naphthenic acid challenges to iron sulfide scales generated in-situ
TRANSCRIPT

NAPHTHENIC ACID CHALLENGES TO IRON SULFIDE SCALES GENERATED IN-SITU FROM MODEL OILS ON MILD STEEL AT HIGH TEMPERATURE
Gheorghe Bota
Institute for Corrosion and Multiphase Technology
342 West State St. Athens, OH 45701
USA
Srdjan Nesic Institute for Corrosion and Multiphase
Technology 342 West State St. Athens, OH 45701
USA
ABSTRACT Iron sulfide scales are formed by sulfur corrosion on the inner walls of refinery distilling towers and transfer lines operating on sour crude oils. Sulfide scales are generally considered to partially reduce corrosion by other corrosive species in crudes, especially naphthenic acids. Sulfur and naphthenic acid corrosion occur simultaneously at similar high temperatures in both distilling units and corrosion research studies. Because the formation of sulfide scales affects the corrosion rates by sulfur species and naphthenic acids differently, corrosion investigation treating them together has hindered an understanding of their competitive corrosion mechanisms. This research study aims to disconnect the corrosive processes at high temperature by generating iron sulfide scales on metal surfaces using model oil compounds and then challenging the scale protectiveness with naphthenic acid. The iron sulfide scales were generated on metal samples in the same experimental apparatus where they were later challenged by the naphthenic acids. This challenge procedure represents refinery operation to an extreme in that refineries routinely swing crude composition varying both sulfur and naphthenic acid concentrations. Experimental conditions (i.e., temperature, velocity) used during this sulfide/challenge protocol were chosen to match, as much as possible, operating conditions in distilling towers and their transfer lines. Key words: naphthenic acid, corrosion, sulfide scales, high temperature, refinery corrosion.
INTRODUCTION Transforming crude oils into fuels and a multitude of chemical by-products generates a series of challenges for the oil refining industry. Among the problems the oil refineries have to address when processing the crude oils is the naphthenic acid corrosion which becomes dominant at high temperatures. “Opportunity crudes" are notorious in causing this specific type of corrosion.1 These crudes typically have high naphthenic acid content and are low gravity crude oils. Due to these low
©2013 by NACE International.Requests for permission to publish this manuscript in any form, in part or in whole, must be in writing toNACE International, Publications Division, 1440 South Creek Drive, Houston, Texas 77084.The material presented and the views expressed in this paper are solely those of the author(s) and are not necessarily endorsed by the Association.

quality characteristics "opportunity crudes "are cheap and readily available on the oil market. As the global fuel demand increases while the sweet crude supplies decrease, the refinery industry is forced to buy more of the low quality crudes which cause significant corrosion problems when processed. The high corrosivity of the low quality crudes is caused not only by their high content in naphthenic acids but also by the sulfur containing compounds which are part of the oil natural composition. Both sulfur compounds and naphthenic acids become corrosive at high temperatures and high velocity, typical conditions in refinery distilling towers and their transfer lines. The two corrosive groups react almost simultaneously with the metal at high temperature; their effects are interwoven which makes it difficult to separate them when their mechanisms are investigated. Thus in this current research work the naphthenic acid and sulfidic corrosion are studied experimentally together using model compounds that can mimic real crude oils behavior under high temperature and high velocity conditions.
NAPHTHENIC ACID CORROSION Naphthenic acids (NAP) were identified as the main corrosive species in acidic crudes although they represent less than 3% wt. They are organic acids with general formula R-(CH2)n-COOH where R is a radical including one or more cyclopentane or cyclohexane rings.2-5 NAP concentration in oils is defined in different ways but the most accepted term currently in the literature and practical use is the Total Acid Number (TAN) which represents the milligrams of KOH necessary to neutralize the acids in 1 g of oil. TAN is expressed in mgKOH/g oil and it can be determined by two different methods - ASTM D 974 which is a colorimetric method and ASTM D 664 which is a potentiometric method.6,7 Although ASTM D 664 is the most commonly used method in refineries, this method is less accurate because it measures not only the organic acids but also the acidity generated by H2S, CO2, MgCl2, and CaCl2 that are present in crudes and may hydrolyze.8 Naphthenic acids are corrosive at high temperatures and according to the literature the lower temperature limit when NAP become corrosive is 220 °C (430 °F).9
The corrosive effects of NAP are intense at a temperature range between 220 °C (430 °F) and 400 °C (752 °F).10-11
Naphthenic acid corrosion and sulfidic corrosion occur together; they interact and can be described by the following reactions.12
Fe + 2RCOOH ⇄ Fe2+(RCOO−)2 + H2 (1)
Fe + H2S ⇄ FeS + H2 (2)
Fe2(RCOO−)2 + H2S ⇄ FeS + 2RCOOH (3)
NAP attack the metal (Reaction 1) forming iron naphthenates that are oil soluble and can be entrained by the flow. Simultaneously some sulfur containing compounds decompose at high temperature generating hydrogen sulfide (H2S) that reacts with the metal (Reaction 2) and forms the iron sulfide (FeS). FeS is insoluble in oil and it deposits on the metal surface where it forms thus offering some limited protection against the NAP attack. According to Reaction 3 the hydrogen sulfide reacts with the soluble iron naphthenates rebuilding the naphthenic acids and generating more FeS which remains suspended in the liquid as particles and becomes a potential source of fouling for the downstream hydrocracker reactor.13 Although these three reactions are accepted in the literature as the most probable mechanism of oil corrosion at high temperature this process is more complicated and under constant influence of different factors as pressure, velocity, chemical composition of oil, etc.
©2013 by NACE International.Requests for permission to publish this manuscript in any form, in part or in whole, must be in writing toNACE International, Publications Division, 1440 South Creek Drive, Houston, Texas 77084.The material presented and the views expressed in this paper are solely those of the author(s) and are not necessarily endorsed by the Association.
NAPHTHENIC ACIDS INTERACTIONS WITH IRON SULFIDE SCALES Most of the literature studies dedicated to naphthenic acid and sulfur corrosion focus mainly on one of these two important corrosive groups, considering the other one as an important influencing factor. This current work has a different experimental approach and studies simultaneously the corrosive effects of both naphthenic acids and sulfur containing compounds. The study verifies the hypothesis that sulfur containing compounds can mitigate the naphthenic acid corrosive effects by building iron sulfide scales on metal surfaces. However the protective effect of the FeS scales decreases under the combined effect of high acidic attack and high velocity which are typical conditions in refinery transfer lines. This hypothesis is experimentally verified by building iron sulfide scales on metal surfaces and then exposing them to a continuous NAP attack. The experiments are called "sulfidation-challenge", and they consist of two different phases: "sulfidation"( FeS scales formation) and "challenge" (acidic attack), both done in the same experimental apparatus.
The following sections describe in detail the experimental procedures and the setup used to verify the hypothesis and to generate the results presented and discussed in last part of this paper.
EXPERIMENTAL
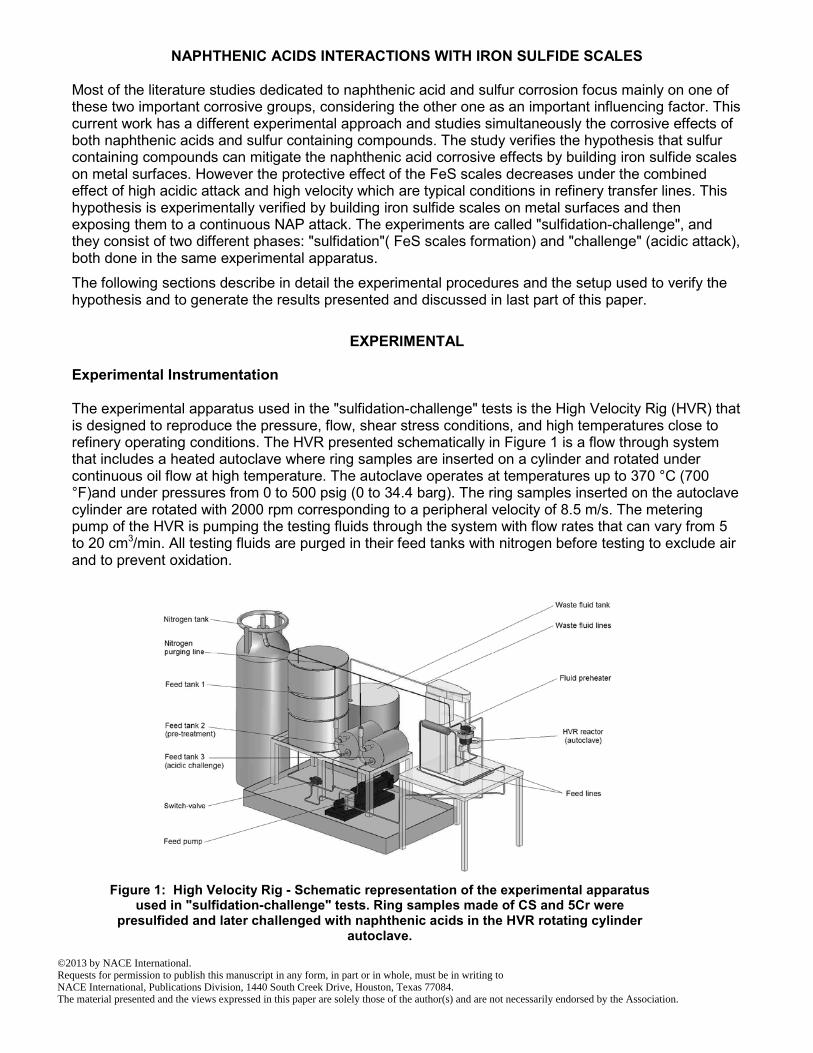
Experimental Instrumentation The experimental apparatus used in the "sulfidation-challenge" tests is the High Velocity Rig (HVR) that is designed to reproduce the pressure, flow, shear stress conditions, and high temperatures close to refinery operating conditions. The HVR presented schematically in Figure 1 is a flow through system that includes a heated autoclave where ring samples are inserted on a cylinder and rotated under continuous oil flow at high temperature. The autoclave operates at temperatures up to 370 °C (700 °F)and under pressures from 0 to 500 psig (0 to 34.4 barg). The ring samples inserted on the autoclave cylinder are rotated with 2000 rpm corresponding to a peripheral velocity of 8.5 m/s. The metering pump of the HVR is pumping the testing fluids through the system with flow rates that can vary from 5 to 20 cm3/min. All testing fluids are purged in their feed tanks with nitrogen before testing to exclude air and to prevent oxidation.
Figure 1: High Velocity Rig - Schematic representation of the experimental apparatus
used in "sulfidation-challenge" tests. Ring samples made of CS and 5Cr were presulfided and later challenged with naphthenic acids in the HVR rotating cylinder
autoclave.
©2013 by NACE International.Requests for permission to publish this manuscript in any form, in part or in whole, must be in writing toNACE International, Publications Division, 1440 South Creek Drive, Houston, Texas 77084.The material presented and the views expressed in this paper are solely those of the author(s) and are not necessarily endorsed by the Association.

The experimental procedure required that iron sulfide scale should be built up and challenged at the same temperature avoiding the cooling down of the specimen and their exposure to air therefore the FeS scales had to be built in-situ. For this purpose the HVR had two feed drums, one filled with yellow oil and used for sulfidation and the other one was filled with the mineral oil spiked with naphthenic acids and was used for the challenge phase of the experiment. Switching the feed from one tank to the other allowed running an experiment without interruption. The properties of the testing fluids are presented in Table 1.
Table 1 Testing Fluids Used for the Pre-Sulfidation Challenge Experiments
Tested Fluid Total Acid Number
(mg KOH/gr oil) Corrosive Sulfur
(%wt)
1 White Oil (Model oil) 0 0
2 Yellow Oil (Model oil) 0 0.25
3 Naphthenic acids ~230 0
The ring samples used in the "sulfidation-challenge" test are made of carbon steel (CS) and 5Cr steel (5Cr, 0.5 Mo) and had the outer diameter OD = 81.75 mm. Six rings were used in every test (3 of CS and 3 of 5Cr). Before every test the ring samples were polished with 400 and 600-grit silicon-carbide paper (SiC) under continuous isopropanol flushing then they were dried with nitrogen and weighed. Finally the ring samples were inserted on the rotation cylinder of the HVR autoclave and exposed to the testing fluids during the experimental runs.
Weight loss of the samples was the method used to evaluate their corrosion rates. Thus samples were weighed before and after the test and the weight's difference was used in corrosion rates calculations. The final weight of ring samples was evaluated at the end of the test by removing completely the FeS scales formed on their surfaces. These scales were removed mechanically and chemically from metal surfaces. The FeS scales that were very loose could be removed mechanically from the ring samples by rinsing them with organic solvents (toluene and acetone) and then brushing them with a stiff plastic brush. After mechanical cleaning the samples were still covered by strongly adherent scale that was removed chemically by using Clarke solution (ASTM G 1-90).14 Samples were weighed both after mechanical and after chemical cleaning.
At the end of every test two samples (one CS ring and one 5Cr ring) were saved and prepared for the analysis with the scanning electron microscopy (SEM) and energy-dispersive X-ray spectroscopy (EDX). These samples were not processed through mechanical and chemical cleaning procedures.
Experimental Procedure Generating the FeS scales in-situ and then challenging them imposed not only special experimental set-up but also special test procedures. It was decided that every experiment should include a sulfidation phase followed by challenge without any “break” between the two test phases. The test conditions for sulfidation had to be identical for each experiment so that the FeS scales would be generated under the same conditions regardless of the challenge conditions that followed. Thus sulfidation time was set to 24 h for every test, and the temperature was set to 343 °C (650 °F).
Preformed FeS scales during the sulfidation phase were challenged with different TAN concentrations for different periods of time. The temperature during the different TAN challenges was kept constant to 343 °C (650 °F) along every challenge phase. Both in sulfidation and in challenge phases the samples were rotated in the autoclave with 2000 rpm which corresponds to a peripheral velocity of v = 8.5 m/s. The general testing conditions for the "sulfidation-challenge" tests are presented in Table 2 whereas Table 3 presents a summary of the "challenge vs. time" test series.
©2013 by NACE International.Requests for permission to publish this manuscript in any form, in part or in whole, must be in writing toNACE International, Publications Division, 1440 South Creek Drive, Houston, Texas 77084.The material presented and the views expressed in this paper are solely those of the author(s) and are not necessarily endorsed by the Association.

Table 2
General Test Conditions for Sulfidation and Challenge Tests
Test phase
Sulfur content (%wt)
TAN Temp. (ºC/°F)
Time (h)
Pressure (psig/barg)
Peripheral Velocity
(m/s)
Sulfidation 0.25 0.1 343/650 24 150/10.3 8.5
Challenge 0 2 – 8 343/650 6 - 120 150/10.3 8.5
Table 3
Summary of Sulfidation-Challenge Tests. Challenge Time vs. Different TAN Solutions. (TAN - total acid number)
Challenge time TAN
6 h 12 h 24 h 50 h 60 h 120 h
TAN 2
TAN 3.5
TAN 5
TAN 6.5
TAN 8
Experimental Calculations All corrosion rates for the experiments done in this study were evaluated based on the weight loss of the samples and expressed in (mm/y) according the Equation (4).15 The weight loss was calculated as the difference between the initial weight of the samples before the test and the final weight of the samples at the end of the test after the FeS scale was completely removed from their metal surfaces.
( ) 100036524tAρ
FWIWCRcFe
×××××
−= (4)
Where: CR - the corrosion rate [mm/y], IW - initial weight [kg], FW – final weight (after final Clarke cleaning) [kg], ρFe - iron density [kg/m3], Ac - sample area exposed to test fluids (outer ring area) [m2], t - time of the experiment [hr]. As it was mentioned before each “sulfidation-challenge” test consists of two different phases therefore the corrosion effects from sulfidation have to be separated of those generated during the challenge phase. The final corrosion rate at the end of the challenge phase is calculated using Equation (4) where the initial weight IW represents the difference between the initial weight of the samples and the weight loss corresponding to sulfidation tests run separately. In this way the weight loss caused by the naphthenic acids challenges does not include the weight loss of the sulfidation phase.
©2013 by NACE International.Requests for permission to publish this manuscript in any form, in part or in whole, must be in writing toNACE International, Publications Division, 1440 South Creek Drive, Houston, Texas 77084.The material presented and the views expressed in this paper are solely those of the author(s) and are not necessarily endorsed by the Association.

Weight losses are used also in evaluating the scale thickness which assumed to be perfectly dense, compact, and uniformly distributed on the sample surfaces. Because the scale evaluation is based on these hypotheses regarding its structure, it will be further referred in this paper as a “calculated scale thickness”. The FeS scale formed on the samples was evaluated as a “total scale” that includes both the fragile, loose scale layers that could be removed from the samples by mechanical means (solvent rinsing, rubbing, and brushing) and an “adherent scale” which could be removed only by chemical means (Clarke solution) from the samples. Total scale was evaluated from the difference between the weight after solvent rinsing and the final weight of the sample according to Equation (5). In a similar manner the “adherent scale” was evaluated from the difference between the weight after sample rubbing and brushing and the sample final weight by using Equation (6). Both “total” and “adherent” scales are expressed in (μm). Total scale:
( ) 6
TFeS
RinseT 10
AρFWW
××−
=δ (5)
Where : δT - thickness of total scale [μm], WRinse - rinse weight, weight after solvent rinse [kg], FW – final weight (after final Clarke cleaning) [kg], ρFeS – iron sulfide density [kg/m3], AT – total area of the sample (total ring area) [m2]. Adherent scale:
( ) 6
TFeS
RubA 10
AρFWW
××−
=δ (6)
Where : δA - thickness of adherent scale [μm], WRub – rubbing, brushing weight [kg], FW – final weight (after final Clarke cleaning) [kg], ρFeS – iron sulfide density [kg/m3], AT – total area of the sample (total ring area) [m2].
RESULTS AND DISCUSSION The “sulfidation-challenge” tests were run in the same experimental unit and in order to separate the “sulfidation” (scale formation) from the FeS “challenge” by the naphthenic acids it was necessary to run some “pure sulfidation” tests. The “pure sulfidation tests” were used as a reference and their corresponding metal weight losses and scale gains were averaged and subtracted from the metal weight losses and scale weight gains measured at the end of every “sulfidation-challenge” test to reveal what happened in the “challenge” phase only. On every graphical representation below, the “sulfidation reference” tests results will be presented separately (on the left) from the “challenge” tests results (on the right).
In this “sulfidation-challenge” study, both types of steel specimens were used together in the HVR autoclave to save time. Thus three rings of each type (CS and 5Cr steel) were tested simultaneously in every test. However the corrosion rate results of corresponding TAN and time series are summarized
©2013 by NACE International.Requests for permission to publish this manuscript in any form, in part or in whole, must be in writing toNACE International, Publications Division, 1440 South Creek Drive, Houston, Texas 77084.The material presented and the views expressed in this paper are solely those of the author(s) and are not necessarily endorsed by the Association.

on two different plots and analyzed separately for each type of steel (Figure 2 and Figure 4). Total and adherent scales were also evaluated separately for each type of steel and they show identical trends for every TAN series. The differences in thickness between total and adherent scales were very small therefore for a clear and comprehensive scale evolution it was decided to represent only the adherent scale in this paper (Figure 3 and Figure 5). NAP Challenges on Carbon Steel
TAN 2 was considered to be low enough as a starting point for challenge the FeS scales and high enough to damage them. Two tests were done with TAN 2: a 24 h and a 60 h challenge test. The average corrosion rates of CS in TAN 2 challenge tests decreased over time as it is shown in Figure 2. However CS corrosion rates for the challenge were in the same range as those of the sulfidation reference test so it can be concluded that they did not change much in the TAN 2 challenge. Further challenges on presulfided samples were done at TAN 3.5 adding a longer time test (120 h) to those of 24 and 60 h. Although the challenge level was increased the corrosion rates for CS show a similar trend as in the case of TAN 2 challenges, decreasing as experimental time increased. TAN 5 was considered a high value for the challenge and as a consequence two short time tests (6 and 12 h) were added to the long time ones (24 and 50 h). Average corrosion rates of presulfided CS samples were almost the same for 6, 12, and 24 h test but they increase for the 50 h longer time test (Figure 2).
0
2
4
6
8
10
-40 -20 0 20 40 60 80 100 120 140
Cor
rosi
on R
ate
(mm
/y)
Time (h)
TAN 2
TAN 3.5
TAN 5
TAN 6.5
TAN 8
7
SulfidationReference
Challenge
Figure 2: Comparison of corrosion rates for CS generated during sulfidation-
challenge tests. TAN challenge series are plotted as function of time. All TAN challenge series were done at the same temperature 343 °C (650 °F). Number 7 above the sulfidation reference represents the number of sulfidation test replicates. Points are average values while errors bars indicate the highest
and lowest value obtained on multiple samples exposed in the same experiment.
As CS corrosion rates did not increase much in the TAN 5 challenges it was decided that samples should be exposed to higher TAN 6.5 in two challenge tests of 24 and 50 h. For this high TAN level the average corrosion rates of CS increased constantly with time when compared to “sulfidation reference” corrosion rates. TAN 8 was the last and highest level that was used to challenge the presulfided samples. Because TAN 8 was considered very aggressive it was decided to run only short time tests (6, 12, and 24 h). The average corrosion rates of CS were similar in the 6 and 12 h tests but they increased sharply when the experimental time was doubled to 24 h (Figure 2).
©2013 by NACE International.Requests for permission to publish this manuscript in any form, in part or in whole, must be in writing toNACE International, Publications Division, 1440 South Creek Drive, Houston, Texas 77084.The material presented and the views expressed in this paper are solely those of the author(s) and are not necessarily endorsed by the Association.

The thicknesses of the FeS scales (adherent scale) formed on CS samples and challenged in the TAN series are presented in Figure 3. The FeS scales continued to grow in all “challenge” tests regardless how high the TAN was during the challenge as the plot shows. The scale growing source was the sulfur residues remaining in the system from sulfidation. However in spite of the FeS scales increase they were not able to protect the CS samples against higher TAN challenge levels (TAN 5 to 8). The FeS scale offered a good protection to CS only in the TAN 2 and TAN 3.5 challenge tests.
0.0
2.0
4.0
6.0
8.0
10.0
12.0
14.0
-40 -20 0 20 40 60 80 100 120 140
Scal
e Th
ickn
ess
(µm
)
Time (h)
Sulfid AS
TAN 2 AS
TAN 3.5 AS
TAN 5 AS
TAN 6.5 AS
TAN 8 AS
SulfidationReference
Challenge
Figure 3: Thickness of adherent scale (FeS) evaluated on presulfided CS samples
and exposed to different TAN (2 - 8) levels challenges. Sulfidation reference section of the plot represents the average thickness value of the FeS scale evaluated in
separate “sulfidation reference” test. (AS – Adherent Scale – in the legend).
NAP Challenges on 5Cr Steel
Corrosion rates of 5Cr presulfided samples are shown in Figure 4 for all TAN vs. time series. Similarly to CS the corrosion rates of 5Cr presulfided samples were low, in the same range with those of the “sulfidation reference” and almost the same for both TAN 2 and TAN 3.5 challenge test series. This demonstrates that the FeS scale preformed on 5Cr protected very well the samples against the NAP attack. Corrosion rates of 5Cr samples were also low and decreasing with the time exposure (from 6 h to 50 h) in the TAN 5 series (Figure 4).
©2013 by NACE International.Requests for permission to publish this manuscript in any form, in part or in whole, must be in writing toNACE International, Publications Division, 1440 South Creek Drive, Houston, Texas 77084.The material presented and the views expressed in this paper are solely those of the author(s) and are not necessarily endorsed by the Association.

0
2
4
6
8
10
-40 -20 0 20 40 60 80 100 120 140
Cor
rosi
on R
ate
(mm
/y)
Time (h)
TAN 2
TAN 3.5
TAN 5
TAN 6.5
TAN 8
7
SulfidationReference
Challenge
Figure 4: Comparison of corrosion rates for 5Cr generated during sulfidation-
challenge tests. All TAN challenge series were done at the same temperature 343 °C (650 °F). Number 7 above the sulfidation reference represents the
number of sulfidation test replicates. Points are average values while errors bars indicate the highest and lowest value obtained on multiple samples
exposed in the same experiment.
For the TAN 6.5 challenge tests corrosion rates of 5Cr were low and almost the same with similar time tests done with TAN 5. Although the average corrosion rates of 5Cr were high after being exposed for 6 h to the aggressive TAN 8 challenge, they dropped and were almost similar in the 12 and 24 h same TAN challenge tests.
0.0
2.0
4.0
6.0
8.0
10.0
12.0
14.0
-40 -20 0 20 40 60 80 100 120 140
Scal
e Th
ickn
ess
(µm
)
Time (h)
Sulfid AS
TAN 2 AS
TAN 3.5 AS
TAN 5 AS
TAN 6.5 AS
TAN 8 AS
SulfidationReference
Challenge
Figure 5: Thickness of adherent scale (FeS) evaluated on presulfided 5Cr samples and exposed to different TAN (2 - 8) levels challenges. Sulfidation reference section of the
plot represents the average thickness value of the FeS scale evaluated in separate “sulfidation reference” test. (AS – Adherent Scale – in the legend).
Figure 5 summaries the thickness values of the adherent scale that was evaluated on the 5Cr samples at the end of the all TAN challenge tests. As the plot reveals the FeS scales formed on 5Cr samples
©2013 by NACE International.Requests for permission to publish this manuscript in any form, in part or in whole, must be in writing toNACE International, Publications Division, 1440 South Creek Drive, Houston, Texas 77084.The material presented and the views expressed in this paper are solely those of the author(s) and are not necessarily endorsed by the Association.

during sulfidation continued to grow during the challenge tests but with a lower rate compared to the scale increase on CS samples. If corrosion rates of 5Cr samples are compared to those of CS in all challenge tests it becomes very clear that the FeS scales offered a better protection against the NAP corrosive attack to 5Cr samples than to CS ones.
Comparison of the 24 h Test 24 h challenge test was common for every TAN series described previously. Therefore these 24 h test data were used for presenting a different perspective of “sulfidation-challenge” tests: corrosion rate as a function of different TAN’s (0.1 - 8)
Comparison of the corrosion rates of CS vs. 5Cr is presented in Figure 6. The CS corrosion rates increased slowly from TAN 2 to TAN 5 then for TAN 6.5 challenge the corrosion rates are almost double than the TAN 5. CS corrosion rates become very high in the TAN 8 challenge test proving that FeS scale protection for CS failed completely. The 5Cr steel presented a very good resistance against NAP attack which was different from the CS results. Thus the 5Cr corrosion rates increased slowly, reached a plateau for TAN 5 and 6.5 and then slightly increased for the TAN 8 challenge.
0
2
4
6
8
10
0 1 2 3 4 5 6 7 8 9
Cor
rosi
on R
ate
(mm
/y)
TAN
CS5Cr
Figure 6: Comparison for corrosion rates of CS and 5Cr samples in 24 h
challenge tests with different NAP concentrations (TAN 2 to TAN 8). Points are average values while errors bars indicate the highest and lowest value obtained
on multiple samples exposed in the same experiment.
The FeS scale formed on the CS specimens in all 24 h tests are summarized in Figure 7, where both total and adherent scale thicknesses are plotted. For TAN 2, 3.5 and 5 test the amount of scale was formed almost constant and corresponding corrosion rates for these tests showed only a slight increase. Therefore it can be said that scale preserved its protective properties during the tests. However, when the challenging TAN was increased to 6.5 and 8 although more scale was produced, it was of lesser quality and the corresponding corrosion rates increase significantly.
©2013 by NACE International.Requests for permission to publish this manuscript in any form, in part or in whole, must be in writing toNACE International, Publications Division, 1440 South Creek Drive, Houston, Texas 77084.The material presented and the views expressed in this paper are solely those of the author(s) and are not necessarily endorsed by the Association.

0.0
2.0
4.0
6.0
8.0
10.0
12.0
14.0
0 1 2 3 4 5 6 7 8 9
Scal
e Th
ickn
ess
(µm
)
TAN
Tot.Scale (FeS)Adh.Scale (FeS)
Figure 7: Total and adherent scale thickness formed on CS specimens during 24 h challenge tests with different NAP concentrations (TAN 2 to TAN 8). Points are average values while errors bars indicate the highest and lowest value obtained
on multiple samples exposed in the same experiment.
The FeS scale formed on the 5Cr specimens had almost a constant thickness in every 24 h test as shown in Figure 8. If these scale thicknesses are compared to their corresponding test corrosion rates it becomes clear how protective the scales were for the 5Cr against NAP corrosive effects.
0.0
2.0
4.0
6.0
8.0
10.0
12.0
14.0
0 1 2 3 4 5 6 7 8 9
Scal
e Th
ickn
ess
(µm
)
TAN
Tot.Scale (FeS)Adh.Scale (FeS)
Figure 8: Total and adherent scale thickness formed on 5Cr samples during 24 h challenge tests with different NAP concentrations (TAN 2 to TAN 8). Points are
average values while errors bars indicate the highest and lowest value obtained on multiple samples exposed in the same experiment.
CONCLUSIONS
• FeS scales were pre-formed in-situ from model oils and challenged by naphthenic acid of
different concentrations according to a new testing protocol "sulfidation-challenge". The new protocol is used to verify the protectiveness of iron sulfide scale against naphthenic acid attack
©2013 by NACE International.Requests for permission to publish this manuscript in any form, in part or in whole, must be in writing toNACE International, Publications Division, 1440 South Creek Drive, Houston, Texas 77084.The material presented and the views expressed in this paper are solely those of the author(s) and are not necessarily endorsed by the Association.

and consists of two different phases done successively in same apparatus. During the first phase FeS scales are generated from model oils and then they are challenged by different TAN concentrations in oil in the second phase of the test
• Experimental data demonstrated that iron sulfide scales were able to protect much better the 5Cr steel samples than the CS against the NAP attack.
• In case of CS samples the FeS scales preformed on these samples were able to protect them only against low TAN challenges (TAN 2 and 3.5 regardless of the time they were exposed to NAP attack). In challenges of higher TAN (5, 6.5, and 8) the preformed scales failed in protecting the CS samples.
• Preformed FeS scales on 5Cr samples protected them very well against the low TAN challenges (TAN 2 and 3.5) when sample corrosion rates were very low and constant. The protection of the iron sulfide scales on 5Cr samples failed in higher TAN challenges but still these scales formed on 5Cr were more protective than on CS.
• All FeS scale formed on both CS and 5Cr samples continued to grow during the "challenge" phases due to the sulfur residues that remained from sulfidation in the experimental apparatus. In spite of this FeS scale growth during the sulfidation phase the scale protectiveness failed and sample corrosion rates increased as the TAN concentration and the exposure time increased too.
• In 24 h challenge tests the FeS scale protectiveness was influenced by the type of steel on which was formed. Thus the 5Cr corrosion rates increased very slowly from TAN 2 to 8 demonstrating a good scale protection but in case of CS samples the scale protection was limited and corrosion rates increased abruptly for TAN 6.5 and 8 challenges.
• All these experimental data generated with model oils will be included in a model that will predict the corrosivity of acidic oils when processed at high temperature and velocity in refinery distilling units.
ACKNOWLEDGEMENTS
The authors are grateful to Ohio University and all the sponsors that provided financial assistance for this research project. The authors would also like to thank Alan H. Wolf for his personal advice, suggestions, and constant encouragement during this work.
REFERENCES 1. Kapusta, S.D., Ooms, A., Smith, A., Van den Berg, F., Fort, W. "Safe Processing of Acid Crudes."
Corr. Paper 04637, 2004, 1-19.
2. Dzidic, I.,Somerville, A.C., Raia, J.C., Hart, H.V. "Determination of Naphthenic Acids in California Crudes and Refinery Waste Waters by Fluoride Ion Chemical Ionization Mass Spectrometry.", Anal. Chem. 1988, 60, 1318-1323.
3. Fan, T.P. "Characterization of Naphthenic Acids in Petroleum by Fast Atom Bombardment Mass Spectrometry." Energy & Fuels, 1991, 5, 371-375.
4. Hsu, C.S., Dechert, G.J., Robbins, W.K., Fukuda, E.K. "Naphthenic Acids in Crude Oils Characterized by Mass Spectrometry." Energy & Fuels, 2000, 14, 217-223.
5. Laredo, G.C., Lopez, C.R., Alvarez, R.E., Cano, J.L. "Naphthenic Acids Total Acid Number and Sulfur Content Profile Characterization in Isthmus and Maya Crude Oils." Fuel, 2004, 83, 1689-1695.
©2013 by NACE International.Requests for permission to publish this manuscript in any form, in part or in whole, must be in writing toNACE International, Publications Division, 1440 South Creek Drive, Houston, Texas 77084.The material presented and the views expressed in this paper are solely those of the author(s) and are not necessarily endorsed by the Association.

6. ASTM D664. "Standard Test Method for Acid Number of Petroleum Products by Potentiometric Titration." Annual Book of ASTM Standards. (West Conshohocken, PA: ASTM 1990).
7. ASTM D974. "Standard Test Method for Acid Number and Base Number by Color-Indicator Titration." Annual Book of ASTM Standards. (West Conshohocken, PA: ASTM 1990).
8. Piehl, R.L. "Naphthenic Acid Corrosion in Crude Distillation Units." MP 1988, 27 (1), 37-43.
9. Derungs, W.A. "Naphthenic Acid Corrosion – An Old Enemy of the Petroleum Industry." Corr. 1956, 12, pp.617-622.
10. Babaian-Kibala, E., Craig H.L., Rusk, G.L., Quinter R.C., Summers M.A. "Naphthenic Acid Corrosion in Refinery Settings." MP 1993, 50-55.
11. Turnbull, A., Slavcheva, E., Shone, B. "Factors controlling naphthenic acid corrosion." Corr., 1998, 54 (11), pp.922-930.
12. Kane, R.D., Cayard, M.S., "Understanding Critical Factors that Influence Refinery Crude Corrosiveness." MP 1999, July, 48-54.
13. Rodriquez, L., Penuela, L. "Experiences with Naphthenic Acid Corrosion in an Extra Heavy oil Upgrader Facility." CORROSION 2006, paper no. 06586. Houston, TX: NACE, 2006.
14. ASTM G 1-90. “Standard Practice for Preparing, Cleaning, and Evaluating Corrosion Test Specimens”. Annual Book of ASTM Standards. (West Conshohocken, PA. ASTM: 1990).
15. Bota, G.M., Qu D., Nesic, S., Wolf, H.A. "Naphthenic Acid Corrosion of Mild Steel in the Presence of Sulfide Scales Formed in Crude Oil Fractions at High Temperature." CORROSION 2010, paper no. 10353. Houston, TX: NACE, 2010.
©2013 by NACE International.Requests for permission to publish this manuscript in any form, in part or in whole, must be in writing toNACE International, Publications Division, 1440 South Creek Drive, Houston, Texas 77084.The material presented and the views expressed in this paper are solely those of the author(s) and are not necessarily endorsed by the Association.