nanoscale - staff.ustc.edu.cn
TRANSCRIPT
Nanoscale
PAPER
Cite this: Nanoscale, 2015, 7, 2352
Received 10th October 2014,Accepted 17th December 2014
DOI: 10.1039/c4nr05990e
www.rsc.org/nanoscale
Self-assembly of metal atoms (Na, K, Ca)on graphene†
Jian Zhou,a Shunhong Zhang,b Qian Wang,b,c,a Yoshiyuki Kawazoed and Puru Jena*a
A thorough search of the distribution pattern of Na, K, and Ca atoms on graphene surface, carried out
using a synergistic combination of density functional theory and particle swarm optimization algorithm,
yielded some unusual results. The equilibrium distribution is concentration and metal dependent; the
metal atoms distribute uniformly when their coverage ratio M : C (M = Na, K, Ca) is 1 : 6, but Na and Ca
atoms self-assemble to form parallel quasi-one-dimensional chains when their coverage is reduced to
1 : 8. At the higher concentration (M : C = 1 : 6), electron–phonon coupling calculations further show that
the NaC6 is a superconductor with critical temperature of 5.8 K, which is the highest value among all the
stable alkali or alkaline-earth metal decorated monolayer graphene systems studied to-date. At the lower
concentration (M : C = 1 : 8) and depending on metal species, well-aligned atomic metal chains interact
with graphene with varying intensity, making it possible to achieve either rigid or non-rigid band doping in
graphene.
I. Introduction
Functionalization of graphene sheet1 has become a topicof great current interest due to its potential for many tech-nological applications. For example, decoration of graphenesurface with hydrogen, oxygen, and fluorine atoms can beused to modulate its electronic properties, such as band gap,electron mobility, and optical absorption.2–4 Similarly, alkalimetal (AM) and alkaline-earth metal (AEM) atoms adsorbedgraphene sheets are considered as potential devices for ionbatteries, hydrogen storage materials, and superconductors.5–8
Unlike nonmetal atoms that can perturb the atomic structureof graphene, decoration by AM and AEM has little effect on itsgeometric structure.7 The main role of these metal atoms isto donate electrons to the graphene sheet, which makes itn-doped.
The distribution patterns of AM and AEM atoms on thegraphene vary with respect to their coverage. When the con-centration is dilute, the metal atoms prefer to disperse on the
graphene surface. On the contrary, when concentration ofmetal atoms exceeds a certain critical value, they tend to formcompact patterns. What remains elusive is the distributionpattern at intermediate concentrations. Due to the complexityof the energy landscape of the graphene surface and the inter-action between deposited metal atoms, predicting the AM orAEM adsorption pattern at intermediate concentration is chal-lenging. Knowing the exact adsorption pattern of AM or AEMon graphene at intermediate concentration will facilitate theexploration of their potential for catalysis and other techno-logical applications.
Using first-principles density functional theory (DFT) com-bined with particle swarm optimization (PSO) algorithm,we have carried out a systematic global search of depositionpattern of Na, K, and Ca on a single graphene layer. We showthat when the coverage ratio M : C = 1 : 6 (M = Na, K, and Ca),all three metal atoms prefer to distribute uniformly. This is incontrast to Li atoms which were found to cluster due to theirsmall size.9 In addition, we find that NaC6 monolayer is super-conducting with a critical temperature Tc = 5.8 K. KC6 mono-layer, on the other hand, is not superconducting. When theM : C ratio is lowered to 1 : 8, K atoms still form a uniformdeposition pattern, while the smaller Na and Ca atoms self-assemble to form quasi-one-dimensional (quasi-1D) metallicchains. Studies of quasi-1D systems both experimentally andtheoretically10 are attracting considerable attention. On onehand, due to their high anisotropy and restricted dimensional-ity, quasi-1D systems are considered as elemental buildingblocks for future electronic devices.11 On the other hand, dueto the fundamental difference between the electronic conduc-
†Electronic supplementary information (ESI) available: Phonon dispersion offree standing Na chain, band structure of ‘empty’ Ca chain, and work functionvariation of MCx with respect to the concentration 1/x. See DOI: 10.1039/c4nr05990e
aDepartment of Physics, Virginia Commonwealth University, Richmond, VA 23284,
USA. E-mail: [email protected], Center for Applied Physics and Technology, College of Engineering, Peking
University, Beijing 100871, ChinacDepartment of Materials Science and Engineering, College of Engineering, Peking
University, Beijing 100871, ChinadInstitute for Material Research, Tohoku University, Sendai, 980-8577, Japan
2352 | Nanoscale, 2015, 7, 2352–2359 This journal is © The Royal Society of Chemistry 2015
Publ
ishe
d on
18
Dec
embe
r 20
14. D
ownl
oade
d by
Bei
jing
Uni
vers
ity o
n 29
/01/
2015
08:
16:0
1.
View Article OnlineView Journal | View Issue
tivity of 1D and 2D/3D metallic conductors, understanding thebehavior of highly confined 1D electron system (described byLuttinger liquid model rather than conventional Landau’sFermi liquid quasiparticle theory) is interesting and challen-ging, both theoretically and experimentally.12 It is, therefore,important to fabricate a system capable of supporting a Luttin-ger liquid state.13 One way to realize this is to find a wayto grow thin metallic nanowires or nanochains on a surface.Previously, quasi-1D AM or AEM chains were observed onsemiconducting and transition metal surfaces where the metalatoms and the substrate are chemically bonded and stronglyhybridized.14–16 In this case, the electronic behavior of thesequasi-1D metal atom chains are not genuinely 1D, and mostlythey even exhibit dielectric behavior.17 Here, we show thatboth the Na and Ca chains on graphene are metallic. Further-more, the Na and C hybridize weakly around the Fermi level.As a result, the Na chain can retain its essential free standingphysical properties and provides an added opportunity tostudy the behavior of 1D electron systems.
II. Computational methods andmodels
Our calculations are based on first-principles density func-tional theory (DFT) with the generalized gradient approxi-mation (GGA) for exchange–correlation functional proposedby Perdew, Burke, and Ernzerhof (PBE)18 and implemented inthe Vienna ab initio Simulation Package (VASP).19 The projectoraugmented wave (PAW) method with 400 eV energy cut-offfor plane-wave basis sets are applied.20 In order to simulatethe 2D systems, we use periodic boundary condition with avacuum space of 12 Å along the non-periodic z direction. Thereciprocal space is represented by the Monkhorst–Pack specialk point scheme21 with density of grid points along x and ydirections of 2π × 0.02 Å−1. Conjugated gradient scheme isadopted to relax the geometric structures without any sym-metric constraint. Grimme’s method22 is used to incorporatevan der Waals interaction corrections between the metal atomsand the graphene substrate. Convergence criteria for totalenergy and Hellmann–Feynman force are set to be 1 × 10⁻⁴ eVand 0.01 eV Å−1, respectively. The dynamic stability andelectron–phonon coupling (EPC) of the NaC6 and KC6 are cal-culated using the Quantum-ESPRESSO package23 and norm-conserving pseudopotentials. Phonon frequencies are cal-culated using the density functional linear-response method.24
Based on convergence tests; we adopt a kinetic energy cutoff of60 Ry and (96 × 96 × 1) k-point mesh in the first Brillouin zone.EPC matrix elements are computed on a (6 × 6 × 1) q-mesh.
In order to search for the globally optimal depositionpattern of metal atoms on graphene, we recall that the adsorp-tion of AM and AEM has little effect on the geometric structureof graphene,7 to reduce the computational cost we fix the sub-strate C atoms and allow the adatoms to move progressivelytowards the optimal adsorption site. Different kinds of super-cells were also used to minimize the constraints of the
periodic boundary condition. For M : C = 1 : 6, we adopt hexa-gonal (3 × 3), 2
ffiffiffi3
p � 2ffiffiffi3
p� �R30°,
ffiffiffiffiffi21
p � ffiffiffiffiffi21
p� �R10.9°, and
3ffiffiffi3
p � 3ffiffiffi3
p� �R30° supercells, which accommodate M3C18,
M4C24, M7C42, and M9C54 moieties, respectively. We also usefour rectangular supercells, accommodating M2C12, M4C24,M6C36, and M8C48 moieties. For M : C = 1 : 8, we apply hexago-nal 2
ffiffiffi3
p � 2ffiffiffi3
p� �R30°, (4 × 4), and 2
ffiffiffi7
p � 2ffiffiffi7
p� �R19.1° super-
cells to accommodate M3C24, M4C32, and M7C56 moieties,respectively. Rectangular supercells of M2C16, M3C24, M4C32,M5C40, and M6C48 are also used to study the M : C = 1 : 8 con-centration. In each supercell, we randomly generate 20 differentmetal adsorption patterns which are considered as the initialgeneration. Each pattern (also called a particle) evolves follow-ing an iterative scheme, namely, it first finds the nearest localminimum through standard DFT structural optimization,and in the next generation it surmounts energy barriers toapproach lower-lying minima according to the particle swarmoptimization (PSO) algorithm.25 The PSO algorithm has beenwell tested to predict the geometric structures of 0D clusters,26
2D sheets,27 3D crystals,28 and surface reconstructions.29 Werefer to our scheme as partial PSO (PPSO) method as only theadsorbed atoms in our simulated system evolves according tothe PSO algorithm. In the PPSO algorithm, the position ofeach particle x is evolved as,
xitþ1 ¼ xit þ vitþ1; ð1Þwhere t refers to the generation step, i is the individual particleindex (i = 1, 2, …, 20), and v is the velocity. For each particle i,we collect the best (lowest energy) position that has beenreached, and denote it as pbesti
t. The best position of all theparticles that have been found up to now is called “globallybest” and denoted as gbestt. Then the evolving velocity of eachparticle i can be written as
vitþ1 ¼ ωvit þ c1r1ðpbestit � xitÞ þ c2r2ðgbestt � xitÞ; ð2Þwhere r1 and r2 are random numbers in the range [0, 1]. Theparameter ω linearly decreases from 0.9 to 0.4 during iter-ation.25,30 The values of c1 and c2 are selected to be 2, whichare found to efficiently lead to the global minimum.25,30 Afterseveral generations, we find that the gbestt structure remainsunchanged, suggesting that the search process converges to anoptimal state. This is considered to be a candidate groundstate in that supercell. These energetically low-lying candidatesare then fully relaxed to eliminate the effects of lattice con-straint on the energy sequence during the structural search.We find that the small relaxation of the graphene substratehas no effect on the relative stability of different isomers. Afterthat, by comparing the relative stability through total energiesper formula unit (denoted as E/f.u.) of all the candidate groundstates, we obtain the globally optimal desorption pattern.
III. Results
After our PPSO search, we find that for M : C = 1 : 6 (M = Na, K,Ca), the systems converge to a uniform distribution pattern
Nanoscale Paper
This journal is © The Royal Society of Chemistry 2015 Nanoscale, 2015, 7, 2352–2359 | 2353
Publ
ishe
d on
18
Dec
embe
r 20
14. D
ownl
oade
d by
Bei
jing
Uni
vers
ity o
n 29
/01/
2015
08:
16:0
1.
View Article Online
possessing plane symmetry group of P6m. This behavior is incontrast with the case of Li on graphene where Li atoms preferto form isolated islands.9 This is because the radii of Na(1.90 Å), Ca (1.94 Å), and K (2.43 Å) are larger than that of theLi (1.67 Å).31
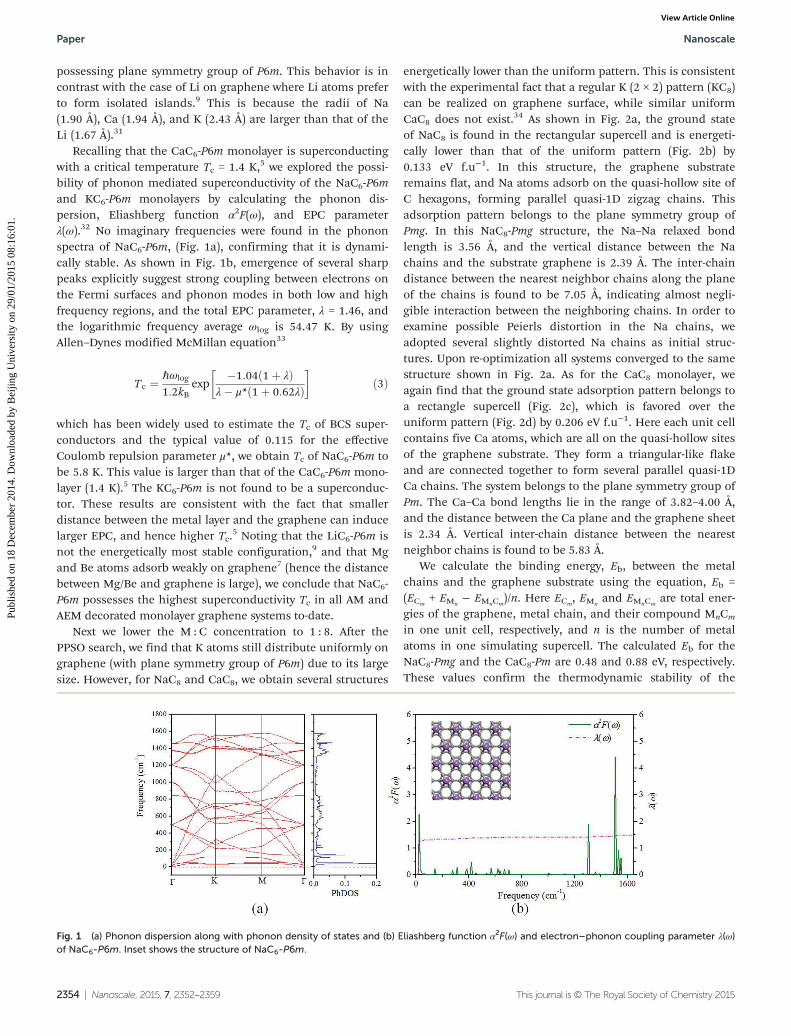
Recalling that the CaC6-P6m monolayer is superconductingwith a critical temperature Tc = 1.4 K,5 we explored the possi-bility of phonon mediated superconductivity of the NaC6-P6mand KC6-P6m monolayers by calculating the phonon dis-persion, Eliashberg function α2F(ω), and EPC parameterλ(ω).32 No imaginary frequencies were found in the phononspectra of NaC6-P6m, (Fig. 1a), confirming that it is dynami-cally stable. As shown in Fig. 1b, emergence of several sharppeaks explicitly suggest strong coupling between electrons onthe Fermi surfaces and phonon modes in both low and highfrequency regions, and the total EPC parameter, λ = 1.46, andthe logarithmic frequency average ωlog is 54.47 K. By usingAllen–Dynes modified McMillan equation33
Tc ¼ ℏωlog
1:2kBexp
�1:04 1þ λð Þλ� μ* 1þ 0:62λð Þ
� �ð3Þ
which has been widely used to estimate the Tc of BCS super-conductors and the typical value of 0.115 for the effectiveCoulomb repulsion parameter μ*, we obtain Tc of NaC6-P6m tobe 5.8 K. This value is larger than that of the CaC6-P6m mono-layer (1.4 K).5 The KC6-P6m is not found to be a superconduc-tor. These results are consistent with the fact that smallerdistance between the metal layer and the graphene can inducelarger EPC, and hence higher Tc.
5 Noting that the LiC6-P6m isnot the energetically most stable configuration,9 and that Mgand Be atoms adsorb weakly on graphene7 (hence the distancebetween Mg/Be and graphene is large), we conclude that NaC6-P6m possesses the highest superconductivity Tc in all AM andAEM decorated monolayer graphene systems to-date.
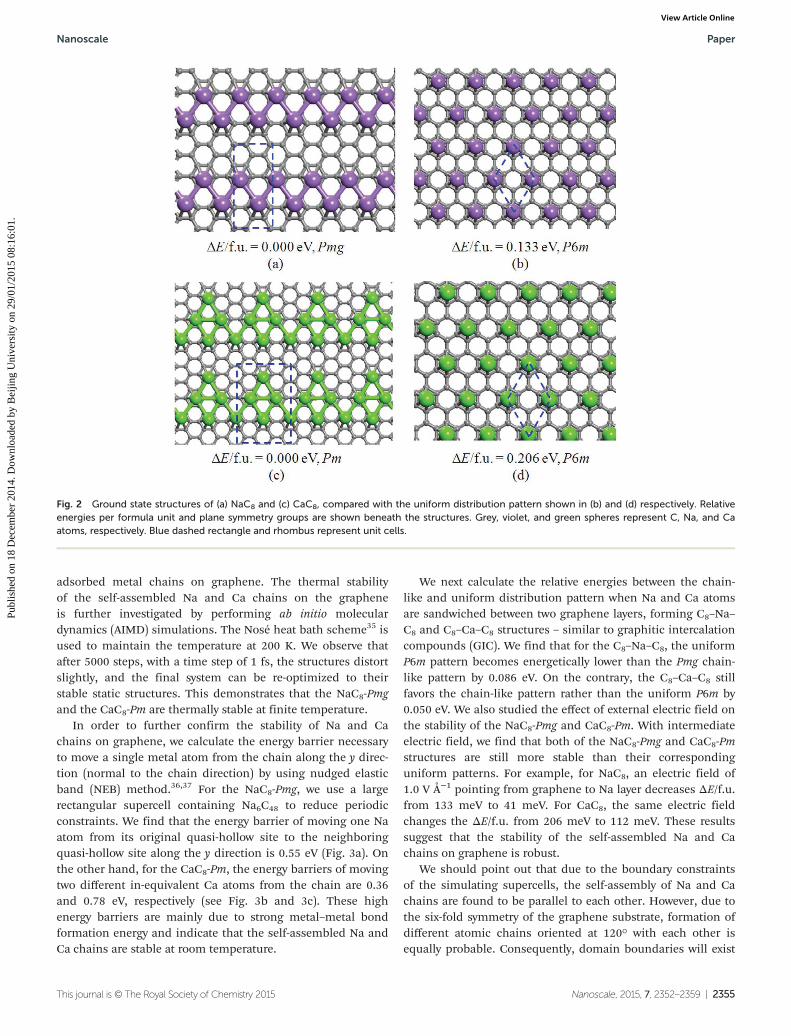
Next we lower the M : C concentration to 1 : 8. After thePPSO search, we find that K atoms still distribute uniformly ongraphene (with plane symmetry group of P6m) due to its largesize. However, for NaC8 and CaC8, we obtain several structures
energetically lower than the uniform pattern. This is consistentwith the experimental fact that a regular K (2 × 2) pattern (KC8)can be realized on graphene surface, while similar uniformCaC8 does not exist.34 As shown in Fig. 2a, the ground stateof NaC8 is found in the rectangular supercell and is energeti-cally lower than that of the uniform pattern (Fig. 2b) by0.133 eV f.u−1. In this structure, the graphene substrateremains flat, and Na atoms adsorb on the quasi-hollow site ofC hexagons, forming parallel quasi-1D zigzag chains. Thisadsorption pattern belongs to the plane symmetry group ofPmg. In this NaC8-Pmg structure, the Na–Na relaxed bondlength is 3.56 Å, and the vertical distance between the Nachains and the substrate graphene is 2.39 Å. The inter-chaindistance between the nearest neighbor chains along the planeof the chains is found to be 7.05 Å, indicating almost negli-gible interaction between the neighboring chains. In order toexamine possible Peierls distortion in the Na chains, weadopted several slightly distorted Na chains as initial struc-tures. Upon re-optimization all systems converged to the samestructure shown in Fig. 2a. As for the CaC8 monolayer, weagain find that the ground state adsorption pattern belongs toa rectangle supercell (Fig. 2c), which is favored over theuniform pattern (Fig. 2d) by 0.206 eV f.u−1. Here each unit cellcontains five Ca atoms, which are all on the quasi-hollow sitesof the graphene substrate. They form a triangular-like flakeand are connected together to form several parallel quasi-1DCa chains. The system belongs to the plane symmetry group ofPm. The Ca–Ca bond lengths lie in the range of 3.82–4.00 Å,and the distance between the Ca plane and the graphene sheetis 2.34 Å. Vertical inter-chain distance between the nearestneighbor chains is found to be 5.83 Å.
We calculate the binding energy, Eb, between the metalchains and the graphene substrate using the equation, Eb =(ECm
+ EMn− EMnCm
)/n. Here ECm, EMn
and EMnCmare total ener-
gies of the graphene, metal chain, and their compound MnCm
in one unit cell, respectively, and n is the number of metalatoms in one simulating supercell. The calculated Eb for theNaC8-Pmg and the CaC8-Pm are 0.48 and 0.88 eV, respectively.These values confirm the thermodynamic stability of the
Fig. 1 (a) Phonon dispersion along with phonon density of states and (b) Eliashberg function α2F(ω) and electron–phonon coupling parameter λ(ω)of NaC6-P6m. Inset shows the structure of NaC6-P6m.
Paper Nanoscale
2354 | Nanoscale, 2015, 7, 2352–2359 This journal is © The Royal Society of Chemistry 2015
Publ
ishe
d on
18
Dec
embe
r 20
14. D
ownl
oade
d by
Bei
jing
Uni
vers
ity o
n 29
/01/
2015
08:
16:0
1.
View Article Online
adsorbed metal chains on graphene. The thermal stabilityof the self-assembled Na and Ca chains on the grapheneis further investigated by performing ab initio moleculardynamics (AIMD) simulations. The Nosé heat bath scheme35 isused to maintain the temperature at 200 K. We observe thatafter 5000 steps, with a time step of 1 fs, the structures distortslightly, and the final system can be re-optimized to theirstable static structures. This demonstrates that the NaC8-Pmgand the CaC8-Pm are thermally stable at finite temperature.
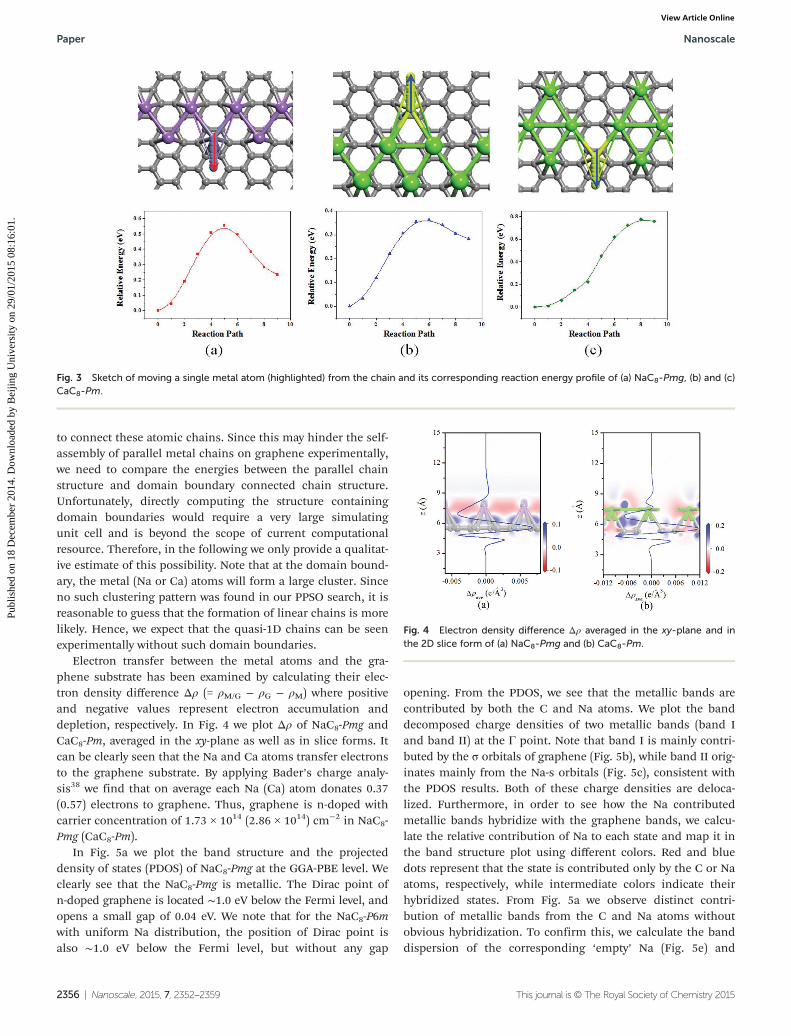
In order to further confirm the stability of Na and Cachains on graphene, we calculate the energy barrier necessaryto move a single metal atom from the chain along the y direc-tion (normal to the chain direction) by using nudged elasticband (NEB) method.36,37 For the NaC8-Pmg, we use a largerectangular supercell containing Na6C48 to reduce periodicconstraints. We find that the energy barrier of moving one Naatom from its original quasi-hollow site to the neighboringquasi-hollow site along the y direction is 0.55 eV (Fig. 3a). Onthe other hand, for the CaC8-Pm, the energy barriers of movingtwo different in-equivalent Ca atoms from the chain are 0.36and 0.78 eV, respectively (see Fig. 3b and 3c). These highenergy barriers are mainly due to strong metal–metal bondformation energy and indicate that the self-assembled Na andCa chains are stable at room temperature.
We next calculate the relative energies between the chain-like and uniform distribution pattern when Na and Ca atomsare sandwiched between two graphene layers, forming C8–Na–C8 and C8–Ca–C8 structures – similar to graphitic intercalationcompounds (GIC). We find that for the C8–Na–C8, the uniformP6m pattern becomes energetically lower than the Pmg chain-like pattern by 0.086 eV. On the contrary, the C8–Ca–C8 stillfavors the chain-like pattern rather than the uniform P6m by0.050 eV. We also studied the effect of external electric field onthe stability of the NaC8-Pmg and CaC8-Pm. With intermediateelectric field, we find that both of the NaC8-Pmg and CaC8-Pmstructures are still more stable than their correspondinguniform patterns. For example, for NaC8, an electric field of1.0 V Å−1 pointing from graphene to Na layer decreases ΔE/f.u.from 133 meV to 41 meV. For CaC8, the same electric fieldchanges the ΔE/f.u. from 206 meV to 112 meV. These resultssuggest that the stability of the self-assembled Na and Cachains on graphene is robust.
We should point out that due to the boundary constraintsof the simulating supercells, the self-assembly of Na and Cachains are found to be parallel to each other. However, due tothe six-fold symmetry of the graphene substrate, formation ofdifferent atomic chains oriented at 120° with each other isequally probable. Consequently, domain boundaries will exist
Fig. 2 Ground state structures of (a) NaC8 and (c) CaC8, compared with the uniform distribution pattern shown in (b) and (d) respectively. Relativeenergies per formula unit and plane symmetry groups are shown beneath the structures. Grey, violet, and green spheres represent C, Na, and Caatoms, respectively. Blue dashed rectangle and rhombus represent unit cells.
Nanoscale Paper
This journal is © The Royal Society of Chemistry 2015 Nanoscale, 2015, 7, 2352–2359 | 2355
Publ
ishe
d on
18
Dec
embe
r 20
14. D
ownl
oade
d by
Bei
jing
Uni
vers
ity o
n 29
/01/
2015
08:
16:0
1.
View Article Online
to connect these atomic chains. Since this may hinder the self-assembly of parallel metal chains on graphene experimentally,we need to compare the energies between the parallel chainstructure and domain boundary connected chain structure.Unfortunately, directly computing the structure containingdomain boundaries would require a very large simulatingunit cell and is beyond the scope of current computationalresource. Therefore, in the following we only provide a qualitat-ive estimate of this possibility. Note that at the domain bound-ary, the metal (Na or Ca) atoms will form a large cluster. Sinceno such clustering pattern was found in our PPSO search, it isreasonable to guess that the formation of linear chains is morelikely. Hence, we expect that the quasi-1D chains can be seenexperimentally without such domain boundaries.
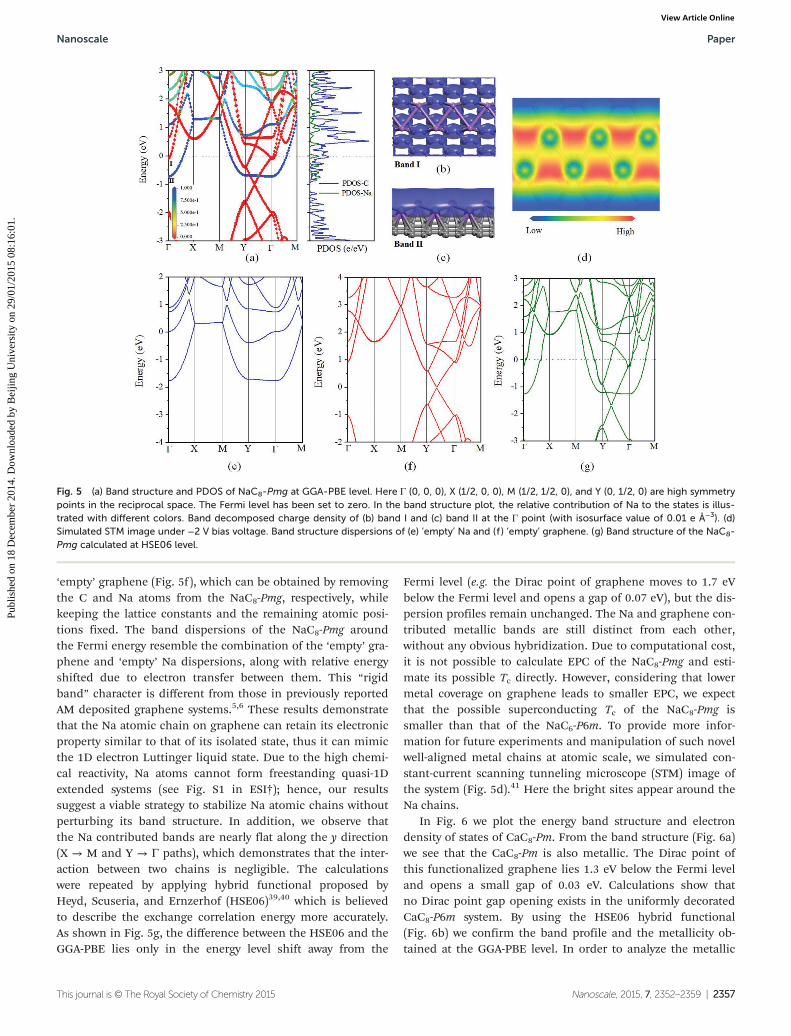
Electron transfer between the metal atoms and the gra-phene substrate has been examined by calculating their elec-tron density difference Δρ (= ρM/G − ρG − ρM) where positiveand negative values represent electron accumulation anddepletion, respectively. In Fig. 4 we plot Δρ of NaC8-Pmg andCaC8-Pm, averaged in the xy-plane as well as in slice forms. Itcan be clearly seen that the Na and Ca atoms transfer electronsto the graphene substrate. By applying Bader’s charge analy-sis38 we find that on average each Na (Ca) atom donates 0.37(0.57) electrons to graphene. Thus, graphene is n-doped withcarrier concentration of 1.73 × 10¹⁴ (2.86 × 10¹⁴) cm−2 in NaC8-Pmg (CaC8-Pm).
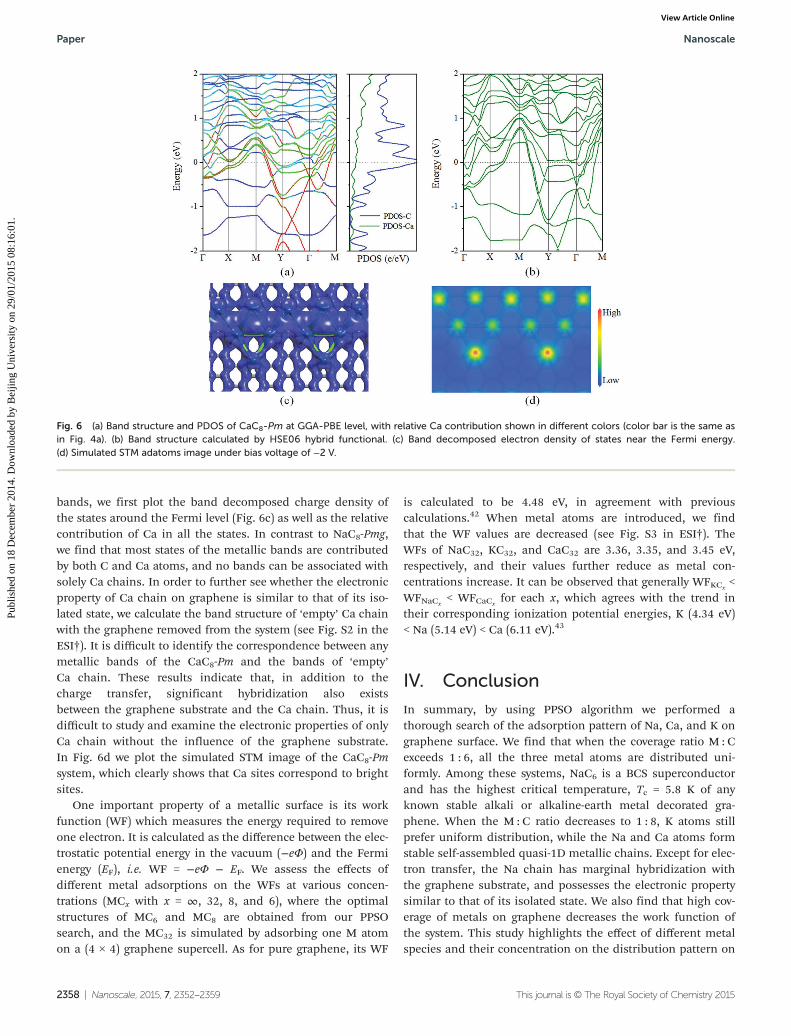
In Fig. 5a we plot the band structure and the projecteddensity of states (PDOS) of NaC8-Pmg at the GGA-PBE level. Weclearly see that the NaC8-Pmg is metallic. The Dirac point ofn-doped graphene is located ∼1.0 eV below the Fermi level, andopens a small gap of 0.04 eV. We note that for the NaC8-P6mwith uniform Na distribution, the position of Dirac point isalso ∼1.0 eV below the Fermi level, but without any gap
opening. From the PDOS, we see that the metallic bands arecontributed by both the C and Na atoms. We plot the banddecomposed charge densities of two metallic bands (band Iand band II) at the Γ point. Note that band I is mainly contri-buted by the σ orbitals of graphene (Fig. 5b), while band II orig-inates mainly from the Na-s orbitals (Fig. 5c), consistent withthe PDOS results. Both of these charge densities are deloca-lized. Furthermore, in order to see how the Na contributedmetallic bands hybridize with the graphene bands, we calcu-late the relative contribution of Na to each state and map it inthe band structure plot using different colors. Red and bluedots represent that the state is contributed only by the C or Naatoms, respectively, while intermediate colors indicate theirhybridized states. From Fig. 5a we observe distinct contri-bution of metallic bands from the C and Na atoms withoutobvious hybridization. To confirm this, we calculate the banddispersion of the corresponding ‘empty’ Na (Fig. 5e) and
Fig. 3 Sketch of moving a single metal atom (highlighted) from the chain and its corresponding reaction energy profile of (a) NaC8-Pmg, (b) and (c)CaC8-Pm.
Fig. 4 Electron density difference Δρ averaged in the xy-plane and inthe 2D slice form of (a) NaC8-Pmg and (b) CaC8-Pm.
Paper Nanoscale
2356 | Nanoscale, 2015, 7, 2352–2359 This journal is © The Royal Society of Chemistry 2015
Publ
ishe
d on
18
Dec
embe
r 20
14. D
ownl
oade
d by
Bei
jing
Uni
vers
ity o
n 29
/01/
2015
08:
16:0
1.
View Article Online
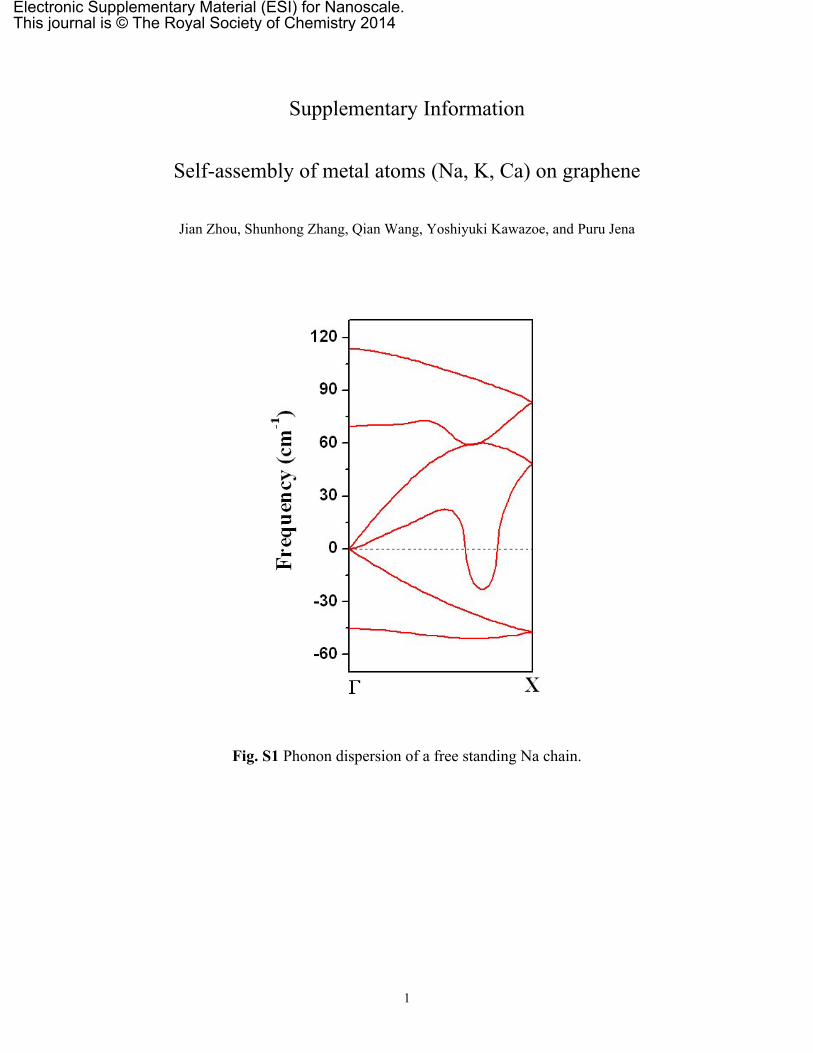
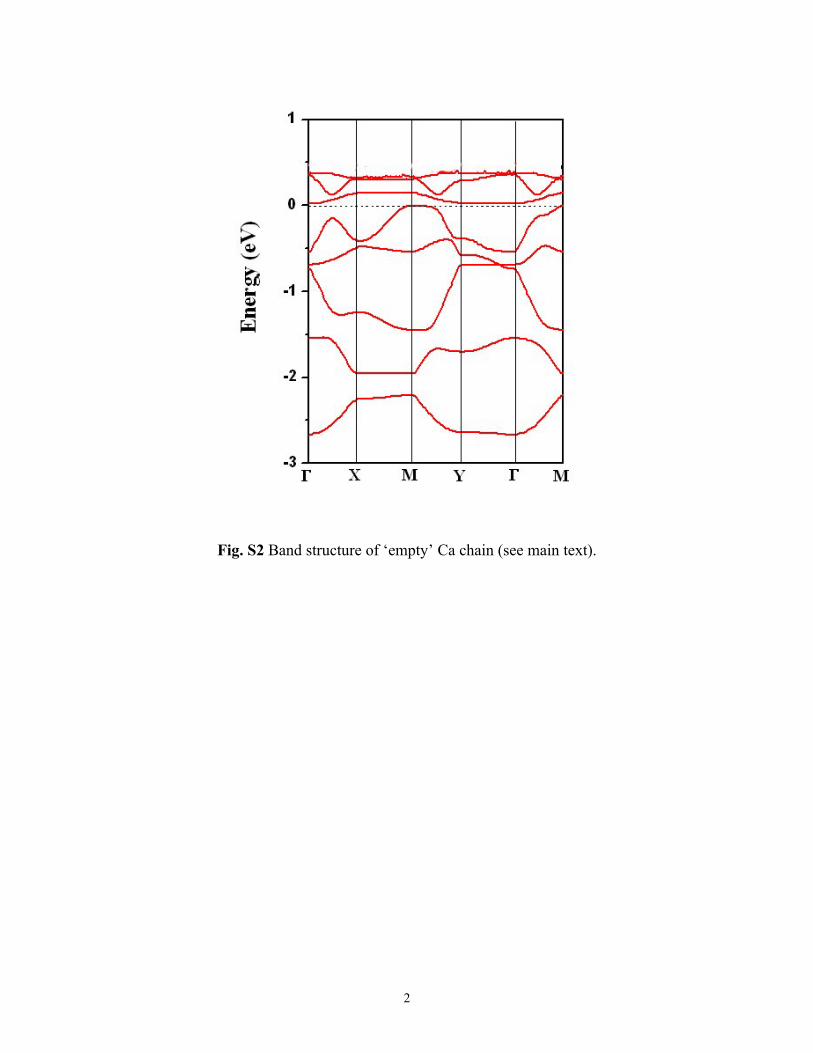
‘empty’ graphene (Fig. 5f), which can be obtained by removingthe C and Na atoms from the NaC8-Pmg, respectively, whilekeeping the lattice constants and the remaining atomic posi-tions fixed. The band dispersions of the NaC8-Pmg aroundthe Fermi energy resemble the combination of the ‘empty’ gra-phene and ‘empty’ Na dispersions, along with relative energyshifted due to electron transfer between them. This “rigidband” character is different from those in previously reportedAM deposited graphene systems.5,6 These results demonstratethat the Na atomic chain on graphene can retain its electronicproperty similar to that of its isolated state, thus it can mimicthe 1D electron Luttinger liquid state. Due to the high chemi-cal reactivity, Na atoms cannot form freestanding quasi-1Dextended systems (see Fig. S1 in ESI†); hence, our resultssuggest a viable strategy to stabilize Na atomic chains withoutperturbing its band structure. In addition, we observe thatthe Na contributed bands are nearly flat along the y direction(X → M and Y → Γ paths), which demonstrates that the inter-action between two chains is negligible. The calculationswere repeated by applying hybrid functional proposed byHeyd, Scuseria, and Ernzerhof (HSE06)39,40 which is believedto describe the exchange correlation energy more accurately.As shown in Fig. 5g, the difference between the HSE06 and theGGA-PBE lies only in the energy level shift away from the
Fermi level (e.g. the Dirac point of graphene moves to 1.7 eVbelow the Fermi level and opens a gap of 0.07 eV), but the dis-persion profiles remain unchanged. The Na and graphene con-tributed metallic bands are still distinct from each other,without any obvious hybridization. Due to computational cost,it is not possible to calculate EPC of the NaC8-Pmg and esti-mate its possible Tc directly. However, considering that lowermetal coverage on graphene leads to smaller EPC, we expectthat the possible superconducting Tc of the NaC8-Pmg issmaller than that of the NaC6-P6m. To provide more infor-mation for future experiments and manipulation of such novelwell-aligned metal chains at atomic scale, we simulated con-stant-current scanning tunneling microscope (STM) image ofthe system (Fig. 5d).41 Here the bright sites appear around theNa chains.
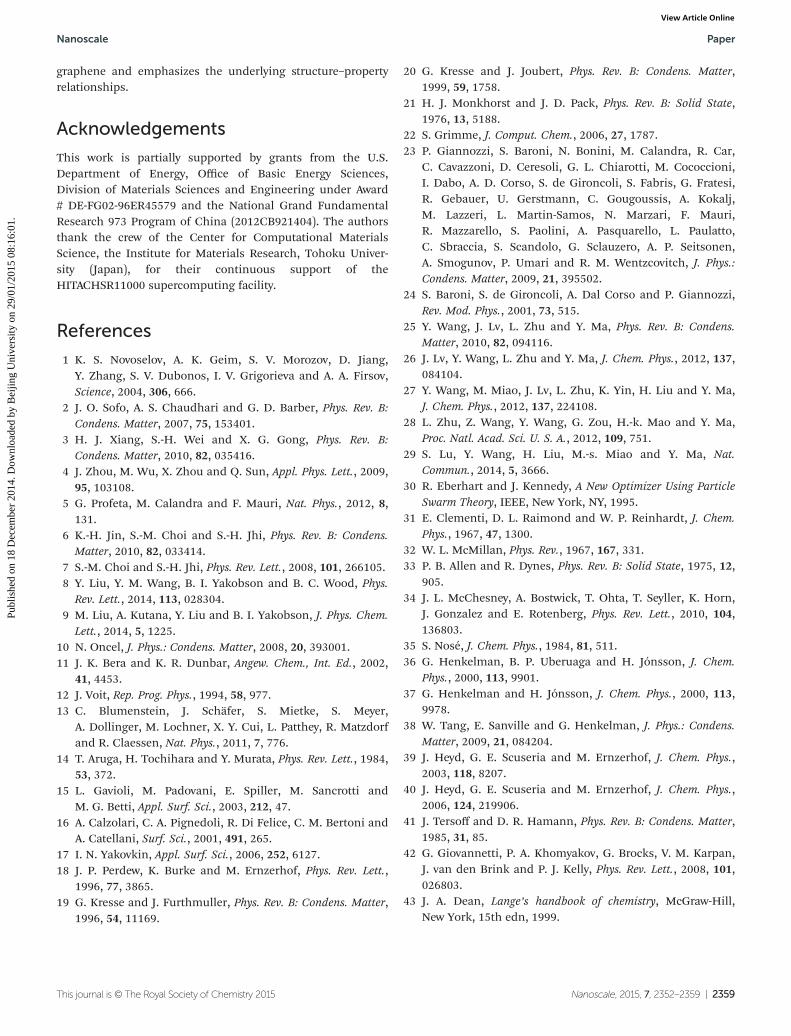
In Fig. 6 we plot the energy band structure and electrondensity of states of CaC8-Pm. From the band structure (Fig. 6a)we see that the CaC8-Pm is also metallic. The Dirac point ofthis functionalized graphene lies 1.3 eV below the Fermi leveland opens a small gap of 0.03 eV. Calculations show thatno Dirac point gap opening exists in the uniformly decoratedCaC8-P6m system. By using the HSE06 hybrid functional(Fig. 6b) we confirm the band profile and the metallicity ob-tained at the GGA-PBE level. In order to analyze the metallic
Fig. 5 (a) Band structure and PDOS of NaC8-Pmg at GGA-PBE level. Here Γ (0, 0, 0), X (1/2, 0, 0), M (1/2, 1/2, 0), and Y (0, 1/2, 0) are high symmetrypoints in the reciprocal space. The Fermi level has been set to zero. In the band structure plot, the relative contribution of Na to the states is illus-trated with different colors. Band decomposed charge density of (b) band I and (c) band II at the Γ point (with isosurface value of 0.01 e Å−3). (d)Simulated STM image under −2 V bias voltage. Band structure dispersions of (e) ‘empty’ Na and (f ) ‘empty’ graphene. (g) Band structure of the NaC8-Pmg calculated at HSE06 level.
Nanoscale Paper
This journal is © The Royal Society of Chemistry 2015 Nanoscale, 2015, 7, 2352–2359 | 2357
Publ
ishe
d on
18
Dec
embe
r 20
14. D
ownl
oade
d by
Bei
jing
Uni
vers
ity o
n 29
/01/
2015
08:
16:0
1.
View Article Online
bands, we first plot the band decomposed charge density ofthe states around the Fermi level (Fig. 6c) as well as the relativecontribution of Ca in all the states. In contrast to NaC8-Pmg,we find that most states of the metallic bands are contributedby both C and Ca atoms, and no bands can be associated withsolely Ca chains. In order to further see whether the electronicproperty of Ca chain on graphene is similar to that of its iso-lated state, we calculate the band structure of ‘empty’ Ca chainwith the graphene removed from the system (see Fig. S2 in theESI†). It is difficult to identify the correspondence between anymetallic bands of the CaC8-Pm and the bands of ‘empty’Ca chain. These results indicate that, in addition to thecharge transfer, significant hybridization also existsbetween the graphene substrate and the Ca chain. Thus, it isdifficult to study and examine the electronic properties of onlyCa chain without the influence of the graphene substrate.In Fig. 6d we plot the simulated STM image of the CaC8-Pmsystem, which clearly shows that Ca sites correspond to brightsites.
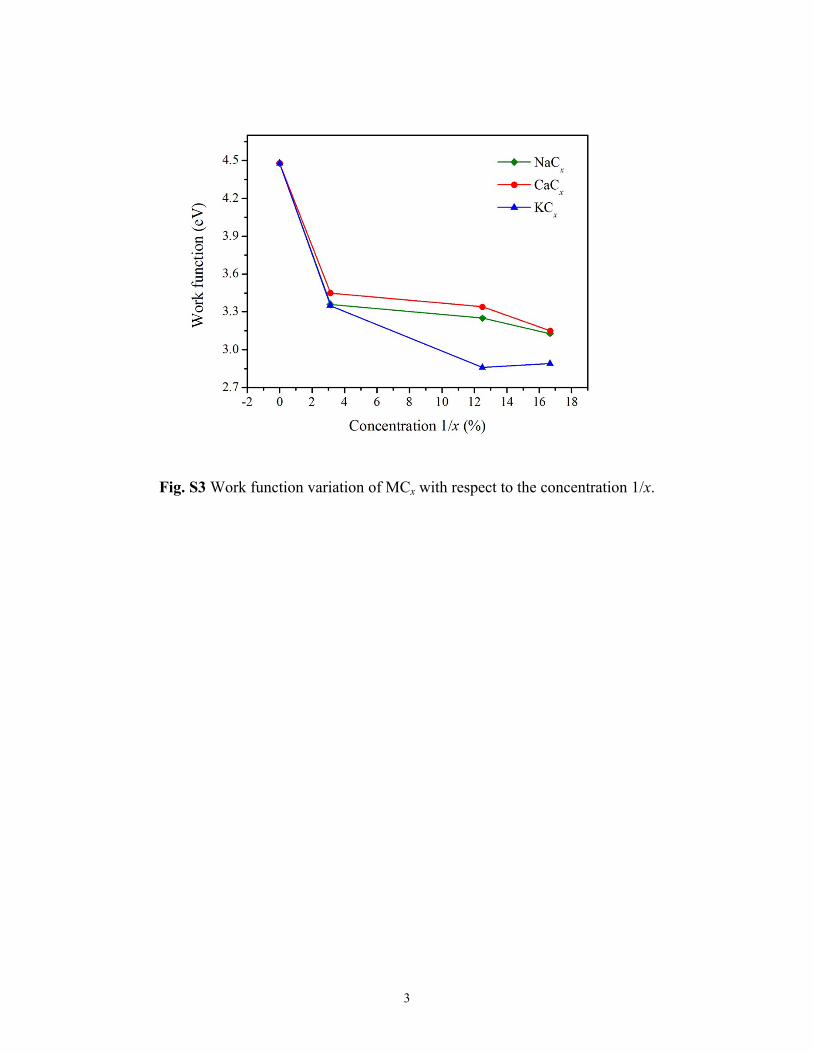
One important property of a metallic surface is its workfunction (WF) which measures the energy required to removeone electron. It is calculated as the difference between the elec-trostatic potential energy in the vacuum (−eΦ) and the Fermienergy (EF), i.e. WF = −eΦ − EF. We assess the effects ofdifferent metal adsorptions on the WFs at various concen-trations (MCx with x = ∞, 32, 8, and 6), where the optimalstructures of MC6 and MC8 are obtained from our PPSOsearch, and the MC32 is simulated by adsorbing one M atomon a (4 × 4) graphene supercell. As for pure graphene, its WF
is calculated to be 4.48 eV, in agreement with previouscalculations.42 When metal atoms are introduced, we findthat the WF values are decreased (see Fig. S3 in ESI†). TheWFs of NaC32, KC32, and CaC32 are 3.36, 3.35, and 3.45 eV,respectively, and their values further reduce as metal con-centrations increase. It can be observed that generally WFKCx
<WFNaCx
< WFCaCxfor each x, which agrees with the trend in
their corresponding ionization potential energies, K (4.34 eV)< Na (5.14 eV) < Ca (6.11 eV).43
IV. Conclusion
In summary, by using PPSO algorithm we performed athorough search of the adsorption pattern of Na, Ca, and K ongraphene surface. We find that when the coverage ratio M : Cexceeds 1 : 6, all the three metal atoms are distributed uni-formly. Among these systems, NaC6 is a BCS superconductorand has the highest critical temperature, Tc = 5.8 K of anyknown stable alkali or alkaline-earth metal decorated gra-phene. When the M : C ratio decreases to 1 : 8, K atoms stillprefer uniform distribution, while the Na and Ca atoms formstable self-assembled quasi-1D metallic chains. Except for elec-tron transfer, the Na chain has marginal hybridization withthe graphene substrate, and possesses the electronic propertysimilar to that of its isolated state. We also find that high cov-erage of metals on graphene decreases the work function ofthe system. This study highlights the effect of different metalspecies and their concentration on the distribution pattern on
Fig. 6 (a) Band structure and PDOS of CaC8-Pm at GGA-PBE level, with relative Ca contribution shown in different colors (color bar is the same asin Fig. 4a). (b) Band structure calculated by HSE06 hybrid functional. (c) Band decomposed electron density of states near the Fermi energy.(d) Simulated STM adatoms image under bias voltage of −2 V.
Paper Nanoscale
2358 | Nanoscale, 2015, 7, 2352–2359 This journal is © The Royal Society of Chemistry 2015
Publ
ishe
d on
18
Dec
embe
r 20
14. D
ownl
oade
d by
Bei
jing
Uni
vers
ity o
n 29
/01/
2015
08:
16:0
1.
View Article Online
graphene and emphasizes the underlying structure–propertyrelationships.
Acknowledgements
This work is partially supported by grants from the U.S.Department of Energy, Office of Basic Energy Sciences,Division of Materials Sciences and Engineering under Award# DE-FG02-96ER45579 and the National Grand FundamentalResearch 973 Program of China (2012CB921404). The authorsthank the crew of the Center for Computational MaterialsScience, the Institute for Materials Research, Tohoku Univer-sity (Japan), for their continuous support of theHITACHSR11000 supercomputing facility.
References
1 K. S. Novoselov, A. K. Geim, S. V. Morozov, D. Jiang,Y. Zhang, S. V. Dubonos, I. V. Grigorieva and A. A. Firsov,Science, 2004, 306, 666.
2 J. O. Sofo, A. S. Chaudhari and G. D. Barber, Phys. Rev. B:Condens. Matter, 2007, 75, 153401.
3 H. J. Xiang, S.-H. Wei and X. G. Gong, Phys. Rev. B:Condens. Matter, 2010, 82, 035416.
4 J. Zhou, M. Wu, X. Zhou and Q. Sun, Appl. Phys. Lett., 2009,95, 103108.
5 G. Profeta, M. Calandra and F. Mauri, Nat. Phys., 2012, 8,131.
6 K.-H. Jin, S.-M. Choi and S.-H. Jhi, Phys. Rev. B: Condens.Matter, 2010, 82, 033414.
7 S.-M. Choi and S.-H. Jhi, Phys. Rev. Lett., 2008, 101, 266105.8 Y. Liu, Y. M. Wang, B. I. Yakobson and B. C. Wood, Phys.
Rev. Lett., 2014, 113, 028304.9 M. Liu, A. Kutana, Y. Liu and B. I. Yakobson, J. Phys. Chem.
Lett., 2014, 5, 1225.10 N. Oncel, J. Phys.: Condens. Matter, 2008, 20, 393001.11 J. K. Bera and K. R. Dunbar, Angew. Chem., Int. Ed., 2002,
41, 4453.12 J. Voit, Rep. Prog. Phys., 1994, 58, 977.13 C. Blumenstein, J. Schäfer, S. Mietke, S. Meyer,
A. Dollinger, M. Lochner, X. Y. Cui, L. Patthey, R. Matzdorfand R. Claessen, Nat. Phys., 2011, 7, 776.
14 T. Aruga, H. Tochihara and Y. Murata, Phys. Rev. Lett., 1984,53, 372.
15 L. Gavioli, M. Padovani, E. Spiller, M. Sancrotti andM. G. Betti, Appl. Surf. Sci., 2003, 212, 47.
16 A. Calzolari, C. A. Pignedoli, R. Di Felice, C. M. Bertoni andA. Catellani, Surf. Sci., 2001, 491, 265.
17 I. N. Yakovkin, Appl. Surf. Sci., 2006, 252, 6127.18 J. P. Perdew, K. Burke and M. Ernzerhof, Phys. Rev. Lett.,
1996, 77, 3865.19 G. Kresse and J. Furthmuller, Phys. Rev. B: Condens. Matter,
1996, 54, 11169.
20 G. Kresse and J. Joubert, Phys. Rev. B: Condens. Matter,1999, 59, 1758.
21 H. J. Monkhorst and J. D. Pack, Phys. Rev. B: Solid State,1976, 13, 5188.
22 S. Grimme, J. Comput. Chem., 2006, 27, 1787.23 P. Giannozzi, S. Baroni, N. Bonini, M. Calandra, R. Car,
C. Cavazzoni, D. Ceresoli, G. L. Chiarotti, M. Cococcioni,I. Dabo, A. D. Corso, S. de Gironcoli, S. Fabris, G. Fratesi,R. Gebauer, U. Gerstmann, C. Gougoussis, A. Kokalj,M. Lazzeri, L. Martin-Samos, N. Marzari, F. Mauri,R. Mazzarello, S. Paolini, A. Pasquarello, L. Paulatto,C. Sbraccia, S. Scandolo, G. Sclauzero, A. P. Seitsonen,A. Smogunov, P. Umari and R. M. Wentzcovitch, J. Phys.:Condens. Matter, 2009, 21, 395502.
24 S. Baroni, S. de Gironcoli, A. Dal Corso and P. Giannozzi,Rev. Mod. Phys., 2001, 73, 515.
25 Y. Wang, J. Lv, L. Zhu and Y. Ma, Phys. Rev. B: Condens.Matter, 2010, 82, 094116.
26 J. Lv, Y. Wang, L. Zhu and Y. Ma, J. Chem. Phys., 2012, 137,084104.
27 Y. Wang, M. Miao, J. Lv, L. Zhu, K. Yin, H. Liu and Y. Ma,J. Chem. Phys., 2012, 137, 224108.
28 L. Zhu, Z. Wang, Y. Wang, G. Zou, H.-k. Mao and Y. Ma,Proc. Natl. Acad. Sci. U. S. A., 2012, 109, 751.
29 S. Lu, Y. Wang, H. Liu, M.-s. Miao and Y. Ma, Nat.Commun., 2014, 5, 3666.
30 R. Eberhart and J. Kennedy, A New Optimizer Using ParticleSwarm Theory, IEEE, New York, NY, 1995.
31 E. Clementi, D. L. Raimond and W. P. Reinhardt, J. Chem.Phys., 1967, 47, 1300.
32 W. L. McMillan, Phys. Rev., 1967, 167, 331.33 P. B. Allen and R. Dynes, Phys. Rev. B: Solid State, 1975, 12,
905.34 J. L. McChesney, A. Bostwick, T. Ohta, T. Seyller, K. Horn,
J. Gonzalez and E. Rotenberg, Phys. Rev. Lett., 2010, 104,136803.
35 S. Nosé, J. Chem. Phys., 1984, 81, 511.36 G. Henkelman, B. P. Uberuaga and H. Jónsson, J. Chem.
Phys., 2000, 113, 9901.37 G. Henkelman and H. Jónsson, J. Chem. Phys., 2000, 113,
9978.38 W. Tang, E. Sanville and G. Henkelman, J. Phys.: Condens.
Matter, 2009, 21, 084204.39 J. Heyd, G. E. Scuseria and M. Ernzerhof, J. Chem. Phys.,
2003, 118, 8207.40 J. Heyd, G. E. Scuseria and M. Ernzerhof, J. Chem. Phys.,
2006, 124, 219906.41 J. Tersoff and D. R. Hamann, Phys. Rev. B: Condens. Matter,
1985, 31, 85.42 G. Giovannetti, P. A. Khomyakov, G. Brocks, V. M. Karpan,
J. van den Brink and P. J. Kelly, Phys. Rev. Lett., 2008, 101,026803.
43 J. A. Dean, Lange’s handbook of chemistry, McGraw-Hill,New York, 15th edn, 1999.
Nanoscale Paper
This journal is © The Royal Society of Chemistry 2015 Nanoscale, 2015, 7, 2352–2359 | 2359
Publ
ishe
d on
18
Dec
embe
r 20
14. D
ownl
oade
d by
Bei
jing
Uni
vers
ity o
n 29
/01/
2015
08:
16:0
1.
View Article Online
1
Supplementary Information
Self-assembly of metal atoms (Na, K, Ca) on graphene
Jian Zhou, Shunhong Zhang, Qian Wang, Yoshiyuki Kawazoe, and Puru Jena
Fig. S1 Phonon dispersion of a free standing Na chain.
Electronic Supplementary Material (ESI) for Nanoscale.This journal is © The Royal Society of Chemistry 2014
2
Fig. S2 Band structure of ‘empty’ Ca chain (see main text).
3
Fig. S3 Work function variation of MCx with respect to the concentration 1/x.