nanoparticle deposits formed at driven contact lineshera.ugr.es/tesisugr/21455764.pdf · 3.1.1...
TRANSCRIPT
Department of Applied Physics
University of Granada
Doctoral Thesis
Nanoparticle deposits formed at drivencontact lines
Authoress:
Carmen Lucıa
Moraila-Martınez
Supervisors:
Dr. Miguel A.
Cabrerizo-Vılchez
Dr. Miguel A.
Rodrıguez-Valverde
July 2, 2012

Editor: Editorial de la Universidad de GranadaAutor: Carmen Lucía Moraila MartínezD.L.: GR 374-2013ISBN: 978-84-9028-331-8

Contents
Acknowledgments 1
Motivation 3
I Receding contact lines of pure liquids 7
1 Theoretical framework 9
1.1 Wetting . . . . . . . . . . . . . . . . . . . . . . . . . . . . . . . . . . . . . . . 9
1.1.1 Young equation . . . . . . . . . . . . . . . . . . . . . . . . . . . . . . . 10
1.1.2 Contact angle hysteresis . . . . . . . . . . . . . . . . . . . . . . . . . . . 13
1.1.3 Receding contact angle . . . . . . . . . . . . . . . . . . . . . . . . . . . 16
1.1.4 Contact line dynamics . . . . . . . . . . . . . . . . . . . . . . . . . . . . 18
1.2 Freely evaporating drops . . . . . . . . . . . . . . . . . . . . . . . . . . . . . . 21
2 Materials and techniques 25
ii Contents
2.1 Materials . . . . . . . . . . . . . . . . . . . . . . . . . . . . . . . . . . . . . . . 25
2.2 Low-rate dynamic contact angle technique . . . . . . . . . . . . . . . . . . . . . 26
2.3 Experimental set-up for contact angle measurements . . . . . . . . . . . . . . . 27
2.4 Sessile drops with steadily-driven contact line . . . . . . . . . . . . . . . . . . . 30
2.4.1 Statistical correlation . . . . . . . . . . . . . . . . . . . . . . . . . . . . 31
2.4.2 Implementation of the Quadratic Flow Rate method . . . . . . . . . . . 31
2.5 Controlled Shrinking Sessile Drop . . . . . . . . . . . . . . . . . . . . . . . . . . 34
3 Results and Discussion 37
3.1 The effect of contact line dynamics and drop formation . . . . . . . . . . . . . . 37
3.1.1 Comparison between Constant Flow Rate and Quadratic Flow Rate . . . 38
3.1.2 Forced wetting, really? . . . . . . . . . . . . . . . . . . . . . . . . . . . 43
3.1.3 Effect of contact line speed on the receding contact angle . . . . . . . . 46
3.1.4 Receding contact angle on rough titanium surfaces . . . . . . . . . . . . 47
3.1.5 Dependence of the receding contact angle on the drop formation . . . . . 48
3.2 Controlled Shrinking Sessile Drop . . . . . . . . . . . . . . . . . . . . . . . . . . 51
4 Conclusions 57
II Receding contact lines of complex liquids 61
5 Theoretical framework 63
5.1 Coffee stain effect . . . . . . . . . . . . . . . . . . . . . . . . . . . . . . . . . . 63
5.2 Derjaguin, Landau, Verwey and Overbeek interactions . . . . . . . . . . . . . . . 67
6 Materials and techniques 71
6.1 Particles . . . . . . . . . . . . . . . . . . . . . . . . . . . . . . . . . . . . . . . 72
6.2 Particle diameter . . . . . . . . . . . . . . . . . . . . . . . . . . . . . . . . . . 72
Contents iii
6.3 Electric state . . . . . . . . . . . . . . . . . . . . . . . . . . . . . . . . . . . . . 73
6.4 Colloidal stability . . . . . . . . . . . . . . . . . . . . . . . . . . . . . . . . . . 76
6.5 Viscosity . . . . . . . . . . . . . . . . . . . . . . . . . . . . . . . . . . . . . . . 81
6.6 Wettability of particles . . . . . . . . . . . . . . . . . . . . . . . . . . . . . . . 81
6.7 Surface tension . . . . . . . . . . . . . . . . . . . . . . . . . . . . . . . . . . . 83
6.8 Substrates for deposit formation . . . . . . . . . . . . . . . . . . . . . . . . . . 85
6.8.1 Poly(methyl methacrylate) . . . . . . . . . . . . . . . . . . . . . . . . . 86
6.8.2 Titanium . . . . . . . . . . . . . . . . . . . . . . . . . . . . . . . . . . . 87
6.9 Summary . . . . . . . . . . . . . . . . . . . . . . . . . . . . . . . . . . . . . . . 90
7 Evaporating drops and shrinking drops of nanoparticle suspensions 93
8 The role of the electrostatic interactions 99
8.1 Evaporating drops of nanoparticle suspensions . . . . . . . . . . . . . . . . . . . 99
8.2 Preliminary CSSD experiments with nanoparticle suspensions . . . . . . . . . . . 107
8.3 Substrate-particle electrostatic attraction . . . . . . . . . . . . . . . . . . . . . . 112
8.4 Strong substrate-particle repulsion . . . . . . . . . . . . . . . . . . . . . . . . . 114
8.5 Weak substrate-particle interaction . . . . . . . . . . . . . . . . . . . . . . . . . 116
8.6 Discussion . . . . . . . . . . . . . . . . . . . . . . . . . . . . . . . . . . . . . . 118
9 Deposit morphology 125
9.1 Nanoparticles concentration . . . . . . . . . . . . . . . . . . . . . . . . . . . . . 126
9.2 Pinning time . . . . . . . . . . . . . . . . . . . . . . . . . . . . . . . . . . . . . 129
9.3 Particle size and binary suspensions . . . . . . . . . . . . . . . . . . . . . . . . . 135
10 Conclusions 145
iv Contents
III Appendices 149
A What means hysteresis? 151
A.1 Memory, dissipation, branching and metastability . . . . . . . . . . . . . . . . . 151
A.2 Adhesion hysteresis . . . . . . . . . . . . . . . . . . . . . . . . . . . . . . . . . 152
A.3 Illustrating adhesion hysteresis using soap film patterns . . . . . . . . . . . . . . 154
A.4 Correlation friction-contact angle hysteresis . . . . . . . . . . . . . . . . . . . . 155
B How does the volume of a sessile drop scale with contact radius? 159
Bibliography 163
Acknowledgments
This work was supported by the “Ministerio Espanol de Ciencia e Innovacion” (project MAT2011-
23339) and the “Junta de Andalucıa” (projects P07-FQM-02517, P08-FQM-4325 and P09-FQM-
4698). We thank to Javier Montes, Miguel A. Fernndez, Yadira Snchez and Jos Antonio Martn
for the help and support during the experimental work. Also, we are very grateful to Dr. Juan
Antonio Holgado-Terriza, programmer of the software Contacto c© and Dinaten c© used for contact
angle measurements.

Motivation
Drying of colloidal suspensions appears in many applications such as coatings (paints, ink printing,
paving)(1), colloidal assembly/templating (2), discrimination of particles with different size (3)
even medical diagnostics (4). Complex liquids, namely suspensions of solid particles, polymeric
dispersions, emulsions.., and simple liquids behave in different way at interfacial regions. The
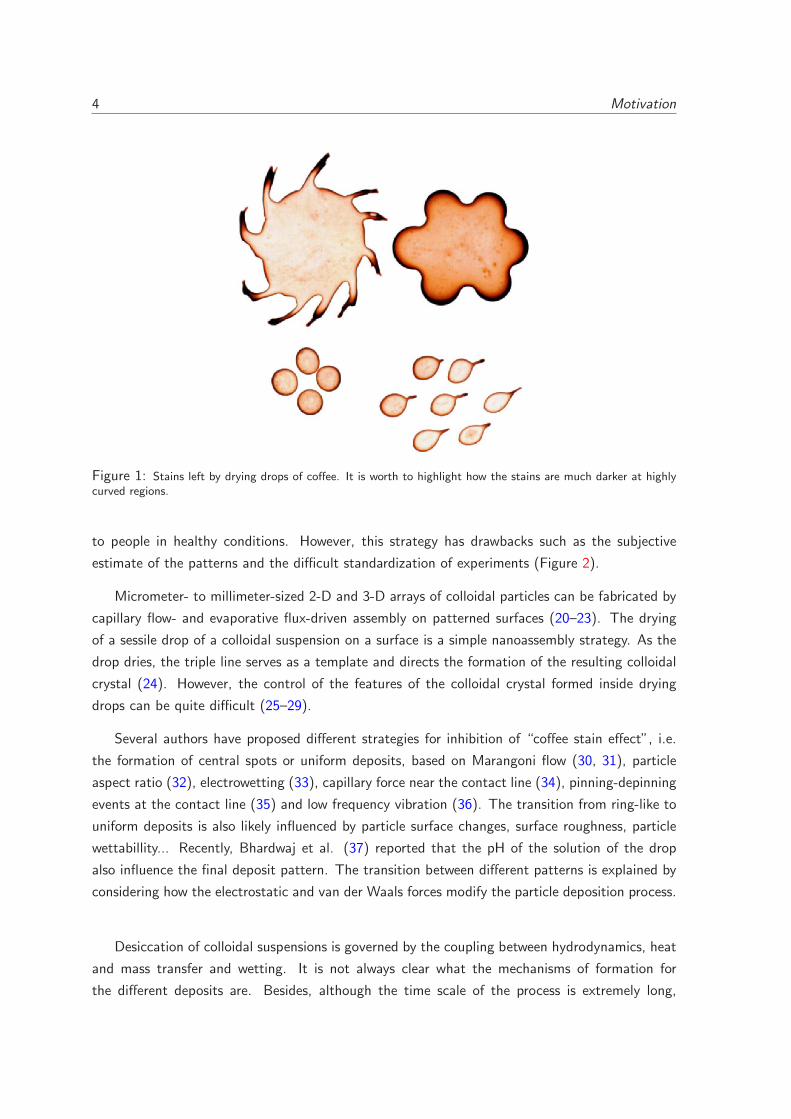
formation of stains at the periphery of drying drops of any colloidal dispersion (see Figure 1)
is known as the “coffee stain effect” or “coffee ring effect” (5–7). This effect is daily observed:
dishwasher stains on drinking glasses, red wine stains on textiles... Currently, the study of deposits
formation with mesoscopic particle suspensions upon drying conditions is an emerging topic with
1409 articles indexed in Web of Science (source: WoK) and 118000 results in Google.
Controlling the distribution of solute during drying is vital in many industrial and scientific
processes. For example, paint manufacturers use a variety of additives to ensure that the pigment
is evenly dispersed and remains so during drying (8). Spreading and drying of ink droplets ejected
from nozzles onto substrates is crucial for the inkjet deposition technologies (9, 10). For research
purposes, drying of drops is also used to deposit uniformly biological entities onto a substrate
such as bacteria (11, 12) or DNA molecules (13, 14). Segregation effects are undesirable in all
these cases. Otherwise, the “coffee ring effect” can be also fruitful.
After drying of pure water drops, the observation of short-lived nanoscopic structures on
surfaces exposed to air usually reveals the surface uncleanness due to adventitious substances
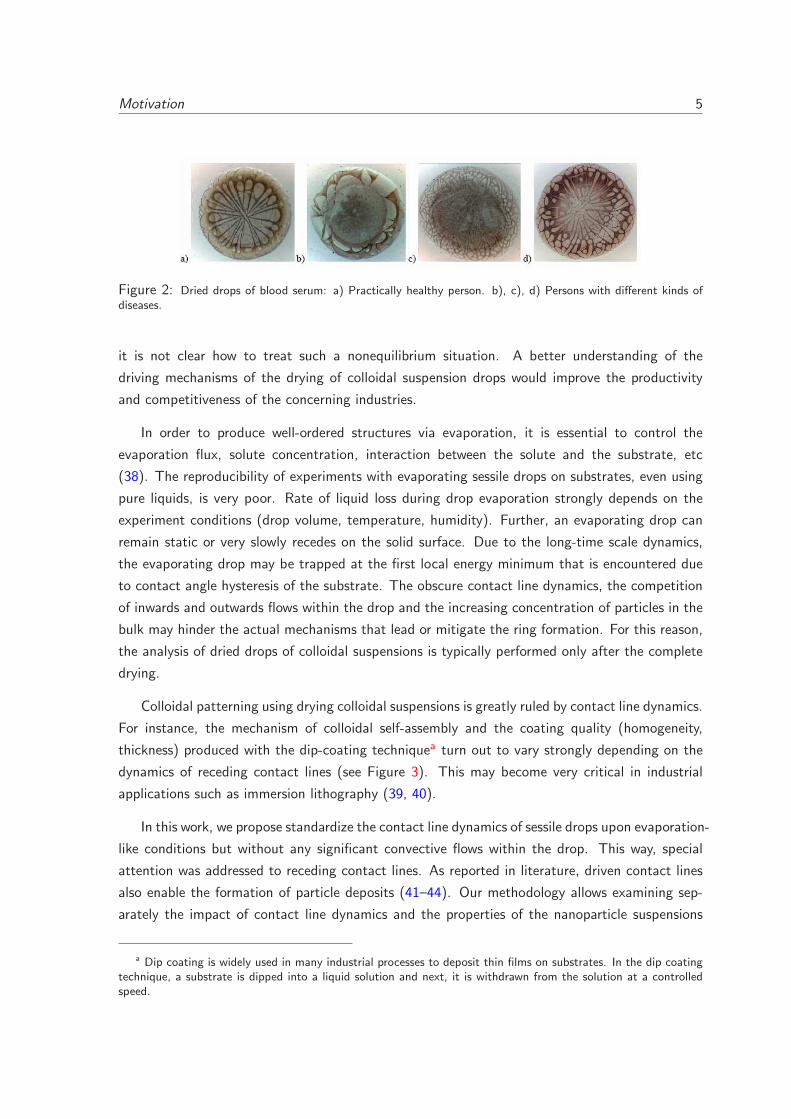
(15, 16). An innovative approach for medical diagnostics is based on the comparison of the
patterns of dried drops of biological liquids of people with different diseases (17–19) with regard
4 Motivation
Figure 1: Stains left by drying drops of coffee. It is worth to highlight how the stains are much darker at highlycurved regions.
to people in healthy conditions. However, this strategy has drawbacks such as the subjective
estimate of the patterns and the difficult standardization of experiments (Figure 2).
Micrometer- to millimeter-sized 2-D and 3-D arrays of colloidal particles can be fabricated by
capillary flow- and evaporative flux-driven assembly on patterned surfaces (20–23). The drying
of a sessile drop of a colloidal suspension on a surface is a simple nanoassembly strategy. As the
drop dries, the triple line serves as a template and directs the formation of the resulting colloidal
crystal (24). However, the control of the features of the colloidal crystal formed inside drying
drops can be quite difficult (25–29).
Several authors have proposed different strategies for inhibition of “coffee stain effect”, i.e.
the formation of central spots or uniform deposits, based on Marangoni flow (30, 31), particle
aspect ratio (32), electrowetting (33), capillary force near the contact line (34), pinning-depinning
events at the contact line (35) and low frequency vibration (36). The transition from ring-like to
uniform deposits is also likely influenced by particle surface changes, surface roughness, particle
wettabillity... Recently, Bhardwaj et al. (37) reported that the pH of the solution of the drop
also influence the final deposit pattern. The transition between different patterns is explained by
considering how the electrostatic and van der Waals forces modify the particle deposition process.
Desiccation of colloidal suspensions is governed by the coupling between hydrodynamics, heat
and mass transfer and wetting. It is not always clear what the mechanisms of formation for
the different deposits are. Besides, although the time scale of the process is extremely long,
Motivation 5
Figure 2: Dried drops of blood serum: a) Practically healthy person. b), c), d) Persons with different kinds ofdiseases.
it is not clear how to treat such a nonequilibrium situation. A better understanding of the
driving mechanisms of the drying of colloidal suspension drops would improve the productivity
and competitiveness of the concerning industries.
In order to produce well-ordered structures via evaporation, it is essential to control the
evaporation flux, solute concentration, interaction between the solute and the substrate, etc
(38). The reproducibility of experiments with evaporating sessile drops on substrates, even using
pure liquids, is very poor. Rate of liquid loss during drop evaporation strongly depends on the
experiment conditions (drop volume, temperature, humidity). Further, an evaporating drop can
remain static or very slowly recedes on the solid surface. Due to the long-time scale dynamics,
the evaporating drop may be trapped at the first local energy minimum that is encountered due
to contact angle hysteresis of the substrate. The obscure contact line dynamics, the competition
of inwards and outwards flows within the drop and the increasing concentration of particles in the
bulk may hinder the actual mechanisms that lead or mitigate the ring formation. For this reason,
the analysis of dried drops of colloidal suspensions is typically performed only after the complete
drying.
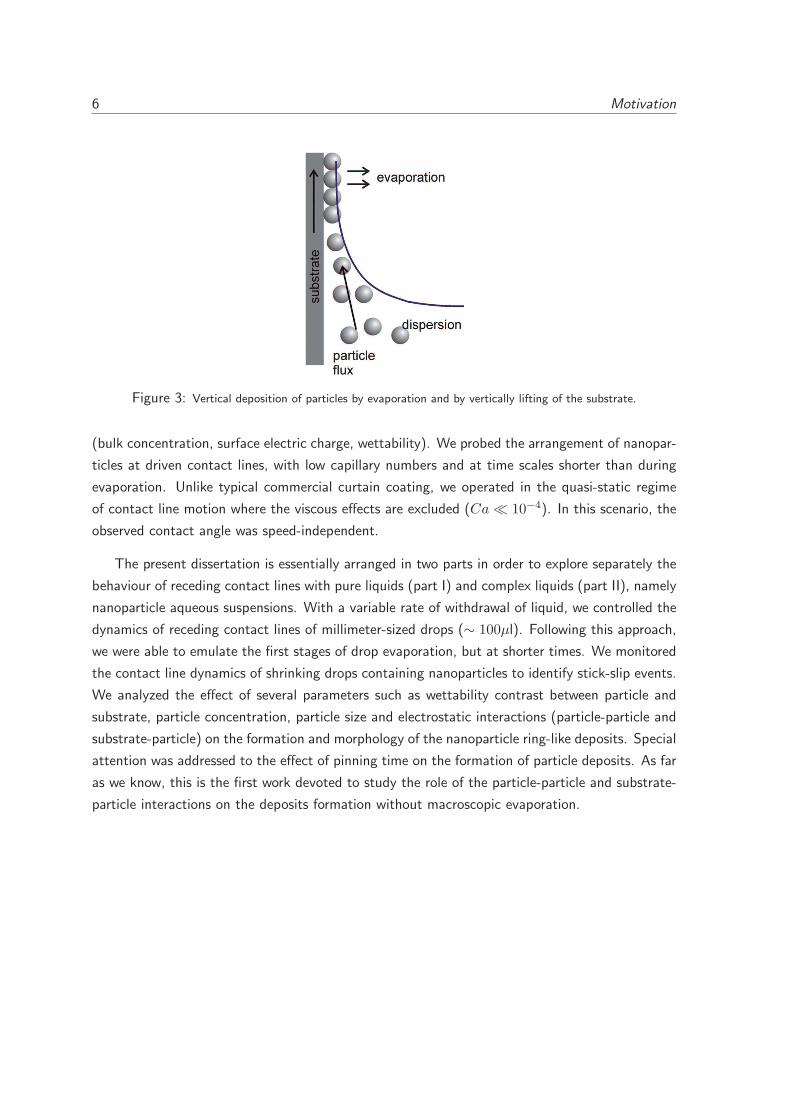
Colloidal patterning using drying colloidal suspensions is greatly ruled by contact line dynamics.
For instance, the mechanism of colloidal self-assembly and the coating quality (homogeneity,
thickness) produced with the dip-coating techniquea turn out to vary strongly depending on the
dynamics of receding contact lines (see Figure 3). This may become very critical in industrial
applications such as immersion lithography (39, 40).
In this work, we propose standardize the contact line dynamics of sessile drops upon evaporation-
like conditions but without any significant convective flows within the drop. This way, special
attention was addressed to receding contact lines. As reported in literature, driven contact lines
also enable the formation of particle deposits (41–44). Our methodology allows examining sep-
arately the impact of contact line dynamics and the properties of the nanoparticle suspensions
a Dip coating is widely used in many industrial processes to deposit thin films on substrates. In the dip coatingtechnique, a substrate is dipped into a liquid solution and next, it is withdrawn from the solution at a controlledspeed.
6 Motivation
Dow
nlo
aded
by U
niv
ersi
dad
de
Gra
nad
a on 2
5 A
pri
l 2012
Publi
shed
on 1
8 N
ovem
ber
2011 o
n h
ttp:/
/pubs.
rsc.
org
| doi:
10.1
039/C
1S
M06650A
Figure 3: Vertical deposition of particles by evaporation and by vertically lifting of the substrate.
(bulk concentration, surface electric charge, wettability). We probed the arrangement of nanopar-
ticles at driven contact lines, with low capillary numbers and at time scales shorter than during
evaporation. Unlike typical commercial curtain coating, we operated in the quasi-static regime
of contact line motion where the viscous effects are excluded (Ca≪ 10−4). In this scenario, the
observed contact angle was speed-independent.
The present dissertation is essentially arranged in two parts in order to explore separately the
behaviour of receding contact lines with pure liquids (part I) and complex liquids (part II), namely
nanoparticle aqueous suspensions. With a variable rate of withdrawal of liquid, we controlled the
dynamics of receding contact lines of millimeter-sized drops (∼ 100µl). Following this approach,
we were able to emulate the first stages of drop evaporation, but at shorter times. We monitored
the contact line dynamics of shrinking drops containing nanoparticles to identify stick-slip events.
We analyzed the effect of several parameters such as wettability contrast between particle and
substrate, particle concentration, particle size and electrostatic interactions (particle-particle and
substrate-particle) on the formation and morphology of the nanoparticle ring-like deposits. Special
attention was addressed to the effect of pinning time on the formation of particle deposits. As far
as we know, this is the first work devoted to study the role of the particle-particle and substrate-
particle interactions on the deposits formation without macroscopic evaporation.
Part I
Receding contact lines of pure liquids

CHAPTER 1
Theoretical framework
Receding contact lines of pure liquids
1.1 Wetting
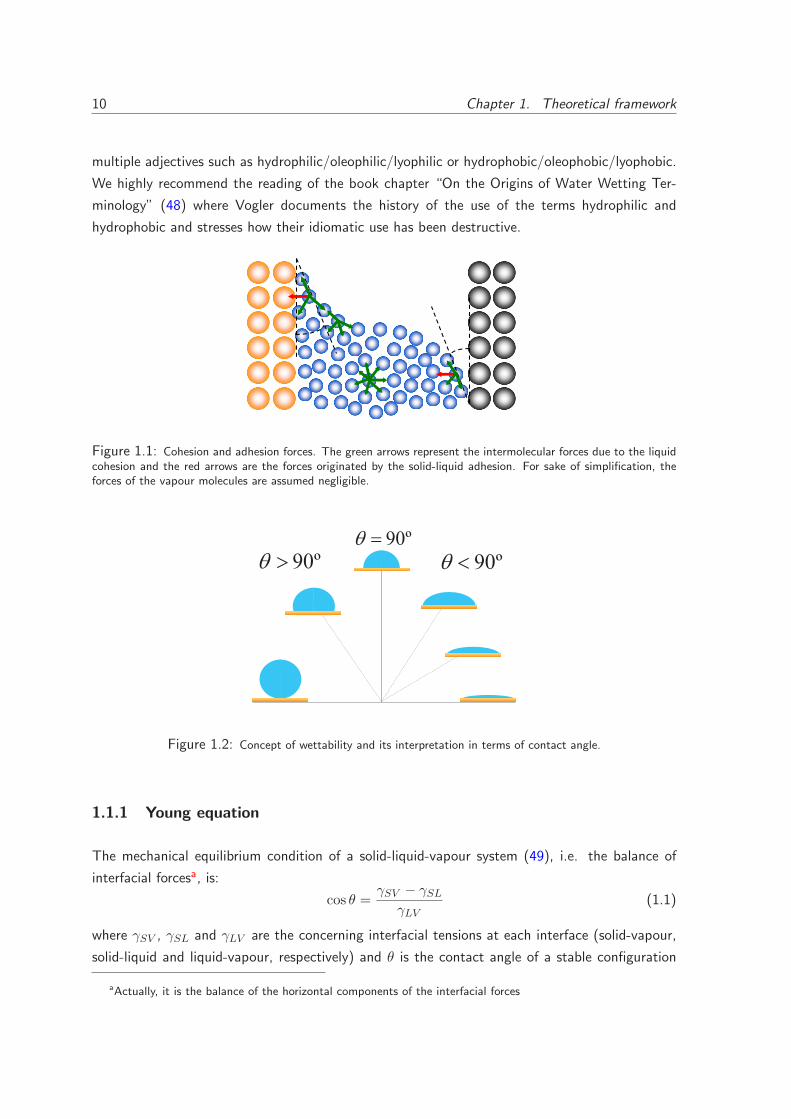
A liquid drop spreads on a solid surface up to cover a particular area, in prejudice of the surrounding
liquid vapour, driven by the solid-liquid intermolecular interactions (see Figure 1.1). This interfa-
cial phenomenon is known as wetting and the affinity of a solid surface to be wetted by a given
liquid is referred to as wettability (45, 46). Currently, wetting is ubiquitous in many emerging dis-
ciplines such as self-cleaning surfaces, microfluidics, micro- and nanoelectromechanical systems,
etc.
Just observing Nature, we find that liquids do not wet equally all solids. Wettability of a
solid-liquid-vapour system can be quantified from the contact angle, which is defined as the angle
formed between the tangent unit to the liquid-vapour interface and the tangent to the solid-liquid
interface at the three-phase contact line (see Figure 1.2). Marmur (47) suggested to use the terms
hygrophilic and hygrophobic (from the Greek prefix hygro- that means liquid) to describe in gen-
eral low-contact angle and high-contact angle surfaces. These terms can prevent the need for using
10 Chapter 1. Theoretical framework
multiple adjectives such as hydrophilic/oleophilic/lyophilic or hydrophobic/oleophobic/lyophobic.
We highly recommend the reading of the book chapter “On the Origins of Water Wetting Ter-
minology” (48) where Vogler documents the history of the use of the terms hydrophilic and
hydrophobic and stresses how their idiomatic use has been destructive.
Figure 1.1: Cohesion and adhesion forces. The green arrows represent the intermolecular forces due to the liquidcohesion and the red arrows are the forces originated by the solid-liquid adhesion. For sake of simplification, theforces of the vapour molecules are assumed negligible.
90º ! 90º "
90º #
Figure 1.2: Concept of wettability and its interpretation in terms of contact angle.
1.1.1 Young equation
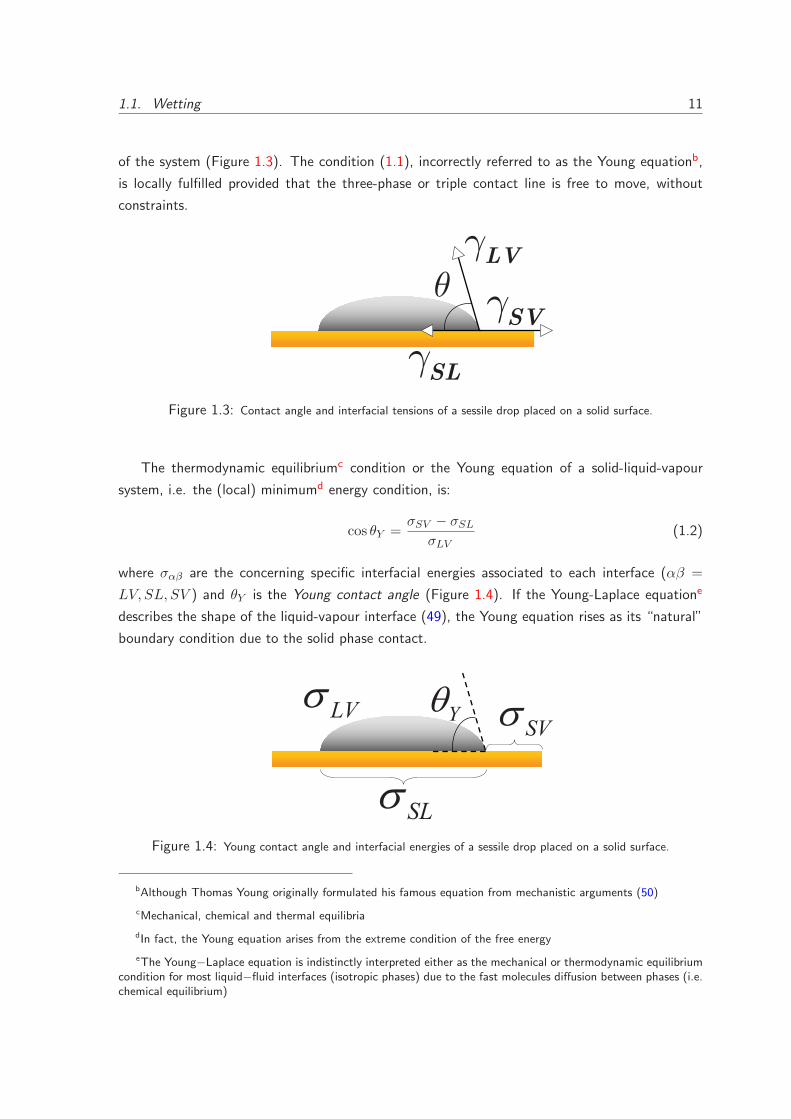
The mechanical equilibrium condition of a solid-liquid-vapour system (49), i.e. the balance of
interfacial forcesa, is:
cos θ =γSV − γSL
γLV(1.1)
where γSV , γSL and γLV are the concerning interfacial tensions at each interface (solid-vapour,
solid-liquid and liquid-vapour, respectively) and θ is the contact angle of a stable configuration
aActually, it is the balance of the horizontal components of the interfacial forces
1.1. Wetting 11
of the system (Figure 1.3). The condition (1.1), incorrectly referred to as the Young equationb,
is locally fulfilled provided that the three-phase or triple contact line is free to move, without
constraints.
LV
SL
!SV
Figure 1.3: Contact angle and interfacial tensions of a sessile drop placed on a solid surface.
The thermodynamic equilibriumc condition or the Young equation of a solid-liquid-vapour
system, i.e. the (local) minimumd energy condition, is:
cos θY =σSV − σSL
σLV(1.2)
where σαβ are the concerning specific interfacial energies associated to each interface (αβ =
LV, SL, SV ) and θY is the Young contact angle (Figure 1.4). If the Young-Laplace equatione
describes the shape of the liquid-vapour interface (49), the Young equation rises as its “natural”
boundary condition due to the solid phase contact.
SL
Y!
SV LV
Figure 1.4: Young contact angle and interfacial energies of a sessile drop placed on a solid surface.
bAlthough Thomas Young originally formulated his famous equation from mechanistic arguments (50)
cMechanical, chemical and thermal equilibria
dIn fact, the Young equation arises from the extreme condition of the free energy
eThe Young−Laplace equation is indistinctly interpreted either as the mechanical or thermodynamic equilibriumcondition for most liquid−fluid interfaces (isotropic phases) due to the fast molecules diffusion between phases (i.e.chemical equilibrium)
12 Chapter 1. Theoretical framework
A solid-liquid-vapour system can be mechanically stable but far from the thermodynamic equi-
librium because of the absence of diffusion equilibrium at common solid-liquid interfaces (51, 52).
Both thermodynamic and mechanical equilibrium conditions (1.1-1.2) will coincide just on an ideal
solid surface: smooth, chemically homogeneous, chemically inert and rigid surface; where the solid
interfacial tensions numerically coincide with the respective specific interfacial energies. Hence,
on moderately rigid solids and at experimental time scales, a mechanical equilibrium configuration
is usually realized at the three-phase line rather than a global thermodynamic equilibrium state
(53). However, microscopic and molecular-scale deformations can occur on the solid surface to
relax the unresolved vertical component of the liquid-vapour interfacial tension. Thermodynamic
equilibrium state will be truly attained when the whole solid-liquid interface is accordingly de-
formed, as the Young modulus of the material, at very long times (even billions of year!). This
sceneario illustrates the well-known creeping flow of the matterf. In conclusion, though the Young
contact angle is conceptually accessible, it is experimentally inaccessible. Thus, the contact angle
obtained experimentally is denominated observable contact angle and is a macroscopic angleg.
The determination of the Young contact angle, θY , i.e. the thermodynamic equilibrium contact
angle of an ideal solid surface, is important for the characterization of solid-liquid interfacial
systems (surface energetics). The Young contact angle is closely related to the concerning specific
interfacial energies (material properties) through the Young equation (1.2). But, as above pointed
out, the Young angle is experimentally inaccessible and besides, the observable contact angle can
take multiple values due to the non-ideal features of nearly all solid surfaces (55, 56).
Surfaces of most practical materials are chemically heterogeneous (different functional groups,
contaminations, mixtures of different solids, etc) and rough (texture, asperities, etc). These
properties produce variability in contact angle, such as contact angle multiplicity (57) and contact
angle hysteresis (58). Even on well-prepared solid surfaces, variability in contact angle is the norm,
not the exceptionh. Thus, the experimental reproducibility of contact angle becomes difficult.
There are many methods that have been developed to measure contact angles. However, there
is still a controversy about the reliability and the reproducibility of the observable contact angles.
For example, measurements reported from independent laboratories using different methods, for
the same solid-liquid system, indicate a discrepancy of about 5◦ (59). Given the large differences
found among measurement methods, it is important to report contact angle data always together
with its detailed measurement method.
f“Everything flows, nothing stands still”- Heracletus (BC 500-440)(54). In fact, any solid surface evolves intime during wetting through chemical reactions, molecular rearrangement or elastic responses. According to theresponse time, measuring time-scale will determine the inertness and stiffness of solid surface in practical terms.
gTypically, the Rayleigh criterium limits the resolution of optical imaging systems to approximately half thewavelength of light (5.5–7.5µm)
h“God made the bulk; surfaces were invented by the devil”-Wolfgang Pauli (April 25, 1900 - December 15,1958)
1.1. Wetting 13
1.1.2 Contact angle hysteresis
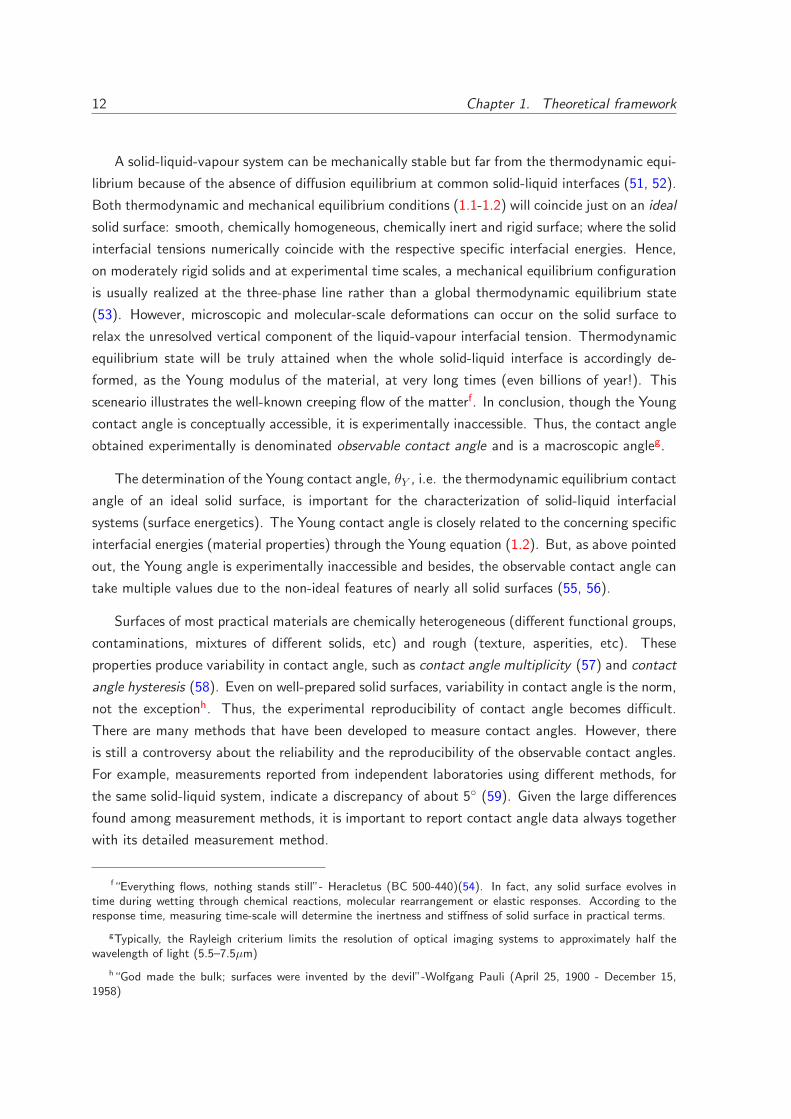
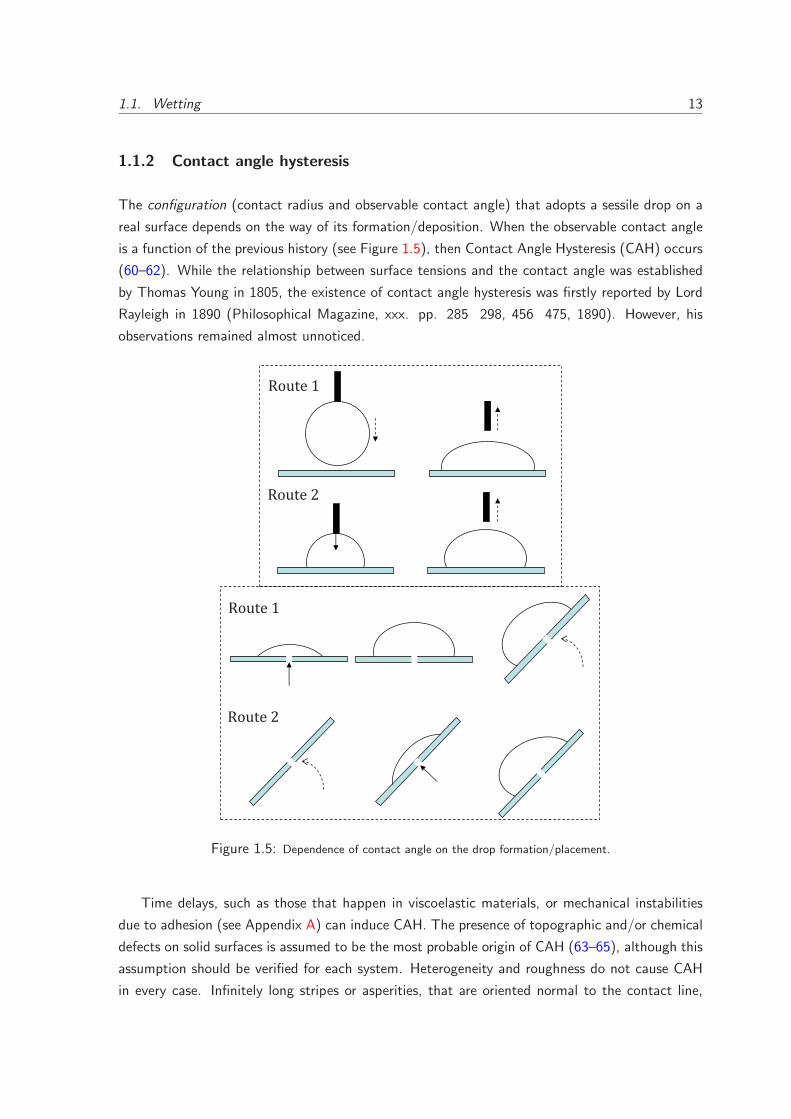
The configuration (contact radius and observable contact angle) that adopts a sessile drop on a
real surface depends on the way of its formation/deposition. When the observable contact angle
is a function of the previous history (see Figure 1.5), then Contact Angle Hysteresis (CAH) occurs
(60–62). While the relationship between surface tensions and the contact angle was established
by Thomas Young in 1805, the existence of contact angle hysteresis was firstly reported by Lord
Rayleigh in 1890 (Philosophical Magazine, xxx. pp. 285 298, 456 475, 1890). However, his
observations remained almost unnoticed.
!"#$ %
!"#$ &
!"#$ %
!"#$ &
Figure 1.5: Dependence of contact angle on the drop formation/placement.
Time delays, such as those that happen in viscoelastic materials, or mechanical instabilities
due to adhesion (see Appendix A) can induce CAH. The presence of topographic and/or chemical
defects on solid surfaces is assumed to be the most probable origin of CAH (63–65), although this
assumption should be verified for each system. Heterogeneity and roughness do not cause CAH
in every case. Infinitely long stripes or asperities, that are oriented normal to the contact line,
14 Chapter 1. Theoretical framework
do not induce CAH (57). There is no macroscopic hysteresis when the characteristic dimensions
of heterogeneity or roughness features fall below about 0.1 µm (66, 67). Further, CAH can
occur due to the kinetics of the solid-liquid interaction such as sorption of liquid by the solid,
liquid penetration into the solid, retention of liquid molecules on the solid surface and surface
reorganization. Anyhow, CAH is an indicator of the imperfection degree of the substrates and
it is a characteristic of all materials used in surface engineering. Attempts to understand CAH
phenomena began many years ago (60, 62, 68–70), although it is not fully understood yet.
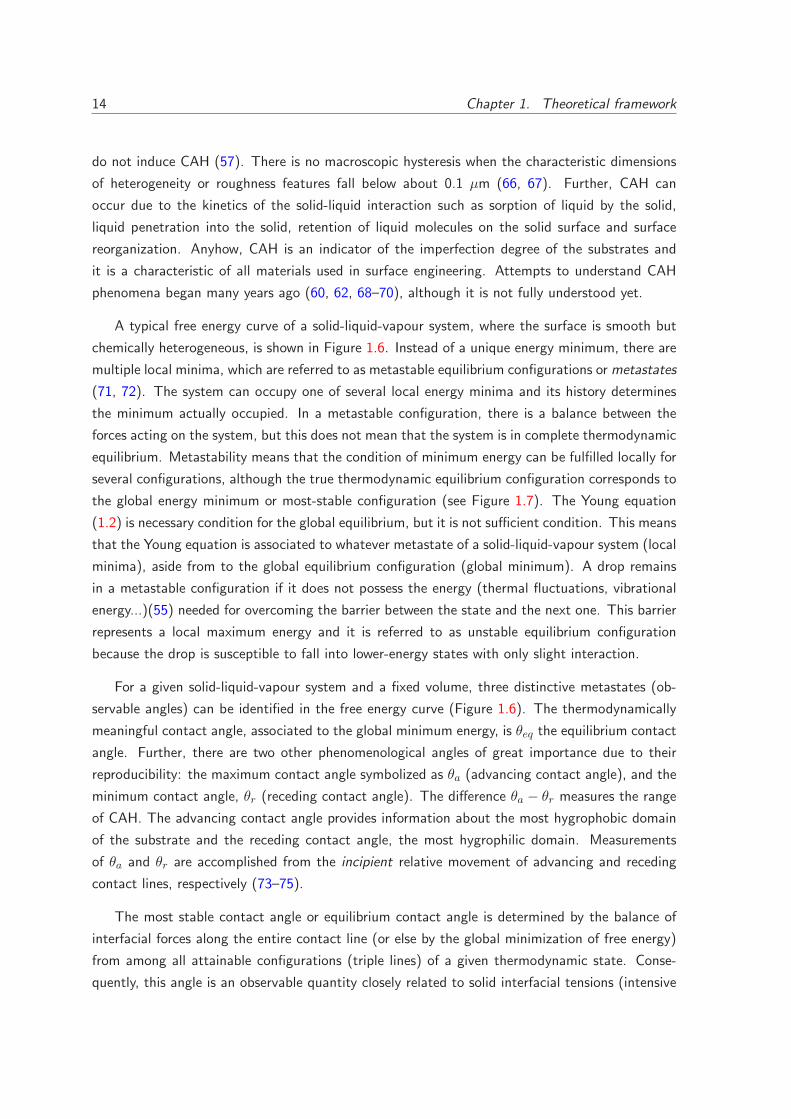
A typical free energy curve of a solid-liquid-vapour system, where the surface is smooth but
chemically heterogeneous, is shown in Figure 1.6. Instead of a unique energy minimum, there are
multiple local minima, which are referred to as metastable equilibrium configurations or metastates
(71, 72). The system can occupy one of several local energy minima and its history determines
the minimum actually occupied. In a metastable configuration, there is a balance between the
forces acting on the system, but this does not mean that the system is in complete thermodynamic
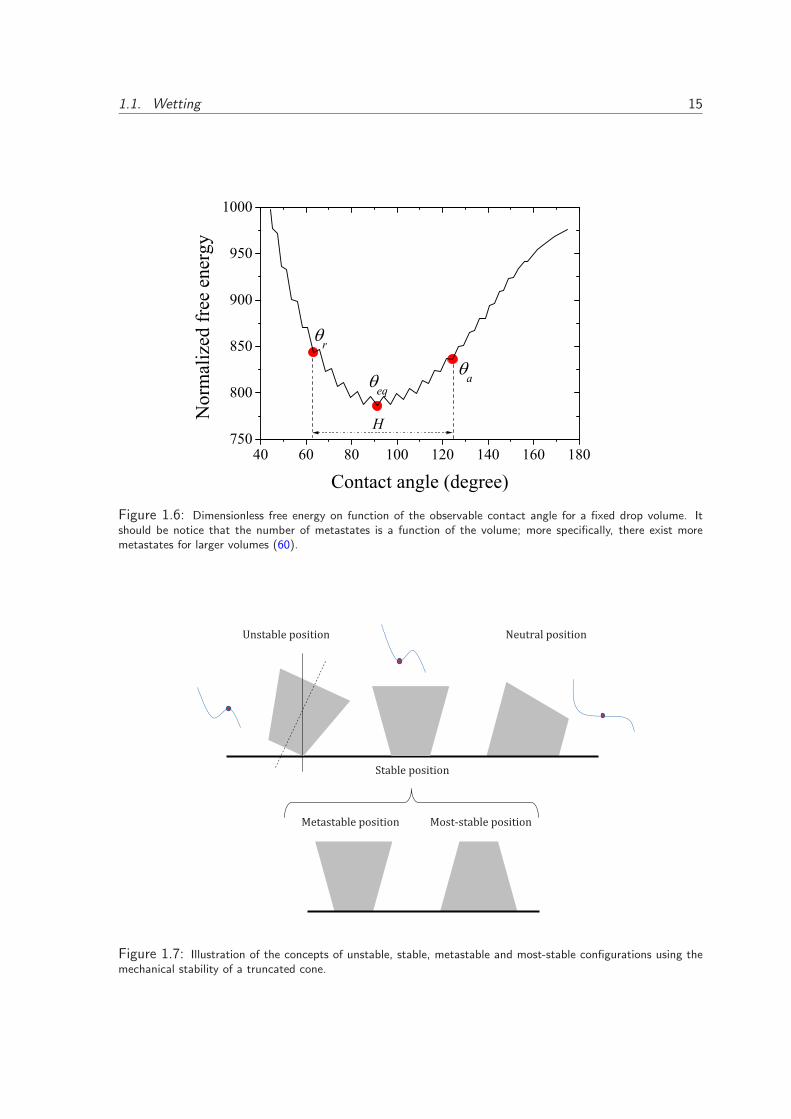
equilibrium. Metastability means that the condition of minimum energy can be fulfilled locally for
several configurations, although the true thermodynamic equilibrium configuration corresponds to
the global energy minimum or most-stable configuration (see Figure 1.7). The Young equation
(1.2) is necessary condition for the global equilibrium, but it is not sufficient condition. This means
that the Young equation is associated to whatever metastate of a solid-liquid-vapour system (local
minima), aside from to the global equilibrium configuration (global minimum). A drop remains
in a metastable configuration if it does not possess the energy (thermal fluctuations, vibrational
energy...)(55) needed for overcoming the barrier between the state and the next one. This barrier
represents a local maximum energy and it is referred to as unstable equilibrium configuration
because the drop is susceptible to fall into lower-energy states with only slight interaction.
For a given solid-liquid-vapour system and a fixed volume, three distinctive metastates (ob-
servable angles) can be identified in the free energy curve (Figure 1.6). The thermodynamically
meaningful contact angle, associated to the global minimum energy, is θeq the equilibrium contact
angle. Further, there are two other phenomenological angles of great importance due to their
reproducibility: the maximum contact angle symbolized as θa (advancing contact angle), and the
minimum contact angle, θr (receding contact angle). The difference θa − θr measures the range
of CAH. The advancing contact angle provides information about the most hygrophobic domain
of the substrate and the receding contact angle, the most hygrophilic domain. Measurements
of θa and θr are accomplished from the incipient relative movement of advancing and receding
contact lines, respectively (73–75).
The most stable contact angle or equilibrium contact angle is determined by the balance of
interfacial forces along the entire contact line (or else by the global minimization of free energy)
from among all attainable configurations (triple lines) of a given thermodynamic state. Conse-
quently, this angle is an observable quantity closely related to solid interfacial tensions (intensive
1.1. Wetting 15
40 60 80 100 120 140 160 180750
800
850
900
950
1000
eqa
H
N
orm
aliz
ed fr
ee e
nerg
y
Contact angle (degree)
r
Figure 1.6: Dimensionless free energy on function of the observable contact angle for a fixed drop volume. Itshould be notice that the number of metastates is a function of the volume; more specifically, there exist moremetastates for larger volumes (60).
!"#$%&'()*"+#+*!
,#$%&'()*"+#+*!
-'.#/$&()*"+#+*!
0*"#1"#$%&'()*"+#+*!0'#$"#$%&' )*"+#+*!
Figure 1.7: Illustration of the concepts of unstable, stable, metastable and most-stable configurations using themechanical stability of a truncated cone.
16 Chapter 1. Theoretical framework
properties) although it usually further depends on the system size (extensive property). Otherwise,
unless very particular conditions, the equilibrium contact angle is hardly experimentally accessi-
ble (76, 77). Equilibrium contact angle becomes an effective, unlocated angle but associated
univocally to the concerning thermodynamic state.
1.1.3 Receding contact angle
Advancing contact angles are usually employed to evaluate solid surface energies (45, 78). How-
ever, Cwikel et al. (79) reported significant differences in the value of surface energy as the
contact angle used. A wide number of publications (80–84) have emphasized the significance
of the receding contact angles in characterizing the interaction between the liquid and the solid
phases. For instance, an evaporating sessile drop begins to move back when the receding contact
angle is just reached (80). In superhydrophobic surfaces, the geometry of the posts determines
the receding contact angle at which the drop starts to move and hence, the depinning transition
is primarily controlled by the receding contact line (81, 82). In coating industry, the adhesion
work is the work per unit of area that should be made on a solid-liquid system to detach the
liquid from the solid surface (83). Hence, the effectiveness of a protective agent on a certain
smooth substrate is better understood by considering the receding contact angle rather than the
advancing contact angle (84).
When the observable contact angle is a function of the previous history of system, then contact
angle hysteresis occurs (see Figure 1.5). Owing to contact angle hysteresis, contact angle strongly
depends on the measuring conditions (55, 74, 85): technique, solid surface quality, liquid purity,
size and creation of the liquid-vapor interface. We are able to control the quality of the solid
sample and the liquid, the drop volume, but the drop formation should be also standardized if we
intend to compare meaningful values of contact angle. For instance, drop evaporation dramatically
depends on the dispensation of liquid (80, 86). Moreover, the pressure applied to a drop in the
dispensing step can have significant impact on the contact angle results of superhydrophobic
surfaces (87). It is well known that a sessile drop carefully placed with a handheld pipette can
result in a contact angle somewhere between advancing and receding (79). The contact angle that
a sessile drop adopts as a result of its placement on a surface can be quite different as the way to
form the drop (handheld placed drop, captive sessile drop, drop formed from below the surface,
etc.) due to contact angle hysteresis (88, 89). These disparities are particularly significant for
receding contact angles (74, 75).
It is widely accepted that advancing contact angle and receding contact angle are the ob-
servable (macroscopic) angles at incipiently moving contact lines. But, the observation of the
incipient motion of contact lines may be very complicated. Hence, advancing and receding an-
gles are often measured at moving contact lines, i.e. they are actually dynamic contact angles
1.1. Wetting 17
(85). However, dynamics of the contact line can dictate, at some extent, the measured values
of contact angle (90). Low-rate dynamic contact angle measurement (91) is a well-established
method to probe the wetting behavior of solid surfaces from the quasi-static motion of steadily
growing/shrinking drops. From our long-standing experience in low-rate dynamic contact angle
experiments, we observed that, unlike the advancing contact angle, the receding contact angle
on different solid surfaces was apparently zero or decreased continuously as the drop volume was
reduced. Due to the different density of metastates on the free-energy curve (see Figure 1.6),
advancing drops usually attain a well-defined metastable configuration whereas receding drops
can attain one of many metastable configurations separated by small energy barriers (92). For
this reason, receding contact angle is especially difficult to reproduce experimentally because it is
very susceptible to ambient vibrations (55, 92) and besides, it is limited by the initial drop volume.
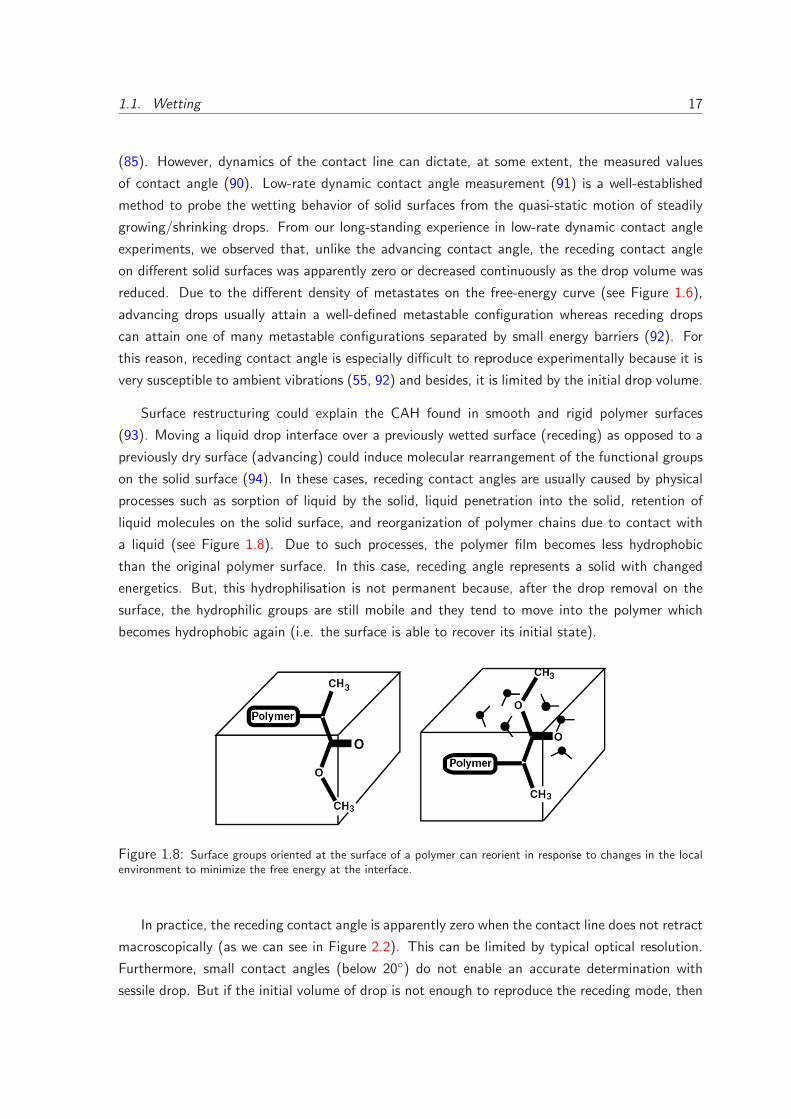
Surface restructuring could explain the CAH found in smooth and rigid polymer surfaces
(93). Moving a liquid drop interface over a previously wetted surface (receding) as opposed to a
previously dry surface (advancing) could induce molecular rearrangement of the functional groups
on the solid surface (94). In these cases, receding contact angles are usually caused by physical
processes such as sorption of liquid by the solid, liquid penetration into the solid, retention of
liquid molecules on the solid surface, and reorganization of polymer chains due to contact with
a liquid (see Figure 1.8). Due to such processes, the polymer film becomes less hydrophobic
than the original polymer surface. In this case, receding angle represents a solid with changed
energetics. But, this hydrophilisation is not permanent because, after the drop removal on the
surface, the hydrophilic groups are still mobile and they tend to move into the polymer which
becomes hydrophobic again (i.e. the surface is able to recover its initial state).
Figure 1.8: Surface groups oriented at the surface of a polymer can reorient in response to changes in the localenvironment to minimize the free energy at the interface.
In practice, the receding contact angle is apparently zero when the contact line does not retract
macroscopically (as we can see in Figure 2.2). This can be limited by typical optical resolution.
Furthermore, small contact angles (below 20◦) do not enable an accurate determination with
sessile drop. But if the initial volume of drop is not enough to reproduce the receding mode, then
18 Chapter 1. Theoretical framework
0 20 40 60 80 100 1200.0
0.2
0.4
0.6
0.8
1.0
V m
in/V
0
r (degree)
a=20o
a=40o
a=80o
a=120o
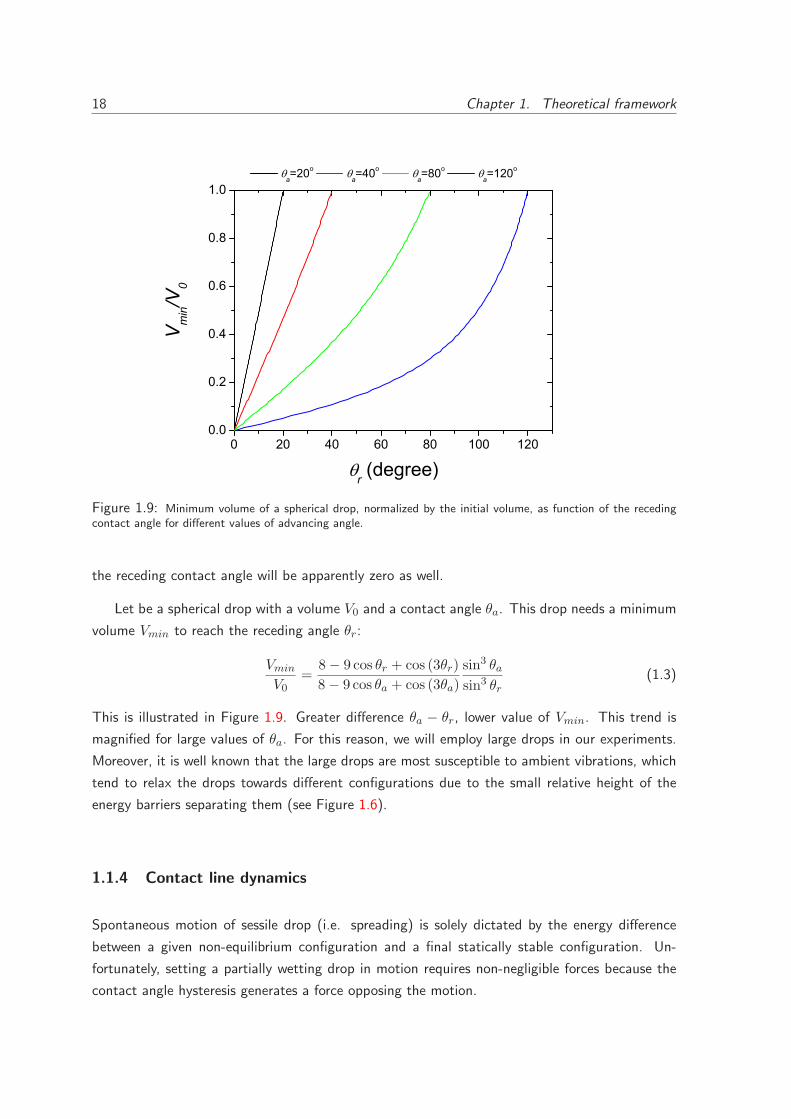
Figure 1.9: Minimum volume of a spherical drop, normalized by the initial volume, as function of the recedingcontact angle for different values of advancing angle.
the receding contact angle will be apparently zero as well.
Let be a spherical drop with a volume V0 and a contact angle θa. This drop needs a minimum
volume Vmin to reach the receding angle θr:
Vmin
V0
=8 − 9 cos θr + cos (3θr)
8 − 9 cos θa + cos (3θa)
sin3 θa
sin3 θr(1.3)
This is illustrated in Figure 1.9. Greater difference θa − θr, lower value of Vmin. This trend is
magnified for large values of θa. For this reason, we will employ large drops in our experiments.
Moreover, it is well known that the large drops are most susceptible to ambient vibrations, which
tend to relax the drops towards different configurations due to the small relative height of the
energy barriers separating them (see Figure 1.6).
1.1.4 Contact line dynamics
Spontaneous motion of sessile drop (i.e. spreading) is solely dictated by the energy difference
between a given non-equilibrium configuration and a final statically stable configuration. Un-
fortunately, setting a partially wetting drop in motion requires non-negligible forces because the
contact angle hysteresis generates a force opposing the motion.
1.1. Wetting 19
Forced motion
Applying an external driving force is usually a convenient way to probe the physics for non ideal
surfaces and it is sometimes the only possible way to investigate them when more direct methods
are not available. Unlike spontaneous wetting, forced wetting allows mapping on purpose certain
configurations of the system. Forced wetting can be accomplished by dipping/rising vertically
the solid in/from the liquid, tilting the solid surface or changing the drop volume by direct liquid
addition/withdrawal (73–75). All these experimental approaches intentionally produce a “slow”
variation in the solid-liquid area (wetted area) through the relative movement of contact line,
driven by vertical push/pull forces, gravity or volume variations, accordingly.
If a sessile drop is slowly forced to advance or recede on the surface, the drop reacts like a
spring in order to reach the new equilibrium statei. Dissipation can occurs either at the contact
line (due to CAH) and/or in the bulk (viscous dissipation). Upon hydrodynamic conditions, the
observable contact angle is known as dynamic contact angle because it changes as a function of
contact line velocity (inertia regime). Further, the opposing viscous force increases as the speed.
An advancing contact line persists to arbitrarily high speeds but a receding contact line vanishes
at a critical speed set by the competition between viscous and surface tension forces.
In forced wetting, capillary force attempts to reduce the wetted area of the drop but has to
work against the inertia and viscosity of the liquid. Capillary forces dominate over shear and
inertial forces when the velocities of moving contact lines are considerably low. The Capillary
Number is defined as:
Ca =ηvcl
γLV(1.4)
where η is the liquid viscosity and vcl, the contact line speed. For contact line speeds lower than
200 µm/s, Ca is always less than 10−5, and deviation from the Laplace-shape is expected to
occur at distances in the order of microns, which are well below the typical optical resolution
(about 10 µm)(55). Thus, we assure that the drop shape is not disturbed by Hydrodynamics. In
this work, we will focus on the capillary-driven regime of forced wetting where the interface shape
far away from the contact line will be quasi-static, i.e. speed-independent.
Stick/slip phenomena
The existence of boundaries between surface domains of different chemistry or elevation can cause
several observable effects on the three-phase contact line, such as corrugation (57) and “pinning”
(95, 96), depending on the measuring scale used. Pinning or canthotaxis (97) occurs when
iIt is worth pointing out that in forced wetting, the system is continuously changing its thermodynamic state(e.g. through the drop volume) and thereby, in general the equilibrium contact angle will depend on the solid-liquidarea (see Figure A.7)
20 Chapter 1. Theoretical framework
1
)a
1
1 1
)b
1 2! 1!
2
2! 2
1
1!
?)c
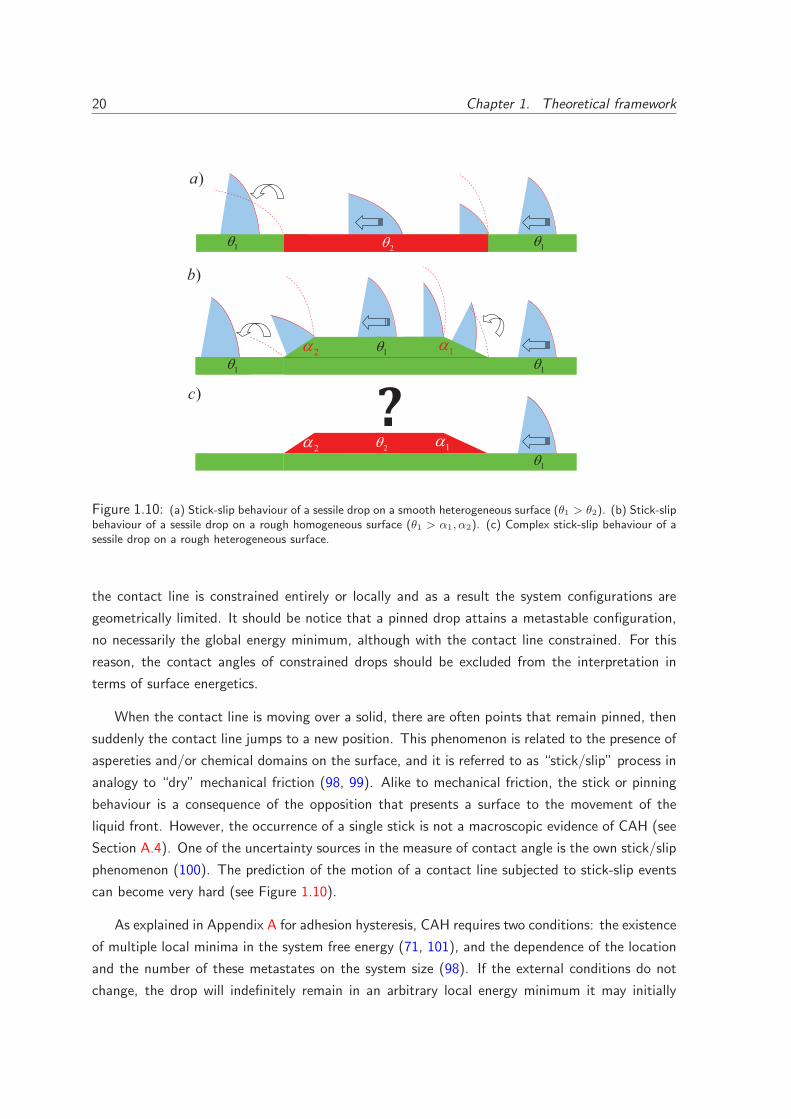
Figure 1.10: (a) Stick-slip behaviour of a sessile drop on a smooth heterogeneous surface (θ1 > θ2). (b) Stick-slipbehaviour of a sessile drop on a rough homogeneous surface (θ1 > α1, α2). (c) Complex stick-slip behaviour of asessile drop on a rough heterogeneous surface.
the contact line is constrained entirely or locally and as a result the system configurations are
geometrically limited. It should be notice that a pinned drop attains a metastable configuration,
no necessarily the global energy minimum, although with the contact line constrained. For this
reason, the contact angles of constrained drops should be excluded from the interpretation in
terms of surface energetics.
When the contact line is moving over a solid, there are often points that remain pinned, then
suddenly the contact line jumps to a new position. This phenomenon is related to the presence of
aspereties and/or chemical domains on the surface, and it is referred to as “stick/slip” process in
analogy to “dry” mechanical friction (98, 99). Alike to mechanical friction, the stick or pinning
behaviour is a consequence of the opposition that presents a surface to the movement of the
liquid front. However, the occurrence of a single stick is not a macroscopic evidence of CAH (see
Section A.4). One of the uncertainty sources in the measure of contact angle is the own stick/slip
phenomenon (100). The prediction of the motion of a contact line subjected to stick-slip events
can become very hard (see Figure 1.10).
As explained in Appendix A for adhesion hysteresis, CAH requires two conditions: the existence
of multiple local minima in the system free energy (71, 101), and the dependence of the location
and the number of these metastates on the system size (98). If the external conditions do not
change, the drop will indefinitely remain in an arbitrary local energy minimum it may initially
1.2. Freely evaporating drops 21
occupy (see Section 1.1.2). A way to force the system to evolve is to change the drop volume
(see Section 2.2). Varying the volume distorts the energy profile, eventually transforming the
initial minimum into an inflection point (see Figure A.7). At that moment, the system loses
stability and makes a spontaneous jump to the nearest local minimum. During the jump, the
energy of the system suddenly decreases. Some energy is thus irreversibly dissipated as heat. It
is worth pointing out that, unlike a stick event, the occurrence of a jump implies the existence of
CAH and viceversa (58).
1.2 Freely evaporating drops
Drop evaporation plays a vital role in various engineering fields, such as air/fuel-premixing, (bi-
ological) crystal growth, painting and inkjet printing. Evaporation of sessile drops was described
many years ago (102, 103). On the contrary, some underlying principles of the dynamic process
of evaporation have been recently published (104). Drop evaporation occurs even in the case
where the ambient vapor pressure equals the saturation vapor pressure above a flat liquid vapor
interface. A drop has a curved surface and as described by Kelvin’s equation (105), the vapor
pressure of a curved liquid surface is higher than the saturation vapor pressure (106). Hence,
evaporation of drops is really avoided upon oversaturation conditions (106).
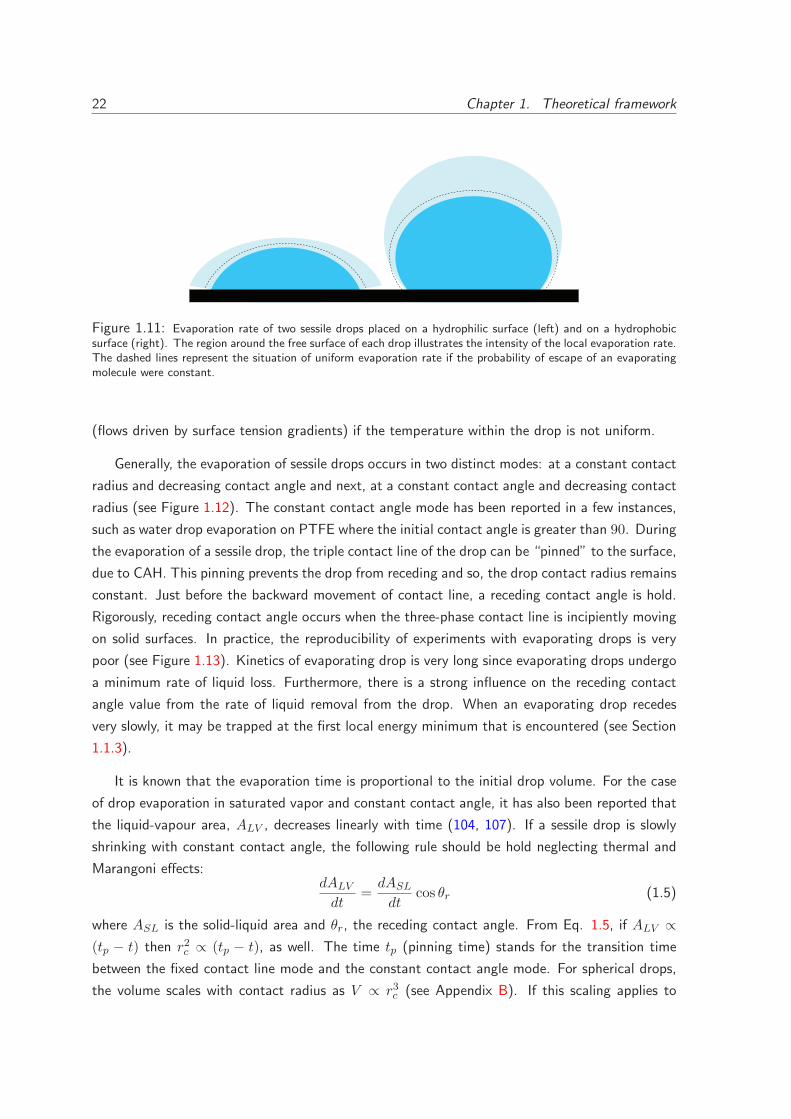
Due to the drop shape (hydrophilicity/hydrophobicity character of the substrate), the evapora-
tion rate at the contact line can be very different. This rate will become maximum for hydrophilic
substrates and minimum for hydrophobic substrates. The probability of escape of an evaporating
molecule is affected by the curvature of its point of departure (see Fig. 1.11). A random walk
initiated at the apex of a flattened drop results in the molecule being reabsorbed. Instead, if the
drop is rounded, the molecule gets to escape from the apex. However, on a hydrophilic surface,
the same random walk initiated from the three-phase contact line allows the evaporating molecule
to escape due to the high local curvature. On a hydrophobic surface, since the flux vector points
out towards the solid surface at the contact line, the evaporating molecule cannot get away from
the drop surface. This demonstrates why the evaporation rate is larger at the edge of wetting
drops (“wedge effect”) than at the apex. Just the opposite argument is applicable to non-wetting
drops.
When the evaporative flux of liquid is relatively constant across the drop or moderately en-
hanced at the contact line (hydrophilic surfaces), an outward flow develops in the liquid in order to
maintain the drop shape (imposed by the liquid surface tension and gravity). Conversely, if evap-
oration primarily occurs at the center of the droplet (hydrophobic surfaces), then the liquid flows
toward the center of the drop. Evaporation also produces a decrease of the temperature within the
drop, which leads to both a heat flux from the substrate into the drop, and to Marangoni effects
22 Chapter 1. Theoretical framework
Figure 1.11: Evaporation rate of two sessile drops placed on a hydrophilic surface (left) and on a hydrophobicsurface (right). The region around the free surface of each drop illustrates the intensity of the local evaporation rate.The dashed lines represent the situation of uniform evaporation rate if the probability of escape of an evaporatingmolecule were constant.
(flows driven by surface tension gradients) if the temperature within the drop is not uniform.
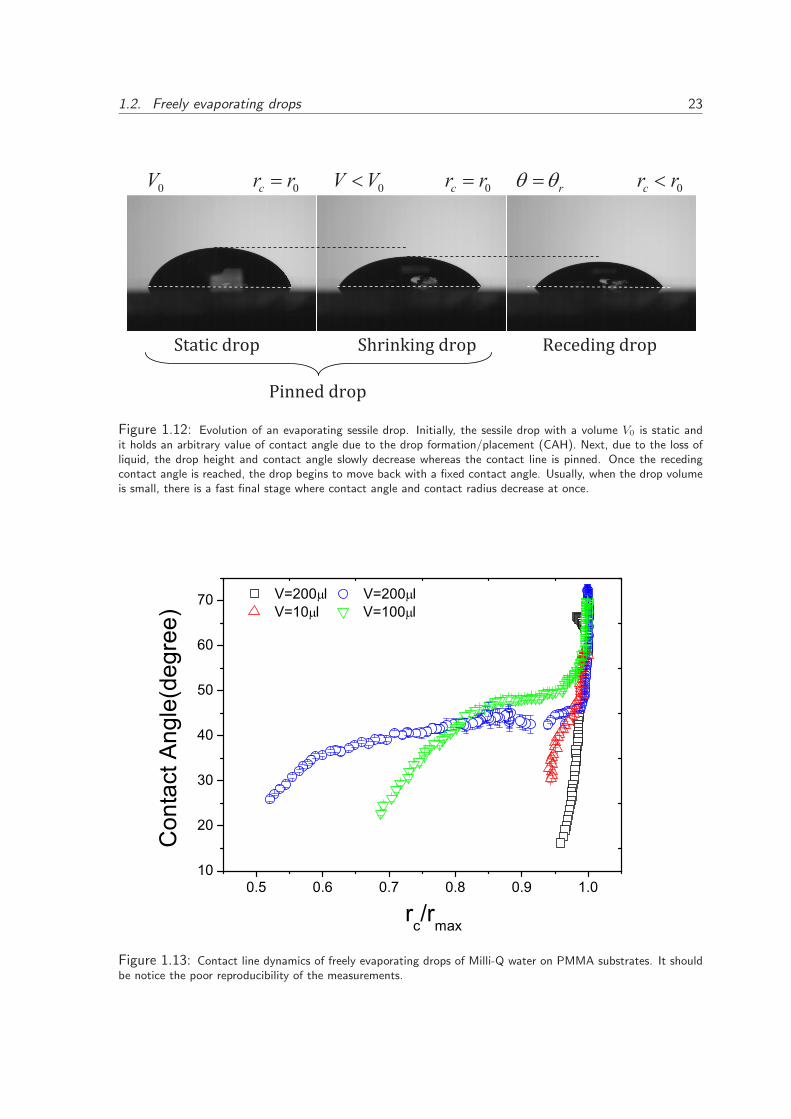
Generally, the evaporation of sessile drops occurs in two distinct modes: at a constant contact
radius and decreasing contact angle and next, at a constant contact angle and decreasing contact
radius (see Figure 1.12). The constant contact angle mode has been reported in a few instances,
such as water drop evaporation on PTFE where the initial contact angle is greater than 90. During
the evaporation of a sessile drop, the triple contact line of the drop can be “pinned” to the surface,
due to CAH. This pinning prevents the drop from receding and so, the drop contact radius remains
constant. Just before the backward movement of contact line, a receding contact angle is hold.
Rigorously, receding contact angle occurs when the three-phase contact line is incipiently moving
on solid surfaces. In practice, the reproducibility of experiments with evaporating drops is very
poor (see Figure 1.13). Kinetics of evaporating drop is very long since evaporating drops undergo
a minimum rate of liquid loss. Furthermore, there is a strong influence on the receding contact
angle value from the rate of liquid removal from the drop. When an evaporating drop recedes
very slowly, it may be trapped at the first local energy minimum that is encountered (see Section
1.1.3).
It is known that the evaporation time is proportional to the initial drop volume. For the case
of drop evaporation in saturated vapor and constant contact angle, it has also been reported that
the liquid-vapour area, ALV , decreases linearly with time (104, 107). If a sessile drop is slowly
shrinking with constant contact angle, the following rule should be hold neglecting thermal and
Marangoni effects:dALV
dt=dASL
dtcos θr (1.5)
where ASL is the solid-liquid area and θr, the receding contact angle. From Eq. 1.5, if ALV ∝(tp − t) then r2c ∝ (tp − t), as well. The time tp (pinning time) stands for the transition time
between the fixed contact line mode and the constant contact angle mode. For spherical drops,
the volume scales with contact radius as V ∝ r3c (see Appendix B). If this scaling applies to
1.2. Freely evaporating drops 23
0V
r !
0cr r!
0cr r!
0cr r"
0V V"
!"!#$ %&'( )&#*+#*, %&'( -.$.%#*, %&'(
/#**.% %&'(
Figure 1.12: Evolution of an evaporating sessile drop. Initially, the sessile drop with a volume V0 is static andit holds an arbitrary value of contact angle due to the drop formation/placement (CAH). Next, due to the loss ofliquid, the drop height and contact angle slowly decrease whereas the contact line is pinned. Once the recedingcontact angle is reached, the drop begins to move back with a fixed contact angle. Usually, when the drop volumeis small, there is a fast final stage where contact angle and contact radius decrease at once.
0.5 0.6 0.7 0.8 0.9 1.010
20
30
40
50
60
70 V=200 l V=200 l V=10 l V=100 l
Con
tact
Ang
le(d
egre
e)
rc/rmax
Figure 1.13: Contact line dynamics of freely evaporating drops of Milli-Q water on PMMA substrates. It shouldbe notice the poor reproducibility of the measurements.

24 Chapter 1. Theoretical framework
gravity-flattened drops, we predict that V ∝ (tp − t)3/2 for the constant contact angle mode of
drop evaporation. In fact, this result agrees with the evaporation rate of a receding drop (104):
−dV
dt∝
√
tp − t (1.6)
whereas the loss rate of volume for a sessile drop with fixed contact line is:
−dV
dt= const. (1.7)
CHAPTER 2
Materials and techniques
Receding contact lines of pure liquids
2.1 Materials
We employed six polymers (2mm-thick sheets, CQ grade, Goodfellow c©) and commercially pure
(unalloyed) titanium (ASTM grade 2-Manfredi c©). We selected these materials by their different
wettability response. The titanium surfaces were finely polished but the polymer surfaces were
analyzed as received except for PTFE, which was further subjected to a heat pressing treatment.
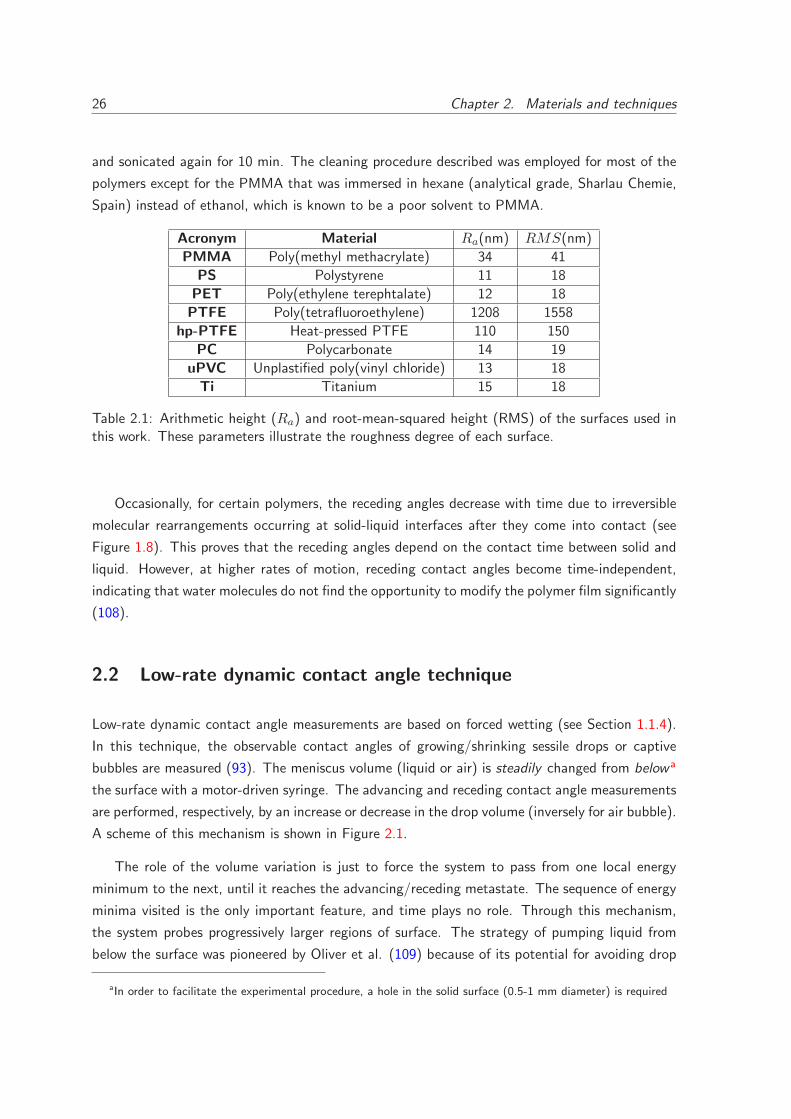
The roughness values of each surface are summarized in Table 2.1. The roughness was mea-
sured with a white light confocal microscope (PLµ, Sensofar c©-Tech S.L.) using a 50x objective
(196.7x196.7 µm2).
The polymers were cut as square pieces (1.5 cm x 1.5 cm) and the titanium as discs (1.6
cm in diameter). A hole of 1 mm diameter was drilled on each sample. Before each experiment,
the surfaces were cleaned ultrasonically in a detergent solution for 10 min, followed by ultrasonic
rinsing in Milli-Q water. Next, the samples were immersed in ethanol (analytical grade, Sharlau
Chemie, Spain) and sonicated for 10 min. Finally, the samples were immersed in Milli-Q water
26 Chapter 2. Materials and techniques
and sonicated again for 10 min. The cleaning procedure described was employed for most of the
polymers except for the PMMA that was immersed in hexane (analytical grade, Sharlau Chemie,
Spain) instead of ethanol, which is known to be a poor solvent to PMMA.
Acronym Material Ra(nm) RMS(nm)
PMMA Poly(methyl methacrylate) 34 41
PS Polystyrene 11 18
PET Poly(ethylene terephtalate) 12 18
PTFE Poly(tetrafluoroethylene) 1208 1558
hp-PTFE Heat-pressed PTFE 110 150
PC Polycarbonate 14 19
uPVC Unplastified poly(vinyl chloride) 13 18
Ti Titanium 15 18
Table 2.1: Arithmetic height (Ra) and root-mean-squared height (RMS) of the surfaces used inthis work. These parameters illustrate the roughness degree of each surface.
Occasionally, for certain polymers, the receding angles decrease with time due to irreversible
molecular rearrangements occurring at solid-liquid interfaces after they come into contact (see
Figure 1.8). This proves that the receding angles depend on the contact time between solid and
liquid. However, at higher rates of motion, receding contact angles become time-independent,
indicating that water molecules do not find the opportunity to modify the polymer film significantly
(108).
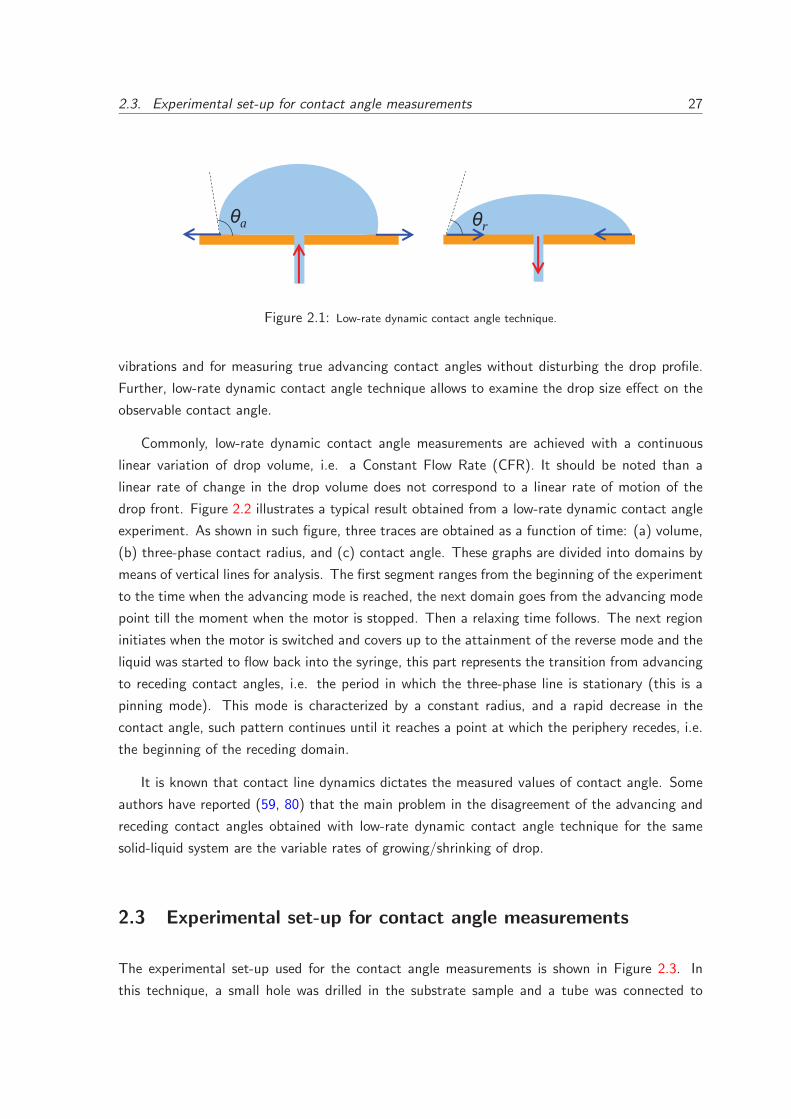
2.2 Low-rate dynamic contact angle technique
Low-rate dynamic contact angle measurements are based on forced wetting (see Section 1.1.4).
In this technique, the observable contact angles of growing/shrinking sessile drops or captive
bubbles are measured (93). The meniscus volume (liquid or air) is steadily changed from belowa
the surface with a motor-driven syringe. The advancing and receding contact angle measurements
are performed, respectively, by an increase or decrease in the drop volume (inversely for air bubble).
A scheme of this mechanism is shown in Figure 2.1.
The role of the volume variation is just to force the system to pass from one local energy
minimum to the next, until it reaches the advancing/receding metastate. The sequence of energy
minima visited is the only important feature, and time plays no role. Through this mechanism,
the system probes progressively larger regions of surface. The strategy of pumping liquid from
below the surface was pioneered by Oliver et al. (109) because of its potential for avoiding drop
aIn order to facilitate the experimental procedure, a hole in the solid surface (0.5-1 mm diameter) is required
2.3. Experimental set-up for contact angle measurements 27
a
r
Figure 2.1: Low-rate dynamic contact angle technique.
vibrations and for measuring true advancing contact angles without disturbing the drop profile.
Further, low-rate dynamic contact angle technique allows to examine the drop size effect on the
observable contact angle.
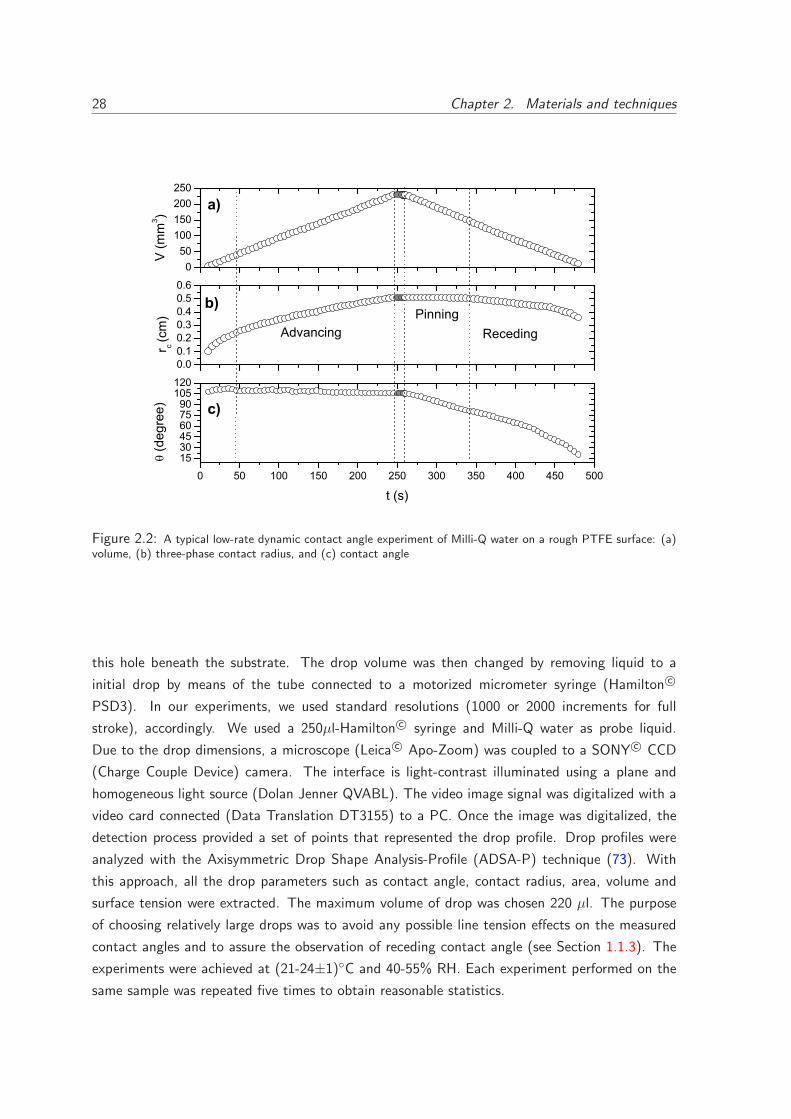
Commonly, low-rate dynamic contact angle measurements are achieved with a continuous
linear variation of drop volume, i.e. a Constant Flow Rate (CFR). It should be noted than a
linear rate of change in the drop volume does not correspond to a linear rate of motion of the
drop front. Figure 2.2 illustrates a typical result obtained from a low-rate dynamic contact angle
experiment. As shown in such figure, three traces are obtained as a function of time: (a) volume,
(b) three-phase contact radius, and (c) contact angle. These graphs are divided into domains by
means of vertical lines for analysis. The first segment ranges from the beginning of the experiment
to the time when the advancing mode is reached, the next domain goes from the advancing mode
point till the moment when the motor is stopped. Then a relaxing time follows. The next region
initiates when the motor is switched and covers up to the attainment of the reverse mode and the
liquid was started to flow back into the syringe, this part represents the transition from advancing
to receding contact angles, i.e. the period in which the three-phase line is stationary (this is a
pinning mode). This mode is characterized by a constant radius, and a rapid decrease in the
contact angle, such pattern continues until it reaches a point at which the periphery recedes, i.e.
the beginning of the receding domain.
It is known that contact line dynamics dictates the measured values of contact angle. Some
authors have reported (59, 80) that the main problem in the disagreement of the advancing and
receding contact angles obtained with low-rate dynamic contact angle technique for the same
solid-liquid system are the variable rates of growing/shrinking of drop.
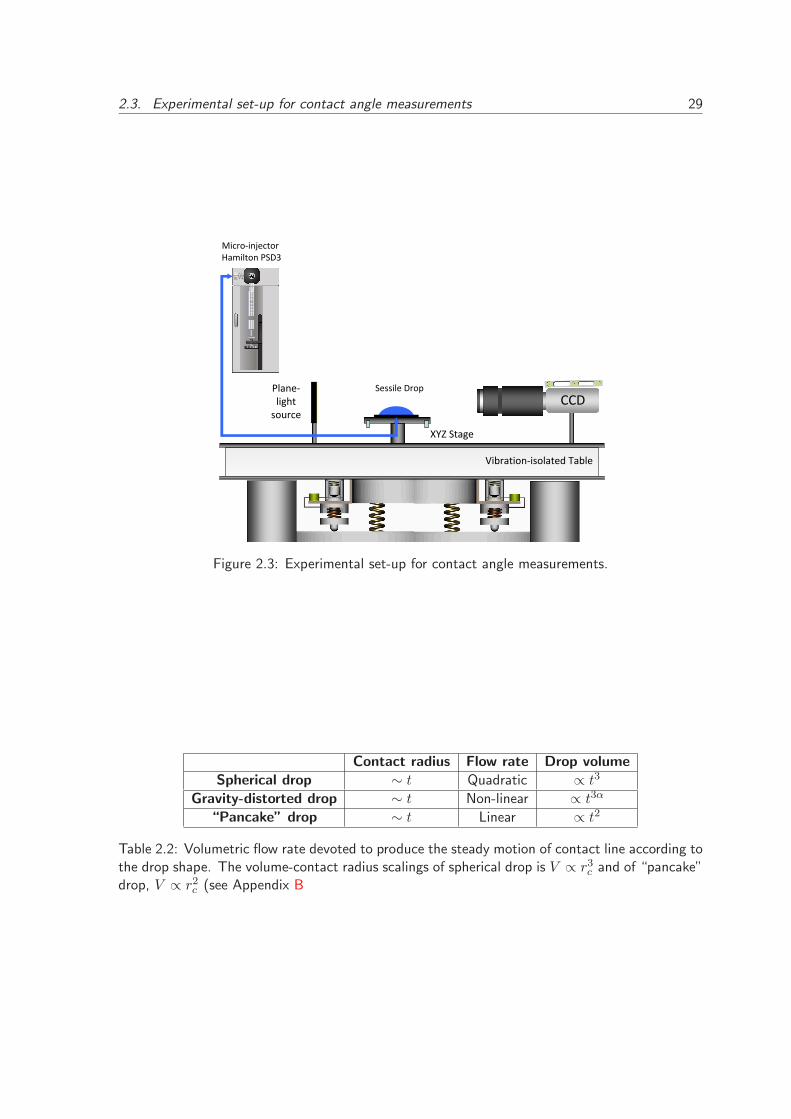
2.3 Experimental set-up for contact angle measurements
The experimental set-up used for the contact angle measurements is shown in Figure 2.3. In
this technique, a small hole was drilled in the substrate sample and a tube was connected to
28 Chapter 2. Materials and techniques
0 50 100 150 200 250 300 350 400 450 500
153045607590
105120
0.00.10.20.30.40.50.6
050
100150200250
(deg
ree)
t (s)
Pinning
r c (c
m)
b)
c)
Receding
V
(mm
3 )
Advancing
a)
Figure 2.2: A typical low-rate dynamic contact angle experiment of Milli-Q water on a rough PTFE surface: (a)volume, (b) three-phase contact radius, and (c) contact angle
this hole beneath the substrate. The drop volume was then changed by removing liquid to a
initial drop by means of the tube connected to a motorized micrometer syringe (Hamilton c©
PSD3). In our experiments, we used standard resolutions (1000 or 2000 increments for full
stroke), accordingly. We used a 250µl-Hamilton c© syringe and Milli-Q water as probe liquid.
Due to the drop dimensions, a microscope (Leica c© Apo-Zoom) was coupled to a SONY c© CCD
(Charge Couple Device) camera. The interface is light-contrast illuminated using a plane and
homogeneous light source (Dolan Jenner QVABL). The video image signal was digitalized with a
video card connected (Data Translation DT3155) to a PC. Once the image was digitalized, the
detection process provided a set of points that represented the drop profile. Drop profiles were
analyzed with the Axisymmetric Drop Shape Analysis-Profile (ADSA-P) technique (73). With
this approach, all the drop parameters such as contact angle, contact radius, area, volume and
surface tension were extracted. The maximum volume of drop was chosen 220 µl. The purpose
of choosing relatively large drops was to avoid any possible line tension effects on the measured
contact angles and to assure the observation of receding contact angle (see Section 1.1.3). The
experiments were achieved at (21-24±1)◦C and 40-55% RH. Each experiment performed on the
same sample was repeated five times to obtain reasonable statistics.
2.3. Experimental set-up for contact angle measurements 29
Plane
light!
source
CCD
Vibration isolated!Table
Micro injector!
Hamilton!PSD3
Sessile!Drop
XYZ!Stage
Figure 2.3: Experimental set-up for contact angle measurements.
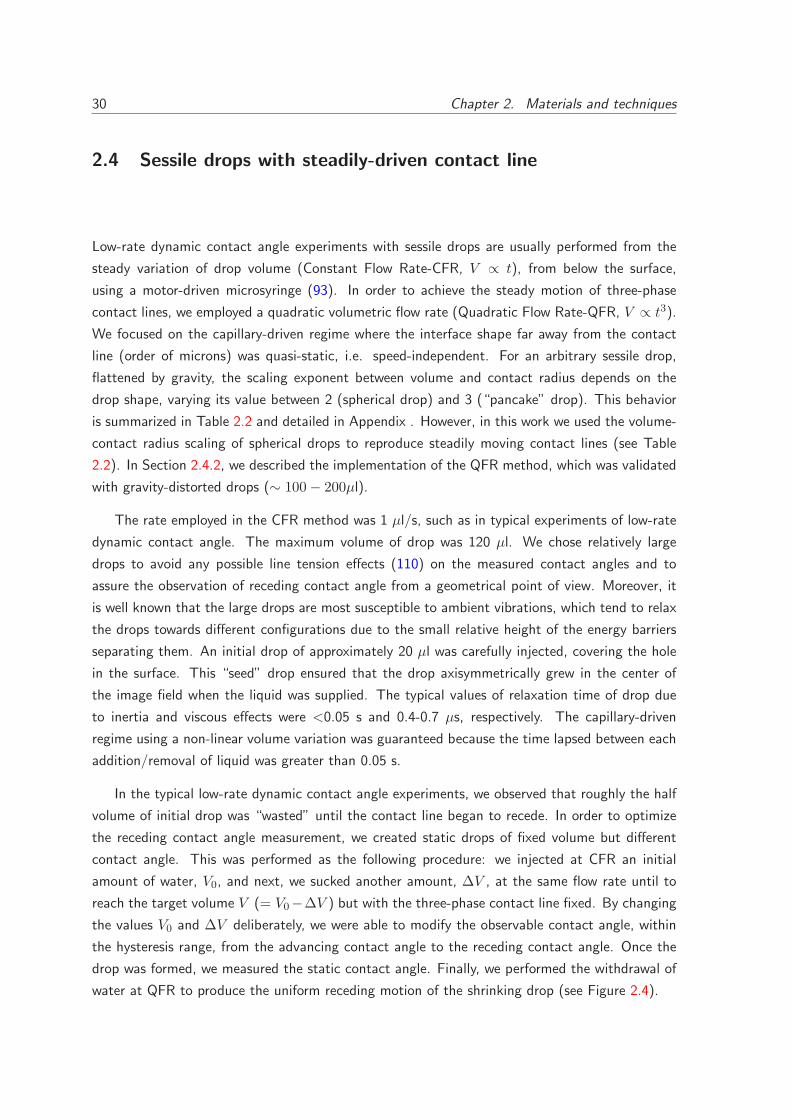
Contact radius Flow rate Drop volume
Spherical drop ∼ t Quadratic ∝ t3
Gravity-distorted drop ∼ t Non-linear ∝ t3α
“Pancake” drop ∼ t Linear ∝ t2
Table 2.2: Volumetric flow rate devoted to produce the steady motion of contact line according tothe drop shape. The volume-contact radius scalings of spherical drop is V ∝ r3c and of “pancake”drop, V ∝ r2c (see Appendix B
30 Chapter 2. Materials and techniques
2.4 Sessile drops with steadily-driven contact line
Low-rate dynamic contact angle experiments with sessile drops are usually performed from the
steady variation of drop volume (Constant Flow Rate-CFR, V ∝ t), from below the surface,
using a motor-driven microsyringe (93). In order to achieve the steady motion of three-phase
contact lines, we employed a quadratic volumetric flow rate (Quadratic Flow Rate-QFR, V ∝ t3).
We focused on the capillary-driven regime where the interface shape far away from the contact
line (order of microns) was quasi-static, i.e. speed-independent. For an arbitrary sessile drop,
flattened by gravity, the scaling exponent between volume and contact radius depends on the
drop shape, varying its value between 2 (spherical drop) and 3 (“pancake” drop). This behavior
is summarized in Table 2.2 and detailed in Appendix . However, in this work we used the volume-
contact radius scaling of spherical drops to reproduce steadily moving contact lines (see Table
2.2). In Section 2.4.2, we described the implementation of the QFR method, which was validated
with gravity-distorted drops (∼ 100 − 200µl).
The rate employed in the CFR method was 1 µl/s, such as in typical experiments of low-rate
dynamic contact angle. The maximum volume of drop was 120 µl. We chose relatively large
drops to avoid any possible line tension effects (110) on the measured contact angles and to
assure the observation of receding contact angle from a geometrical point of view. Moreover, it
is well known that the large drops are most susceptible to ambient vibrations, which tend to relax
the drops towards different configurations due to the small relative height of the energy barriers
separating them. An initial drop of approximately 20 µl was carefully injected, covering the hole
in the surface. This “seed” drop ensured that the drop axisymmetrically grew in the center of
the image field when the liquid was supplied. The typical values of relaxation time of drop due
to inertia and viscous effects were <0.05 s and 0.4-0.7 µs, respectively. The capillary-driven
regime using a non-linear volume variation was guaranteed because the time lapsed between each
addition/removal of liquid was greater than 0.05 s.
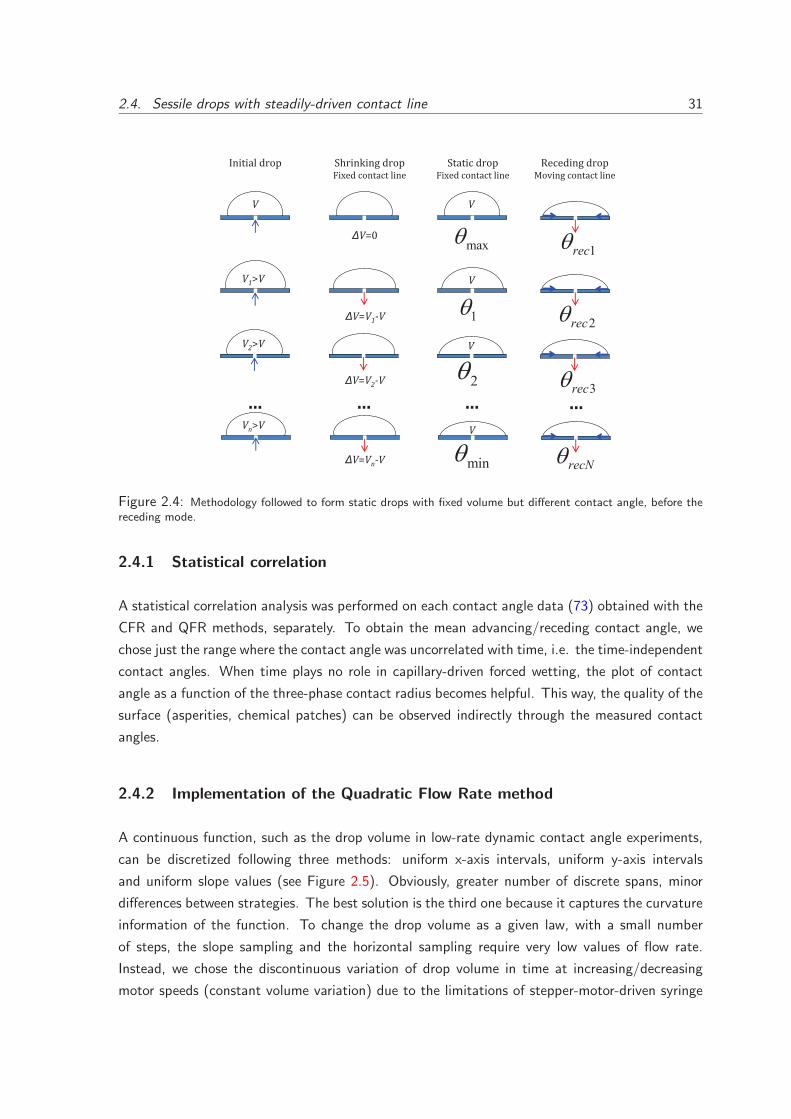
In the typical low-rate dynamic contact angle experiments, we observed that roughly the half
volume of initial drop was “wasted” until the contact line began to recede. In order to optimize
the receding contact angle measurement, we created static drops of fixed volume but different
contact angle. This was performed as the following procedure: we injected at CFR an initial
amount of water, V0, and next, we sucked another amount, ∆V , at the same flow rate until to
reach the target volume V (= V0−∆V ) but with the three-phase contact line fixed. By changing
the values V0 and ∆V deliberately, we were able to modify the observable contact angle, within
the hysteresis range, from the advancing contact angle to the receding contact angle. Once the
drop was formed, we measured the static contact angle. Finally, we performed the withdrawal of
water at QFR to produce the uniform receding motion of the shrinking drop (see Figure 2.4).
2.4. Sessile drops with steadily-driven contact line 31
!"!#$%&'()*#+,&%$(-!"$!%.#-,
max
1
V
V
2
V
min
V
……
V1/V
…
V2/V
Vn/V
V
V0V1 V
V0V2 V
V0Vn V
V01
2'#-3#-4%&'()*#+,&%$(-!"$!%.#-,
5-#!#".%&'() 6,$,&#-4%&'()7(8#-4%$(-!"$!%.#-,
…
1rec
2rec
3rec
recN
Figure 2.4: Methodology followed to form static drops with fixed volume but different contact angle, before thereceding mode.
2.4.1 Statistical correlation
A statistical correlation analysis was performed on each contact angle data (73) obtained with the
CFR and QFR methods, separately. To obtain the mean advancing/receding contact angle, we
chose just the range where the contact angle was uncorrelated with time, i.e. the time-independent
contact angles. When time plays no role in capillary-driven forced wetting, the plot of contact
angle as a function of the three-phase contact radius becomes helpful. This way, the quality of the
surface (asperities, chemical patches) can be observed indirectly through the measured contact
angles.
2.4.2 Implementation of the Quadratic Flow Rate method
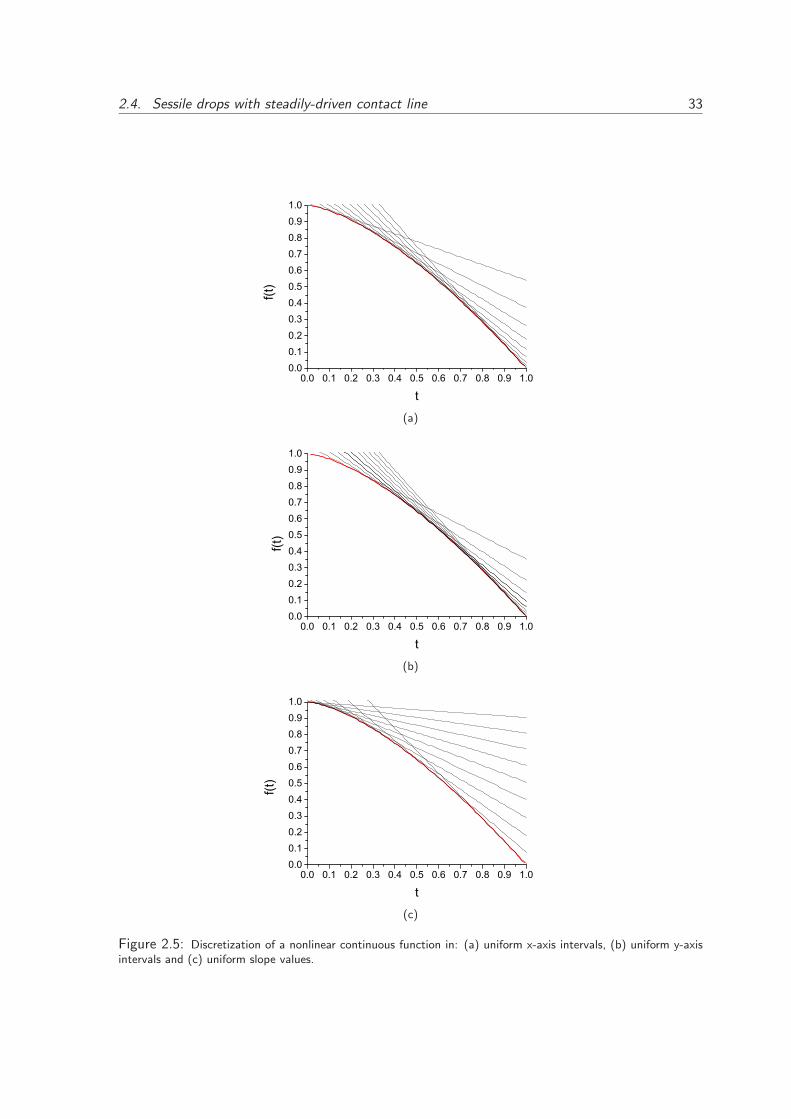
A continuous function, such as the drop volume in low-rate dynamic contact angle experiments,
can be discretized following three methods: uniform x-axis intervals, uniform y-axis intervals
and uniform slope values (see Figure 2.5). Obviously, greater number of discrete spans, minor
differences between strategies. The best solution is the third one because it captures the curvature
information of the function. To change the drop volume as a given law, with a small number
of steps, the slope sampling and the horizontal sampling require very low values of flow rate.
Instead, we chose the discontinuous variation of drop volume in time at increasing/decreasing
motor speeds (constant volume variation) due to the limitations of stepper-motor-driven syringe
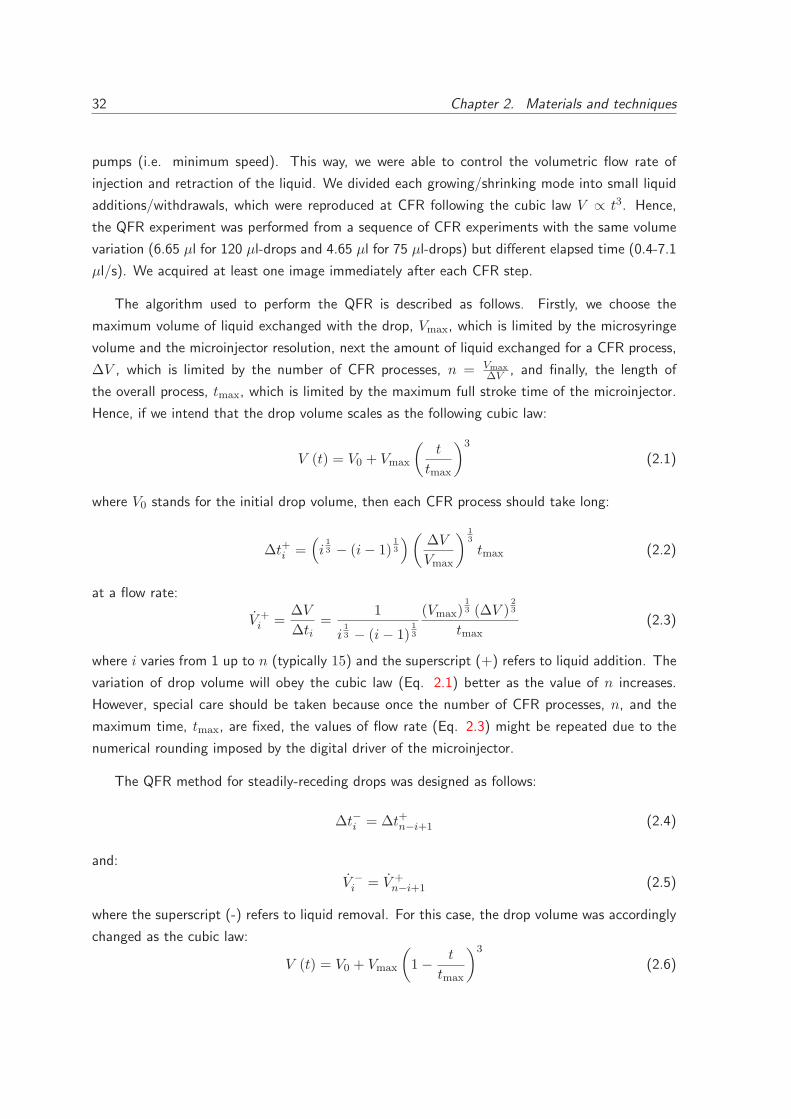
32 Chapter 2. Materials and techniques
pumps (i.e. minimum speed). This way, we were able to control the volumetric flow rate of
injection and retraction of the liquid. We divided each growing/shrinking mode into small liquid
additions/withdrawals, which were reproduced at CFR following the cubic law V ∝ t3. Hence,
the QFR experiment was performed from a sequence of CFR experiments with the same volume
variation (6.65 µl for 120 µl-drops and 4.65 µl for 75 µl-drops) but different elapsed time (0.4-7.1
µl/s). We acquired at least one image immediately after each CFR step.
The algorithm used to perform the QFR is described as follows. Firstly, we choose the
maximum volume of liquid exchanged with the drop, Vmax, which is limited by the microsyringe
volume and the microinjector resolution, next the amount of liquid exchanged for a CFR process,
∆V , which is limited by the number of CFR processes, n = Vmax
∆V , and finally, the length of
the overall process, tmax, which is limited by the maximum full stroke time of the microinjector.
Hence, if we intend that the drop volume scales as the following cubic law:
V (t) = V0 + Vmax
(
t
tmax
)3
(2.1)
where V0 stands for the initial drop volume, then each CFR process should take long:
∆t+i =(
i1
3 − (i− 1)1
3
)
(
∆V
Vmax
)1
3
tmax (2.2)
at a flow rate:
V +i =
∆V
∆ti=
1
i1
3 − (i− 1)1
3
(Vmax)1
3 (∆V )2
3
tmax
(2.3)
where i varies from 1 up to n (typically 15) and the superscript (+) refers to liquid addition. The
variation of drop volume will obey the cubic law (Eq. 2.1) better as the value of n increases.
However, special care should be taken because once the number of CFR processes, n, and the
maximum time, tmax, are fixed, the values of flow rate (Eq. 2.3) might be repeated due to the
numerical rounding imposed by the digital driver of the microinjector.
The QFR method for steadily-receding drops was designed as follows:
∆t−i = ∆t+n−i+1 (2.4)
and:
V −i = V +
n−i+1 (2.5)
where the superscript (-) refers to liquid removal. For this case, the drop volume was accordingly
changed as the cubic law:
V (t) = V0 + Vmax
(
1 −t
tmax
)3
(2.6)
2.4. Sessile drops with steadily-driven contact line 33
0.0 0.1 0.2 0.3 0.4 0.5 0.6 0.7 0.8 0.9 1.00.00.10.20.30.40.50.60.70.80.91.0
f(t)
t
(a)
0.0 0.1 0.2 0.3 0.4 0.5 0.6 0.7 0.8 0.9 1.00.00.10.20.30.40.50.60.70.80.91.0
f(t)
t
(b)
0.0 0.1 0.2 0.3 0.4 0.5 0.6 0.7 0.8 0.9 1.00.00.10.20.30.40.50.60.70.80.91.0
f(t)
t
(c)
Figure 2.5: Discretization of a nonlinear continuous function in: (a) uniform x-axis intervals, (b) uniform y-axisintervals and (c) uniform slope values.
34 Chapter 2. Materials and techniques
Flow rate Liquid-vapor area Contact radius Contact angle
Static shrinking drop Quadratic − ∝ (tp − t)2 > θr
Receding shrinking drop Square-root ∝ (tp − t) ∝√tp − t θr
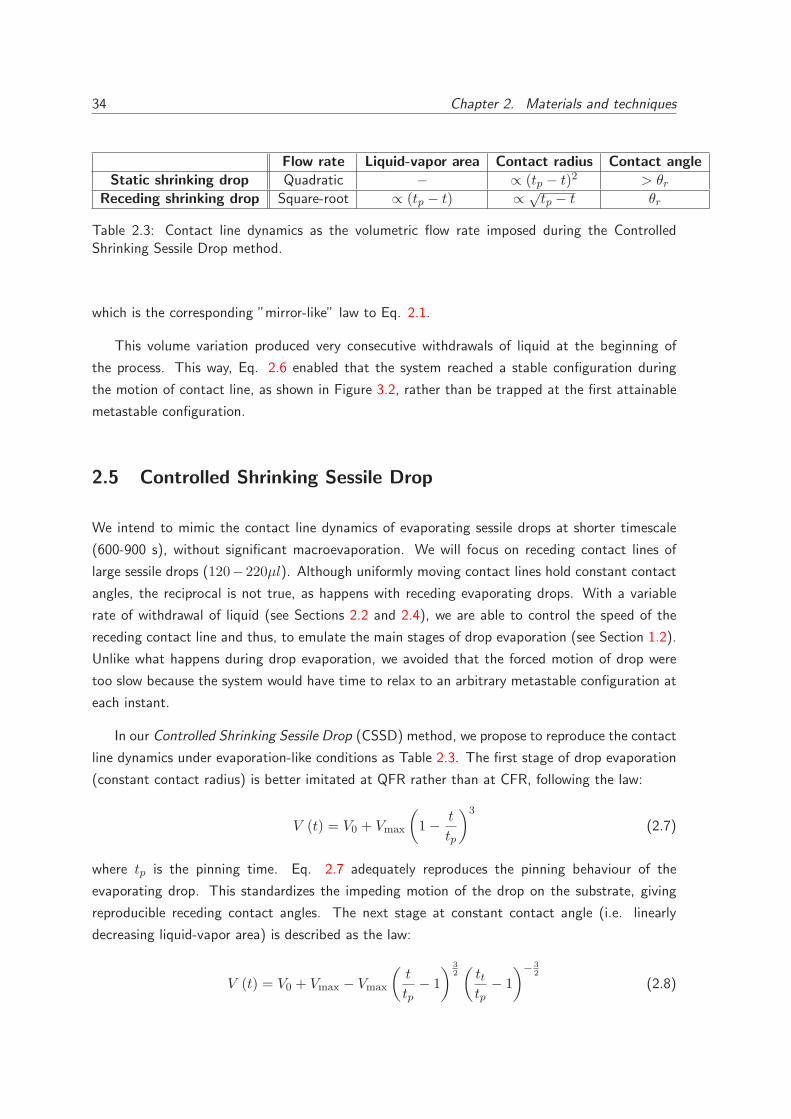
Table 2.3: Contact line dynamics as the volumetric flow rate imposed during the ControlledShrinking Sessile Drop method.
which is the corresponding ”mirror-like” law to Eq. 2.1.
This volume variation produced very consecutive withdrawals of liquid at the beginning of
the process. This way, Eq. 2.6 enabled that the system reached a stable configuration during
the motion of contact line, as shown in Figure 3.2, rather than be trapped at the first attainable
metastable configuration.
2.5 Controlled Shrinking Sessile Drop
We intend to mimic the contact line dynamics of evaporating sessile drops at shorter timescale
(600-900 s), without significant macroevaporation. We will focus on receding contact lines of
large sessile drops (120−220µl). Although uniformly moving contact lines hold constant contact
angles, the reciprocal is not true, as happens with receding evaporating drops. With a variable
rate of withdrawal of liquid (see Sections 2.2 and 2.4), we are able to control the speed of the
receding contact line and thus, to emulate the main stages of drop evaporation (see Section 1.2).
Unlike what happens during drop evaporation, we avoided that the forced motion of drop were
too slow because the system would have time to relax to an arbitrary metastable configuration at
each instant.
In our Controlled Shrinking Sessile Drop (CSSD) method, we propose to reproduce the contact
line dynamics under evaporation-like conditions as Table 2.3. The first stage of drop evaporation
(constant contact radius) is better imitated at QFR rather than at CFR, following the law:
V (t) = V0 + Vmax
(
1 −t
tp
)3
(2.7)
where tp is the pinning time. Eq. 2.7 adequately reproduces the pinning behaviour of the
evaporating drop. This standardizes the impeding motion of the drop on the substrate, giving
reproducible receding contact angles. The next stage at constant contact angle (i.e. linearly
decreasing liquid-vapor area) is described as the law:
V (t) = V0 + Vmax − Vmax
(
t
tp− 1
)3
2
(
tttp
− 1
)− 3
2
(2.8)
2.5. Controlled Shrinking Sessile Drop 35
0.0 0.2 0.4 0.6 0.8 1.0 1.2 1.4 1.6 1.8 2.00.00.20.40.60.81.01.21.41.61.82.0
receding
pinning
tp/tt=1/2
V(t)
/V0
t (a.u.)
1+(1-t/tp)3
1-((t/tp-1)/(t
t/t
p-1))3/2
tp/tt=1/4
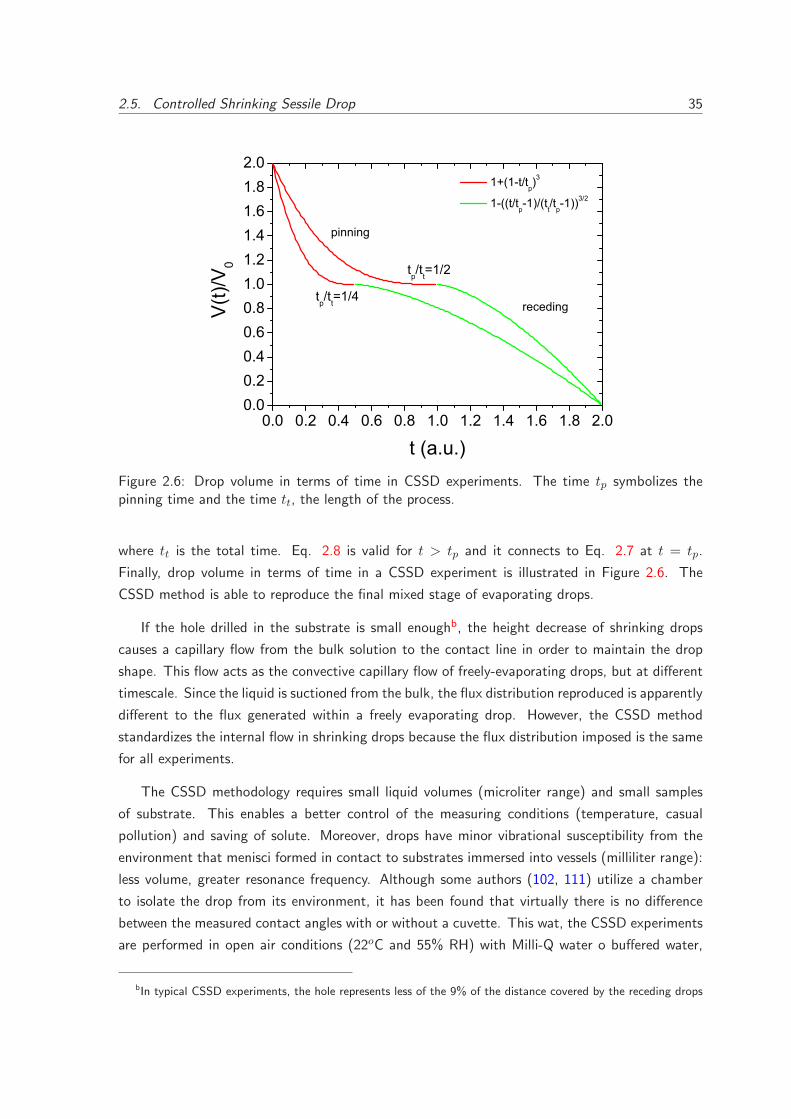
Figure 2.6: Drop volume in terms of time in CSSD experiments. The time tp symbolizes thepinning time and the time tt, the length of the process.
where tt is the total time. Eq. 2.8 is valid for t > tp and it connects to Eq. 2.7 at t = tp.
Finally, drop volume in terms of time in a CSSD experiment is illustrated in Figure 2.6. The
CSSD method is able to reproduce the final mixed stage of evaporating drops.
If the hole drilled in the substrate is small enoughb, the height decrease of shrinking drops
causes a capillary flow from the bulk solution to the contact line in order to maintain the drop
shape. This flow acts as the convective capillary flow of freely-evaporating drops, but at different
timescale. Since the liquid is suctioned from the bulk, the flux distribution reproduced is apparently
different to the flux generated within a freely evaporating drop. However, the CSSD method
standardizes the internal flow in shrinking drops because the flux distribution imposed is the same
for all experiments.
The CSSD methodology requires small liquid volumes (microliter range) and small samples
of substrate. This enables a better control of the measuring conditions (temperature, casual
pollution) and saving of solute. Moreover, drops have minor vibrational susceptibility from the
environment that menisci formed in contact to substrates immersed into vessels (milliliter range):
less volume, greater resonance frequency. Although some authors (102, 111) utilize a chamber
to isolate the drop from its environment, it has been found that virtually there is no difference
between the measured contact angles with or without a cuvette. This wat, the CSSD experiments
are performed in open air conditions (22oC and 55% RH) with Milli-Q water o buffered water,
bIn typical CSSD experiments, the hole represents less of the 9% of the distance covered by the receding drops

36 Chapter 2. Materials and techniques
accordingly.
CHAPTER 3
Results and Discussion
Receding contact lines of pure liquids
In this chapter we illustrate the dependence of the receding contact angle of sessile drops on
the dynamics of the three-phase contact line (in the very low capillary number regime) and on
the drop placement on the solid surface. As happens in the Wilhelmy balance (74), we explored
the response of water drops with steadily moving contact lines on surfaces of polymer and metal
oxide. The contact lines were uniformly driven using a non-linear variation of drop volume (108).
We monitored receding water drops with equal initial volume but different static contact angle
on the same surface. This procedure allowed us to scan the contact angle hysteresis range up to
the minimum observable value of contact angle.
3.1 The effect of contact line dynamics and drop formation
In Figure 2.2, we can observe an advancing mode apparently well defined, whereas the receding
angle is continuously decreasing. In these cases, receding angles are often estimated from the
dynamic contact angle extrapolated to zero velocity. However, this approach is called into question
38 Chapter 3. Results and Discussion
due to the own CAH: observable contact angle is a function of the previous history of the system.
3.1.1 Comparison between Constant Flow Rate and Quadratic Flow Rate
We measured the low-rate dynamic contact angles of Milli-Q water on the same polymer surfaces,
using the conventional method of volume variation (CFR) and our proposal (QFR) (see Figure
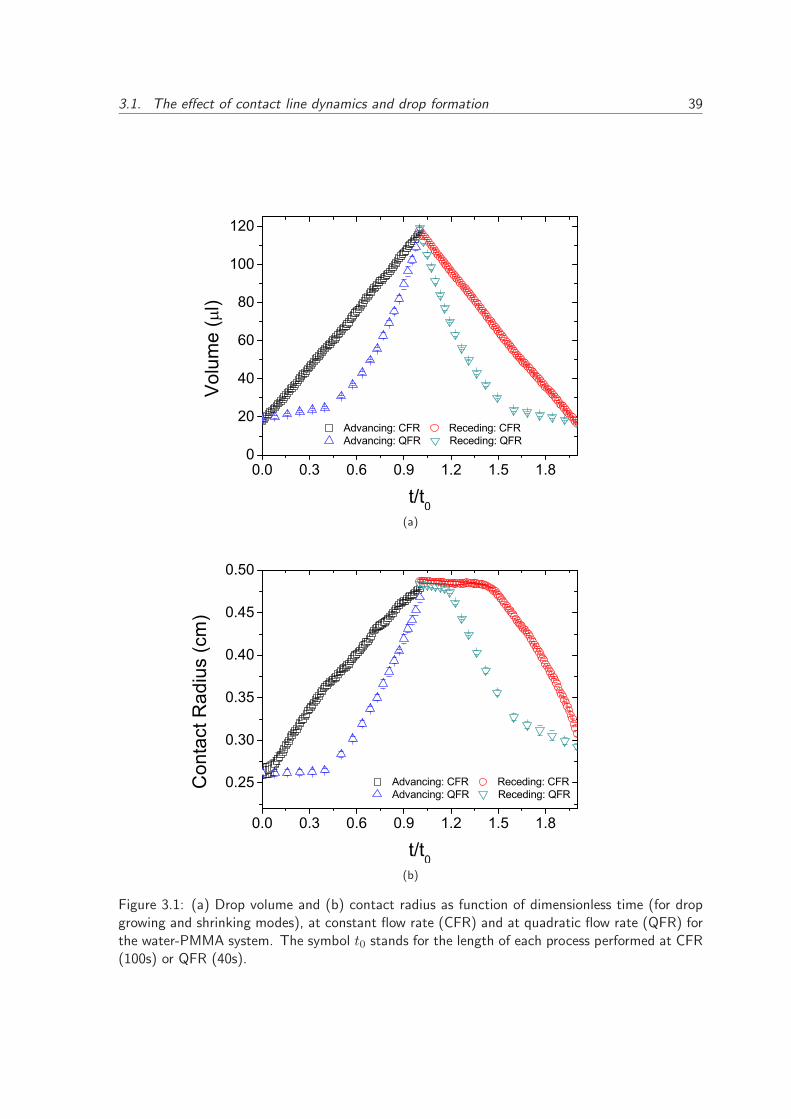
3.1a for the water-PMMA system). In Figure 3.1b, we plot the evolution of the contact radius
of growing and shrinking drops produced by the CFR method and the QFR method on a PMMA
surface. The QFR method produced a steady motion of the contact line over a large surface
region. The last five points of the receding contact radius in Figure 3.1b are not meaningful
because the instantaneous suction (each point) was so slow and the drop volume was not so large
(< 30µl) that the drop energy was not enough to attain the lower receding contact angle. This
will be illustrated in Figure 3.2, where the last five points (inverted triangles) of receding contact
angle reveal a relaxation (approx. 1◦) compared to the stable value of contact angle.
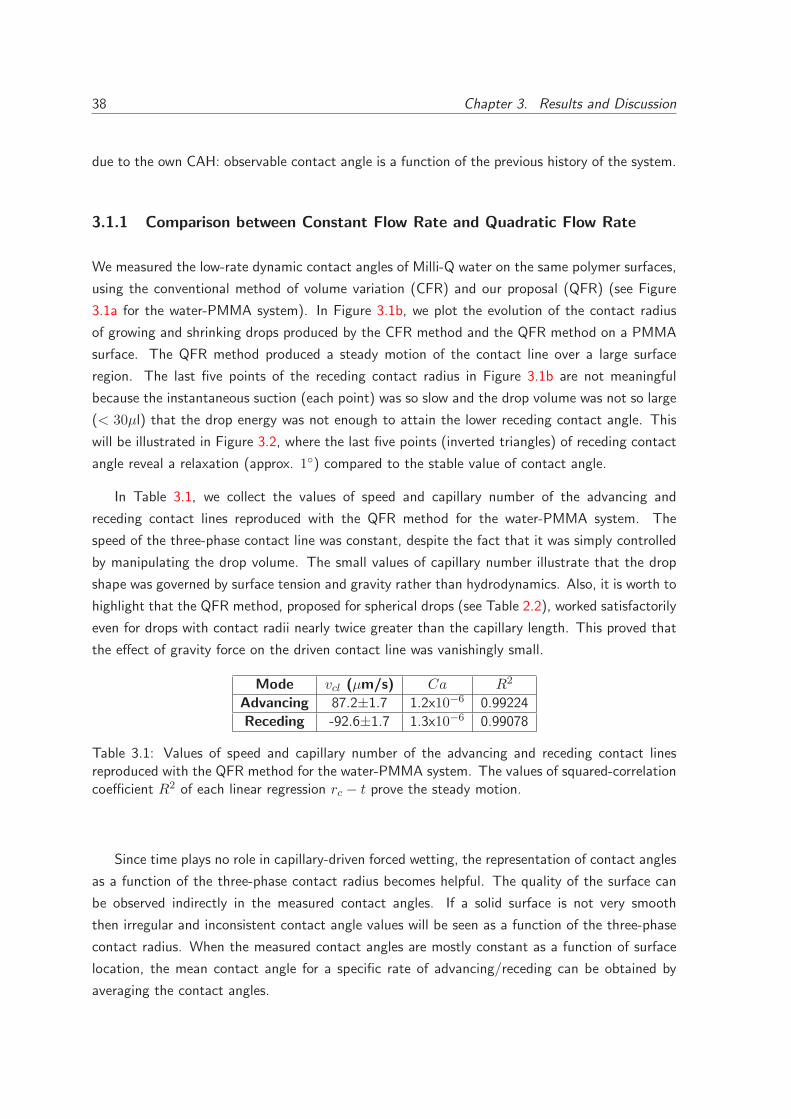
In Table 3.1, we collect the values of speed and capillary number of the advancing and
receding contact lines reproduced with the QFR method for the water-PMMA system. The
speed of the three-phase contact line was constant, despite the fact that it was simply controlled
by manipulating the drop volume. The small values of capillary number illustrate that the drop
shape was governed by surface tension and gravity rather than hydrodynamics. Also, it is worth to
highlight that the QFR method, proposed for spherical drops (see Table 2.2), worked satisfactorily
even for drops with contact radii nearly twice greater than the capillary length. This proved that
the effect of gravity force on the driven contact line was vanishingly small.
Mode vcl (µm/s) Ca R2
Advancing 87.2±1.7 1.2x10⁻⁶ 0.99224
Receding -92.6±1.7 1.3x10⁻⁶ 0.99078
Table 3.1: Values of speed and capillary number of the advancing and receding contact linesreproduced with the QFR method for the water-PMMA system. The values of squared-correlationcoefficient R2 of each linear regression rc − t prove the steady motion.
Since time plays no role in capillary-driven forced wetting, the representation of contact angles
as a function of the three-phase contact radius becomes helpful. The quality of the surface can
be observed indirectly in the measured contact angles. If a solid surface is not very smooth
then irregular and inconsistent contact angle values will be seen as a function of the three-phase
contact radius. When the measured contact angles are mostly constant as a function of surface
location, the mean contact angle for a specific rate of advancing/receding can be obtained by
averaging the contact angles.
3.1. The effect of contact line dynamics and drop formation 39
0.0 0.3 0.6 0.9 1.2 1.5 1.80
20
40
60
80
100
120
Advancing: CFR Receding: CFR Advancing: QFR Receding: QFR
Vol
ume
(l)
t/t0(a)
0.0 0.3 0.6 0.9 1.2 1.5 1.8
0.25
0.30
0.35
0.40
0.45
0.50
Advancing: CFR Receding: CFR Advancing: QFR Receding: QFR
Con
tact
Rad
ius
(cm
)
t/t0(b)
Figure 3.1: (a) Drop volume and (b) contact radius as function of dimensionless time (for dropgrowing and shrinking modes), at constant flow rate (CFR) and at quadratic flow rate (QFR) forthe water-PMMA system. The symbol t0 stands for the length of each process performed at CFR(100s) or QFR (40s).
40 Chapter 3. Results and Discussion
0.25 0.30 0.35 0.40 0.45 0.50
40
45
50
55
60
65
70
75
80
Advancing: CFR Receding: CFR Advancing: QFR Receding: QFR
Con
tact
Ang
le (d
egre
es)
Contact Radius (cm)
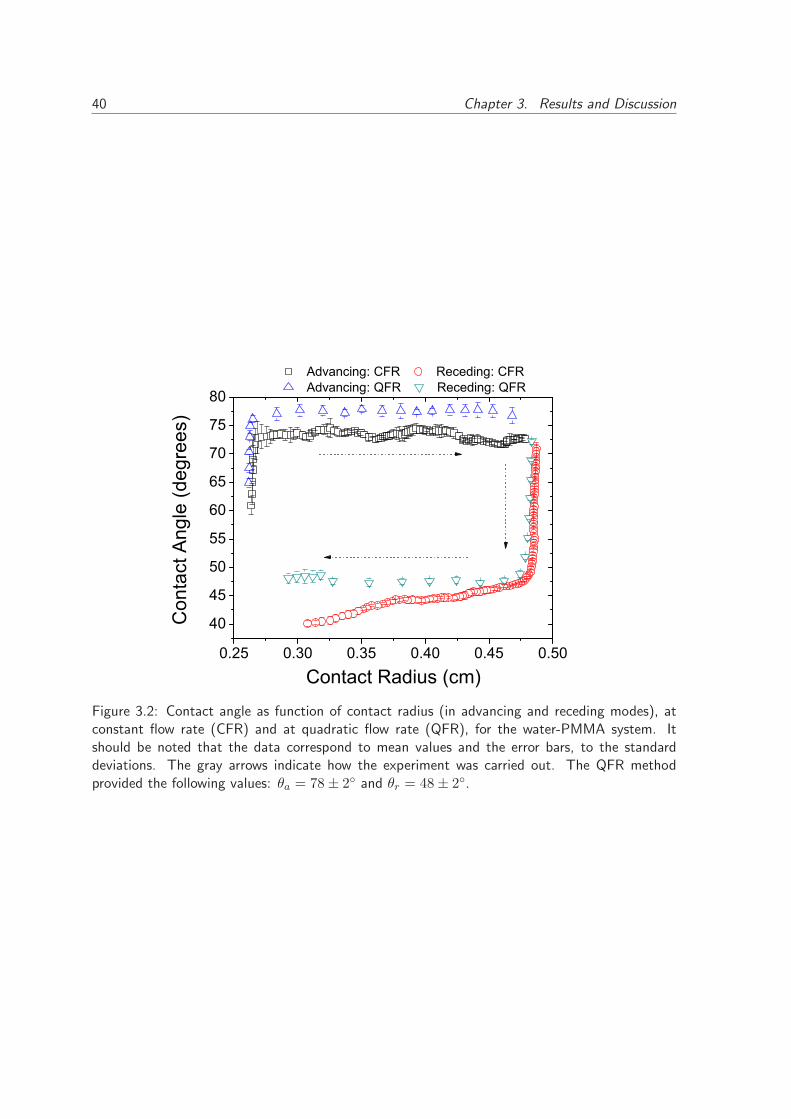
Figure 3.2: Contact angle as function of contact radius (in advancing and receding modes), atconstant flow rate (CFR) and at quadratic flow rate (QFR), for the water-PMMA system. Itshould be noted that the data correspond to mean values and the error bars, to the standarddeviations. The gray arrows indicate how the experiment was carried out. The QFR methodprovided the following values: θa = 78 ± 2◦ and θr = 48 ± 2◦.
3.1. The effect of contact line dynamics and drop formation 41
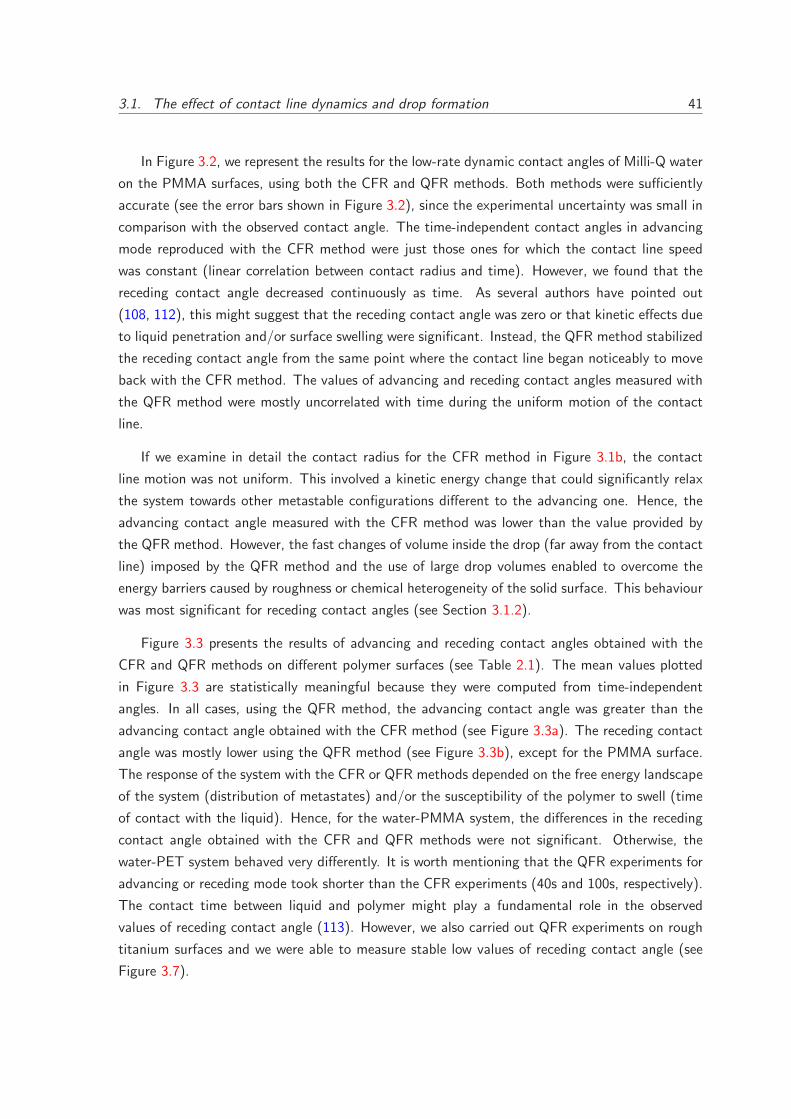
In Figure 3.2, we represent the results for the low-rate dynamic contact angles of Milli-Q water
on the PMMA surfaces, using both the CFR and QFR methods. Both methods were sufficiently
accurate (see the error bars shown in Figure 3.2), since the experimental uncertainty was small in
comparison with the observed contact angle. The time-independent contact angles in advancing
mode reproduced with the CFR method were just those ones for which the contact line speed
was constant (linear correlation between contact radius and time). However, we found that the
receding contact angle decreased continuously as time. As several authors have pointed out
(108, 112), this might suggest that the receding contact angle was zero or that kinetic effects due
to liquid penetration and/or surface swelling were significant. Instead, the QFR method stabilized
the receding contact angle from the same point where the contact line began noticeably to move
back with the CFR method. The values of advancing and receding contact angles measured with
the QFR method were mostly uncorrelated with time during the uniform motion of the contact
line.
If we examine in detail the contact radius for the CFR method in Figure 3.1b, the contact
line motion was not uniform. This involved a kinetic energy change that could significantly relax
the system towards other metastable configurations different to the advancing one. Hence, the
advancing contact angle measured with the CFR method was lower than the value provided by
the QFR method. However, the fast changes of volume inside the drop (far away from the contact
line) imposed by the QFR method and the use of large drop volumes enabled to overcome the
energy barriers caused by roughness or chemical heterogeneity of the solid surface. This behaviour
was most significant for receding contact angles (see Section 3.1.2).
Figure 3.3 presents the results of advancing and receding contact angles obtained with the
CFR and QFR methods on different polymer surfaces (see Table 2.1). The mean values plotted
in Figure 3.3 are statistically meaningful because they were computed from time-independent
angles. In all cases, using the QFR method, the advancing contact angle was greater than the
advancing contact angle obtained with the CFR method (see Figure 3.3a). The receding contact
angle was mostly lower using the QFR method (see Figure 3.3b), except for the PMMA surface.
The response of the system with the CFR or QFR methods depended on the free energy landscape
of the system (distribution of metastates) and/or the susceptibility of the polymer to swell (time
of contact with the liquid). Hence, for the water-PMMA system, the differences in the receding
contact angle obtained with the CFR and QFR methods were not significant. Otherwise, the
water-PET system behaved very differently. It is worth mentioning that the QFR experiments for
advancing or receding mode took shorter than the CFR experiments (40s and 100s, respectively).
The contact time between liquid and polymer might play a fundamental role in the observed
values of receding contact angle (113). However, we also carried out QFR experiments on rough
titanium surfaces and we were able to measure stable low values of receding contact angle (see
Figure 3.7).
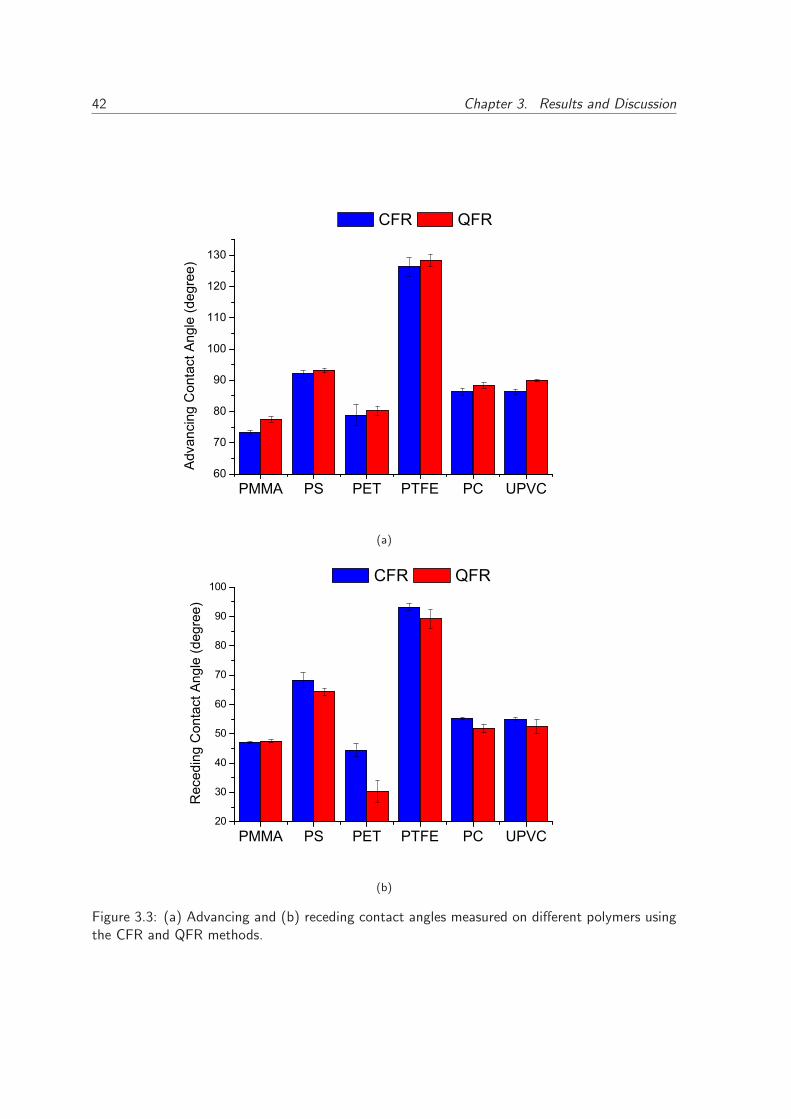
42 Chapter 3. Results and Discussion
PMMA PS PET PTFE PC UPVC60
70
80
90
100
110
120
130
Adv
anci
ng C
onta
ct A
ngle
(deg
ree)
CFR QFR
(a)
PMMA PS PET PTFE PC UPVC20
30
40
50
60
70
80
90
100
Rec
edin
g C
onta
ct A
ngle
(deg
ree)
CFR QFR
(b)
Figure 3.3: (a) Advancing and (b) receding contact angles measured on different polymers usingthe CFR and QFR methods.
3.1. The effect of contact line dynamics and drop formation 43
The QFR method produced the steady motion of the contact line over a larger surface distance
(≥ 1 mm) than the CFR method (see Figure 3.5), except for the PC surface in receding mode.
The behaviour observed for the PC surface might be due to irreversible molecular rearrangements
occurring at the solid-liquid interface after they came into contact (108, 112). In this particular
case, the receding angle may depend on the contact time between solid and liquid. It is worth to
point out that the distance traveled by an advancing drop at uniform motion was greater than
the distance described by a receding drop, except for the PMMA and PTFE surfaces. In fact, the
maximum distance covered by receding contact lines with the QFR method was found over the
PMMA surface, for which the receding contact angle agreed with the value provided by the CFR
method. Using the QFR method, we generally measured more representative values of advancing
and receding contact angles, because they were averaged over a greater area of the solid surfaces.
3.1.2 Forced wetting, really?
Low-rate dynamic contact angle measurements are based on forced wetting, where a liquid drop is
forced to attain one of the singular metastable configurations within the contact angle hysteresis
range. In order to confirm that the QFR method really produced forced wetting, a water drop
placed on a PMMA surface was firstly forced to move on and then stopped (see Figure 3.4a). As
the drop volume increased, the three-phase contact line advanced. When the motor was suddenly
stopped, the low-rate dynamic contact angle decreased (relaxation) up to a static value (see
Figure 3.4b). In the receding mode, a water drop was previously formed, next it was forced to
move back and, finally stopped. After the motor was stopped, the low-rate dynamic contact angle
increased (relaxation) up to a static value.
The relaxation observed in Figure 3.4b confirms that the contact angle measured with the QFR
method was not a statically stable contact angle (namely, the contact angle at zero velocity of
the three-phase contact line) (73). Varying the drop volume at QFR ensured that the observable
contact angle were the advancing or receding contact angle because the drop was deliberately
forced to attain a limit advancing or receding configuration (72), respectively. When a drop
recedes very slowly, such as an evaporating drop, it may be trapped at the first local energy
minimum that is encountered (80, 86). In contrast, the QFR method properly provided energy
enough to the drop to overcome the multiple energy barriers of the system and to attain the
concerning metastable configuration (advancing or receding).
The energy supplied to the drop using the QFR method was mostly employed to keep the
contact line speed and to attain the corresponding forced configuration of the system (114). In
receding mode, the large initial drop and the decelerated withdrawal of liquid enabled that the
system reached and kept the practical metastable configuration of lower contact angle during the
contact line motion.
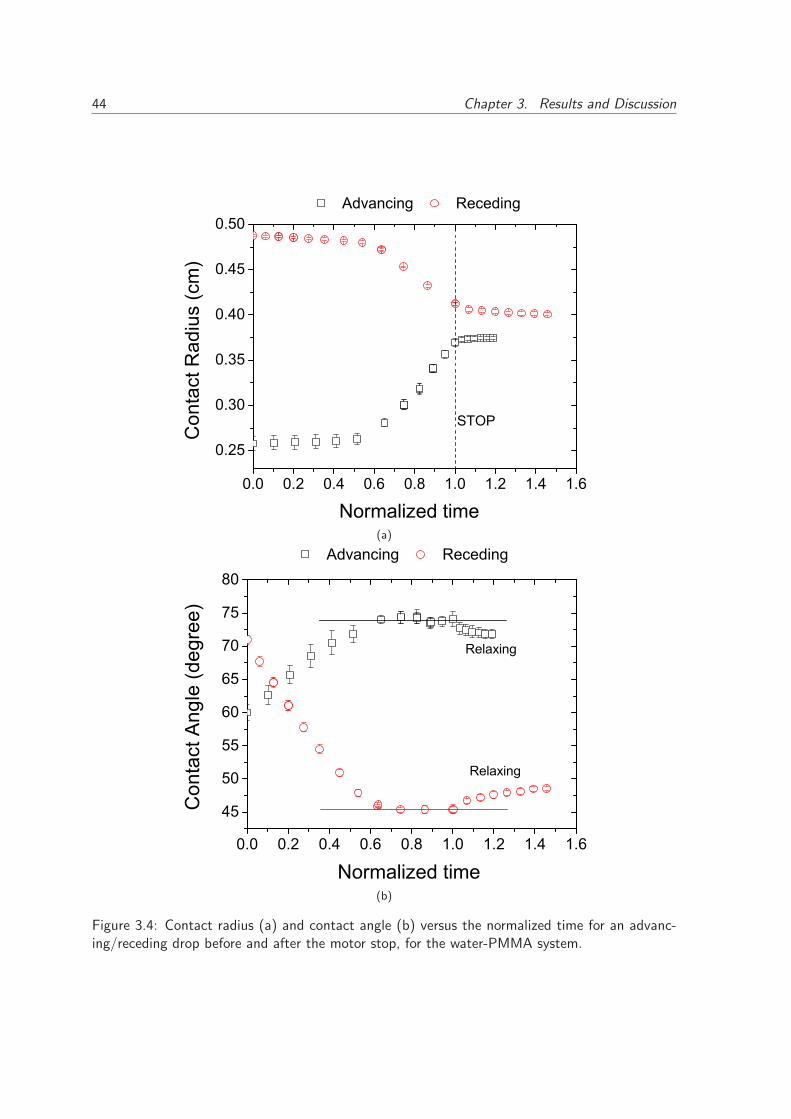
44 Chapter 3. Results and Discussion
0.0 0.2 0.4 0.6 0.8 1.0 1.2 1.4 1.6
0.25
0.30
0.35
0.40
0.45
0.50
Advancing Receding
Con
tact
Rad
ius
(cm
)
Normalized time
STOP
(a)
0.0 0.2 0.4 0.6 0.8 1.0 1.2 1.4 1.6
45
50
55
60
65
70
75
80
Relaxing
Advancing Receding
Con
tact
Ang
le (d
egre
e)
Normalized time
Relaxing
(b)
Figure 3.4: Contact radius (a) and contact angle (b) versus the normalized time for an advanc-ing/receding drop before and after the motor stop, for the water-PMMA system.
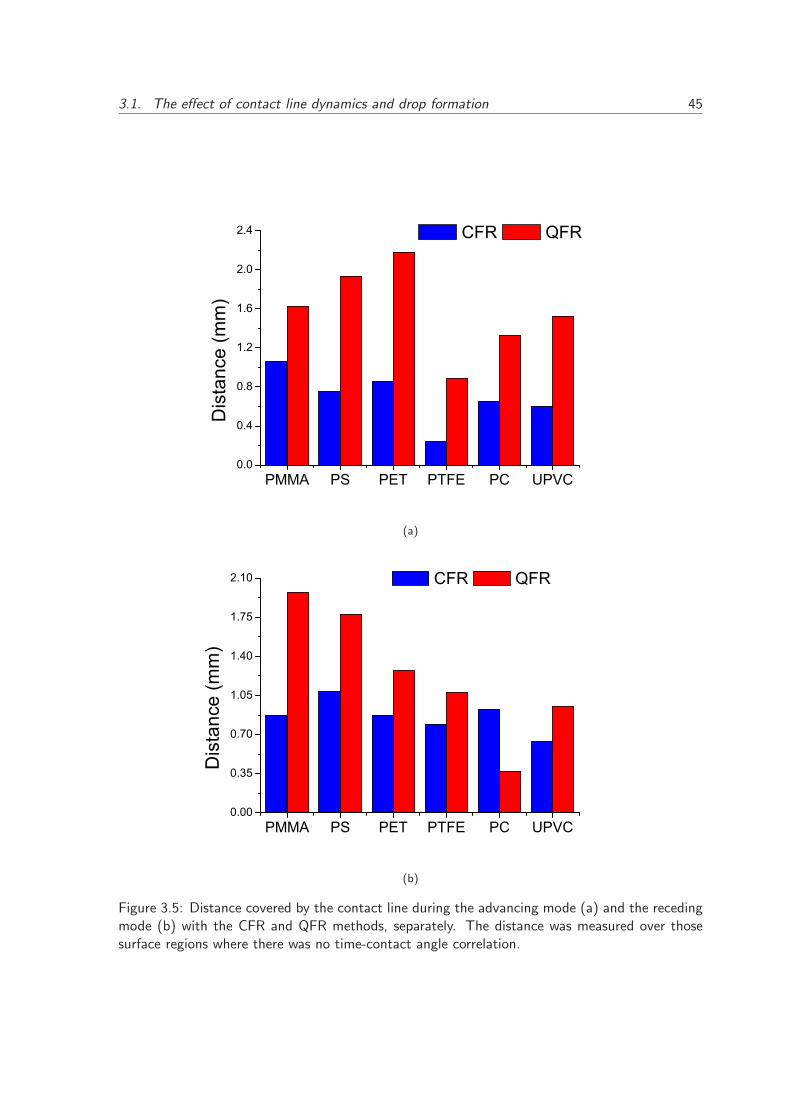
3.1. The effect of contact line dynamics and drop formation 45
PMMA PS PET PTFE PC UPVC0.0
0.4
0.8
1.2
1.6
2.0
2.4D
ista
nce
(mm
) CFR QFR
(a)
PMMA PS PET PTFE PC UPVC0.00
0.35
0.70
1.05
1.40
1.75
2.10
Dis
tanc
e (m
m)
CFR QFR
(b)
Figure 3.5: Distance covered by the contact line during the advancing mode (a) and the recedingmode (b) with the CFR and QFR methods, separately. The distance was measured over thosesurface regions where there was no time-contact angle correlation.
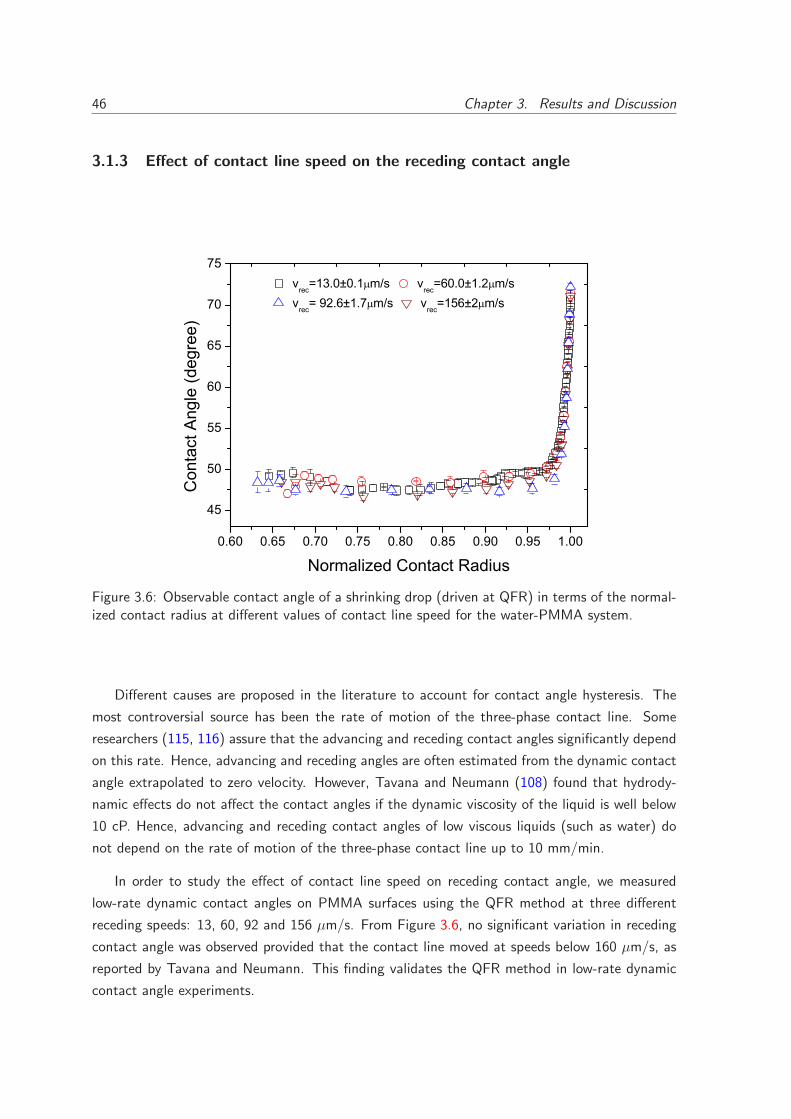
46 Chapter 3. Results and Discussion
3.1.3 Effect of contact line speed on the receding contact angle
0.60 0.65 0.70 0.75 0.80 0.85 0.90 0.95 1.00
45
50
55
60
65
70
75
vrec
=13.0±0.1 m/s vrec
=60.0±1.2 m/sv
rec= 92.6±1.7 m/s v
rec=156±2 m/s
Con
tact
Ang
le (d
egre
e)
Normalized Contact Radius
Figure 3.6: Observable contact angle of a shrinking drop (driven at QFR) in terms of the normal-ized contact radius at different values of contact line speed for the water-PMMA system.
Different causes are proposed in the literature to account for contact angle hysteresis. The
most controversial source has been the rate of motion of the three-phase contact line. Some
researchers (115, 116) assure that the advancing and receding contact angles significantly depend
on this rate. Hence, advancing and receding angles are often estimated from the dynamic contact
angle extrapolated to zero velocity. However, Tavana and Neumann (108) found that hydrody-
namic effects do not affect the contact angles if the dynamic viscosity of the liquid is well below
10 cP. Hence, advancing and receding contact angles of low viscous liquids (such as water) do
not depend on the rate of motion of the three-phase contact line up to 10 mm/min.
In order to study the effect of contact line speed on receding contact angle, we measured
low-rate dynamic contact angles on PMMA surfaces using the QFR method at three different
receding speeds: 13, 60, 92 and 156 µm/s. From Figure 3.6, no significant variation in receding
contact angle was observed provided that the contact line moved at speeds below 160 µm/s, as
reported by Tavana and Neumann. This finding validates the QFR method in low-rate dynamic
contact angle experiments.
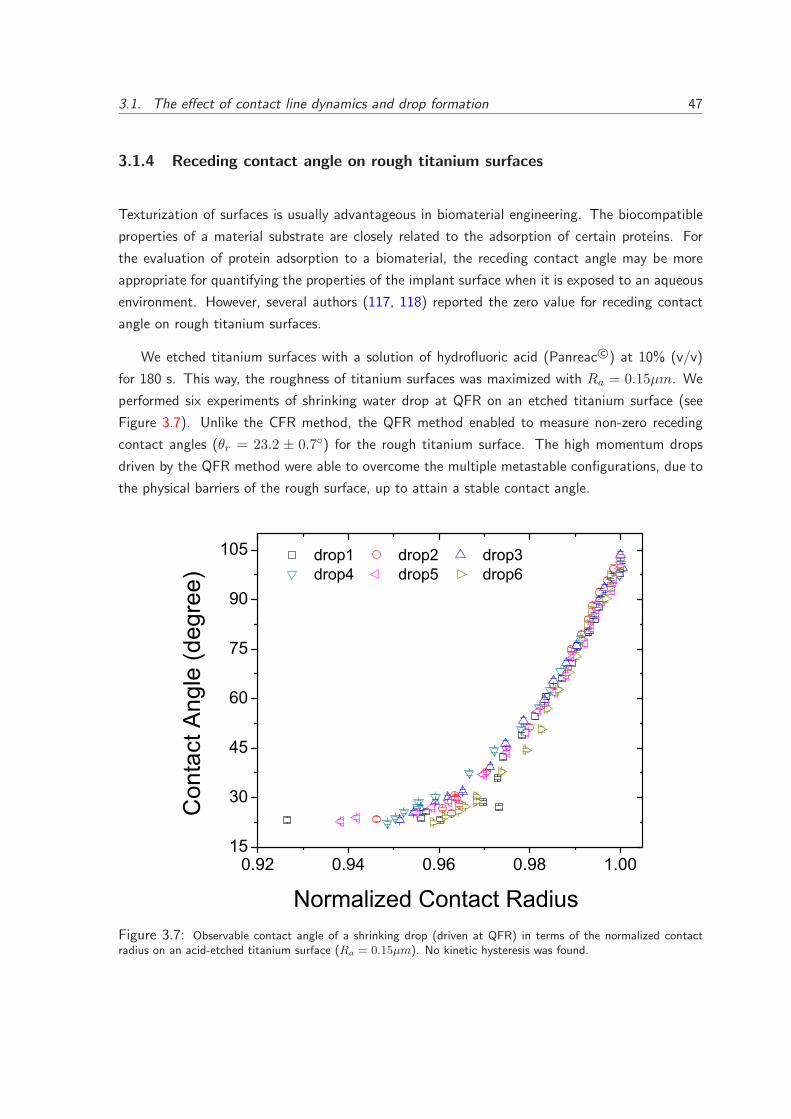
3.1. The effect of contact line dynamics and drop formation 47
3.1.4 Receding contact angle on rough titanium surfaces
Texturization of surfaces is usually advantageous in biomaterial engineering. The biocompatible
properties of a material substrate are closely related to the adsorption of certain proteins. For
the evaluation of protein adsorption to a biomaterial, the receding contact angle may be more
appropriate for quantifying the properties of the implant surface when it is exposed to an aqueous
environment. However, several authors (117, 118) reported the zero value for receding contact
angle on rough titanium surfaces.
We etched titanium surfaces with a solution of hydrofluoric acid (Panreac c©) at 10% (v/v)
for 180 s. This way, the roughness of titanium surfaces was maximized with Ra = 0.15µm. We
performed six experiments of shrinking water drop at QFR on an etched titanium surface (see
Figure 3.7). Unlike the CFR method, the QFR method enabled to measure non-zero receding
contact angles (θr = 23.2 ± 0.7◦) for the rough titanium surface. The high momentum drops
driven by the QFR method were able to overcome the multiple metastable configurations, due to
the physical barriers of the rough surface, up to attain a stable contact angle.
0.92 0.94 0.96 0.98 1.0015
30
45
60
75
90
105
drop1 drop2 drop3 drop4 drop5 drop6
Con
tact
Ang
le (d
egre
e)
Normalized Contact RadiusFigure 3.7: Observable contact angle of a shrinking drop (driven at QFR) in terms of the normalized contactradius on an acid-etched titanium surface (Ra = 0.15µm). No kinetic hysteresis was found.
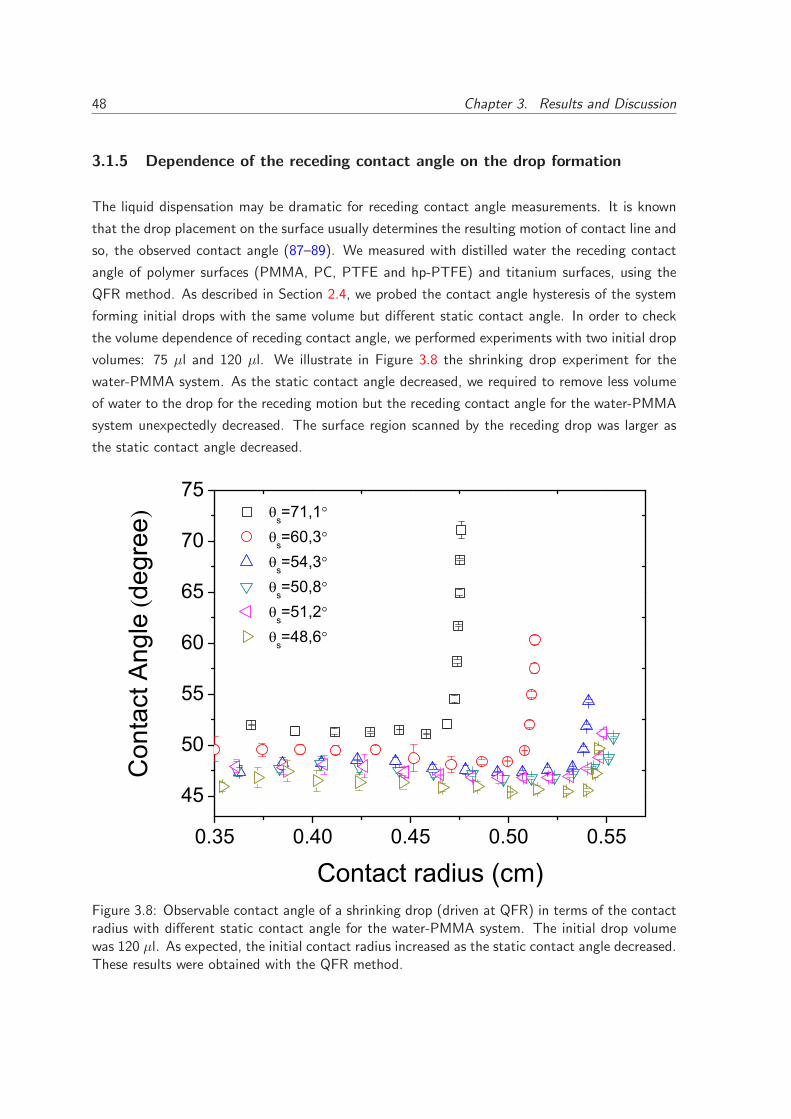
48 Chapter 3. Results and Discussion
3.1.5 Dependence of the receding contact angle on the drop formation
The liquid dispensation may be dramatic for receding contact angle measurements. It is known
that the drop placement on the surface usually determines the resulting motion of contact line and
so, the observed contact angle (87–89). We measured with distilled water the receding contact
angle of polymer surfaces (PMMA, PC, PTFE and hp-PTFE) and titanium surfaces, using the
QFR method. As described in Section 2.4, we probed the contact angle hysteresis of the system
forming initial drops with the same volume but different static contact angle. In order to check
the volume dependence of receding contact angle, we performed experiments with two initial drop
volumes: 75 µl and 120 µl. We illustrate in Figure 3.8 the shrinking drop experiment for the
water-PMMA system. As the static contact angle decreased, we required to remove less volume
of water to the drop for the receding motion but the receding contact angle for the water-PMMA
system unexpectedly decreased. The surface region scanned by the receding drop was larger as
the static contact angle decreased.
0.35 0.40 0.45 0.50 0.55
45
50
55
60
65
70
75
s=71,1
s=60,3
s=54,3
s=50,8
s=51,2
s=48,6
Con
tact
Ang
lede
gree
Contact radius (cm)Figure 3.8: Observable contact angle of a shrinking drop (driven at QFR) in terms of the contactradius with different static contact angle for the water-PMMA system. The initial drop volumewas 120 µl. As expected, the initial contact radius increased as the static contact angle decreased.These results were obtained with the QFR method.
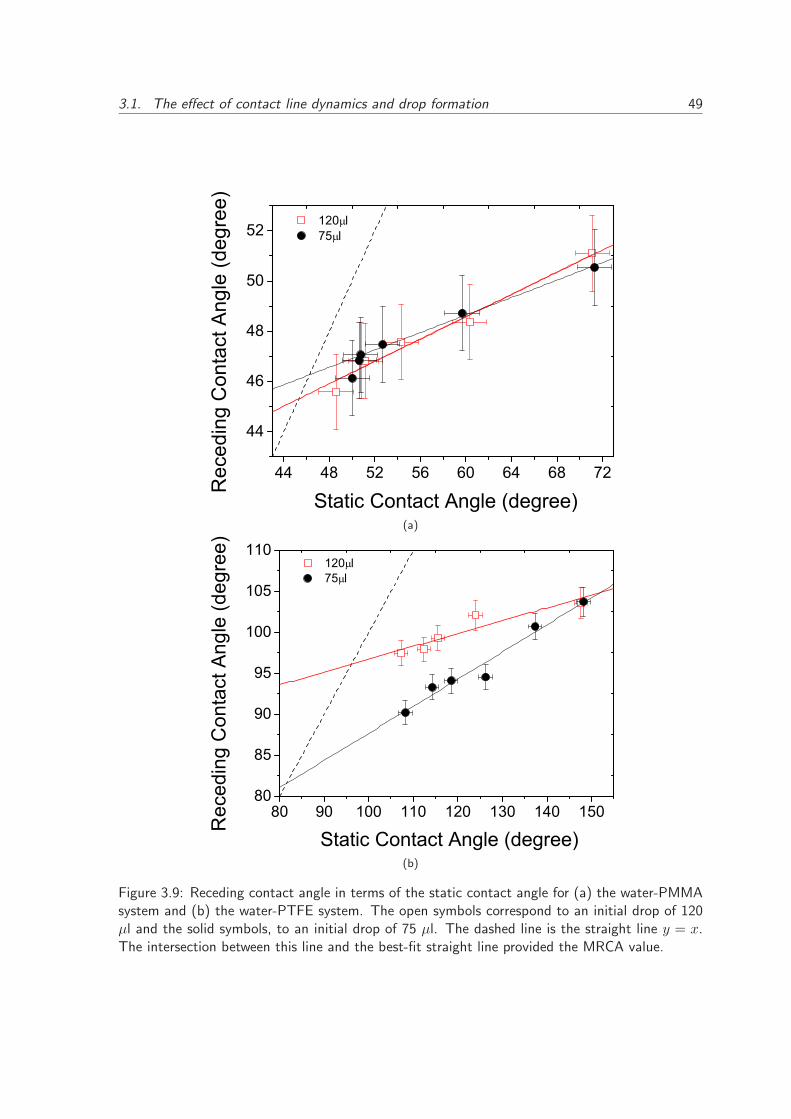
3.1. The effect of contact line dynamics and drop formation 49
44 48 52 56 60 64 68 72
44
46
48
50
52
Static Contact Angle (degree) Rec
edin
g C
onta
ct A
ngle
(deg
ree)
120 l 75 l
(a)
80 90 100 110 120 130 140 15080
85
90
95
100
105
110
Static Contact Angle (degree) Rec
edin
g C
onta
ct A
ngle
(deg
ree)
120 l 75 l
(b)
Figure 3.9: Receding contact angle in terms of the static contact angle for (a) the water-PMMAsystem and (b) the water-PTFE system. The open symbols correspond to an initial drop of 120µl and the solid symbols, to an initial drop of 75 µl. The dashed line is the straight line y = x.The intersection between this line and the best-fit straight line provided the MRCA value.
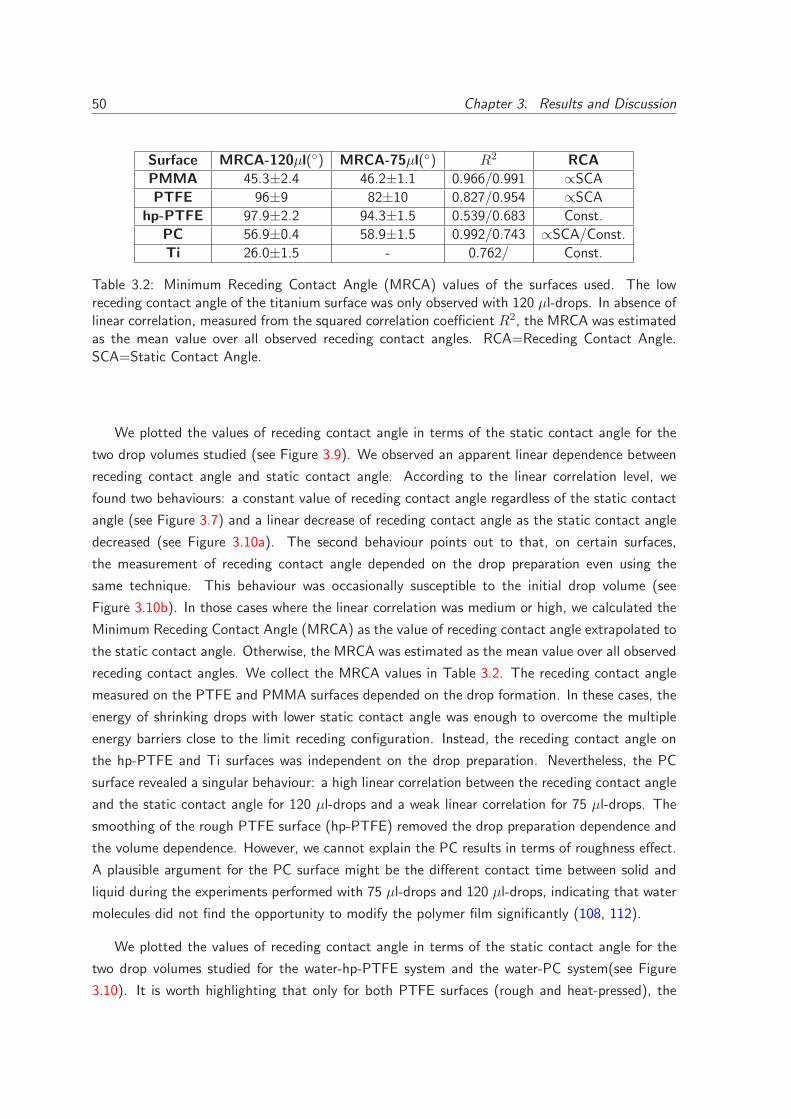
50 Chapter 3. Results and Discussion
Surface MRCA-120µl(◦) MRCA-75µl(◦) R2 RCA
PMMA 45.3±2.4 46.2±1.1 0.966/0.991 ∝SCA
PTFE 96±9 82±10 0.827/0.954 ∝SCA
hp-PTFE 97.9±2.2 94.3±1.5 0.539/0.683 Const.
PC 56.9±0.4 58.9±1.5 0.992/0.743 ∝SCA/Const.
Ti 26.0±1.5 - 0.762/ Const.
Table 3.2: Minimum Receding Contact Angle (MRCA) values of the surfaces used. The lowreceding contact angle of the titanium surface was only observed with 120 µl-drops. In absence oflinear correlation, measured from the squared correlation coefficient R2, the MRCA was estimatedas the mean value over all observed receding contact angles. RCA=Receding Contact Angle.SCA=Static Contact Angle.
We plotted the values of receding contact angle in terms of the static contact angle for the
two drop volumes studied (see Figure 3.9). We observed an apparent linear dependence between
receding contact angle and static contact angle. According to the linear correlation level, we
found two behaviours: a constant value of receding contact angle regardless of the static contact
angle (see Figure 3.7) and a linear decrease of receding contact angle as the static contact angle
decreased (see Figure 3.10a). The second behaviour points out to that, on certain surfaces,
the measurement of receding contact angle depended on the drop preparation even using the
same technique. This behaviour was occasionally susceptible to the initial drop volume (see
Figure 3.10b). In those cases where the linear correlation was medium or high, we calculated the
Minimum Receding Contact Angle (MRCA) as the value of receding contact angle extrapolated to
the static contact angle. Otherwise, the MRCA was estimated as the mean value over all observed
receding contact angles. We collect the MRCA values in Table 3.2. The receding contact angle
measured on the PTFE and PMMA surfaces depended on the drop formation. In these cases, the
energy of shrinking drops with lower static contact angle was enough to overcome the multiple
energy barriers close to the limit receding configuration. Instead, the receding contact angle on
the hp-PTFE and Ti surfaces was independent on the drop preparation. Nevertheless, the PC
surface revealed a singular behaviour: a high linear correlation between the receding contact angle
and the static contact angle for 120 µl-drops and a weak linear correlation for 75 µl-drops. The
smoothing of the rough PTFE surface (hp-PTFE) removed the drop preparation dependence and
the volume dependence. However, we cannot explain the PC results in terms of roughness effect.
A plausible argument for the PC surface might be the different contact time between solid and
liquid during the experiments performed with 75 µl-drops and 120 µl-drops, indicating that water
molecules did not find the opportunity to modify the polymer film significantly (108, 112).
We plotted the values of receding contact angle in terms of the static contact angle for the
two drop volumes studied for the water-hp-PTFE system and the water-PC system(see Figure
3.10). It is worth highlighting that only for both PTFE surfaces (rough and heat-pressed), the
3.2. Controlled Shrinking Sessile Drop 51
best fitting straight lines were not parallel. This might reveal a roughness effect.
Marmur referred to the term “theoretical receding contact angle” (72) as the minimum value
of the observable (measurable) contact angle at incipiently receding contact lines. This contact
angle is often poorly repeatable (unstable). Otherwise, Marmur also coined the term “practical
receding contact angle” (72) as the minimum value of the observable (measurable) and repeatable
(stable) contact angle hold during the entire motion of drop (as illustrated in Figure 3.2). The
MRCA estimated from practical receding contact angles is a good approximation to theoretical
receding contact angle.
3.2 Controlled Shrinking Sessile Drop
In Figures 3.11 and 3.12, we show a typical experiment performed with the CSSD method. We
observed that the liquid-vapour area decreased linearly as time for an intermediate range (see
Figure 3.11b), after the pinning stage (see Figure 3.12). As happens with freely evaporating
drops, the receding contact line in CSSD experiments held a constant contact angle (see Figure
3.12). We also varied the length of the CSSD experiment (see Figure 3.13). In the fast CSSD
experiment (tt =100s), no hydrodynamics effects were found (see Figure 3.13b). The CSSD
method was independent on the process length, up to 900 s. Above 900 s, the shrinking drop
began to evaporate significantly because the withdrawal rate was similar to the actual evaporation
rate. The CSSD process reproduced the final mixed stage of drop evaporation (see Figure 3.13b).
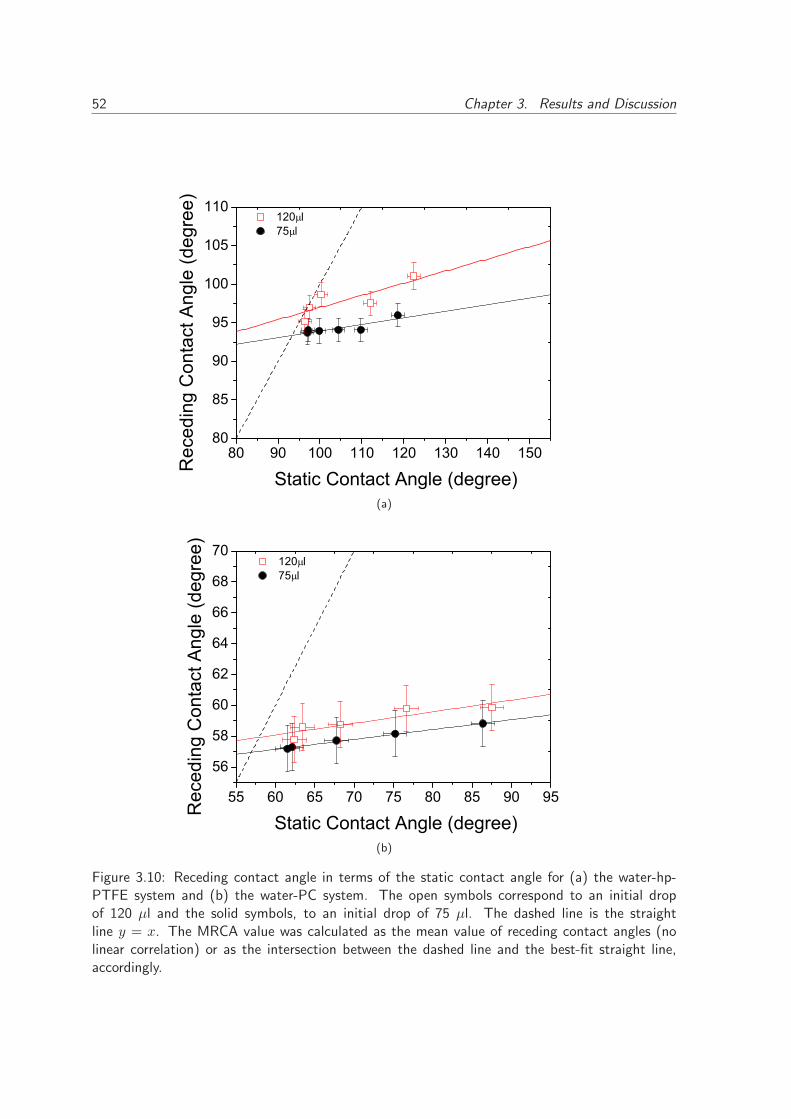
52 Chapter 3. Results and Discussion
80 90 100 110 120 130 140 15080
85
90
95
100
105
110
Static Contact Angle (degree) Rec
edin
g C
onta
ct A
ngle
(deg
ree)
120 l 75 l
(a)
55 60 65 70 75 80 85 90 95
56
58
60
62
64
66
68
70
Static Contact Angle (degree) Rec
edin
g C
onta
ct A
ngle
(deg
ree)
120 l 75 l
(b)
Figure 3.10: Receding contact angle in terms of the static contact angle for (a) the water-hp-PTFE system and (b) the water-PC system. The open symbols correspond to an initial dropof 120 µl and the solid symbols, to an initial drop of 75 µl. The dashed line is the straightline y = x. The MRCA value was calculated as the mean value of receding contact angles (nolinear correlation) or as the intersection between the dashed line and the best-fit straight line,accordingly.
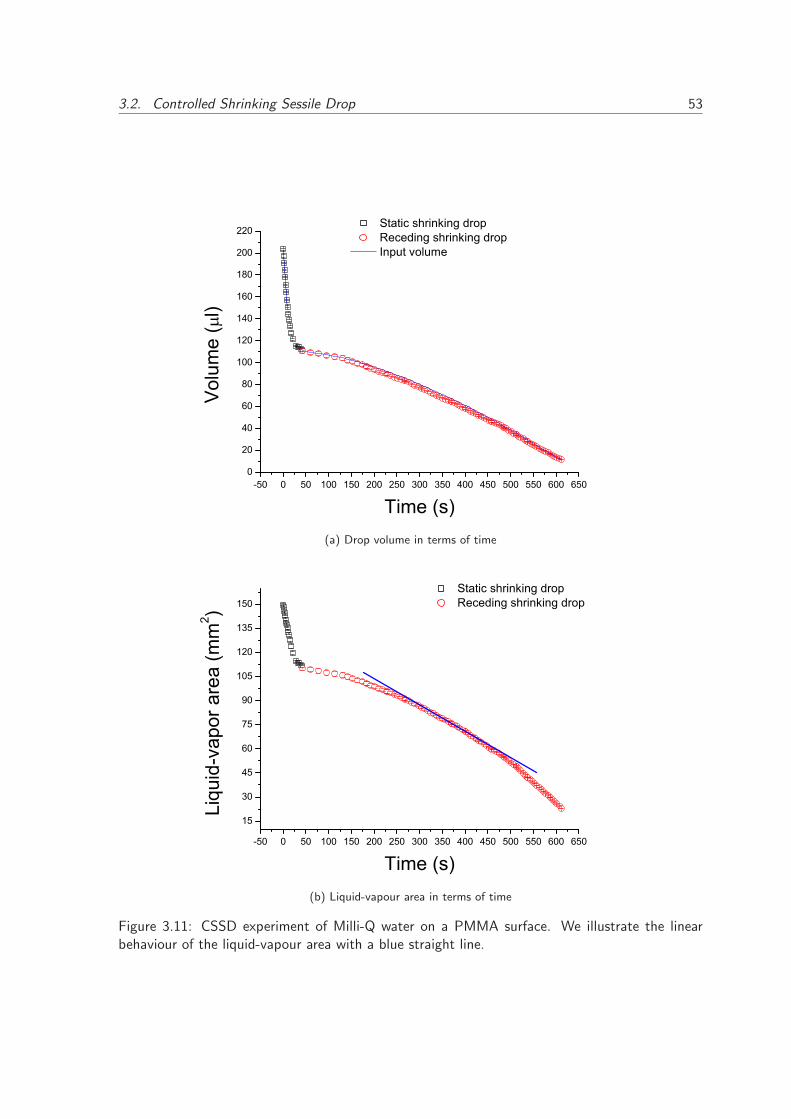
3.2. Controlled Shrinking Sessile Drop 53
-50 0 50 100 150 200 250 300 350 400 450 500 550 600 6500
20
40
60
80
100
120
140
160
180
200
220 Static shrinking drop Receding shrinking drop Input volume
Volu
me
(l)
Time (s)(a) Drop volume in terms of time
-50 0 50 100 150 200 250 300 350 400 450 500 550 600 650
15
30
45
60
75
90
105
120
135
150 Static shrinking drop Receding shrinking drop
Liqu
id-v
apor
are
a (m
m2 )
Time (s)(b) Liquid-vapour area in terms of time
Figure 3.11: CSSD experiment of Milli-Q water on a PMMA surface. We illustrate the linearbehaviour of the liquid-vapour area with a blue straight line.
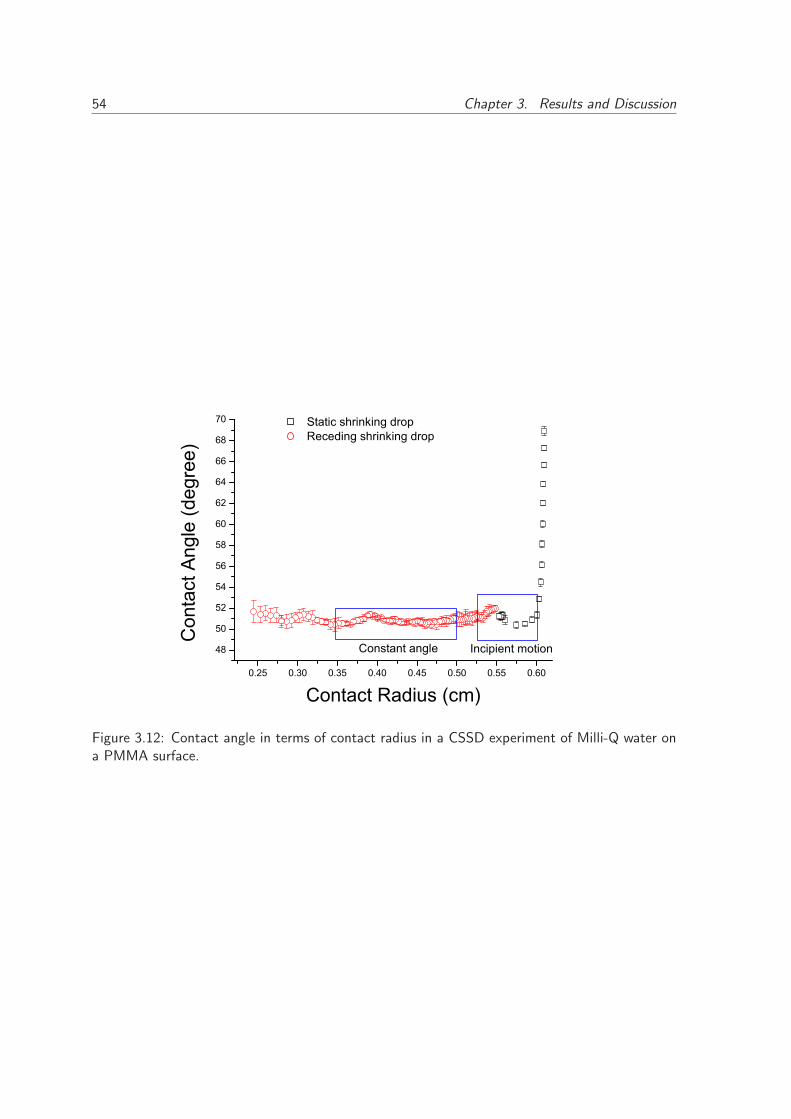
54 Chapter 3. Results and Discussion
0.25 0.30 0.35 0.40 0.45 0.50 0.55 0.60
48
50
52
54
56
58
60
62
64
66
68
70
Constant angle Incipient motion
Static shrinking drop Receding shrinking drop
Con
tact
Ang
le (d
egre
e)
Contact Radius (cm)
Figure 3.12: Contact angle in terms of contact radius in a CSSD experiment of Milli-Q water ona PMMA surface.
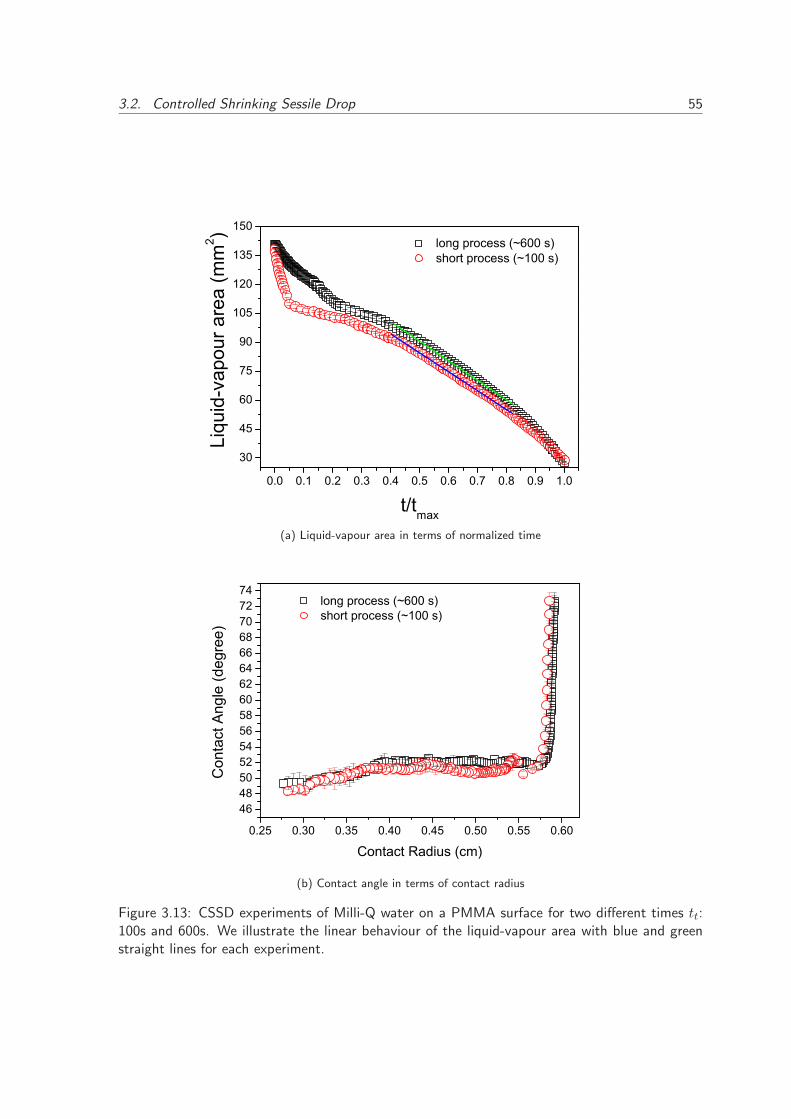
3.2. Controlled Shrinking Sessile Drop 55
0.0 0.1 0.2 0.3 0.4 0.5 0.6 0.7 0.8 0.9 1.0
30
45
60
75
90
105
120
135
150 long process (~600 s) short process (~100 s)
Li
quid
-vap
our a
rea
(mm
2 )
t/tmax
(a) Liquid-vapour area in terms of normalized time
0.25 0.30 0.35 0.40 0.45 0.50 0.55 0.60
464850525456586062646668707274
long process (~600 s) short process (~100 s)
Con
tact
Ang
le (d
egre
e)
Contact Radius (cm)
(b) Contact angle in terms of contact radius
Figure 3.13: CSSD experiments of Milli-Q water on a PMMA surface for two different times tt:100s and 600s. We illustrate the linear behaviour of the liquid-vapour area with blue and greenstraight lines for each experiment.

CHAPTER 4
Conclusions
Receding contact lines of pure liquids
In this work, we focused on the dynamics of three-phase contact line at very low capillary numbers.
In this scenario, the observed contact angle should be speed-independent. However, we found
that the quasi-static contact angle at moving contact lines of shrinking drops depended on the
volumetric flow rate. We were able to measure stable, minimum values of receding contact angle
with quadratic flow rate. This behaviour points out to a hysteresis effect rather than a viscous
effect. We recommend, whenever possible, to perform a preliminary study on the impact of the
drop preparation and drop size on the receding contact angle measurement.
With the methodology developed in this part, we are able to control the speed of the receding
contact lines and further to emulate the first stages of drop evaporation. The drop volume was
changed by removing liquid to a initial drop using a motorized-micrometer syringe. Contact line
dynamics of shrinking drops was then controlled by regulating the volume flow rate. We were able
to reproduce the linear decrease of liquid-vapour area with time of evaporating drops using a non-
linear withdrawal of liquid volume. Unlike freely-evaporating drops of pure liquids, the receding
contact lines of shrinking drops mostly held a constant contact angle over a significant area. The
58 Chapter 4. Conclusions
internal flux distribution imposed, included the flow produced by the eventual microevaporation
at the triple line, was the same for all experiments, once fixed the initial drop volume, the process
length and the substrate (contact angle hysteresis). This way, the Controlled Shrinking Sessile
Drop (CSSD) method allows standardizing the contact line dynamics of evaporating drops.
English
Next, we summarize the main conclusions of the part I of this work:
1 Quadratic volumetric flow rate in low-rate dynamic contact angle experiments enables the
steady motion of contact lines of sessile drops, which standardizes the input of kinetic energy
to driven contact lines. This strategy applies to a wide range of polymer surfaces. Further
work should be addressed to the systematic use of quadratic flow rate in low-rate dynamic
contact angle experiments.
2 Receding contact angle values measured at steadily moving contact lines are time- and
speed-independent. This enables to map significantly the surface energetics over the sub-
strate.
3 Receding contact angle of a sessile drop on certain surfaces dependes on how the drop
was formed. Larger initial drops and a previous withdrawal of liquid enables the early
receding motion for shrinking drops. This allows to evaluate the minimum observable value
of receding contact angle, independent of the drop placement.
4 The overall process (including the mix stage) of liquid drop evaporation has been reproduced
successfully using a no-linear variation of drop volume.
Espanol
A continuacion, resumimos las principales conclusiones de la parte I de este trabajo:
1 Un ritmo volumetrico quadratico en experimentos de angulo de contacto dinamico facilitan
el movimiento uniforme de lınea de contacto de gotas sesiles, lo que estandariza la entrada
de energıa cinetica a la lınea guiada. Se deberıa estudiar en profundidad el uso sistematico
de ritmos volumetricos quadraticos en experimentos de angulo de contacto dinamico.
2 Los angulos de contacto de retroceso medidos en lıneas de contacto en movimiento uniforme
are independientes de la velocidad y del tiempo. Esto permite mapear significativamente la
energıa superficial del sustrato.

59
3 El angulo de contacto de retroceso de una gota sesil sobre determinadas superficies depende
de como se formo la gota. Gotas voluminosas y una succion previa de lıquido facilitan el
movimiento temprano en retroceso de gotas “menguantes”. Esto permite evaluar el valor
observable mınimo del angulo de contacto de retroceso, con independencia de la colocacion
de la gota.
4 El proceso global (incluyendo la etapa mixta) de evaporacion de gotas sesiles se ha repro-
ducido con exito utilizando una variacion no lineal de volumen de gota.

Part II
Receding contact lines of complex
liquids

CHAPTER 5
Theoretical framework
Receding contact lines of complex liquids
5.1 Coffee stain effect
When a coffee drop evaporates on a solid surface, a ring-like deposit is left along the perimeter.
If the liquid contains particles, like in a suspension, these particles will be driven outwards by
the flow. When all the liquid has evaporated, the particles will form a ring or stain (see Figure
5.1). Morphology of the particle deposits varies in extensively manner (see Figure 5.2), aside
from ring-like structures (5), they can exhibit a central bump (119), uniform deposit (120) or
complex patterns involving multiple rings (121), network of polygons or hexagonal arrays (122).
Diversity in morphology deposits is due to the complex mechanism behind the transport of particles
phenomena during drop evaporation.
The mechanism for particle deposits and the morphology of the deposits left has been widely
studied. The first study proposing a physical model was the published by Deegan et al (6). They
demonstrated that exist two conditions necessaries for ring-like deposits apparition: contact line
pinning and evaporation from the edge of the drop. They showed that the particle migration is
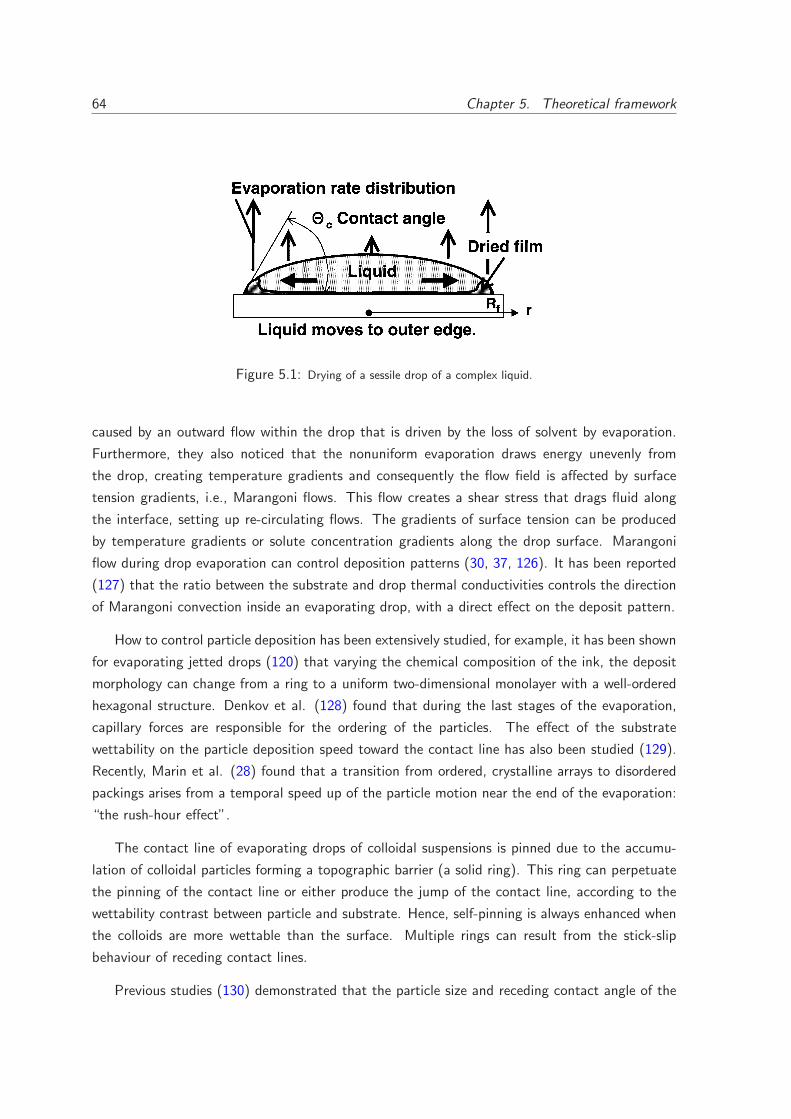
64 Chapter 5. Theoretical framework
Fig. 9 Deegan’s model for co ee stain phenomenaFigure 5.1: Drying of a sessile drop of a complex liquid.
caused by an outward flow within the drop that is driven by the loss of solvent by evaporation.
Furthermore, they also noticed that the nonuniform evaporation draws energy unevenly from
the drop, creating temperature gradients and consequently the flow field is affected by surface
tension gradients, i.e., Marangoni flows. This flow creates a shear stress that drags fluid along
the interface, setting up re-circulating flows. The gradients of surface tension can be produced
by temperature gradients or solute concentration gradients along the drop surface. Marangoni
flow during drop evaporation can control deposition patterns (30, 37, 126). It has been reported
(127) that the ratio between the substrate and drop thermal conductivities controls the direction
of Marangoni convection inside an evaporating drop, with a direct effect on the deposit pattern.
How to control particle deposition has been extensively studied, for example, it has been shown
for evaporating jetted drops (120) that varying the chemical composition of the ink, the deposit
morphology can change from a ring to a uniform two-dimensional monolayer with a well-ordered
hexagonal structure. Denkov et al. (128) found that during the last stages of the evaporation,
capillary forces are responsible for the ordering of the particles. The effect of the substrate
wettability on the particle deposition speed toward the contact line has also been studied (129).
Recently, Marin et al. (28) found that a transition from ordered, crystalline arrays to disordered
packings arises from a temporal speed up of the particle motion near the end of the evaporation:
“the rush-hour effect”.
The contact line of evaporating drops of colloidal suspensions is pinned due to the accumu-
lation of colloidal particles forming a topographic barrier (a solid ring). This ring can perpetuate
the pinning of the contact line or either produce the jump of the contact line, according to the
wettability contrast between particle and substrate. Hence, self-pinning is always enhanced when
the colloids are more wettable than the surface. Multiple rings can result from the stick-slip
behaviour of receding contact lines.
Previous studies (130) demonstrated that the particle size and receding contact angle of the
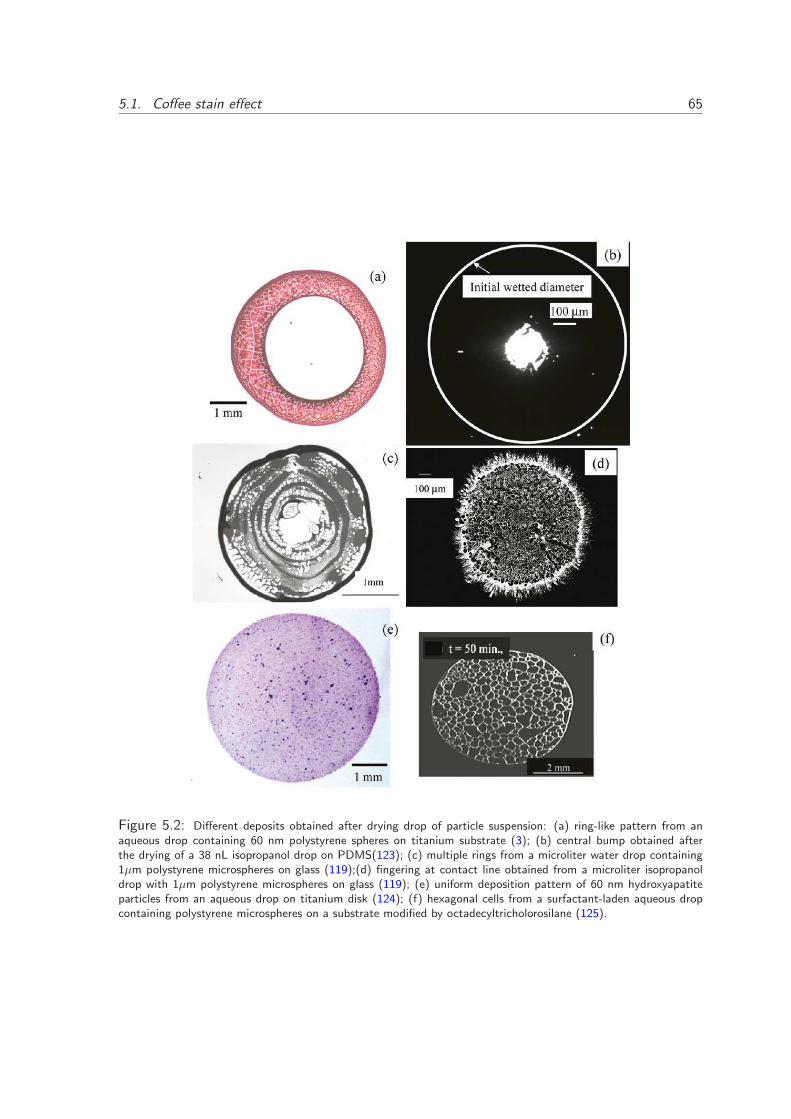
5.1. Coffee stain effect 65
Figure 5.2: Different deposits obtained after drying drop of particle suspension: (a) ring-like pattern from anaqueous drop containing 60 nm polystyrene spheres on titanium substrate (3); (b) central bump obtained afterthe drying of a 38 nL isopropanol drop on PDMS(123); (c) multiple rings from a microliter water drop containing1µm polystyrene microspheres on glass (119);(d) fingering at contact line obtained from a microliter isopropanoldrop with 1µm polystyrene microspheres on glass (119); (e) uniform deposition pattern of 60 nm hydroxyapatiteparticles from an aqueous drop on titanium disk (124); (f) hexagonal cells from a surfactant-laden aqueous dropcontaining polystyrene microspheres on a substrate modified by octadecyltricholorosilane (125).
66 Chapter 5. Theoretical framework
substrate, determine the distance away from the contact line where particles get deposited, which
determines the final deposition morphology of particles. Chhasatia et al. (131) found that with
the change in substrate wettability significant differences are created in the microflow patterns
inside the drop, resulting in different particle dynamics and deposit morphologies.
As explained before, the deposition of colloidal particles from an evaporating droplet onto
a substrate depends on the flow profile that is induced inside the evaporating droplet. Under
different evaporation conditions, fluid can either flow toward or away from the contact line. When
the evaporative flux of liquid is relatively constant across the droplet or moderately enhanced
at the edge of the droplet (hydrophilic surfaces), an outward flow develops in the liquid. This
outward flow convects the solute toward the contact line, leading to the development of a solute
ring on the substrate. Conversely, if evaporation primarily occurs at the center of the droplet
(hydrophobic surfaces), then a solute ring does not form because the liquid flows toward the
center of the droplet. Rather, a uniform deposit of particles remained on the substrate.
Siddhartha et al. (132) studied the electrokinetic effects on the particle deposition. They
found that, electrokinetic-effect induced (as a consequence of evaporation of an electrolyte drop
in contact with a charged substrate) enhancement the deposition velocity at the end of the drop
lifetime may lead to a drastic increase of the disordered phase deposition velocity, modulating the
consequent “coffee stain” effect to a significant extent.
The role of DLVO interactions on the morphology of the particle deposits has been investigate
by Bhardwaj et al. (37). They found that there are three convective patterns that cause the
different particle deposits. A peripheral ring is obtained due to the radial flow created by the
maximum evaporation rate at the contact line. A uniform layer is formed when the transport of
particles normally toward the substrate occurs due to an attractive DLVO force. A central bump
is created with Marangoni recirculation loop.
On the other hand, the “coffee stain” effect produces a undesired inhomogeneous distribution
of solutes. In applications such as microarrays, coating and printing, the inhomogeneity of the
residual deposits compromises the overall performance of the system. In this way, many studies
have been developed in order to reverse or mitigate the “coffee ring” effect. Eral et al. (33) found
that the stains of colloidal particles can be suppressed by electrowetting at alternating frequencies
ranging from a few Hz to a few tens of kHz. The effects that contribute to the suppression of the
“coffee stain” effect are: the time-dependent electrostatic force which prevents the pinning of the
contact line and the internal flow fields generated by the AC electrowetting prevents the accumu-
lation of particles along the contact line. Yunker et al. (32) found that the shape of the suspended
particles can be used to eliminate the coffee-ring effect. The ellipsoidal particles are deposited
uniformly during evaporation. They also found that under appropriate conditions, suspensions of
spheres mixed with a small number of ellipsoids produce uniform deposition. Therefore, adding
5.2. Derjaguin, Landau, Verwey and Overbeek interactions 67
ellipsoids to existing suspensions, uniform depositions can be produced.
5.2 Derjaguin, Landau, Verwey and Overbeek interactions
The van der Waals and electrostatic forces do affect the colloidal systems, but most previous
studies on the evaporating droplet did not consider the effects. There are just a few works
devoted to study the effects of the interparticle interaction and particle-substrate interaction
(24, 126, 131, 133).
Figure 5.3 shows schematically the various types of interaction potentials that can occur
between two similarly charged surfaces or colloidal particles in a 1:1 electrolyte solution under the
combined action of the van der Waals and electrostatic forces (134). Depending on the electrolyte
concentration and surface charge density or potential one of the following may occur:
• For highly charged surfaces in dilute electrolyte, there is a strong long-range repulsion that
peaks at some distance.
• In more concentrated electrolyte solutions there is a significant secondary minimum. The
potential energy minimum at contact is known as the primary minimum. For a colloidal
system, even though the thermodynamically equilibrium state may be with the particles in
contact in the deep primary minimum, the energy barrier may be too high for the particles to
overcome during any reasonable time period. When this is the case, the particles will either
sit in the weaker secondary minimum or remain totally dispersed in the solution. In the latter
case the colloid is referred to as being kinetically stable (as opposed to thermodynamically
stable).
• For surfaces of low charge density or potential, the energy barrier will be lower. This leads to
slow aggregation, known as coagulation or flocculation. Below a certain charge or potential,
or above some concentration of electrolyte, known as the critical coagulation concentration,
the energy barrier falls below the W = 0 axis (middle curve in Figure 5.3) and the particles
then coagulate rapidly. The colloid is now referred to as being unstable.
• As the surface charge or potential approaches zero the interaction curve approaches the pure
van der Waals curve, and two surfaces now attract each other strongly at all separations.
The surface potential of spherical particles (ψp) can be related to the surface charge density
(σp) by the Gouy-Chapman relation (135):
σp =2εε0kBT
eκ−1sinh
(
eψp
2kBT
)
(5.1)
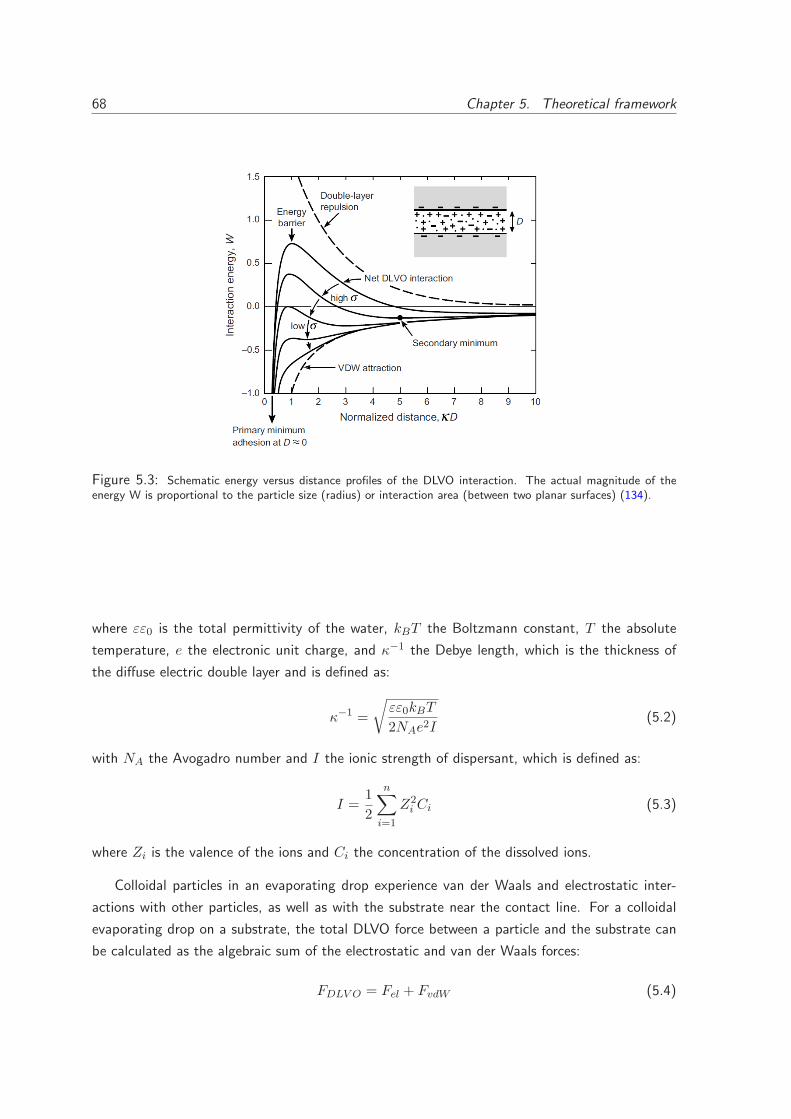
68 Chapter 5. Theoretical framework
Figure 5.3: Schematic energy versus distance profiles of the DLVO interaction. The actual magnitude of theenergy W is proportional to the particle size (radius) or interaction area (between two planar surfaces) (134).
where εε0 is the total permittivity of the water, kBT the Boltzmann constant, T the absolute
temperature, e the electronic unit charge, and κ−1 the Debye length, which is the thickness of
the diffuse electric double layer and is defined as:
κ−1 =
√
εε0kBT
2NAe2I(5.2)
with NA the Avogadro number and I the ionic strength of dispersant, which is defined as:
I =1
2
n∑
i=1
Z2i Ci (5.3)
where Zi is the valence of the ions and Ci the concentration of the dissolved ions.
Colloidal particles in an evaporating drop experience van der Waals and electrostatic inter-
actions with other particles, as well as with the substrate near the contact line. For a colloidal
evaporating drop on a substrate, the total DLVO force between a particle and the substrate can
be calculated as the algebraic sum of the electrostatic and van der Waals forces:
FDLV O = Fel + FvdW (5.4)
5.2. Derjaguin, Landau, Verwey and Overbeek interactions 69
The particle-substrate electrostatic force is calculated as:
Fel = Fel (0) exp(−z/κ−1) (5.5)
where, κ−1 is the Debye length (eq. 5.2) and z the distance between the particle and the substrate.
The electrostatic force at zero distance depends on the temperature, the particle diameter and
the surface potentials of the particle and the substrate.
The van der Waals attraction force between the substrate and the particle is given by (135):
FvdW =1
12Ad3
p
αrtd
z2 (z + dp)2
(5.6)
where A is the Hamaker constant and dp is the particle diameter. Although particle and substrate
were likely charged, if the particles get very close to the substrate then the short-range attractive
forces become significant.
Unlike the double-layer (electrostatic) interaction, the van der Waals interaction potential is
largely insensitive to variations in electrolyte concentration and pH, and it can be considered as
fixed in a first approximation. Further, the van der Waals attraction must always exceed the
electrostatic repulsion at small enough distances (D) since it is a power law interaction (i.e.,
W ∝ −1/Dn), whereas the double-layer interaction energy remains finite or rises much more
slowly as D→0.
However, when two surfaces or particles approach closer than a few nanometers, continuum
theories of attractive van der Waals and repulsive double-layer forces often fail to describe their
interaction. This is either because one or both of these continuum theories breaks down at small
separations or because other non-DLVO forces come into play. These additional forces can be
monotonically repulsive, monotonically attractive, or oscillatory, and they can be much stronger
than either of the two DLVO forces at small separations. There are also non-DLVO forces that are
due to surface-adsorbed polymers or to surface-specific (rather than solvent-specific) interactions.
Solvation forces depend not only on the properties of the intervening liquid medium but also on
the chemical and physical properties of the surfaces for example, whether they are hydrophilic or
hydrophobic, smooth or rough, amorphous or crystalline (atomically structured), homogeneous
or heterogeneous, natural or patterned, rigid or fluid-like. These factors affect the structure that
confined liquids adopt between two surfaces, which in turn affects the solvation force.
Alike several authors (37), the non-DLVO forces acting on the substrate-particle system will
be neglected in this work.

CHAPTER 6
Materials and techniques
Receding contact lines of complex liquids
The formation and the morphology of particle deposits are largely dependant on the properties of
the particles and the substrate. The properties of particle suspensions such as size (136), volume
fraction (137), hydrophilicity/hydrophobicity (138) and surface electrical charge (37) can further
the occurrence or the mitigation of the self-pinning of contact line (139) and the own deposition
over the substrate. Otherwise, the contact angle hysteresis and the surface electrical charge of
the substrate also affect the deposit formation and its morphology.
Due to the relevance of the particle properties in the coffee stain effect, in this chapter we
analyzed the following properties of the different types of particle suspensions used in this work:
particle diameter, electric state, colloidal stability, viscosity, wettability of particles and surface
tension. Over the substrates used for the deposit formation, we measured the roughness and
the contact angle hysteresis. The electrical state of the substrates was estimated from particle
electrophoretic mobility measurements. For these purposes, a wide set of techniques was employed
and the results obtained are compiled below.
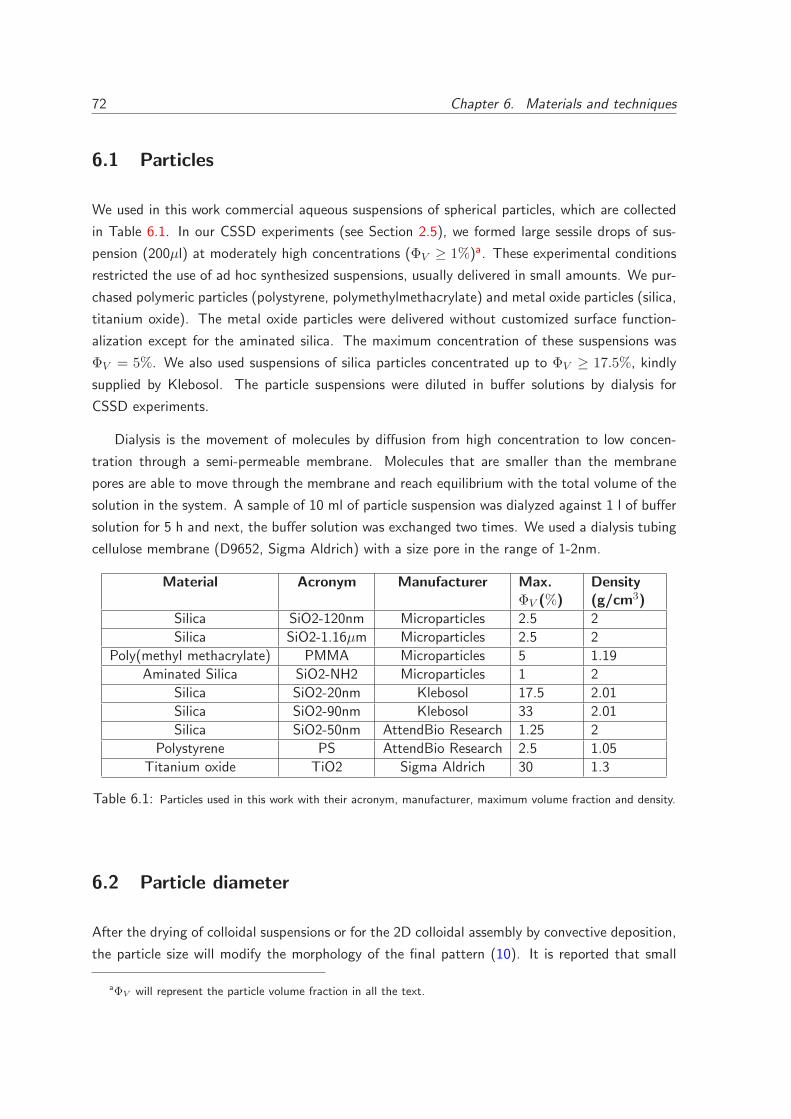
72 Chapter 6. Materials and techniques
6.1 Particles
We used in this work commercial aqueous suspensions of spherical particles, which are collected
in Table 6.1. In our CSSD experiments (see Section 2.5), we formed large sessile drops of sus-
pension (200µl) at moderately high concentrations (ΦV ≥ 1%)a. These experimental conditions
restricted the use of ad hoc synthesized suspensions, usually delivered in small amounts. We pur-
chased polymeric particles (polystyrene, polymethylmethacrylate) and metal oxide particles (silica,
titanium oxide). The metal oxide particles were delivered without customized surface function-
alization except for the aminated silica. The maximum concentration of these suspensions was
ΦV = 5%. We also used suspensions of silica particles concentrated up to ΦV ≥ 17.5%, kindly
supplied by Klebosol. The particle suspensions were diluted in buffer solutions by dialysis for
CSSD experiments.
Dialysis is the movement of molecules by diffusion from high concentration to low concen-
tration through a semi-permeable membrane. Molecules that are smaller than the membrane
pores are able to move through the membrane and reach equilibrium with the total volume of the
solution in the system. A sample of 10 ml of particle suspension was dialyzed against 1 l of buffer
solution for 5 h and next, the buffer solution was exchanged two times. We used a dialysis tubing
cellulose membrane (D9652, Sigma Aldrich) with a size pore in the range of 1-2nm.
Material Acronym Manufacturer Max.ΦV (%)
Density(g/cm3)
Silica SiO2-120nm Microparticles 2.5 2
Silica SiO2-1.16µm Microparticles 2.5 2
Poly(methyl methacrylate) PMMA Microparticles 5 1.19
Aminated Silica SiO2-NH2 Microparticles 1 2
Silica SiO2-20nm Klebosol 17.5 2.01
Silica SiO2-90nm Klebosol 33 2.01
Silica SiO2-50nm AttendBio Research 1.25 2
Polystyrene PS AttendBio Research 2.5 1.05
Titanium oxide TiO2 Sigma Aldrich 30 1.3
Table 6.1: Particles used in this work with their acronym, manufacturer, maximum volume fraction and density.
6.2 Particle diameter
After the drying of colloidal suspensions or for the 2D colloidal assembly by convective deposition,
the particle size will modify the morphology of the final pattern (10). It is reported that small
aΦV will represent the particle volume fraction in all the text.
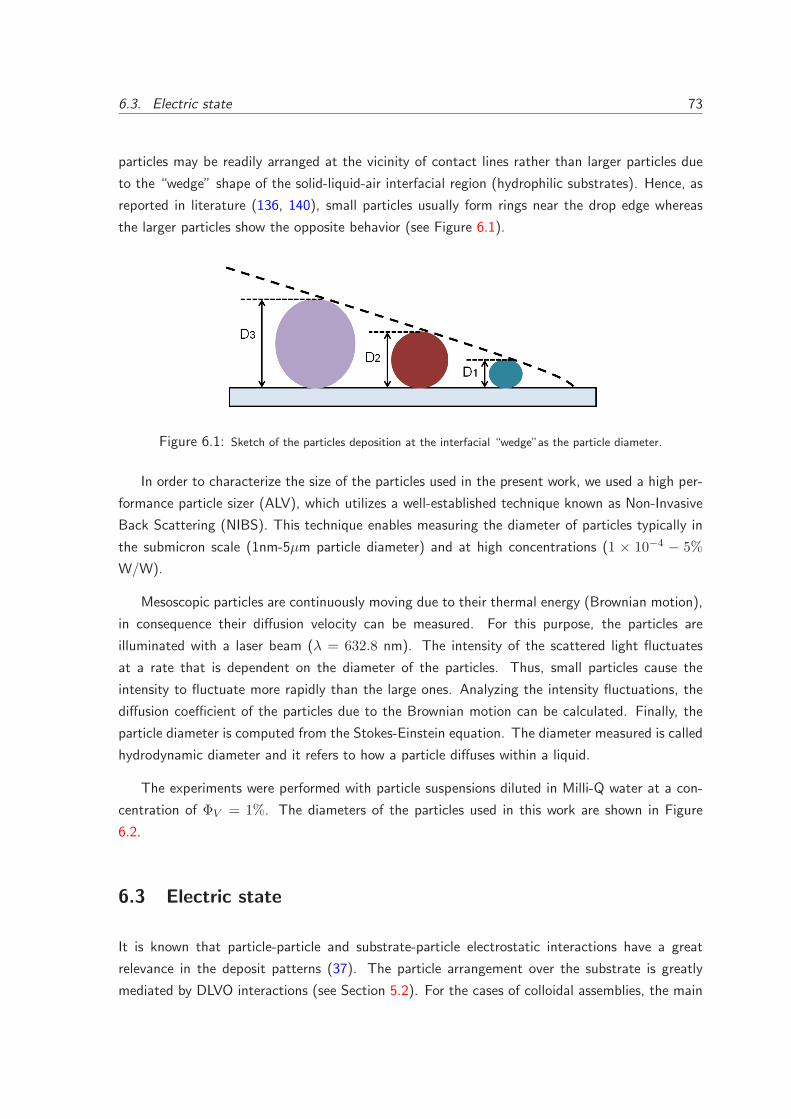
6.3. Electric state 73
particles may be readily arranged at the vicinity of contact lines rather than larger particles due
to the “wedge” shape of the solid-liquid-air interfacial region (hydrophilic substrates). Hence, as
reported in literature (136, 140), small particles usually form rings near the drop edge whereas
the larger particles show the opposite behavior (see Figure 6.1).
Figure 6.1: Sketch of the particles deposition at the interfacial “wedge”as the particle diameter.
In order to characterize the size of the particles used in the present work, we used a high per-
formance particle sizer (ALV), which utilizes a well-established technique known as Non-Invasive
Back Scattering (NIBS). This technique enables measuring the diameter of particles typically in
the submicron scale (1nm-5µm particle diameter) and at high concentrations (1 × 10⁻⁴ − 5%
W/W).
Mesoscopic particles are continuously moving due to their thermal energy (Brownian motion),
in consequence their diffusion velocity can be measured. For this purpose, the particles are
illuminated with a laser beam (λ = 632.8 nm). The intensity of the scattered light fluctuates
at a rate that is dependent on the diameter of the particles. Thus, small particles cause the
intensity to fluctuate more rapidly than the large ones. Analyzing the intensity fluctuations, the
diffusion coefficient of the particles due to the Brownian motion can be calculated. Finally, the
particle diameter is computed from the Stokes-Einstein equation. The diameter measured is called
hydrodynamic diameter and it refers to how a particle diffuses within a liquid.
The experiments were performed with particle suspensions diluted in Milli-Q water at a con-
centration of ΦV = 1%. The diameters of the particles used in this work are shown in Figure
6.2.
6.3 Electric state
It is known that particle-particle and substrate-particle electrostatic interactions have a great
relevance in the deposit patterns (37). The particle arrangement over the substrate is greatly
mediated by DLVO interactions (see Section 5.2). For the cases of colloidal assemblies, the main
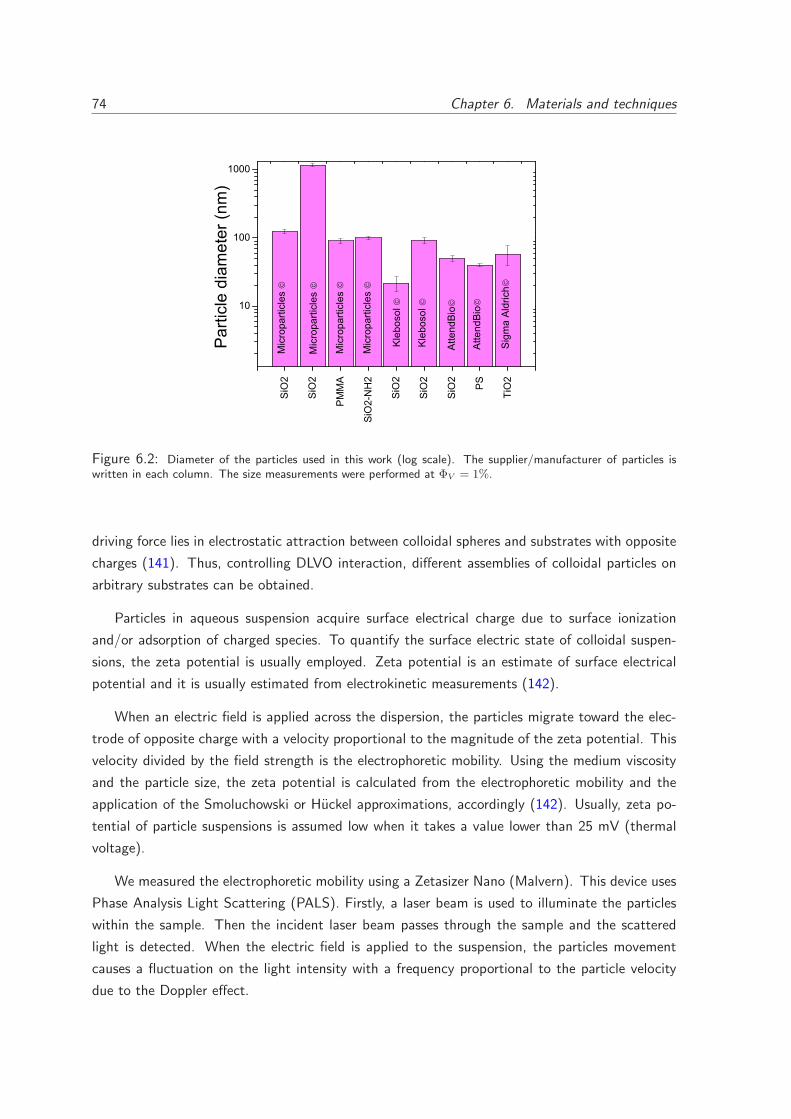
74 Chapter 6. Materials and techniques
SiO2
SiO2
PMMA
SiO2-NH2
SiO2
SiO2
SiO2
PS
TiO2
10
100
1000
Kle
boso
l
Mic
ropa
rticl
es
Mic
ropa
rticl
es
Mic
ropa
rticl
es
Sig
ma
Ald
rich
Atte
ndB
io
Atte
ndB
io
Kle
boso
l
Par
ticle
dia
met
er (n
m)
Mic
ropa
rticl
es
Figure 6.2: Diameter of the particles used in this work (log scale). The supplier/manufacturer of particles iswritten in each column. The size measurements were performed at ΦV = 1%.
driving force lies in electrostatic attraction between colloidal spheres and substrates with opposite
charges (141). Thus, controlling DLVO interaction, different assemblies of colloidal particles on
arbitrary substrates can be obtained.
Particles in aqueous suspension acquire surface electrical charge due to surface ionization
and/or adsorption of charged species. To quantify the surface electric state of colloidal suspen-
sions, the zeta potential is usually employed. Zeta potential is an estimate of surface electrical
potential and it is usually estimated from electrokinetic measurements (142).
When an electric field is applied across the dispersion, the particles migrate toward the elec-
trode of opposite charge with a velocity proportional to the magnitude of the zeta potential. This
velocity divided by the field strength is the electrophoretic mobility. Using the medium viscosity
and the particle size, the zeta potential is calculated from the electrophoretic mobility and the
application of the Smoluchowski or Huckel approximations, accordingly (142). Usually, zeta po-
tential of particle suspensions is assumed low when it takes a value lower than 25 mV (thermal
voltage).
We measured the electrophoretic mobility using a Zetasizer Nano (Malvern). This device uses
Phase Analysis Light Scattering (PALS). Firstly, a laser beam is used to illuminate the particles
within the sample. Then the incident laser beam passes through the sample and the scattered
light is detected. When the electric field is applied to the suspension, the particles movement
causes a fluctuation on the light intensity with a frequency proportional to the particle velocity
due to the Doppler effect.
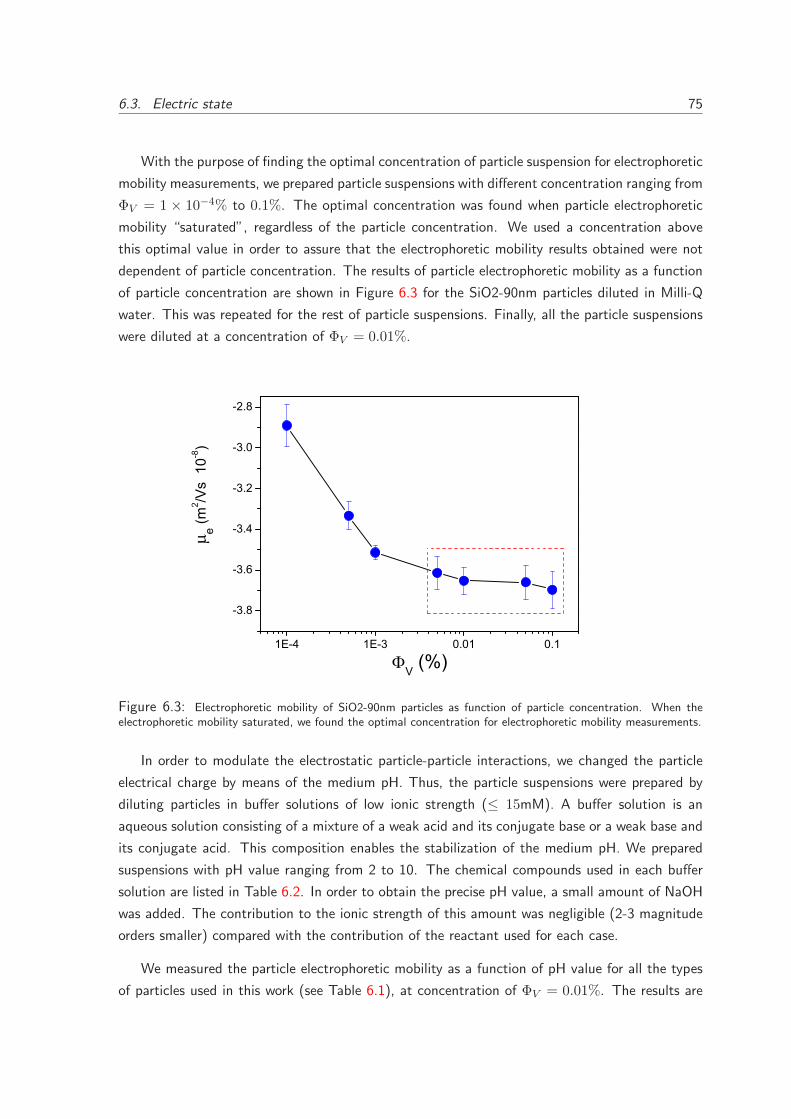
6.3. Electric state 75
With the purpose of finding the optimal concentration of particle suspension for electrophoretic
mobility measurements, we prepared particle suspensions with different concentration ranging from
ΦV = 1 × 10⁻⁴% to 0.1%. The optimal concentration was found when particle electrophoretic
mobility “saturated”, regardless of the particle concentration. We used a concentration above
this optimal value in order to assure that the electrophoretic mobility results obtained were not
dependent of particle concentration. The results of particle electrophoretic mobility as a function
of particle concentration are shown in Figure 6.3 for the SiO2-90nm particles diluted in Milli-Q
water. This was repeated for the rest of particle suspensions. Finally, all the particle suspensions
were diluted at a concentration of ΦV = 0.01%.
1E-4 1E-3 0.01 0.1
-3.8
-3.6
-3.4
-3.2
-3.0
-2.8
e (m2 /V
s 1
0-8)
V (%)
Figure 6.3: Electrophoretic mobility of SiO2-90nm particles as function of particle concentration. When theelectrophoretic mobility saturated, we found the optimal concentration for electrophoretic mobility measurements.
In order to modulate the electrostatic particle-particle interactions, we changed the particle
electrical charge by means of the medium pH. Thus, the particle suspensions were prepared by
diluting particles in buffer solutions of low ionic strength (≤ 15mM). A buffer solution is an
aqueous solution consisting of a mixture of a weak acid and its conjugate base or a weak base and
its conjugate acid. This composition enables the stabilization of the medium pH. We prepared
suspensions with pH value ranging from 2 to 10. The chemical compounds used in each buffer
solution are listed in Table 6.2. In order to obtain the precise pH value, a small amount of NaOH
was added. The contribution to the ionic strength of this amount was negligible (2-3 magnitude
orders smaller) compared with the contribution of the reactant used for each case.
We measured the particle electrophoretic mobility as a function of pH value for all the types
of particles used in this work (see Table 6.1), at concentration of ΦV = 0.01%. The results are
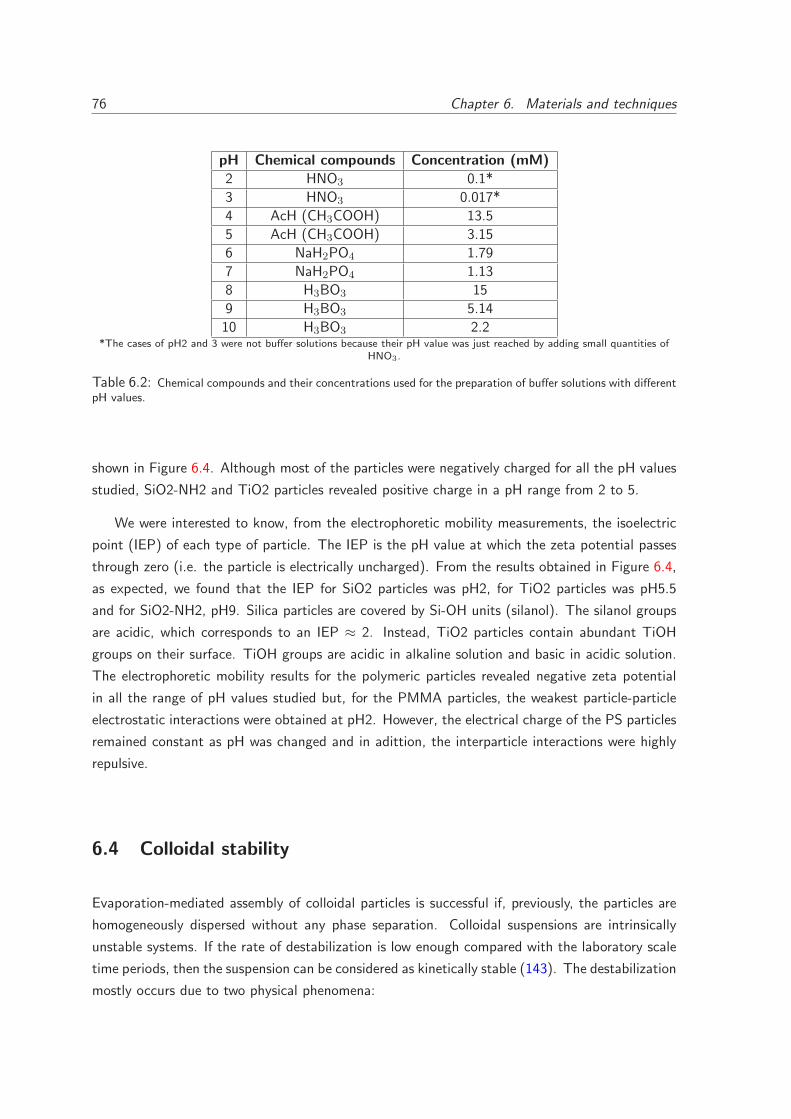
76 Chapter 6. Materials and techniques
pH Chemical compounds Concentration (mM)
2 HNO3 0.1*
3 HNO3 0.017*
4 AcH (CH3COOH) 13.5
5 AcH (CH3COOH) 3.15
6 NaH2PO4 1.79
7 NaH2PO4 1.13
8 H3BO3 15
9 H3BO3 5.14
10 H3BO3 2.2*The cases of pH2 and 3 were not buffer solutions because their pH value was just reached by adding small quantities of
HNO3.
Table 6.2: Chemical compounds and their concentrations used for the preparation of buffer solutions with differentpH values.
shown in Figure 6.4. Although most of the particles were negatively charged for all the pH values
studied, SiO2-NH2 and TiO2 particles revealed positive charge in a pH range from 2 to 5.
We were interested to know, from the electrophoretic mobility measurements, the isoelectric
point (IEP) of each type of particle. The IEP is the pH value at which the zeta potential passes
through zero (i.e. the particle is electrically uncharged). From the results obtained in Figure 6.4,
as expected, we found that the IEP for SiO2 particles was pH2, for TiO2 particles was pH5.5
and for SiO2-NH2, pH9. Silica particles are covered by Si-OH units (silanol). The silanol groups
are acidic, which corresponds to an IEP ≈ 2. Instead, TiO2 particles contain abundant TiOH
groups on their surface. TiOH groups are acidic in alkaline solution and basic in acidic solution.
The electrophoretic mobility results for the polymeric particles revealed negative zeta potential
in all the range of pH values studied but, for the PMMA particles, the weakest particle-particle
electrostatic interactions were obtained at pH2. However, the electrical charge of the PS particles
remained constant as pH was changed and in adittion, the interparticle interactions were highly
repulsive.
6.4 Colloidal stability
Evaporation-mediated assembly of colloidal particles is successful if, previously, the particles are
homogeneously dispersed without any phase separation. Colloidal suspensions are intrinsically
unstable systems. If the rate of destabilization is low enough compared with the laboratory scale
time periods, then the suspension can be considered as kinetically stable (143). The destabilization
mostly occurs due to two physical phenomena:
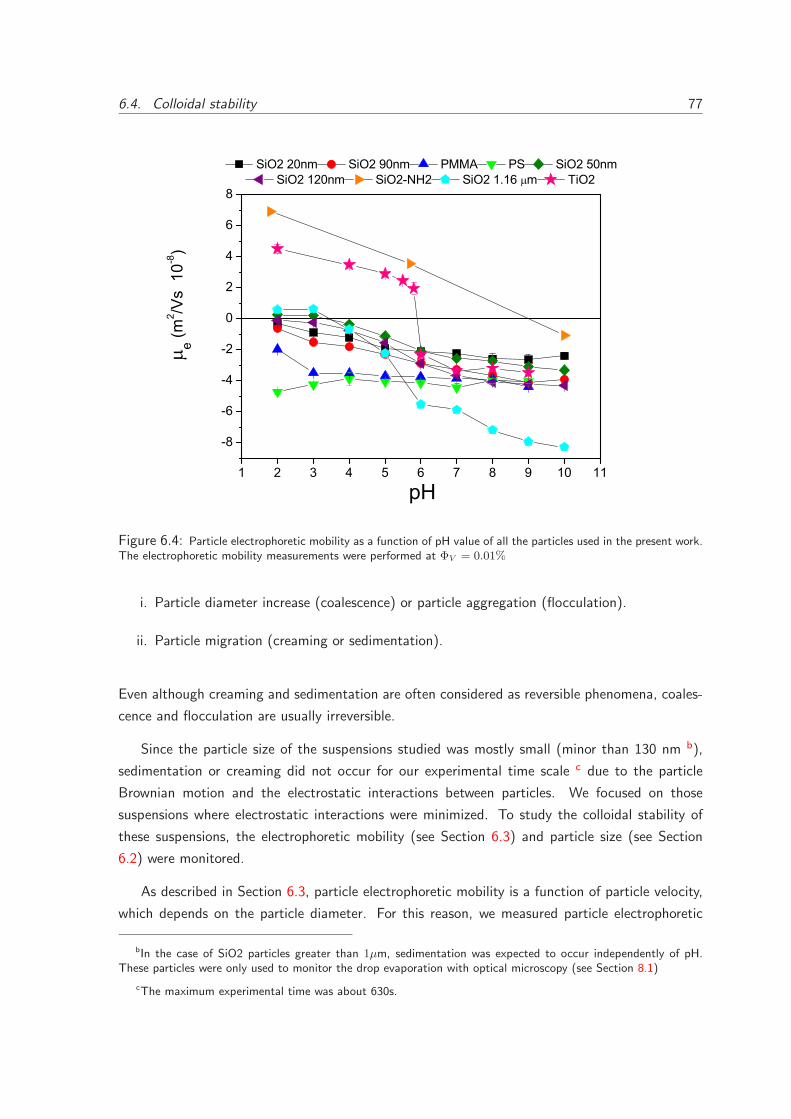
6.4. Colloidal stability 77
1 2 3 4 5 6 7 8 9 10 11
-8
-6
-4
-2
0
2
4
6
8e (m
2 /Vs
10-8
) SiO2 20nm SiO2 90nm PMMA PS SiO2 50nm
SiO2 120nm SiO2-NH2 SiO2 1.16 m TiO2
pH
Figure 6.4: Particle electrophoretic mobility as a function of pH value of all the particles used in the present work.The electrophoretic mobility measurements were performed at ΦV = 0.01%
i. Particle diameter increase (coalescence) or particle aggregation (flocculation).
ii. Particle migration (creaming or sedimentation).
Even although creaming and sedimentation are often considered as reversible phenomena, coales-
cence and flocculation are usually irreversible.
Since the particle size of the suspensions studied was mostly small (minor than 130 nm b),
sedimentation or creaming did not occur for our experimental time scale c due to the particle
Brownian motion and the electrostatic interactions between particles. We focused on those
suspensions where electrostatic interactions were minimized. To study the colloidal stability of
these suspensions, the electrophoretic mobility (see Section 6.3) and particle size (see Section
6.2) were monitored.
As described in Section 6.3, particle electrophoretic mobility is a function of particle velocity,
which depends on the particle diameter. For this reason, we measured particle electrophoretic
bIn the case of SiO2 particles greater than 1µm, sedimentation was expected to occur independently of pH.These particles were only used to monitor the drop evaporation with optical microscopy (see Section 8.1)
cThe maximum experimental time was about 630s.
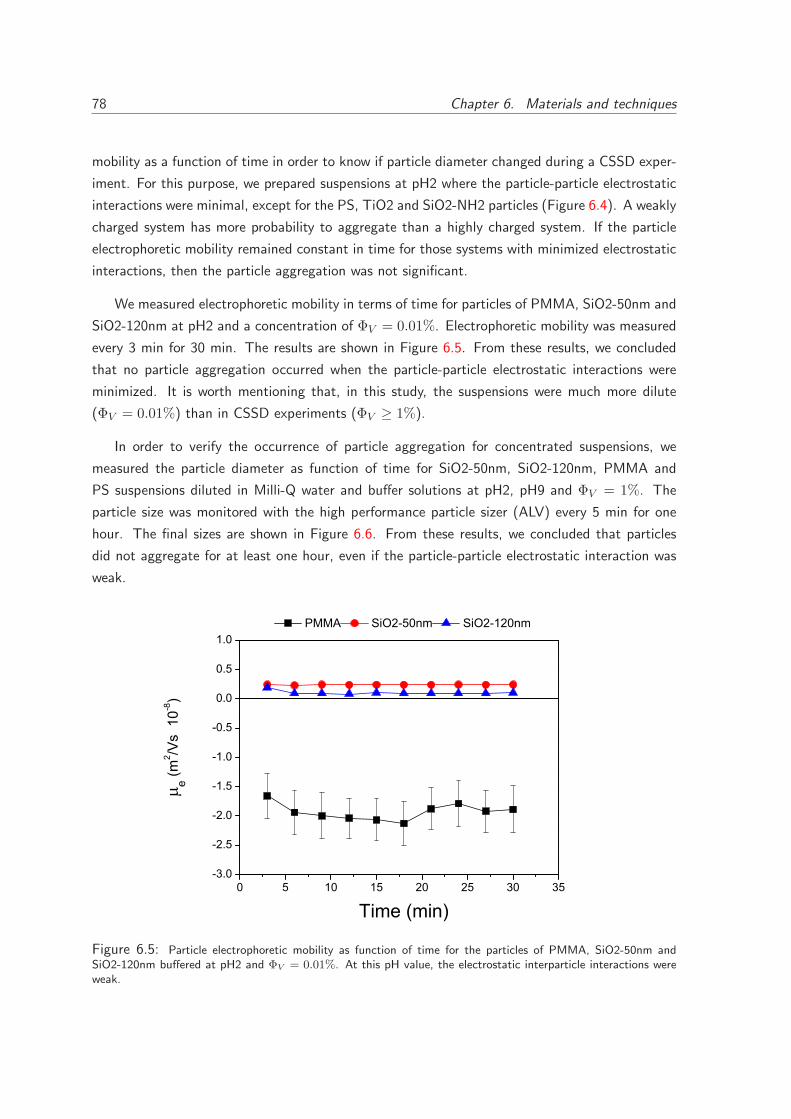
78 Chapter 6. Materials and techniques
mobility as a function of time in order to know if particle diameter changed during a CSSD exper-
iment. For this purpose, we prepared suspensions at pH2 where the particle-particle electrostatic
interactions were minimal, except for the PS, TiO2 and SiO2-NH2 particles (Figure 6.4). A weakly
charged system has more probability to aggregate than a highly charged system. If the particle
electrophoretic mobility remained constant in time for those systems with minimized electrostatic
interactions, then the particle aggregation was not significant.
We measured electrophoretic mobility in terms of time for particles of PMMA, SiO2-50nm and
SiO2-120nm at pH2 and a concentration of ΦV = 0.01%. Electrophoretic mobility was measured
every 3 min for 30 min. The results are shown in Figure 6.5. From these results, we concluded
that no particle aggregation occurred when the particle-particle electrostatic interactions were
minimized. It is worth mentioning that, in this study, the suspensions were much more dilute
(ΦV = 0.01%) than in CSSD experiments (ΦV ≥ 1%).
In order to verify the occurrence of particle aggregation for concentrated suspensions, we
measured the particle diameter as function of time for SiO2-50nm, SiO2-120nm, PMMA and
PS suspensions diluted in Milli-Q water and buffer solutions at pH2, pH9 and ΦV = 1%. The
particle size was monitored with the high performance particle sizer (ALV) every 5 min for one
hour. The final sizes are shown in Figure 6.6. From these results, we concluded that particles
did not aggregate for at least one hour, even if the particle-particle electrostatic interaction was
weak.
0 5 10 15 20 25 30 35-3.0
-2.5
-2.0
-1.5
-1.0
-0.5
0.0
0.5
1.0
e (m2 /V
s 1
0-8)
PMMA SiO2-50nm SiO2-120nm
Time (min)
Figure 6.5: Particle electrophoretic mobility as function of time for the particles of PMMA, SiO2-50nm andSiO2-120nm buffered at pH2 and ΦV = 0.01%. At this pH value, the electrostatic interparticle interactions wereweak.
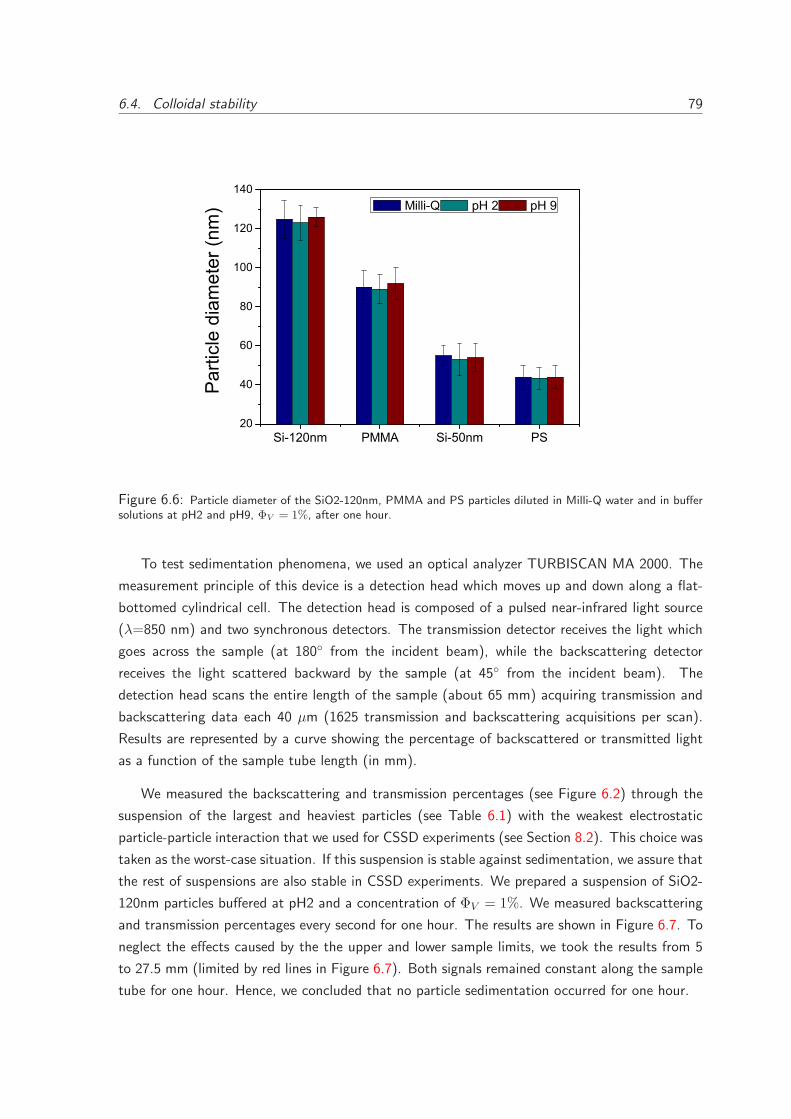
6.4. Colloidal stability 79
Si-120nm PMMA Si-50nm PS20
40
60
80
100
120
140
Par
ticle
dia
met
er (n
m) Milli-Q pH 2 pH 9
Figure 6.6: Particle diameter of the SiO2-120nm, PMMA and PS particles diluted in Milli-Q water and in buffersolutions at pH2 and pH9, ΦV = 1%, after one hour.
To test sedimentation phenomena, we used an optical analyzer TURBISCAN MA 2000. The
measurement principle of this device is a detection head which moves up and down along a flat-
bottomed cylindrical cell. The detection head is composed of a pulsed near-infrared light source
(λ=850 nm) and two synchronous detectors. The transmission detector receives the light which
goes across the sample (at 180◦ from the incident beam), while the backscattering detector
receives the light scattered backward by the sample (at 45◦ from the incident beam). The
detection head scans the entire length of the sample (about 65 mm) acquiring transmission and
backscattering data each 40 µm (1625 transmission and backscattering acquisitions per scan).
Results are represented by a curve showing the percentage of backscattered or transmitted light
as a function of the sample tube length (in mm).
We measured the backscattering and transmission percentages (see Figure 6.2) through the
suspension of the largest and heaviest particles (see Table 6.1) with the weakest electrostatic
particle-particle interaction that we used for CSSD experiments (see Section 8.2). This choice was
taken as the worst-case situation. If this suspension is stable against sedimentation, we assure that
the rest of suspensions are also stable in CSSD experiments. We prepared a suspension of SiO2-
120nm particles buffered at pH2 and a concentration of ΦV = 1%. We measured backscattering
and transmission percentages every second for one hour. The results are shown in Figure 6.7. To
neglect the effects caused by the the upper and lower sample limits, we took the results from 5
to 27.5 mm (limited by red lines in Figure 6.7). Both signals remained constant along the sample
tube for one hour. Hence, we concluded that no particle sedimentation occurred for one hour.
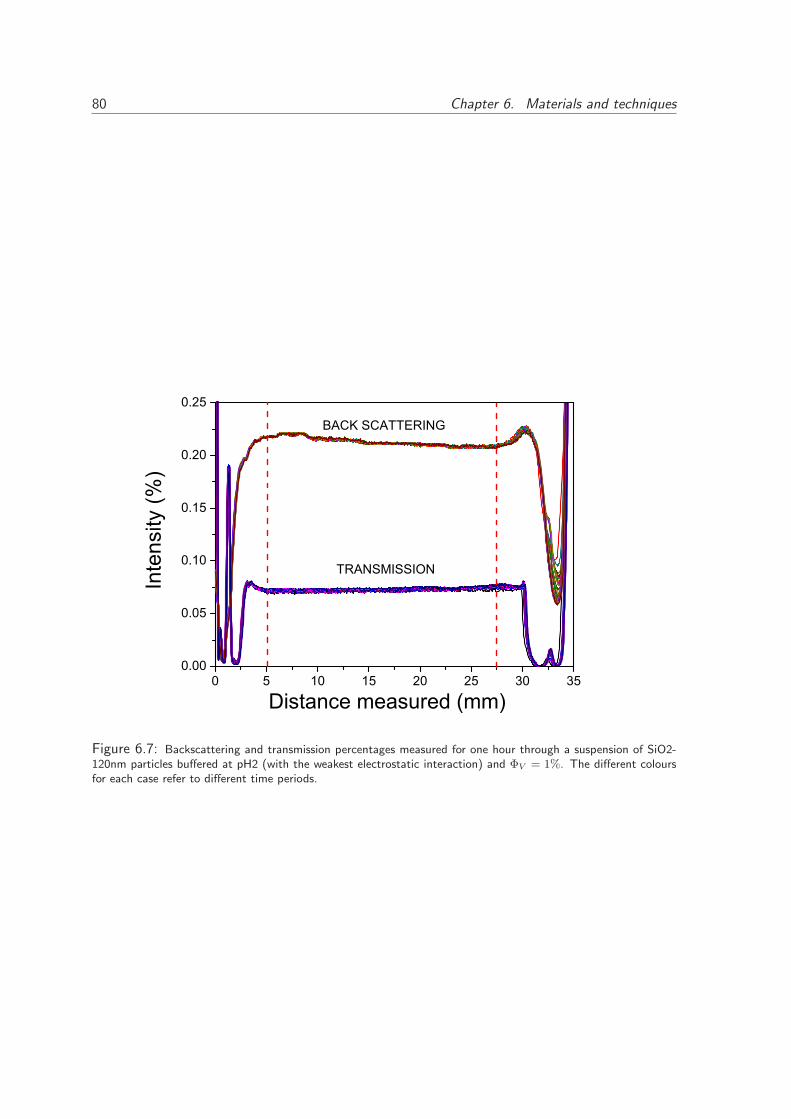
80 Chapter 6. Materials and techniques
0 5 10 15 20 25 30 350.00
0.05
0.10
0.15
0.20
0.25
Distance measured (mm)
Inte
nsity
(%)
TRANSMISSION
BACK SCATTERING
Figure 6.7: Backscattering and transmission percentages measured for one hour through a suspension of SiO2-120nm particles buffered at pH2 (with the weakest electrostatic interaction) and ΦV = 1%. The different coloursfor each case refer to different time periods.
6.5. Viscosity 81
6.5 Viscosity
Advancing and receding contact angles may be affected by the viscosity of the liquid (108). In
the case of liquids with low viscosity, surface forces are dominant and the contact angles are not
dependant of the motion rates of the three-phase contact line (see Section 1.1.4). For liquids
with high viscosity, an increment of the rate of motion causes the advancing contact angle to
increase and the receding contact angle to decrease.
In order to study if the contact angle measured in CSSD experiments was affected by the
viscosity of the particle suspensions, rheology experiments were carried out in a MCR 501 magneto-
rheometer (Anton Paar) with a parallel plate configuration at room temperature. We used a glass
plate with 40 mm diameter. To calibrate the rheometer, we used silicone oil (Sigma-Aldrich)
with a well known viscosity (20mPa s at room temperature). The viscosity of Milli-Q water and
the SiO2-90nm particle suspensions at ΦV = 1 and 8.3% was measured as function of the shear
stress. To test if the particle suspension viscosity changed with the particle electrical charge,
we measured the viscosity of the suspensions at pH2 and pH9, namely, weakly and strongly
interacting charged particles, respectively. The results show (see Figure 6.8) that the viscosity of
the particle suspension was not affected by the particle concentration nor the particle electrical
charge. Hence, the particles arrangement during the drying of the suspension seems to be not
altered by the suspension viscosity. Furthermore, the particle-particle interactions in the bulk did
not present significant changes compared with the dilute regime studied in Section 6.3. Thus, we
assured that the contact line dynamics in CSSD experiments was not affected by viscous effects.
6.6 Wettability of particles
Dynamics of three-phase contact lines of drying sessile drops will depend on the wettability
properties of substrate and nanoparticles. The amplitude of contact angle hysteresis and the
receding contact angle of the substrate will determine the transition of an evaporating drop from
the situation of static contact line to moving contact line with constant contact angle. If the
drop contains nanoparticles, the wettability contrast between substrate and particle will also affect
triple line motion through the self-pinning effect (see Section 5.1).
We define the wettabillity contrast (∆θ) as the difference between the substrate receding
contact angle and the particle receding contact angle (∆θ = θs − θp). We selected the receding
contact angle because during CSSD experiments and in general, during any suspension drying
process, the contact line motion is firstly lead by the receding contact angle of the substrate and
secondly, it is affected by the receding contact angle of the particle.
It is well known that measuring the contact angle of mesoscopic particles is a very hard
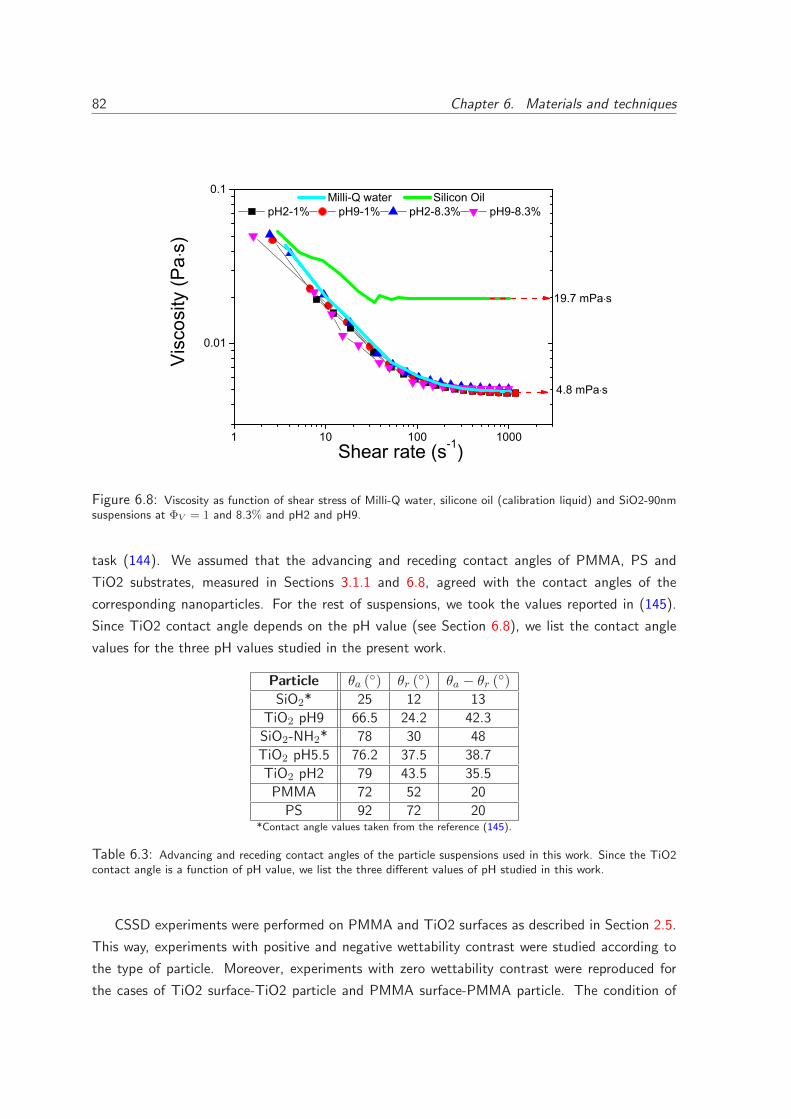
82 Chapter 6. Materials and techniques
1 10 100 1000
0.01
0.1
Shear rate (s-1)
4.8 mPa s
Vis
cosi
ty (P
as)
Milli-Q water Silicon Oil pH2-1% pH9-1% pH2-8.3% pH9-8.3%
19.7 mPa s
Figure 6.8: Viscosity as function of shear stress of Milli-Q water, silicone oil (calibration liquid) and SiO2-90nmsuspensions at ΦV = 1 and 8.3% and pH2 and pH9.
task (144). We assumed that the advancing and receding contact angles of PMMA, PS and
TiO2 substrates, measured in Sections 3.1.1 and 6.8, agreed with the contact angles of the
corresponding nanoparticles. For the rest of suspensions, we took the values reported in (145).
Since TiO2 contact angle depends on the pH value (see Section 6.8), we list the contact angle
values for the three pH values studied in the present work.
Particle θa (◦) θr (◦) θa − θr (◦)
SiO2* 25 12 13
TiO2 pH9 66.5 24.2 42.3
SiO2-NH2* 78 30 48
TiO2 pH5.5 76.2 37.5 38.7
TiO2 pH2 79 43.5 35.5
PMMA 72 52 20
PS 92 72 20*Contact angle values taken from the reference (145).
Table 6.3: Advancing and receding contact angles of the particle suspensions used in this work. Since the TiO2contact angle is a function of pH value, we list the three different values of pH studied in this work.
CSSD experiments were performed on PMMA and TiO2 surfaces as described in Section 2.5.
This way, experiments with positive and negative wettability contrast were studied according to
the type of particle. Moreover, experiments with zero wettability contrast were reproduced for
the cases of TiO2 surface-TiO2 particle and PMMA surface-PMMA particle. The condition of
6.7. Surface tension 83
zero wettability contrast might be arguable due to the different origin of particle and substrate.
For example, in the TiO2-TiO2 system the particles were composed of titania (titanium oxide)
whereas the substrate was pure metallic titanium, immediately oxidized. Similarly, the PMMA
particles were prepared by synthesis and the PMMA sheets by extrusion.
6.7 Surface tension
Adsorption of nanoparticles at the liquid-air interface of drying drops may change the evaporation
rate. The surface tension measurement enables to detect if the nanoparticles prefer to diffuse
towards the water-air interface rather than to remain in the drop bulk. It is worth mentioning that
the surface tension of a sessile drop of pure liquid does not affect the motion of contact line, which
depends on the wettability properties of the substrate. However, if there were nanoparticles at the
liquid-air interface very close to the triple line then the solid-liquid interactions would change and
so, the contact angle. Moreover, the arrangement of nanoparticles at the vicinity of contact lines
might be altered due to the interactions with the nanoparticles placed at the liquid-air interface.
We monitored the surface tension of static pendant drops of the nanoparticles suspensions
studied in this work in terms of time. The experimental device was the same than used for contact
angle measurements (see Section 2.3).
To check if water surface tension changed with the pH value, a 25µl pendant drop of buffer
solution was formed at a constant flow rate of 0.4 µl/s, and its surface tension was measured for
400 s. Each experiment was repeated 5 times. Results for surface tension (symbols) and drop
volume (lines) of buffered solutions at pH2, pH5.5 and pH9 values are shown in Figure 6.9. The
drop formation took long 60 s, as illustrated in Figure 6.9 before the vertical dashed line. Once
the final drop volume was reached then the surface tension held a constant value. We observed
that the water surface tension did not change with the pH value.
To study adsorption of nanoparticles at the liquid-air interface, we prepared particle suspen-
sions buffered at pH2 and pH9 values with a concentration of ΦV = 1%. At these values, the
particle-particle electrostatic interactions were mostly weak and strong, respectively. The density
of particle suspensions was not measured, instead we calculated it as:
ρs = ρpΦV + ρw (1 − ΦV )
where ρs, ρp and ρw are the densities of the suspension, the particle and the pure water
respectively. We chose PMMA, PS and SiO2-120nm particles due to their different hydrophilicity
(see Table 6.3). We monitored the surface tension of 25µl pendant drops of the particle sus-
pensions above mentioned. The results are presented in Figure 6.10. The initial value of surface
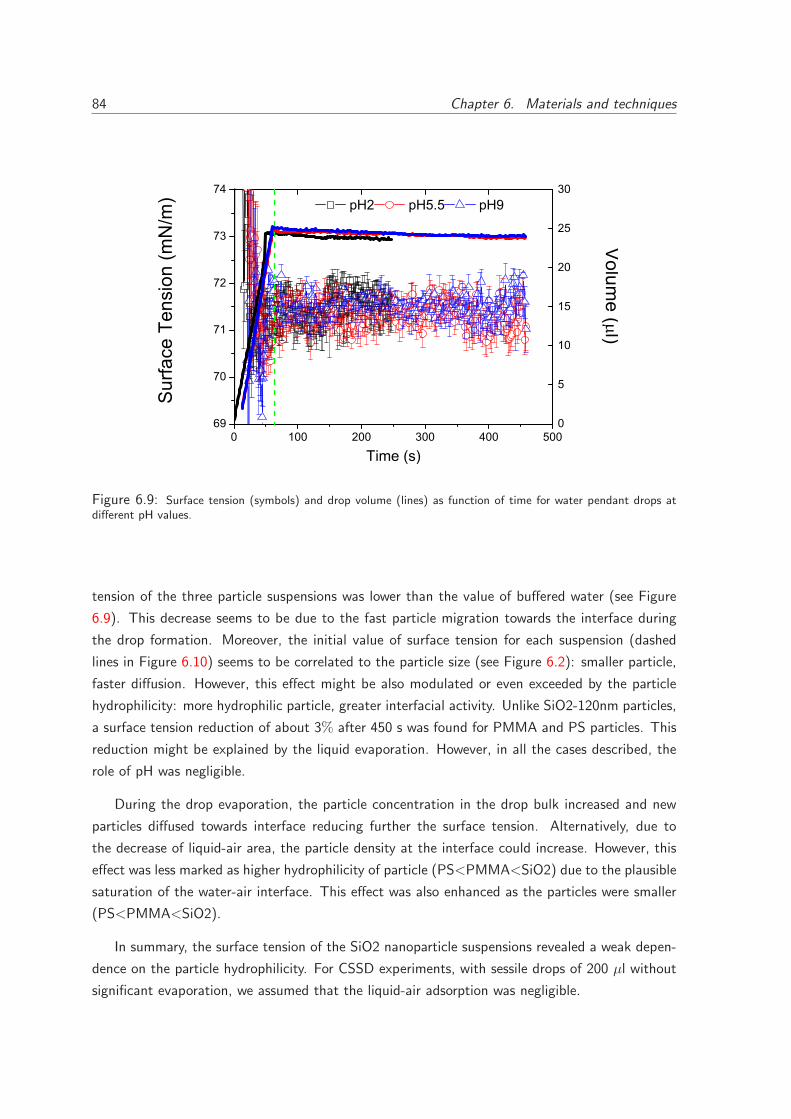
84 Chapter 6. Materials and techniques
0 100 200 300 400 50069
70
71
72
73
74V
olume (
l)S
urfa
ce T
ensi
on (m
N/m
)
pH2 pH5.5 pH9
Time (s)
0
5
10
15
20
25
30
Figure 6.9: Surface tension (symbols) and drop volume (lines) as function of time for water pendant drops atdifferent pH values.
tension of the three particle suspensions was lower than the value of buffered water (see Figure
6.9). This decrease seems to be due to the fast particle migration towards the interface during
the drop formation. Moreover, the initial value of surface tension for each suspension (dashed
lines in Figure 6.10) seems to be correlated to the particle size (see Figure 6.2): smaller particle,
faster diffusion. However, this effect might be also modulated or even exceeded by the particle
hydrophilicity: more hydrophilic particle, greater interfacial activity. Unlike SiO2-120nm particles,
a surface tension reduction of about 3% after 450 s was found for PMMA and PS particles. This
reduction might be explained by the liquid evaporation. However, in all the cases described, the
role of pH was negligible.
During the drop evaporation, the particle concentration in the drop bulk increased and new
particles diffused towards interface reducing further the surface tension. Alternatively, due to
the decrease of liquid-air area, the particle density at the interface could increase. However, this
effect was less marked as higher hydrophilicity of particle (PS<PMMA<SiO2) due to the plausible
saturation of the water-air interface. This effect was also enhanced as the particles were smaller
(PS<PMMA<SiO2).
In summary, the surface tension of the SiO2 nanoparticle suspensions revealed a weak depen-
dence on the particle hydrophilicity. For CSSD experiments, with sessile drops of 200 µl without
significant evaporation, we assumed that the liquid-air adsorption was negligible.
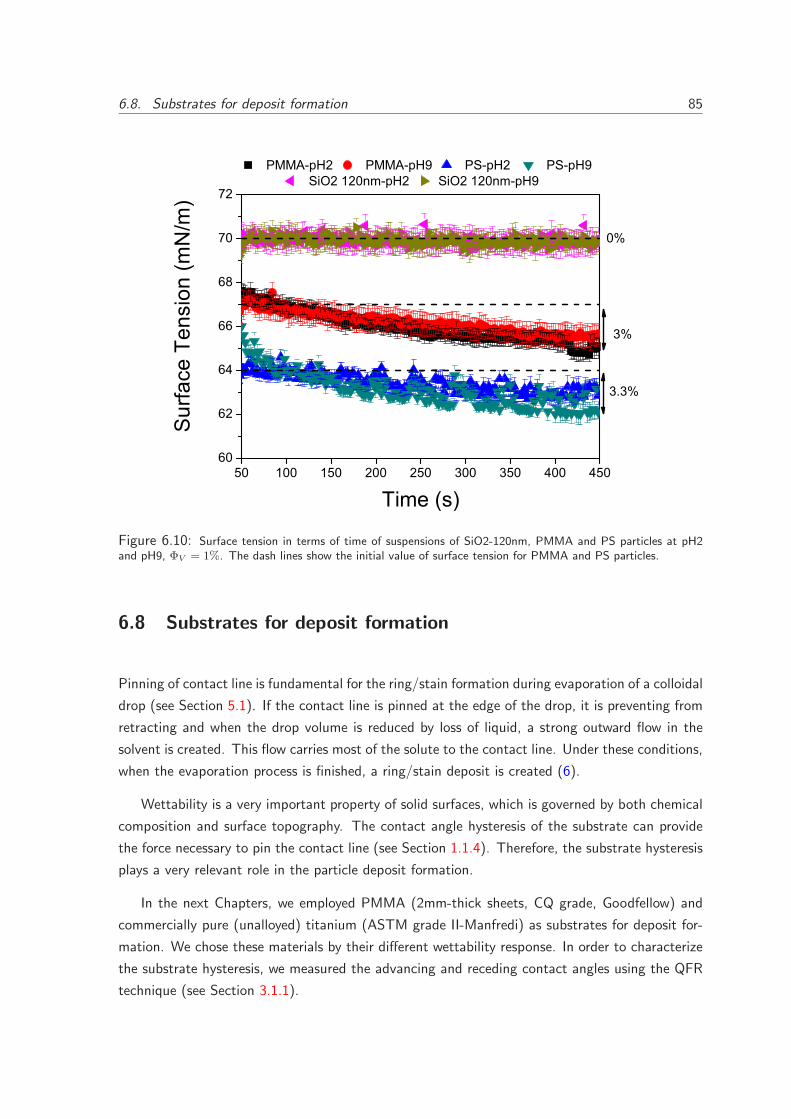
6.8. Substrates for deposit formation 85
50 100 150 200 250 300 350 400 45060
62
64
66
68
70
72
3%
3.3%
Sur
face
Ten
sion
(mN
/m)
PMMA-pH2 PMMA-pH9 PS-pH2 PS-pH9
SiO2 120nm-pH2 SiO2 120nm-pH9
Time (s)
0%
Figure 6.10: Surface tension in terms of time of suspensions of SiO2-120nm, PMMA and PS particles at pH2and pH9, ΦV = 1%. The dash lines show the initial value of surface tension for PMMA and PS particles.
6.8 Substrates for deposit formation
Pinning of contact line is fundamental for the ring/stain formation during evaporation of a colloidal
drop (see Section 5.1). If the contact line is pinned at the edge of the drop, it is preventing from
retracting and when the drop volume is reduced by loss of liquid, a strong outward flow in the
solvent is created. This flow carries most of the solute to the contact line. Under these conditions,
when the evaporation process is finished, a ring/stain deposit is created (6).
Wettability is a very important property of solid surfaces, which is governed by both chemical
composition and surface topography. The contact angle hysteresis of the substrate can provide
the force necessary to pin the contact line (see Section 1.1.4). Therefore, the substrate hysteresis
plays a very relevant role in the particle deposit formation.
In the next Chapters, we employed PMMA (2mm-thick sheets, CQ grade, Goodfellow) and
commercially pure (unalloyed) titanium (ASTM grade II-Manfredi) as substrates for deposit for-
mation. We chose these materials by their different wettability response. In order to characterize
the substrate hysteresis, we measured the advancing and receding contact angles using the QFR
technique (see Section 3.1.1).
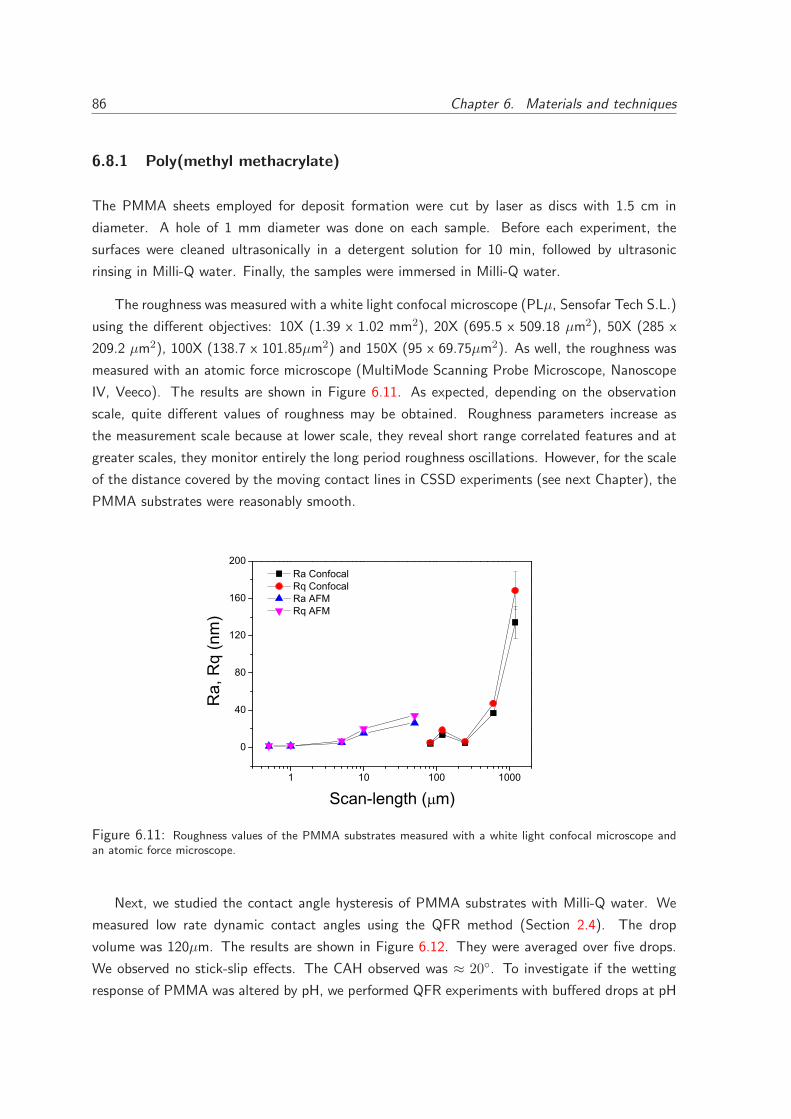
86 Chapter 6. Materials and techniques
6.8.1 Poly(methyl methacrylate)
The PMMA sheets employed for deposit formation were cut by laser as discs with 1.5 cm in
diameter. A hole of 1 mm diameter was done on each sample. Before each experiment, the
surfaces were cleaned ultrasonically in a detergent solution for 10 min, followed by ultrasonic
rinsing in Milli-Q water. Finally, the samples were immersed in Milli-Q water.
The roughness was measured with a white light confocal microscope (PLµ, Sensofar Tech S.L.)
using the different objectives: 10X (1.39 x 1.02 mm2), 20X (695.5 x 509.18 µm2), 50X (285 x
209.2 µm2), 100X (138.7 x 101.85µm2) and 150X (95 x 69.75µm2). As well, the roughness was
measured with an atomic force microscope (MultiMode Scanning Probe Microscope, Nanoscope
IV, Veeco). The results are shown in Figure 6.11. As expected, depending on the observation
scale, quite different values of roughness may be obtained. Roughness parameters increase as
the measurement scale because at lower scale, they reveal short range correlated features and at
greater scales, they monitor entirely the long period roughness oscillations. However, for the scale
of the distance covered by the moving contact lines in CSSD experiments (see next Chapter), the
PMMA substrates were reasonably smooth.
1 10 100 1000
0
40
80
120
160
200 Ra Confocal Rq Confocal Ra AFM Rq AFM
Ra,
Rq
(nm
)
Scan-length ( m)
Figure 6.11: Roughness values of the PMMA substrates measured with a white light confocal microscope andan atomic force microscope.
Next, we studied the contact angle hysteresis of PMMA substrates with Milli-Q water. We
measured low rate dynamic contact angles using the QFR method (Section 2.4). The drop
volume was 120µm. The results are shown in Figure 6.12. They were averaged over five drops.
We observed no stick-slip effects. The CAH observed was ≈ 20◦. To investigate if the wetting
response of PMMA was altered by pH, we performed QFR experiments with buffered drops at pH
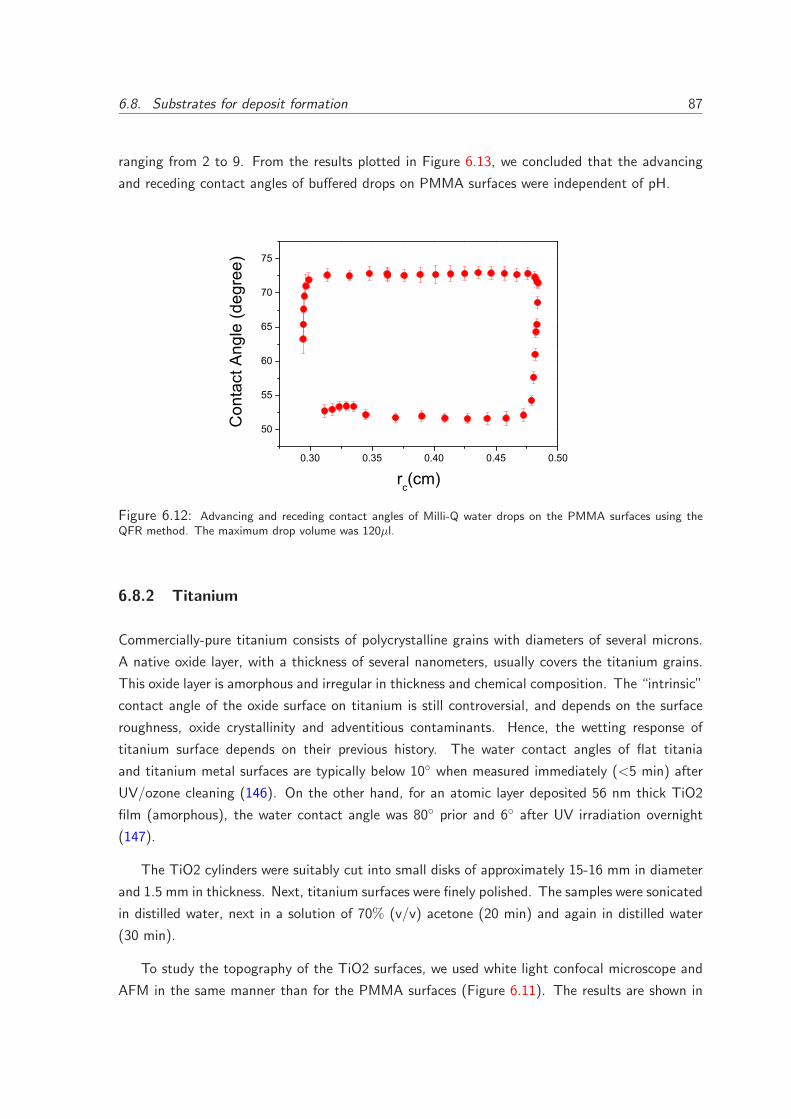
6.8. Substrates for deposit formation 87
ranging from 2 to 9. From the results plotted in Figure 6.13, we concluded that the advancing
and receding contact angles of buffered drops on PMMA surfaces were independent of pH.
0.30 0.35 0.40 0.45 0.50
50
55
60
65
70
75
Con
tact
Ang
le (d
egre
e)
rc(cm)
Figure 6.12: Advancing and receding contact angles of Milli-Q water drops on the PMMA surfaces using theQFR method. The maximum drop volume was 120µl.
6.8.2 Titanium
Commercially-pure titanium consists of polycrystalline grains with diameters of several microns.
A native oxide layer, with a thickness of several nanometers, usually covers the titanium grains.
This oxide layer is amorphous and irregular in thickness and chemical composition. The “intrinsic”
contact angle of the oxide surface on titanium is still controversial, and depends on the surface
roughness, oxide crystallinity and adventitious contaminants. Hence, the wetting response of
titanium surface depends on their previous history. The water contact angles of flat titania
and titanium metal surfaces are typically below 10◦ when measured immediately (<5 min) after
UV/ozone cleaning (146). On the other hand, for an atomic layer deposited 56 nm thick TiO2
film (amorphous), the water contact angle was 80◦ prior and 6◦ after UV irradiation overnight
(147).
The TiO2 cylinders were suitably cut into small disks of approximately 15-16 mm in diameter
and 1.5 mm in thickness. Next, titanium surfaces were finely polished. The samples were sonicated
in distilled water, next in a solution of 70% (v/v) acetone (20 min) and again in distilled water
(30 min).
To study the topography of the TiO2 surfaces, we used white light confocal microscope and
AFM in the same manner than for the PMMA surfaces (Figure 6.11). The results are shown in
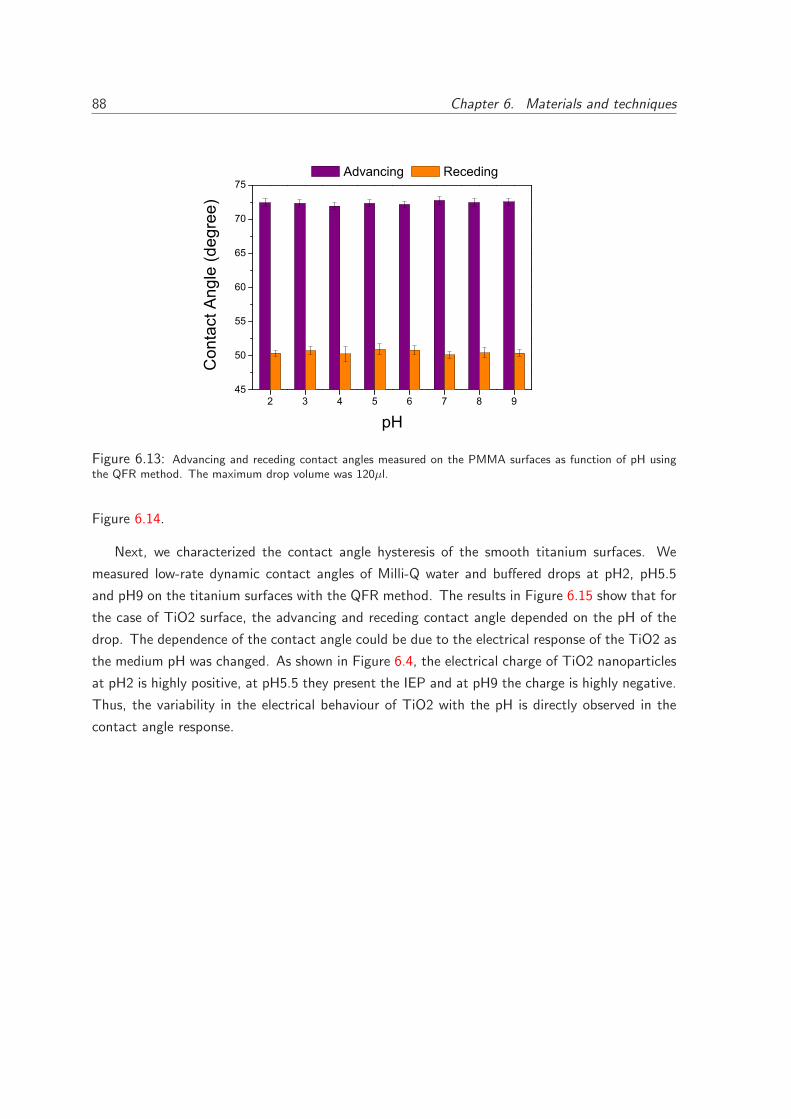
88 Chapter 6. Materials and techniques
2 3 4 5 6 7 8 945
50
55
60
65
70
75
Con
tact
Ang
le (d
egre
e)
pH
Advancing Receding
Figure 6.13: Advancing and receding contact angles measured on the PMMA surfaces as function of pH usingthe QFR method. The maximum drop volume was 120µl.
Figure 6.14.
Next, we characterized the contact angle hysteresis of the smooth titanium surfaces. We
measured low-rate dynamic contact angles of Milli-Q water and buffered drops at pH2, pH5.5
and pH9 on the titanium surfaces with the QFR method. The results in Figure 6.15 show that for
the case of TiO2 surface, the advancing and receding contact angle depended on the pH of the
drop. The dependence of the contact angle could be due to the electrical response of the TiO2 as
the medium pH was changed. As shown in Figure 6.4, the electrical charge of TiO2 nanoparticles
at pH2 is highly positive, at pH5.5 they present the IEP and at pH9 the charge is highly negative.
Thus, the variability in the electrical behaviour of TiO2 with the pH is directly observed in the
contact angle response.
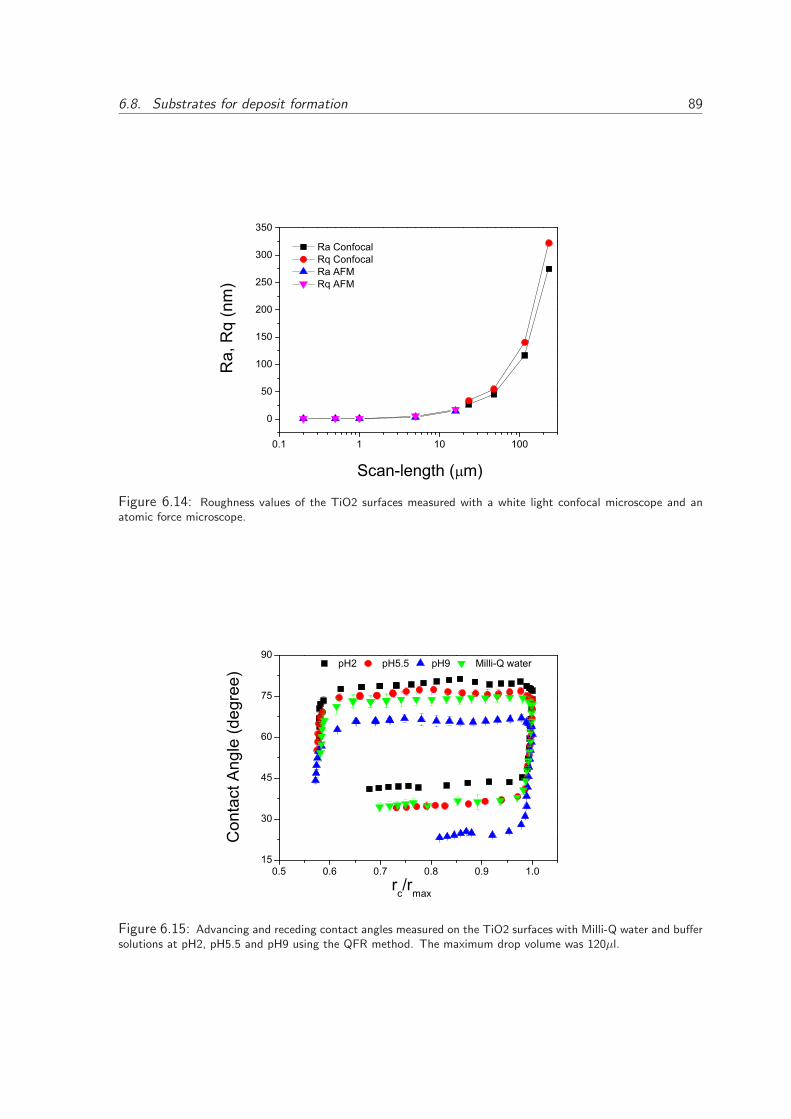
6.8. Substrates for deposit formation 89
0.1 1 10 100
0
50
100
150
200
250
300
350
Scan-length ( m)
Ra,
Rq
(nm
) Ra Confocal Rq Confocal Ra AFM Rq AFM
Figure 6.14: Roughness values of the TiO2 surfaces measured with a white light confocal microscope and anatomic force microscope.
0.5 0.6 0.7 0.8 0.9 1.015
30
45
60
75
90
rc/rmax
pH2 pH5.5 pH9 Milli-Q water
C
onta
ct A
ngle
(deg
ree)
Figure 6.15: Advancing and receding contact angles measured on the TiO2 surfaces with Milli-Q water and buffersolutions at pH2, pH5.5 and pH9 using the QFR method. The maximum drop volume was 120µl.
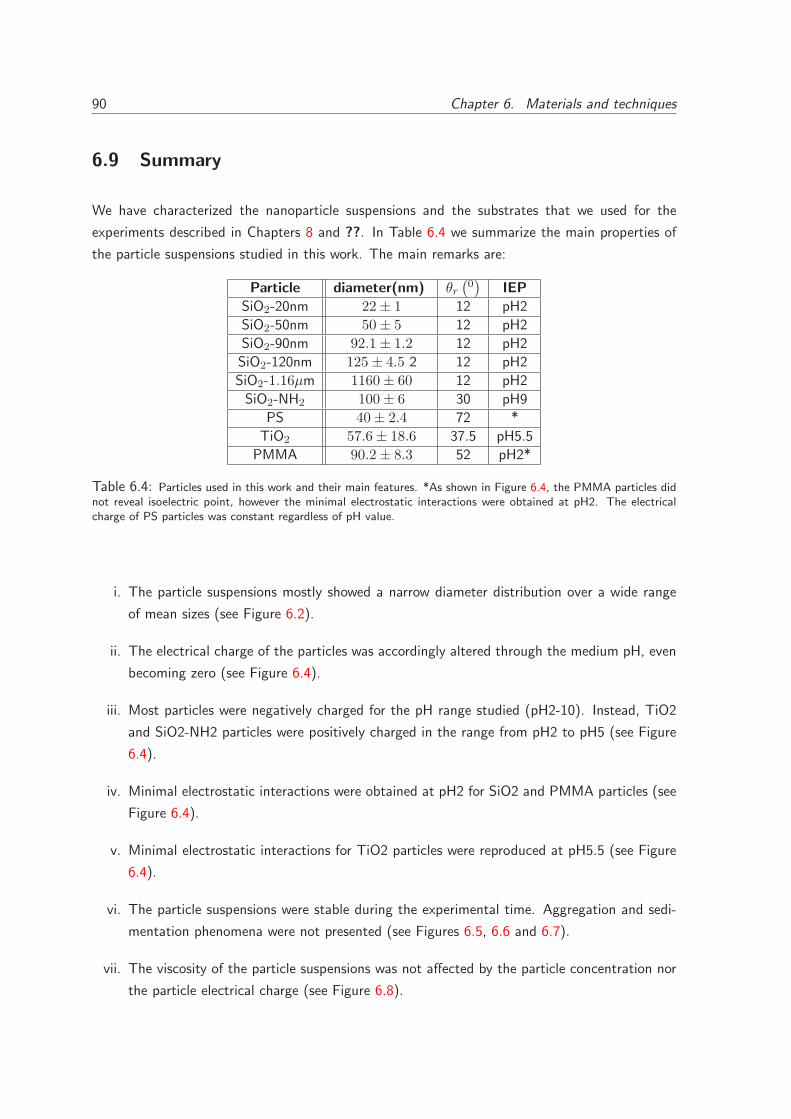
90 Chapter 6. Materials and techniques
6.9 Summary
We have characterized the nanoparticle suspensions and the substrates that we used for the
experiments described in Chapters 8 and ??. In Table 6.4 we summarize the main properties of
the particle suspensions studied in this work. The main remarks are:
Particle diameter(nm) θr
(
0)
IEP
SiO2-20nm 22 ± 1 12 pH2
SiO2-50nm 50 ± 5 12 pH2
SiO2-90nm 92.1 ± 1.2 12 pH2
SiO2-120nm 125 ± 4.5 2 12 pH2
SiO2-1.16µm 1160 ± 60 12 pH2
SiO2-NH2 100 ± 6 30 pH9
PS 40 ± 2.4 72 *
TiO2 57.6 ± 18.6 37.5 pH5.5
PMMA 90.2 ± 8.3 52 pH2*
Table 6.4: Particles used in this work and their main features. *As shown in Figure 6.4, the PMMA particles didnot reveal isoelectric point, however the minimal electrostatic interactions were obtained at pH2. The electricalcharge of PS particles was constant regardless of pH value.
i. The particle suspensions mostly showed a narrow diameter distribution over a wide range
of mean sizes (see Figure 6.2).
ii. The electrical charge of the particles was accordingly altered through the medium pH, even
becoming zero (see Figure 6.4).
iii. Most particles were negatively charged for the pH range studied (pH2-10). Instead, TiO2
and SiO2-NH2 particles were positively charged in the range from pH2 to pH5 (see Figure
6.4).
iv. Minimal electrostatic interactions were obtained at pH2 for SiO2 and PMMA particles (see
Figure 6.4).
v. Minimal electrostatic interactions for TiO2 particles were reproduced at pH5.5 (see Figure
6.4).
vi. The particle suspensions were stable during the experimental time. Aggregation and sedi-
mentation phenomena were not presented (see Figures 6.5, 6.6 and 6.7).
vii. The viscosity of the particle suspensions was not affected by the particle concentration nor
the particle electrical charge (see Figure 6.8).
6.9. Summary 91
viii. PS particles revealed the lower hydrophilicity and SiO2 particles, the higher hydrophilicity
(see Table 6.3).
ix. Liquid-air interface was not significantly affected by the particle suspensions (see Figure
6.10).
x. The advancing and receding contact angles of the PMMA surfaces were independent of the
medium pH (see Figure 6.13).
xi. The advancing and receding contact angles of the TiO2 surfaces depended on the medium
pH (see Figure 6.15 and Table 6.3).

CHAPTER 7
Evaporating drops and shrinking drops of
nanoparticle suspensions
Deegan et al (6) found that there are two necessary conditions for ring like deposits formation:
contact line pinning and evaporation from the edge of the drop . When one of these conditions is
relaxed, the final deposit is uniform or a central spot is observed (see Section 5.1). For a drop in
which the liquid is removed from the center of the drop (shrinking drop), it has been theoretically
proved that, instead of a solute ring, a uniform deposit of particles should be formed (148). This
type of “evaporation” does not induce a flow of liquid toward the contact line. Since the loss
of liquid is from the center of the drop, then an inward flow is developed and the “evaporated”
liquid is replenished in the bulk. The CSSD technique (described in Section 2.5) fulfills one of the
two necessary conditions for ring-like deposit formation: pinning of contact line. However, the
loss of liquid is not performed from the contact line but from the bulk. Under these conditions,
the formation of ring-like deposits are not expected to occur.
In order to study the contact line dynamics of freely-evaporating drops of nanoparticle sus-
pensions, we performed evaporation experiments with SiO2-20nm, SiO2-50nm, SiO2-120nm and
PMMA suspensions on PMMA surfaces. The suspensions were diluted in Milli-Q water (at free
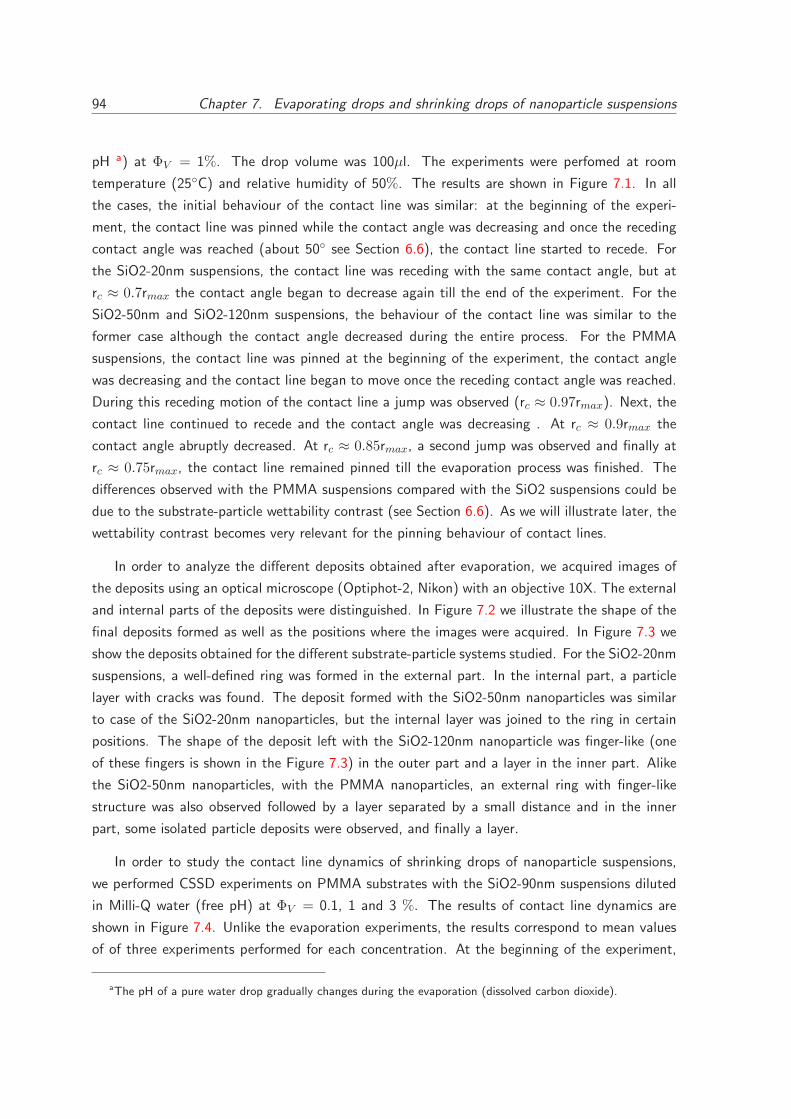
94 Chapter 7. Evaporating drops and shrinking drops of nanoparticle suspensions
pH a) at ΦV = 1%. The drop volume was 100µl. The experiments were perfomed at room
temperature (25◦C) and relative humidity of 50%. The results are shown in Figure 7.1. In all
the cases, the initial behaviour of the contact line was similar: at the beginning of the experi-
ment, the contact line was pinned while the contact angle was decreasing and once the receding
contact angle was reached (about 50◦ see Section 6.6), the contact line started to recede. For
the SiO2-20nm suspensions, the contact line was receding with the same contact angle, but at
rc ≈ 0.7rmax the contact angle began to decrease again till the end of the experiment. For the
SiO2-50nm and SiO2-120nm suspensions, the behaviour of the contact line was similar to the
former case although the contact angle decreased during the entire process. For the PMMA
suspensions, the contact line was pinned at the beginning of the experiment, the contact angle
was decreasing and the contact line began to move once the receding contact angle was reached.
During this receding motion of the contact line a jump was observed (rc ≈ 0.97rmax). Next, the
contact line continued to recede and the contact angle was decreasing . At rc ≈ 0.9rmax the
contact angle abruptly decreased. At rc ≈ 0.85rmax, a second jump was observed and finally at
rc ≈ 0.75rmax, the contact line remained pinned till the evaporation process was finished. The
differences observed with the PMMA suspensions compared with the SiO2 suspensions could be
due to the substrate-particle wettability contrast (see Section 6.6). As we will illustrate later, the
wettability contrast becomes very relevant for the pinning behaviour of contact lines.
In order to analyze the different deposits obtained after evaporation, we acquired images of
the deposits using an optical microscope (Optiphot-2, Nikon) with an objective 10X. The external
and internal parts of the deposits were distinguished. In Figure 7.2 we illustrate the shape of the
final deposits formed as well as the positions where the images were acquired. In Figure 7.3 we
show the deposits obtained for the different substrate-particle systems studied. For the SiO2-20nm
suspensions, a well-defined ring was formed in the external part. In the internal part, a particle
layer with cracks was found. The deposit formed with the SiO2-50nm nanoparticles was similar
to case of the SiO2-20nm nanoparticles, but the internal layer was joined to the ring in certain
positions. The shape of the deposit left with the SiO2-120nm nanoparticle was finger-like (one
of these fingers is shown in the Figure 7.3) in the outer part and a layer in the inner part. Alike
the SiO2-50nm nanoparticles, with the PMMA nanoparticles, an external ring with finger-like
structure was also observed followed by a layer separated by a small distance and in the inner
part, some isolated particle deposits were observed, and finally a layer.
In order to study the contact line dynamics of shrinking drops of nanoparticle suspensions,
we performed CSSD experiments on PMMA substrates with the SiO2-90nm suspensions diluted
in Milli-Q water (free pH) at ΦV = 0.1, 1 and 3 %. The results of contact line dynamics are
shown in Figure 7.4. Unlike the evaporation experiments, the results correspond to mean values
of of three experiments performed for each concentration. At the beginning of the experiment,
aThe pH of a pure water drop gradually changes during the evaporation (dissolved carbon dioxide).
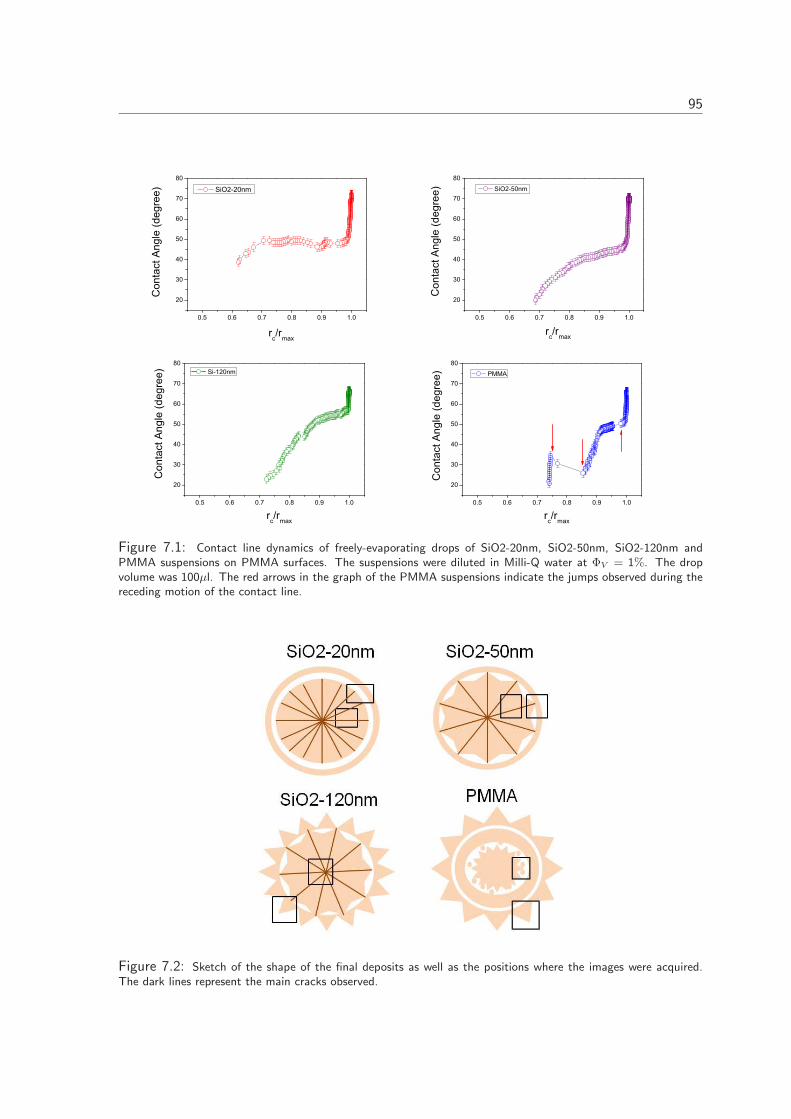
95
0.5 0.6 0.7 0.8 0.9 1.0
20
30
40
50
60
70
80
rc/rmax
Con
tact
Ang
le (d
egre
e) SiO2-20nm
0.5 0.6 0.7 0.8 0.9 1.0
20
30
40
50
60
70
80
C
onta
ct A
ngle
(deg
ree)
rc/rmax
SiO2-50nm
0.5 0.6 0.7 0.8 0.9 1.0
20
30
40
50
60
70
80
Con
tact
Ang
le (d
egre
e)
rc/rmax
Si-120nm
0.5 0.6 0.7 0.8 0.9 1.0
20
30
40
50
60
70
80
rc/rmax
Con
tact
Ang
le (d
egre
e)
PMMA
Figure 7.1: Contact line dynamics of freely-evaporating drops of SiO2-20nm, SiO2-50nm, SiO2-120nm andPMMA suspensions on PMMA surfaces. The suspensions were diluted in Milli-Q water at ΦV = 1%. The dropvolume was 100µl. The red arrows in the graph of the PMMA suspensions indicate the jumps observed during thereceding motion of the contact line.
Figure 7.2: Sketch of the shape of the final deposits as well as the positions where the images were acquired.The dark lines represent the main cracks observed.
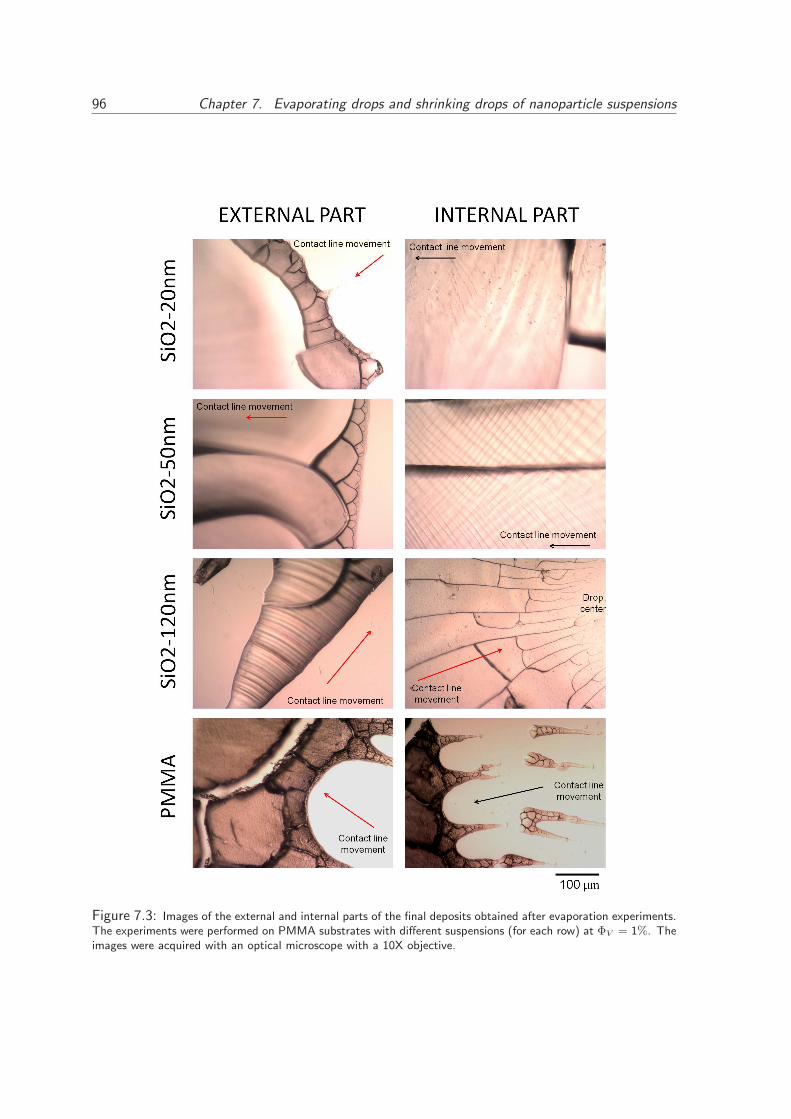
96 Chapter 7. Evaporating drops and shrinking drops of nanoparticle suspensions
Figure 7.3: Images of the external and internal parts of the final deposits obtained after evaporation experiments.The experiments were performed on PMMA substrates with different suspensions (for each row) at ΦV = 1%. Theimages were acquired with an optical microscope with a 10X objective.
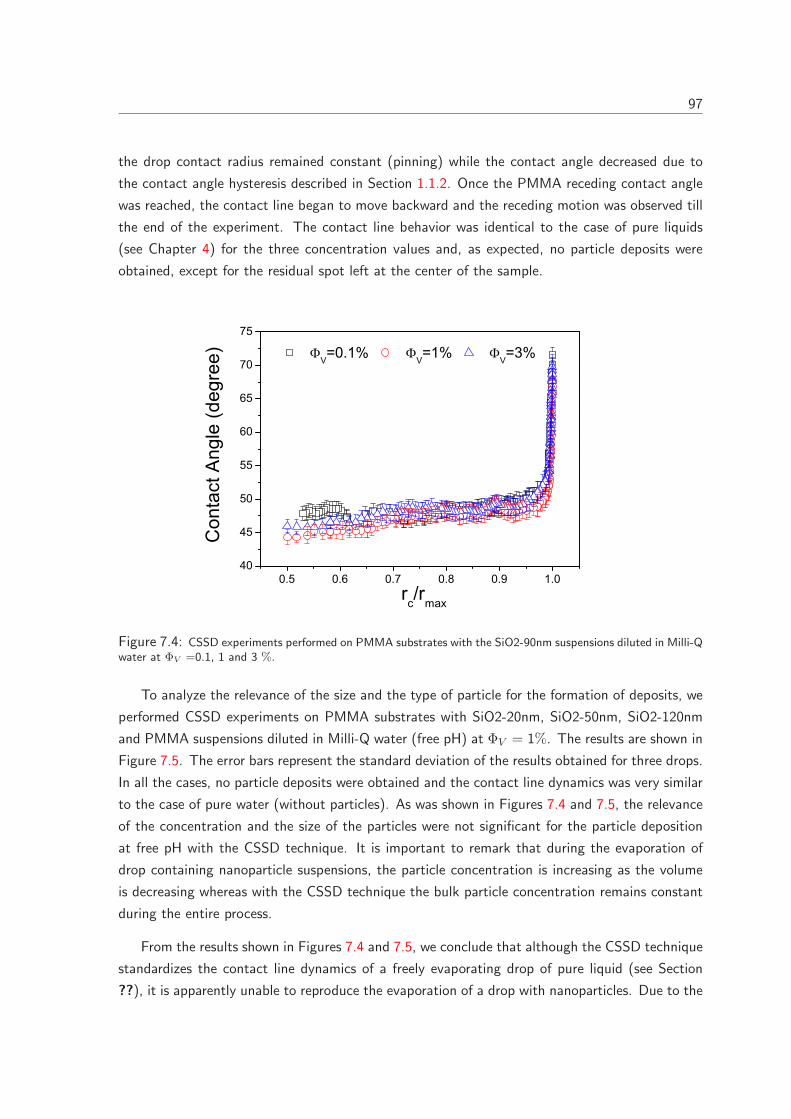
97
the drop contact radius remained constant (pinning) while the contact angle decreased due to
the contact angle hysteresis described in Section 1.1.2. Once the PMMA receding contact angle
was reached, the contact line began to move backward and the receding motion was observed till
the end of the experiment. The contact line behavior was identical to the case of pure liquids
(see Chapter 4) for the three concentration values and, as expected, no particle deposits were
obtained, except for the residual spot left at the center of the sample.
0.5 0.6 0.7 0.8 0.9 1.040
45
50
55
60
65
70
75
rc/rmax
Con
tact
Ang
le (d
egre
e)
V=0.1% V=1% V=3%
Figure 7.4: CSSD experiments performed on PMMA substrates with the SiO2-90nm suspensions diluted in Milli-Qwater at ΦV =0.1, 1 and 3 %.
To analyze the relevance of the size and the type of particle for the formation of deposits, we
performed CSSD experiments on PMMA substrates with SiO2-20nm, SiO2-50nm, SiO2-120nm
and PMMA suspensions diluted in Milli-Q water (free pH) at ΦV = 1%. The results are shown in
Figure 7.5. The error bars represent the standard deviation of the results obtained for three drops.
In all the cases, no particle deposits were obtained and the contact line dynamics was very similar
to the case of pure water (without particles). As was shown in Figures 7.4 and 7.5, the relevance
of the concentration and the size of the particles were not significant for the particle deposition
at free pH with the CSSD technique. It is important to remark that during the evaporation of
drop containing nanoparticle suspensions, the particle concentration is increasing as the volume
is decreasing whereas with the CSSD technique the bulk particle concentration remains constant
during the entire process.
From the results shown in Figures 7.4 and 7.5, we conclude that although the CSSD technique
standardizes the contact line dynamics of a freely evaporating drop of pure liquid (see Section
??), it is apparently unable to reproduce the evaporation of a drop with nanoparticles. Due to the
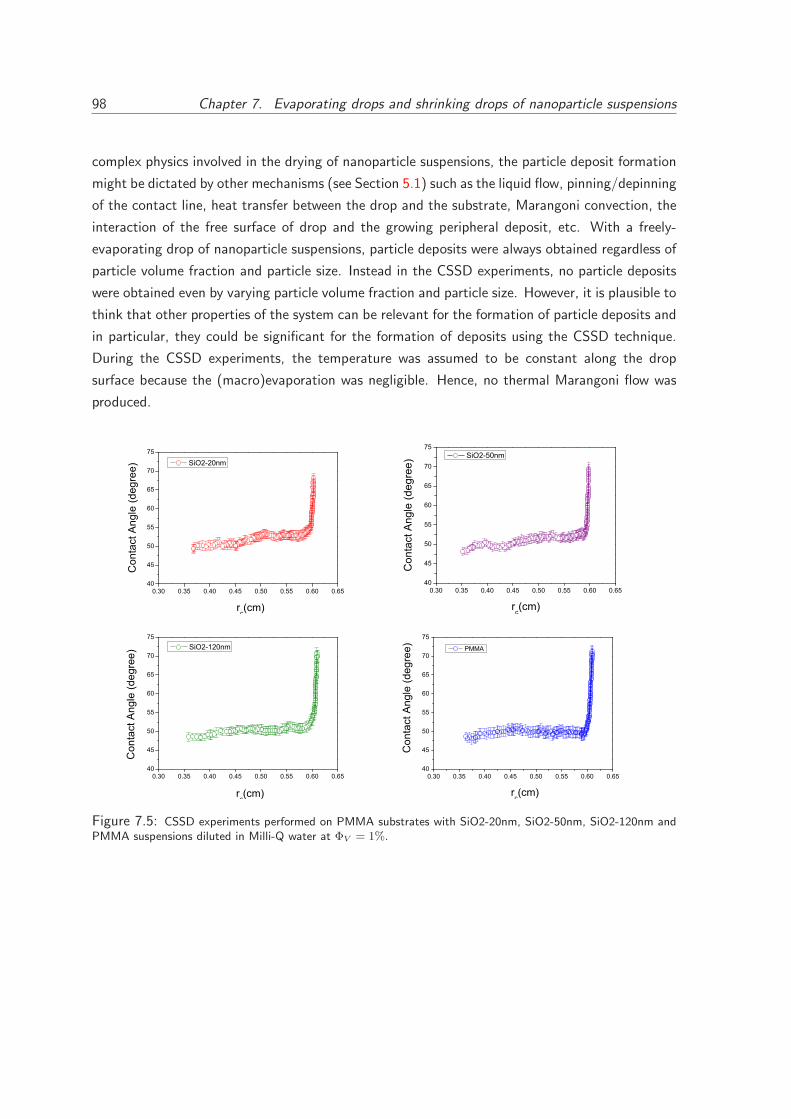
98 Chapter 7. Evaporating drops and shrinking drops of nanoparticle suspensions
complex physics involved in the drying of nanoparticle suspensions, the particle deposit formation
might be dictated by other mechanisms (see Section 5.1) such as the liquid flow, pinning/depinning
of the contact line, heat transfer between the drop and the substrate, Marangoni convection, the
interaction of the free surface of drop and the growing peripheral deposit, etc. With a freely-
evaporating drop of nanoparticle suspensions, particle deposits were always obtained regardless of
particle volume fraction and particle size. Instead in the CSSD experiments, no particle deposits
were obtained even by varying particle volume fraction and particle size. However, it is plausible to
think that other properties of the system can be relevant for the formation of particle deposits and
in particular, they could be significant for the formation of deposits using the CSSD technique.
During the CSSD experiments, the temperature was assumed to be constant along the drop
surface because the (macro)evaporation was negligible. Hence, no thermal Marangoni flow was
produced.
0.30 0.35 0.40 0.45 0.50 0.55 0.60 0.6540
45
50
55
60
65
70
75
Con
tact
Ang
le (d
egre
e)
rc(cm)
SiO2-20nm
0.30 0.35 0.40 0.45 0.50 0.55 0.60 0.6540
45
50
55
60
65
70
75
Con
tact
Ang
le (d
egre
e)
rc(cm)
SiO2-50nm
0.30 0.35 0.40 0.45 0.50 0.55 0.60 0.6540
45
50
55
60
65
70
75
Con
tact
Ang
le (d
egre
e)
rc(cm)
SiO2-120nm
0.30 0.35 0.40 0.45 0.50 0.55 0.60 0.6540
45
50
55
60
65
70
75
PMMA
C
onta
ct A
ngle
(deg
ree)
rc(cm)
Figure 7.5: CSSD experiments performed on PMMA substrates with SiO2-20nm, SiO2-50nm, SiO2-120nm andPMMA suspensions diluted in Milli-Q water at ΦV = 1%.
CHAPTER 8
The role of the electrostatic interactions in
the formation of nanoparticle deposits
8.1 Evaporating drops of nanoparticle suspensions
During the drying of particles suspensions, the particle deposition process can be dictated by
DLVO interactions, i.e. the electrostatic and van der Waals forces. These interactions might
modify the shape of the final deposit (37, 141, 149). In order to test the relevance of substrate-
particle electrostatic interactions on the particle deposit formation, we performed free evaporation
experiments on PMMA substrates with PS, SiO2-90nm and TiO2 suspensions at ΦV = 1% (see
Section 6.1 for details of the suspensions). The drop volume was 100µl. The experiments were
perfomed at room temperature (25◦C) and relative humidity of 50%. To change the electrostatic
interactions, the nanoparticles were buffered at pH2 and 9. At pH2 the substrate-particle elec-
trostatic interactions were minimum, while a strong substrate-particle repulsion was obtained at
pH9 (see Figure 6.4). The results showed that different morphologies of the nanoparticle deposits
were obtained as the electrostatic interactions of the system were varied (see Figure 8.1).
We also performed free evaporation experiments on TiO2 substrates to examine the attractive
substrate-particle interactions. We prepared PS and TiO2 nanoparticle suspensions at ΦV = 1%
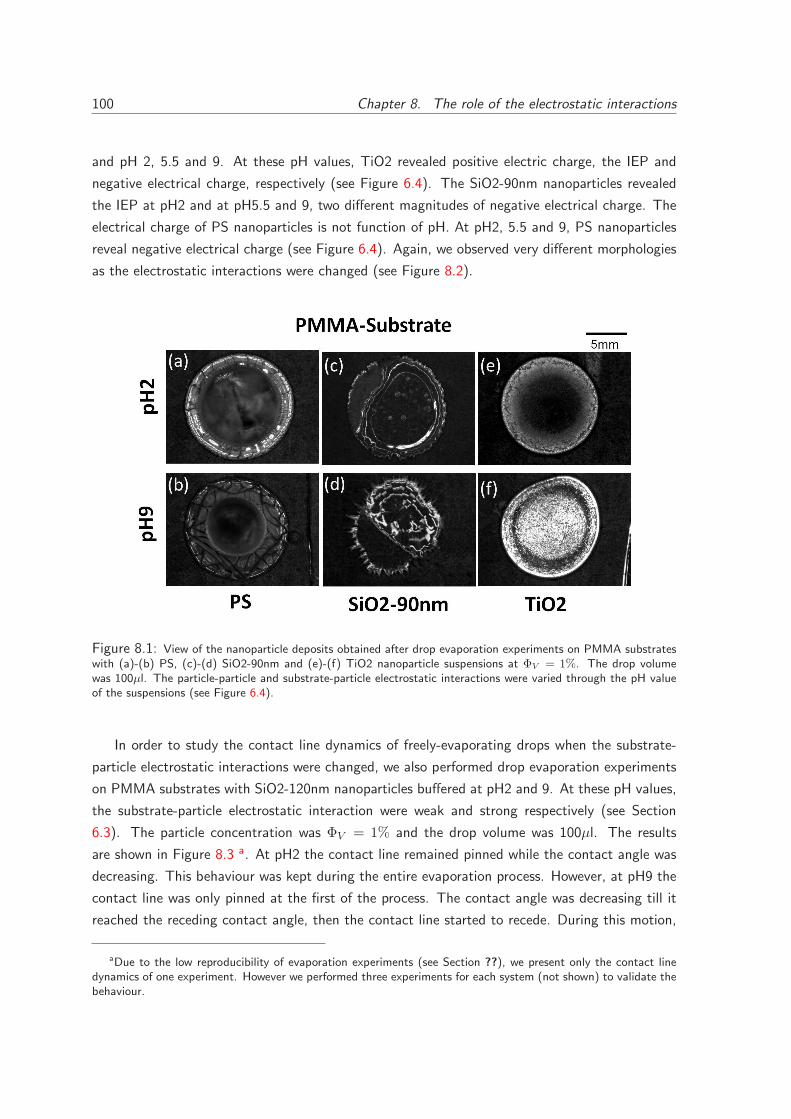
100 Chapter 8. The role of the electrostatic interactions
and pH 2, 5.5 and 9. At these pH values, TiO2 revealed positive electric charge, the IEP and
negative electrical charge, respectively (see Figure 6.4). The SiO2-90nm nanoparticles revealed
the IEP at pH2 and at pH5.5 and 9, two different magnitudes of negative electrical charge. The
electrical charge of PS nanoparticles is not function of pH. At pH2, 5.5 and 9, PS nanoparticles
reveal negative electrical charge (see Figure 6.4). Again, we observed very different morphologies
as the electrostatic interactions were changed (see Figure 8.2).
Figure 8.1: View of the nanoparticle deposits obtained after drop evaporation experiments on PMMA substrateswith (a)-(b) PS, (c)-(d) SiO2-90nm and (e)-(f) TiO2 nanoparticle suspensions at ΦV = 1%. The drop volumewas 100µl. The particle-particle and substrate-particle electrostatic interactions were varied through the pH valueof the suspensions (see Figure 6.4).
In order to study the contact line dynamics of freely-evaporating drops when the substrate-
particle electrostatic interactions were changed, we also performed drop evaporation experiments
on PMMA substrates with SiO2-120nm nanoparticles buffered at pH2 and 9. At these pH values,
the substrate-particle electrostatic interaction were weak and strong respectively (see Section
6.3). The particle concentration was ΦV = 1% and the drop volume was 100µl. The results
are shown in Figure 8.3 a. At pH2 the contact line remained pinned while the contact angle was
decreasing. This behaviour was kept during the entire evaporation process. However, at pH9 the
contact line was only pinned at the first of the process. The contact angle was decreasing till it
reached the receding contact angle, then the contact line started to recede. During this motion,
aDue to the low reproducibility of evaporation experiments (see Section ??), we present only the contact linedynamics of one experiment. However we performed three experiments for each system (not shown) to validate thebehaviour.
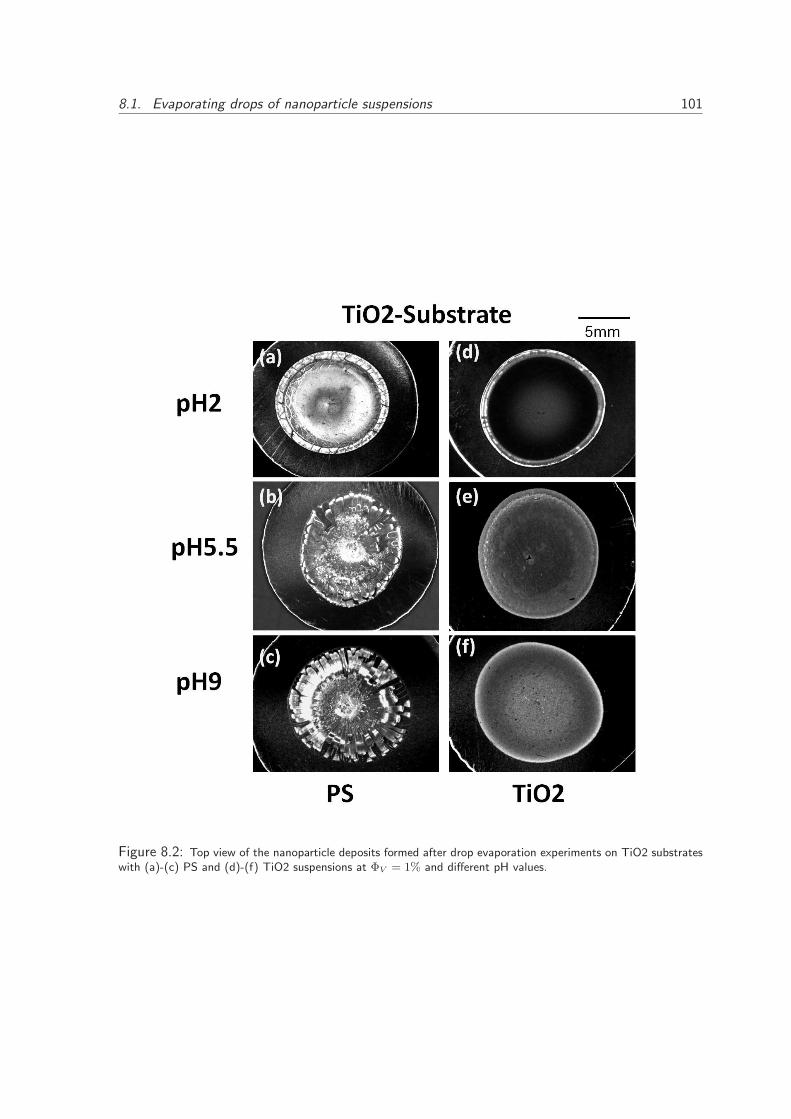
8.1. Evaporating drops of nanoparticle suspensions 101
Figure 8.2: Top view of the nanoparticle deposits formed after drop evaporation experiments on TiO2 substrateswith (a)-(c) PS and (d)-(f) TiO2 suspensions at ΦV = 1% and different pH values.
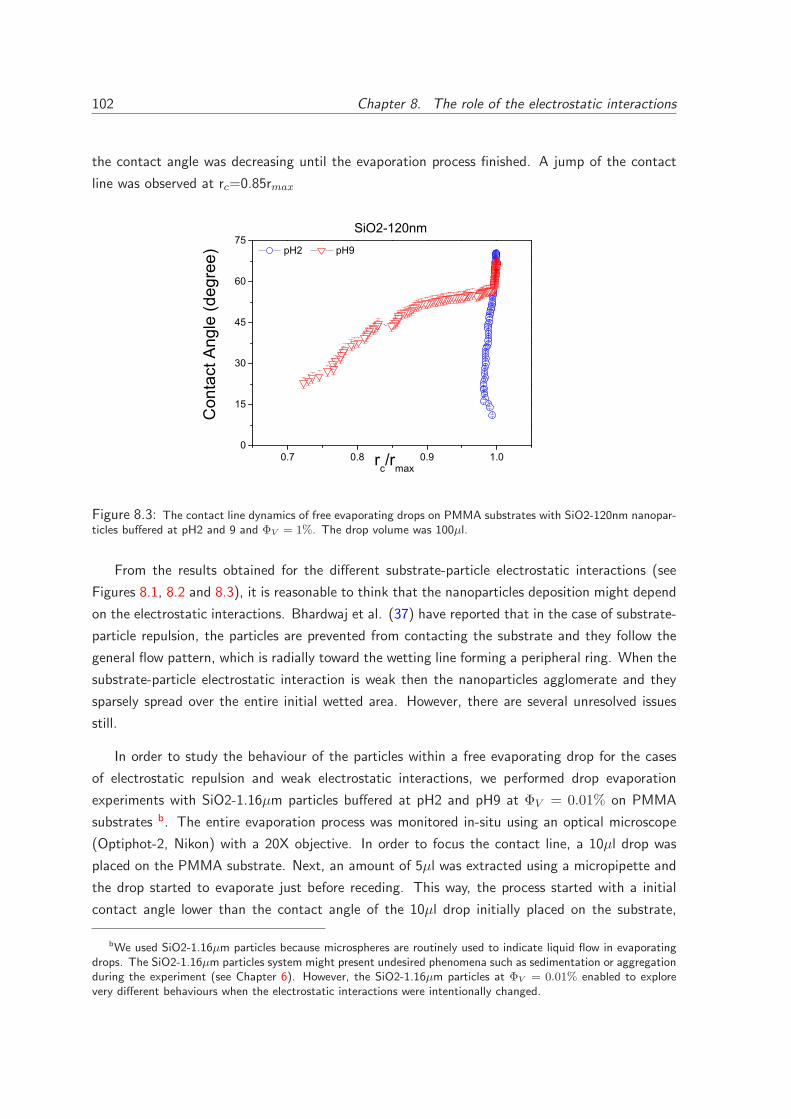
102 Chapter 8. The role of the electrostatic interactions
the contact angle was decreasing until the evaporation process finished. A jump of the contact
line was observed at rc=0.85rmax
0.7 0.8 0.9 1.00
15
30
45
60
75
rc/rmax
Con
tact
Ang
le (d
egre
e)
pH2 pH9
SiO2-120nm
Figure 8.3: The contact line dynamics of free evaporating drops on PMMA substrates with SiO2-120nm nanopar-ticles buffered at pH2 and 9 and ΦV = 1%. The drop volume was 100µl.
From the results obtained for the different substrate-particle electrostatic interactions (see
Figures 8.1, 8.2 and 8.3), it is reasonable to think that the nanoparticles deposition might depend
on the electrostatic interactions. Bhardwaj et al. (37) have reported that in the case of substrate-
particle repulsion, the particles are prevented from contacting the substrate and they follow the
general flow pattern, which is radially toward the wetting line forming a peripheral ring. When the
substrate-particle electrostatic interaction is weak then the nanoparticles agglomerate and they
sparsely spread over the entire initial wetted area. However, there are several unresolved issues
still.
In order to study the behaviour of the particles within a free evaporating drop for the cases
of electrostatic repulsion and weak electrostatic interactions, we performed drop evaporation
experiments with SiO2-1.16µm particles buffered at pH2 and pH9 at ΦV = 0.01% on PMMA
substrates b. The entire evaporation process was monitored in-situ using an optical microscope
(Optiphot-2, Nikon) with a 20X objective. In order to focus the contact line, a 10µl drop was
placed on the PMMA substrate. Next, an amount of 5µl was extracted using a micropipette and
the drop started to evaporate just before receding. This way, the process started with a initial
contact angle lower than the contact angle of the 10µl drop initially placed on the substrate,
bWe used SiO2-1.16µm particles because microspheres are routinely used to indicate liquid flow in evaporatingdrops. The SiO2-1.16µm particles system might present undesired phenomena such as sedimentation or aggregationduring the experiment (see Chapter 6). However, the SiO2-1.16µm particles at ΦV = 0.01% enabled to explorevery different behaviours when the electrostatic interactions were intentionally changed.
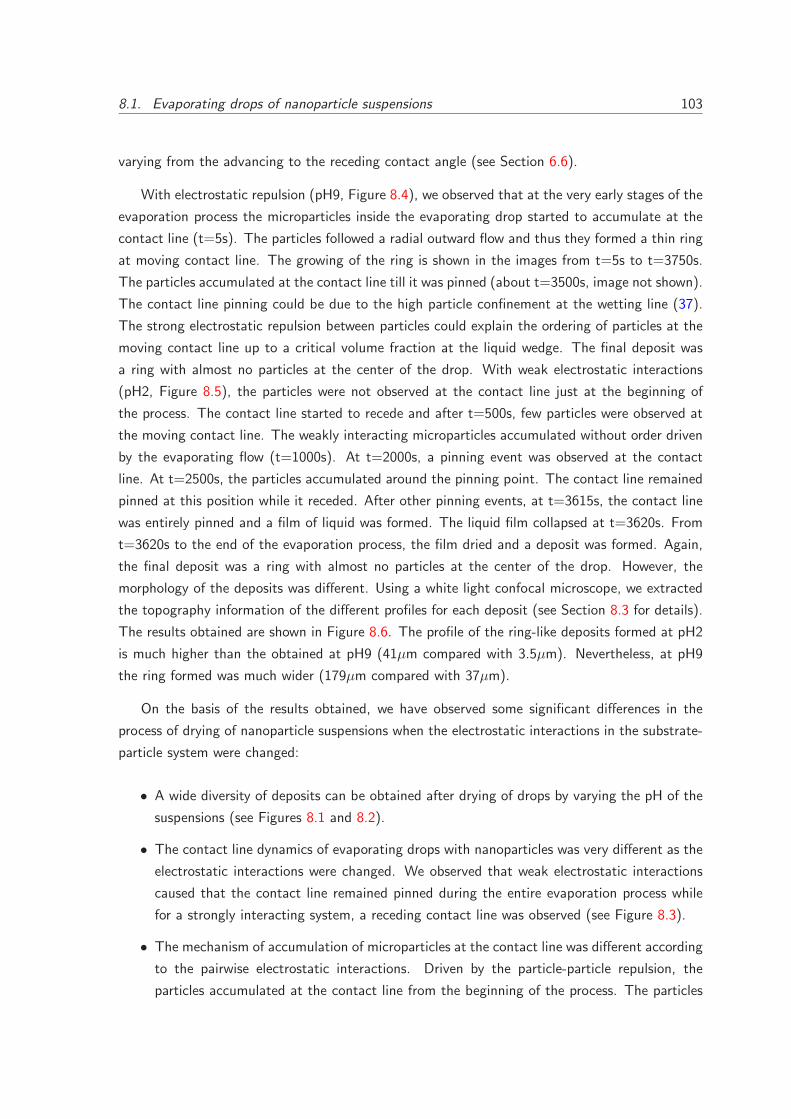
8.1. Evaporating drops of nanoparticle suspensions 103
varying from the advancing to the receding contact angle (see Section 6.6).
With electrostatic repulsion (pH9, Figure 8.4), we observed that at the very early stages of the
evaporation process the microparticles inside the evaporating drop started to accumulate at the
contact line (t=5s). The particles followed a radial outward flow and thus they formed a thin ring
at moving contact line. The growing of the ring is shown in the images from t=5s to t=3750s.
The particles accumulated at the contact line till it was pinned (about t=3500s, image not shown).
The contact line pinning could be due to the high particle confinement at the wetting line (37).
The strong electrostatic repulsion between particles could explain the ordering of particles at the
moving contact line up to a critical volume fraction at the liquid wedge. The final deposit was
a ring with almost no particles at the center of the drop. With weak electrostatic interactions
(pH2, Figure 8.5), the particles were not observed at the contact line just at the beginning of
the process. The contact line started to recede and after t=500s, few particles were observed at
the moving contact line. The weakly interacting microparticles accumulated without order driven
by the evaporating flow (t=1000s). At t=2000s, a pinning event was observed at the contact
line. At t=2500s, the particles accumulated around the pinning point. The contact line remained
pinned at this position while it receded. After other pinning events, at t=3615s, the contact line
was entirely pinned and a film of liquid was formed. The liquid film collapsed at t=3620s. From
t=3620s to the end of the evaporation process, the film dried and a deposit was formed. Again,
the final deposit was a ring with almost no particles at the center of the drop. However, the
morphology of the deposits was different. Using a white light confocal microscope, we extracted
the topography information of the different profiles for each deposit (see Section 8.3 for details).
The results obtained are shown in Figure 8.6. The profile of the ring-like deposits formed at pH2
is much higher than the obtained at pH9 (41µm compared with 3.5µm). Nevertheless, at pH9
the ring formed was much wider (179µm compared with 37µm).
On the basis of the results obtained, we have observed some significant differences in the
process of drying of nanoparticle suspensions when the electrostatic interactions in the substrate-
particle system were changed:
• A wide diversity of deposits can be obtained after drying of drops by varying the pH of the
suspensions (see Figures 8.1 and 8.2).
• The contact line dynamics of evaporating drops with nanoparticles was very different as the
electrostatic interactions were changed. We observed that weak electrostatic interactions
caused that the contact line remained pinned during the entire evaporation process while
for a strongly interacting system, a receding contact line was observed (see Figure 8.3).
• The mechanism of accumulation of microparticles at the contact line was different according
to the pairwise electrostatic interactions. Driven by the particle-particle repulsion, the
particles accumulated at the contact line from the beginning of the process. The particles
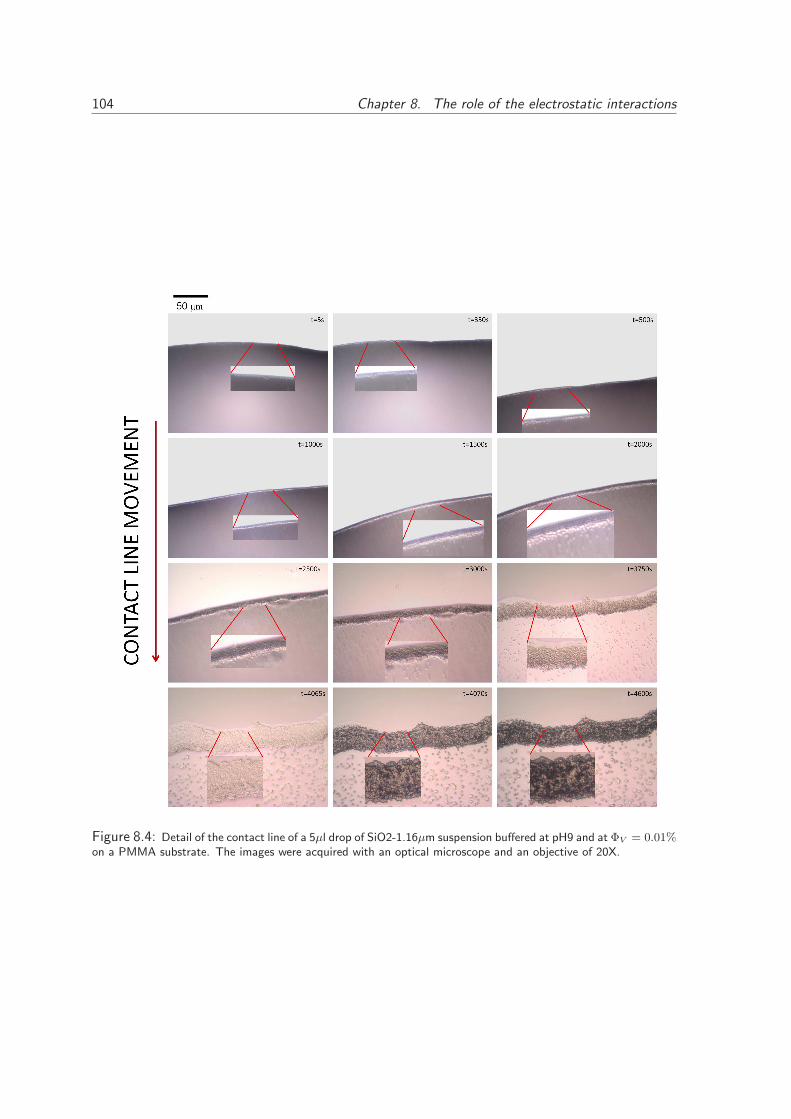
104 Chapter 8. The role of the electrostatic interactions
Figure 8.4: Detail of the contact line of a 5µl drop of SiO2-1.16µm suspension buffered at pH9 and at ΦV = 0.01%on a PMMA substrate. The images were acquired with an optical microscope and an objective of 20X.
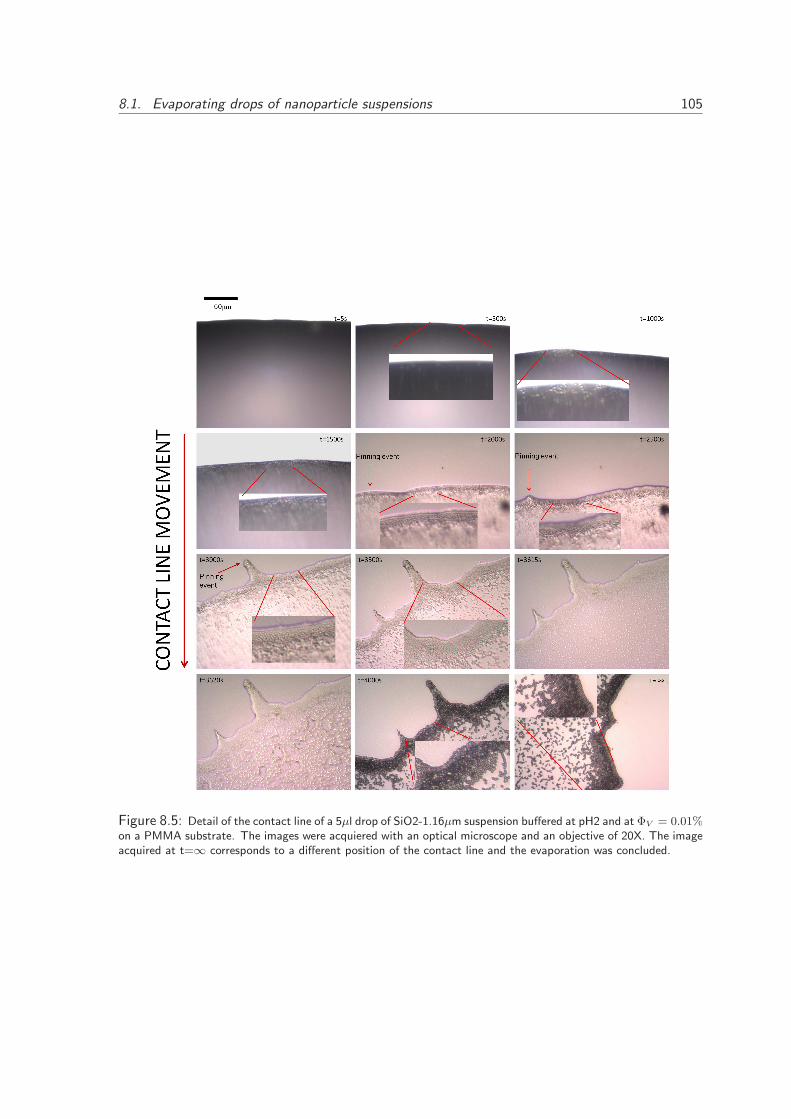
8.1. Evaporating drops of nanoparticle suspensions 105
Figure 8.5: Detail of the contact line of a 5µl drop of SiO2-1.16µm suspension buffered at pH2 and at ΦV = 0.01%on a PMMA substrate. The images were acquiered with an optical microscope and an objective of 20X. The imageacquired at t=∞ corresponds to a different position of the contact line and the evaporation was concluded.
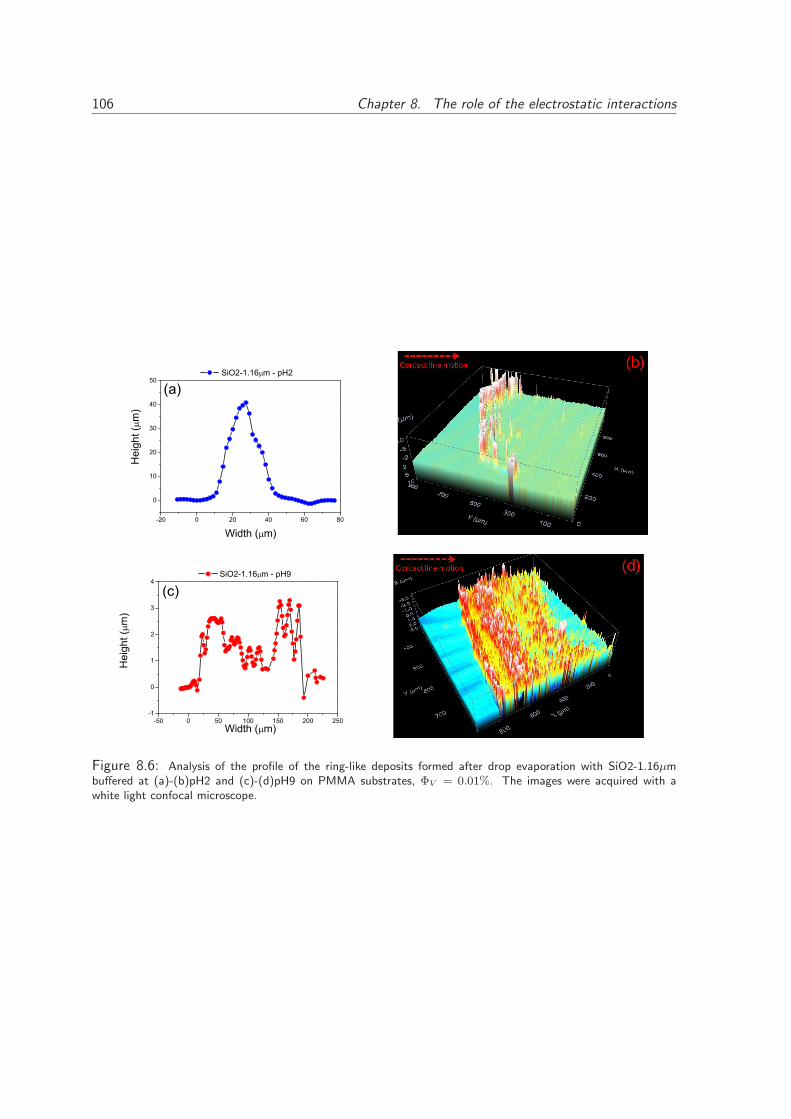
106 Chapter 8. The role of the electrostatic interactions
-20 0 20 40 60 80
0
10
20
30
40
50
(a)
Hei
ght (
m)
Width ( m)
SiO2-1.16 m - pH2
-50 0 50 100 150 200 250-1
0
1
2
3
4 SiO2-1.16 m - pH9
Width ( m)
Hei
ght (
m)
(c)
Figure 8.6: Analysis of the profile of the ring-like deposits formed after drop evaporation with SiO2-1.16µmbuffered at (a)-(b)pH2 and (c)-(d)pH9 on PMMA substrates, ΦV = 0.01%. The images were acquired with awhite light confocal microscope.
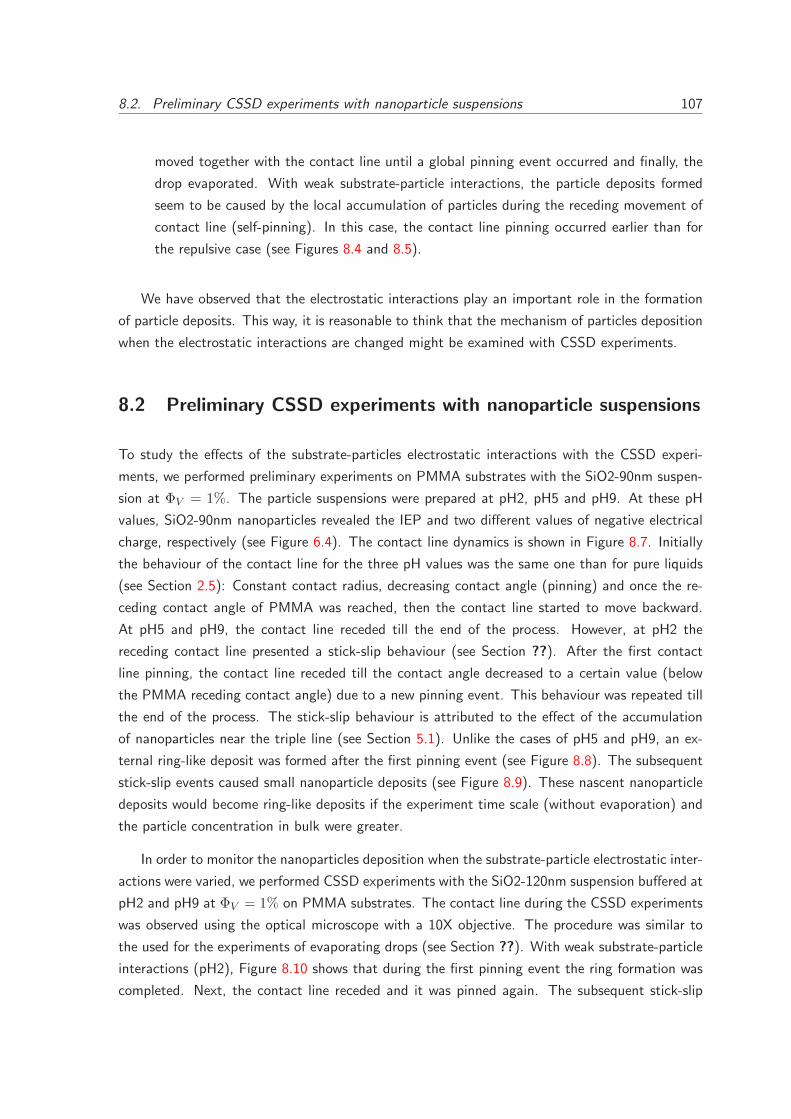
8.2. Preliminary CSSD experiments with nanoparticle suspensions 107
moved together with the contact line until a global pinning event occurred and finally, the
drop evaporated. With weak substrate-particle interactions, the particle deposits formed
seem to be caused by the local accumulation of particles during the receding movement of
contact line (self-pinning). In this case, the contact line pinning occurred earlier than for
the repulsive case (see Figures 8.4 and 8.5).
We have observed that the electrostatic interactions play an important role in the formation
of particle deposits. This way, it is reasonable to think that the mechanism of particles deposition
when the electrostatic interactions are changed might be examined with CSSD experiments.
8.2 Preliminary CSSD experiments with nanoparticle suspensions
To study the effects of the substrate-particles electrostatic interactions with the CSSD experi-
ments, we performed preliminary experiments on PMMA substrates with the SiO2-90nm suspen-
sion at ΦV = 1%. The particle suspensions were prepared at pH2, pH5 and pH9. At these pH
values, SiO2-90nm nanoparticles revealed the IEP and two different values of negative electrical
charge, respectively (see Figure 6.4). The contact line dynamics is shown in Figure 8.7. Initially
the behaviour of the contact line for the three pH values was the same one than for pure liquids
(see Section 2.5): Constant contact radius, decreasing contact angle (pinning) and once the re-
ceding contact angle of PMMA was reached, then the contact line started to move backward.
At pH5 and pH9, the contact line receded till the end of the process. However, at pH2 the
receding contact line presented a stick-slip behaviour (see Section ??). After the first contact
line pinning, the contact line receded till the contact angle decreased to a certain value (below
the PMMA receding contact angle) due to a new pinning event. This behaviour was repeated till
the end of the process. The stick-slip behaviour is attributed to the effect of the accumulation
of nanoparticles near the triple line (see Section 5.1). Unlike the cases of pH5 and pH9, an ex-
ternal ring-like deposit was formed after the first pinning event (see Figure 8.8). The subsequent
stick-slip events caused small nanoparticle deposits (see Figure 8.9). These nascent nanoparticle
deposits would become ring-like deposits if the experiment time scale (without evaporation) and
the particle concentration in bulk were greater.
In order to monitor the nanoparticles deposition when the substrate-particle electrostatic inter-
actions were varied, we performed CSSD experiments with the SiO2-120nm suspension buffered at
pH2 and pH9 at ΦV = 1% on PMMA substrates. The contact line during the CSSD experiments
was observed using the optical microscope with a 10X objective. The procedure was similar to
the used for the experiments of evaporating drops (see Section ??). With weak substrate-particle
interactions (pH2), Figure 8.10 shows that during the first pinning event the ring formation was
completed. Next, the contact line receded and it was pinned again. The subsequent stick-slip
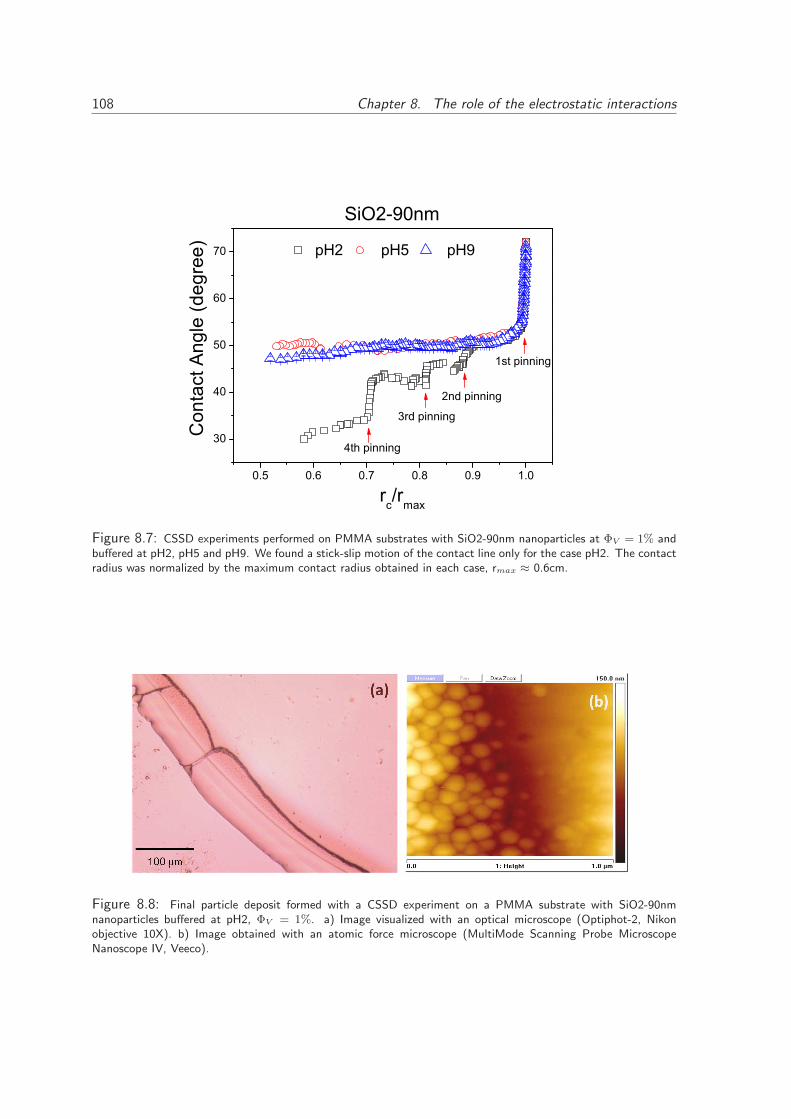
108 Chapter 8. The role of the electrostatic interactions
0.5 0.6 0.7 0.8 0.9 1.0
30
40
50
60
70
4th pinning
3rd pinning
2nd pinning
pH2 pH5 pH9
Con
tact
Ang
le (d
egre
e)
rc/rmax
1st pinning
SiO2-90nm
Figure 8.7: CSSD experiments performed on PMMA substrates with SiO2-90nm nanoparticles at ΦV = 1% andbuffered at pH2, pH5 and pH9. We found a stick-slip motion of the contact line only for the case pH2. The contactradius was normalized by the maximum contact radius obtained in each case, rmax ≈ 0.6cm.
Figure 8.8: Final particle deposit formed with a CSSD experiment on a PMMA substrate with SiO2-90nmnanoparticles buffered at pH2, ΦV = 1%. a) Image visualized with an optical microscope (Optiphot-2, Nikonobjective 10X). b) Image obtained with an atomic force microscope (MultiMode Scanning Probe MicroscopeNanoscope IV, Veeco).
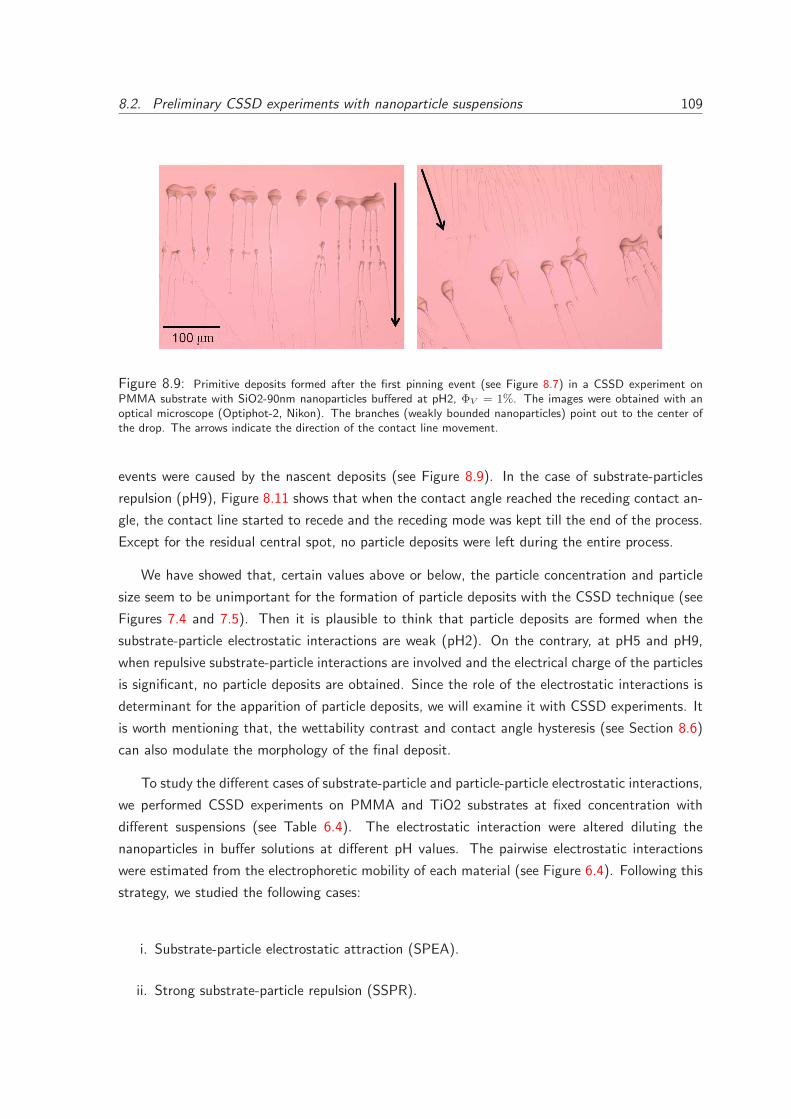
8.2. Preliminary CSSD experiments with nanoparticle suspensions 109
Figure 8.9: Primitive deposits formed after the first pinning event (see Figure 8.7) in a CSSD experiment onPMMA substrate with SiO2-90nm nanoparticles buffered at pH2, ΦV = 1%. The images were obtained with anoptical microscope (Optiphot-2, Nikon). The branches (weakly bounded nanoparticles) point out to the center ofthe drop. The arrows indicate the direction of the contact line movement.
events were caused by the nascent deposits (see Figure 8.9). In the case of substrate-particles
repulsion (pH9), Figure 8.11 shows that when the contact angle reached the receding contact an-
gle, the contact line started to recede and the receding mode was kept till the end of the process.
Except for the residual central spot, no particle deposits were left during the entire process.
We have showed that, certain values above or below, the particle concentration and particle
size seem to be unimportant for the formation of particle deposits with the CSSD technique (see
Figures 7.4 and 7.5). Then it is plausible to think that particle deposits are formed when the
substrate-particle electrostatic interactions are weak (pH2). On the contrary, at pH5 and pH9,
when repulsive substrate-particle interactions are involved and the electrical charge of the particles
is significant, no particle deposits are obtained. Since the role of the electrostatic interactions is
determinant for the apparition of particle deposits, we will examine it with CSSD experiments. It
is worth mentioning that, the wettability contrast and contact angle hysteresis (see Section 8.6)
can also modulate the morphology of the final deposit.
To study the different cases of substrate-particle and particle-particle electrostatic interactions,
we performed CSSD experiments on PMMA and TiO2 substrates at fixed concentration with
different suspensions (see Table 6.4). The electrostatic interaction were altered diluting the
nanoparticles in buffer solutions at different pH values. The pairwise electrostatic interactions
were estimated from the electrophoretic mobility of each material (see Figure 6.4). Following this
strategy, we studied the following cases:
i. Substrate-particle electrostatic attraction (SPEA).
ii. Strong substrate-particle repulsion (SSPR).
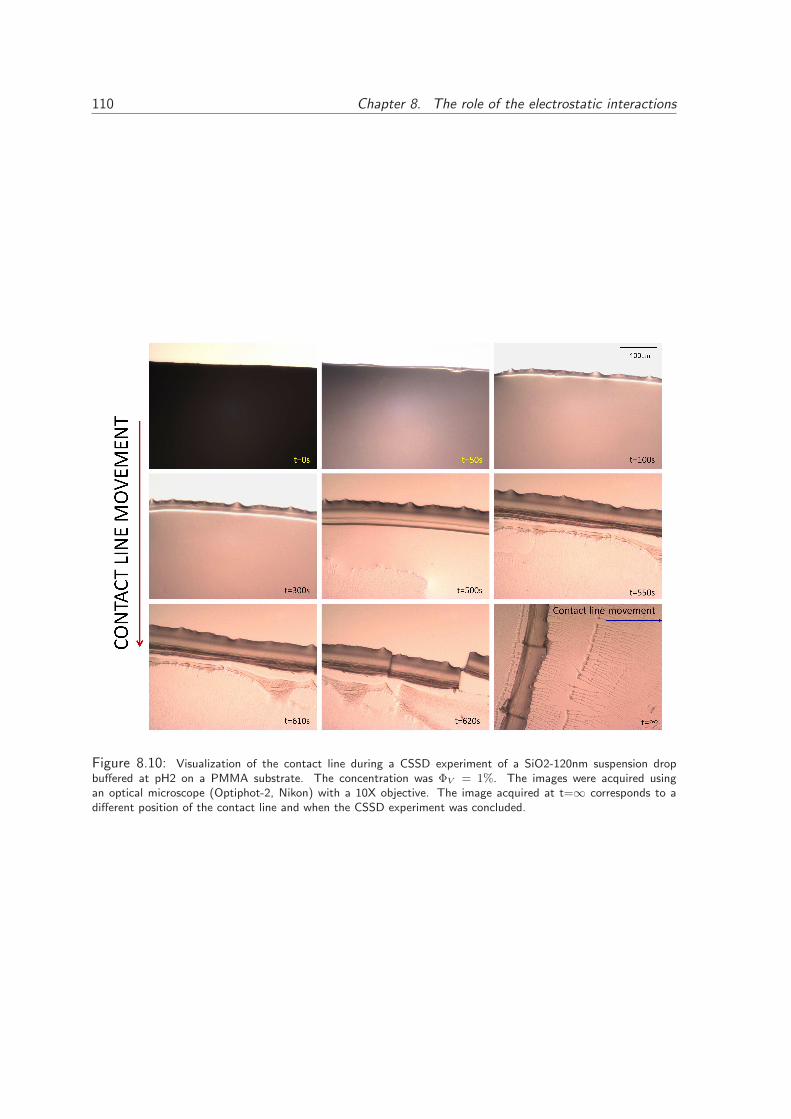
110 Chapter 8. The role of the electrostatic interactions
Figure 8.10: Visualization of the contact line during a CSSD experiment of a SiO2-120nm suspension dropbuffered at pH2 on a PMMA substrate. The concentration was ΦV = 1%. The images were acquired usingan optical microscope (Optiphot-2, Nikon) with a 10X objective. The image acquired at t=∞ corresponds to adifferent position of the contact line and when the CSSD experiment was concluded.
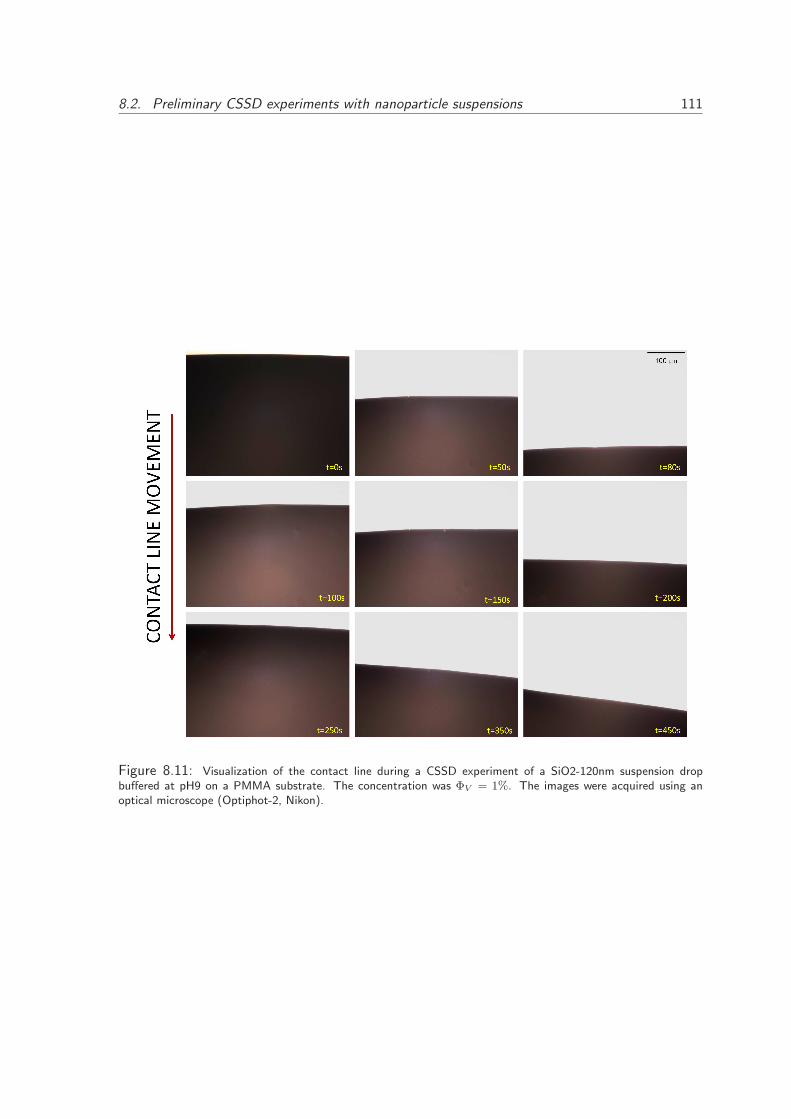
8.2. Preliminary CSSD experiments with nanoparticle suspensions 111
Figure 8.11: Visualization of the contact line during a CSSD experiment of a SiO2-120nm suspension dropbuffered at pH9 on a PMMA substrate. The concentration was ΦV = 1%. The images were acquired using anoptical microscope (Optiphot-2, Nikon).
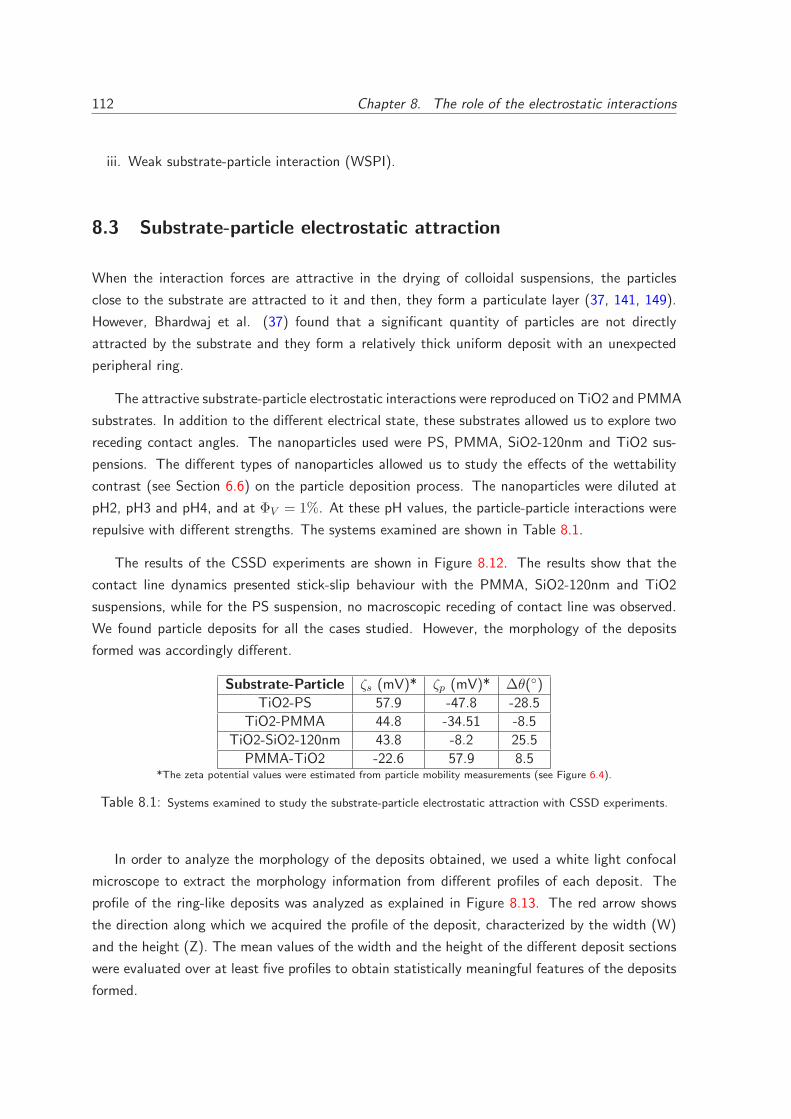
112 Chapter 8. The role of the electrostatic interactions
iii. Weak substrate-particle interaction (WSPI).
8.3 Substrate-particle electrostatic attraction
When the interaction forces are attractive in the drying of colloidal suspensions, the particles
close to the substrate are attracted to it and then, they form a particulate layer (37, 141, 149).
However, Bhardwaj et al. (37) found that a significant quantity of particles are not directly
attracted by the substrate and they form a relatively thick uniform deposit with an unexpected
peripheral ring.
The attractive substrate-particle electrostatic interactions were reproduced on TiO2 and PMMA
substrates. In addition to the different electrical state, these substrates allowed us to explore two
receding contact angles. The nanoparticles used were PS, PMMA, SiO2-120nm and TiO2 sus-
pensions. The different types of nanoparticles allowed us to study the effects of the wettability
contrast (see Section 6.6) on the particle deposition process. The nanoparticles were diluted at
pH2, pH3 and pH4, and at ΦV = 1%. At these pH values, the particle-particle interactions were
repulsive with different strengths. The systems examined are shown in Table 8.1.
The results of the CSSD experiments are shown in Figure 8.12. The results show that the
contact line dynamics presented stick-slip behaviour with the PMMA, SiO2-120nm and TiO2
suspensions, while for the PS suspension, no macroscopic receding of contact line was observed.
We found particle deposits for all the cases studied. However, the morphology of the deposits
formed was accordingly different.
Substrate-Particle ζs (mV)* ζp (mV)* ∆θ(◦)
TiO2-PS 57.9 -47.8 -28.5
TiO2-PMMA 44.8 -34.51 -8.5
TiO2-SiO2-120nm 43.8 -8.2 25.5
PMMA-TiO2 -22.6 57.9 8.5*The zeta potential values were estimated from particle mobility measurements (see Figure 6.4).
Table 8.1: Systems examined to study the substrate-particle electrostatic attraction with CSSD experiments.
In order to analyze the morphology of the deposits obtained, we used a white light confocal
microscope to extract the morphology information from different profiles of each deposit. The
profile of the ring-like deposits was analyzed as explained in Figure 8.13. The red arrow shows
the direction along which we acquired the profile of the deposit, characterized by the width (W)
and the height (Z). The mean values of the width and the height of the different deposit sections
were evaluated over at least five profiles to obtain statistically meaningful features of the deposits
formed.
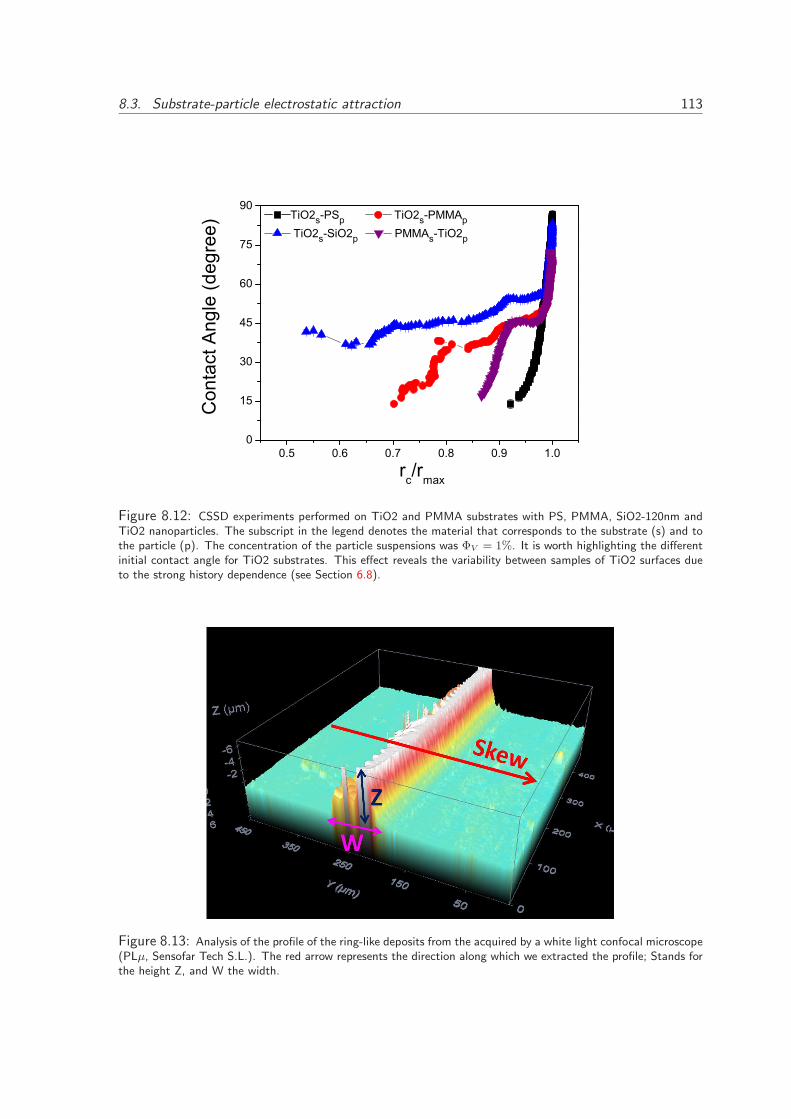
8.3. Substrate-particle electrostatic attraction 113
0.5 0.6 0.7 0.8 0.9 1.00
15
30
45
60
75
90TiO2s-PSp TiO2s-PMMAp TiO2s-SiO2p PMMAs-TiO2p
Con
tact
Ang
le (d
egre
e)
rc/rmax
Figure 8.12: CSSD experiments performed on TiO2 and PMMA substrates with PS, PMMA, SiO2-120nm andTiO2 nanoparticles. The subscript in the legend denotes the material that corresponds to the substrate (s) and tothe particle (p). The concentration of the particle suspensions was ΦV = 1%. It is worth highlighting the differentinitial contact angle for TiO2 substrates. This effect reveals the variability between samples of TiO2 surfaces dueto the strong history dependence (see Section 6.8).
Figure 8.13: Analysis of the profile of the ring-like deposits from the acquired by a white light confocal microscope(PLµ, Sensofar Tech S.L.). The red arrow represents the direction along which we extracted the profile; Stands forthe height Z, and W the width.
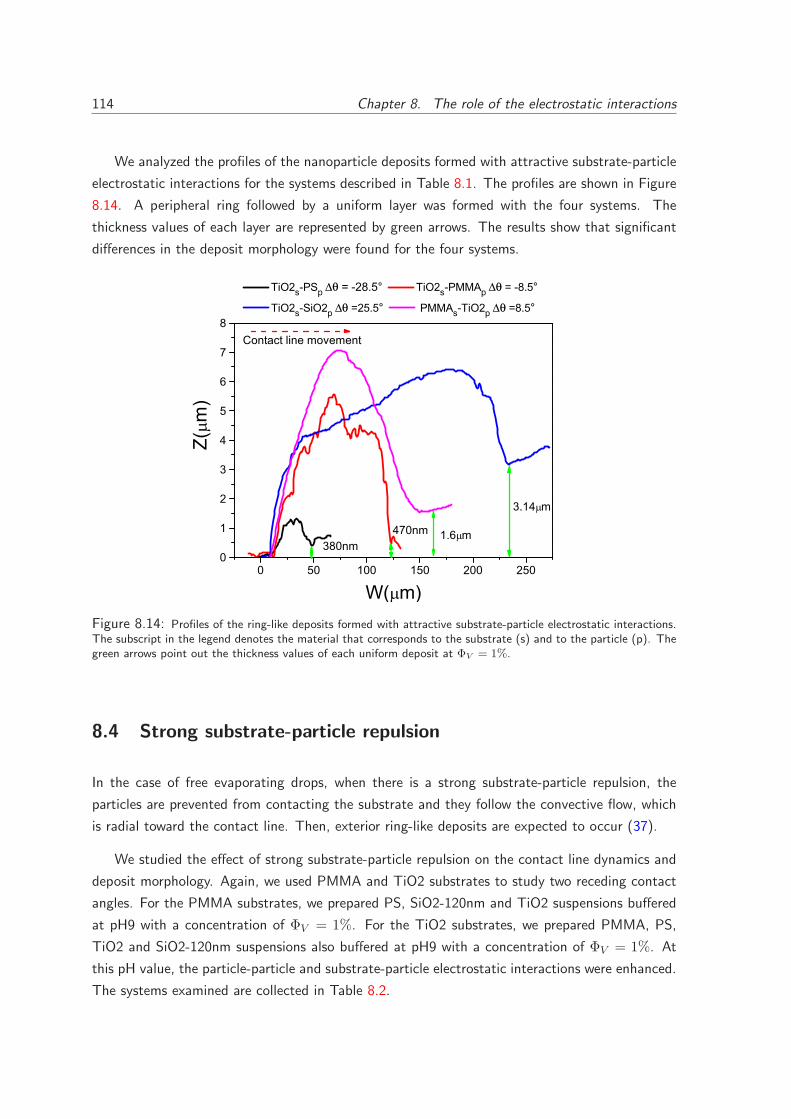
114 Chapter 8. The role of the electrostatic interactions
We analyzed the profiles of the nanoparticle deposits formed with attractive substrate-particle
electrostatic interactions for the systems described in Table 8.1. The profiles are shown in Figure
8.14. A peripheral ring followed by a uniform layer was formed with the four systems. The
thickness values of each layer are represented by green arrows. The results show that significant
differences in the deposit morphology were found for the four systems.
0 50 100 150 200 2500
1
2
3
4
5
6
7
8
TiO2s-PSp = -28.5° TiO2s-PMMAp = -8.5°
TiO2s-SiO2p =25.5° PMMAs-TiO2p =8.5°
1.6 m
3.14 m
470nm
Z(m
)
W( m)
380nm
Contact line movement
Figure 8.14: Profiles of the ring-like deposits formed with attractive substrate-particle electrostatic interactions.The subscript in the legend denotes the material that corresponds to the substrate (s) and to the particle (p). Thegreen arrows point out the thickness values of each uniform deposit at ΦV = 1%.
8.4 Strong substrate-particle repulsion
In the case of free evaporating drops, when there is a strong substrate-particle repulsion, the
particles are prevented from contacting the substrate and they follow the convective flow, which
is radial toward the contact line. Then, exterior ring-like deposits are expected to occur (37).
We studied the effect of strong substrate-particle repulsion on the contact line dynamics and
deposit morphology. Again, we used PMMA and TiO2 substrates to study two receding contact
angles. For the PMMA substrates, we prepared PS, SiO2-120nm and TiO2 suspensions buffered
at pH9 with a concentration of ΦV = 1%. For the TiO2 substrates, we prepared PMMA, PS,
TiO2 and SiO2-120nm suspensions also buffered at pH9 with a concentration of ΦV = 1%. At
this pH value, the particle-particle and substrate-particle electrostatic interactions were enhanced.
The systems examined are collected in Table 8.2.
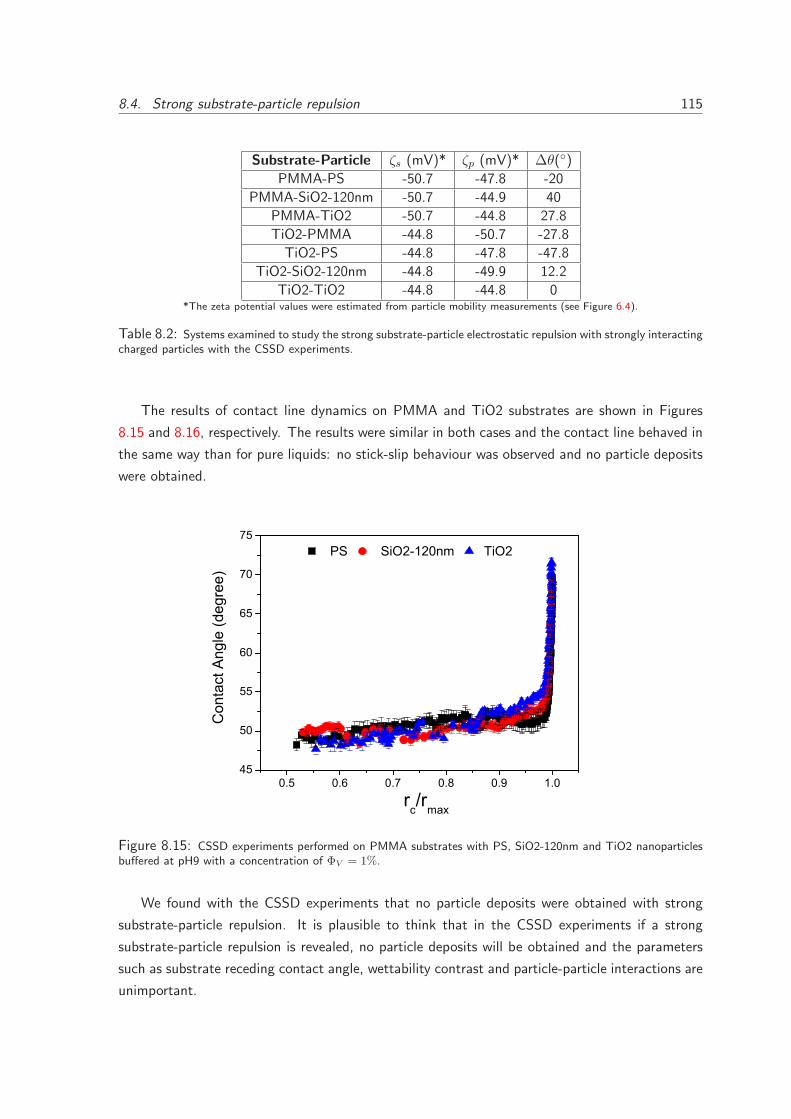
8.4. Strong substrate-particle repulsion 115
Substrate-Particle ζs (mV)* ζp (mV)* ∆θ(◦)
PMMA-PS -50.7 -47.8 -20
PMMA-SiO2-120nm -50.7 -44.9 40
PMMA-TiO2 -50.7 -44.8 27.8
TiO2-PMMA -44.8 -50.7 -27.8
TiO2-PS -44.8 -47.8 -47.8
TiO2-SiO2-120nm -44.8 -49.9 12.2
TiO2-TiO2 -44.8 -44.8 0*The zeta potential values were estimated from particle mobility measurements (see Figure 6.4).
Table 8.2: Systems examined to study the strong substrate-particle electrostatic repulsion with strongly interactingcharged particles with the CSSD experiments.
The results of contact line dynamics on PMMA and TiO2 substrates are shown in Figures
8.15 and 8.16, respectively. The results were similar in both cases and the contact line behaved in
the same way than for pure liquids: no stick-slip behaviour was observed and no particle deposits
were obtained.
0.5 0.6 0.7 0.8 0.9 1.045
50
55
60
65
70
75
rc/rmax
PS SiO2-120nm TiO2
Con
tact
Ang
le (d
egre
e)
Figure 8.15: CSSD experiments performed on PMMA substrates with PS, SiO2-120nm and TiO2 nanoparticlesbuffered at pH9 with a concentration of ΦV = 1%.
We found with the CSSD experiments that no particle deposits were obtained with strong
substrate-particle repulsion. It is plausible to think that in the CSSD experiments if a strong
substrate-particle repulsion is revealed, no particle deposits will be obtained and the parameters
such as substrate receding contact angle, wettability contrast and particle-particle interactions are
unimportant.
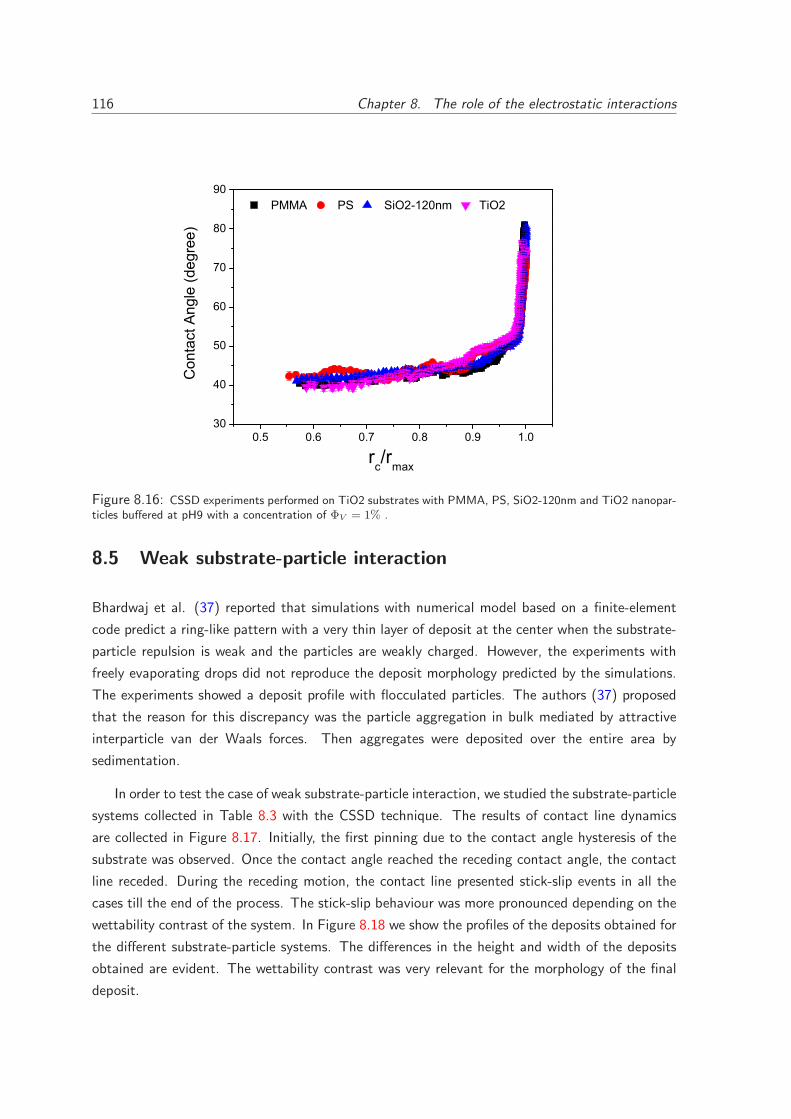
116 Chapter 8. The role of the electrostatic interactions
0.5 0.6 0.7 0.8 0.9 1.030
40
50
60
70
80
90C
onta
ct A
ngle
(deg
ree)
PMMA PS SiO2-120nm TiO2
rc/rmax
Figure 8.16: CSSD experiments performed on TiO2 substrates with PMMA, PS, SiO2-120nm and TiO2 nanopar-ticles buffered at pH9 with a concentration of ΦV = 1% .
8.5 Weak substrate-particle interaction
Bhardwaj et al. (37) reported that simulations with numerical model based on a finite-element
code predict a ring-like pattern with a very thin layer of deposit at the center when the substrate-
particle repulsion is weak and the particles are weakly charged. However, the experiments with
freely evaporating drops did not reproduce the deposit morphology predicted by the simulations.
The experiments showed a deposit profile with flocculated particles. The authors (37) proposed
that the reason for this discrepancy was the particle aggregation in bulk mediated by attractive
interparticle van der Waals forces. Then aggregates were deposited over the entire area by
sedimentation.
In order to test the case of weak substrate-particle interaction, we studied the substrate-particle
systems collected in Table 8.3 with the CSSD technique. The results of contact line dynamics
are collected in Figure 8.17. Initially, the first pinning due to the contact angle hysteresis of the
substrate was observed. Once the contact angle reached the receding contact angle, the contact
line receded. During the receding motion, the contact line presented stick-slip events in all the
cases till the end of the process. The stick-slip behaviour was more pronounced depending on the
wettability contrast of the system. In Figure 8.18 we show the profiles of the deposits obtained for
the different substrate-particle systems. The differences in the height and width of the deposits
obtained are evident. The wettability contrast was very relevant for the morphology of the final
deposit.
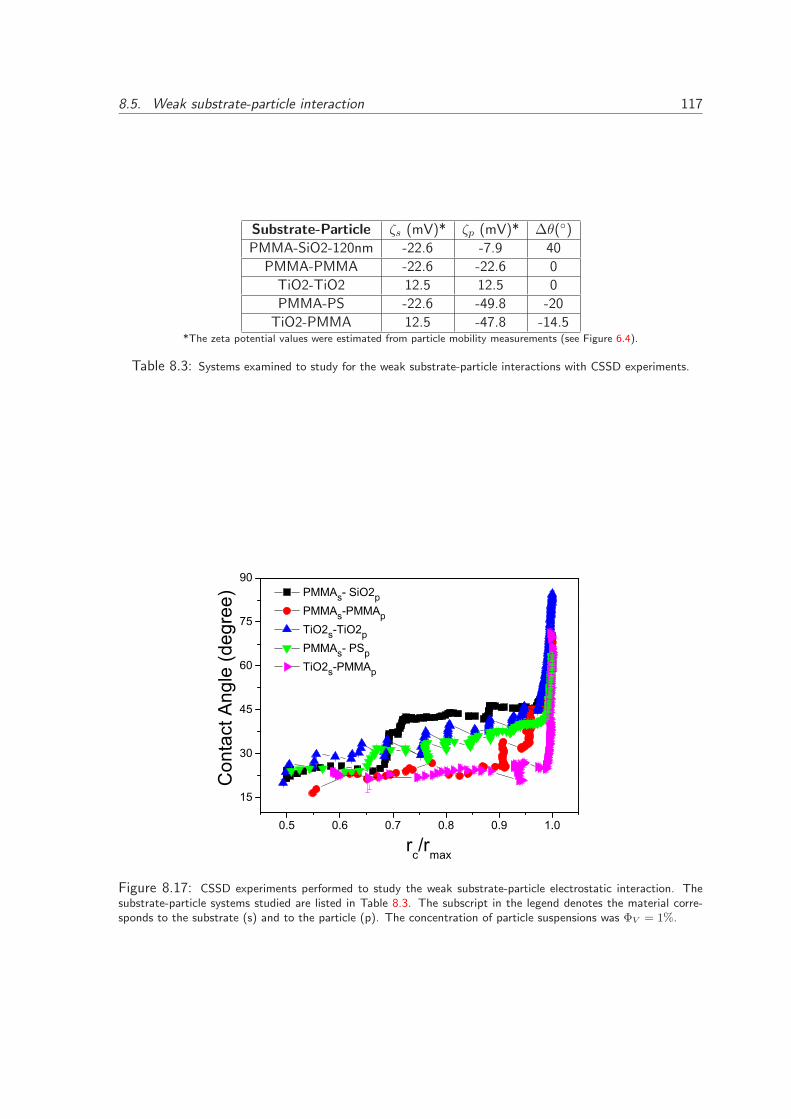
8.5. Weak substrate-particle interaction 117
Substrate-Particle ζs (mV)* ζp (mV)* ∆θ(◦)
PMMA-SiO2-120nm -22.6 -7.9 40
PMMA-PMMA -22.6 -22.6 0
TiO2-TiO2 12.5 12.5 0
PMMA-PS -22.6 -49.8 -20
TiO2-PMMA 12.5 -47.8 -14.5*The zeta potential values were estimated from particle mobility measurements (see Figure 6.4).
Table 8.3: Systems examined to study for the weak substrate-particle interactions with CSSD experiments.
0.5 0.6 0.7 0.8 0.9 1.0
15
30
45
60
75
90 PMMAs- SiO2p PMMAs-PMMAp TiO2s-TiO2p PMMAs- PSp TiO2s-PMMAp
Con
tact
Ang
le (d
egre
e)
rc/rmax
Figure 8.17: CSSD experiments performed to study the weak substrate-particle electrostatic interaction. Thesubstrate-particle systems studied are listed in Table 8.3. The subscript in the legend denotes the material corre-sponds to the substrate (s) and to the particle (p). The concentration of particle suspensions was ΦV = 1%.
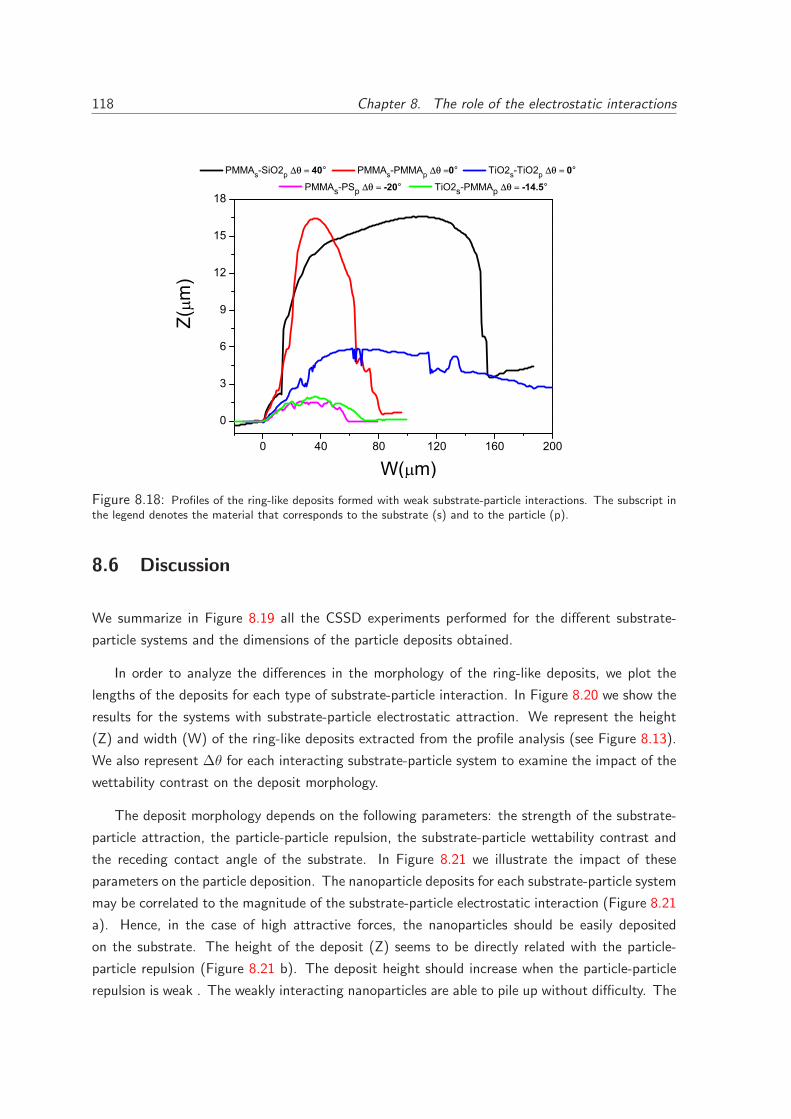
118 Chapter 8. The role of the electrostatic interactions
0 40 80 120 160 200
0
3
6
9
12
15
18
PMMAs-SiO2p 40° PMMAs-PMMAp 0° TiO2s-TiO2p 0°
PMMAs-PSp -20° TiO2s-PMMAp -14.5°Z(
m)
W( m)
Figure 8.18: Profiles of the ring-like deposits formed with weak substrate-particle interactions. The subscript inthe legend denotes the material that corresponds to the substrate (s) and to the particle (p).
8.6 Discussion
We summarize in Figure 8.19 all the CSSD experiments performed for the different substrate-
particle systems and the dimensions of the particle deposits obtained.
In order to analyze the differences in the morphology of the ring-like deposits, we plot the
lengths of the deposits for each type of substrate-particle interaction. In Figure 8.20 we show the
results for the systems with substrate-particle electrostatic attraction. We represent the height
(Z) and width (W) of the ring-like deposits extracted from the profile analysis (see Figure 8.13).
We also represent ∆θ for each interacting substrate-particle system to examine the impact of the
wettability contrast on the deposit morphology.
The deposit morphology depends on the following parameters: the strength of the substrate-
particle attraction, the particle-particle repulsion, the substrate-particle wettability contrast and
the receding contact angle of the substrate. In Figure 8.21 we illustrate the impact of these
parameters on the particle deposition. The nanoparticle deposits for each substrate-particle system
may be correlated to the magnitude of the substrate-particle electrostatic interaction (Figure 8.21
a). Hence, in the case of high attractive forces, the nanoparticles should be easily deposited
on the substrate. The height of the deposit (Z) seems to be directly related with the particle-
particle repulsion (Figure 8.21 b). The deposit height should increase when the particle-particle
repulsion is weak . The weakly interacting nanoparticles are able to pile up without difficulty. The
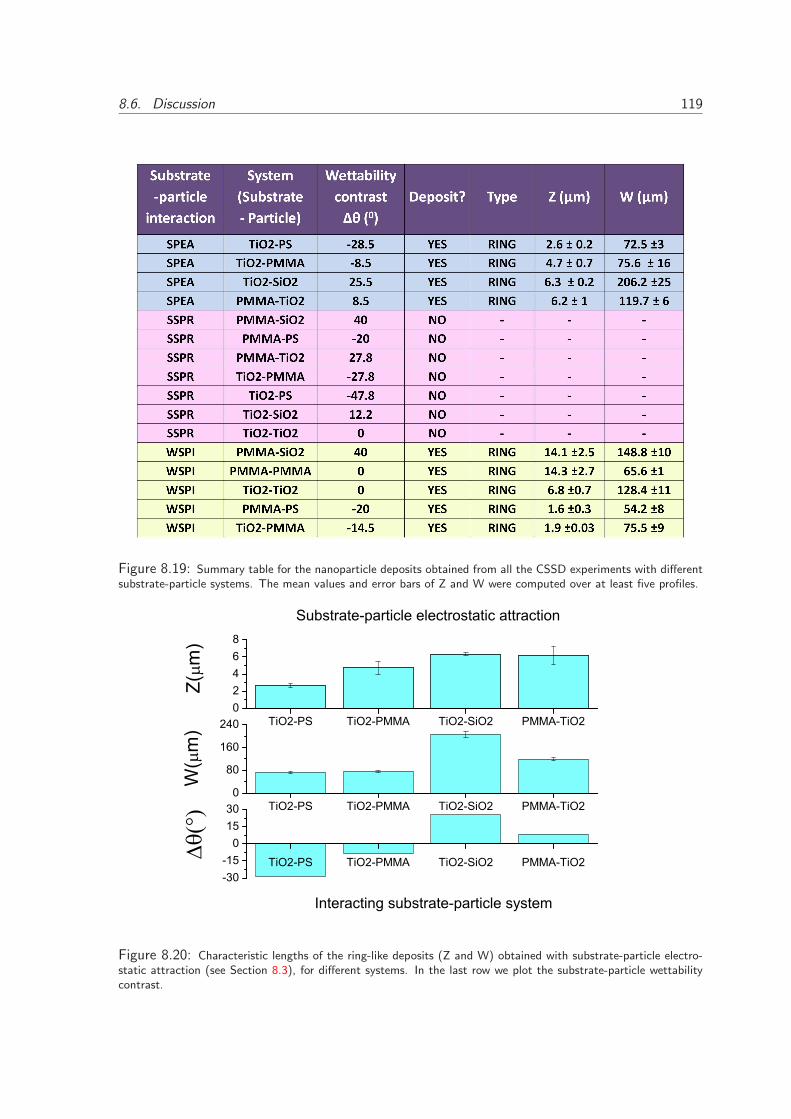
8.6. Discussion 119
Figure 8.19: Summary table for the nanoparticle deposits obtained from all the CSSD experiments with differentsubstrate-particle systems. The mean values and error bars of Z and W were computed over at least five profiles.
TiO2-PS TiO2-PMMA TiO2-SiO2 PMMA-TiO202468
Z(m
)
TiO2-PS TiO2-PMMA TiO2-SiO2 PMMA-TiO20
80
160
240
W
(m
)
TiO2-PS TiO2-PMMA TiO2-SiO2 PMMA-TiO2-30-1501530
Substrate-particle electrostatic attraction
Interacting substrate-particle system
Figure 8.20: Characteristic lengths of the ring-like deposits (Z and W) obtained with substrate-particle electro-static attraction (see Section 8.3), for different systems. In the last row we plot the substrate-particle wettabilitycontrast.
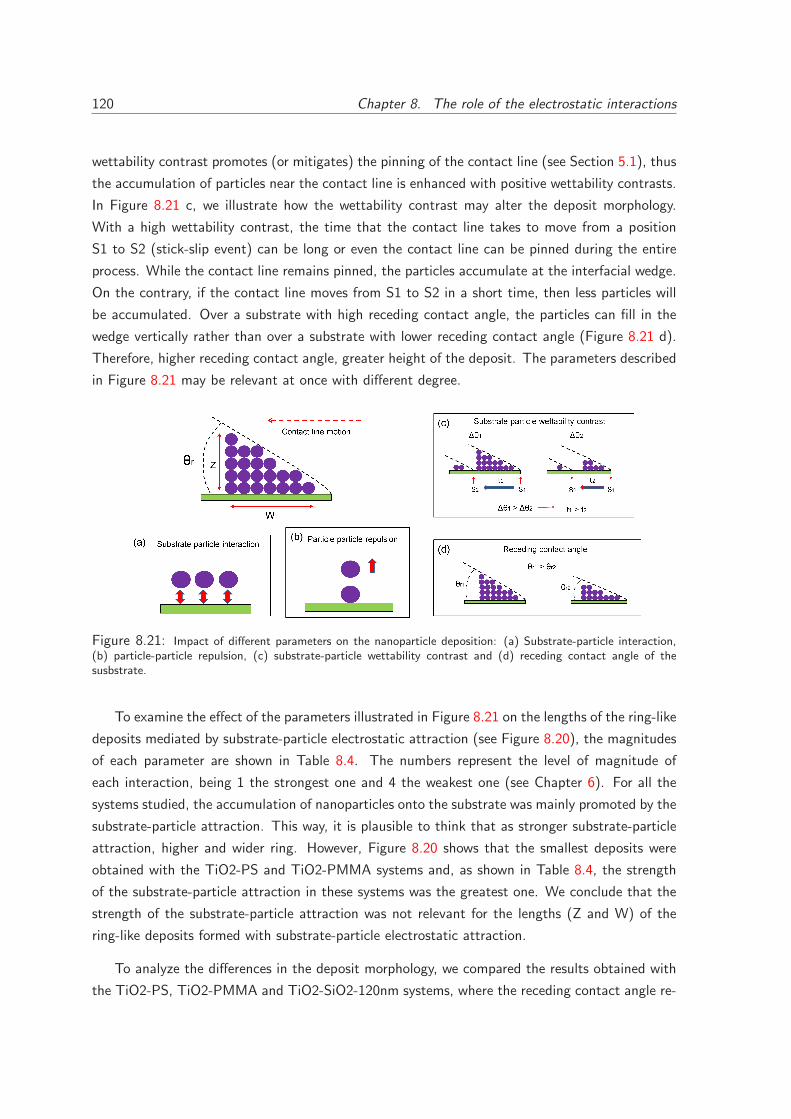
120 Chapter 8. The role of the electrostatic interactions
wettability contrast promotes (or mitigates) the pinning of the contact line (see Section 5.1), thus
the accumulation of particles near the contact line is enhanced with positive wettability contrasts.
In Figure 8.21 c, we illustrate how the wettability contrast may alter the deposit morphology.
With a high wettability contrast, the time that the contact line takes to move from a position
S1 to S2 (stick-slip event) can be long or even the contact line can be pinned during the entire
process. While the contact line remains pinned, the particles accumulate at the interfacial wedge.
On the contrary, if the contact line moves from S1 to S2 in a short time, then less particles will
be accumulated. Over a substrate with high receding contact angle, the particles can fill in the
wedge vertically rather than over a substrate with lower receding contact angle (Figure 8.21 d).
Therefore, higher receding contact angle, greater height of the deposit. The parameters described
in Figure 8.21 may be relevant at once with different degree.
Figure 8.21: Impact of different parameters on the nanoparticle deposition: (a) Substrate-particle interaction,(b) particle-particle repulsion, (c) substrate-particle wettability contrast and (d) receding contact angle of thesusbstrate.
To examine the effect of the parameters illustrated in Figure 8.21 on the lengths of the ring-like
deposits mediated by substrate-particle electrostatic attraction (see Figure 8.20), the magnitudes
of each parameter are shown in Table 8.4. The numbers represent the level of magnitude of
each interaction, being 1 the strongest one and 4 the weakest one (see Chapter 6). For all the
systems studied, the accumulation of nanoparticles onto the substrate was mainly promoted by the
substrate-particle attraction. This way, it is plausible to think that as stronger substrate-particle
attraction, higher and wider ring. However, Figure 8.20 shows that the smallest deposits were
obtained with the TiO2-PS and TiO2-PMMA systems and, as shown in Table 8.4, the strength
of the substrate-particle attraction in these systems was the greatest one. We conclude that the
strength of the substrate-particle attraction was not relevant for the lengths (Z and W) of the
ring-like deposits formed with substrate-particle electrostatic attraction.
To analyze the differences in the deposit morphology, we compared the results obtained with
the TiO2-PS, TiO2-PMMA and TiO2-SiO2-120nm systems, where the receding contact angle re-
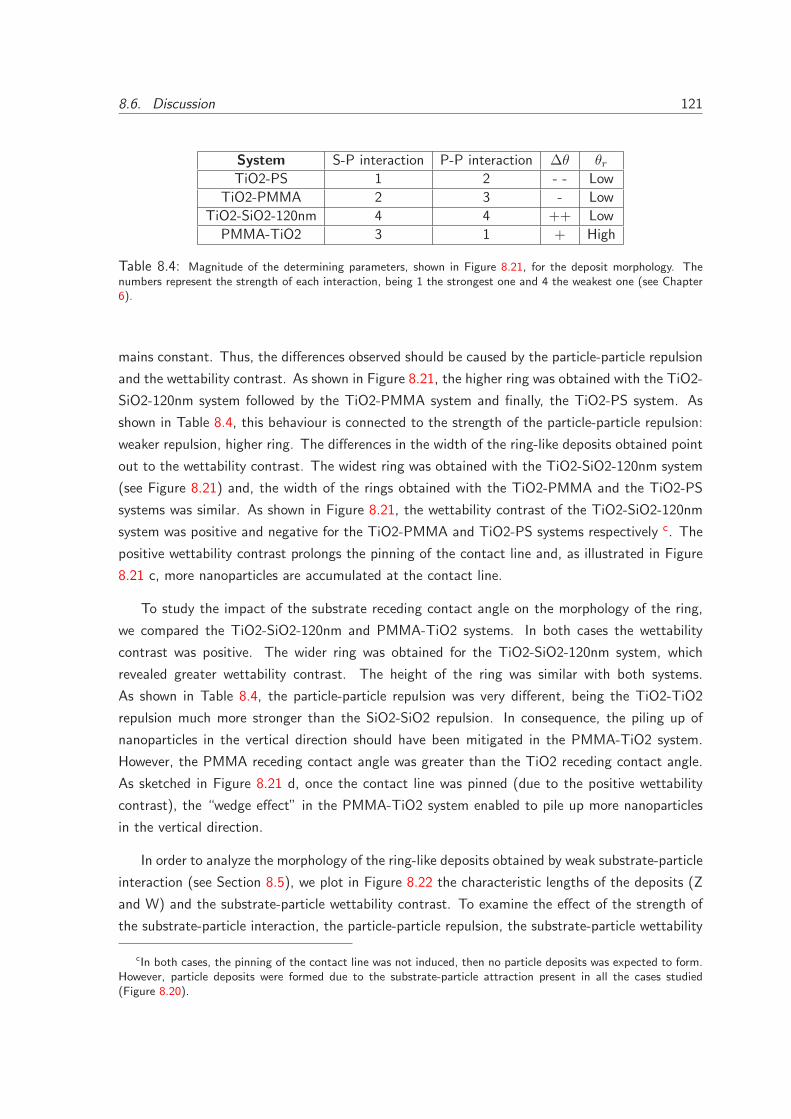
8.6. Discussion 121
System S-P interaction P-P interaction ∆θ θr
TiO2-PS 1 2 - - Low
TiO2-PMMA 2 3 - Low
TiO2-SiO2-120nm 4 4 ++ Low
PMMA-TiO2 3 1 + High
Table 8.4: Magnitude of the determining parameters, shown in Figure 8.21, for the deposit morphology. Thenumbers represent the strength of each interaction, being 1 the strongest one and 4 the weakest one (see Chapter6).
mains constant. Thus, the differences observed should be caused by the particle-particle repulsion
and the wettability contrast. As shown in Figure 8.21, the higher ring was obtained with the TiO2-
SiO2-120nm system followed by the TiO2-PMMA system and finally, the TiO2-PS system. As
shown in Table 8.4, this behaviour is connected to the strength of the particle-particle repulsion:
weaker repulsion, higher ring. The differences in the width of the ring-like deposits obtained point
out to the wettability contrast. The widest ring was obtained with the TiO2-SiO2-120nm system
(see Figure 8.21) and, the width of the rings obtained with the TiO2-PMMA and the TiO2-PS
systems was similar. As shown in Figure 8.21, the wettability contrast of the TiO2-SiO2-120nm
system was positive and negative for the TiO2-PMMA and TiO2-PS systems respectively c. The
positive wettability contrast prolongs the pinning of the contact line and, as illustrated in Figure
8.21 c, more nanoparticles are accumulated at the contact line.
To study the impact of the substrate receding contact angle on the morphology of the ring,
we compared the TiO2-SiO2-120nm and PMMA-TiO2 systems. In both cases the wettability
contrast was positive. The wider ring was obtained for the TiO2-SiO2-120nm system, which
revealed greater wettability contrast. The height of the ring was similar with both systems.
As shown in Table 8.4, the particle-particle repulsion was very different, being the TiO2-TiO2
repulsion much more stronger than the SiO2-SiO2 repulsion. In consequence, the piling up of
nanoparticles in the vertical direction should have been mitigated in the PMMA-TiO2 system.
However, the PMMA receding contact angle was greater than the TiO2 receding contact angle.
As sketched in Figure 8.21 d, once the contact line was pinned (due to the positive wettability
contrast), the “wedge effect” in the PMMA-TiO2 system enabled to pile up more nanoparticles
in the vertical direction.
In order to analyze the morphology of the ring-like deposits obtained by weak substrate-particle
interaction (see Section 8.5), we plot in Figure 8.22 the characteristic lengths of the deposits (Z
and W) and the substrate-particle wettability contrast. To examine the effect of the strength of
the substrate-particle interaction, the particle-particle repulsion, the substrate-particle wettability
cIn both cases, the pinning of the contact line was not induced, then no particle deposits was expected to form.However, particle deposits were formed due to the substrate-particle attraction present in all the cases studied(Figure 8.20).
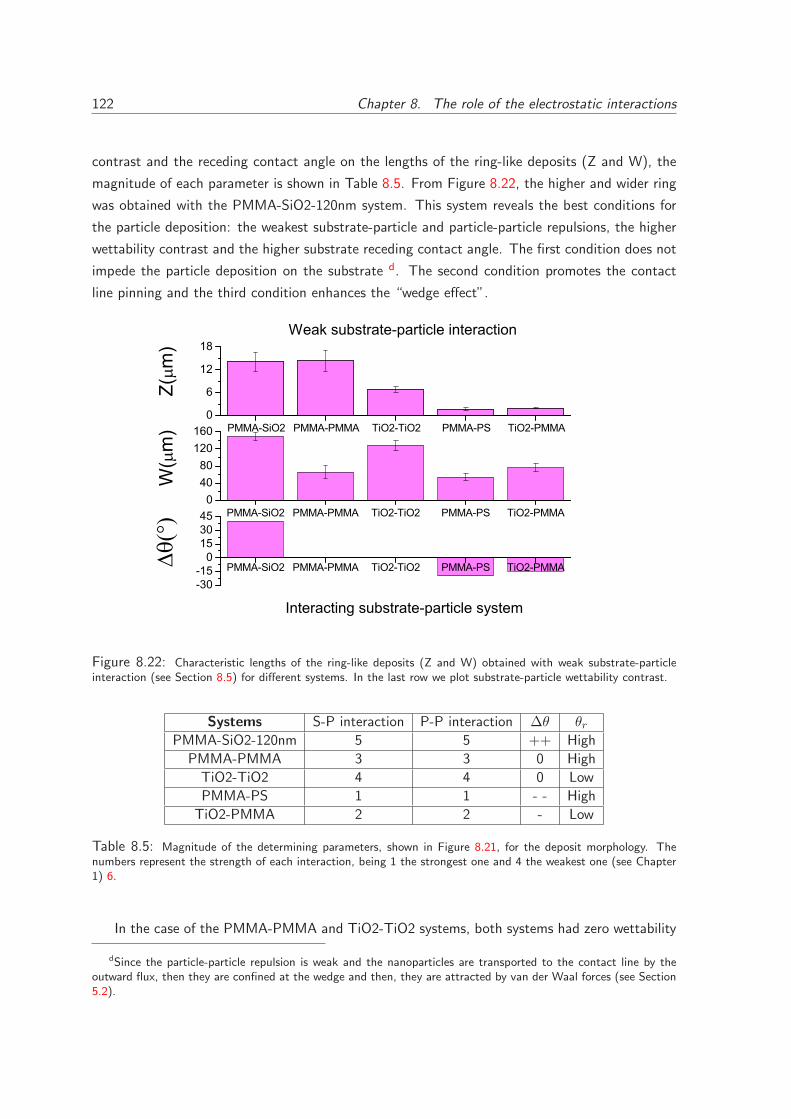
122 Chapter 8. The role of the electrostatic interactions
contrast and the receding contact angle on the lengths of the ring-like deposits (Z and W), the
magnitude of each parameter is shown in Table 8.5. From Figure 8.22, the higher and wider ring
was obtained with the PMMA-SiO2-120nm system. This system reveals the best conditions for
the particle deposition: the weakest substrate-particle and particle-particle repulsions, the higher
wettability contrast and the higher substrate receding contact angle. The first condition does not
impede the particle deposition on the substrate d. The second condition promotes the contact
line pinning and the third condition enhances the “wedge effect”.
PMMA-SiO2 PMMA-PMMA TiO2-TiO2 PMMA-PS TiO2-PMMA0
6
12
18
Interacting substrate-particle system
Weak substrate-particle interaction
PMMA-SiO2 PMMA-PMMA TiO2-TiO2 PMMA-PS TiO2-PMMA04080120160
PMMA-SiO2 PMMA-PMMA TiO2-TiO2 PMMA-PS TiO2-PMMA-30-150153045
W(m)
Z(m)
Figure 8.22: Characteristic lengths of the ring-like deposits (Z and W) obtained with weak substrate-particleinteraction (see Section 8.5) for different systems. In the last row we plot substrate-particle wettability contrast.
Systems S-P interaction P-P interaction ∆θ θr
PMMA-SiO2-120nm 5 5 ++ High
PMMA-PMMA 3 3 0 High
TiO2-TiO2 4 4 0 Low
PMMA-PS 1 1 - - High
TiO2-PMMA 2 2 - Low
Table 8.5: Magnitude of the determining parameters, shown in Figure 8.21, for the deposit morphology. Thenumbers represent the strength of each interaction, being 1 the strongest one and 4 the weakest one (see Chapter1) 6.
In the case of the PMMA-PMMA and TiO2-TiO2 systems, both systems had zero wettability
dSince the particle-particle repulsion is weak and the nanoparticles are transported to the contact line by theoutward flux, then they are confined at the wedge and then, they are attracted by van der Waal forces (see Section5.2).
8.6. Discussion 123
contrast. The lengths (Z and W) of the ring-like deposits could be dictated by the substrate-
particle repulsion, the particle-particle repulsion and the substrate receding contact angle. The
PMMA-PMMA system formed a higher ring than the formed with the TiO2-TiO2 system. This
was due to the high receding contact angle of PMMA. The ring obtained with the TiO2-TiO2
system was wider than the obtained with the PMMA-PMMA system. The substrate-particle
repulsion of the PMMA-PMMA system was slightly stronger than in the TiO2-TiO2 system.
Hence, the TiO2 nanoparticles accumulated on the TiO2 substrate easier. Therefore, the strength
of the substrate-particle repulsion becomes relevant for the particle deposition in the horizontal
direction.
The PMMA-PS and TiO2-PMMA systems presented negative wettability contrast. In both
cases the particle-particle repulsion was alike strong. The rings formed were very similar with
small values Z. However, the ring formed with the TiO2-PMMA system was wider. In this case,
the substrate-particle interaction was weaker (even attractive) than in the PMMA-PS system,
where the particle deposition was less favored.

CHAPTER 9
Effects of particle concentration, size and
polidispersity on the deposit morphology
Controlling the particle deposition in a substrate is a main issue to investigate due to the potential
applications such as biochip devices, sensors, ultrahigh-density optical and magnetic recording
media, etc. Self-assembled 2D colloidal crystals are monolayer arrays of colloidal microspheres
or nanospheres, which have a great variety of successful applications in surface patterning such
as colloidal lithography. This novel technique is used to fabricate diversify structures scaling
down to nanometer features, in which the colloidal particles provide excellent masks or templates.
However, the principal requirement for the success of these applications lies in the capability of
fabricating colloidal crystals with excellent quality and controlled morphology (? ).
Drying of a drop of nanoparticle suspension offer many alternatives towards the generation of
deposits of nanoparticles on solid substrates. Depending on experimental conditions such as the
solid volume fraction or particle size, a variety of morphologies can appear on the substrate (? ).
Many groups have reported the formation of nanoparticle rings, with diameters ranging from a few
hundred nm to a few microns (). Due to the complex physical and chemical processes involved
in the drying of nanoparticle suspensions, simple strategies as the increment in nanoparticle
concentration, are not usually sufficient for the formation of rings of nanoparticles by following
126 Chapter 9. Deposit morphology
solvent evaporation.
In Chapter 8, we found that particle deposits are obtained with the CSSD technique when the
substrate-particle electrostatic interactions are attractive (see Section 8.3) or weak (see Section
8.5). In the present chapter we focused on the variations in the morphology of the particle deposits
when parameter such as nanoparticle concentration, pinning time and particle size are changed.
We performed CSSD experiments with the different nanoparticle suspensions at pH2 on PMMA
substrates. We used this pH because the electrostatic interactions were weak (see Figure 6.4).
PMMA substrates were utilized due to their stable response in contact angle (see Section ??)
and the transparency of the material to be analyzed by optical microscopy. The experiments were
performed at room temperature (25◦C) and relative humidity of 50%.
9.1 Nanoparticles concentration
In Section 8.5, we found that ring-like deposits are obtained with the CSSD technique with differ-
ent nanoparticle suspensions on PMMA substrates at pH2 (weak substrate-particle electrostatic
interactions). In the different experiments performed (see Figure 8.17) the nanoparticle concen-
tration was fixed to ΦV = 1%. In the present section we investigate the effects of the solid volume
fraction on the deposit obtained with CSSD experiments.
As shown in Chapter 7, in a free evaporating drop of nanoparticle suspensions, the concentra-
tion increases during the evaporation and particle deposits are always obtained. However, Stowell
et al. (? ) found that the microscopic morphology of the self-assembled structures formed
depends on the starting nanoparticles concentration in the dispersion prior to deposition. By de-
creasing nanoparticles concentration, the morphology observed changed from rings to polygonal
networks, to ordered hexagonal networks, and finally structures without microstructural order.
They concluded that dilute solutions are more susceptible to establishing Marangoni convection.
Therefore, low concentrations of nanoparticles result in poorly defined structures leading to ex-
perimental difficulties in observing the resultant patterns.
Instead, with the CSSD technique, the particle concentration in bulk remains constant during
the entire process. We expect to find a critical concentration for ring-like deposit formation.
In order to investigate this minimum particle concentration, we performed CSSD experiments
with SiO2-90nm suspensions and PMMA substrates at pH2. The nanoparticle concentration was
decreased (from ΦV = 1% to ΦV = 0.05% ) until no particle deposit was obtained. In Figure 9.1
we plot the contact line dynamics of the different experiments. From ΦV = 1% to ΦV = 0.5%,
the contact line presented stick-slip behaviour, which indicates the existence of particle deposits
onto the substrate. At ΦV = 0.1% the contact line presented an irregular receding motion with
decreasing contact angle. At ΦV = 0.05%, the contact line behaved such as for pure liquids till
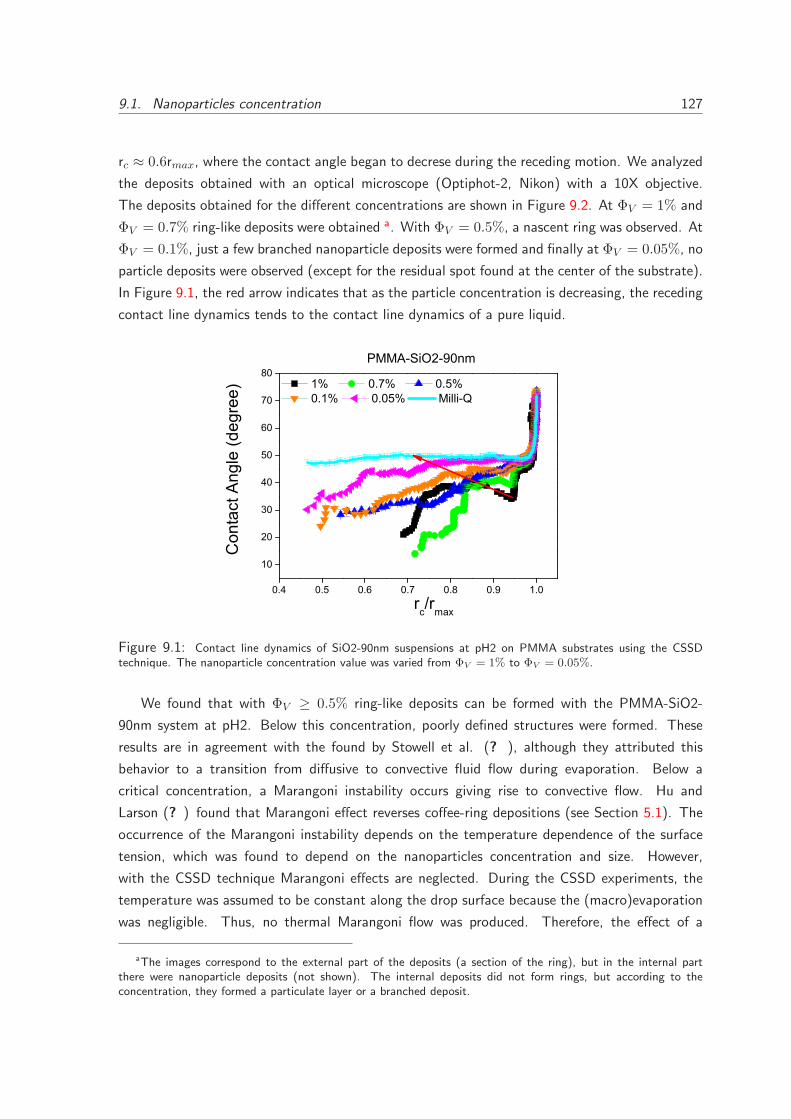
9.1. Nanoparticles concentration 127
rc ≈ 0.6rmax, where the contact angle began to decrese during the receding motion. We analyzed
the deposits obtained with an optical microscope (Optiphot-2, Nikon) with a 10X objective.
The deposits obtained for the different concentrations are shown in Figure 9.2. At ΦV = 1% and
ΦV = 0.7% ring-like deposits were obtained a. With ΦV = 0.5%, a nascent ring was observed. At
ΦV = 0.1%, just a few branched nanoparticle deposits were formed and finally at ΦV = 0.05%, no
particle deposits were observed (except for the residual spot found at the center of the substrate).
In Figure 9.1, the red arrow indicates that as the particle concentration is decreasing, the receding
contact line dynamics tends to the contact line dynamics of a pure liquid.
0.4 0.5 0.6 0.7 0.8 0.9 1.0
10
20
30
40
50
60
70
80
rc/rmax
C
onta
ct A
ngle
(deg
ree)
1% 0.7% 0.5% 0.1% 0.05% Milli-Q
PMMA-SiO2-90nm
Figure 9.1: Contact line dynamics of SiO2-90nm suspensions at pH2 on PMMA substrates using the CSSDtechnique. The nanoparticle concentration value was varied from ΦV = 1% to ΦV = 0.05%.
We found that with ΦV ≥ 0.5% ring-like deposits can be formed with the PMMA-SiO2-
90nm system at pH2. Below this concentration, poorly defined structures were formed. These
results are in agreement with the found by Stowell et al. (? ), although they attributed this
behavior to a transition from diffusive to convective fluid flow during evaporation. Below a
critical concentration, a Marangoni instability occurs giving rise to convective flow. Hu and
Larson (? ) found that Marangoni effect reverses coffee-ring depositions (see Section 5.1). The
occurrence of the Marangoni instability depends on the temperature dependence of the surface
tension, which was found to depend on the nanoparticles concentration and size. However,
with the CSSD technique Marangoni effects are neglected. During the CSSD experiments, the
temperature was assumed to be constant along the drop surface because the (macro)evaporation
was negligible. Thus, no thermal Marangoni flow was produced. Therefore, the effect of a
aThe images correspond to the external part of the deposits (a section of the ring), but in the internal partthere were nanoparticle deposits (not shown). The internal deposits did not form rings, but according to theconcentration, they formed a particulate layer or a branched deposit.
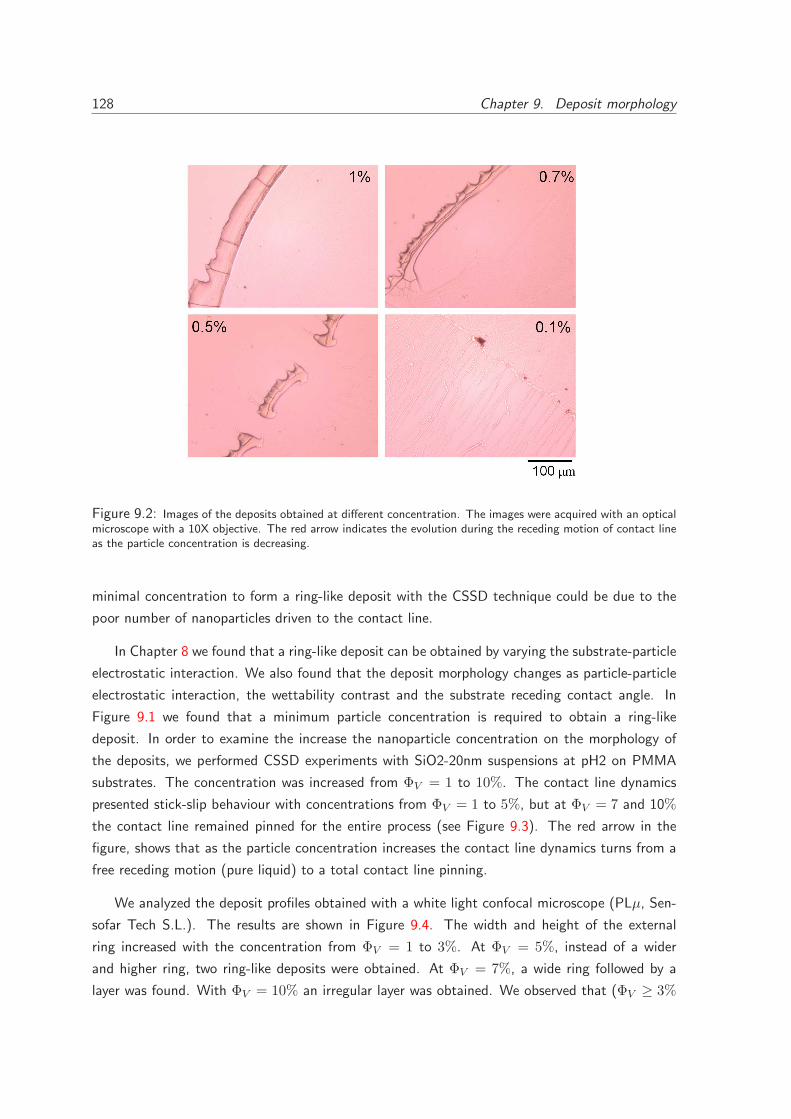
128 Chapter 9. Deposit morphology
Figure 9.2: Images of the deposits obtained at different concentration. The images were acquired with an opticalmicroscope with a 10X objective. The red arrow indicates the evolution during the receding motion of contact lineas the particle concentration is decreasing.
minimal concentration to form a ring-like deposit with the CSSD technique could be due to the
poor number of nanoparticles driven to the contact line.
In Chapter 8 we found that a ring-like deposit can be obtained by varying the substrate-particle
electrostatic interaction. We also found that the deposit morphology changes as particle-particle
electrostatic interaction, the wettability contrast and the substrate receding contact angle. In
Figure 9.1 we found that a minimum particle concentration is required to obtain a ring-like
deposit. In order to examine the increase the nanoparticle concentration on the morphology of
the deposits, we performed CSSD experiments with SiO2-20nm suspensions at pH2 on PMMA
substrates. The concentration was increased from ΦV = 1 to 10%. The contact line dynamics
presented stick-slip behaviour with concentrations from ΦV = 1 to 5%, but at ΦV = 7 and 10%
the contact line remained pinned for the entire process (see Figure 9.3). The red arrow in the
figure, shows that as the particle concentration increases the contact line dynamics turns from a
free receding motion (pure liquid) to a total contact line pinning.
We analyzed the deposit profiles obtained with a white light confocal microscope (PLµ, Sen-
sofar Tech S.L.). The results are shown in Figure 9.4. The width and height of the external
ring increased with the concentration from ΦV = 1 to 3%. At ΦV = 5%, instead of a wider
and higher ring, two ring-like deposits were obtained. At ΦV = 7%, a wide ring followed by a
layer was found. With ΦV = 10% an irregular layer was obtained. We observed that (ΦV ≥ 3%
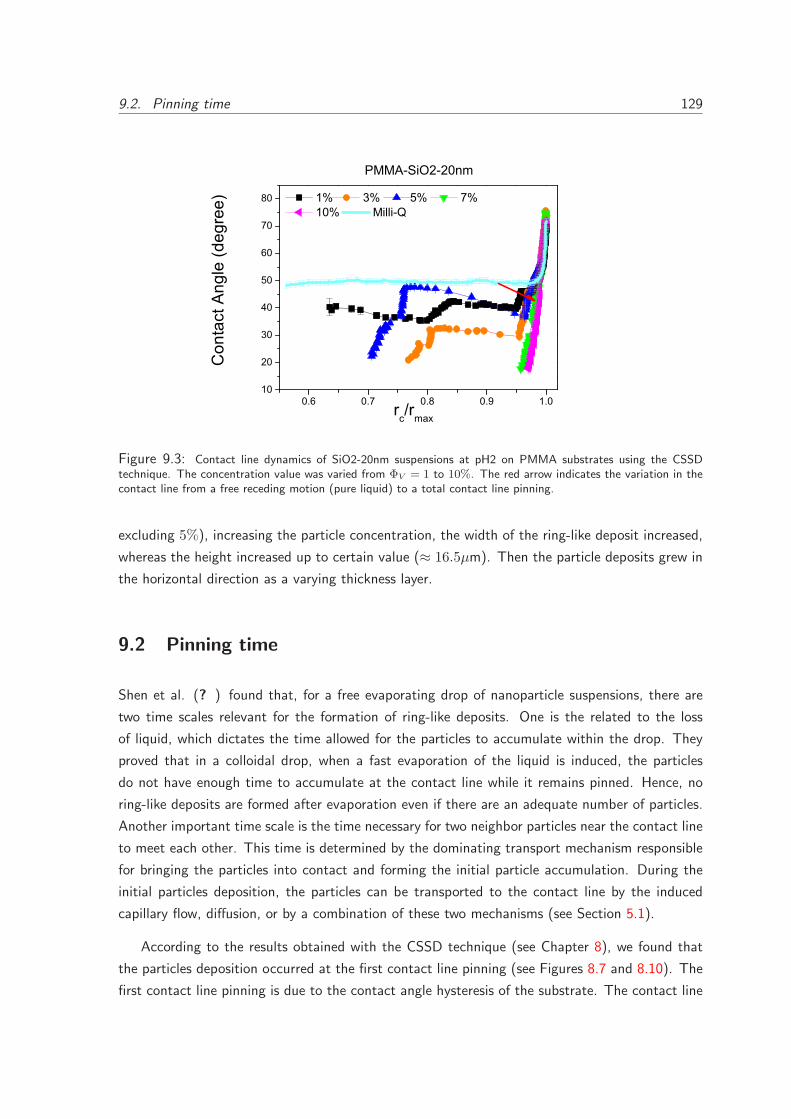
9.2. Pinning time 129
0.6 0.7 0.8 0.9 1.010
20
30
40
50
60
70
80
Con
tact
Ang
le (d
egre
e)
rc/rmax
PMMA-SiO2-20nm
1% 3% 5% 7% 10% Milli-Q
Figure 9.3: Contact line dynamics of SiO2-20nm suspensions at pH2 on PMMA substrates using the CSSDtechnique. The concentration value was varied from ΦV = 1 to 10%. The red arrow indicates the variation in thecontact line from a free receding motion (pure liquid) to a total contact line pinning.
excluding 5%), increasing the particle concentration, the width of the ring-like deposit increased,
whereas the height increased up to certain value (≈ 16.5µm). Then the particle deposits grew in
the horizontal direction as a varying thickness layer.
9.2 Pinning time
Shen et al. (? ) found that, for a free evaporating drop of nanoparticle suspensions, there are
two time scales relevant for the formation of ring-like deposits. One is the related to the loss
of liquid, which dictates the time allowed for the particles to accumulate within the drop. They
proved that in a colloidal drop, when a fast evaporation of the liquid is induced, the particles
do not have enough time to accumulate at the contact line while it remains pinned. Hence, no
ring-like deposits are formed after evaporation even if there are an adequate number of particles.
Another important time scale is the time necessary for two neighbor particles near the contact line
to meet each other. This time is determined by the dominating transport mechanism responsible
for bringing the particles into contact and forming the initial particle accumulation. During the
initial particles deposition, the particles can be transported to the contact line by the induced
capillary flow, diffusion, or by a combination of these two mechanisms (see Section 5.1).
According to the results obtained with the CSSD technique (see Chapter 8), we found that
the particles deposition occurred at the first contact line pinning (see Figures 8.7 and 8.10). The
first contact line pinning is due to the contact angle hysteresis of the substrate. The contact line
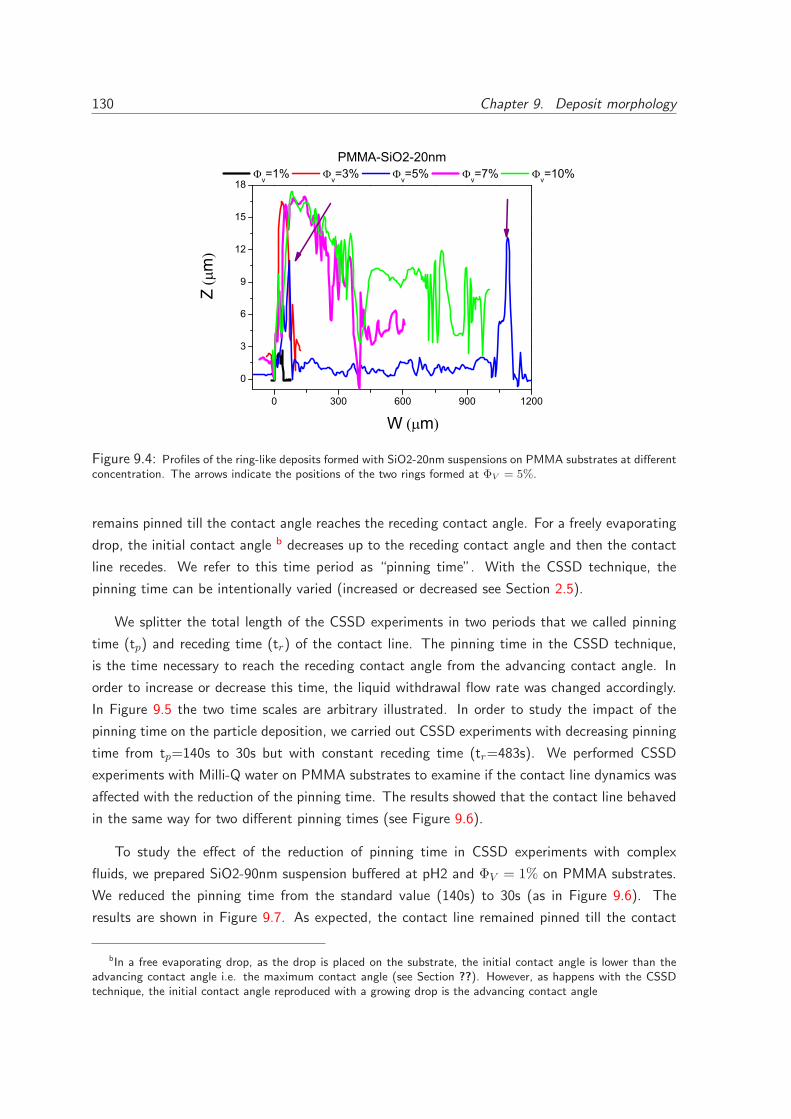
130 Chapter 9. Deposit morphology
0 300 600 900 1200
0
3
6
9
12
15
18
Zm
W m
v=1% v=3% v=5% v=7% v=10%PMMA-SiO2-20nm
Figure 9.4: Profiles of the ring-like deposits formed with SiO2-20nm suspensions on PMMA substrates at differentconcentration. The arrows indicate the positions of the two rings formed at ΦV = 5%.
remains pinned till the contact angle reaches the receding contact angle. For a freely evaporating
drop, the initial contact angle b decreases up to the receding contact angle and then the contact
line recedes. We refer to this time period as “pinning time”. With the CSSD technique, the
pinning time can be intentionally varied (increased or decreased see Section 2.5).
We splitter the total length of the CSSD experiments in two periods that we called pinning
time (tp) and receding time (tr) of the contact line. The pinning time in the CSSD technique,
is the time necessary to reach the receding contact angle from the advancing contact angle. In
order to increase or decrease this time, the liquid withdrawal flow rate was changed accordingly.
In Figure 9.5 the two time scales are arbitrary illustrated. In order to study the impact of the
pinning time on the particle deposition, we carried out CSSD experiments with decreasing pinning
time from tp=140s to 30s but with constant receding time (tr=483s). We performed CSSD
experiments with Milli-Q water on PMMA substrates to examine if the contact line dynamics was
affected with the reduction of the pinning time. The results showed that the contact line behaved
in the same way for two different pinning times (see Figure 9.6).
To study the effect of the reduction of pinning time in CSSD experiments with complex
fluids, we prepared SiO2-90nm suspension buffered at pH2 and ΦV = 1% on PMMA substrates.
We reduced the pinning time from the standard value (140s) to 30s (as in Figure 9.6). The
results are shown in Figure 9.7. As expected, the contact line remained pinned till the contact
bIn a free evaporating drop, as the drop is placed on the substrate, the initial contact angle is lower than theadvancing contact angle i.e. the maximum contact angle (see Section ??). However, as happens with the CSSDtechnique, the initial contact angle reproduced with a growing drop is the advancing contact angle
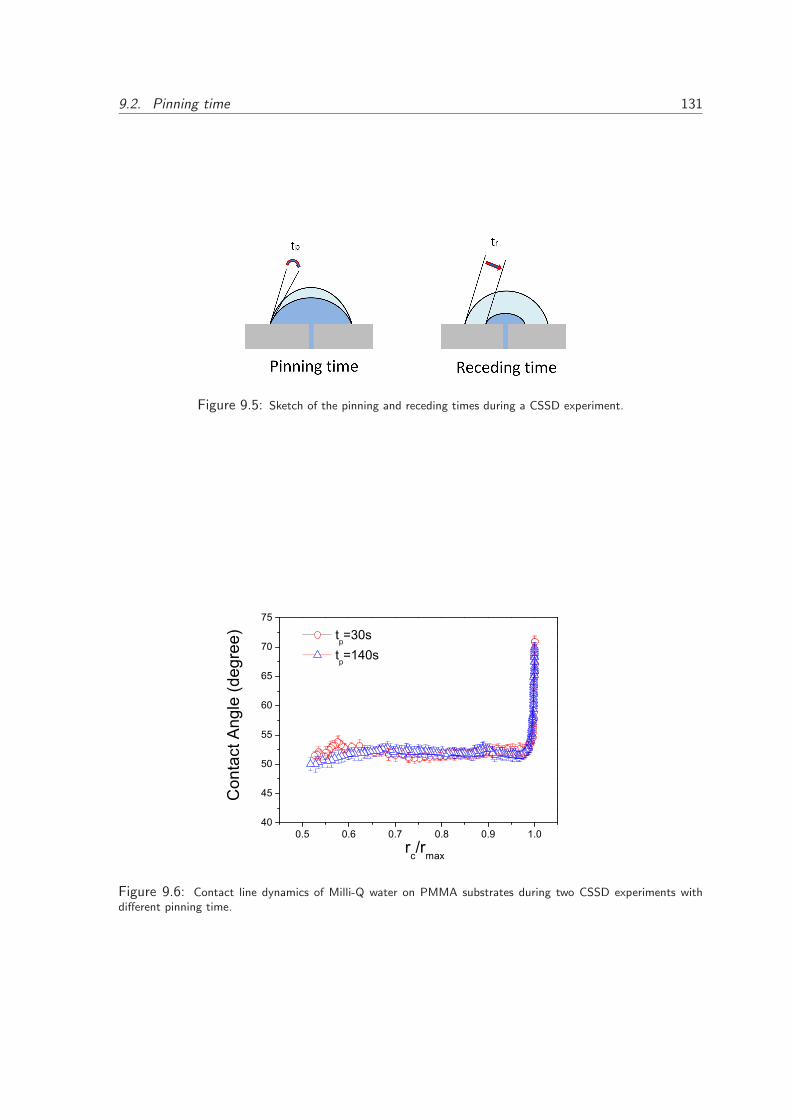
9.2. Pinning time 131
Figure 9.5: Sketch of the pinning and receding times during a CSSD experiment.
0.5 0.6 0.7 0.8 0.9 1.040
45
50
55
60
65
70
75
rc/rmax
Con
tact
Ang
le (d
egre
e)
tp=30s tp=140s
Figure 9.6: Contact line dynamics of Milli-Q water on PMMA substrates during two CSSD experiments withdifferent pinning time.
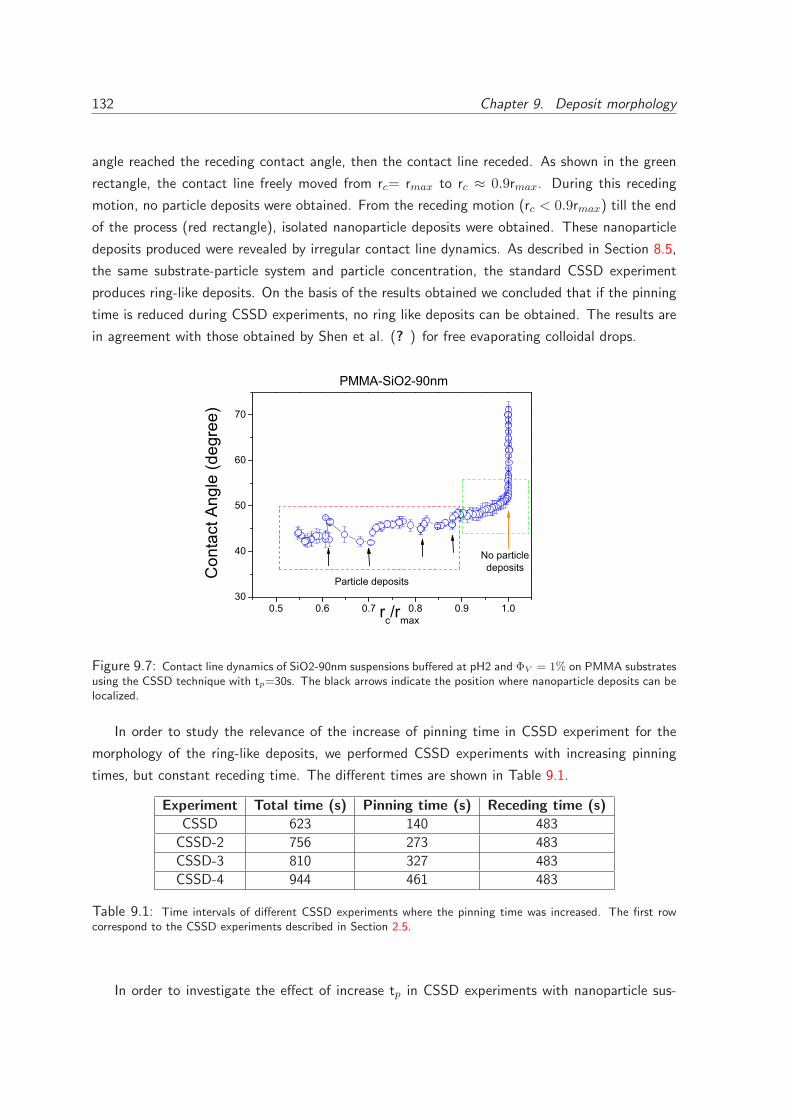
132 Chapter 9. Deposit morphology
angle reached the receding contact angle, then the contact line receded. As shown in the green
rectangle, the contact line freely moved from rc= rmax to rc ≈ 0.9rmax. During this receding
motion, no particle deposits were obtained. From the receding motion (rc < 0.9rmax) till the end
of the process (red rectangle), isolated nanoparticle deposits were obtained. These nanoparticle
deposits produced were revealed by irregular contact line dynamics. As described in Section 8.5,
the same substrate-particle system and particle concentration, the standard CSSD experiment
produces ring-like deposits. On the basis of the results obtained we concluded that if the pinning
time is reduced during CSSD experiments, no ring like deposits can be obtained. The results are
in agreement with those obtained by Shen et al. (? ) for free evaporating colloidal drops.
0.5 0.6 0.7 0.8 0.9 1.030
40
50
60
70
No particle deposits
rc/rmax
Con
tact
Ang
le (d
egre
e)
PMMA-SiO2-90nm
Particle deposits
Figure 9.7: Contact line dynamics of SiO2-90nm suspensions buffered at pH2 and ΦV = 1% on PMMA substratesusing the CSSD technique with tp=30s. The black arrows indicate the position where nanoparticle deposits can belocalized.
In order to study the relevance of the increase of pinning time in CSSD experiment for the
morphology of the ring-like deposits, we performed CSSD experiments with increasing pinning
times, but constant receding time. The different times are shown in Table 9.1.
Experiment Total time (s) Pinning time (s) Receding time (s)
CSSD 623 140 483
CSSD-2 756 273 483
CSSD-3 810 327 483
CSSD-4 944 461 483
Table 9.1: Time intervals of different CSSD experiments where the pinning time was increased. The first rowcorrespond to the CSSD experiments described in Section 2.5.
In order to investigate the effect of increase tp in CSSD experiments with nanoparticle sus-
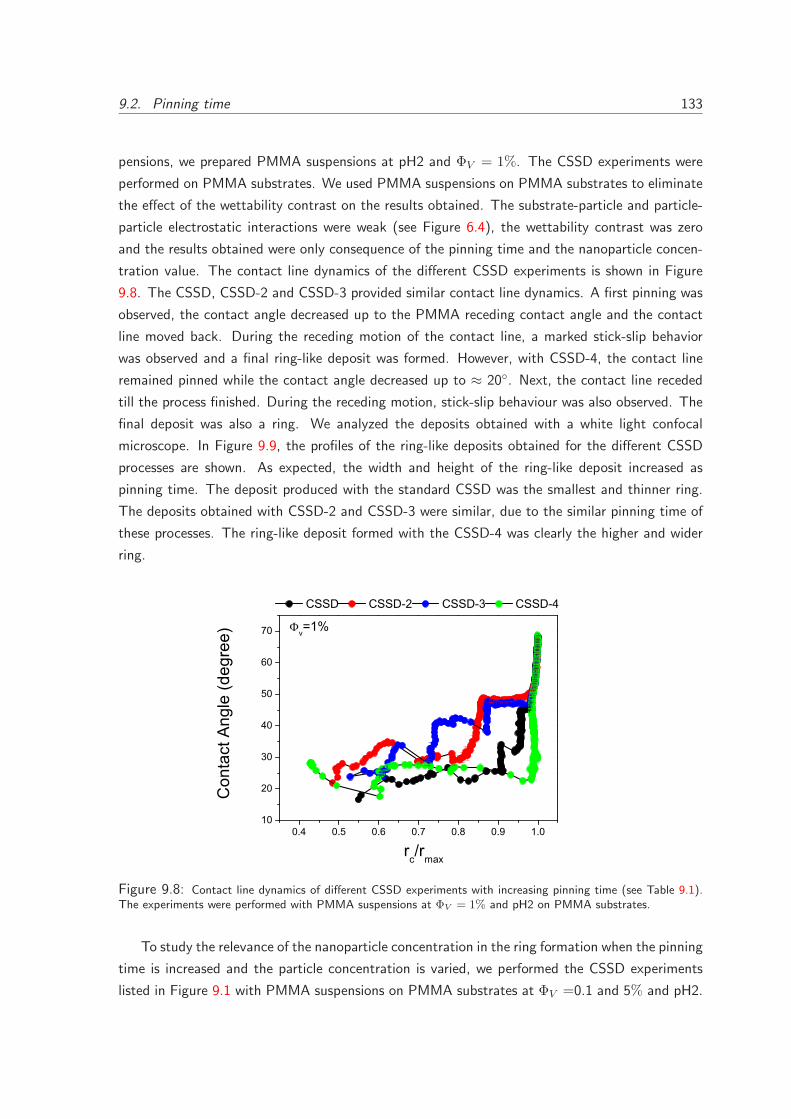
9.2. Pinning time 133
pensions, we prepared PMMA suspensions at pH2 and ΦV = 1%. The CSSD experiments were
performed on PMMA substrates. We used PMMA suspensions on PMMA substrates to eliminate
the effect of the wettability contrast on the results obtained. The substrate-particle and particle-
particle electrostatic interactions were weak (see Figure 6.4), the wettability contrast was zero
and the results obtained were only consequence of the pinning time and the nanoparticle concen-
tration value. The contact line dynamics of the different CSSD experiments is shown in Figure
9.8. The CSSD, CSSD-2 and CSSD-3 provided similar contact line dynamics. A first pinning was
observed, the contact angle decreased up to the PMMA receding contact angle and the contact
line moved back. During the receding motion of the contact line, a marked stick-slip behavior
was observed and a final ring-like deposit was formed. However, with CSSD-4, the contact line
remained pinned while the contact angle decreased up to ≈ 20◦. Next, the contact line receded
till the process finished. During the receding motion, stick-slip behaviour was also observed. The
final deposit was also a ring. We analyzed the deposits obtained with a white light confocal
microscope. In Figure 9.9, the profiles of the ring-like deposits obtained for the different CSSD
processes are shown. As expected, the width and height of the ring-like deposit increased as
pinning time. The deposit produced with the standard CSSD was the smallest and thinner ring.
The deposits obtained with CSSD-2 and CSSD-3 were similar, due to the similar pinning time of
these processes. The ring-like deposit formed with the CSSD-4 was clearly the higher and wider
ring.
0.4 0.5 0.6 0.7 0.8 0.9 1.010
20
30
40
50
60
70 v=1%
CSSD CSSD-2 CSSD-3 CSSD-4
rc/rmax
Con
tact
Ang
le (d
egre
e)
Figure 9.8: Contact line dynamics of different CSSD experiments with increasing pinning time (see Table 9.1).The experiments were performed with PMMA suspensions at ΦV = 1% and pH2 on PMMA substrates.
To study the relevance of the nanoparticle concentration in the ring formation when the pinning
time is increased and the particle concentration is varied, we performed the CSSD experiments
listed in Figure 9.1 with PMMA suspensions on PMMA substrates at ΦV =0.1 and 5% and pH2.
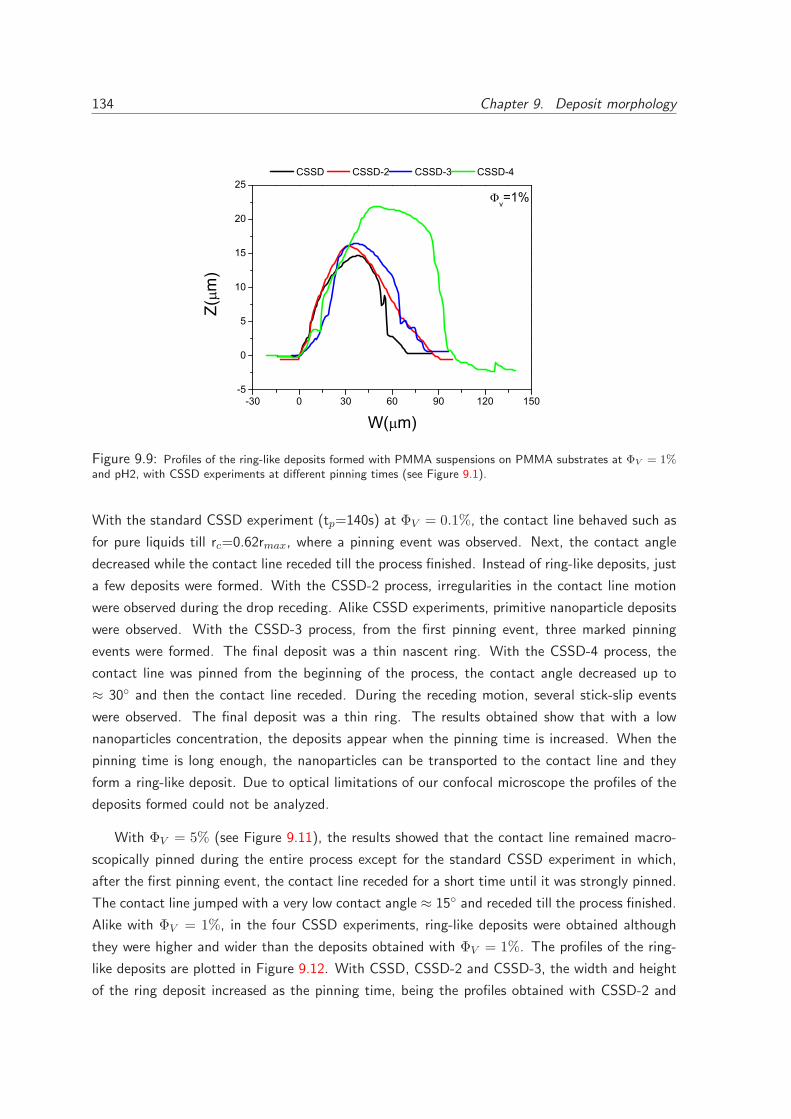
134 Chapter 9. Deposit morphology
-30 0 30 60 90 120 150-5
0
5
10
15
20
25 v=1%
CSSD CSSD-2 CSSD-3 CSSD-4
Z(m
)
W( m)
Figure 9.9: Profiles of the ring-like deposits formed with PMMA suspensions on PMMA substrates at ΦV = 1%and pH2, with CSSD experiments at different pinning times (see Figure 9.1).
With the standard CSSD experiment (tp=140s) at ΦV = 0.1%, the contact line behaved such as
for pure liquids till rc=0.62rmax, where a pinning event was observed. Next, the contact angle
decreased while the contact line receded till the process finished. Instead of ring-like deposits, just
a few deposits were formed. With the CSSD-2 process, irregularities in the contact line motion
were observed during the drop receding. Alike CSSD experiments, primitive nanoparticle deposits
were observed. With the CSSD-3 process, from the first pinning event, three marked pinning
events were formed. The final deposit was a thin nascent ring. With the CSSD-4 process, the
contact line was pinned from the beginning of the process, the contact angle decreased up to
≈ 30◦ and then the contact line receded. During the receding motion, several stick-slip events
were observed. The final deposit was a thin ring. The results obtained show that with a low
nanoparticles concentration, the deposits appear when the pinning time is increased. When the
pinning time is long enough, the nanoparticles can be transported to the contact line and they
form a ring-like deposit. Due to optical limitations of our confocal microscope the profiles of the
deposits formed could not be analyzed.
With ΦV = 5% (see Figure 9.11), the results showed that the contact line remained macro-
scopically pinned during the entire process except for the standard CSSD experiment in which,
after the first pinning event, the contact line receded for a short time until it was strongly pinned.
The contact line jumped with a very low contact angle ≈ 15◦ and receded till the process finished.
Alike with ΦV = 1%, in the four CSSD experiments, ring-like deposits were obtained although
they were higher and wider than the deposits obtained with ΦV = 1%. The profiles of the ring-
like deposits are plotted in Figure 9.12. With CSSD, CSSD-2 and CSSD-3, the width and height
of the ring deposit increased as the pinning time, being the profiles obtained with CSSD-2 and
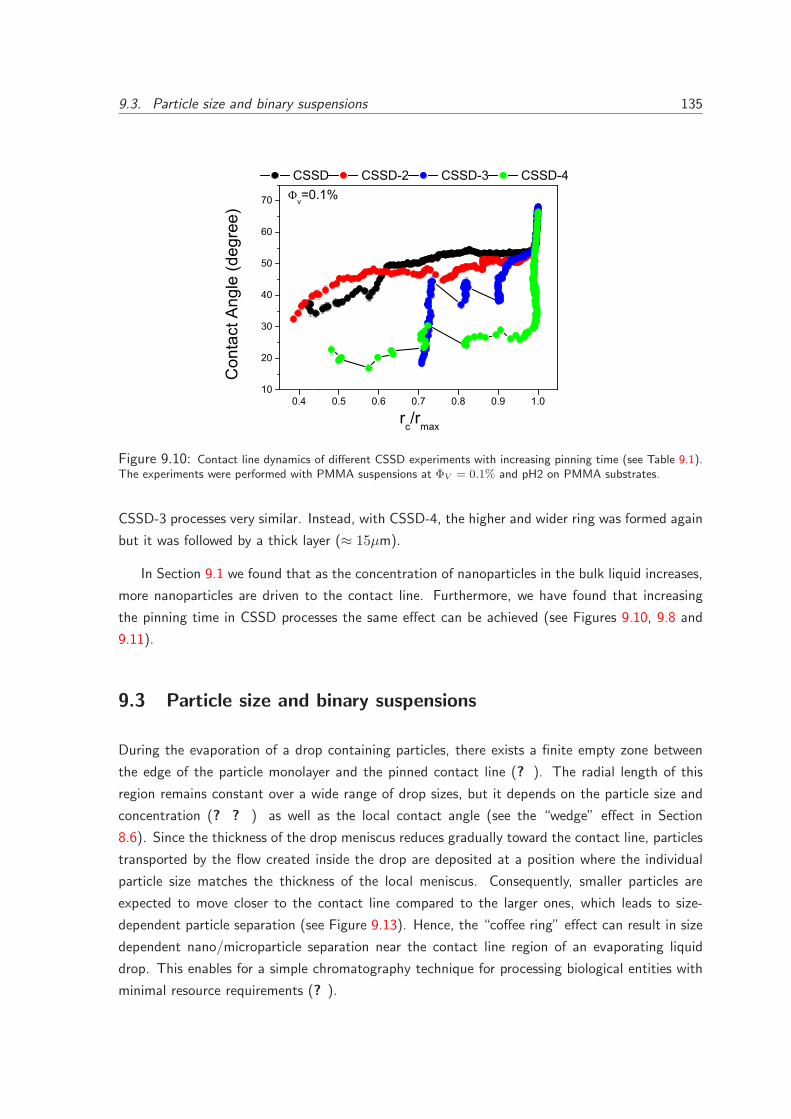
9.3. Particle size and binary suspensions 135
0.4 0.5 0.6 0.7 0.8 0.9 1.010
20
30
40
50
60
70 v=0.1% CSSD CSSD-2 CSSD-3 CSSD-4
rc/rmax
Con
tact
Ang
le (d
egre
e)
Figure 9.10: Contact line dynamics of different CSSD experiments with increasing pinning time (see Table 9.1).The experiments were performed with PMMA suspensions at ΦV = 0.1% and pH2 on PMMA substrates.
CSSD-3 processes very similar. Instead, with CSSD-4, the higher and wider ring was formed again
but it was followed by a thick layer (≈ 15µm).
In Section 9.1 we found that as the concentration of nanoparticles in the bulk liquid increases,
more nanoparticles are driven to the contact line. Furthermore, we have found that increasing
the pinning time in CSSD processes the same effect can be achieved (see Figures 9.10, 9.8 and
9.11).
9.3 Particle size and binary suspensions
During the evaporation of a drop containing particles, there exists a finite empty zone between
the edge of the particle monolayer and the pinned contact line (? ). The radial length of this
region remains constant over a wide range of drop sizes, but it depends on the particle size and
concentration (? ? ) as well as the local contact angle (see the “wedge” effect in Section
8.6). Since the thickness of the drop meniscus reduces gradually toward the contact line, particles
transported by the flow created inside the drop are deposited at a position where the individual
particle size matches the thickness of the local meniscus. Consequently, smaller particles are
expected to move closer to the contact line compared to the larger ones, which leads to size-
dependent particle separation (see Figure 9.13). Hence, the “coffee ring” effect can result in size
dependent nano/microparticle separation near the contact line region of an evaporating liquid
drop. This enables for a simple chromatography technique for processing biological entities with
minimal resource requirements (? ).
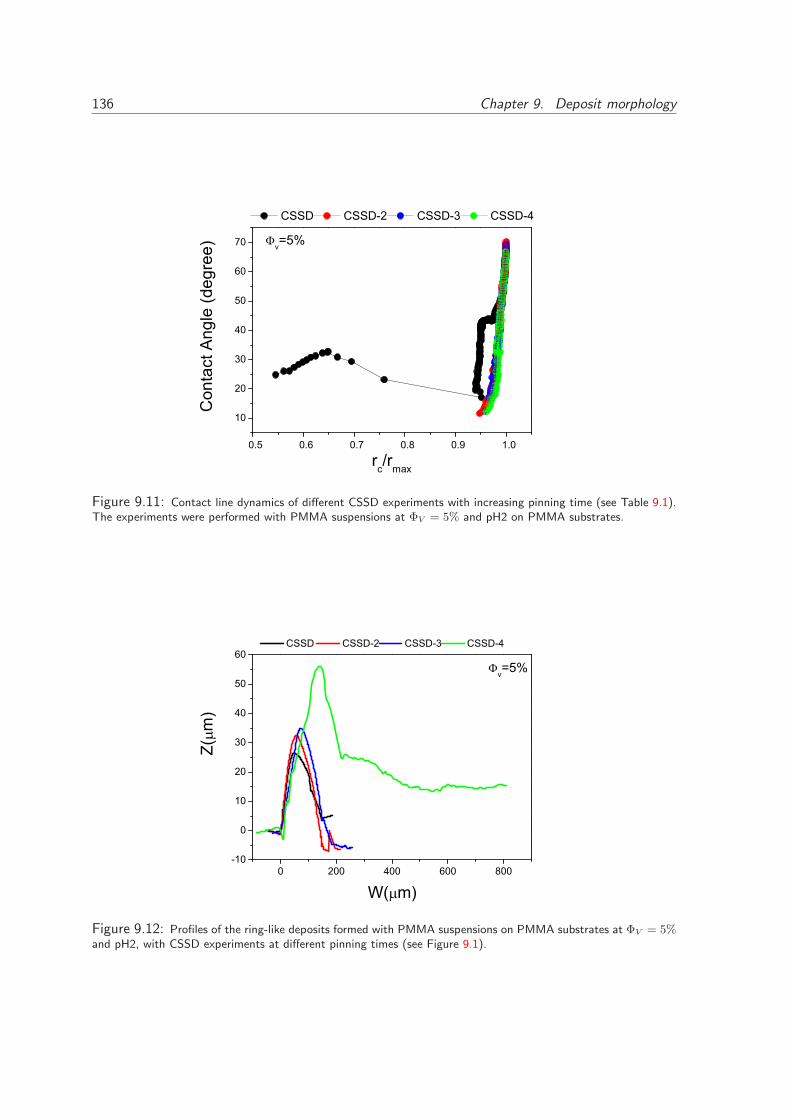
136 Chapter 9. Deposit morphology
0.5 0.6 0.7 0.8 0.9 1.0
10
20
30
40
50
60
70
rc/rmax
Con
tact
Ang
le (d
egre
e)
v=5%
CSSD CSSD-2 CSSD-3 CSSD-4
Figure 9.11: Contact line dynamics of different CSSD experiments with increasing pinning time (see Table 9.1).The experiments were performed with PMMA suspensions at ΦV = 5% and pH2 on PMMA substrates.
0 200 400 600 800-10
0
10
20
30
40
50
60
Z(m
)
v=5%
W( m)
CSSD CSSD-2 CSSD-3 CSSD-4
Figure 9.12: Profiles of the ring-like deposits formed with PMMA suspensions on PMMA substrates at ΦV = 5%and pH2, with CSSD experiments at different pinning times (see Figure 9.1).
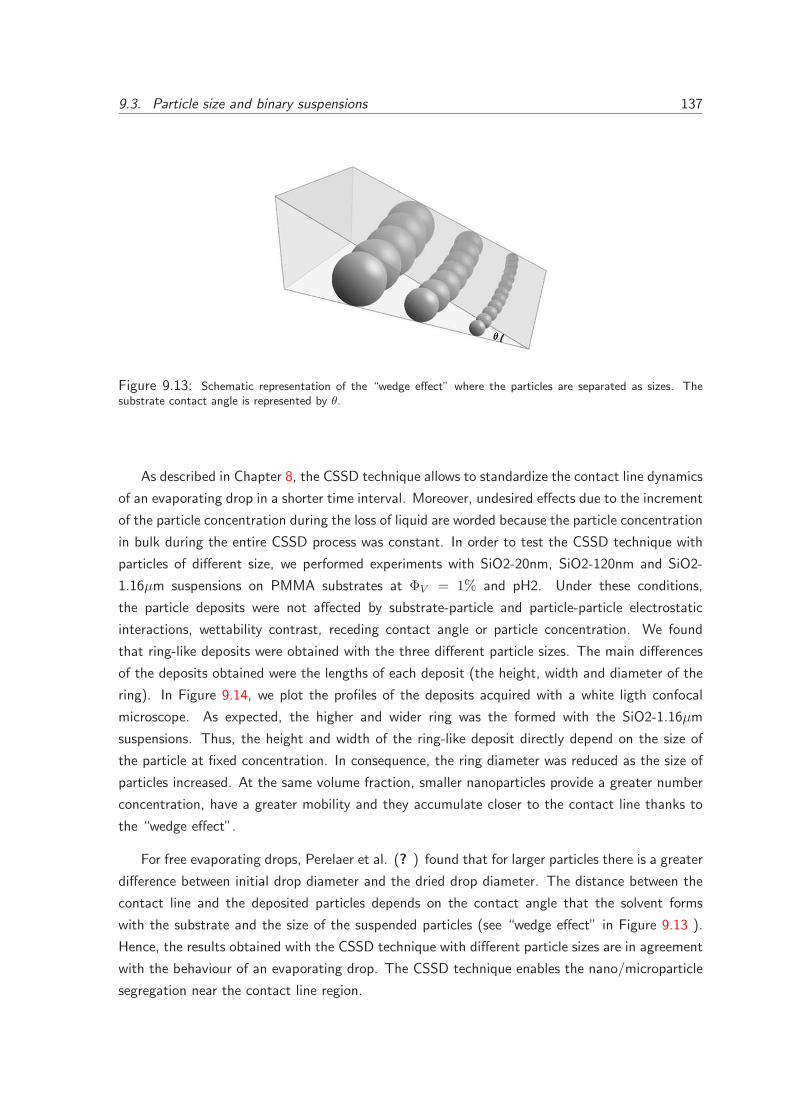
9.3. Particle size and binary suspensions 137
Figure 9.13: Schematic representation of the “wedge effect” where the particles are separated as sizes. Thesubstrate contact angle is represented by θ.
As described in Chapter 8, the CSSD technique allows to standardize the contact line dynamics
of an evaporating drop in a shorter time interval. Moreover, undesired effects due to the increment
of the particle concentration during the loss of liquid are worded because the particle concentration
in bulk during the entire CSSD process was constant. In order to test the CSSD technique with
particles of different size, we performed experiments with SiO2-20nm, SiO2-120nm and SiO2-
1.16µm suspensions on PMMA substrates at ΦV = 1% and pH2. Under these conditions,
the particle deposits were not affected by substrate-particle and particle-particle electrostatic
interactions, wettability contrast, receding contact angle or particle concentration. We found
that ring-like deposits were obtained with the three different particle sizes. The main differences
of the deposits obtained were the lengths of each deposit (the height, width and diameter of the
ring). In Figure 9.14, we plot the profiles of the deposits acquired with a white ligth confocal
microscope. As expected, the higher and wider ring was the formed with the SiO2-1.16µm
suspensions. Thus, the height and width of the ring-like deposit directly depend on the size of
the particle at fixed concentration. In consequence, the ring diameter was reduced as the size of
particles increased. At the same volume fraction, smaller nanoparticles provide a greater number
concentration, have a greater mobility and they accumulate closer to the contact line thanks to
the “wedge effect”.
For free evaporating drops, Perelaer et al. (? ) found that for larger particles there is a greater
difference between initial drop diameter and the dried drop diameter. The distance between the
contact line and the deposited particles depends on the contact angle that the solvent forms
with the substrate and the size of the suspended particles (see “wedge effect” in Figure 9.13 ).
Hence, the results obtained with the CSSD technique with different particle sizes are in agreement
with the behaviour of an evaporating drop. The CSSD technique enables the nano/microparticle
segregation near the contact line region.
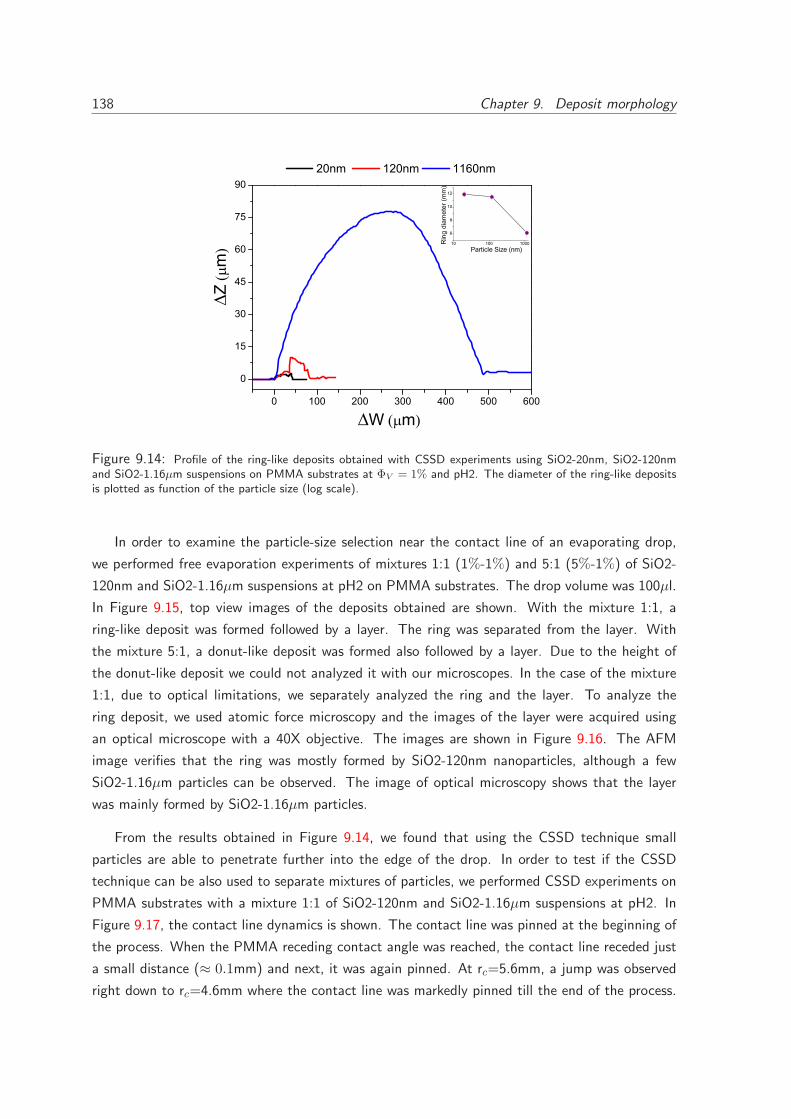
138 Chapter 9. Deposit morphology
0 100 200 300 400 500 600
0
15
30
45
60
75
90 20nm 120nm 1160nm
Zm
W m
10 100 1000
6
8
10
12
Rin
g di
amet
er (m
m)
Particle Size (nm)
Figure 9.14: Profile of the ring-like deposits obtained with CSSD experiments using SiO2-20nm, SiO2-120nmand SiO2-1.16µm suspensions on PMMA substrates at ΦV = 1% and pH2. The diameter of the ring-like depositsis plotted as function of the particle size (log scale).
In order to examine the particle-size selection near the contact line of an evaporating drop,
we performed free evaporation experiments of mixtures 1:1 (1%-1%) and 5:1 (5%-1%) of SiO2-
120nm and SiO2-1.16µm suspensions at pH2 on PMMA substrates. The drop volume was 100µl.
In Figure 9.15, top view images of the deposits obtained are shown. With the mixture 1:1, a
ring-like deposit was formed followed by a layer. The ring was separated from the layer. With
the mixture 5:1, a donut-like deposit was formed also followed by a layer. Due to the height of
the donut-like deposit we could not analyzed it with our microscopes. In the case of the mixture
1:1, due to optical limitations, we separately analyzed the ring and the layer. To analyze the
ring deposit, we used atomic force microscopy and the images of the layer were acquired using
an optical microscope with a 40X objective. The images are shown in Figure 9.16. The AFM
image verifies that the ring was mostly formed by SiO2-120nm nanoparticles, although a few
SiO2-1.16µm particles can be observed. The image of optical microscopy shows that the layer
was mainly formed by SiO2-1.16µm particles.
From the results obtained in Figure 9.14, we found that using the CSSD technique small
particles are able to penetrate further into the edge of the drop. In order to test if the CSSD
technique can be also used to separate mixtures of particles, we performed CSSD experiments on
PMMA substrates with a mixture 1:1 of SiO2-120nm and SiO2-1.16µm suspensions at pH2. In
Figure 9.17, the contact line dynamics is shown. The contact line was pinned at the beginning of
the process. When the PMMA receding contact angle was reached, the contact line receded just
a small distance (≈ 0.1mm) and next, it was again pinned. At rc=5.6mm, a jump was observed
right down to rc=4.6mm where the contact line was markedly pinned till the end of the process.
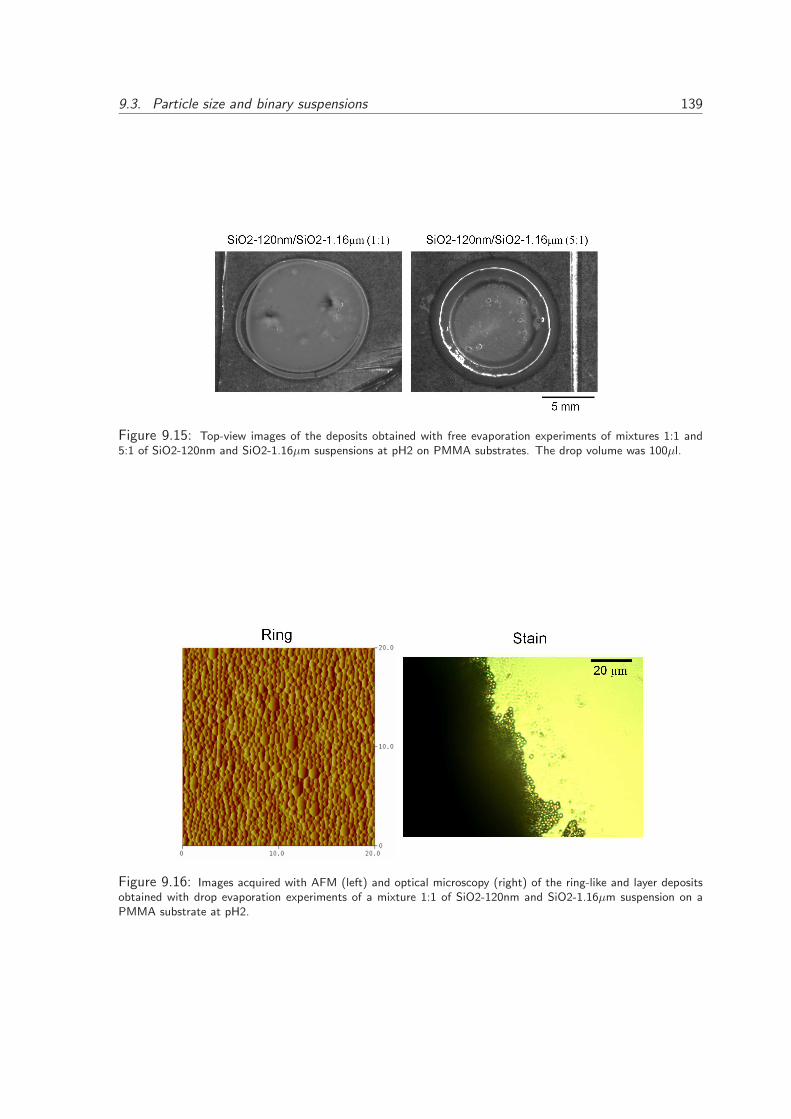
9.3. Particle size and binary suspensions 139
Figure 9.15: Top-view images of the deposits obtained with free evaporation experiments of mixtures 1:1 and5:1 of SiO2-120nm and SiO2-1.16µm suspensions at pH2 on PMMA substrates. The drop volume was 100µl.
Figure 9.16: Images acquired with AFM (left) and optical microscopy (right) of the ring-like and layer depositsobtained with drop evaporation experiments of a mixture 1:1 of SiO2-120nm and SiO2-1.16µm suspension on aPMMA substrate at pH2.
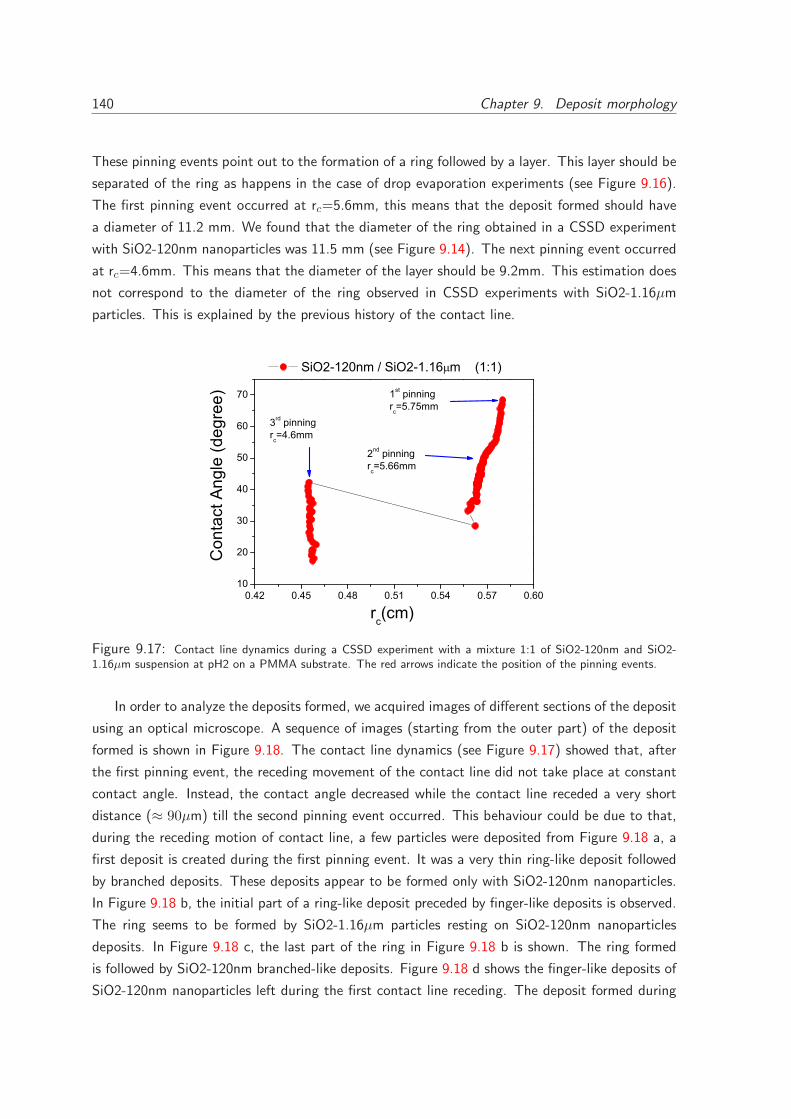
140 Chapter 9. Deposit morphology
These pinning events point out to the formation of a ring followed by a layer. This layer should be
separated of the ring as happens in the case of drop evaporation experiments (see Figure 9.16).
The first pinning event occurred at rc=5.6mm, this means that the deposit formed should have
a diameter of 11.2 mm. We found that the diameter of the ring obtained in a CSSD experiment
with SiO2-120nm nanoparticles was 11.5 mm (see Figure 9.14). The next pinning event occurred
at rc=4.6mm. This means that the diameter of the layer should be 9.2mm. This estimation does
not correspond to the diameter of the ring observed in CSSD experiments with SiO2-1.16µm
particles. This is explained by the previous history of the contact line.
0.42 0.45 0.48 0.51 0.54 0.57 0.6010
20
30
40
50
60
70
3rd pinning r
c=4.6mm
2nd pinning r
c=5.66mm
1st pinning r
c=5.75mm
Con
tact
Ang
le (d
egre
e)
rc(cm)
SiO2-120nm / SiO2-1.16 m (1:1)
Figure 9.17: Contact line dynamics during a CSSD experiment with a mixture 1:1 of SiO2-120nm and SiO2-1.16µm suspension at pH2 on a PMMA substrate. The red arrows indicate the position of the pinning events.
In order to analyze the deposits formed, we acquired images of different sections of the deposit
using an optical microscope. A sequence of images (starting from the outer part) of the deposit
formed is shown in Figure 9.18. The contact line dynamics (see Figure 9.17) showed that, after
the first pinning event, the receding movement of the contact line did not take place at constant
contact angle. Instead, the contact angle decreased while the contact line receded a very short
distance (≈ 90µm) till the second pinning event occurred. This behaviour could be due to that,
during the receding motion of contact line, a few particles were deposited from Figure 9.18 a, a
first deposit is created during the first pinning event. It was a very thin ring-like deposit followed
by branched deposits. These deposits appear to be formed only with SiO2-120nm nanoparticles.
In Figure 9.18 b, the initial part of a ring-like deposit preceded by finger-like deposits is observed.
The ring seems to be formed by SiO2-1.16µm particles resting on SiO2-120nm nanoparticles
deposits. In Figure 9.18 c, the last part of the ring in Figure 9.18 b is shown. The ring formed
is followed by SiO2-120nm branched-like deposits. Figure 9.18 d shows the finger-like deposits of
SiO2-120nm nanoparticles left during the first contact line receding. The deposit formed during
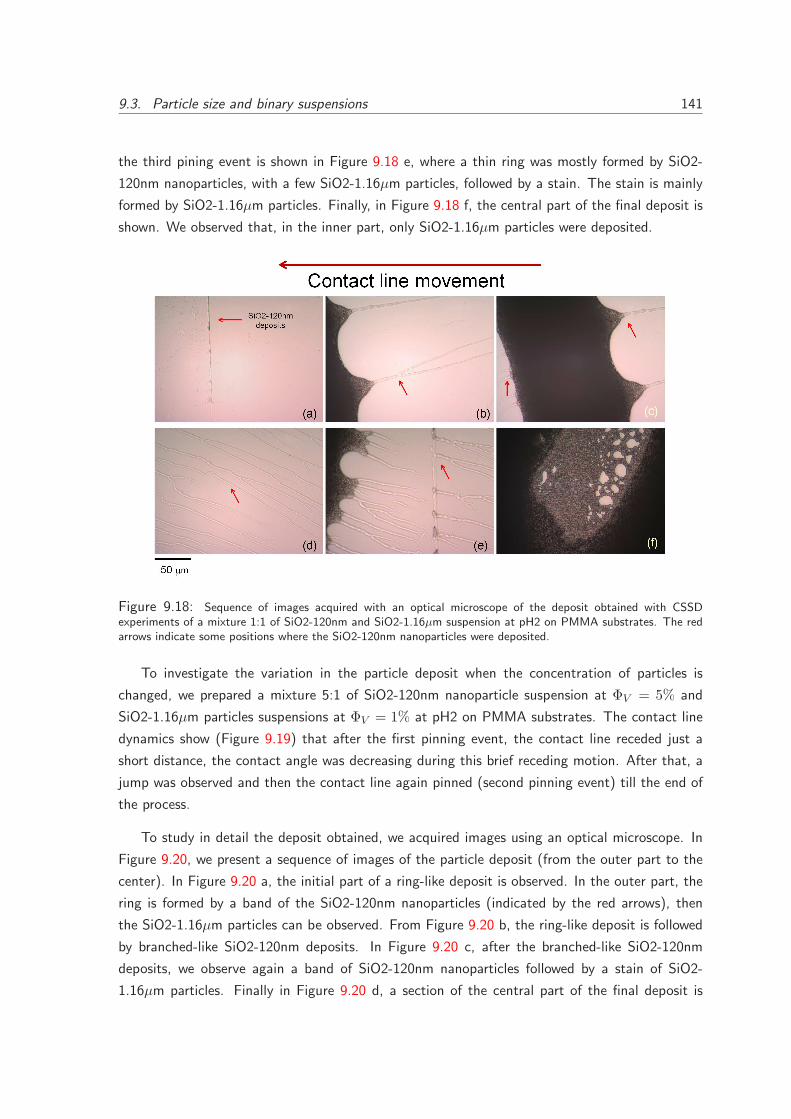
9.3. Particle size and binary suspensions 141
the third pining event is shown in Figure 9.18 e, where a thin ring was mostly formed by SiO2-
120nm nanoparticles, with a few SiO2-1.16µm particles, followed by a stain. The stain is mainly
formed by SiO2-1.16µm particles. Finally, in Figure 9.18 f, the central part of the final deposit is
shown. We observed that, in the inner part, only SiO2-1.16µm particles were deposited.
Figure 9.18: Sequence of images acquired with an optical microscope of the deposit obtained with CSSDexperiments of a mixture 1:1 of SiO2-120nm and SiO2-1.16µm suspension at pH2 on PMMA substrates. The redarrows indicate some positions where the SiO2-120nm nanoparticles were deposited.
To investigate the variation in the particle deposit when the concentration of particles is
changed, we prepared a mixture 5:1 of SiO2-120nm nanoparticle suspension at ΦV = 5% and
SiO2-1.16µm particles suspensions at ΦV = 1% at pH2 on PMMA substrates. The contact line
dynamics show (Figure 9.19) that after the first pinning event, the contact line receded just a
short distance, the contact angle was decreasing during this brief receding motion. After that, a
jump was observed and then the contact line again pinned (second pinning event) till the end of
the process.
To study in detail the deposit obtained, we acquired images using an optical microscope. In
Figure 9.20, we present a sequence of images of the particle deposit (from the outer part to the
center). In Figure 9.20 a, the initial part of a ring-like deposit is observed. In the outer part, the
ring is formed by a band of the SiO2-120nm nanoparticles (indicated by the red arrows), then
the SiO2-1.16µm particles can be observed. From Figure 9.20 b, the ring-like deposit is followed
by branched-like SiO2-120nm deposits. In Figure 9.20 c, after the branched-like SiO2-120nm
deposits, we observe again a band of SiO2-120nm nanoparticles followed by a stain of SiO2-
1.16µm particles. Finally in Figure 9.20 d, a section of the central part of the final deposit is
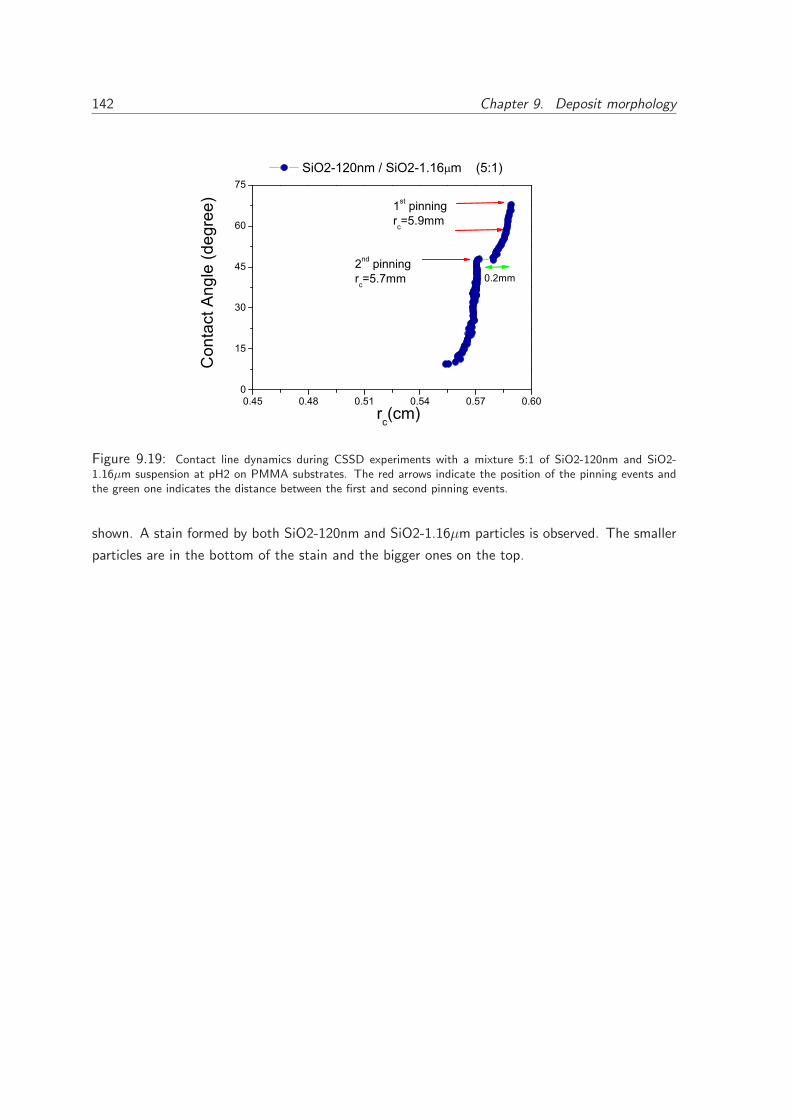
142 Chapter 9. Deposit morphology
0.45 0.48 0.51 0.54 0.57 0.600
15
30
45
60
75
2nd pinning rc=5.7mm
rc(cm)
Con
tact
Ang
le (d
egre
e)
SiO2-120nm / SiO2-1.16 m (5:1)
1st pinning rc=5.9mm
0.2mm
Figure 9.19: Contact line dynamics during CSSD experiments with a mixture 5:1 of SiO2-120nm and SiO2-1.16µm suspension at pH2 on PMMA substrates. The red arrows indicate the position of the pinning events andthe green one indicates the distance between the first and second pinning events.
shown. A stain formed by both SiO2-120nm and SiO2-1.16µm particles is observed. The smaller
particles are in the bottom of the stain and the bigger ones on the top.
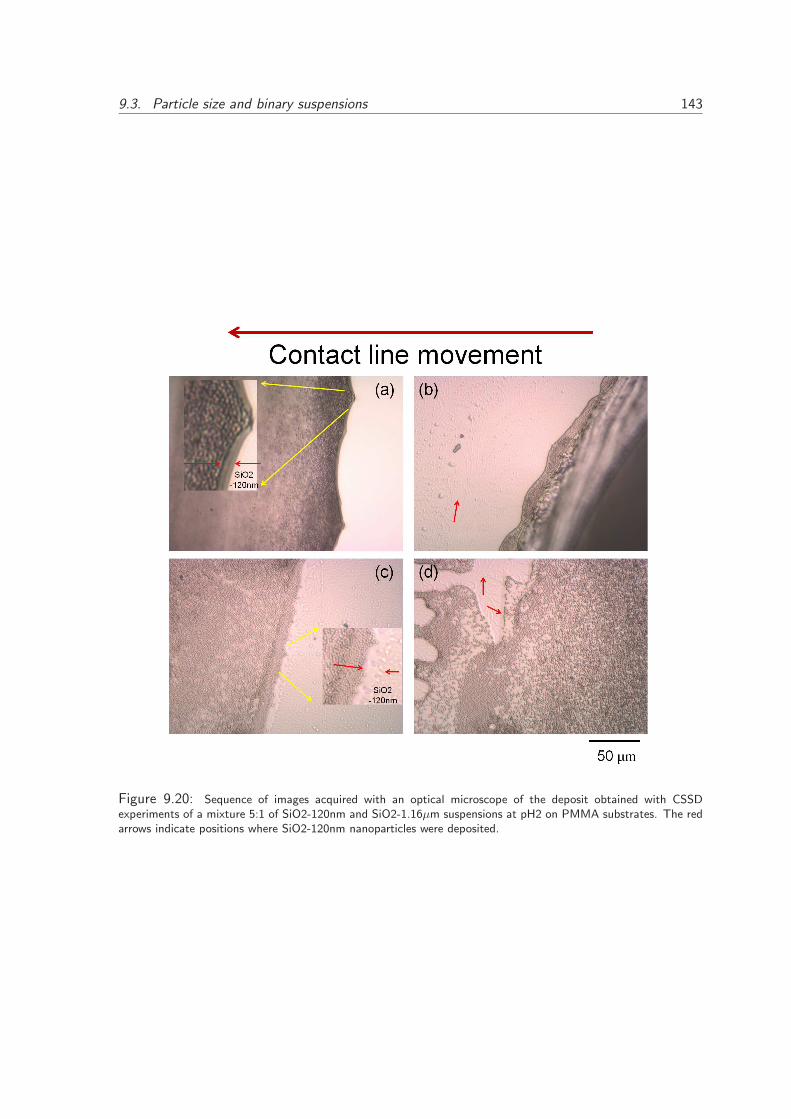
9.3. Particle size and binary suspensions 143
Figure 9.20: Sequence of images acquired with an optical microscope of the deposit obtained with CSSDexperiments of a mixture 5:1 of SiO2-120nm and SiO2-1.16µm suspensions at pH2 on PMMA substrates. The redarrows indicate positions where SiO2-120nm nanoparticles were deposited.

CHAPTER 10
Conclusions
Receding contact lines of complex liquids
Moving drops are an efficient way of collecting nanoparticles. The activated dynamics of the
contact line enables the directional drying of colloidal suspensions. The “coffee stain” effect in
the deposit formation produced by driven contact lines can be suppressed on electrically charged
substrates. We have found that, varying the medium pH, the “coffee stain” effect can be canceled
provided that the substrate is weakly charged and the loss of drop volume is driven from the drop
bulk. The deposit morphology can be modulated by the wettability contrast between substrate
and particle and the pinning time. This opens up a new method of controlling deposition patterns
through change of substrate electric charge and the particle-substrate wettabillity contrast.
English
The most important conclusions of the part II of this work are summarized as follows:
i. With Controlled Shrinking Dessile Drop (CSSD) experiments of nanoparticle suspensions at
free pH, no deposits are obtained even by varying particle volume fraction and particle size.
146 Chapter 10. Conclusions
ii. The weak substrate-particle and particle-particle electrostatic interactions enhance the pin-
ning of the contact line for free evaporating drop of nanoparticle suspensions.
iii. No particle deposit is obtained with the CSSD technique when the substrate-particle elec-
trostatic repulsion is strong.
iv. Ring-like deposits are obtained with the CSSD technique when there exist substrate-particle
electrostatic attraction and weak substrate-particle interaction.
v. The morphology of the nanoparticle deposits are modulated at different degree by the
following parameters: the strength of the substrate-particle interaction, the particle-particle
repulsion, the substrate-particle wettability contrast and the substrate receding contact
angle.
vi. A minimum particle concentration is required for ring-like deposit produced with the CSSD
technique.
vii. As particle concentration increases, the ring formed with the CSSD technique increases in
thickness and height till reach a maximum height. Above certain concentration, the ring
becomes a particulate film.
viii. The pinning time is a relevant parameter for the deposit formation. No particle deposits
are found if the pinning time is reduced. However, an increase of pinning time enables the
ring formation even at low particle concentration.
ix. The CSSD technique enables the nano/microparticle segregation near the contact line re-
gion.
Espanol
Las conclusiones mas importantes de la parte II de este trabajo estan resumidas a continuacion:
i. No se encontraron depositos de partıculas utilizando la tecnica CSSD con suspensiones
de nanopartıculas a pH libre, y en donde la concentracion y tamano de partıcula fueron
variados.
ii. En experimentos de evaporacion libre donde las interacciones electrostaticas sustrato-partıcula
y partıcula-partıcula fueron debilitadas vıa pH del medio, se encontro que el anclaje de la
lınea de contacto fue reforzado, impidiendo el retroceso de la lınea de contacto.
iii. No se obtienen depositos de partıculas mediante la tecnica CSSD con suspensiones de
nanopartıculas donde las interacciones electrostaticas partıcula-sustrato son altamente re-
pulsivas.
147
iv. Depositos en forma de anillo se obtienen con la tecnica CSSD cuando las interacciones
electrostaticas sustrato-partıcula son atractivas o debiles.
v. La morfologıa de los depositos pueder ser modulada a diferentes grados por parametros
como la intensidad de las interacciones electrostaticas sustrato-partıcula, partıcula-partıcula,
el contraste de mojabilidad sustrato-partıcula, ası como el angulo de retroceso del sustrato.
vi. Una mınima concentracion de partıculas es requerida para la formacion de depositos en
forma de anillo con la tecnica CSSD.
vii. Cuando la concentracion de partıcula es incrementada, el anillo formado con la tecnica
CSSD aumenta en grosor y altura hasta llegar a una altura lımite, en la cual el incremento
en concentracion conlleva al engrosamiento del anillo hasta convertirse en una pelıcula.
viii. El tiempo de anclaje de la lınea de contacto es un parametro relevante en la formacion de
depositos. Con la tecnica CSSD se ha encontrado que reduciendo este tiempo, se carece
de formacion de anillos. Sin embargo, incrementando el tiempo de anclaje se favorece a la
formacion de anillos aun a concentraciones bajas de partıculas.
ix. La tecnica CSSD es capaz de discriminar el tamano de partıcula llevando las mas pequenas
cerca de la lınea de contacto y transportando las mas grandes al centro de la gota.


Part III
Appendices

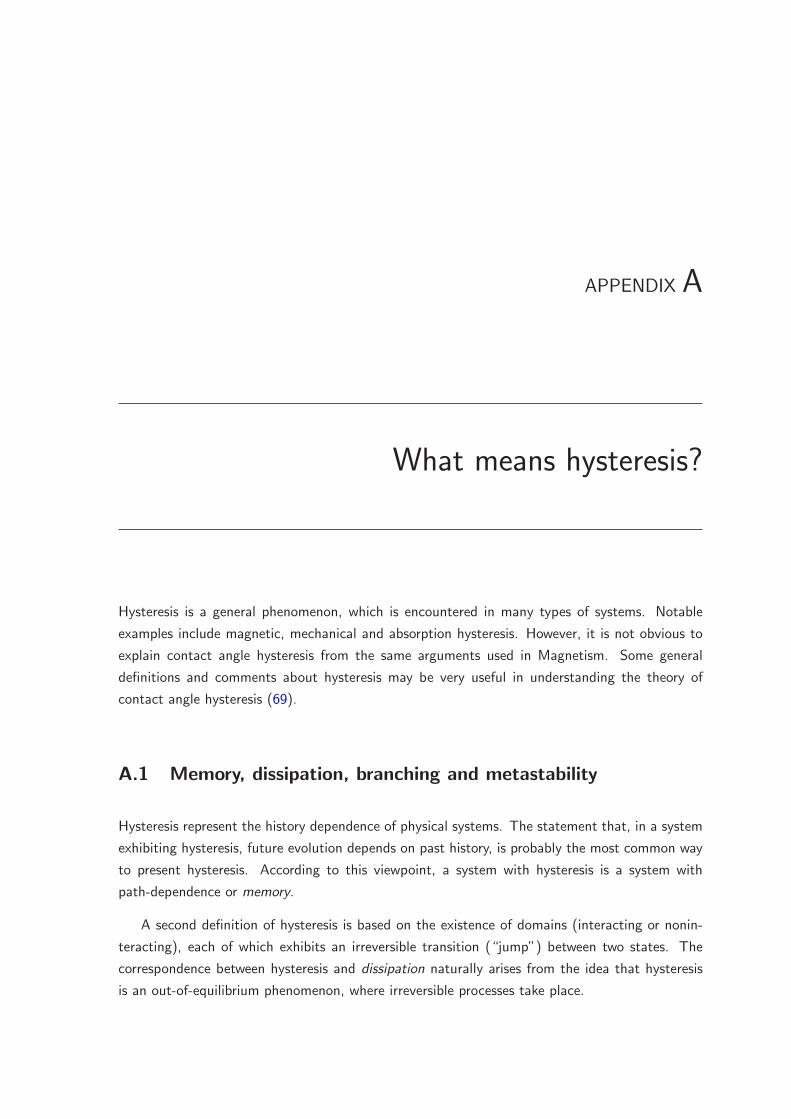
APPENDIX A
What means hysteresis?
Hysteresis is a general phenomenon, which is encountered in many types of systems. Notable
examples include magnetic, mechanical and absorption hysteresis. However, it is not obvious to
explain contact angle hysteresis from the same arguments used in Magnetism. Some general
definitions and comments about hysteresis may be very useful in understanding the theory of
contact angle hysteresis (69).
A.1 Memory, dissipation, branching and metastability
Hysteresis represent the history dependence of physical systems. The statement that, in a system
exhibiting hysteresis, future evolution depends on past history, is probably the most common way
to present hysteresis. According to this viewpoint, a system with hysteresis is a system with
path-dependence or memory.
A second definition of hysteresis is based on the existence of domains (interacting or nonin-
teracting), each of which exhibits an irreversible transition (“jump”) between two states. The
correspondence between hysteresis and dissipation naturally arises from the idea that hysteresis
is an out-of-equilibrium phenomenon, where irreversible processes take place.
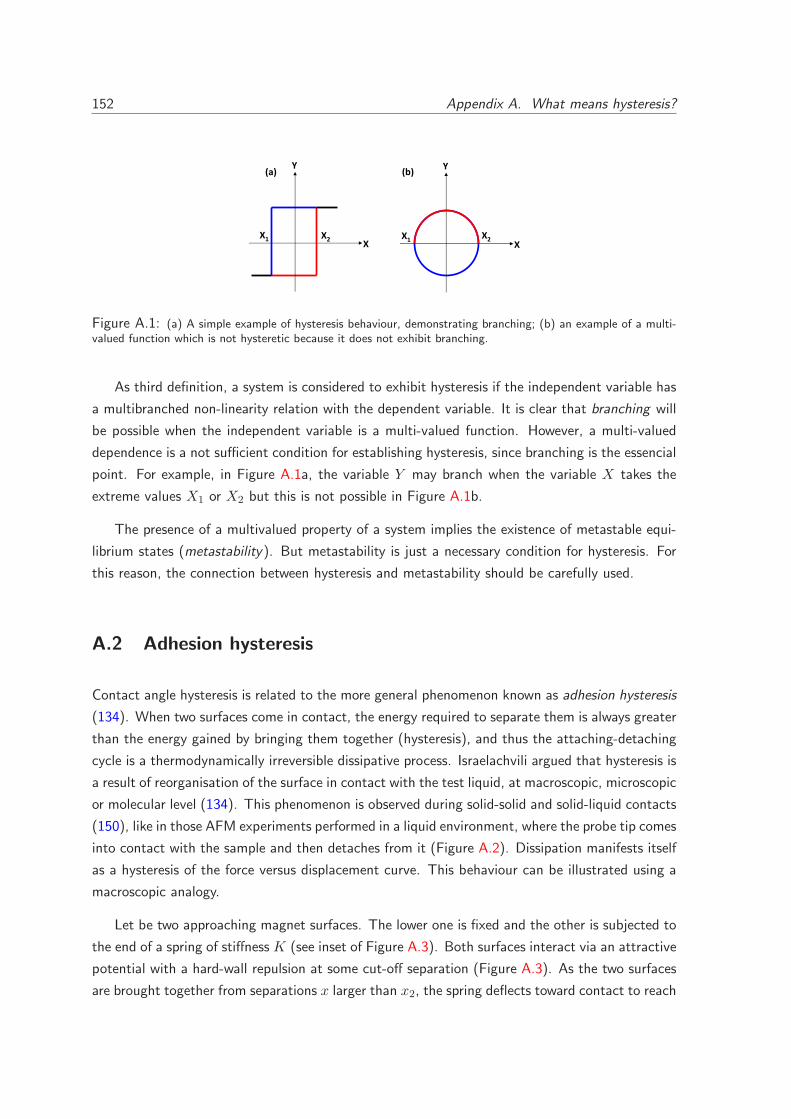
152 Appendix A. What means hysteresis?
Y
X
Y
X
(a) (b)
X1 X2 X1X2
Figure A.1: (a) A simple example of hysteresis behaviour, demonstrating branching; (b) an example of a multi-valued function which is not hysteretic because it does not exhibit branching.
As third definition, a system is considered to exhibit hysteresis if the independent variable has
a multibranched non-linearity relation with the dependent variable. It is clear that branching will
be possible when the independent variable is a multi-valued function. However, a multi-valued
dependence is a not sufficient condition for establishing hysteresis, since branching is the essencial
point. For example, in Figure A.1a, the variable Y may branch when the variable X takes the
extreme values X1 or X2 but this is not possible in Figure A.1b.
The presence of a multivalued property of a system implies the existence of metastable equi-
librium states (metastability). But metastability is just a necessary condition for hysteresis. For
this reason, the connection between hysteresis and metastability should be carefully used.
A.2 Adhesion hysteresis
Contact angle hysteresis is related to the more general phenomenon known as adhesion hysteresis
(134). When two surfaces come in contact, the energy required to separate them is always greater
than the energy gained by bringing them together (hysteresis), and thus the attaching-detaching
cycle is a thermodynamically irreversible dissipative process. Israelachvili argued that hysteresis is
a result of reorganisation of the surface in contact with the test liquid, at macroscopic, microscopic
or molecular level (134). This phenomenon is observed during solid-solid and solid-liquid contacts
(150), like in those AFM experiments performed in a liquid environment, where the probe tip comes
into contact with the sample and then detaches from it (Figure A.2). Dissipation manifests itself
as a hysteresis of the force versus displacement curve. This behaviour can be illustrated using a
macroscopic analogy.
Let be two approaching magnet surfaces. The lower one is fixed and the other is subjected to
the end of a spring of stiffness K (see inset of Figure A.3). Both surfaces interact via an attractive
potential with a hard-wall repulsion at some cut-off separation (Figure A.3). As the two surfaces
are brought together from separations x larger than x2, the spring deflects toward contact to reach
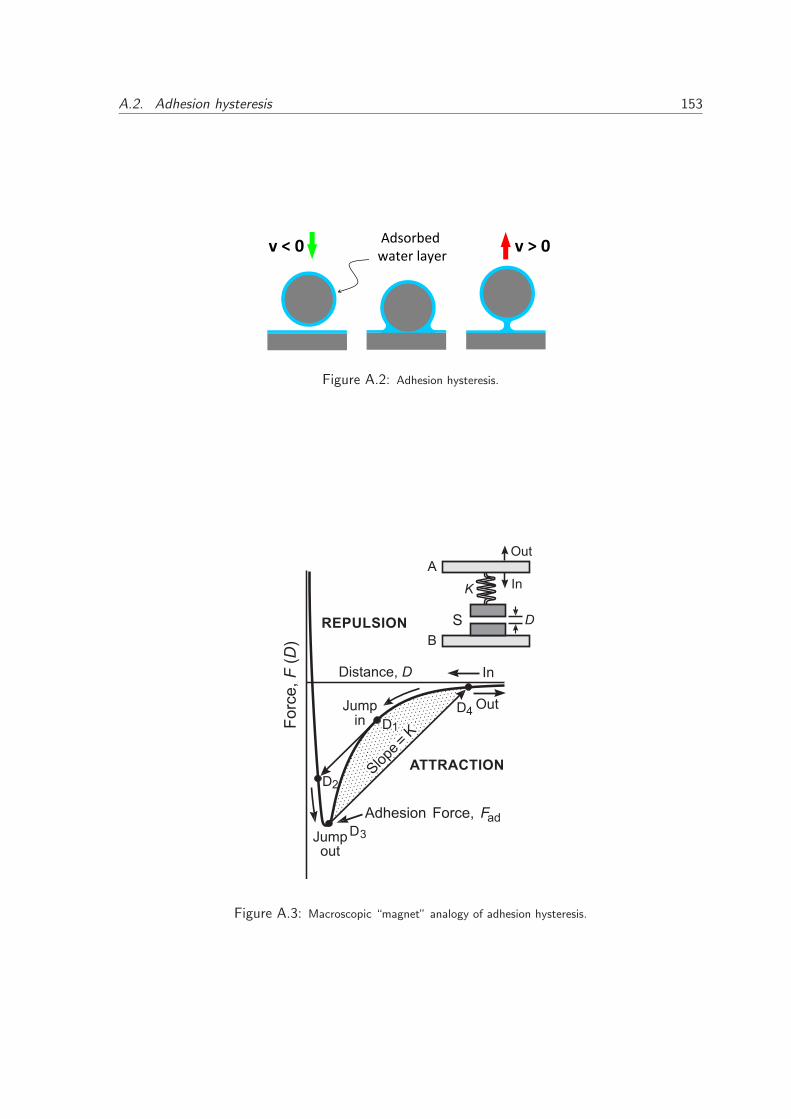
A.2. Adhesion hysteresis 153
v > 0v < 0Adsorbed
water layer
Figure A.2: Adhesion hysteresis.
D
K
OutA
B
S
D2
D3
D4
D1
In
Slope
K
Fo
rce
, F
(D)
ATTRACTION
Distance, D
Jumpin
In
Out
Jumpout
Adhesion Force, Fad
REPULSION
Figure A.3: Macroscopic “magnet” analogy of adhesion hysteresis.
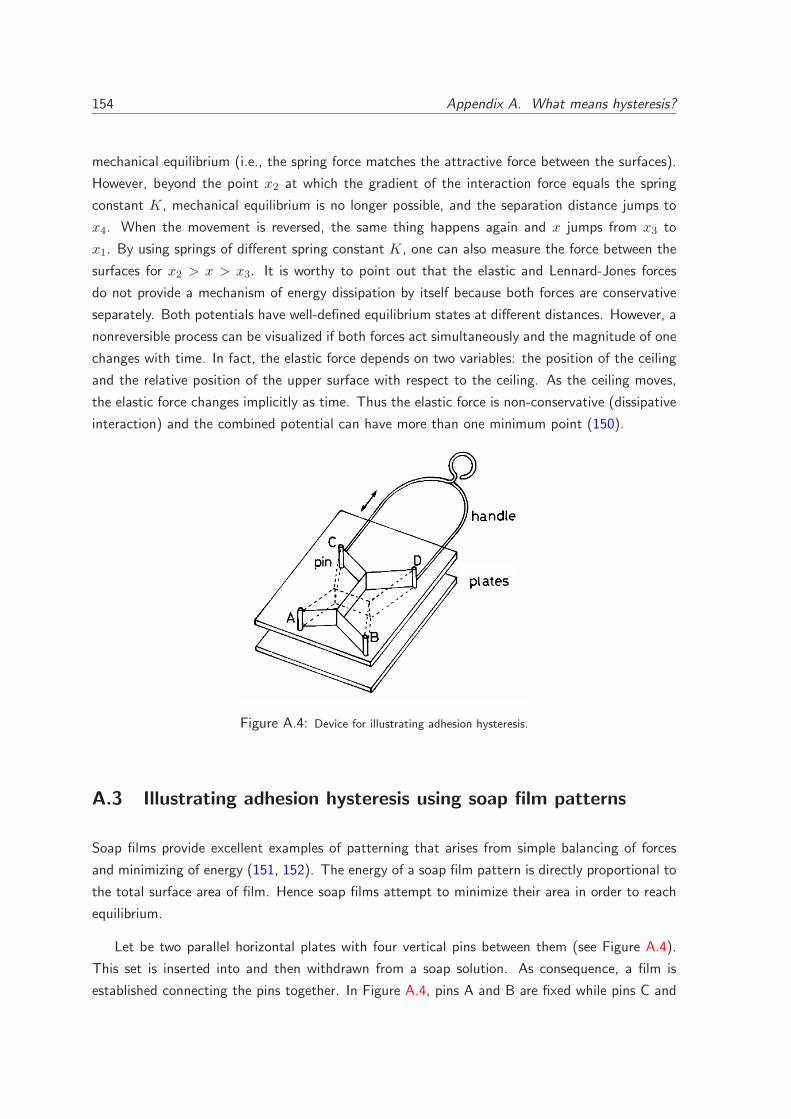
154 Appendix A. What means hysteresis?
mechanical equilibrium (i.e., the spring force matches the attractive force between the surfaces).
However, beyond the point x2 at which the gradient of the interaction force equals the spring
constant K, mechanical equilibrium is no longer possible, and the separation distance jumps to
x4. When the movement is reversed, the same thing happens again and x jumps from x3 to
x1. By using springs of different spring constant K, one can also measure the force between the
surfaces for x2 > x > x3. It is worthy to point out that the elastic and Lennard-Jones forces
do not provide a mechanism of energy dissipation by itself because both forces are conservative
separately. Both potentials have well-defined equilibrium states at different distances. However, a
nonreversible process can be visualized if both forces act simultaneously and the magnitude of one
changes with time. In fact, the elastic force depends on two variables: the position of the ceiling
and the relative position of the upper surface with respect to the ceiling. As the ceiling moves,
the elastic force changes implicitly as time. Thus the elastic force is non-conservative (dissipative
interaction) and the combined potential can have more than one minimum point (150).
Figure A.4: Device for illustrating adhesion hysteresis.
A.3 Illustrating adhesion hysteresis using soap film patterns
Soap films provide excellent examples of patterning that arises from simple balancing of forces
and minimizing of energy (151, 152). The energy of a soap film pattern is directly proportional to
the total surface area of film. Hence soap films attempt to minimize their area in order to reach
equilibrium.
Let be two parallel horizontal plates with four vertical pins between them (see Figure A.4).
This set is inserted into and then withdrawn from a soap solution. As consequence, a film is
established connecting the pins together. In Figure A.4, pins A and B are fixed while pins C and
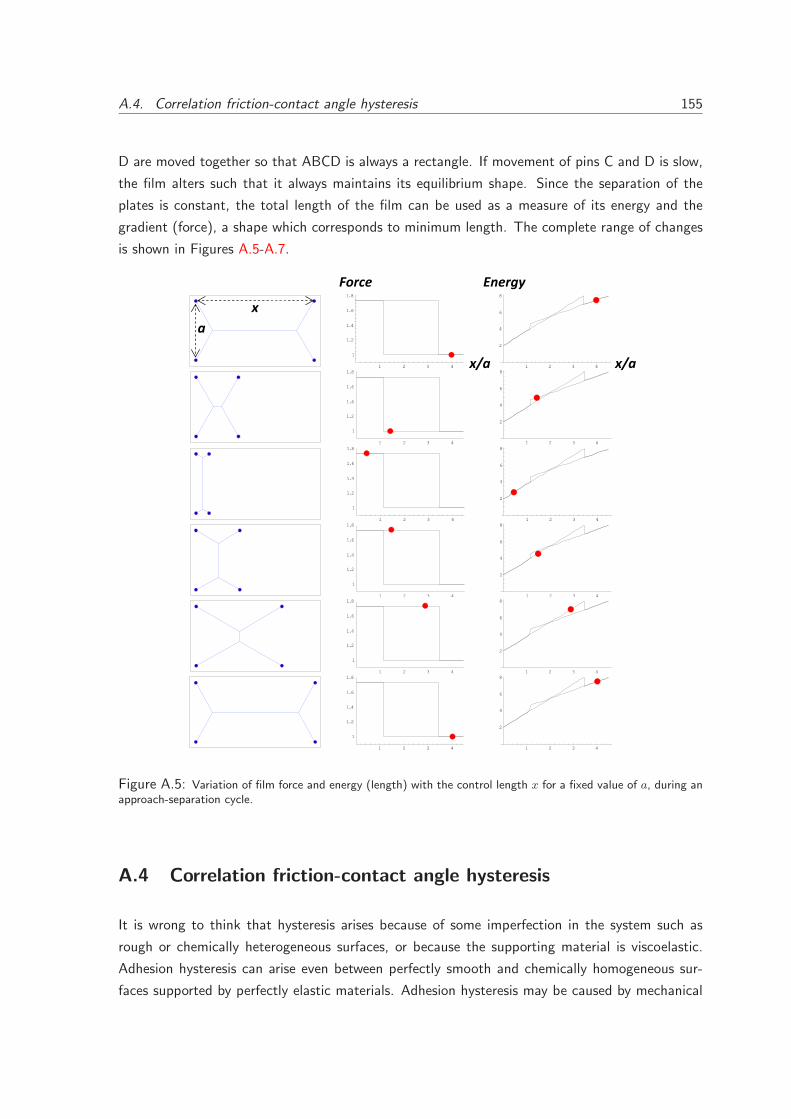
A.4. Correlation friction-contact angle hysteresis 155
D are moved together so that ABCD is always a rectangle. If movement of pins C and D is slow,
the film alters such that it always maintains its equilibrium shape. Since the separation of the
plates is constant, the total length of the film can be used as a measure of its energy and the
gradient (force), a shape which corresponds to minimum length. The complete range of changes
is shown in Figures A.5-A.7.
1 2 3 4
1
1.2
1.4
1.6
1.8
1 2 3 4
2
4
6
8
1 2 3 4
1
1.2
1.4
1.6
1.8
1 2 3 4
2
4
6
8
1 2 3 4
1
1.2
1.4
1.6
1.8
1 2 3 4
2
4
6
8
1 2 3 4
1
1.2
1.4
1.6
1.8
1 2 3 4
2
4
6
8
1 2 3 4
1
1.2
1.4
1.6
1.8
1 2 3 4
2
4
6
8
1 2 3 4
1
1.2
1.4
1.6
1.8
1 2 3 4
2
4
6
8
Force
x/a x/a
Energy
x
a
Figure A.5: Variation of film force and energy (length) with the control length x for a fixed value of a, during anapproach-separation cycle.
A.4 Correlation friction-contact angle hysteresis
It is wrong to think that hysteresis arises because of some imperfection in the system such as
rough or chemically heterogeneous surfaces, or because the supporting material is viscoelastic.
Adhesion hysteresis can arise even between perfectly smooth and chemically homogeneous sur-
faces supported by perfectly elastic materials. Adhesion hysteresis may be caused by mechanical
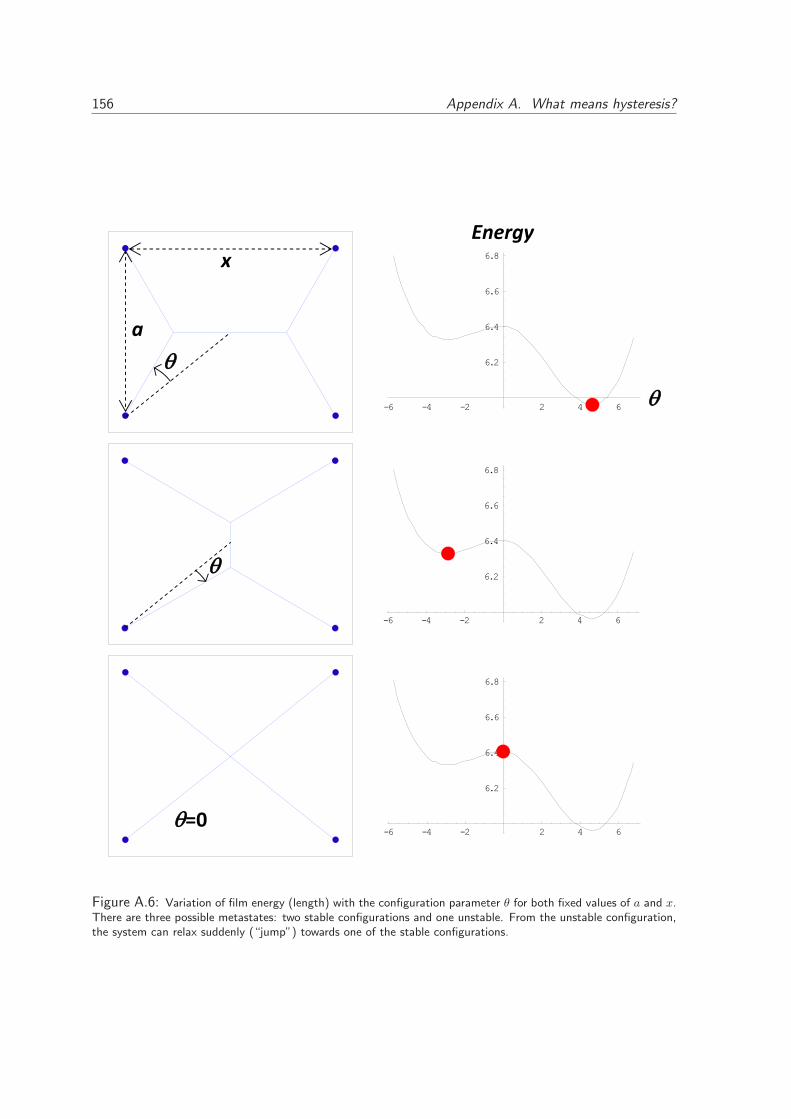
156 Appendix A. What means hysteresis?
-6 -4 -2 2 4 6
6.2
6.4
6.6
6.8
-6 -4 -2 2 4 6
6.2
6.4
6.6
6.8
-6 -4 -2 2 4 6
6.2
6.4
6.6
6.8
=0
a
Energy
x
Figure A.6: Variation of film energy (length) with the configuration parameter θ for both fixed values of a and x.There are three possible metastates: two stable configurations and one unstable. From the unstable configuration,the system can relax suddenly (“jump”) towards one of the stable configurations.
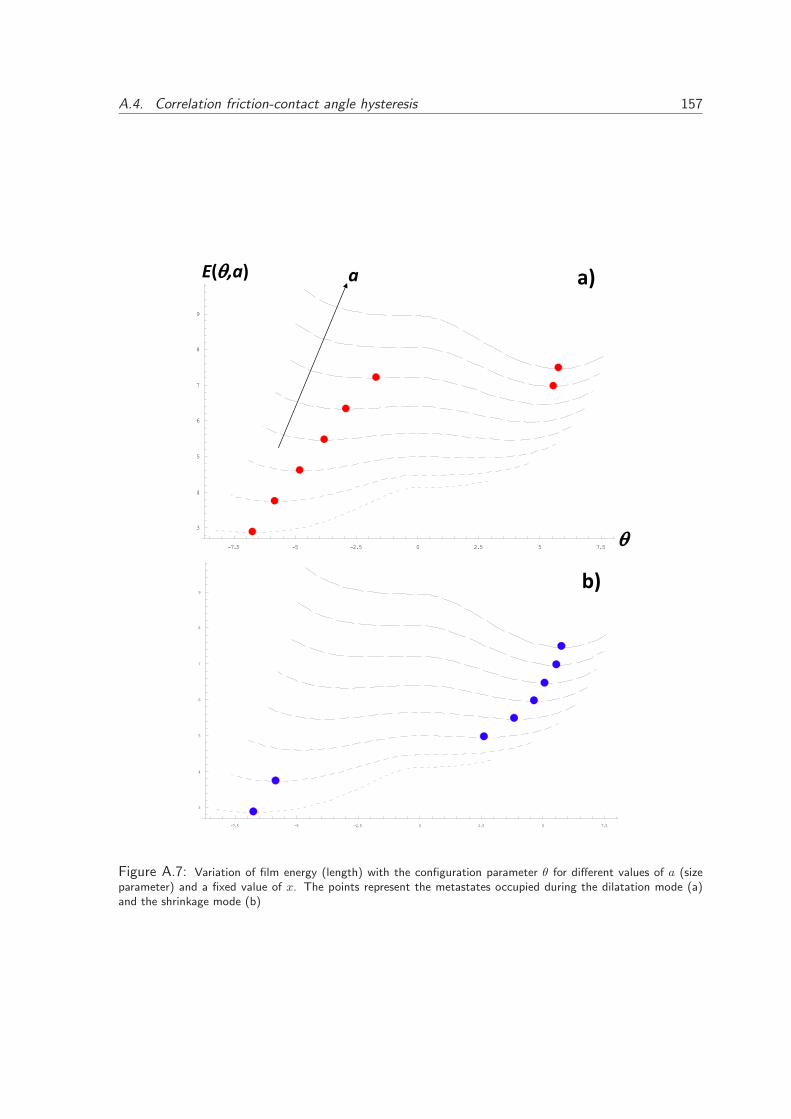
A.4. Correlation friction-contact angle hysteresis 157
-7.5 -5 -2.5 0 2.5 5 7.5
3
4
5
6
7
8
9
-7.5 -5 -2.5 0 2.5 5 7.5
3
4
5
6
7
8
9
E( ,a)
a)
b)
a
Figure A.7: Variation of film energy (length) with the configuration parameter θ for different values of a (sizeparameter) and a fixed value of x. The points represent the metastates occupied during the dilatation mode (a)and the shrinkage mode (b)
158 Appendix A. What means hysteresis?
effects such as instabilities, or chemical effects such as interdiffusion, interdigitation, molecular
reorientations and exchange processes occurring at an interface after contact. Such processes
induce roughness and chemical heterogeneity even though initially (and after separation and
reequilibration) both surfaces are perfectly smooth and chemically homogeneous.
Adhesion hysteresis is also observed during a solid-solid contact (150). Friction forces have
been shown to be proportional to the adhesion hysteresis, as discussed by Israelachvili (153). The
friction coefficient is not directly correlated with adhesion but rather with the adhesion hysteresis,
which is a measure of the energy dissipated during an irreversible adhesion (e.g. approach-
separate) cycle.
Contact angle hysteresis is usually illustrated as a frictional effect (e.g. the motion of a body on
a tilted plane, stick-jump events...). But, in fact, friction is a consequence of adhesion hysteresis
magnified by roughness accordingly. In the friction between two solids, the real microscopic
contact area is considered as a constant. Unlike, in the case of a liquid drop on a solid, the real
microscopic contact area can strongly change as the hygrohilicity/hygrophobicity of the surface
or the imposed motion. Hence, the analogy friction-contact angle hysteresis should be carefully
invoked since that the dissipative mechanisms underlying in contact angle hysteresis indeed explain
the friction, not the opposite one.
Reducing the friction of liquid flows on solid surfaces has become an important issue with the
development of microfluidics systems, and more generally for the manipulation of fluids at small
scales.
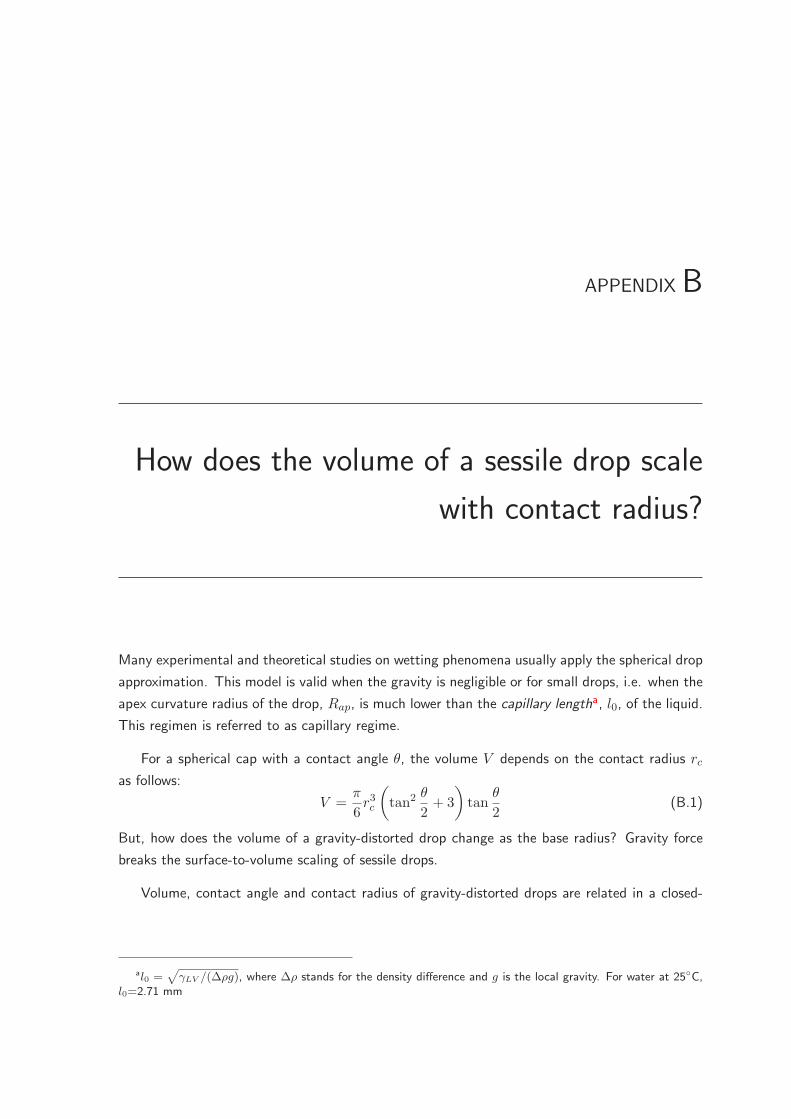
APPENDIX B
How does the volume of a sessile drop scale
with contact radius?
Many experimental and theoretical studies on wetting phenomena usually apply the spherical drop
approximation. This model is valid when the gravity is negligible or for small drops, i.e. when the
apex curvature radius of the drop, Rap, is much lower than the capillary lengtha, l0, of the liquid.
This regimen is referred to as capillary regime.
For a spherical cap with a contact angle θ, the volume V depends on the contact radius rc
as follows:
V =π
6r3c
(
tan2 θ
2+ 3
)
tanθ
2(B.1)
But, how does the volume of a gravity-distorted drop change as the base radius? Gravity force
breaks the surface-to-volume scaling of sessile drops.
Volume, contact angle and contact radius of gravity-distorted drops are related in a closed-
al0 =√
γLV /(∆ρg), where ∆ρ stands for the density difference and g is the local gravity. For water at 25◦C,l0=2.71 mm
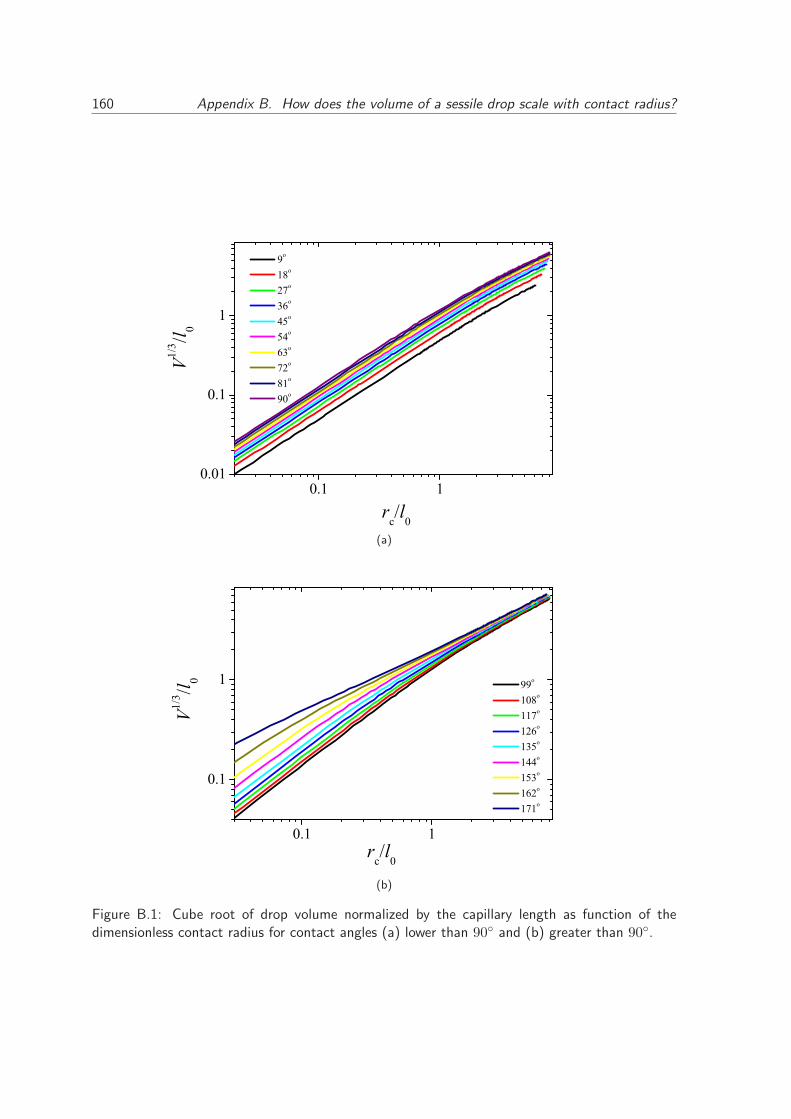
160 Appendix B. How does the volume of a sessile drop scale with contact radius?
0.1 10.01
0.1
1
9o
18o
27o
36o
45o
54o
63o
72o
81o
90o
V1/3 /l
0
rc/l
0(a)
0.1 1
0.1
1
99o
108o
117o
126o
135o
144o
153o
162o
171o
V1/3 /l
0
rc/l
0
(b)
Figure B.1: Cube root of drop volume normalized by the capillary length as function of thedimensionless contact radius for contact angles (a) lower than 90◦ and (b) greater than 90◦.
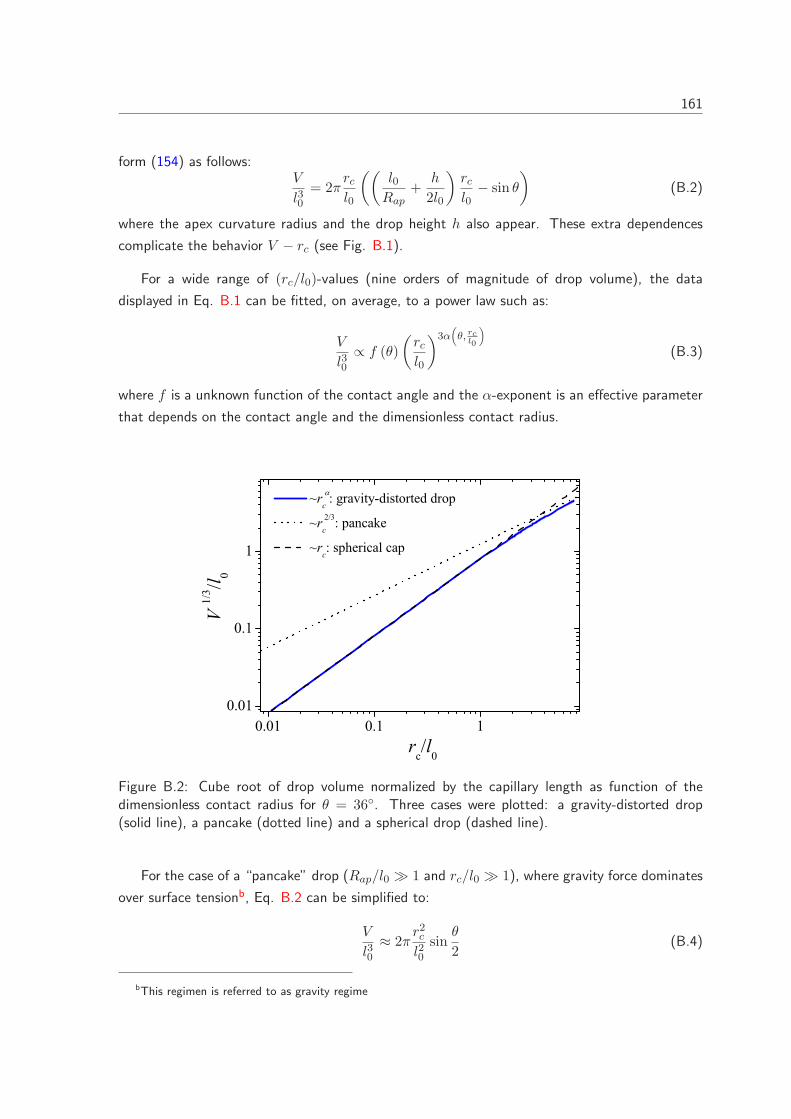
161
form (154) as follows:V
l30= 2π
rcl0
((
l0Rap
+h
2l0
)
rcl0
− sin θ
)
(B.2)
where the apex curvature radius and the drop height h also appear. These extra dependences
complicate the behavior V − rc (see Fig. B.1).
For a wide range of (rc/l0)-values (nine orders of magnitude of drop volume), the data
displayed in Eq. B.1 can be fitted, on average, to a power law such as:
V
l30∝ f (θ)
(
rcl0
)3α(
θ, rcl0
)
(B.3)
where f is a unknown function of the contact angle and the α-exponent is an effective parameter
that depends on the contact angle and the dimensionless contact radius.
0.01 0.1 10.01
0.1
1
~r c : gravity-distorted drop
~r 2/3c : pancake
~rc: spherical cap
V 1/3 /l
0
rc/l
0
Figure B.2: Cube root of drop volume normalized by the capillary length as function of thedimensionless contact radius for θ = 36◦. Three cases were plotted: a gravity-distorted drop(solid line), a pancake (dotted line) and a spherical drop (dashed line).
For the case of a “pancake” drop (Rap/l0 ≫ 1 and rc/l0 ≫ 1), where gravity force dominates
over surface tensionb, Eq. B.2 can be simplified to:
V
l30≈ 2π
r2cl20
sinθ
2(B.4)
bThis regimen is referred to as gravity regime

162 Appendix B. How does the volume of a sessile drop scale with contact radius?
where the well-known formula of meniscus height (45) was invoked:
h = 2l0 sinθ
2(B.5)
As shown in Fig. B.2, sessile drops behave as spherical drops (Eq. B.1) when the contact radius
is lower than the capillary length (rc/l0 ≤ 1). Instead, drops are considered as “pancakes” (Eq.
B.4) when the contact radius is much greater than the capillary length (rc/l0 ≫ 1). Otherwise,
Eq. B.3 applies.
Bibliography
(1) Handbook of Industrial Drying ; Mujumdar, A. S., Ed.; CRC Press, 2006; Vol. 125, p 1286.
(2) Stannard, A. Dewetting-mediated pattern formation in nanoparticle assemblies. J. Phys.:
Condens. Matter 2011, 23, 083001.
(3) Sommer, A. P.; Ben-Moshe, M.; Magdassi, S. Size-Discriminative Self-Assembly of
Nanospheres in Evaporating Drops. J. Phys. Chem. B 2004, 108, 8–10.
(4) Trantum, J. R.; Wright, D. W.; Haselton, F. R. Biomarker-Mediated Disruption of Coffee-
Ring Formation as a Low Resource Diagnostic Indicator. Langmuir 2012, 28, 2187–2193.
(5) Deegan, R. D.; Bakajin, O.; Dupont, T. F.; Huber, G.; Nagel, S. R.; Witten, T. A. Capillary
flow as the cause of ring stains from dried liquid drops. Nature 1997, 389, 827–829.
(6) Deegan, R. D.; Bakajin, O.; Dupont, T. F.; Huber, G.; Nagel, S. R.; Witten, T. A. Contact
line deposits in an evaporating drop. Phys. Rev. E 2000, 62, 756–765.
(7) Deegan, R. D. Pattern formation in drying drops. Phys. Rev. E 2000, 61, 475–485.
(8) Ludwig, I.; Schabel, W.; Kind, M.; Castaing, J.-C.; Ferlin, P. Drying and film formation of
industrial waterborne latices. AIChE Journal 2007, 53, 549–560.
(9) Derby, B. Inkjet Printing of Functional and Structural Materials: Property Requirements,
Feature Stability, and Resolution. Annu. Rev. Mater. Sci. 2010, 40, 395–414.
164 Bibliography
(10) Biswas, S.; Gawande, S.; Bromberg, V.; Sun, Y. Effects of Particle Size and Substrate
Surface Properties on Deposition Dynamics of Inkjet-Printed Colloidal Drops for Printable
Photovoltaics Fabrication. J. Sol. Energ. Eng. 2010, 132, 021010–7.
(11) Nellimoottil, T. T.; Rao, P. N.; Ghosh, S. S.; Chattopadhyay, A. Evaporation-Induced
Patterns from Droplets Containing Motile and Nonmotile Bacteria. Langmuir 2007, 23,
8655–8658.
(12) Baughman, K. F.; Maier, R. M.; Norris, T. A.; Beam, B. M.; Mudalige, A.; Pember-
ton, J. E.; Curry, J. E. Evaporative Deposition Patterns of Bacteria from a Sessile Drop:
Effect of Changes in Surface Wettability Due to Exposure to a Laboratory Atmosphere.
Langmuir 2010, 26, 7293–7298.
(13) Abramchuk, S. S.; Khokhlov, A. R.; Iwataki, T.; Oana, H.; Yoshikawa, K. Direct observation
of DNA molecules in a convection flow of a drying droplet. Europhys. Lett. 2001, 55, 294–
300.
(14) Smalyukh, I. I.; Zribi, O. V.; Butler, J. C.; Lavrentovich, O. D.; Wong, G. C. L. Structure
and dynamics of liquid crystalline pattern formation in drying droplets of DNA. Phys. Rev.
Lett. 2006, 96, 177801–4.
(15) Kim, J.-H.; Ahn, S. I.; Kim, J. H.; Zin, W.-C. Evaporation of Water Droplets on Polymer
Surfaces. Langmuir 2007, 23, 6163–6169.
(16) Mendez-Vilas, A.; Jodar-Reyes, A.; Dıaz, J.; Gonzalez-Martın, M. Nanoscale aggregation
phenomena at the contact line of air-drying pure water droplets on silicon revealed by
atomic force microscopy. Curr. Appl Phys. 2009, 9, 48–58.
(17) Yakhno, T.; Kazakov, V.; Sanina, O.; Sanin, A.; Yakhno, V. Drops of biological fluids drying
on a hard substrate: Variation of the morphology, weight, temperature, and mechanical
properties. Technical Physics 2010, 55, 929–935.
(18) Tarasevich, Y.; Pravoslavnova, D. Segregation in desiccated sessile drops of biological fluids.
Eur. Phys. J. E 2007, 22, 311–314.
(19) Brutin, D.; Sobac, B.; Loquet, B.; Sampol, J. Pattern formation in drying drops of blood.
J. Fluid Mech. 2011, 667, 85–95.
(20) Denkov, N. D.; Velev, O. D.; Kralchevsky, P. A.; Yoshimura, I. B. I. H.; Nagayama, K.
Two-dimensional crystallization. Nature 1993, 361, 26.
(21) Fustin, C. A.; Glasser, G.; Spiess, H. W.; Jonas, U. Parameters Influencing the Templated
Growth of Colloidal Crystals on Chemically Patterned Surfaces. Langmuir 2004, 20, 9114–
9123.
Bibliography 165
(22) Vyawahare, S.; Craig, K. M.; Scherer, A. Patterning Lines by Capillary Flows. Nano Lett.
2006, 6, 271–276.
(23) Kuncicky, D. M.; Bose, K.; Costa, K. D.; Velev, O. D. Sessile droplet templating of minia-
ture porous hemispheres from colloid crystals. Chem. Mater. 2007, 19, 141–143.
(24) Kuncicky, D. M.; Velev, O. D. Surface-guided templating of particle assemblies inside drying
sessile Droplets. Langmuir 2008, 24, 1371–1380.
(25) Rabani, E.; Reichman, D. R.; Geissler, P. L.; Brus, L. E. Drying-mediated self-assembly of
nanoparticles. Nature 2003, 426, 271–274.
(26) Bigioni, T. P.; Lin, X.-M.; Nguyen, T. T.; Corwin, E. I.; Witten, T. A.; Jaeger, H. M.
Kinetically driven self assembly of highly ordered nanoparticle monolayers. Nature Materials
2006, 5, 265–270.
(27) Vancea, I.; Thiele, U.; Pauliac-Vaujour, E.; Stannard, A.; Martin, C. P.; Blunt, M. O.;
Moriarty, P. J. Front instabilities in evaporatively dewetting nanofluids. Phys. Rev. E 2008,
78, 041601.
(28) Marın, A. G.; Gelderblom, H.; Lohse, D.; Snoeijer, J. H. Order-to-Disorder Transition in
Ring-Shaped Colloidal Stains. Phys. Rev. Lett. 2011, 107, 085502–4.
(29) Marin, A. G.; Gelderblom, H.; Lohse, D.; Snoeijer, J. H. Rush-hour in evaporating coffee
drops. Phys. Fluids 2011, 23, 091111–1.
(30) Hu, H.; Larson, R. G. Marangoni Effect Reverses Coffee-Ring Depositions. J. Phys. Chem.
B 2006, 110, 7090–7094.
(31) Majumder, M.; Rendall, C. S.; Eukel, J. A.; Wang, J. Y. L.; Behabtu, N.; Pint, C. L.;
Liu, T.-Y.; Orbaek, A. W.; Mirri, F.; Nam, J.; Barron, A. R.; Hauge, R. H.; Schmidt, H. K.;
Pasquali, M. Overcoming the Coffee-Stain Effect by Compositional Marangoni-Flow-
Assisted Drop-Drying. J. Phys. Chem. B 2012, 116, 6536–6542.
(32) Yunker, P. J.; Still, T.; Lohr, M. A.; Yodh, A. G. Suppression of the coffee-ring effect by
shape-dependent capillary interactions. Nature 2011, 476, 308–311.
(33) Eral, H. B.; Augustine, D. M.; Duits, M. H. G.; Mugele, F. Suppressing the coffee stain
effect: How to control colloidal self-assembly in evaporating drops using electrowetting.
Soft Matter 2011, 7, 4954–4958.
(34) Weon, B. M.; Je, J. H. Capillary force repels coffee-ring effect. Phys. Rev. E 2010, 82,
015305–4.
166 Bibliography
(35) Li, H.; Fowler, N.; Struck, C.; Sivasankar, S. Flow triggered by instabilities at the contact
line of a drop containing nanoparticles. Soft Matter 2011, 7, 5116–5119.
(36) Whitehill, J.; Neild, A.; Ng, T. W.; Stokes, M. Collection of suspended particles in a drop
using low frequency vibration. Appl. Phys. Lett. 2010, 96, 053501–3.
(37) Bhardwaj, R.; Fang, X.; Somasundaran, D., Ponisseriland Attinger Self-Assembly of Col-
loidal Particles from Evaporating Droplets: Role of DLVO Interactions and Proposition of
a Phase Diagram. Langmuir 2010, 26, 7833–7842.
(38) Byun, M.; Wang, J.; Lin, Z. Massively ordered microstructures composed of magnetic
nanoparticles. J. Phys.: Condens. Matter 2009, 21, 264014–6.
(39) Burnett, H.; Shedd, T.; Nellis, G.; El-Morsi, M.; Engelstad, R.; Garoff, S.; Varanasi, K.
Control of the receding meniscus in immersion lithography. J. Vac. Sci. Technol. B 2005,
23, 2611 –2616.
(40) Winkels, K.; Peters, I.; Evangelista, F.; Riepen, M.; Daerr, A.; Limat, L.; Snoeijer, J.
Receding contact lines: From sliding drops to immersion lithography. Eur. Phys. J. Special
Topics 2011, 192, 195–205.
(41) Dimitrov, A. S.; Nagayama, K. Steady-state unidirectional convective assembling of fine
particles into two-dimensional arrays. Chem. Phys. Lett. 1995, 243, 462–468.
(42) Ghosh, M.; Fan, F.; Stebe, K. J. Spontaneous Pattern Formation by Dip Coating of Col-
loidal Suspensions on Homogeneous Surfaces. Langmuir 2007, 23, 2180–2183.
(43) Rio, E.; Daerr, A.; Lequeux, F.; Limat, L. Moving contact lines of a colloidal suspension in
the presence of drying. Langmuir 2006, 22, 3186–3191.
(44) Bodiguel, H.; Doumenc, F.; Guerrier, B. Stick-Slip Patterning at Low Capillary Numbers
for an Evaporating Colloidal Suspension. Langmuir 2010, 26, 10758–10763.
(45) Adamson, A. W. Physical Chemistry of Surfaces, 5th ed.; John Wiley & Sons, Inc., 1990.
(46) de Gennes, P.-G.; Brochard-Wyart, F.; Quere, D. Capillarity and Wetting Phenomena.
Drops, Bubbles, Pearls, Waves; Springer, 2004.
(47) Marmur, A. From hygrophilic to superhygrophobic: Theoretical conditions for making high-
contact-angle surfaces from low-contact-angle materials. Langmuir 2008, 24, 7573–7579.
(48) Vogler, E. A. In Water in Biomaterials Science; John Wiley, 2001; Chapter 6, pp 149–182.
(49) Gaydos, J.; Boruvka, L.; Rotenberg, Y.; Chen, P.; Neumann, A. W. In The Generalized
Theory of Capillarity ; Marcel Dekker, Inc.: 270 Madison Avenue, New York, NW 10016,
1996; Chapter 1, pp 1–52.
Bibliography 167
(50) Young, T. An Essay on the Cohesion of Fluids. Phil. Trans. R. Soc. 1805, 95, 65–87.
(51) Rusanov, A. I. Problems of surface thermodynamics. Pure & App. Chem. 1992, 64, 111–
124.
(52) Roura, P.; Fort, J. Local thermodynamic derivation of Young’s equation. J. Colloid Interface
Sci. 2004, 272, 420–429.
(53) Eustathopolous, N.; Nicholas, M.; Drevet, B. In Fundamental Equations of Wetting ; Else-
vier Science: Oxford, 1999; Chapter 1, pp 16–17.
(54) Edgeworth, R.; Dalton, B. J.; Parnell, T. The pitch drop experiment. European Journal of
Physics 1984, 5, 198.
(55) Decker, E. L.; Frank, B.; Suo, Y.; Garoff, S. Physics of contact angle measurement. Colloids
Surf., A 1999, 156, 177–189.
(56) Marmur, A. Solid-Surface Characterization by Wetting. Annu. Rev. Mater. Sci. 2009, 39,
473–489.
(57) Montes-Ruiz-Cabello, F. J.; Kusumaatmaja, H.; Rodriguez-Valverde, M. A.; Yeo-
mans, J. M.; Cabrerizo-Vilchez, M. Modeling the Corrugation of the Three-Phase Contact
Line Perpendicular to a Chemically Striped Substrate. Langmuir 2009, 25, 8357–8361.
(58) Rodriguez-Valverde, M. A.; Montes-Ruiz-Cabello, F. J.; Cabrerizo-Vilchez, M. A. Wetting
on axially-patterned heterogeneous surfaces. Adv. Colloid Interface Sci. 2008, 138, 84–100.
(59) Neumann, A. W.; Good, R. J. In Techniques of Measuring Contact Angles; Plenum Press:
New York, 1997; Vol. 11, pp 31–91.
(60) Johnson, R.; Dettre, R. Contact Angle Hysteresis. Study of an Idealized Heterogeneous
Surface. J. Phys. Chem. 1964, 68, 1744–1750.
(61) Huh, C.; Mason, S. Effects of Surface-Roughness on Wetting (Theoretical). J. Colloid
Interface Sci. 1977, 60, 11–38.
(62) Joanny, J. F.; de Gennes, P.-G. A model for contact-angle hysteresis. J. Chem. Phys. 1984,
81, 552–562.
(63) Nadkarni, G.; Garoff, S. An investigation of microscopic aspects of contact-angle hysteresis
pinning of the contact line on a single defect. Europhys. Lett. 1992, 20, 523–528.
(64) Drelich, J. Static contact angles for liquids at heterogeneous rigid solid surfaces. Polish. J.
Chem. 1997, 71, 525–549.
168 Bibliography
(65) Rangwalla, H.; Schwab, A. D.; Yurdumakan, B.; Yablon, D. G.; Yeganeh, M. S.; Dhino-
jwala, A. Molecular structure of an alkyl-side-chain polymer-water interface: Origins of
contact angle hysteresis. Langmuir 2004, 20, 8625–8633.
(66) Neumann, A. W.; Good, R. J. Thermodynamics of contact angles. I. Heterogeneous solid
surfaces. J. Colloid Interface Sci. 1972, 38, 341–358.
(67) Eick, J. D.; Good, R. J.; Neumann, A. W. Thermodynamics of contact angles. II. Rough
solid surfaces. J. Colloid Interface Sci. 1975, 53, 235–238.
(68) Schwartz, L.; Garoff, S. Contact-angle hysteresis on heterogeneous surfaces. Langmuir
1985, 1, 219–230.
(69) Marmur, A. Thermodynamic aspects of contact angle hysteresis. Adv. Colloid Interface Sci.
1994, 50, 121.
(70) Rodriguez-Valverde, M. A.; Ruiz-Cabello, F. J. M.; Gea-Jodar, P. M.; Kamusewitz, H.;
Cabrerizo-Vilchez, M. A. A new model to estimate the Young contact angle from contact
angle hysteresis measurements. Colloids Surf., A 2010, 365, 21–27.
(71) Shuttleworth, R.; Bailey, G. L. J. The Spreading of a Liquid over a Rough Solid. Discuss.
Faraday Soc. 1948, 3, 16–22.
(72) Marmur, A. Soft contact: Measurement and interpretation of contact angles. Soft Matter
2006, 2, 12–17.
(73) Kwok, D.; Gietzelt, T.; Grundke, K.; Jacobasch, H.; Neumann, A. Contact angle measure-
ments and contact angle interpretation .1. Contact angle measurements by axisymmetric
drop shape analysis and a goniometer sessile drop technique. Langmuir 1997, 13, 2880–
2894.
(74) Krishnan, A.; Liu, Y. H.; Cha, P.; Woodward, R.; Allara, D.; Vogler, E. A. An evaluation
of methods for contact angle measurement. Colloids Surf., B 2005, 43, 95–98.
(75) Bormashenko, E.; Bormashenko, Y.; Whyman, G.; Pogreb, R.; Musin, A.; Jager, R.;
Barkay, Z. Contact Angle Hysteresis on Polymer Substrates Established with Various Exper-
imental Techniques, Its Interpretation, and Quantitative Characterization. Langmuir 2008,
24, 4020–4025.
(76) Rodriguez-Valverde, M. A.; Montes Ruiz-Cabello, F. J.; Cabrerizo-Vilchez, M. A. A new
method for evaluating the most-stable contact angle using mechanical vibration. Soft Mat-
ter 2011, 7, 53–56.
Bibliography 169
(77) Ruiz-Cabello, F. J. M.; Rodriguez-Valverde, M. A.; Cabrerizo-Vilchez, M. A new method
for evaluating the most stable contact angle using tilting plate experiments. Soft Matter
2011, 7, 10457–10461.
(78) Handbook of Surface and Colloid Chemistry ; Birdi, K., Ed.; CRC Press: LLC 2000
Corporate Blvd., N.W., Boca Raton, Florida 33431, 1997.
(79) Cwikel, D.; Zhao, Q.; Liu, C.; Su, X.; Marmur, A. Comparing Contact Angle Measurements
and Surface Tension Assessments of Solid Surfaces. Langmuir 2010, 26, 15289–15294.
(80) Erbil, H. Y.; McHale, G.; Rowan, S. M.; Newton, M. I. Determination of the Receding
Contact Angle of Sessile Drops on Polymer Surfaces by Evaporation. Langmuir 1999, 15,
7378–7385.
(81) Mognetti, B. M.; Yeomans, J. M. Modeling Receding Contact Lines on Superhydrophobic
Surfaces. Langmuir 2010, 26, 18162–18168.
(82) Chibowski, E. Apparent Surface Free Energy of Superhydrophobic Surfaces. J. Adhes. Sci.
Technol. 2011, 25, 1323–1336.
(83) Meuler, A. J.; Smith, J. D.; Varanasi, K. K.; Mabry, J. M.; McKinley, G. H.; Cohen, R. E.
Relationships between Water Wettability and Ice Adhesion. ACS Applied Materials and
Interfaces 2010, 2, 3100–3110.
(84) Brugnara, M.; Degasperi, E.; Della-Volpe, C.; Maniglio, D.; Penati, A.; Siboni, S.; To-
niolo, L.; Poli, T.; Invernizzi, S.; Castelvetro, V. The application of the contact angle in
monument protection: new materials and methods. Colloids Surf., A 2004, 241, 299–312.
(85) Strobel, M.; Lyons, C. S. An Essay on Contact Angle Measurements. Plasma Process.
Polym. 2011, 8, 8–13.
(86) Erbil, H. Y. In Surface Chemistry of Solid and Liquid Interfaces; Wiley-Blackwell, 2006;
Chapter 9, pp 308–337.
(87) Kietzig, A.-M. Comments on ’An Essay on Contact Angle Measurements’. An Illustration
of the Respective Influence of Droplet Deposition and Measurement Parameters. Plasma
Process. Polym. 2011, 8, 1003–1009.
(88) Pierce, E.; Carmona, F.; Amirfazli, A. Understanding of sliding and contact angle results
in tilted plateexperiments. Colloids Surf., A 2008, 323, 73–82.
(89) Brutin, D.; Zhu, Z.; Rahli, O.; Xie, J.; Liu, Q.; Tadrist, L. Sessile Drop in Microgravity:
Creation, Contact Angle and Interface. Microgravity Sci. Tech. 2009, 21, 67–76.
(90) Blake, T. D. The physics of moving wetting lines. J. Colloid Interface Sci. 2006, 299, 1–13.
170 Bibliography
(91) Kwok, D.; Lin, R.; Mui, M.; Neumann, A. Low-rate dynamic and static contact angles and
the determination of solid surface tensions. Colloids Surf., A 1996, 116, 63–77.
(92) Long, J.; Chen, P. On the role of energy barriers in determining contact angle hysteresis.
Adv. Colloid Interface Sci. 2006, 127, 55–66.
(93) Ruiz-Cabello, F. J. M.; Rodriguez-Valverde, M. A.; Cabrerizo-Vilchez, M. A. Contact Angle
Hysteresis on Polymer Surfaces: An Experimental Study. J. Adhes. Sci. Technol. 2011, 25,
2039–2049.
(94) Lee, S. H.; Ruckenstein, E. Surface restructuring of polymers. J. Colloid Interface Sci.
1987, 120, 529–536.
(95) Ramos, S.; Charlaix, E.; Benyagoub, A. Contact angle hysteresis on nano-structured sur-
faces. Surf. Sci. 2003, 540, 355–362.
(96) Ramos, S.; Tanguy, A. Pinning-depinning of the contact line on nanorough surfaces. Eur.
Phys. J. E 2006, 19, 433–440.
(97) Langbein, D. In Canthotaxis/Wetting Barriers/Pinning Lines; Springer, 2002; Vol. 178,
Chapter 7, pp 149–177.
(98) Marmur, A. Contact-angle hysteresis on heterogeneous smooth surfaces: Theoretical com-
parison of the captive bubble and drop methods. Colloids Surf., A 1998, 136, 209–215.
(99) Zhang, X.; Mi, Y. Dynamics of a Stick-Jump Contact Line of Water Drops on a Strip
Surface. Langmuir 2009, 25, 3212–3218.
(100) Ruiz-Cabello, F. J. M.; Rodriguez-Valverde, M. A.; Marmur, A.; Cabrerizo-Vilchez, M. A.
Comparison of Sessile Drop and Captive Bubble Methods on Rough Homogeneous Surfaces:
A Numerical Study. Langmuir 2011, 27, 9638–9643.
(101) Good, R. A thermodynamic derivation of Wenzel’s modification of Young’s equation for
contact angles together with a theory of hysteresis. J. Am. Chem. Soc. 1952, 74, 5041–
5042.
(102) Bourgks-Monnier, C.; Shanahan, M. E. R. Influence of Evaporation on Contact Angle.
Langmuir 1995, 11, 2820–2829.
(103) Hegseth, J. J.; Rashidnia, N.; Chai, A. Natural convection in droplet evaporation. Phys.
Rev. E 1996, 54, 1640–1644.
(104) Erbil, H. Y. Evaporation of pure liquid sessile and spherical suspended drops: A review.
Adv. Colloid Interface Sci. 2012, 170, 67–86.
Bibliography 171
(105) Siboni, S. Determination of the Kelvin equation in the presence of an arbitrary gravita-
tional/inertial field. Am. J. Phys. 2006, 74, 565–568.
(106) Butt, H.-J.; Golovko, D. S.; Bonaccurso, E. On the Derivation of Young’s Equation for
Sessile Drops: Nonequilibrium Effects Due to Evaporation. J. Phys. Chem. B 2007, 111,
5277–5283.
(107) Sokuler, M.; Auernhammer, G. K.; Liu, C. J.; Bonaccurso, E.; Butt, H.-J. Dynamics of
condensation and evaporation: Effect of inter-drop spacing. Europhys. Lett. 2010, 89,
36004.
(108) Tavana, H.; Neumann, A. On the question of rate-dependence of contact angles. Colloids
Surf., A 2006, 282, 256–262.
(109) Oliver, J. F.; Huh, C.; Mason, S. G. Resistance to spreading of liquids by sharp edges. J.
Colloid Interface Sci. 1977, 59, 568–581.
(110) Amirfazli, A.; Neumann, A. Status of the three-phase line tension: a review. Adv. Colloid
Interface Sci. 2004, 3, 110.
(111) Kim, J.-H.; Ahn, S. I.; Kim, J. H.; Kim, J. S.; Cho, K.; Jung, J. C.; Chang, T.; Ree, M.;
Zin, W.-C. Evaporation of sessile droplets of dilute aqueous solutions containing sodium
n-alkylates from polymer surfaces: Influences of alkyl length and concentration of solute.
Langmuir 2008, 24, 11442–11450.
(112) Lam, C. N. C.; Wu, R.; Li, D.; Hair, M. L.; Neumann, A. W. Study of the advancing
and receding contact angles: Liquid sorption as a cause of contact angle hysteresis. Adv.
Colloid Interface Sci. 2002, 96, 169–191.
(113) Lam, C. N. C.; Kim, N.; Hui, D.; Kwok, D. Y.; Hair, M. L.; Neumann, A. W. The effect
of liquid properties to contact angle hysteresis. Colloids Surf., A 2001, 189, 265–278.
(114) Erickson, D.; Blackmore, B.; Li, D. An energy balance approach to modeling the hydrody-
namically driven spreading of a liquid drop. Colloids Surf., A 2001, 182, 109–122.
(115) Dussan, E. B. On the Spreading of Liquids on Solid Surfaces: Static and Dynamic Contact
Lines. Annu. Rev. Fluid Mech. 1979, 11, 371–400.
(116) Blake, T. D.; Ruschak, K. J. A maximum speed of wetting. Nature 1979, 282, 489–491.
(117) Rupp, F.; Scheideler, L.; Geis-Gerstorfer, J. Effect of Heterogenic Surfaces on Contact Angle
Hysteresis: Dynamic Contact Angle Analysis in Material Sciences. Chem. Eng. Technol.
2002, 25, 877–882.
172 Bibliography
(118) Rupp, F.; Scheideler, L.; Olshanska, N.; de Wild, M.; Wieland, M.; Geis-Gerstorfer, J.
Enhancing surface free energy and hydrophilicity through chemical modification of mi-
crostructured titanium implant surfaces. J. Biomed. Mater. Res. A 2006, 76A, 323–334.
(119) Bhardwaj, R.; Fang, X.; Attinger, D. Pattern formation during the evaporation of a colloidal
nanoliter drop: a numerical and experimental study. New J. Phys. 2009, 11, 075020–33.
(120) Park, J.; Moon, J. Control of Colloidal Particle Deposit Patterns within Picoliter Droplets
Ejected by Ink-Jet Printing. Langmuir 2006, 22, 3506–3513.
(121) Keseroglu, K.; ulha, M. Assembly of nanoparticles at the contact line of a drying droplet
under the influence of a dipped tip. J. Colloid Interface Sci. 2011, 360, 8–14.
(122) Huang, M. H.; Lin, P.-H. Shape-Controlled Synthesis of Polyhedral Nanocrystals and Their
Facet-Dependent Properties. Adv. Funct. Mater. 2012, 22, 14–24.
(123) Dushkin, C.; Yoshimura, H.; Nagayama, K. NUCLEATION AND GROWTH OF 2-
DIMENSIONAL COLLOIDAL CRYSTALS. Chem. Phys. Lett. 1993, 204, 455–460.
(124) Sommer, A. P. Suffocation of Nerve Fibers by Living Nanovesicles: A Model Simulation.
J. Proteome Res. 2004, 3, 667–669.
(125) Truskett, V. N.; Stebe, K. J. Influence of Surfactants on an Evaporating Drop: Fluorescence
Images and Particle Deposition Patterns. Langmuir 2003, 19, 8271–8279.
(126) Yan, Q.; Gao, L.; Sharma, V.; Chiang, Y.-M.; Wong, C. C. Particle and Substrate Charge
Effects on Colloidal Self-Assembly in a Sessile Drop. Langmuir 2008, 24, 11518–11522.
(127) Ristenpart, W. D.; Kim, P. G.; Domingues, C.; Wan, J.; Stone, H. A. Influence of Substrate
Conductivity on Circulation Reversal in Evaporating Drops. Phys. Rev. Lett. 2007, 99,
234502–4.
(128) Denkov, N. D.; Kralchevsky, P. A.; Ivanov, I. B. Lateral capillary forces and two-dimensional
arrays of colloid particles and protein molecules. J. Disper. Sci. Technol. 1997, 18, 577–591.
(129) Gelderblom, H.; Marın, A. G.; Nair, H.; van Houselt, A.; Lefferts, L.; Snoeijer, J. H.;
Lohse, D. How water droplets evaporate on a superhydrophobic substrate. Phys. Rev. E
2011, 83, 026306–6.
(130) Perelaer, J.; Smith, P. J.; Hendriks, C. E.; van den Berg, A. M. J.; Schubert, U. S. The
preferential deposition of silica micro-particles at the boundary of inkjet printed droplets.
Soft Matter 2008, 4, 1072–1078.
(131) Chhasatia, V. H.; Sun, Y. Interaction of bi-dispersed particles with contact line in an
evaporating colloidal drop. Soft Matter 2011, 7, 10135–10143.
Bibliography 173
(132) Das, S.; Chakraborty, S.; Mitra, S. K. Ring stains in the presence of electrokinetic interac-
tions. Phys. Rev. E 2012, 85, 046311–8.
(133) Jung, J.-y.; Kim, Y. W.; Yoo, J. Y.; Koo, J.; Kang, Y. T. Forces Acting on a Single
Particle in an Evaporating Sessile Droplet on a Hydrophilic Surface. Anal. Chem. 2010,
82, 784–788.
(134) Chen, Y. L.; Helm, C. A.; Israelachvili, J. N. Molecular Mechanisms Associated with Ad-
hesion and Contact Angle Hysteresis of Monolayer Surfaces. J. Phys. Chem. 1991, 95,
10736–10747.
(135) Kobayashi, M.; Nanaumi, H.; Muto, Y. Initial deposition rate of latex particles in the packed
bed of zirconia beads. Colloids Surf., A 2009, 347, 2–7.
(136) Wong, T.-S.; Chen, T.-H.; Shen, X.; Ho, C.-M. Nanochromatography Driven by the Coffee
Ring Effect. Anal. Chem. 2011, 83, 1871–1873.
(137) Hodges, C. S.; Ding, Y.; Biggs, S. The influence of nanoparticle shape on the drying of
colloidal suspensions. J. Colloid Interface Sci. 2010, 352, 99 – 106.
(138) Sandu, I.; Fleaca, C. T. The influence of gravity on the distribution of the deposit formed
onto a substrate by sessile, hanging, and sandwiched hanging drop evaporation. J. Colloid
Interface Sci. 2011, 358, 621 – 625.
(139) Sangani, A. S.; Lu, C.; Su, K.; Schwarz, J. A. Capillary force on particles near a drop edge
resting on a substrate and a criterion for contact line pinning. Phys. Rev. E 2009, 80,
011603–15.
(140) Shmuylovich, L.; Shen, A. Q.; ; Stone, H. A. Surface morphology of drying latex films:
Multiple ring formation. Langmuir 2002, 18, 3441–3445.
(141) Zhang, X.; Zhang, J.; Zhu, D.; Li, X.; Zhang, X.; Wang, T.; Yang, B. A Universal Approach
To Fabricate Ordered Colloidal Crystals Arrays Based on Electrostatic Self-Assembly. Lang-
muir 2010, 26, 17936–17942.
(142) Delgado, A. Interfacial Electrokinetics and Electrophoresis; Surfactant Science Series;
Marcel Dekker, 2002.
(143) Mengual, O.; Meunier, G.; Cayre, I.; Puech, K.; Snabre, P. Characterisation of instability
of concentrated dispersions by a new optical analyser: the TURBISCAN MA 1000. Colloids
Surf., A 1999, 152, 111 – 123.
(144) Mohammadi, R.; Amirfazli, A. Contact Angle Measurement for Dispersed Microspheres
Using Scanning Confocal Microscopy. J. Dispersion Sci. Technol. 2005, 25, 567–574.
174 Bibliography
(145) Cousins, B. G.; Zekonyte, J.; Doherty, P. J.; Garvey, M. J.; Williams., R. L. Manufacturing a
nanometre scale surface topography with varying surface chemistry to assess the combined
effect on cell behaviour. Int. J. Nano and Biomaterials 2008, 1, 320–338.
(146) Tosatti, S.; Michel, R.; Textor, M.; Spencer, N. D. Self-Assembled Monolayers of Dodecyl
and Hydroxy-dodecyl Phosphates on Both Smooth and Rough Titanium and Titanium
Oxide Surfaces. Langmuir 2002, 18, 3537–3548.
(147) van Zwol, P. J.; Palasantzas, G.; De Hosson, J. T. M. Influence of roughness on capillary
forces between hydrophilic surfaces. Phys. Rev. E 2008, 78, 031606–6.
(148) Fischer, B. J. Particle Convection in an Evaporating Colloidal Droplet. Langmuir 2002,
18, 60–67.
(149) Vogel, N.; Weiss, C. K.; Landfester, K. From soft to hard: the generation of functional and
complex colloidal monolayers for nanolithography. Soft Matter 2012, 8, 4044–4061.
(150) Nosonovsky, M. Model for solid-liquid and solid-solid friction of rough surfaces with adhe-
sion hysteresis. J. Chem. Phys. 2007, 126, 224701–6.
(151) Tilley, J.; Lovett, D. Illustrating phase changes using graphics modelling of soap film pat-
terns. Phys. Educ. 1995, 30, 74–79.
(152) Isenberg, C. The Science of Soap Films and Soap Bubbles; Dover Publications Inc.: New
York, 1992.
(153) Israelachvili, J. N. Intermolecular and Surface Forces, 3rd ed.; Academic Press: London,
2011.
(154) Behroozi, F.; Macomber, H. K.; Dostal, J. A.; Behroozi, C. H.; Lambert, B. K. The profile
of a dew drop. Am. J. Phys. 1996, 64, 1120–1125.