nanobodies raised against monomeric ɑ-synuclein inhibit ...10.1186/s12915-017-0390... · 1...
TRANSCRIPT
1
Supplementary Information
Nanobodies raised against monomeric ɑ-synuclein inhibit fibril
formation and destabilize toxic oligomeric species of ɑ-synuclein
Marija Iljina#, Liu Hong, Mathew H. Horrocks, Marthe H. Ludtmann, Minee L. Choi, Craig
D. Hughes, Francesco S. Ruggeri, Tim Guilliams, Alexander K. Buell, Ji-Eun Lee, Sonia
Gandhi, Steven F. Lee, Clare E. Bryant, Michele Vendruscolo, Tuomas P. J. Knowles,
Christopher M. Dobson*, Erwin De Genst
#*, David Klenerman
1*
# Equally contributing authors.
*Correspondence may be addressed to:
2
Supplementary Methods
Bulk ThT measurements of Alexa Fluor labeled ɑS. Our previous studies showed that
incorporation of Alexa Fluor (AF) labels at residue 90 did not significantly affect the
aggregation properties of alpha-synuclein (ɑS) owing to this residue being located at the
periphery of the amyloid-forming region of ɑS[1]. Furthermore, we found that the rates of
monomer incorporation into AF488 and AF594-labeled protein were the same under identical
incubation conditions[2]. To confirm that AF-labeled ɑS assembled into fibrils over a broadly
comparable timescale to unlabeled wild-type (wt) ɑS, we carried out bulk thioflavin-T (ThT)
assays using wt and AF594-labeled protein. AF488-labeled ɑS was not used in this
experiment because the emission form the fluorescent probe was expected to interfere with
ThT fluorescence. For the assays, unlabeled 70 µM wt ɑS was used or 70 µM AF594-labeled
A90C ɑS. The samples were prepared in PBS buffer (10 mM phosphate, pH 7.5, 100 mM
NaCl and 0.1% NaN3) and incubated under identical conditions, in the dark at 37 °C with
agitation at 200 rpm (New Brunswick Scientific Innova 43). The aliquots were withdrawn at
the same time intervals and pre-mixed with ThT solution to contain 20 μM of this dye.
Measurements were performed in triplicate using Cary Eclipse spectrometer with 420 nm
excitation and emission collected at 460-600 nm. Maximum ThT fluorescence intensity
values from the background-corrected fluorescence spectra were plotted against incubation
time (Supplementary Fig. 1a). In this experiment, the spectra of AF594-labeled ɑS showed an
additional fluorescence emission peak centered at ~620 nm, which was well separated from
the ThT emission signal and did not interfere with the measurement.
AFM Image analysis. Image flattening and statistical analysis of the average fibrillar heights
was performed by SPIP (Image metrology) software, as previously described[3-5]. Fibrils
were analyzed at a fixed resolution of 4 nm, by fitting their cross-sections to Gaussian
distributions and selecting the fit maxima. Mean height of a fibril was defined as the average
value of the corresponding maxima along the traced profile of the molecule. The populations
of mean fibril heights are shown in Fig. 1c (main text) and Supplementary Fig. 1.
TIRFM Imaging. To confirm the inhibition of ThT-active aggregate formation during the
aggregation of ɑS in the presence of NbSyn87 and NbSyn2, observed by bulk ThT assays
(Fig. 1, main text), we performed total internal reflection fluorescence microscopy imaging
(TIRFM) of unlabeled ɑS wt solutions according to previously reported protocols[6]. Protein

3
solutions were prepared and incubated under the same conditions as for the sm-FRET and
bulk ThT experiments, either alone or with the addition of 2 molar equivalents of nanobodies
(35 µM ɑS, 70 µM nanobodies, 20-h incubation). For imaging, the solutions were diluted to
200 nM (ɑS and ɑS with NbHul5g) or 500 nM (ɑS with NbSyn2 and ɑS with NbSyn87)
concentration into PBS buffer (PBS, 00-3002, ThermoFisher scientific), containing 5 µM
ThT and 2 nM Nile red (NR, N1142, ThermoFisher scientific), to enable the simultaneous
staining of ɑS aggregates with ThT and NR dyes. Fluorescence imaging was carried out using
custom-built TIRFM setup described previously[6]. Images were acquired at a frame rate of
20 ms and consisted of 100 frames in the ThT emission channel and 2000 frames in the NR
channel. Image stacks comprising 100 frames in the ThT channel were created. The
localisations in the NR channel were determined using the peak fit plugin (ImageJ, NIH,
Bethesda, USA). For each sample combination, 14-19 separate image stacks were collected,
enabling the characterization of 978-1815 individual protein aggregates. Representative
image stacks and the quantification of the numbers of aggregates and the fractions of ThT-
active species are in Supplementary Fig. 1b.
TEM Imaging. For transmission electron microscopy (TEM) imaging, 1:1 molar ratio of
AF488 and AF594-labeled ɑS were combined either in the absence or in the presence of
2 equivalents of the studied nanobodies, and incubated under identical conditions as the
samples used for sm-FRET and bulk ThT experiments. After >100-h incubation, PBS buffer
was exchanged for Tris (25 mM Tris, 0.1 M NaCl, pH 7.4) using spin-filters with molecular
cutoff of 5 kDa (Sartonis), because PBS buffer lead to the precipitation of negative stain in
preliminary TEM imaging experiments. 10 μL volumes of the samples were applied onto
carbon-coated 400-mesh copper grids (Agar Scientific) for 5 min, and washed with distilled
water. Negative staining was carried out by using 2% (w/v) uranyl acetate. TEM images were
acquired using Tecnai G2 microscope (13218, EDAX, AMETEK) operating at an excitation
voltage of 200 kV. Representative images are shown in Supplementary Fig. 2b, and are
consistent with AFM results obtained for unlabeled ɑS under identical incubation conditions
(see main text, Fig. 1b).
QCM experiments to analyze the elongation rates of pre-formed ɑS fibrils in the
presence of NbSyn87 and NbSyn2. Quartz crystal microbalance (QCM) measurements were
carried out with E4 QCM D instrument (Q-Sense, Biolin Scientific, Stockholm, Sweden),
using gold-coated QSX 301 sensor. ɑS fibril preparation and all subsequent measurements
4
were performed at 37 °C in PBS buffer, closely following previously reported protocols[7-9].
In order to outcompete the C-terminal region of ɑS with respect to binding to the nanobodies
and regenerate the surface-bound ɑS fibrils, a synthetic peptide (Genemed Synthesis Inc., San
Antonio, TX, USA) was used, based on the sequence of ɑS and comprising its residues 118-
140 (118-VDPDNEAYEMPSEEGYQDYEPEA-140). QCM data are shown in
Supplementary Fig. 1d. The rates of frequency decrease during the periods of incubation with
ɑS monomer, or with an equimolar ratio of ɑS and NbSyn87 or NbSyn2 are included in
Supplementary Tables 3 and 4, and presented as averages between the overtones N = 3,5,7.
The detailed interpretation of the measured values is in Supplementary Results.
Nanobody labeling with AF dyes. Random lysine labeling was performed using N-
Hydroxysuccinimde (NHS) linked AF647 or 488. 1.5 molar equivalents of AF647 (or 488)
NHS ester (Life Technologies) were added to unlabeled nanobody solution in 100 mM
sodium bicarbonate buffer (pH 8.3), and incubated with agitation for 3 h. The labeled protein
was then separated from free dye using Sephadex G-25 loaded PD-10 desalting columns (GE
Healthcare). The labeling efficiency was determined using UV-Vis absorbance
measurements, and was above 90% (NanoDrop 2000c UV-Vis Spectrophotometer, Thermo
Scientific). The stoichiometry of AF647 labeling of the nanobodies was determined
according to the manufacturer‟s specifications and confirmed by mass-spectrometry and was
found to be close to a 1:1 stoichiometry. The presence of the dye did not interfere with ɑS
binding as observed using total internal reflection fluorescence spectrometry and SPR (data
not shown).
TCCD data acquisition and analysis. To verify the absence of binding between
fluorescently-labeled nanobodies and fluorescently-labeled ɑS at single-molecule
concentrations in our experiments, control two-color coincidence detection (TCCD) was
performed. Dual excitation in either 488/594 nm or 488/633 nm mode (depending on the AF
label pairs of the analyzed samples) was used, and single-molecule confocal instrumentation
and methodology as previously described in detail[10, 11], utilizing a detection under fast-
flow as for the sm-FRET measurements. In TCCD experiments, in contrast to monitoring
FRET signal between the dye pairs, direct fluorescence signal from both AF488 and AF594
(or AF647) was detected as a consequence of direct dual-color laser excitation. Bound
species bearing two different fluorophores are expected to produce two fluorescence bursts
that are coincident in time, while singly labeled molecules will produce non-coincident

5
fluorescence bursts. The coincidence can be quantified using the association quotient Q,
defined as:
)( ECBA
ECQ
(S1)
where A is the number of fluorescent bursts in the blue channel above the 15 photons bin-1
threshold, B is the number of fluorescent bursts in the red channel, C is the number of
coincident events, and E is the number of chance-coincident events. Q value arising purely
due to chance coincidence events was determined by analyzing free AF dyes in solution, as
described below.
For the measurements, 1:1 stoichiometric ratio of AF-labeled ɑS and NbSyn87 was used.
This nanobody was chosen owing to its highest affinity for ɑS and therefore the highest
potential chance for it to remain bound in our single-molecule experiments. The following
equimolar combinations were tested: AF647-NbSyn87 + AF488-ɑS, AF488-NbSyn87 +
AF647-ɑS, AF488-NbSyn87 + AF594-ɑS. In addition, samples of free AF647 + AF488 and
aggregated AF647-ɑS + AF488-ɑS were analyzed as controls. For the measurements, the
samples were diluted either in PBS buffer or deionized water up to single-molecule
concentration suitable for the TCCD analysis. The dilution into different buffers served as a
test for potential changes in the co-interaction of the nanobody and ɑS due to the changes in
pH and ionic strength. Following the dilution, solutions were immediately introduced into a
straight channel of a microfluidic device via a gel-loading tip (200 µL, Life technologies) and
withdrawn at a constant rate of 1 cm s-1
via a syringe pump (PHD2000, Harvard Apparatus).
Overlapped laser beams were focused into the middle of the channel. For each sample, data
were acquired for 600 s, with 100 µs bin-width, chosen according to the expected residence
time in the excitation region at the chosen flow speed[12], 100,000 bins per frame and a total
of 60 frames. The fluorescence photon traces in two separate channels, the emission from
AF488 and AF594 dyes (or AF647, when the samples and the setup were in 488/647 mode),
were collected simultaneously and outputted using custom-programmed field-programmable
gate array (FPGA, Colexica). All measurements were made at ambient temperature around 20
°C, similarly to sm-FRET measurements.
The collected photon traces were analyzed using custom-written Igor Pro 6.22 (Wavemetrics)
software analogous to previously described[2]. The data were corrected for autofluorescence
and the crosstalk. Photon bursts with intensities greater than the threshold of 15 photons.bin-1
in the blue and in the red channels were selected according to previously established

6
threshold selection approach that allows maximizing the detection of coincident events.
Simultaneous events in both channels above the threshold (the AND criterion[13]) were
selected. To account for any possible coincident events due to chance, the desynchronization
approach was used[14]. Time-bins in the blue channel were randomly re-numbered before the
selection of simultaneous events in the two channels above the threshold. Using these
outputs, the association quotient Q was estimated according to equation S1. The resulting
values are summarized in Supplementary Table 1.
TCCD chance coincidence controls using free dyes in solution or dual-labeled ɑS. To
determine Q corresponding to a non-interacting system and resulting purely from the chance-
coincidence, 1:1 stoichiometric mixture of free AF dyes were measured by TCCD, keeping
the same detection conditions as for the protein measurements. The free unbound dyes were
prepared according to a previously published protocol[15]. For the measurement, 1:1 molar
ratio of AF488 and AF647 were used. The samples were recorded straight after preparation.
As positive controls, the samples of dual-labeled ɑS incubated under agitation at 2 µM for
72 h were also recorded. The data were analyzed in the same manner as the data recorded
using the fluorescent proteins and the resulting Q values are presented in Supplementary
Table 1.
In all cases, the Q values from NbSyn87 + ɑS samples were comparable to the values
obtained for the free dyes in solution, and lower than the Q value for aggregated ɑS.
Therefore, it can be concluded that the nanobody is fully unbound from ɑS in the single-
molecule experiments. This result suggests that the observed differences in FRET histograms
in single-molecule experiments are not due to photophysical effects on the fluorophores
caused by bound nanobodies and supports the hypothesis that they are due to the structural
differences of the analyzed oligomers.
Comparison of average ɑS monomer fluorescence intensities in the presence or in the
absence of unlabeled nanobodies. As an additional test to verify that the unlabeled
nanobodies did not interfere with the fluorescence emission from AF labels on ɑS, the values
of average monomer brightness in sm-FRET measurements were compared across the
samples with or without the nanobodies, following data collection with the sample dilutions
in either PBS or water. The resulting average AF488-ɑS monomer intensities selected above
the threshold of 15 photons.bin-1
are listed in Supplementary Table 2. The values are all
7
comparable, additionally confirming the absence of alteration of fluorescence signal in the
presence of nanobodies.
Kinetic analysis. The kinetic analysis was as recently reported[16], with the additional
inclusion of two explicit reverse reactions from high-FRET oligomers to low-FRET
oligomers, and from low-FRET oligomers to monomers, as shown in Supplementary Fig. 3a.
The following kinetic moment equations were used to model the aggregation of ɑS in the
absence and in the presence of nanobodies:
{
( ) ( )
( ) ( )
( )
( ) ( )
( ) ( )
( ) ( )
( ) ( ) ( ) ( )
( ) ( ) ( ) ( )
(S2)
where ( ) and ( ) are the number concentration of low-FRET and high-FRET
oligomers, ( ) and ( ) are the number and mass concentration of fibrils, ( ) is the
concentration of free ɑS monomer units, is the total concentration of monomer in the
system, and are the average size of low-FRET and high-FRET oligomers, which for
simplicity are both set equal to the critical nucleus size for primary nucleation.
are the rate constants governing the primary nucleation of low-FRET oligomers,
the conversion from low-FRET oligomers to high-FRET oligomers, the conversion from
high-FRET oligomers to fibrils, and the growth of fibrils respectively. Two reverse reactions,
with the rate constants and are introduced in order to describe the inhibitory effects of
nanobodies. In Fig. 3b-e, global fits are performed with the above model using four
experimental data sets with and without nanobodies. Parameters are determined through the
best fit to fibril, monomer and oligomer kinetics simultaneously. Error estimations are carried
out on each parameter separately by keeping the relative difference of all predictions within
20%.
Surface Plasmon Resonance Measurements. The kinetic constants of the interaction of
NbSyn87 with wt ɑS were determined by Surface Plasmon Resonance (SPR) measurements
8
(Biacore 3,000, GE Healthcare, Sweden). The ɑS protein was immobilized on a CM5 chip at
approximately 50 resonance units (50 pg/mm2), via EDC/NHS chemistry according to the
manufacturer‟s recommendations. Triplicate association traces of NbSyn87 for
concentrations ranging from 0 µM to 227 µM were recorded for 2 min in a buffer containing
10 mM HEPES pH 7.4, 150 mM NaCl, 0.005 % Tween 20 and 3 mM EDTA, at 25 °C.
Triplicate dissociation traces of the complexes in the buffer were recorded for 5 min. Curves
obtained after subtraction of the signals of the reference cell (the flow cell that contained no
immobilized protein) and injection of buffer, were then fitted to a 1:1 Langmuir binding
model with the program BIAeval (Biacore). The resulting values for NbSyn87: ɑS interaction
were: kon = (4.09 ± 0.04) × 106 M
-1s
-1; koff = (32.0 ± 0.1) × 10
-3 s
-1; and Kd=(7.82 ± 0.08) ×
10-9
M. These values were expected to increase but stay within the same order of magnitude
at 37 °C (El Turk et. al., Manuscript in preparation). For the NbSyn2: ɑS interaction, the
kinetics were considered too fast to be measured reliably by SPR. If to assume that the kon is
in the order of 1×10⁶ M
-1s
-1, then koff = Kd*kon = 0.26 s
-1 for a Kd value of 260 nM at 37
°C[17].
Proteinase K digestion assays. To confirm the structural differences of ɑS oligomers
generated in the presence of ɑS-specific nanobodies to the oligomers formed in the presence
of the control nanobody, their susceptibility to proteinase K digestion was measured. The
sample preparation was the same as for sm-FRET kinetic measurements, and solutions
contained a 1:1 dual-labeled mixture of ɑS (70 µM) with 2 equivalents of unlabeled
nanobodies. Proteinase K aliquots were prepared in PBS buffer of the same composition as in
all previous experiments, with the addition of 1 mM CaCl2, and stored at -80 °C before use.
Protein samples after 29-h incubation under the same conditions as in previous experiments
were diluted into a range of proteinase K concentrations between 0-10 µg ml-1
in PBS buffer
with 1 mM CaCl2. The total protein concentration during incubations with proteinase K was
280 nM of ɑS and 560 nM of nanobodies. Note that even though only fluorescently labeled
ɑS was detected in this experiment and unlabeled nanobodies remained „invisible‟, both ɑS
and nanobodies were expected to be susceptible to the digestion by proteinase K. Therefore,
ɑS samples in the absence of nanobodies were not measured to ensure consistent comparison
between the same starting total protein concentrations. The samples were incubated at 37 °C
for 10 min, and subsequently further diluted (up to 280 pM of ɑS) prior to analysis by sm-
FRET. The results, presented as a fraction of degradation against proteinase K

9
concentrations, are in Fig. 4a (main text), and representative data obtained for individual
timepoints are in Supplementary Fig. 5. To note, the relative minor difference in profiles of
the samples aggregated in the presence of ɑS-specific nanobodies (Fig. 4a, main text) may
reflect the differences in the binding affinity of the two nanobodies rather than the structural
dissimilarity of the ɑS oligomers, since the samples containing both nanobodies yielded
similar FRET efficiency distributions (Supplementary Fig. 5). The binding of ɑS-specific
nanobodies may protect against ɑS degradation. Because of the 10-fold difference in the
affinities of the two ɑS-specific nanobodies, higher fraction of ɑS was expected to be bound
by NbSyn87 than by NbSyn2 under the proteinase K incubation conditions, hence explaining
the resulting higher stability of oligomers formed in the presence of NbSyn87 in comparison
to the oligomers formed in the presence of NbSyn2 in this assay.
Proteasome degradation assays. These assays, presented in Fig. 4b (main text) were carried
out according to previously described protocol[18]. For the comparison between the
nanobody-containing samples and ɑS-only samples after 29 hours of incubation with respect
to their stability towards degradation by 26S proteasome, the samples were diluted for
proteasomal degradation to contain 40 nM proteasome, 125 mM ATP.MgCl2, 5 µM creatine
kinase and 0.1 M creatine phosphatase in 50 mM Tris buffer (pH 7.4). The resulting samples
were analyzed by sm-FRET both immediately after mixing, and after incubation for 24 h
under quiescent conditions at 37 °C. The fractions of non-degraded oligomers were
determined as the numbers of oligomers after the incubation divided by the numbers of
oligomers immediately after mixing (Fig. 4b, main text).
ROS measurements. Mixed cultures of hippocampal or cortical rat neurons and glial cells
were prepared and cultured as described previously[19]. The experiments were carried out
according to previously detailed protocols[1, 20]. For the assays presented in Fig. 4c (main
text), AF647-ɑS was used because the spectral properties of AF647 were more compatible
with the experiment than of AF488 or AF594 dyes. 70 M samples of ɑS, either in the
absence or presence of 2 equivalents of NbSyn2, NbSyn87 and NbHuL5g, were prepared and
incubated under identical conditions as for sm-FRET experiments. After 29-h incubation, the
solutions were withdrawn and used for ROS experiments. The solutions were applied to
10
primary co-cultures of neurons and astrocytes loaded with dihydroethidium (HEt) (2 μM HEt
was present in the solution during the experiments). No preincubation (“loading”) with HEt
was used in order to limit the intracellular accumulation of oxidized products. For HEt
measurements, a ratio of the fluorescence intensities resulting from its oxidized/reduced
forms was quantified. Emission recorded above 560 nm was assigned to be from the oxidized
form (ethidium), while emission collected from 405 to 470 nm was from the reduced form
(hydroethidium). The rate of ROS production was determined by dividing the gradient of the
HEt ratio function against time after application of 500 nM ɑS solution by the gradient prior
to ɑS application. The representative plots of HEt ratio against time are shown in
Supplementary Fig. 6. Consistent with our previous reports[1, 20], application of 500-nM ɑS
induced an increase in the rate of ROS production. Application of ɑS that had been
aggregated in the presence of control NbHul5g resulted in a similar increase in ROS
production, with no significant difference between the response caused by ɑS and ɑS plus
NbHul5g. In contrast, the application of ɑS sample aggregated with NbSyn87 as well as the
application of ɑS aggregated with NbSyn2 lead to significantly reduced rate of ROS (Fig. 4c,
main text).
Toxicity (cell death) experiments. These assays, presented in Fig. 4d (main text), were
carried out to investigate whether the effect of the nanobodies on the aggregation process
reduced the ability of ɑS aggregates to induce cell death. We applied the ɑS solutions
prepared as before, either in aqueous buffer or in the presence of nanobodies, to primary co-
cultures for 4 h. The cells were loaded simultaneously with 20 M propidium iodide (PI),
which is excluded from viable cells but exhibits red fluorescence following a loss of
membrane integrity, and 4.5 M Hoechst 33342 (Molecular Probes), which gives blue
staining to chromatin, to count the total number of cells. A total number of 600-800 neurons
or glial cells were counted in 10 fields of each coverslip after the 4-h incubation with 100-nM
ɑS samples that had been aggregated in the presence or the absence of the various
nanobodies. Each experiment was repeated 5 or more times using separate cultures. The
incubation of cells with 100-nM ɑS samples for 4 h resulted in an increase in cell death,
while the incubation of cells with ɑS aggregated in the presence of either NbSyn87 or
NbSyn2 lead to a significant reduction in cell death (Fig. 4d). Incubation of cells with either
nanobodies in the absence of ɑS was confirmed not to alter the basal rate of cell death.
11
Quantification of TNF-α production. The experiments in Fig. 4e (main text) were carried
out using BV2 microglia, according to the previously reported protocol[18]. ɑS-only (wt) at
70 µM, and in the presence of 140 µM of nanobodies were prepared as for all previous
aggregation assays, withdrawn at 29 h and applied at 10 µM concentration of ɑS. After
application, the cells were incubated at 37 °C for 24 h, and the supernatants were
subsequently collected and analyzed using TNF-ɑ Elisa kit (R & D, Minneapolis, MN)
according to manufacturer‟s protocol.
Statistical analysis of the data from cell experiments. Student t-tests (two-tailed) were
carried out using Origin 9 software (Microcal Software) or Microsoft Excel, and the resulting
ranges of p values are included in Fig. 4 (main text).
12
Supplementary Results
Analysis of QCM experiments: elongation of ɑS fibrils in the presence of NbSyn87 and
NbSyn2.
The data for both nanobodies show that the elongation rate is reduced directly after
incubation with nanobodies, or, even more clearly, in the presence of nanobodies. In both
cases the reduction in measured rate of frequency change is ca. 50%. Given that
stoichiometric amounts of ɑS monomer and nanobody are added, the elongation likely
proceeds through the addition of ɑS-nanobody complex. This complex has a mass of the
order of 24 kDa, compared to the molecular mass of ɑS alone of ca. 14 kDa. This difference
is relevant, as QCM senses the change in mass of the surface-bound material. If the signal in
the QCM experiment would only stem from the dry mass of the added protein, a decrease of
the rate of frequency change by 50% would translate therefore into an inhibition of 70%,
representing an upper bound of the observed inhibition.
We have shown in the past that the mass sensitivity of QCM for fibril growth is ca. 4 times as
high as predicted by the Sauerbrey equation[8], using the dry mass. Therefore, only ca. 25%
of the signal stem from the dry mass, and 75% stem from water that is dragged along with the
fibrils. If the frequency shift were proportional to the dry mass, i.e. that the dry mass always
contributes the same fraction to the frequency shift, then this would yield the same degree of
inhibition as calculated above (70%). If, however, we assume that the water contribution is
independent of the mass of the elongating unit (and rather defined by the fibril geometry,
which is probably not strongly dependent on the binding of the nanobody), we obtain a lower
bound for inhibition, corresponding to 58%.
Therefore, based on the QCM experiments, the elongation rate of pre-formed ɑS fibrils in the
presence of nanobody corresponds to 30-40% of the rate in the absence of nanobodies.
Kinetic analysis of ɑS aggregation in the presence of nanobodies.
Our experimental results showed that the presence of both ɑS-specific nanobodies slowed
down the aggregation of ɑS. Using sm-FRET measurements, we characterized the impact of
nanobodies on the earliest steps of the aggregation reaction and observed a clear inhibition of
high-FRET oligomer formation. To quantitatively characterize this inhibition in the presence
of the nanobodies, we applied kinetic analysis, using the nucleation-conversion-

13
polymerization model that we have recently reported for the aggregation of ɑS alone[16], but
additionally including two explicit reverse reactions, as is schematically outlined in
Supplementary Fig. 3a. According to this model, monomeric ɑS molecules assemble into
low-FRET oligomers, which subsequently convert into high-FRET oligomers. These in turn
convert into fibrils, which then grow via a succession of monomer addition steps. As
previously[16], within this description, oligomer conversion and fibril elongation steps are
treated as size-independent, and any late-stage processes such as fibril fragmentation do not
enter the analysis. To account for the observed inhibitory effects of the nanobodies on
oligomer conversion, we introduced two explicit reverse reaction steps, from high-FRET
oligomers to low-FRET oligomers and from low-FRET oligomers to monomers. The
inclusion of these steps enabled the overall rate of conversion to high-FRET oligomers to be
reduced in the presence of the ɑS-specific nanobodies, assuming the forward reactions to be
unaltered. It was confirmed that the addition of these two steps was necessary for the
analysis, because either decreasing the rates of forward reactions or solely decreasing one of
the two reverse reaction rates resulted in large deviations between the predicted and observed
ranges of aggregate concentrations.
We used the modified model to globally fit the kinetic profiles of monomer depletion,
oligomer formation and fibril formation. The rate constants reported in Supplementary Fig. 3
result from the best fit to monomer, oligomer and fibril kinetics simultaneously, and the fits
are shown in Supplementary Fig. 3b-e. All resulting parameters of the forward reactions are
consistent with our previous results23
. The estimated rate constants for the conversion from
high-FRET to low-FRET oligomers, , were 1± 0.5 h
-1 for NbSyn2 and 10±5 h
-1 for
NbSyn87, and both values are consistent with our independent experimental observation of
the rapid conversion within minutes of pre-formed high-FRET oligomers to low-FRET
oligomers upon the addition of nanobodies (shown in main text, Fig. 3). Using the derived
parameters, we predicted the kinetics of low-FRET and high-FRET oligomer production
during the aggregation reaction over longer time-period up to 100 h. According to these
predictions shown in Supplementary Fig. 3f, the concentration of low-FRET oligomers would
decrease slower in the presence of the ɑS-specific nanobodies than in their absence.
Furthermore, the formation of high-FRET oligomers would be inhibited, in good agreement
with the sm-FRET findings. These effects are predicted to be stronger in the presence of
NbSyn87, consistent with its higher affinity for ɑS in comparison to NbSyn2.
14
Supplementary Tables
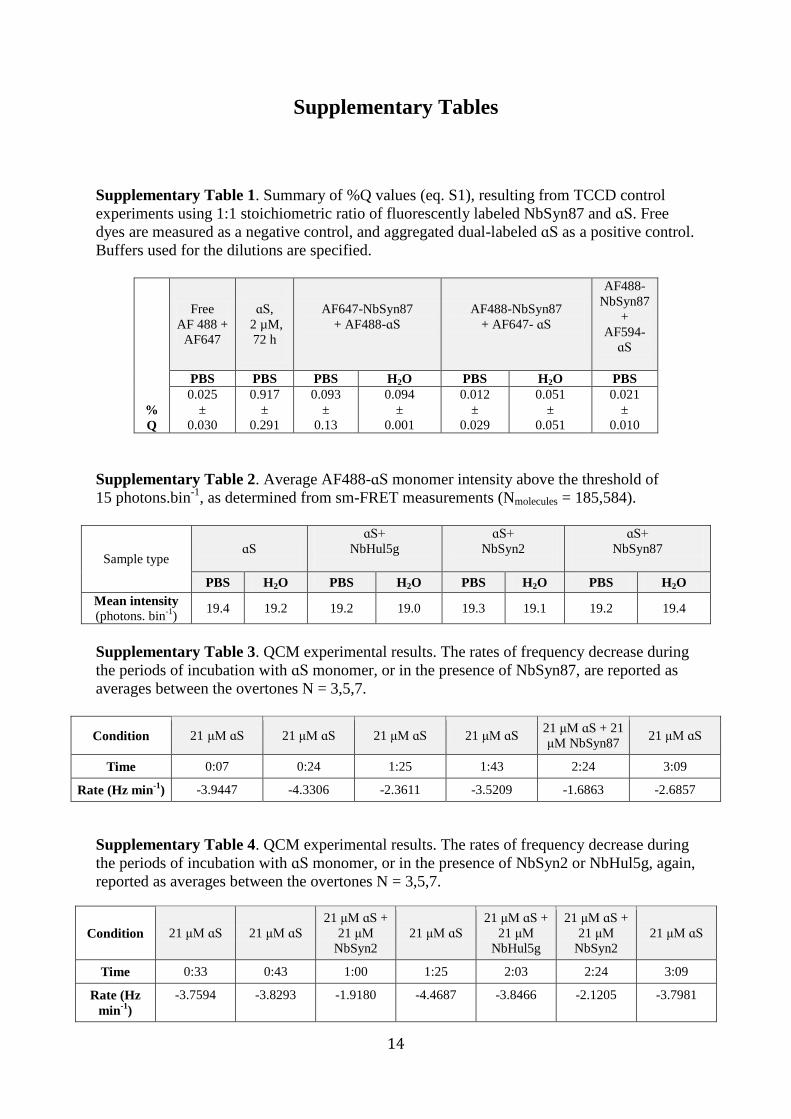
Supplementary Table 1. Summary of %Q values (eq. S1), resulting from TCCD control
experiments using 1:1 stoichiometric ratio of fluorescently labeled NbSyn87 and ɑS. Free
dyes are measured as a negative control, and aggregated dual-labeled ɑS as a positive control.
Buffers used for the dilutions are specified.
%
Q
Free
AF 488 +
AF647
ɑS,
2 µM,
72 h
AF647-NbSyn87
+ AF488-ɑS
AF488-NbSyn87
+ AF647- ɑS
AF488-
NbSyn87
+
AF594-
ɑS
PBS PBS PBS H2O PBS H2O PBS
0.025
±
0.030
0.917
±
0.291
0.093
±
0.13
0.094
±
0.001
0.012
±
0.029
0.051
±
0.051
0.021
±
0.010
Supplementary Table 2. Average AF488-ɑS monomer intensity above the threshold of
15 photons.bin-1
, as determined from sm-FRET measurements (Nmolecules = 185,584).
Sample type ɑS
ɑS+
NbHul5g
ɑS+
NbSyn2
ɑS+
NbSyn87
PBS H2O PBS H2O PBS H2O PBS H2O
Mean intensity (photons. bin
-1)
19.4 19.2 19.2 19.0 19.3 19.1 19.2 19.4
Supplementary Table 3. QCM experimental results. The rates of frequency decrease during
the periods of incubation with ɑS monomer, or in the presence of NbSyn87, are reported as
averages between the overtones N = 3,5,7.
Condition 21 μM ɑS 21 μM ɑS 21 μM ɑS 21 μM ɑS 21 μM ɑS + 21
μM NbSyn87 21 μM ɑS
Time 0:07 0:24 1:25 1:43 2:24 3:09
Rate (Hz min-1
) -3.9447 -4.3306 -2.3611 -3.5209 -1.6863 -2.6857
Supplementary Table 4. QCM experimental results. The rates of frequency decrease during
the periods of incubation with ɑS monomer, or in the presence of NbSyn2 or NbHul5g, again,
reported as averages between the overtones N = 3,5,7.
Condition 21 μM ɑS 21 μM ɑS
21 μM ɑS +
21 μM
NbSyn2
21 μM ɑS
21 μM ɑS +
21 μM
NbHul5g
21 μM ɑS +
21 μM
NbSyn2
21 μM ɑS
Time 0:33 0:43 1:00 1:25 2:03 2:24 3:09
Rate (Hz
min-1
)
-3.7594 -3.8293 -1.9180 -4.4687 -3.8466 -2.1205 -3.7981
15
Supplementary References
1. Cremades N, Cohen SI, Deas E, Abramov AY, Chen AY, Orte A, Sandal M, Clarke
RW, Dunne P, Aprile FA, et al: Direct observation of the interconversion of normal
and toxic forms of α-synuclein. Cell. 2012;149:1048-1059.
2. Horrocks MH, Tosatto L, Dear AJ, Garcia GA, Iljina M, Cremades N, Dalla Serra M,
Knowles TP, Dobson CM, Klenerman D: Fast Flow Microfluidics and Single-
Molecule Fluorescence for the Rapid Characterization of α-Synuclein Oligomers.
Anal Chem. 2015;87:8818-8826.
3. Ansaloni A, Wang ZM, Jeong JS, Ruggeri FS, Dietler G, Lashuel HA: One-pot
semisynthesis of exon 1 of the Huntingtin protein: new tools for elucidating the role
of posttranslational modifications in the pathogenesis of Huntington's disease. Angew
Chem Int Ed Engl. 2014;53:1928-1933.
4. Khalaf O, Fauvet B, Oueslati A, Dikiy I, Mahul-Mellier AL, Ruggeri FS, Mbefo MK,
Vercruysse F, Dietler G, Lee SJ, et al: The H50Q mutation enhances α-synuclein
aggregation, secretion, and toxicity. J Biol Chem. 2014;289:21856-21876.
5. Ruggeri FS, Habchi J, Cerreta A, Dietler G: AFM-Based Single Molecule
Techniques: unraveling the Amyloid Pathogenic Species. Curr Pharm Des. 2016.
6. Bongiovanni MN, Godet J, Horrocks MH, Tosatto L, Carr AR, Wirthensohn DC,
Ranasinghe RT, Lee JE, Ponjavic A, Fritz JV, et al: Multi-dimensional super-
resolution imaging enables surface hydrophobicity mapping. Nat Commun.
2016;7:13544.
7. Buell AK, White DA, Meier C, Welland ME, Knowles TP, Dobson CM: Surface
attachment of protein fibrils via covalent modification strategies. J Phys Chem B.
2010;114:10925-10938.
8. Michaels TC, Buell AK, Terentjev EM, Knowles TP: Quantitative Analysis of
Diffusive Reactions at the Solid-Liquid Interface in Finite Systems. J Phys Chem Lett.
2014;5:695-699.
9. Brown JW, Buell AK, Michaels TC, Meisl G, Carozza J, Flagmeier P, Vendruscolo
M, Knowles TP, Dobson CM, Galvagnion C: β-Synuclein suppresses both the
initiation and amplification steps of α-synuclein aggregation via competitive binding
to surfaces. Sci Rep. 2016;6:36010.
10. Orte A, Birkett NR, Clarke RW, Devlin GL, Dobson CM, Klenerman D: Direct
characterization of amyloidogenic oligomers by single-molecule fluorescence. Proc
Natl Acad Sci U S A. 2008;105:14424-14429.
11. Narayan P, Orte A, Clarke RW, Bolognesi B, Hook S, Ganzinger KA, Meehan S,
Wilson MR, Dobson CM, Klenerman D: The extracellular chaperone clusterin
sequesters oligomeric forms of the amyloid-β(1-40) peptide. Nat Struct Mol Biol.
2012;19:79-83.
12. Horrocks MH, Li H, Shim JU, Ranasinghe RT, Clarke RW, Huck WT, Abell C,
Klenerman D: Single molecule fluorescence under conditions of fast flow. Anal
Chem. 2012;84:179-185.
13. Ying L, Wallace M, Balasubramanian S, Klenerman D: Ratiometric analysis of
single-molecule fluorescence resonance energy transfer using logical combinations of
threshold criteria: A study of 12-mer DNA. Journal of Physical Chemistry B.
2000;104:5171-5178.
16
14. Clarke R, Orte A, Klenerman D: Optimized threshold selection for single-molecule
two-color fluorescence coincidence spectroscopy. Analytical Chemistry.
2007;79:2771-2777.
15. Rey NL, Petit GH, Bousset L, Melki R, Brundin P: Transfer of human α-synuclein
from the olfactory bulb to interconnected brain regions in mice. Acta Neuropathol.
2013;126:555-573.
16. Iljina M, Garcia GA, Horrocks MH, Tosatto L, Choi ML, Ganzinger KA, Abramov
AY, Gandhi S, Wood NW, Cremades N, et al: Kinetic model of the aggregation of
alpha-synuclein provides insights into prion-like spreading. Proc Natl Acad Sci U S
A. 2016.
17. De Genst EJ, Guilliams T, Wellens J, O'Day EM, Waudby CA, Meehan S, Dumoulin
M, Hsu ST, Cremades N, Verschueren KH, et al: Structure and properties of a
complex of α-synuclein and a single-domain camelid antibody. J Mol Biol.
2010;402:326-343.
18. Iljina M, Tosatto L, Choi ML, Sang JC, Ye Y, Hughes CD, Bryant CE, Gandhi S,
Klenerman D: Arachidonic acid mediates the formation of abundant alpha-helical
multimers of alpha-synuclein. Sci Rep. 2016;6:33928.
19. Vaarmann A, Gandhi S, Gourine AV, Abramov AY: Novel pathway for an old
neurotransmitter: dopamine-induced neuronal calcium signalling via receptor-
independent mechanisms. Cell Calcium. 2010;48:176-182.
20. Deas E, Cremades N, Angelova PR, Ludtmann MH, Yao Z, Chen S, Horrocks MH,
Banushi B, Little D, Devine MJ, et al: Alpha-Synuclein Oligomers Interact with
Metal Ions to Induce Oxidative Stress and Neuronal Death in Parkinson's Disease.
Antioxid Redox Signal 2016;24:376-391.