nancy edmonson consultant and qualified statistician houston, texas ntd reporting estimating...
TRANSCRIPT

Nancy EdmonsonConsultant and Qualified StatisticianHouston, Texas
NTD ReportingEstimating boardings and passenger miles with
automatic passenger counters and Ridecheck PlusAPC University
October 17, 2014Houston, TX

• Even with 100% APC-equipped vehicles, more than 2% of data is missing or discarded
NTD Reporting by APC Data Mining
FTA Requirements
• Considered an “alternative sampling technique”
• Meet NTD standard of 95% confidence and +/- 10% accuracy
• For APC-based data, parallel estimation for boardings and passenger miles for one year
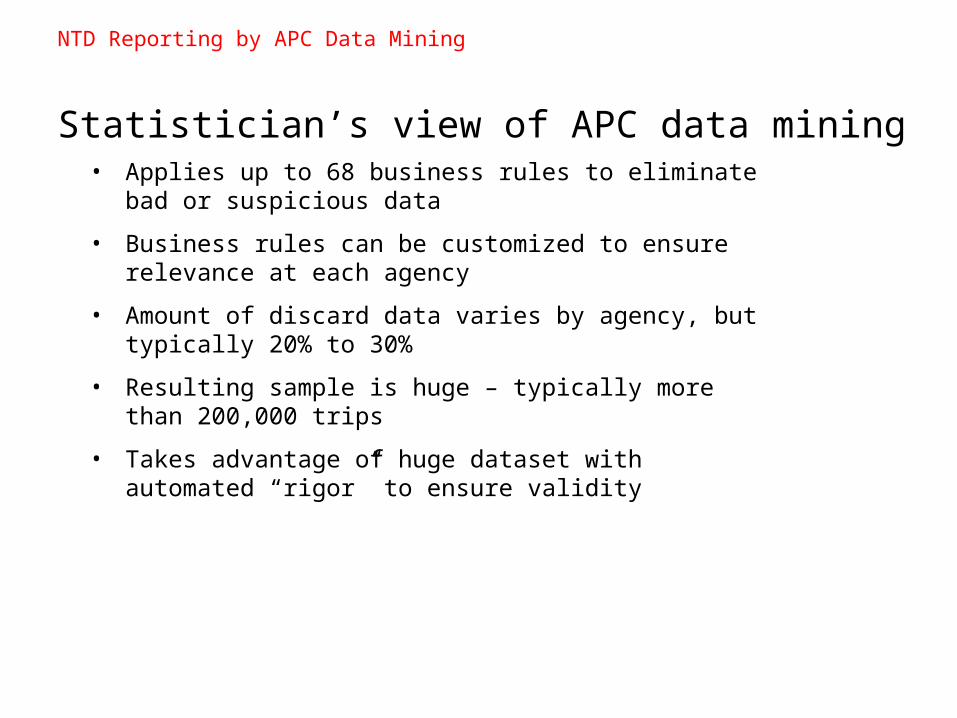
• Resulting sample is huge – typically more than 200,000 trips
• Business rules can be customized to ensure relevance at each agency
NTD Reporting by APC Data Mining
Statistician’s view of APC data mining• Applies up to 68 business rules to eliminate bad or
suspicious data
• Amount of discard data varies by agency, but typically 20% to 30%
• Takes advantage of huge dataset with automated “rigor” to ensure validity

NTD Reporting by APC Data Mining
Key is Data Cleaning• Covered earlier by Rich
• Key strength of the methodology
• Business rules set to be appropriate for each agency
• Block level and trip level checks
• Eliminates bad data as well as adjusts good data (e.g., carryover rule)

NTD Reporting by APC Data Mining
Basic Process – Work up from one survey 1

NTD Reporting by APC Data Mining
Summary of same trip 2

NTD Reporting by APC Data Mining
Average trip for entire month 3

NTD Reporting by APC Data Mining
Factor average trip into monthly total 4

NTD Reporting by APC Data Mining
Process boardings for all trips and routes 5

NTD Reporting by APC Data Mining
Process PM for all trips and routes 6

NTD Reporting by APC Data Mining
Survey sample huge -count by route and month

NTD Reporting by APC Data Mining
Process can include adjustments such as accuracy factor

• In areas of high ridership, how well do the APCs deal with crowds?
• Does agency have proper procedures for checking and calibrating APCs?
• If accuracy factor is used, is checker data representative of system?
• Are all routes, contractors and vehicle types represented in sample?
NTD Reporting by APC Data Mining
Check for bias, and check again
• Is system 100% APC-equipped?
• On lightly patronized trips, is operator activity substantially affecting ridership
• Are proper adjustments make for service interruptions, missed service, or special schedules?
• Were the checkers themselves reliable and accurate?
NTD Reporting by APC Data Mining
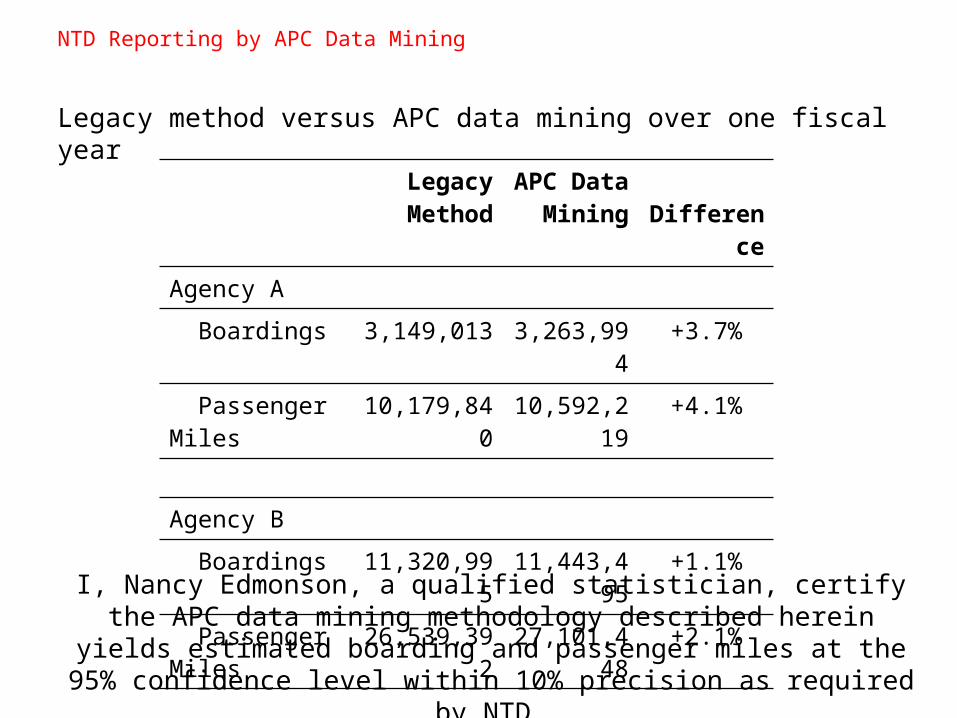
Legacy method versus APC data mining over one fiscal year
Legacy Method
APC Data Mining Difference
Agency A
Boardings 3,149,013 3,263,994 +3.7%
Passenger Miles 10,179,840 10,592,219 +4.1%
Agency B
Boardings 11,320,995 11,443,495 +1.1%
Passenger Miles 26,539,392 27,101,448 +2.1%
I, Nancy Edmonson, a qualified statistician, certify the APC data mining methodology described herein yields estimated boarding and passenger miles
at the 95% confidence level within 10% precision as required by NTD.