namibia annual trade statistics 2015
TRANSCRIPT

1Annual Trade Statistics Bulletin 2015Namibia Statistics Agency
Annual Trade Statistics Bulletin
2015
Namibia Statistics Agency
Namibia Statistics Agency, P. O. Box 2133, Windhoek, FGI House, Post Street Mall
Tel: +264 61 431 3200
Fax: +264 61 431 3253 | +264 61 431 3240
www.nsa.org.na

2 Annual Trade Statistics Bulletin 2015Namibia Statistics Agency
Our MissionIn a coordinated manner produce and
disseminate relevant, quality and timely statistics that are fit-for-purpose in
accordance with international standards and best practice.
Our VisionTo be a high performance institution in
statistics delivery
Our Shared ValuesExcellent Performance
IntegrityService focusTransparency
AccuracyPartnership
Forth coming issue Expected release date
Gross Domestic Product Fourth Quarter 2015 15 April 2015

1Annual Trade Statistics Bulletin 2015Namibia Statistics Agency
Our MissionIn a coordinated manner produce and
disseminate relevant, quality and timely statistics that are fit-for-purpose in
accordance with international standards and best practice.
Our VisionTo be a high performance institution in
statistics delivery
Our Shared ValuesExcellent Performance
IntegrityService focusTransparency
AccuracyPartnership

PREFACE
Foreign trade statistics play an important
role in Namibia’s economy as it measures
values and quantities of goods that,
by moving into or out of a country, add
or subtract from a nation’s material
stock of goods. Foreign trade statistics
are essential for the formulation of
monetary, fiscal, commercial and regional
integration policies. More importantly,
in the Southern African Customs Union
(SACU), reliable import statistics are
crucial when it comes to revenue sharing
among member states.
Since Namibia’s independence,
government policy has been to develop,
promote and diversify the country’s
exports as well as reducing its reliance on
foreign goods. It also helped to expand
and consolidate market shares of existing
markets and penetrate new markets. Prior
to independence, trade flow between
Namibia and the rest of the world was not
independently recorded.
Since 1990, positive developments have
taken place, both in the particulars
recorded and the methods of recording.
Computerization of procedures at the
Directorate of Customs and Excise in the
Ministry of Finance continues to enhance
the timely dissemination and analysis of
trade statistics through prompt transfer
of captured trade data at Customs to the
NSA.
This bulletin presents the annual trade
statistics for 2015.
Ndamona C. Kali
Acting Statistician-General
2 Annual Trade Statistics Bulletin 2015Namibia Statistics Agency
“Since 1990, positive developments have taken place, both in the particulars recorded and the methods of recording. Computerization of procedures at the Directorate of Customs and Excise in the Ministry of Finance continues to enhance the timely dissemination and analysis of trade statistics through prompt transfer of captured trade data at Customs to the NSA.”
“

CONTENTS1. Introduction .......................................................................................... 52. Key developments ................................................................................. 5
2.1. Revisions ..........................................................................................52.2. Trade balance ...................................................................................62.3. Exports to key markets .....................................................................72.4. Imports from key markets ................................................................82.5. Top export products .........................................................................92.6. Fish exports ....................................................................................102.7. Top re-exports products .................................................................112.8. Top import products ......................................................................12
3. Trade by economic regions .................................................................. 133.1. Exports ...........................................................................................133.2. Imports ...........................................................................................14
4. Trade by mode of transport ................................................................. 154.1. Exports ...........................................................................................154.2. Imports ...........................................................................................16
5. Conclusion ........................................................................................... 176. List of Terms and Definitions ................................................................ 187. Appendix ............................................................................................. 20
7.1. Trade by FOB value .........................................................................207.2. Main export destination .................................................................207.3. Main re-export destination ............................................................207.4. Main source of imports ..................................................................217.5. Top ten exports ..............................................................................217.6. Top ten re-exports ..........................................................................217.7. Top ten imports ..............................................................................227.8. Export products to key markets .....................................................227.9. Import products from key markets ................................................247.10. Trade by office ..............................................................................26
3Annual Trade Statistics Bulletin 2015Namibia Statistics Agency
LIST OF TABLESTable 1: 2014 Annual revisions .................................................................... 57.1. Trade by FOB value ........................................................................... 207.2. Main export destination ................................................................... 207.3. Main re-export destination ............................................................... 207.4. Main source of imports ..................................................................... 217.5. Top ten exports ................................................................................ 217.6. Top ten re-exports ............................................................................ 217.7. Top ten imports ................................................................................ 227.8. Export products to key markets ........................................................ 227.9. Import products from key markets .................................................... 247.10. Trade by office ................................................................................ 26
LIST OF FIGURESChart 1: Trade balance; 2006 to 2015 .......................................................... 6Chart 2: Main export destinations .............................................................. 7Chart 3: Main sources of imports ................................................................ 8 Chart 4: Top five exports ............................................................................ 9Chart 5: Fish exports ................................................................................. 10Chart 6: Top five re-exports ...................................................................... 11Chart 7: Top five imports .......................................................................... 12Chart 8: Export by economic regions ......................................................... 13Chart 9: Import by economic blocs ........................................................... 14Chart 10: Exports by mode of transport .................................................... 15Chart 11: Imports by mode of transport.................................................... 16
4 Annual Trade Statistics Bulletin 2015Namibia Statistics Agency

1. INTRODUCTIONThe mandate of the Namibia Statistics
Agency is to produce and disseminate
relevant, quality and timely statistics. This
includes statistics relating to imports and
exports. This report presents a summary
of trade statistics in terms of imports and
exports of merchandise during the year
2015.
Foreign trade statistics derived from
records of trade flows across international
borders are invaluable for the formulation
of commercial, fiscal and monetary
policies of any country.
The basic information for the compilation
of trade statistics is collected and captured
based on import/export declarations
made by traders.
2. KEY DEVELOPMENTS
2.1. RevisionsRevisions to trade data are made every
month. This occurs when a new monthly
data file is uploaded into the database
with additional information from previous
months. In some months, revisions are
negligible while in other months they are
significant.
Table 1 shows revisions made to 2014
data after more complete data became
available.
Total exports and imports for the year
2014 were revised slightly upward from
N$64.5 billion to N$64.7 billion, and
from N$90.7 billion to N$92.1 billion,
respectively.
These revisions resulted in the deficit to
swing up to N$27.4 billion from N$26.2
billion reported earlier.
Table 1: 2014 Annual revisions
FlowValue (N$ m)
Revised 2014 As reported in the previous report Difference
Export 64,677 64,455 2 22
Import 92,090 90,687 1,403
Trade balance -27,413 -26,232 -1,181
“The basic information for the compilation of trade statistics is collected and captured based on import/export declarations made by traders.”
“5Annual Trade Statistics Bulletin 2015Namibia Statistics Agency

2.2. Trade balanceNamibia continued to record an
unfavorable trade balance, with 2015
recording the highest trade deficit
amounting to N$39.2 billion in ten years
since 2006. The trade deficit widened by
43.1 percent to N$39.2 billion compared
to a revised figure of last year in which
the deficit was estimated to be N$27.4
billion (chart 1). The deficit widened as
expenditure on imports expanded by 6
percent while export revenue dropped by
9.8 percent.
Trade balance in Namibia averaged to a
deficit of N$11 billion from 2006 till 2015,
it reached an all-time high with a surplus
of N$2.6 billion in 2006 and a record low
with a deficit of N$39.2 billion during the
period under review.
In 2015, the largest deficits were recorded
with South Africa (N$50.7 billion), China
(N$4.3 billion), Bahamas (N$2.1 billion),
India (N$1.6 billion) and Germany
(N$1.2 billion) and the biggest trade
surpluses with Botswana (N$10.8 billion),
Switzerland (N$6.5 billion), Spain (N$2.3
billion), Angola (N$2.2 billion) and France
(N$1.3 billion).
Expenditure on imports rose up to N$97.6
billion, from N$92.1 billion last year, as
spending on mineral fuels, electrical
machinery, copper ores and articles of
iron or steel improved.
On the other hand, the overall value of
exports fell to N$58.4 billion down from
N$64.7 billion in the preceding year,
mainly due to lower sale of minerals such
as copper ore and zinc. In addition, vehicle
sales also dented overall export revenue.
Chart 1: Trade balance; 2006 to 2015
-40,000
-35,000
-30,000
-25,000
-20,000
-15,000
-10,000
-5,000
0
5,000
2006 2007 2008 2009 2010 2011 2012 2013 2014 2015
2,568
-375
998
-5,173-3,860
-5,140
-15,013
-17,226
-27,413
-39,196
Valu
e (N
$ m
)
Period
Export revenue
dropped by
9.8 %
6 Annual Trade Statistics Bulletin 2015Namibia Statistics Agency
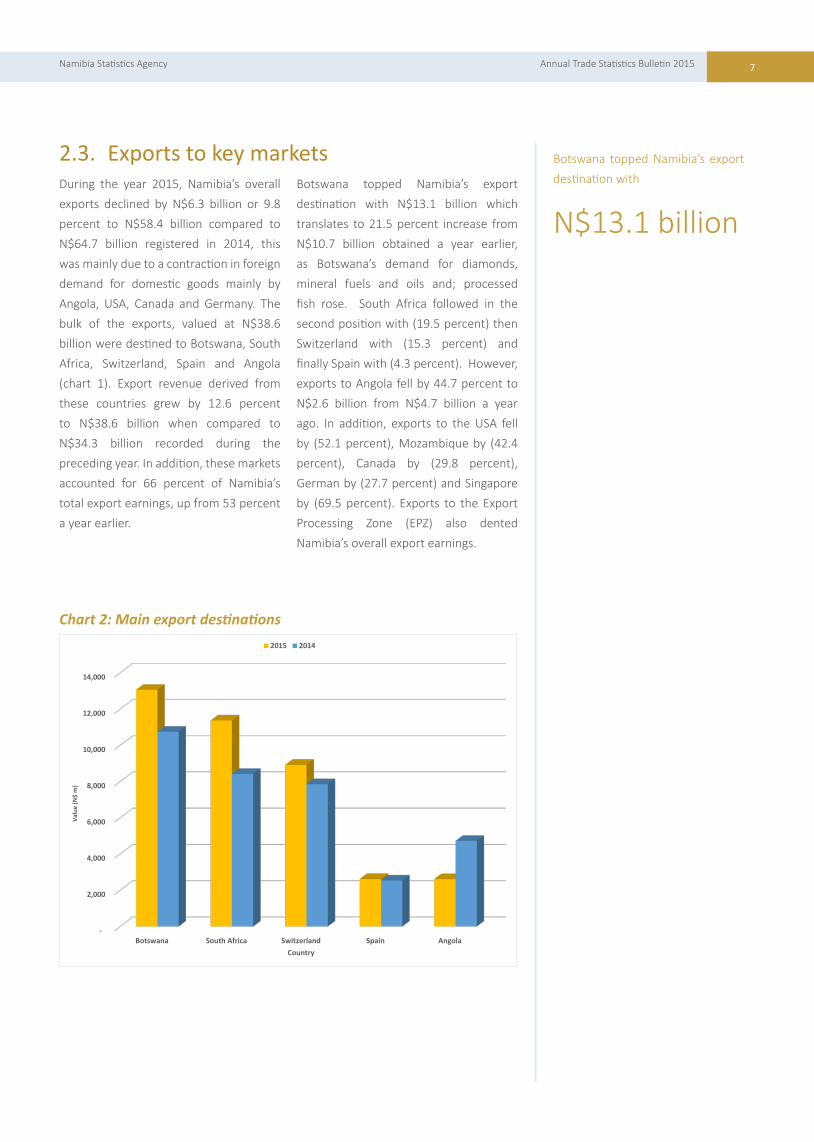
2.3. Exports to key marketsDuring the year 2015, Namibia’s overall
exports declined by N$6.3 billion or 9.8
percent to N$58.4 billion compared to
N$64.7 billion registered in 2014, this
was mainly due to a contraction in foreign
demand for domestic goods mainly by
Angola, USA, Canada and Germany. The
bulk of the exports, valued at N$38.6
billion were destined to Botswana, South
Africa, Switzerland, Spain and Angola
(chart 1). Export revenue derived from
these countries grew by 12.6 percent
to N$38.6 billion when compared to
N$34.3 billion recorded during the
preceding year. In addition, these markets
accounted for 66 percent of Namibia’s
total export earnings, up from 53 percent
a year earlier.
Botswana topped Namibia’s export
destination with N$13.1 billion which
translates to 21.5 percent increase from
N$10.7 billion obtained a year earlier,
as Botswana’s demand for diamonds,
mineral fuels and oils and; processed
fish rose. South Africa followed in the
second position with (19.5 percent) then
Switzerland with (15.3 percent) and
finally Spain with (4.3 percent). However,
exports to Angola fell by 44.7 percent to
N$2.6 billion from N$4.7 billion a year
ago. In addition, exports to the USA fell
by (52.1 percent), Mozambique by (42.4
percent), Canada by (29.8 percent),
German by (27.7 percent) and Singapore
by (69.5 percent). Exports to the Export
Processing Zone (EPZ) also dented
Namibia’s overall export earnings.
Chart 2: Main export destinations
-
2,000
4,000
6,000
8,000
10,000
12,000
14,000
Botswana South Africa Switzerland Spain Angola
Valu
e (N
$ m
)
Country
2015 2014
Botswana topped Namibia’s export
destination with
N$13.1 billion
7Annual Trade Statistics Bulletin 2015Namibia Statistics Agency

8 Annual Trade Statistics Bulletin 2015Namibia Statistics Agency
2.4. Imports from key marketsDuring the year 2015, goods imported
into Namibia increased by N$5.5 billion to
N$97.6 billion, from N$92.1 billion a year
earlier. South Africa, China, Switzerland,
Botswana and Bahamas were the main
suppliers of goods to Namibia during the
period under review (Chart 3). The overall
value of imports from these countries
increased by 21.5 percent translated to
N$75.1 billion when compared to N$61.8
billion witnessed in the year 2014. These
markets accounted for 77 percent of total
imports in 2015, down from 67 percent
last year.
The strongest growth in the value of
imports was mainly observed from
Zambia, Peru and China. Overall imports
from these markets grew to N$9.5 billion
compared to N$4.5 billion recorded last
year, as domestic demand for copper
cathodes, cereals and sugar from Zambia;
copper ores from Peru and ships, vessels,
boilers, articles of iron or steel from China
increased.
Namibia continues to depend on South
Africa as a major source of imports, as the
import bill from that country continues to
grow.
In 2015, the import bill rose by 19.8
percent to account for N$62 billion
compared to N$57.8 billion in the
preceding year. Substantial increases in
the value of imports were observed from
Switzerland at 66.5 percent, Botswana at
19.4 percent and India at 12.7 percent. In
the case of Switzerland, the increase was
mainly caused by copper ores, boilers and
vehicles, on the other hand, diamonds,
vehicles, pharmaceuticals and; mineral
fuel and oils influenced the increase in
the value of imports from Botswana.
Interestingly, Namibia recorded an
increase in the overall value of imports
from India, but this time around fish
imports influenced the growth in imports
from that country.
Namibians’ value of imports from some
markets declined, the strongest drop was
mainly observed from Germany (35.8
percent), the Bahamas (30.6 percent) and
DRC (22.6 percent).
Chart 3: Main sources of imports
-
10,000
20,000
30,000
40,000
50,000
60,000
70,000
South Africa China Switzerland Botswana Bahamas
Valu
e (N
$ m
)
Country
2015 2014
The strongest growth in the value of
imports was mainly observed from
Zambia, Peru and China.
Namibia continues to depend on
South Africa as a major source of
imports, as the import bill from that
country continues to grow.
Namibians’ value of imports
from some markets declined, the
strongest drop was mainly observed
from Germany (35.8 percent), the
Bahamas (30.6 percent) and DRC
(22.6 percent).

9Annual Trade Statistics Bulletin 2015Namibia Statistics Agency
2.5. Top export productsNamibia’s top five leading export
commodities in 2015 were diamonds,
copper cathodes, fish, copper ores and
zinc (Chart 4). Overall export earnings
generated from these commodities
increased by 9.7 percent to N$42.2
billion, up from N$38.4 billion obtained
a year earlier, making these commodities
to account for 72 percent of total export
revenue in the year under review, up from
59 percent as compared to the preceding
year.
Diamond continues to dominate the
export market, in 2015 it accounted for 33
percent of overall exports and increased
by 18.3 percent from last year due to
high demand from Botswana and South
Africa. In contrast, diamond exports
to the Export Processing Zone (EPZ),
Belgium, USA and Switzerland contracted.
The strongest growth in exports among
the aforementioned commodities was
observed in the value of copper cathodes
which rose to N$8 billion, from N$3.5
billion a year earlier as a result of external
demand from Switzerland that grew by
more than double, from N$3.5 billion
a year ago to N$7.5 billion in 2015. In
addition, high foreign demand for copper
cathodes by Italy, North Korea, China,
RSA, Saudi Arabia and Germany was also
the cause for a relatively sharp increase
in the overall value of copper cathodes
exported which subsequently moved up
three places to occupy the second place
as Namibia’s top export earner for 2015.
On the other hand, the strongest decline
in exports was reflected in the value of
vehicles, zinc, and copper ores. Total
revenue from exports derived from the
aforesaid commodities fell by 35 percent
to account for N$9.1 billion in 2015,
down from N$14 billion a year earlier. In
addition, the decline in export revenue
was also due to lower sales of boilers
(a decline of 38 percent), electrical
machinery and equipment (declined by
12.6 percent), salt and cement (declined
by 17.5 percent) and vessels (declined by
96.6 percent).
Chart 4: Top five exports
-
2,000
4,000
6,000
8,000
10,000
12,000
14,000
16,000
18,000
20,000
Diamonds Copper cathodes Fish Copper ores Zinc and articlesthereof
Valu
e (N
$ m
)
Commodities
2015 2014
Diamond continues to dominate the
export market, in 2015 it accounted
for 33% of overall exports and
increased by 18.3% from last year
due to high demand from Botswana
and South Africa.
The decline in export revenue was
also due to lower sales of boilers (a
decline of 38%), electrical machinery
and equipment (declined by 12.6 %),
salt and cement (declined by 17.5 %)
and vessels (declined by 96.6 %).
10 Annual Trade Statistics Bulletin 2015Namibia Statistics Agency
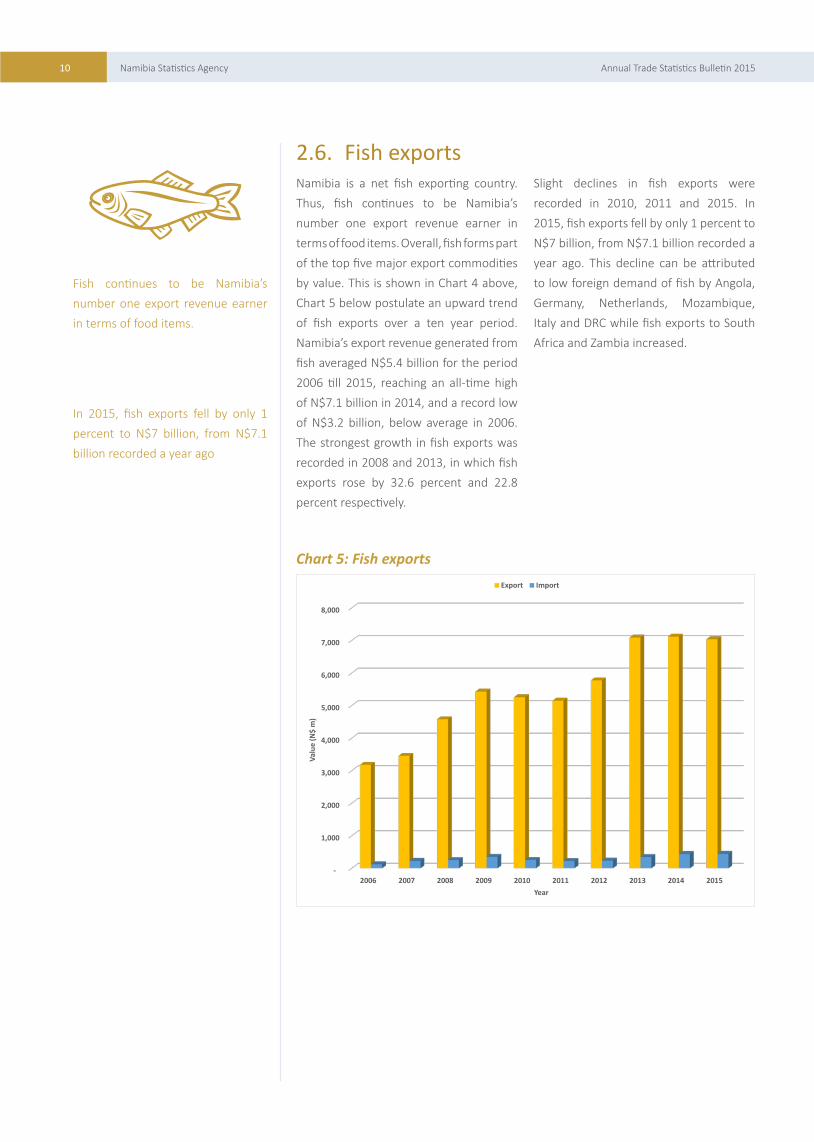
2.6. Fish exportsNamibia is a net fish exporting country.
Thus, fish continues to be Namibia’s
number one export revenue earner in
terms of food items. Overall, fish forms part
of the top five major export commodities
by value. This is shown in Chart 4 above,
Chart 5 below postulate an upward trend
of fish exports over a ten year period.
Namibia’s export revenue generated from
fish averaged N$5.4 billion for the period
2006 till 2015, reaching an all-time high
of N$7.1 billion in 2014, and a record low
of N$3.2 billion, below average in 2006.
The strongest growth in fish exports was
recorded in 2008 and 2013, in which fish
exports rose by 32.6 percent and 22.8
percent respectively.
Slight declines in fish exports were
recorded in 2010, 2011 and 2015. In
2015, fish exports fell by only 1 percent to
N$7 billion, from N$7.1 billion recorded a
year ago. This decline can be attributed
to low foreign demand of fish by Angola,
Germany, Netherlands, Mozambique,
Italy and DRC while fish exports to South
Africa and Zambia increased.
Chart 5: Fish exports
-
1,000
2,000
3,000
4,000
5,000
6,000
7,000
8,000
2006 2007 2008 2009 2010 2011 2012 2013 2014 2015
Valu
e (N
$ m
)
Year
Export Import
Fish continues to be Namibia’s
number one export revenue earner
in terms of food items.
In 2015, fish exports fell by only 1
percent to N$7 billion, from N$7.1
billion recorded a year ago

11Annual Trade Statistics Bulletin 2015Namibia Statistics Agency
2.7. Top re-exports productsRe-exports are exports of foreign goods,
which have been previously imported
into Namibia for different reasons. The
overall value of re-exported commodities
declined in 2015 by 27.8 percent to
N$9.6 billion, when compared to N$13.3
billion recorded a year earlier. Copper
cathodes, diamond, vehicles, boilers and
copper ores (Chart 6) were the most re-
exported commodities in 2015 in terms
of value. In addition, the value of these
commodities combined rose from N$3.8
billion last year to N$7.4 billion in 2015,
and this represents 96 percent growth.
Furthermore, the above mentioned
commodities accounted for 77 percent of
total re-export in 2015, down from 28.5
percent in the previous year.
Copper cathodes moved two places up
to occupy the first position as Namibia’s
top re-export commodity from the third
position it occupied last year, and was
mainly re-exported to Switzerland. On the
other hand, re-export of vessels was the
major cause for a decline in the overall
value of re-exports, as it dropped by 96.6
percent to N$0.3 billion, when compared
to N$9 billion witnessed a year ago.
Chart 6: Top five re-exports
-
500
1,000
1,500
2,000
2,500
3,000
3,500
Copper cathodes Diamonds Vehicles Boilers Copper ores
Valu
e (N
$ m
)
Commodities
2015 2014
12 Annual Trade Statistics Bulletin 2015Namibia Statistics Agency
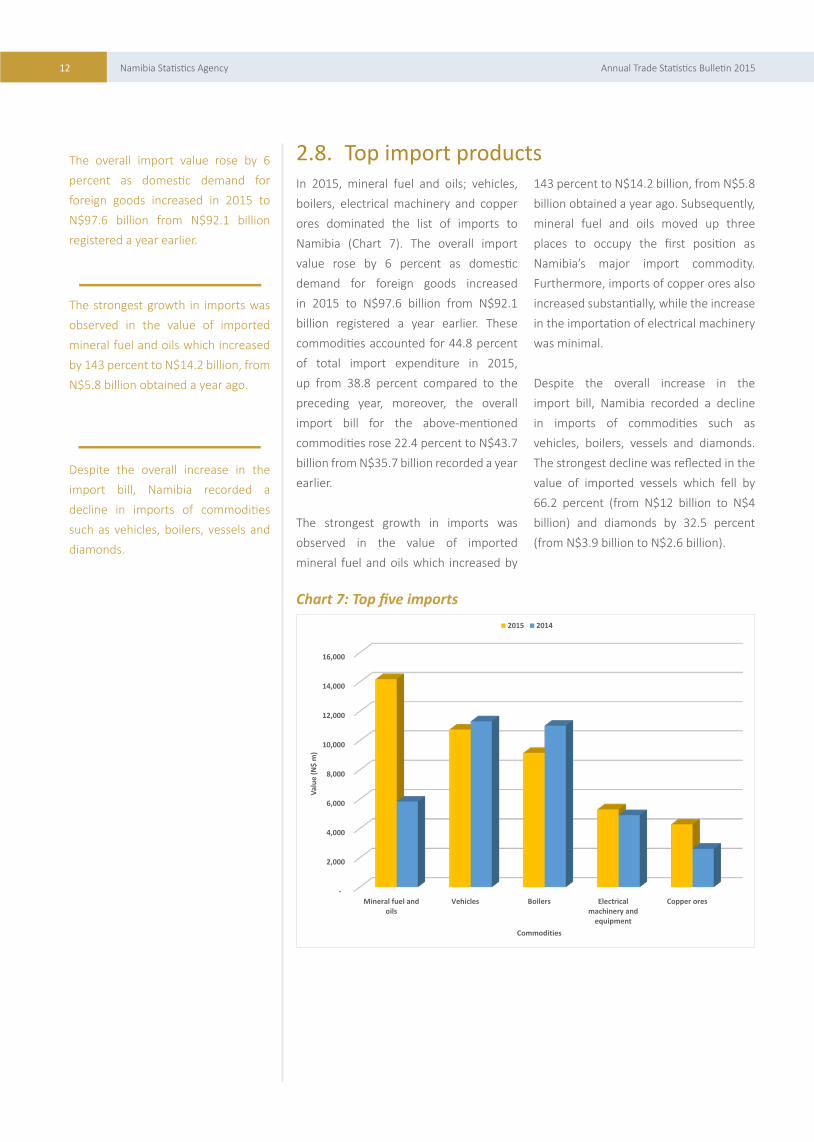
2.8. Top import products In 2015, mineral fuel and oils; vehicles,
boilers, electrical machinery and copper
ores dominated the list of imports to
Namibia (Chart 7). The overall import
value rose by 6 percent as domestic
demand for foreign goods increased
in 2015 to N$97.6 billion from N$92.1
billion registered a year earlier. These
commodities accounted for 44.8 percent
of total import expenditure in 2015,
up from 38.8 percent compared to the
preceding year, moreover, the overall
import bill for the above-mentioned
commodities rose 22.4 percent to N$43.7
billion from N$35.7 billion recorded a year
earlier.
The strongest growth in imports was
observed in the value of imported
mineral fuel and oils which increased by
143 percent to N$14.2 billion, from N$5.8
billion obtained a year ago. Subsequently,
mineral fuel and oils moved up three
places to occupy the first position as
Namibia’s major import commodity.
Furthermore, imports of copper ores also
increased substantially, while the increase
in the importation of electrical machinery
was minimal.
Despite the overall increase in the
import bill, Namibia recorded a decline
in imports of commodities such as
vehicles, boilers, vessels and diamonds.
The strongest decline was reflected in the
value of imported vessels which fell by
66.2 percent (from N$12 billion to N$4
billion) and diamonds by 32.5 percent
(from N$3.9 billion to N$2.6 billion).
Chart 7: Top five imports
-
2,000
4,000
6,000
8,000
10,000
12,000
14,000
16,000
Mineral fuel andoils
Vehicles Boilers Electricalmachinery and
equipment
Copper ores
Valu
e (N
$ m
)
Commodities
2015 2014
The overall import value rose by 6
percent as domestic demand for
foreign goods increased in 2015 to
N$97.6 billion from N$92.1 billion
registered a year earlier.
The strongest growth in imports was
observed in the value of imported
mineral fuel and oils which increased
by 143 percent to N$14.2 billion, from
N$5.8 billion obtained a year ago.
Despite the overall increase in the
import bill, Namibia recorded a
decline in imports of commodities
such as vehicles, boilers, vessels and
diamonds.

13Annual Trade Statistics Bulletin 2015Namibia Statistics Agency
3. TRADE BY ECONOMIC REGIONS
3.1. ExportsThe Southern African Customs Union
(SACU) maintained its position as
Namibia’s number one export market,
a position it held for the past ten years.
Export revenue from this region grew by
25 percent to account for N$24.4 billion
in 2015 from N$19.5 billion recorded a
year earlier. In addition, SACU accounted
for 28 percent of total exports to selected
regions (Chart 8), up from 25 percent
obtained in the previous year.
The European Union (EU) was Namibia’s
second largest export market. This is as
a result of a 17 percent growth in export
revenue from that market to N$9.4
billion in 2015, from N$8 billion last year.
In addition, the EU accounted for 10.6
percent of total exports, slightly up from
10.2 percent compared to a year earlier.
EFTA (Iceland, Liechtenstein, Norway and
Switzer-land) occupied the third position
as one of the largest export destinations
for Namibia. Exports to this market also
rose by 13.8 percent to N$8.986 billion,
from N$7.896 billion recorded a year
earlier. Additionally, export earnings
accounted for 10 percent of overall
export revenue, similar to its contribution
last year. Furthermore, export revenue
from the Common Market for Eastern and
Southern Africa (COMESA) also rose, from
N$3.7 billion reported in 2014 to N$4.3
billion in 2015.
On the other hand, the combined export
revenue from SADC-Non-SACU and BRIC
(Brazil, Russia, India and China), dropped
by 14 percent to account for N$9.6
billion, when compared to N$11.2 billion
recorded in 2014.
Chart 8: Export by economic regions
-
5,000
10,000
15,000
20,000
25,000
SACU EU EFTA SADC-NONSACU
COMESA BRIC
Valu
e (N
$ m
)
Economic region
2015 2014
SACU accounted for
28 % of total exports to selected regions
The European Union (EU) was
Namibia’s second largest export
market
The EU accounted for
10.6 %of total exports
EFTA (Iceland, Liechtenstein,
Norway and Switzer-land) occupied
the third position as one of the
largest export destinations for
Namibia.
The combined export revenue from
SADC-Non-SACU and BRIC (Brazil,
Russia, India and China), dropped
by
14 %

14 Annual Trade Statistics Bulletin 2015Namibia Statistics Agency
3.2. ImportsDuring the year under review, Namibia
mostly imported from the SACU region
compared to other economic regions
(Chart 9). Import expenditure from SACU
increased by 19.7 percent to N$64.6
billion compared to N$54 billion recorded
a year ago. In addition, the import bill
from SACU accounted for a share of 40
percent of total imports in 2015, similar
to what was recorded a year ago.
BRIC regional grouping occupied the
second position as Namibia’s major
source of imports, as domestic demand
from this region rose by a staggering
60 percent to account for N$8.8 billion,
compared to N$5.5 billion registered a
year ago. Subsequently, BRIC moved one
place up to replace the EU as one of the
major import source for Namibia, from
the third place in 2014.
In addition, BRIC accounted for 5.4
percent share of total imports to Namibia,
down from 4.1 percent share it accounted
for in the preceding year.
The EU followed in the third place with
imports valued at N$6.5 billion in 2015,
this represents a 25.7 percent decline
when compared to N$8.8 billion worth
of imports recorded a year earlier.
Furthermore, the region accounted for
4 percent of total imports, down from
6.5 percent recorded a year ago. SADC-
Non-SACU nations occupied the fourth
position as Namibia’s source of imports.
The expenditure on imports to this region
grew by 47 percent to N$5.2 billion in
2015, up from N$3.5 billion recorded a
year ago. In addition, COMESA and EFTA
also contributed significantly as Namibia’s
source of imports during the period of
review.
Chart 9: Import by economic blocs
-
10,000
20,000
30,000
40,000
50,000
60,000
70,000
SACU BRIC EU SADC-NONSACU
COMESA EFTA
Valu
e (N
$ m
)
Economic region
2015 2014
BRIC accounted for
5.4 % share of total imports to Namibia

15Annual Trade Statistics Bulletin 2015Namibia Statistics Agency
4. TRADE BY MODE OF TRANSPORT
4.1. ExportsIn 2015, the majority of Namibia’s
export goods were transported via sea
(Chart 10), however, the overall value of
goods exported via this transport mode
dropped by 28 percent to account for
N$22.1 billion, when compared to N$30.1
billion reported a year ago. In addition,
sea transport accounted for 38 percent
of Namibia’s total exports, down from 47
percent recorded in the preceding year.
Similarly, the value of goods transported
via road also dropped. However, the drop
in exported goods via road was minimal
when compared to the drop of exports via
sea.
It dropped by only 8 percent to account for
N$17.7 billion in 2015, from N$19.1 billion
recorded in the preceding year. Moreover,
the percentage share of exports via road
remained relatively constant over the two
periods.
Despite the decline in exports via sea
and road, goods exported through air
transport rose by 28 percent to account
for N$18.5 billion, this is N$4.1 billion
higher than what was reported a year
ago. Additionally, exports via this mode
accounted for 32 percent of total exports
transported, down from 22 percent
recorded in the past year.
Chart 10: Exports by mode of transport
-
5,000
10,000
15,000
20,000
25,000
30,000
35,000
Sea Air Road
Valu
e (N
$ m
)
Transport mode
2015 2014
In 2015, the majority of
Namibia’s export goods were
transported via sea.
Sea transport accounted for
38 %of Namibia’s total exports.
Goods exported through air
transport rose by
28 %Exports via this mode
accounted for
32 % of total exports transported
16 Annual Trade Statistics Bulletin 2015Namibia Statistics Agency
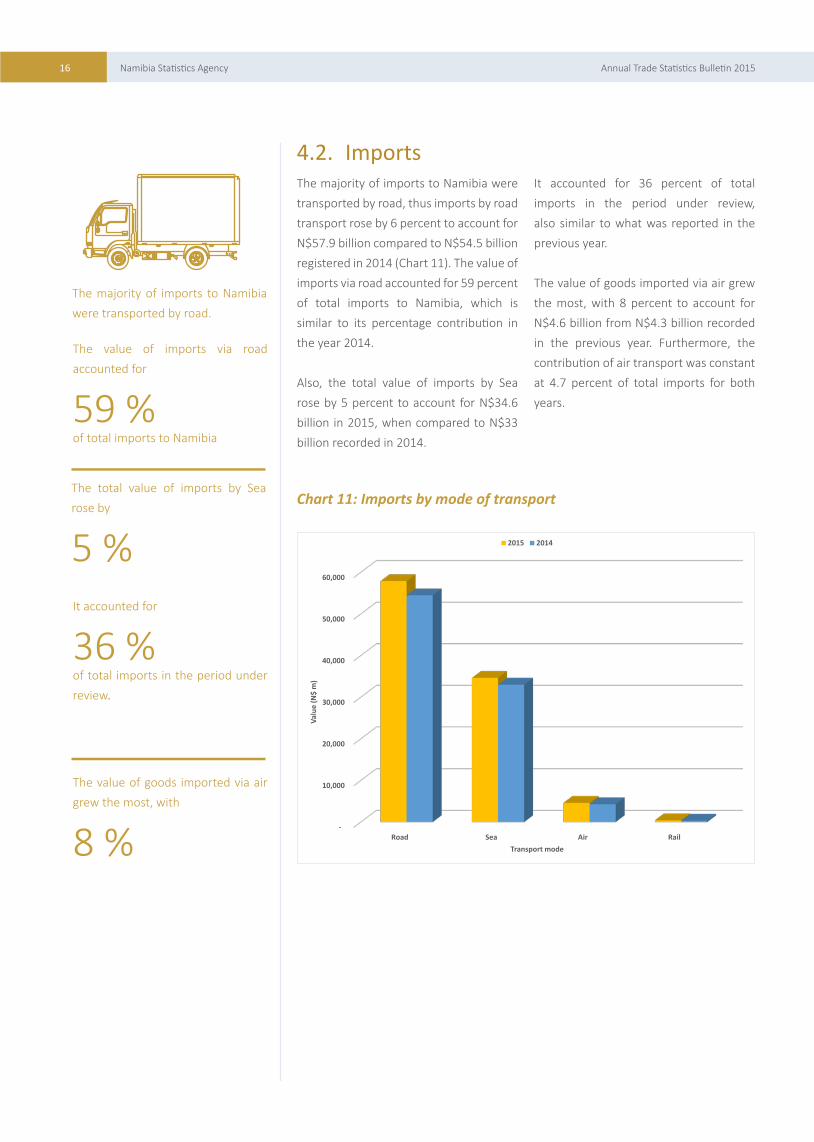
4.2. ImportsThe majority of imports to Namibia were
transported by road, thus imports by road
transport rose by 6 percent to account for
N$57.9 billion compared to N$54.5 billion
registered in 2014 (Chart 11). The value of
imports via road accounted for 59 percent
of total imports to Namibia, which is
similar to its percentage contribution in
the year 2014.
Also, the total value of imports by Sea
rose by 5 percent to account for N$34.6
billion in 2015, when compared to N$33
billion recorded in 2014.
It accounted for 36 percent of total
imports in the period under review,
also similar to what was reported in the
previous year.
The value of goods imported via air grew
the most, with 8 percent to account for
N$4.6 billion from N$4.3 billion recorded
in the previous year. Furthermore, the
contribution of air transport was constant
at 4.7 percent of total imports for both
years.
Chart 11: Imports by mode of transport
-
10,000
20,000
30,000
40,000
50,000
60,000
Road Sea Air Rail
Valu
e (N
$ m
)
Transport mode
2015 2014
The total value of imports by Sea
rose by
5 %
The value of goods imported via air
grew the most, with
8 %
The majority of imports to Namibia
were transported by road.
The value of imports via road
accounted for
59 %of total imports to Namibia
It accounted for
36 %
of total imports in the period under
review.

17Annual Trade Statistics Bulletin 2015Namibia Statistics Agency
5. CONCLUSION
Namibia recorded a negative trade
balance valued at N$39.2 billion in 2015,
it widened by 43 percent from N$27.4
billion reported in 2014.
During the period under review,
Namibia’s key export markets were mainly
Botswana, South Africa, Switzerland,
Spain and Angola. On the other hand
Namibia’s imports were mainly sourced
from South Africa, China, Switzerland,
Botswana and the Bahamas.
Major exported commodities were:
diamonds, copper cathodes, fish,
copper ores and zinc. Similarly, the
aforementioned commodities including
vehicles and boilers were the top re-
exports.
On the other hand, major import
commodities were: mineral fuel and oils;
vehicles, boilers, electrical machinery and
equipment; and copper ores.
In terms of economic regions, Namibia’s
export destinations in 2015 were SACU,
Non-SACU-SADC, EU and EFTA. Imports
were also mostly sourced from the same
economic regions with SACU dominating
followed by BRIC, EU, and then EFTA.
Namibia exported most commodities
via sea while most commodities were
imported via road. Air transport also
played a vital role in both the exports and
imports of commodities.

18 Annual Trade Statistics Bulletin 2015Namibia Statistics Agency
6. LIST OF TERMS AND DEFINITIONS
Export Processing Zone (EPZ): An Export Processing Zone (EPZ) is a Customs area where
one is allowed to import machinery, equipment and material for the manufacture of
export goods under security, without payment of duty. The imported goods are subject
to customs control at importation, through the manufacturing process, to the time of
sale/export, or duty payment for home consumption.
Trade Balance: The commercial balance or net exports (sometimes symbolized as NX),
is the difference between the monetary value of exports and imports of output in an
economy over a certain period.
Trade Deficit: Is an economic measure of a negative trade balance in which a country’s
imports exceeds its exports.
Trade Surplus: Is an economic measure of a positive trade balance in which a country’s
exports exceeds its imports.

19Annual Trade Statistics Bulletin 2015Namibia Statistics Agency
ACRONYMS
BRIC Brazil, Russia, India and China
COMESA Common Market for Eastern and Southern Africa
DRC Democratic Republic of Congo
EAC East African Community
EFTA European Free Trade Association
EPZ Export Processing Zone
EU European Union
SACU Southern African Customs Union
SADC Southern African Development Community

20 Annual Trade Statistics Bulletin 2015Namibia Statistics Agency
7. APPENDIX
7.1. Trade by FOB valueYear
Export ImportValue (fob) Value (cif) Value (fob)
2015 58,362 97,558 91,423
2014 64,677 92,090 86,932
7.2. Main export destinationPartner
2015 2014
Value (N$ m) Share Value (N$ m) Share Annual change
Botswana 13,065 2 2.4 10,749 1 6.6 21.5
South Africa 11,370 1 9.5 8,420 1 3.0 35.0
Switzerland 8,921 1 5.3 7,857 1 2.1 13.5
Spain 2,620 4.5 2,536 3.9 3.3
Angola 2,614 4.5 4,723 7.3 -44.7
Zambia 2,368 4.1 1,816 2.8 30.4
China 1,991 3.4 1,930 3.0 3.1
EPZ 1,761 3.0 2,588 4.0 -32.0
France 1,654 2.8 1,036 1.6 59.6
DRC 1,604 2.7 1,135 1.8 41.3
Other 10,394 1 7.8 21,885 3 3.8 -52.5
Total 58,362 100.0 64,677 100.0 -9.8
7.3. Main re-export destinationPartner
2015 2014
Value (N$ m) Share Value (N$ m) Share Annual change
Switzerland 4,070 4 2.3 1,303 9.8 212.3
South Africa 1,316 1 3.7 1,367 1 0.3 -3.7
Angola 981 1 0.2 308 2.3 218.9
BELGIUM 595 6.2 351 2.6 69.6
USA 543 5.6 333 2.5 63.0
Zambia 442 4.6 82 0.6 437.2
DRC 376 3.9 43 0.3 764.8
China 299 3.1 3 0.0 10,169.5
India 266 2.8 74 0.6 259.1
Viet-Nam 107 1.1 5 0.0 1,865.3
Other 617 6.4 9,437 7 0.9 -93.5
Total 9,611 100.0 13,306 100.0 -27.8

21Annual Trade Statistics Bulletin 2015Namibia Statistics Agency
7.4. Main source of importsPartner
2015 2014Value (N$ m) Share Value (N$ m) Share Annual change
South Africa 62,023 6 3.6 51,754 5 6.2 19.8
China 6,280 6.4 3,633 3.9 72.8
Switzerland 2,383 2.4 1,431 1.6 66.5
Botswana 2,307 2.4 1,932 2.1 19.4
Bahamas 2,134 2.2 3,076 3.3 -30.6
Zambia 2,089 2.1 534 0.6 291.1
India 1,843 1.9 1,635 1.8 12.7
DRC 1,842 1.9 2,381 2.6 -22.6
German 1,675 1.7 2,609 2.8 -35.8
Peru 1,111 1.1 299 0.3 271.5
Other 13,873 1 4.2 22,806 2 4.8 -39.2
Total 97,558 100.0 92,090 100.0 5.9
7.5. Top ten exports Commodities
2015 2014Value (N$ m) Share Value (N$ m) Share Annual change
Diamonds 19,528 3 3.5 16,513 2 5.5 18.3
Copper cathodes 8,014 1 3.7 3,512 5.4 128.2
Fish 7,036 1 2.1 7,117 1 1.0 -1.1
Copper ores 5,642 9.7 8,038 1 2.4 -29.8
Zinc and articles thereof 1,962 3.4 3,264 5.0 -39.9
Beverages (Inc alcoholic) 1,594 2.7 1,650 2.6 -3.4
Live animals 1,556 2.7 755 1.2 106.0
Vehicles 1,475 2.5 2,653 4.1 -44.4
Mineral fuels and oils 1,272 2.2 941 1.5 35.1
Meat 1,209 2.1 1,198 1.9 1.0
Other 9,076 1 5.6 19,036 2 9.4 -52.3
Total 58,362 100.0 64,677 100.0 -9.8
7.6. Top ten re-exportsCommodities
2015 2014Value (N$ m) Share Value (N$ m) Share Annual change
Copper cathodes 3,032 3 1.5 9 87 7.4 207.2
Diamonds 2,094 2 1.8 1,322 9.9 58.4
Vehicles 1,000 1 0.4 7 74 5.8 29.2
Boilers 7 36 7.7 7 06 5.3 4.3
Copper ores 5 61 5.8 - - -
Electrical machinery and equipment 3 09 3.2 2 32 1.7 33.2
Vessels 3 02 3.1 8,899 6 6.9 -96.6
Misscellaneous chemical products 2 43 2.5 12 0.1 1,865.2
Medical or surgical instruments 2 00 2.1 2 37 1.8 -15.3
Paper or parperboards 1 63 1.7 23 0.2 605.1
Other 9 71 1 0.1 1 14 0.9 749.9
Total 9,611 100.0 1 3,306 100.0 -27.8

22 Annual Trade Statistics Bulletin 2015Namibia Statistics Agency
7.7. Top ten importsCommodities
2015 2014Value (N$ m) Share Value (N$ m) Share Annual change
Mineral fuel and oils 14,190 1 4.5 5,840 6.3 142.99
Vehicles 10,757 1 1.0 11,311 1 2.3 -4.89
Boilers 9,159 9.4 11,022 1 2.0 -16.90
Electrical machinery and equipment 5,305 5.4 4,909 5.3 8.07
Copper ores 4,290 4.4 2,615 2.8 64.03
Articles of iron or steel 4,218 4.3 3,592 3.9 17.43
Vessels 4,045 4.1 11,968 1 3.0 -66.20
Copper cathodes 3,856 4.0 2,831 3.1 36.21
Diamonds 2,615 2.7 3,873 4.2 -32.49
Beverages (Inc alcoholic) 2,461 2.5 2,450 2.7 0.43
Other 36,661 3 7.6 31,678 3 4.4 15.73
Total 97,558 100.0 92,090 100.0 5.94
7.8. Export products to key marketsBotswana
Commodities2015 2014
Value (N$ m) Share Value (N$ m) Share Annual changeDiamonds 12,352 9 4.5 9,743 90.6 26.8
Mineral fuel and oils 551 4.2 400 3.7 37.5
Preparations of meats, of fish 50 0.4 35 0.3 42.3
Beverages (Inc alcoholic) 28 0.2 33 0.3 -15.1
Cement 22 0.2 0.1 49.8
Boilers 16 0.1 9 0.1 84.8
Vehicles 15 0.1 287 2.7 -94.9
Fish 4 0.0 5 0.0 -7.2
Preparations of cereals and pastrycook products 4 0.0 0 0.0 940.3
Electrical machinery and equipment 3 0.0 83 0.8 -96.1
Other 20 0.2 139 1.3 -85.3
Total 13,065 100.0 10,749 1 00.0 21.5
South Africa
Commodities2015 2014
Value (N$ m) Share Value (N$ m) Share Annual changeDiamonds 3,097 2 7.2 992 11.8 212.2
Live animals 1,497 1 3.2 574 6.8 160.7
Fish 1,087 9.6 968 11.5 12.2
Beverages (Inc alcoholic) 819 7.2 798 9.5 2.6
Meat 682 6.0 680 8.1 0.4
Vehicles 608 5.3 605 7.2 0.4
Preparations of meats, of fish 538 4.7 547 6.5 -1.6
Mineral fuel and oils 474 4.2 25 0.3 1,780.8
Boilers 457 4.0 762 9.1 -40.0
Electrical machinery and equipment 433 3.8 522 6.2 -17.0
Other 1,677 1 4.8 1,947 23.1 -13.8
Total 11,370 100.0 8,420 100.0 35.0
23Annual Trade Statistics Bulletin 2015Namibia Statistics Agency
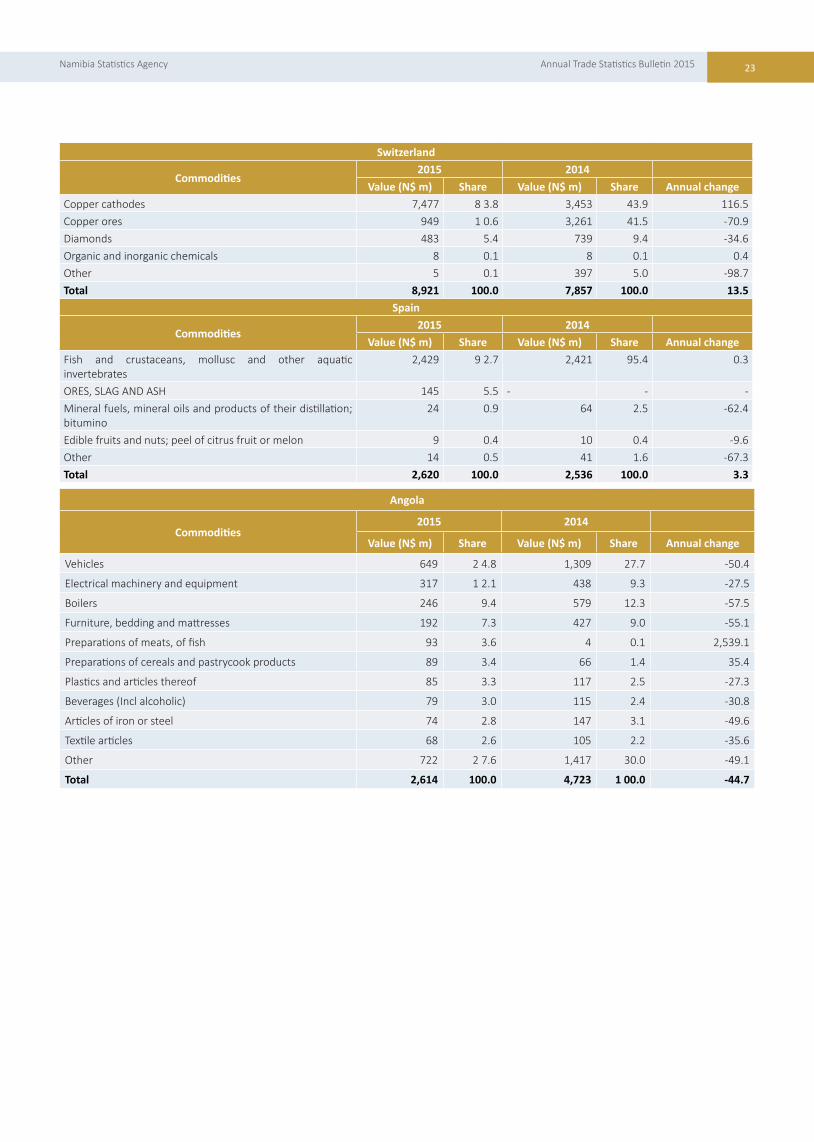
Switzerland
Commodities2015 2014
Value (N$ m) Share Value (N$ m) Share Annual changeCopper cathodes 7,477 8 3.8 3,453 43.9 116.5
Copper ores 949 1 0.6 3,261 41.5 -70.9
Diamonds 483 5.4 739 9.4 -34.6
Organic and inorganic chemicals 8 0.1 8 0.1 0.4
Other 5 0.1 397 5.0 -98.7
Total 8,921 100.0 7,857 100.0 13.5Spain
Commodities2015 2014
Value (N$ m) Share Value (N$ m) Share Annual changeFish and crustaceans, mollusc and other aquatic invertebrates
2,429 9 2.7 2,421 95.4 0.3
ORES, SLAG AND ASH 145 5.5 - - -
Mineral fuels, mineral oils and products of their distillation; bitumino
24 0.9 64 2.5 -62.4
Edible fruits and nuts; peel of citrus fruit or melon 9 0.4 10 0.4 -9.6
Other 14 0.5 41 1.6 -67.3
Total 2,620 100.0 2,536 100.0 3.3
Angola
Commodities2015 2014
Value (N$ m) Share Value (N$ m) Share Annual change
Vehicles 649 2 4.8 1,309 27.7 -50.4
Electrical machinery and equipment 317 1 2.1 438 9.3 -27.5
Boilers 246 9.4 579 12.3 -57.5
Furniture, bedding and mattresses 192 7.3 427 9.0 -55.1
Preparations of meats, of fish 93 3.6 4 0.1 2,539.1
Preparations of cereals and pastrycook products 89 3.4 66 1.4 35.4
Plastics and articles thereof 85 3.3 117 2.5 -27.3
Beverages (Incl alcoholic) 79 3.0 115 2.4 -30.8
Articles of iron or steel 74 2.8 147 3.1 -49.6
Textile articles 68 2.6 105 2.2 -35.6
Other 722 2 7.6 1,417 30.0 -49.1
Total 2,614 100.0 4,723 1 00.0 -44.7

24 Annual Trade Statistics Bulletin 2015Namibia Statistics Agency
7.9. Import products from key marketsSouth Africa
Commodities2015 2014
Value (N$ m) Share Value (N$ m) Share Annual changeVehicles 9,500 15.3 9,566 1 8.5 -0.7
Mineral fuel and oils 9,076 14.6 2,399 4.6 278.3
Boilers 5,864 9.5 5,804 1 1.2 1.0
Electrical machinery and equipment 3,720 6.0 3,372 6.5 10.3
Articles of iron or steel 3,025 4.9 2,852 5.5 6.1
Beverages (Incl alcoholic) 2,260 3.6 2,243 4.3 0.8
Plastics and articles thereof 1,724 2.8 1,534 3.0 12.4
Pharmaceutical products 1,362 2.2 1,254 2.4 8.7
Articles of apparel and clothing accessories 1,200 1.9 1,121 2.2 7.0
Cosmetics and essential oils 1,082 1.7 939 1.8 15.3
Other 23,209 37.4 20,669 3 9.9 12.3
Total 62,023 1 00.0 51,754 100.0 19.8China
Commodities2015 2014
Value (N$ m) Share Value (N$ m) Share Annual changeVessels 1,065 17.0 640 1 7.6 66.5
Boilers 1,051 16.7 638 1 7.5 64.9
Articles of iron or steel 942 15.0 249 6.9 277.7
Iron and steel 493 7.8 203 5.6 142.4
Aircraft, spacecraft and parts thereof 442 7.0 33 0.9 1,237.0
Vehicles 390 6.2 162 4.5 140.5
Furniture, bedding and mattresses 306 4.9 217 6.0 41.2
Electrical machinery and equipment 287 4.6 297 8.2 -3.4
Organic and inorganic chemicals 215 3.4 356 9.8 -39.7
Plastics and articles thereof 206 3.3 160 4.4 28.8
Other 883 14.1 678 1 8.7 30.2
Total 6,280 1 00.0 3,633 100.0 72.8Switzerland
Commodities2015 2014
Value (N$ m) Share Value (N$ m) Share Annual changeCopper ores 2,035 85.4 904 6 3.2 125.2
Mineral fuel and oils 140 5.9 210 1 4.7 -33.7
Boilers 79 3.3 55 3.8 44.8
Cement 70 2.9 209 1 4.6 -66.5
Electrical machinery and equipment 12 0.5 12 0.9 -1.9
Vehicles 12 0.5 2 0.1 636.1
Articles of iron or steel 10 0.4 2 0.1 461.0
Medical or surgical instruments and apparatus 6 0.3 6 0.4 5.3
Pharmaceutical products 4 0.2 3 0.2 42.4
Plastics and articles thereof 4 0.2 1 0.1 240.5
Other 11 0.5 27 1.9 -58.6
Total 2,383 1 00.0 1,431 100.0 66.5
25Annual Trade Statistics Bulletin 2015Namibia Statistics Agency
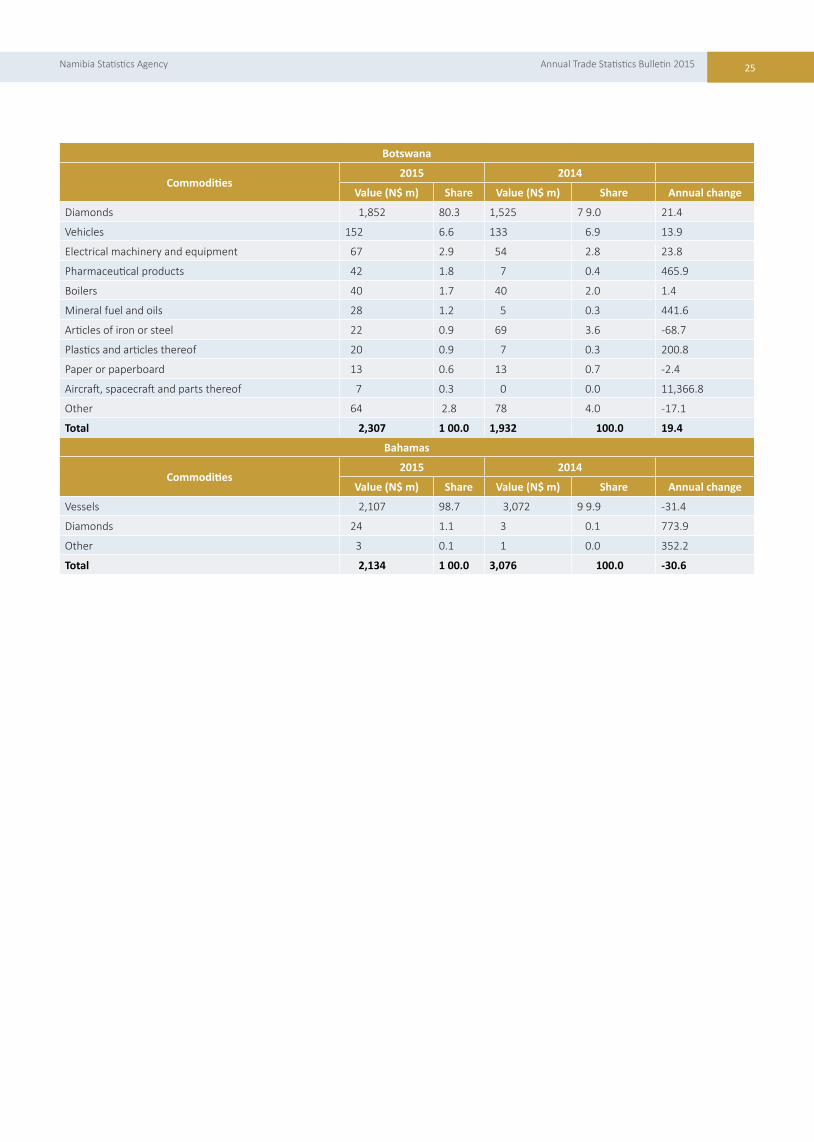
Botswana
Commodities2015 2014
Value (N$ m) Share Value (N$ m) Share Annual change
Diamonds 1,852 80.3 1,525 7 9.0 21.4
Vehicles 152 6.6 133 6.9 13.9
Electrical machinery and equipment 67 2.9 54 2.8 23.8
Pharmaceutical products 42 1.8 7 0.4 465.9
Boilers 40 1.7 40 2.0 1.4
Mineral fuel and oils 28 1.2 5 0.3 441.6
Articles of iron or steel 22 0.9 69 3.6 -68.7
Plastics and articles thereof 20 0.9 7 0.3 200.8
Paper or paperboard 13 0.6 13 0.7 -2.4
Aircraft, spacecraft and parts thereof 7 0.3 0 0.0 11,366.8
Other 64 2.8 78 4.0 -17.1
Total 2,307 1 00.0 1,932 100.0 19.4
Bahamas
Commodities2015 2014
Value (N$ m) Share Value (N$ m) Share Annual change
Vessels 2,107 98.7 3,072 9 9.9 -31.4
Diamonds 24 1.1 3 0.1 773.9
Other 3 0.1 1 0.0 352.2
Total 2,134 1 00.0 3,076 100.0 -30.6

26 Annual Trade Statistics Bulletin 2015Namibia Statistics Agency
7.10. Trade by office
Office
2015 2014Export Import Export Import
Value (N$ m)
ShareValue
(N$ m)Share
Value (N$ m)
ShareValue
(N$ m)Share
Ariamsvlei 3,257 5.6 18,681 1 9.1 3,378 5.2 17,379 1 8.9
Eros Airport 12,565 21.5 2,372 2.4 9,788 1 5.1 1,958 2.1
F. P. du Toit - - 3,242 3.3 0 0.0 2,922 3.2
Gobabis 0 0.0 3 0.0 - - 2 0.0
Grootfontein - - 4 0.0 0 0.0 0 0.0
Chief Hosea Kutako Intl Airport 5,010 8.6 2,133 2.2 1,783 2.8 2,191 2.4
Impalila Island 0 0.0 11 0.0 0 0.0 8 0.0
Katima Mulilo 227 0.4 17 0.0 260 0.4 1 0.0
Katwitwi 142 0.2 9 0.0 261 0.4 3 0.0
Keetmanshoop 0 0.0 79 0.1 0 0.0 88 0.1
Lüderitz 3,574 6.1 1,200 1.2 4,605 7.1 1,992 2.2
Klein Manase 1 0.0 3 0.0 - - 3 0.0
Mohembo 22 0.0 163 0.2 16 0.0 193 0.2
Ngoma 497 0.9 291 0.3 421 0.7 298 0.3
Noordoewer 2,733 4.7 8,859 9.1 2,460 3.8 8,308 9.0
Omahenene 78 0.1 0 0.0 151 0.2 0 0.0
Ondangwa 0 0.0 4 0.0 0 0.0 6 0.0
Oranjemund 52 0.1 953 1.0 55 0.1 912 1.0
Oshakati 10 0.0 320 0.3 8 0.0 399 0.4
Oshikango 2,319 4.0 500 0.5 4,111 6.4 151 0.2
Otjiwarongo - - 13 0.0 0 0.0 8 0.0
Ruacana 0 0.0 - - 7 0.0 0 0.0
Rundu 13 0.0 3 0.0 31 0.0 2 0.0
Swakopmund 0 0.0 1 0.0 0 0.0 5 0.0
Trans Kalahari 3,847 6.6 19,429 1 9.9 3,669 5.7 17,859 1 9.4
Tsumeb 4 0.0 41 0.0 4 0.0 2,443 2.7
International Airport-Windhoek 1 0.0 39 0.0 0 0.0 8 0.0
Walvis Bay 18,452 3 1.6 33,533 3 4.4 26,302 4 0.7 31,189 3 3.9
Wenela 2,922 5.0 3,957 4.1 1,964 3.0 589 0.6
Windhoek Regional Warehouse Office 2,634 4.5 534 0.5 5,399 8.3 2,153 2.3
Windhoek Regional Office 1 0.0 474 0.5 2 0.0 323 0.4
Windhoek Regional Excise Office - - 690 0.7 - - 695 0.8
Total 58,362 100.0 97,558 100.0 64,677 100.0 92,090 100.0

27Annual Trade Statistics Bulletin 2015Namibia Statistics Agency

28 Annual Trade Statistics Bulletin 2015Namibia Statistics Agency
Namibia Statistics AgencyP.O. Box 2133, FGI House, Post Street Mall,
Windhoek, Namibia
Tel: +264 61 431 3200
Fax: +264 61 431 3253 | +264 61 431 3240
Email: [email protected]
Scan to find more statistics information about Namibia
Like us on Facebook:facebook.com/NamibiaStatisticsAgency
Follow us on Twitter:@namstatsagency
Subscribe to us on YouTube:youtube.com/namstatsagency