nagios at funet - terena.org · nagios at funet noc noc follows the (combined) ... –bgp route...
TRANSCRIPT

Nagios at Funet
Teemu Kiviniemi, CSC/Funet
6th June 2012
6th TF-NOC meeting
Dublin, Ireland

Introduction
Funet uses Nagios extensively for
monitoring.
– network
– servers
– services
Two Nagios monitoring servers
– Over 900 monitored hosts
– Over 10000 monitored services
2

Nagios at Funet NOC
NOC follows the (combined) hostgroup
and servicegroup summaries
– Traditional and iPad versions are available.
NOC receives SMS and/or e-mail alerts
about critical services.
NOC opens a ticket about each problem.
Problems are acknowledged in Nagios
with the ticket number.
Nagios scheduled downtime is set before
maintenance. 3

NOC monitoring levels
We have four different monitoring urgency
levels for our services.
Monitoring levels have different reaction
time requirements:
– 30 minutes, 4 hours, NBD, best effort
Also the operative processes and the
documentation available to NOC must be
better in services at higher monitoring
levels.
4

NOC monitoring levels (continued)
Monitoring levels have different notification
options.
Services at the highest monitoring level
trigger SMS alerts to NOC immediately.
No e-mail or SMS alerts are sent about
best effort services.
Nagios host and service escalations are
defined to escalate longer service
disruptions to managers.
5
Nagios configuration management
Nagios configuration is split to several
directories and files.
Some configuration is identical between
the two monitoring servers.
Configuration files are in Subversion VCS.
Service administrators configure service
checks mostly on their own, following the
agreed guidelines.
6

Automatically generated
configuration
Large parts of Nagios configuration are
generated automatically.
– Linux servers, routers, DWDM, switches, DNS
zones.
Configuration is generated with Perl
scripts, and Nagios is updated
automatically.
Linux server administrators can customize
some aspects of the generated
configuration. 7

Custom check plugins
We have written a lot of custom check
plugins for our monitoring needs.
A total of 85 custom Nagios check plugins
are enabled in our current configuration.
Examples:
– BGP route status and other router/switch
SNMP checks
– IPv6 transition mechanisms
– DNS zone SOA reachability
– RRD statistics 8

Reporting
We plot Nagios performance data using
pnp4nagios.
For all other reporting we use Nagios-
Surfer – a tool developed at Funet.
9

How Nagios-Surfer works
10

Nagios configuration overview
reports
Generated by Nagios-Surfer for all hosts,
services, contacts, and groups.
Reports contain information about
– Service checks - What is monitored and how?
– Notifications - Who received notifications and
when?
– Configuration differences – What differences
are there between the monitoring configuration
of hosts or services in the same group.
11

Nagios configuration overview
reports
12

Nagios availability reports
Nagios-Surfer generates availability
reports of all hosts, services, contacts and
groups.
Availability reports are pregenerated.
– Unlike Nagios avail.cgi which reads through
the event log each time a report is requested.
– We get 1.5GB of event log per month.
Availability numbers are reported per-
month.
13

Nagios availability reports
14

Nagios event log reports
Nagios-Surfer generates monthly event log
summaries of all hosts and services.
– Redundant information, such as duplicate and
subsequent OK lines are removed.
Each break contains a link to detailed
information about the break.
Event logs can be accessed easily through
the availability reports.
15

Nagios event log reports
16

Nagios and quality assurance
We have internal quality assurance
processes that oversee that services meet
the set reliability requirements.
Service administrators investigate new
service breaks and save the information to
Nagios-Surfer.
– A quality assurance process can use the data
to concentrate on the most relevant issues.
17

Archiving information about breaks
Information about the causes of all breaks
is archived with Nagios-Surfer.
Investigating old issues becomes easier,
as the breaks of possible service
dependencies are visible.
Makes it easier to notice patterns.
18

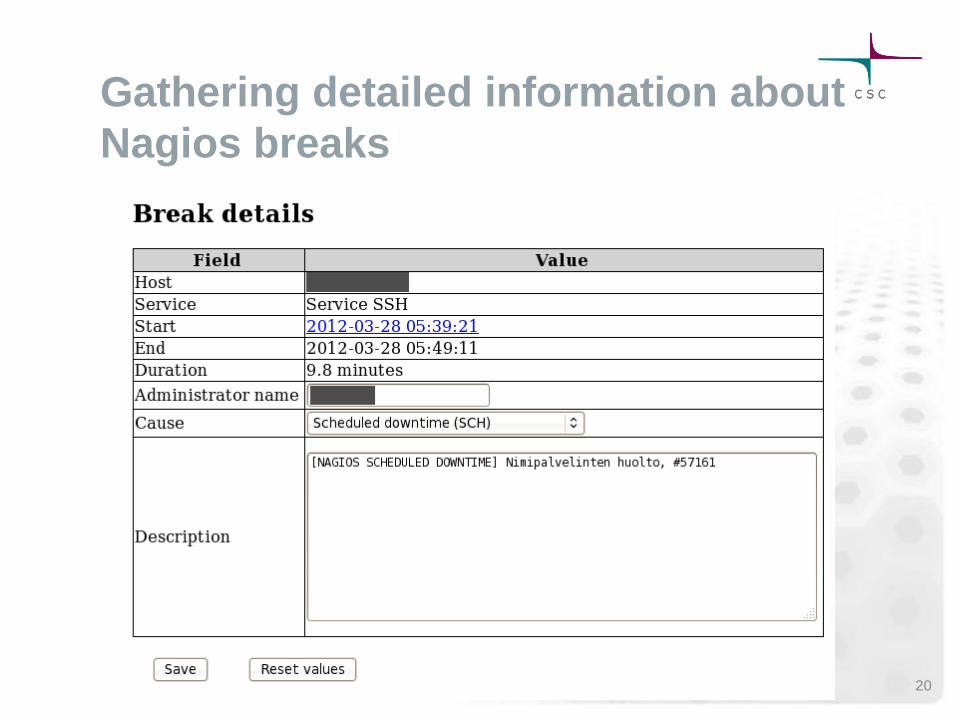
Gathering detailed information about
Nagios breaks
Nagios-Surfer sends break clarification
requests to administrators by e-mail.
Administrators can categorize and
describe breaks. The information is saved
to Nagios-Surfer database for later use.
If a break is categorized as scheduled
downtime, the change will be reflected in
the availability reports.
– If a break happens during Nagios scheduled
downtime, the break is automatically
categorized as scheduled downtime. 19
Gathering detailed information about
Nagios breaks
20

Providing availability reports to end-
user organizations
An organization connected to Funet will be
able to see the availability history of all
used services at a glance.
– IP connections
– Light paths
– … and more?
Availability data is provided by Nagios-
Surfer.
Work in progress
21

Some other useful tools
A tool for scheduling Nagios downtime
according to predefined templates.
– Server X is rebooted – affects also services Y
and Z.
– Scheduled downtime is set for all affected
services.
A tool which combines several Nagios
service groups into one large service
group.
22

Performance
Our primary monitoring server is a quad-
core Xeon with 12GB of RAM and Ubuntu
10.04 LTS.
Nagios keeps up with the monitoring
schedule.
Occasionally we have seen bad
interactivity on the server, caused by
massive disk I/O.
– Especially when writing the state retention file
– Nagios status files and object cache are now
stored on tmpfs. 23
Things to improve
Our high resolution end-user site ping
monitoring is done outside Nagios.
Nagios polls the status of end-user sites
periodically, from the extenal monitoring
system.
New problems are seen by Nagios only
after the next service check.
– It would be better to push state changes to
Nagios immediately.
NOC would not have to look at two different
monitoring screens. 24

Things to improve (continued)
We have still some legacy monitoring that
is done with custom-made scripts.
We would like to integrate all our
monitoring to Nagios.
– We could use the same reporting for all our
monitored services.
– We could have a single NOC monitoring
screen.
25

Conclusions
Nagios suits us well.
Nagios is easy to customize.
– Has allowed us to modify and build on the
available features.
On the other hand, switching away from Nagios
would be a lot of work now.
26