nagendra k. singh nrc on plant biotechnology indian agricultural research institute, new...
TRANSCRIPT

Nagendra K. Singh
NRC on Plant BiotechnologyIndian Agricultural Research Institute, New Delhi-110012
Pigeonpea Genomics Initiative
Pigeonpea Genomics Initiative

Status of Plant Genome Sequencing
•Sequencing of 16 Plants in Progress(10 completed + 6 about to be finished)Arabidopsis, Rice, Poplar, Medicago, Sorghum, Papaya, Cassava, Cucumber, Tomato, Potato, Maize, Soybean, Citrus, Grape, Banana, Wheat
•Arabidopsis and Rice with high quality BAC by BAC sequence data
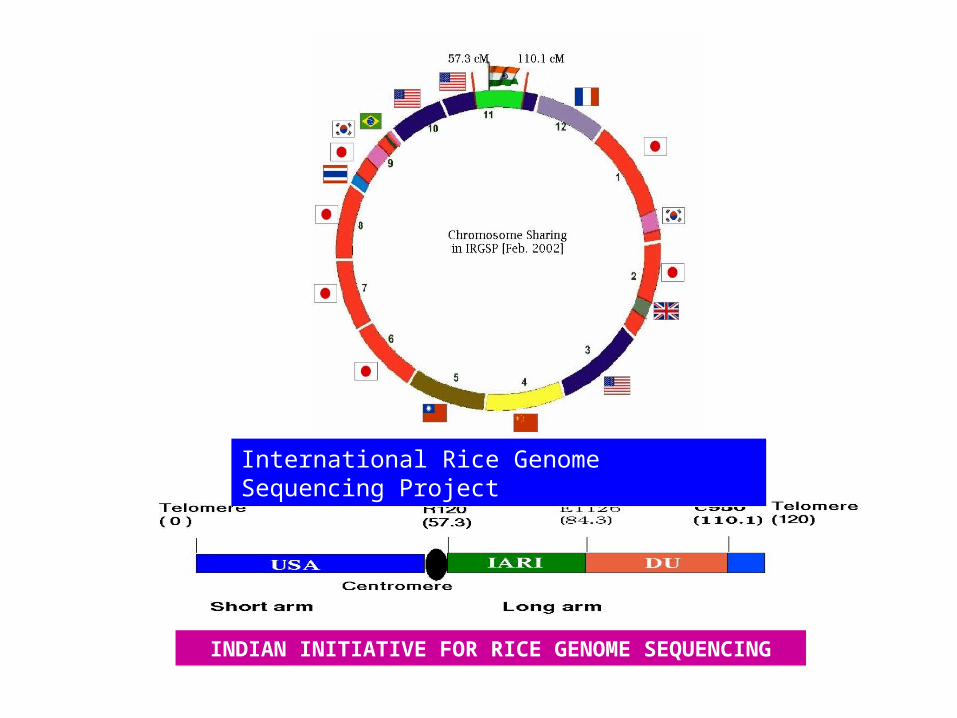
INDIAN INITIATIVE FOR RICE GENOME SEQUENCINGINDIAN INITIATIVE FOR RICE GENOME SEQUENCING
International Rice Genome Sequencing ProjectInternational Rice Genome Sequencing Project


INTERNATIONAL TOMATO GENOME SEQENCING CONSORTIUM
Based on Song-Bin Chang’s Ph. D. Thesis 2004

Indo-US AKI Pigeonpea Genomics Initiative
from Orphan Legume to Draft Genome Sequence

Productivity (hg/ha) World-Food grains
FAOSTAT, 2010
Year
Prod
uctiv
ity (h
g/ha
)
Cereals
Pulses

A major source of protein to about 20% of the world population (Thu et al., 2003).
An abundant source of minerals and vitamins (Saxena et al., 2002).
Most versatile food legume with diversified uses such as food, feed, fodder and fuel.
It is hardy, widely adaptable crop with better tolerance to drought and high temperature.
Plays an important role in sustaining soil productivity by fixing atmospheric nitrogen.
Pigeonpea
Pigeonpea (Cajanus cajan (L.) Millsp.) belongs to
family Fabaceae with chromosome no. 2n=22 and genome
size of 853 Mbp

Area, Production and Productivity
Year Area (Mha)
Production (MT)
Productivity (Kg/ha)
World 2008 4.90 4.22 861
India 2008 3.72 3.07 825
o India produces about 75% of the global output of pigeonpea.
o Very low average productivity (800 kg/ha) as compared to it’s potential (2000 kg/ha) (Ali and Kumar, 2005).
(FAOSTAT 2010)

Constraints to High Productivity
Growing traditional landraces on large area
Non-availability of quality seeds of improved varieties
Inferior plant type with low harvest index
Long crop duration (5-9 months)
Wilt, SMD, Water logging, Pod borer
Poor agronomic practices

First meeting of Pigeonpea Consortium on 10th Nov 2006 at
NRCPB, New Delhi Objectives: 1.100,000 ESTs and genic-SSR /SNP markers
2. Genomic SSR markers
3. Mutant lines and mapping populations as resource for gene discovery
4.High density molecular linkage map as a reference map
5.Markers and genes for important agronomic traits
6. Pigeonpea genome informatics platform
7. Sequencing gene-rich BAC clones of pigeonpea
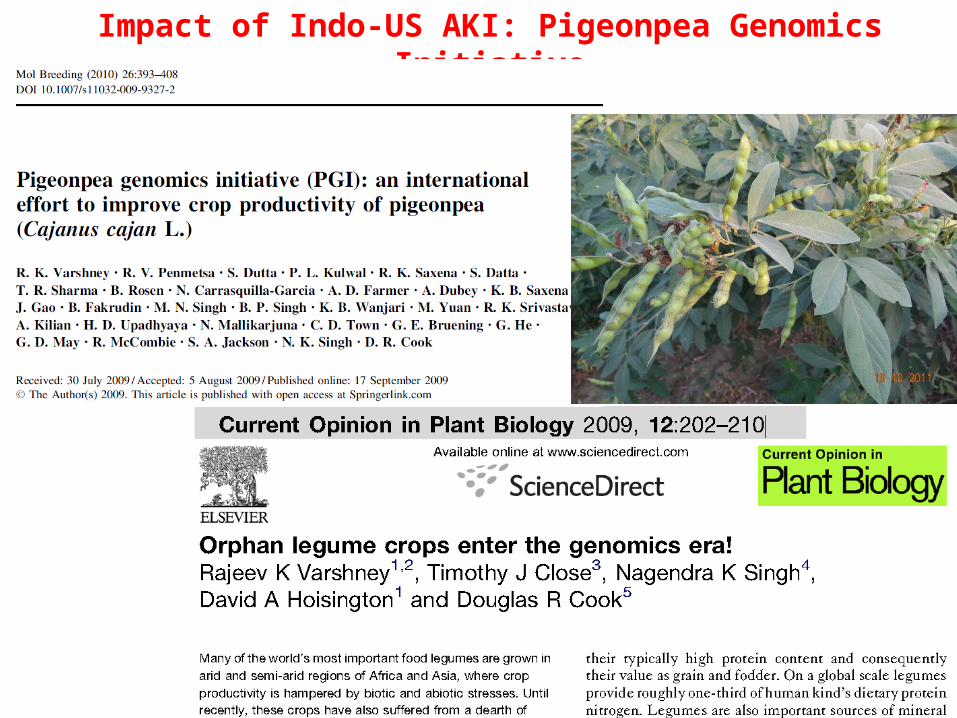
Impact of Indo-US AKI: Pigeonpea Genomics Initiative

Impact of Indo-US AKI: Pigeonpea Genomics Initiative

Sequencing of Pigeonpea Genome

1st Draft of Pigeonpea Genome Sequence
Submitted to NCBI GenBank, July 2011

Pigeonpea Genome- Repeat Elements

Pigeonpea Genome- Gene Content

Pigeonpea Genome- Comparison with Soybean
152 homologs of genes for abiotic stress tolerance •56 genes for heat shock proteins (HSP), •32 genes for glutathione-S-transferase (GST), •28 genes for trehalose-6-phosphate synthase (TPS), •8 genes for glutamine synthase (GS), •7 genes for water channel protein aquaporins•several transcription factors e.g. DREB, NAC and MYB genes

Circular Map of Synteny between 11 Pigeonpea 20 Soybean Chromosomes Based on 512 Single Copy Genes
Pigeonpea Genome- Comparison with Soybean

Pigeonpea Genome-miRNA

Pigeonpea Genome- Improved Assembly

Pigeonpea Genome- Improved Assembly

Pigeonpea Genome- Improved Assembly

Pigeonpea Genome-
Development of Genic-SSR and SNP markers by
mRNA Sequencing

M 1 2 3 4 5 6 7 8 9 10 11 12 13 14 15 16 17 18 19 20 21 22 23 24 25 26 27 28 29 30 M
50bp
100bp
150bp
Agarose gel (4.0 %) showing allelic variation among 30 genotypes of
pigeonpea and related wild species with genic-SSR marker ASSR-277

Asha
GTR 9HDMO4-1
H2004-1JA 4PCMF 39-1
PCMF 40
PCMF 43-7GT288A
PS 971PS 956
Pusa 9Kudarat
ICPA 2089A
ICPR 2438
UPAS 120
TTB 7Pusa Dwarf
BaharMaruti
Pusa 992
GTR 11
R. aurea
C. platycarpus(1)
C. platycarpus(2)
C. cajanifolius
C. lineatusC. scriceaR. bracteataC. albicans
Ib
Ia
II
IIa2
Ia1
IIb
IIa
Similarity coefficient
Dendrogram showing phylogenetic relationship of 30 genotypes of Cajanus cajan and related wild species based on 20 genic-SSR markers

Pigeonpea Genome- High density linkage map based on 366 genic-SNP and 24 genic-
SSR markers
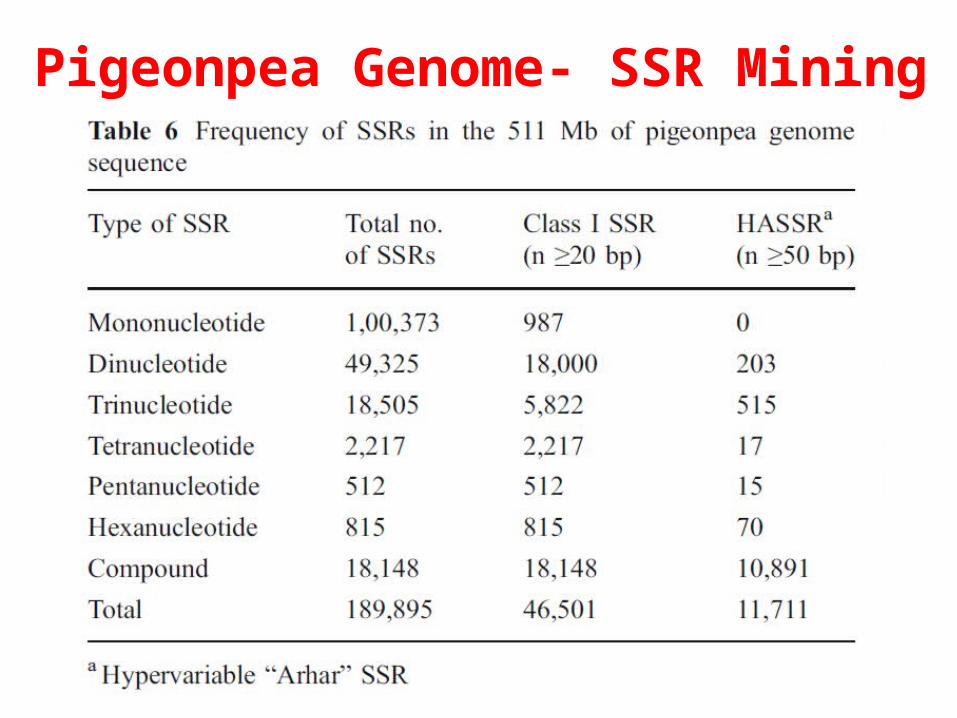
Pigeonpea Genome- SSR Mining

M 1 2 3 4 5 6 7 8 1 2 3 4 5 6 7 8 1 2 3 4 5 6 7 8
200
100
300
HASSR-283 HASSR-284 HASSR-285
M 1 2 3 4 5 6 7 8 1 2 3 4 5 6 7 8 1 2 3 4 5 6 7 8
200
100
300 HASSR-127 HASSR-128HASSR-129
Pigeonpea Genome- HASSR Markers

Ideotype: Set of features delineating the shape, size, canopy and external structure of the plant•Plant height•Number of primary and secondary branches•Number and length of internodes•Size, shape and position of leaves and reproductive organs
Options for Enhancing Pigeonpea Productivity1.Hybrids2.Ideotype
Application of Genic SSR/SNP Markers in QTL
Mapping

1.Development of molecular linkage map of pigeonpea
2.Mapping of genes/QTLs for traits involved in plant ideotype and maturity
Application of Genic SSR/SNP Markers in QTL
Mapping
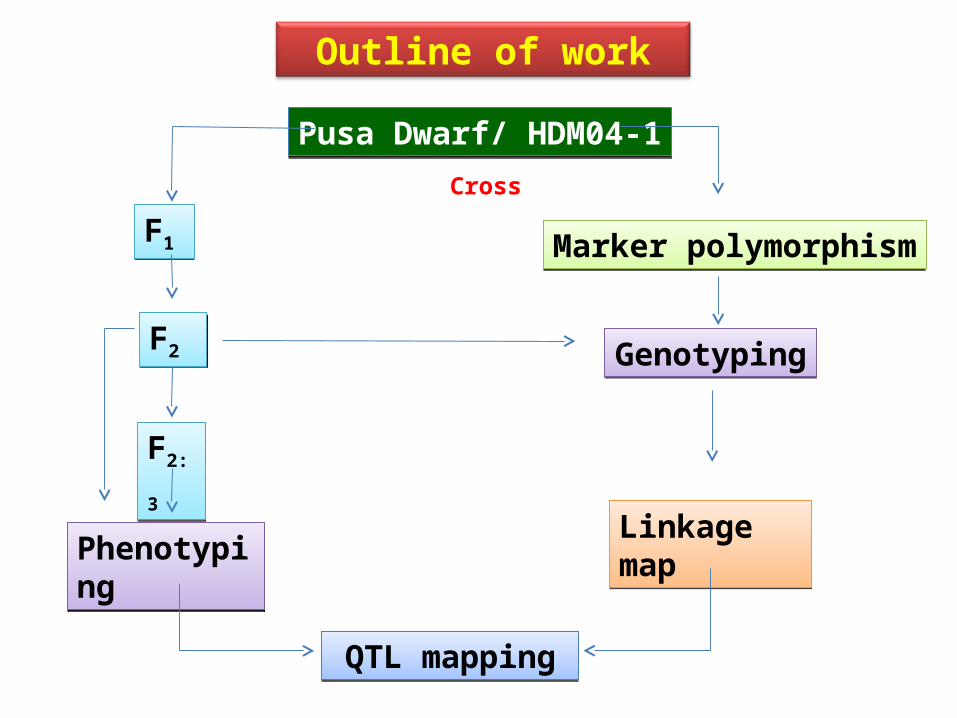
Outline of work
Pusa Dwarf/ HDM04-1Pusa Dwarf/ HDM04-1
F1F1
F2F2
F2:3F2:3
Marker polymorphismMarker polymorphism
GenotypingGenotyping
Linkage mapLinkage mapPhenotypingPhenotyping
QTL mappingQTL mapping
Cross

Mapping Population: ♀ Pusa Dwarf X ♂ HDM04-1Trait Pusa Dwarf HDM04-1
Plant height (cm) 88 118
No. of primary branches/plant
20 5
No. of pods/plant 120 24
Days to Flowering 106 65
Days to Maturity 158 116
Growth habit Determinate Indeterminate
Plant Material
Pusa Dwarf HDM04-1

A. Genic-SSR
• Total 927 genic SSR markers, 772 developed from 454 TSA
contigs and 155 from Sanger ESTs under Indo-US AKI
project were used.
B. Genomic-SSR
• 45 genomic SSR markers from literature ( Odeny et al.,
2007, 2009)
• Additional 40 SSR markers were designed from public BAC
end sequence database at NCBI BatchPrimer 3 software
(You et al., 2008)
Markers

C. Intron length Polymorphism (ILP) Markers
A total of 60 ILP primers were designed using Medicago genome
as subject species genome by ConservedPrimers 2.0 software .
(http://rye.pw.usda.gov/ConservedPrimers/index.html)

D. Single Nucleotide Polymorphism Assay:
SNPs were identified by aligning 15,511 common large TSA contigs
between the two varieties.
1536-plex and 768-plex Illumina GoldenGate assays were designed
and latter was used for genotyping of F2 population
Two pools of RNA from varieties namely Asha and UPAS120 were
sequenced by 454-FLX sequencing and TSA contigs were used for in
silico SNP identification (Indo- US AKI project).

GoldenGate Genotyping OPA

Segregation analysis: All markers were tested for goodness of fit by chi-square test.
Linkage analysis:
Linkage analysis of segregating markers was done by Mapdisto software
(http://mapdisto.free.fr/MapDisto/) at LOD = 3
QTL analysis: Statistical analysis of Phenotypic data was performed SPSS
software version 10.0
QTL analysis was done by QTL Network software version 2.1 (Yang
et al. 2008)

Marker type No. tested
No. amplified
Polymorphic No (%)
Marker Source/Reference
Genic-SSR(EST- 454 seq.)
772 583 (75.5%) 28 (4.8%) Indo-US AKI,NRCPB
Genic-SSR(EST-Sanger seq.)
155 31 (20%) 0 Indo-US AKI,NRCPB
GENOMIC-SSR (Genomic library)
45 32 (71.1%) 0 Odeny et al., (2007, 2009)
GENOMIC-SSR(BAC end sequences)
40 27(67.7%) 0 NCBI GSS database
ILP(454 TSA contigs)
60 51(85%) 0 NPTC, NRCPB
TOTAL 1072 724 (67.5%) 28
Markers Used for Parental Polymorphism Survey

M A B A B A B A B A B A B A B A B A B A B A B A B A B A B A B A B A B A B A B A B A B A B A B A B M
Parental polymorphism survey with ASSR markers (1-24), 21-ASSR1486 (polymorphic) L-100bp DNA ladder, A-Pusa Dwarf, B-HDM04-1
100
1 2 3 4 5 6 7 8 9 10 11 12 13 14 15 16 17 18 19 20 21 22 23 24
200300400500
Polymorphism survey with genic-SSR markers

Genotyping of F2 with SSR Markers
L 1 2 3 4 5 6 7 8 9 10 11 12 13 14 15 16 17 18 19 20 21 22 P 1 P2
Genotyping of F2 population with ASSR8 in 4% metaphor agarose gel
L- 100bp DNA ladder, 1-22 - F2 genotypes, P1- Pusa Dwarf, P2- HDM04-1
500300200100

ASSR 66 77 95 148 205 206 247 277 281 286 300 304 317 363 390 L 1 2 1 2 1 2 1 2 1 2 1 2 1 2 L 1 2 1 2 1 2 1 2 1 2 1 2 1 2 1 2
Parental polymorphism survey for ASSR markers in 8% PAGEL-50bp DNA ladder, 1- Pusa Dwarf, 2-HDM04-1
Parental Polymorphism survey on PAGE
150bp
200bp
250bp
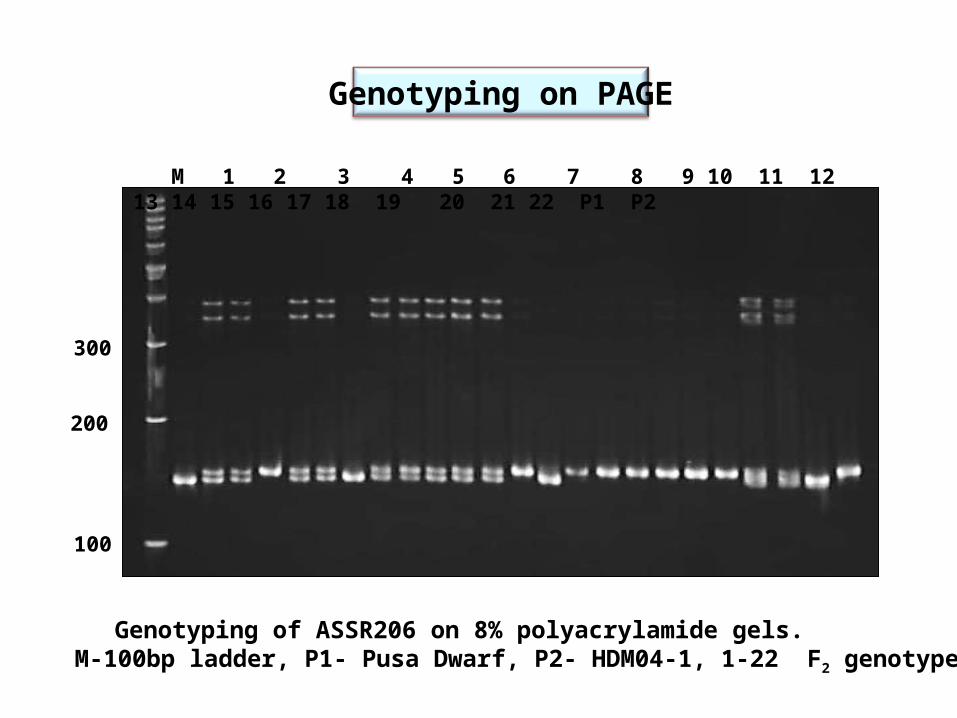
Genotyping on PAGE
Genotyping of ASSR206 on 8% polyacrylamide gels. M-100bp ladder, P1- Pusa Dwarf, P2- HDM04-1, 1-22 F2 genotypes
M 1 2 3 4 5 6 7 8 9 10 11 12 13 14 15 16 17 18 19 20 21 22 P1 P2
100
200
300

F2 Progeny

Homogeneous F3 Families

Segregating F3 Families

F3 Recombinants

Phenotyping of F2 and F2:3 (20 plants/lines)
1. Plant height
2. Number of primary branches per plant
3. Number of pods per plant
4. Days to flowering
5. Days to maturity
6. Number of secondary branches
7. Pod bearing length
8. No. of seeds per pod
9. Growth habit (determinate/indetrminate)

cm cm
Frequency Distribution of Plant Height and No. of Primary Branches
Frequency Distribution of Plant Height and No. of Primary Branches
P1 P2 P1
P2
P2
P2
P1
P1

Frequency Distribution for No. of Pods
Pod numbers Pod numbers
P1
P2
P2
P1

Frequency Distribution for Days to Flowering and Days to MaturityFrequency Distribution for Days to Flowering and Days to Maturity
P2 P1P2 P1
P1
P2
P1 P2

Trait Pusa
Dwarf
HDM0
4-1
F2 F3
Range Mean SD CV Range Mean SD CV
Plant height 85 120 49-190 130.4 31.2 23.9 59-160 112.12 22.67 20.22
No. of pri. branches 18 7 2-29 12.6 5.65 44.86 4-16.6 9.88 1.95 19.75
No. of pods 180 24 6-279 74.3 57.7 77.7 6.6-170.9 58.4 23.9 41.0
Days to flowering 90 65 51-99 74.75 10.50 14.05 59-116 90.95 11.17 12.28
Days to maturity 150 120 85-158 120.13 19.01 15.82 110.43-208 140.09 15.31 10.93
Descriptive Statistics of Five Traits for the Parents and Mapping Populations of Pusa Dwarf and HDM04-1

QTL Map for All Traits

QTL Map for All Traits

QTLs with additive and dominance epistatic effects for number of primary branches per plant in F2:3 population from Pusa Dwarf/HDM04-1
▬ Interaction between QTLs with epistatic and main effects.
● QTLs with only additive effect
▀ QTLs with only dominant effect
▀ QTLs with no dominance effect

Summary and Conclusions
Draft of 511 Mb of pigeonpea genome sequence assembled, 47,004 genes, 437 HASSR markers
Deep coverage TSA assembly of 43,324 genes, 550 genic-SSR and 2,304 genic-SNP GoldenGate assays
Intra-species reference map of 366 genic-SNP and SSR markers
1,363 markers screened to find 135 polymorphic (9.9%) markersbetween Pusa Dwarf and HDM04-1 (28 SSR and 107 SNP)
Linkage map of 136 loci, 1056.82 cM, average interval 7.77 cM.
2 QTLs for plant height, qPH3, qPH5 ( 28.2, 28.1% PEV) 3 QTLs for primary branches, qPB3, qPB5, qPB9 (23.4, 11.1, 2.6% PEV) 2 QTLs for number of pods, qPD3, qPD5, (16.4, 18.7% PEV) 2 QTLs for days to flowering, qFL3, qFL5 (52.3, 8.8% PEV) 3 QTLs for days to maturity, qMT3.1, qMT3.2, qMT5 (23.4, 4.4,15.6%
PEV) Significant epistasis of qPB3 with qPB5 and qPB9 (3.5% PEV).
Co-located of QTLs in two genomic regions on LG3 and LG5 with pleiotropic effect
Useful for MAS of semi-dwarf short duration pigeonpea varieties

Acknowledgements Acknowledgements
• ICAR for funding support under Indo-US AKI and NPTC Projects
• Doug Cook, UC Davis, Chris Town, JCVI and Rajeev Varshney, ICRISAT for quality files of BAC end sequences

Thank You