nagarjuna agrichem ltd detail reportbreport.myiris.com/firstcall/nagagric_20100714.pdf · the asset...
TRANSCRIPT

1
Stock Data
Sector Agrochemicals
Face Value(Rs) 10.00
52 wk. High/Low (Rs.) 385.90/113.70
Volume (2 wk. Avg.) 23000
BSE Code 524709
Market Cap(Rs in Mn) 5036.9
Financials (Rs in Mn) FY10A FY11E FY12E
Net Sales 6503 6828 7511
EBIDTA 1288 1391 1530
PAT 597 646 714
EPS 40.1 43.4 47.9
P/E 8.43 7.79 7.05
NAGARJUNA AGRICHEM LTD BUY F
I
R
S
T
C
A
L
L
R
E
S
E
A
R
C
H
SYNOPSIS
• NACL was established in 1994 for producing Monocrotophos Technical. NACL has since grown substantially and now manufactures a comprehensive range of pesticide technicals, formulations and custom manufactured fine chemicals.
• NACL has one of the largest Dealer Network spread across India, with marketing and sales offices in addition to an extensive Warehousing & Logistics Infrastructure to handle operations in 20 Indian States.
• The company operates at one of the most modern and comprehensive Technical Agrochemical manufacturing plants, situated in Srikakulam district of Andhra Pradesh, India.
• The revenue of the company for the year ended on March 31st increased 7.43% YoY while Profit increased 21.3% YoY.
• The topline & bottomline of the company are expected to grow at a CAGR of 7% & 13% over 2009A to 2012E respectively.
1 Year Comparative Graph
NAGARJUNA AGRICHE BSE SENSEX
V.S.R. Sastry
Equity Research Desk
Dr. V.V.L.N. Sastry Ph.D.
Chief Research Officer
C.M.P: Target Price: Rs.338.05 Rs.390.00
Share Holding Pattern
Date: 14 July 2010

2
Peer Group Comparison
Name of the company CMP(Rs.)
Market Cap.(Rs.Mn.) EPS(Rs.) P/E(x) P/Bv(x) Dividend (%)
Nagarjuna Agrichem
Ltd 338.05 5036.9 40.11 8.43 2.29 30
United Phosphorous 177.00 77802.8 4.12 42.9 3.89 75
Excel Crop Care 238.40 2623.7 34.01 7.01 1.55 125
Insecticides India 227.00 2879.0 22.25 10.20 2.23 20
Investment Highlights
FY10 Performance
Net profit of the company has increased at 21.3% yoy Rs.597.60mn from
Rs.492.60mn of same period of last year. Total revenue for the year stood at
Rs.6503.10 mn from Rs.6053.60 which is 7.43% increased than that of a year
ago. EPS for the year stood at Rs.40.11 per equity share of Rs.10.00 each.
Operating profit of the company stood at Rs.1288.60mn. OPM for the year stood at
20%. Expenditure of the company increased 8.3% YoY to Rs.5301.20 mn. Interest
expenses for the year stood at Rs.170.9mn.
3
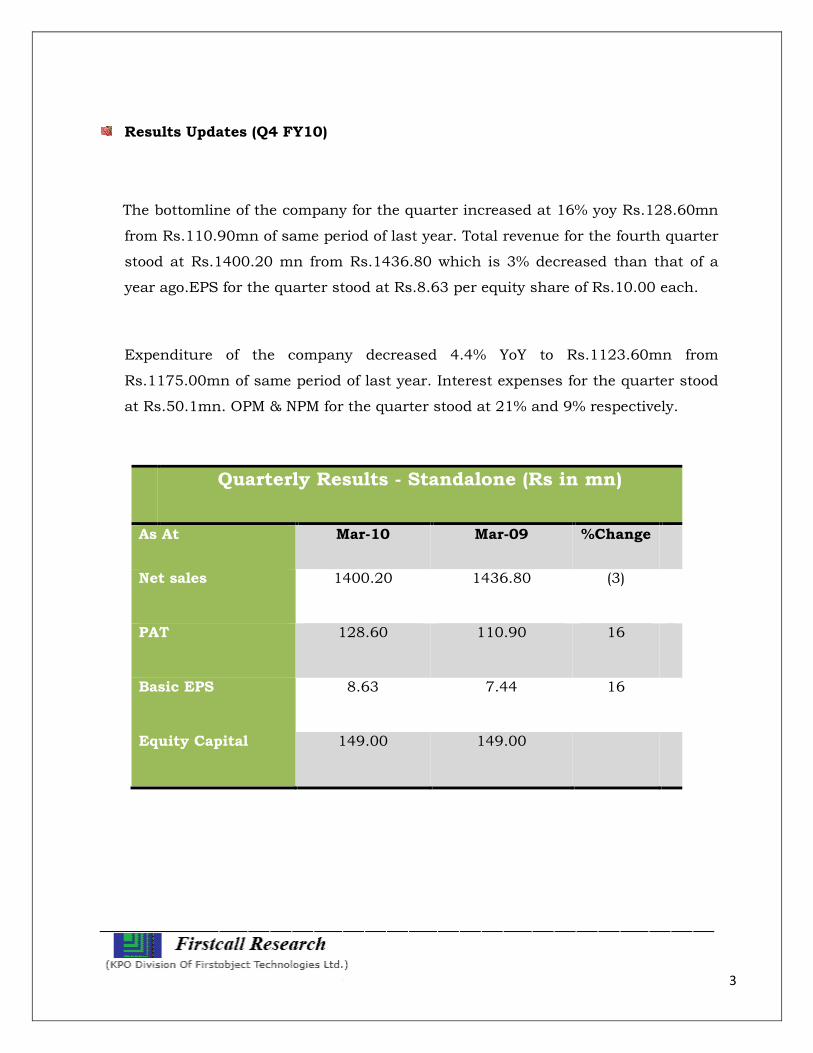
Results Updates (Q4 FY10)
The bottomline of the company for the quarter increased at 16% yoy Rs.128.60mn
from Rs.110.90mn of same period of last year. Total revenue for the fourth quarter
stood at Rs.1400.20 mn from Rs.1436.80 which is 3% decreased than that of a
year ago.EPS for the quarter stood at Rs.8.63 per equity share of Rs.10.00 each.
Expenditure of the company decreased 4.4% YoY to Rs.1123.60mn from
Rs.1175.00mn of same period of last year. Interest expenses for the quarter stood
at Rs.50.1mn. OPM & NPM for the quarter stood at 21% and 9% respectively.
Quarterly Results - Standalone (Rs in mn)
As At Mar-10 Mar-09 %Change
Net sales 1400.20 1436.80 (3)
PAT 128.60 110.90 16
Basic EPS 8.63 7.44 16
Equity Capital 149.00 149.00

4

5
Board recommends Final Dividend
The Board of Directors of the Company have recommended a Final Dividend of
30% for the Financial Year 2009-10.
The Board of Directors has also decided to raise further equity by way of QIP /
Public Issue / Rights Issue / Private Placement or any contribution thereof or
conversion of debt into equity not exceeding of Rs. 100 Crores by way of
conducting Postal Ballot pursuant to Sec. 192 A(2) of the Companies Act, 1956.
Company Profile
Nagarjuna Group is truly an enterprise on the move. The foundation of the Group was
laid over two decades ago by technocrat entrepreneur Shri. KVK Raju. He started with
an initial investment of US $ 1.2 million and sowed the seeds of what is now one of the
fastest growing industrial houses in India.

6
In addition to a growing presence in Agribusiness, the Group has made significant
investments in core sectors like Refining, Power generation and Life Sciences. Today,
the asset base of Nagarjuna Group is over US $ 2.5 billion.
The Agribusiness Division of Nagarjuna is committed to enhancing the availability of
quality food supply for the future by developing products and services that contribute
to increasing farm productivity.
The Agribusiness Division of the Nagarjuna Group consists of the following business
units:-
• Plant Nutrition
• Crop Protection
NACL was established in 1994 for producing Monocrotophos Technical. NACL has
since grown substantially and now manufactures a comprehensive range of pesticide
technical's, formulations and custom manufactured fine chemicals. All the
manufactured products conform to international quality standards and specifications.
The company have adequate capacities, state-of-the-art infrastructure, skilled
experienced manpower and technical absorption capabilities. In fact, Custom
Synthesis and manufacturing are one of NACL's inherent capabilities. The production
lines are designed for a quick change over. The company also have a Custom
Synthesis and Toll Manufacturing Division, which caters to the requirements of
reputed overseas customers.
NACL has one of the largest Dealer Network spread across India, with marketing and
sales offices in addition to an extensive Warehousing & Logistics Infrastructure to
handle operations in 20 Indian States. NACL has tie-ups with large Indian
Agrochemical Majors and MNC’s for the domestic and export markets. The Current
Gross Annual Sales of the Organization is apprx. US $ 145 million.
The company operate one of the most modern and comprehensive Technical
7
Agrochemical manufacturing plants, situated in Srikakulam district of Andhra
Pradesh, India.
NACL formulates its formulations in a modern Formulation Plant situated in the East
Godavari District of Andhra Pradesh. This location is situated in the scenic rice
growing area on India's East Coast. This Unit is one of the few to have in a single
location, integrated multi-line facilities capable of producing a variety of pesticide
formulations such as liquids, wettable powders and granules simultaneously. This
unit has the formulation technology to produce dry flowables and water based
emulsions.
The category wise annual capacities are:
• Liquid : 25,000 KL
• Granules : 15,000 MT
• Wettable Powder : 3,000 MT
NACL is setting up a New Green Field Project for Manufacturing Technical with an
initial investment of 30 Million US Dollars. The Project will be on stream by 2010.
NACL is also setting up a New Corporate R&D Centre in Hyderabad. In this Corporate
R&D Centre, in addition to in-house R&D projects, Contract Research will also be
undertaken.
NACL has an impressive range of branded formulations in the categories of
Insecticides, Fungicides and Herbicides. In addition to catering to the entire Indian
subcontinent, the company export both Technicals and Formulation grade pesticides
to some countries in Europe, Asia including the Middle East, Japan, USA, Australia
and Africa.
Products

8
List of Technicals
TECHNICALS
Insecticides: . Purity
PROFENOFOS 91% / 95%
ACEPHATE 98%
DICHLOROVOS 98%
MONOCROTOPHOS 74%
TECHNICALS
Fungicides: Purity
PROPICONAZOLE 92%
MYCLOBUTANIL 97%
Herbicides: Purity
PRETILACHLOR 96%
List of Formulation Products
FORMULATIONS
FUNGICIDE . TRADE NAME Carbendazim 5% WP ZEN
Carbendazim 12% + Mancozeb 63% WP
NAGARJUNA COMBIPLUS
Cymoxanil 8% + Mancozeb 64% WP
FONT
Hexaconazole 5% EC NAGARJUNA MASS
Hexaconazole 5% SC NAGARJUNA MASS PLUS
Mancozeb 75% WP ZEB
Myclobutanil 10 % WP INDEX
Propiconazole 25 % EC RESULT
Tricyclazole 75% WP SIVIC
Thifluzamide 24% SC VISTA
Validamycin 3 % L RHIZOCIN
HERBICIDE . TRADE NAME
Atrazine 50% WP SURYA
Ammonium Salt of Glyphosate 71% SG
GLOBUS SG
Bensulfuron methyl 0.6% +Pretilachlor 6%
ERAZE STRONG
Clodinafop Propargyl 15 % WP
POINT
Glyphosate 41% SL GLOBUS SL
Metsulfuron Methyl 20% WP
DOT
Pretilachlor 50% EC ERAZE
Pretilachlor 30.7% w/w or 30% w/v
ERAZE-N

9
Paraquat Dichloride 24% SL
RHINO
INSECTICIDE . TRADE NAME
Acephate 75% SP PACE
Acetamiprid 20% SP NAGARJUNA ENNOVA
Buprofezin 25% SC BENJ
Carbofuran 3% CG FURY
Cartap Hydrochloride 4% G
SANVEX-4G
Cartap Hydro Chloride 50% SP
SANVEX SP
Chlorpyrifos 20% EC FORCE
Clothianidin 50 % WDG DANTOP
Chlorpyrifos 50% EC+ Cypermethrin 5% EC
CANON
Dichlorvos 76% EC DASH
Endosulfan 35% EC SPEED
Emamectin Benzoate 5% SG
NAGARJUNA TRUST
(BPMC) Fenobucarb 50% EC
MERLIN
Fipronil 0.3% GR TASK-GR
Fipronil 5% SC TASK
Imidacloprid 17.8% SL NAGARJUNA MIDA
Lambda Cyhalothrin 2.5% EC
WARRIOR
Lambda Cyhalothrin 5% EC
WARRIOR PLUS
Milbemectin 1 % EC MILBEKNOCK
Monocrotophos 36% SL MONOCROWN
Phorate 10%CG NAGARJUNA PHORATE
Profenofos 50% EC PROFEX
Profenofos 40% + Cypermethrin 4% EC
PROFEX SUPER
Spinosad 45% SC CONSERVE
Exports
Nagarjuna's growing global presence is reflected in its exports. Today Nagarjuna is
among the few companies in India exporting pesticide technicals and formulations to
as many as 24 countries including Australia, Bangladesh, Belgium, Brazil, Colombia,
Egypt, France, Germany, Indonesia, Italy, Ivorycoast, Japan, Malaysia, Netherlands,

10
Nigeria, Saudi Arabia, Singapore, Sri Lanka, Switzerland, Taiwan, Tanzania, Thailand,
USA and Yemen.
To meet the growing demand in the international markets and improve its export
business, the Group is constantly introducing new generics and formulations. To
strengthen this process, Nagarjuna has generated complete packages of Chemistry,
Toxicology, Residues and Bioefficacy data for all its manufactured techincals.
Manufacturing and R & D
NACL has adequate capacities, state-of-the-art infrastructure, skilled experienced
manpower and technology absorption capabilities. The production lines are designed
for quick change over to also undertake Toll manufacturing adhering to the highest
international standards and specifications.
The Technical Grade Pesticides manufactured are:
Insecticides Herbicides Fungicides
Profenophos Pretilachlor Propiconazole
Acephate
Tricyclozole
Dichlorovos . Myclobutanil
Research and Development plays a critical role in NACL. The R&D division carries out
work on process development of technical and intermediates, custom synthesis,
process improvement, application research and basic research.
11
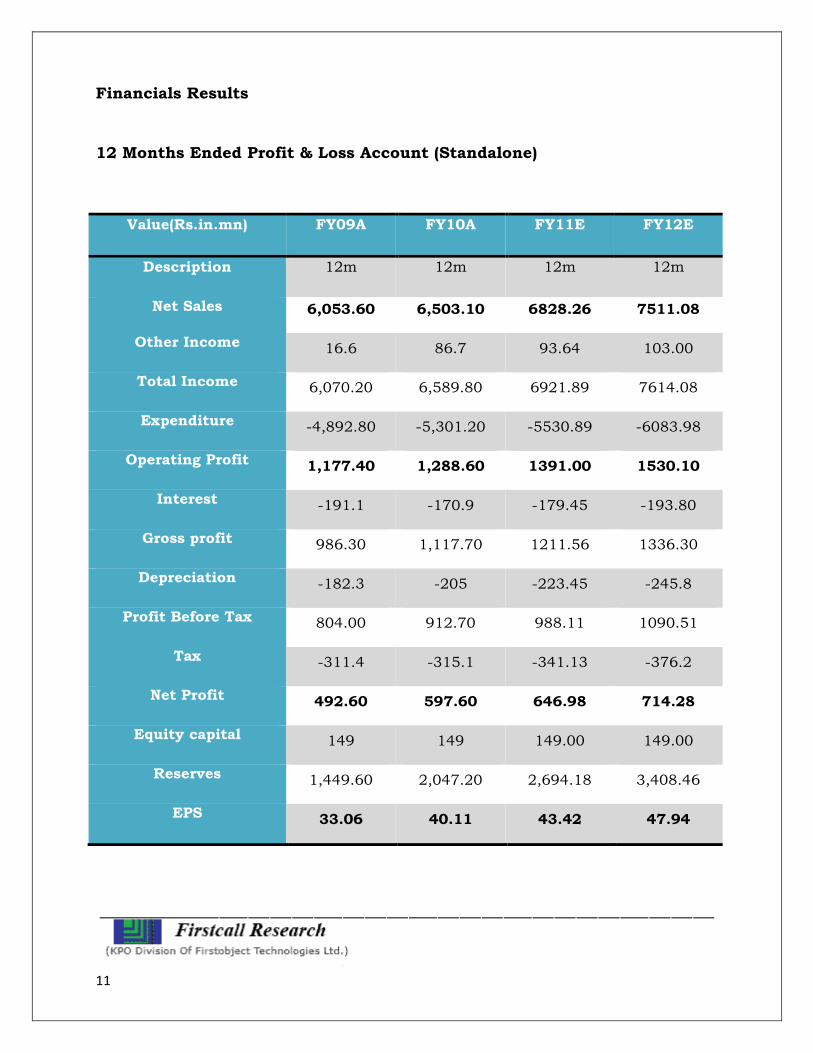
Financials Results
12 Months Ended Profit & Loss Account (Standalone)
Value(Rs.in.mn) FY09A FY10A FY11E FY12E
Description 12m 12m 12m 12m
Net Sales 6,053.60 6,503.10 6828.26 7511.08
Other Income 16.6 86.7 93.64 103.00
Total Income 6,070.20 6,589.80 6921.89 7614.08
Expenditure -4,892.80 -5,301.20 -5530.89 -6083.98
Operating Profit 1,177.40 1,288.60 1391.00 1530.10
Interest -191.1 -170.9 -179.45 -193.80
Gross profit 986.30 1,117.70 1211.56 1336.30
Depreciation -182.3 -205 -223.45 -245.8
Profit Before Tax 804.00 912.70 988.11 1090.51
Tax -311.4 -315.1 -341.13 -376.2
Net Profit 492.60 597.60 646.98 714.28
Equity capital 149 149 149.00 149.00
Reserves 1,449.60 2,047.20 2,694.18 3,408.46
EPS 33.06 40.11 43.42 47.94

12
Quarterly Ended Profit & Loss Account (Standalone)
Value(Rs.in.mn) Sep-09A Dec-09A Mar-10A June-10E
Description 3m 3m 3m 3m
Net sales 2,017.40 1,714.10 1,400.20 1358.19
Other income 19.1 31.5 24.3 25.52
Total Income 2,036.50 1,745.60 1,424.50 1383.71
Expenditure -1,672.50 -1,375.60 -1,123.60 -1093.35
Operating profit 364.00 370.00 300.90 290.36
Interest -40.3 -44 -50.1 -54.11
Gross profit 323.70 326.00 250.80 236.25
Depreciation -50.4 -53 -52.2 -53.24
Profit Before Tax 273.30 273.00 198.60 183.01
Tax -101.4 -89.8 -70 -58.56
Net Profit 171.90 183.20 128.60 124.45
Equity capital 149 149 149 149.00
EPS 11.54 12.30 8.63 8.35

13
Key Ratio
Particulars FY09 A FY10 A FY11 E FY12 E
EBIDTA % 19% 20% 20% 20%
PAT % 8% 9% 9% 10%
P/E ratio (x) 10.23 8.43 7.79 7.05
ROCE - % 59% 47% 40% 35%
ROE - % 31% 27% 23% 20%
Price/Book Value 3.15 2.29 1.77 1.42
Debt Equity Ratio 0.05 0.04 0.03 0.03
Book Value (Rs.) 107.29 147.40 190.82 238.76
EV/EBIDITA (x) 4.28 3.91 3.98 3.95
Charts:

14

15

16
Outlook and Conclusion
• At the current market price of Rs.338.05. the stock trades at a P/E of 7.79x and
7.05x for FY11E and FY12E respectively. On the basis of EV/EBDITA, the stock
trades at 3.98x and 3.95x for FY11E and FY12E respectively.
• EPS of the company is expected to be at Rs.43.42 and Rs.47.94 for the earnings of
FY11E and FY12E respectively. Price to Book Value of the stock is expected to be
at 1.77 and 1.42 respectively for FY11E and FY12E.
• We recommend ‘BUY’ in this particular scrip with a target price of Rs.390.00 for
Medium to Long Term Gains.
Industry Overview
• Agrochemicals also known as Pesticides are substance or mixture of substances
that are used to avert, destroy or control any kind of pests or unwanted type of
plants or animals that cause harm to crops or hampers the normal growth
process of a crop. As per a Government of India estimate of 2002, value of crop
losses caused due to non-usage of pesticides was around Rs 90,000 crore.
Thereon, assuming losses grew at an average 2%, total losses would have
amounted to Rs 101,355 crore in FY2009, a staggering 2.2% of India's GDP.
• Chemical Industry is one of the oldest industries in India, which contributes
significantly towards industrial and economic growth of the nation. It is highly
science based and provides valuable chemicals for various end products such
as textiles, paper, paints and varnishes, leather etc., which are required in
almost all walks of life. The Indian Chemical Industry forms the backbone of the
industrial and agricultural development of India and provides building blocks
for downstream industries.

17
• The chemical industry currently produces nearly 70,000 commercial products,
ranging from cosmetics and toiletries, to plastics and pesticides. The wide and
diverse spectrum of products can be broken down into a number of categories,
including inorganic and organic (commodity) chemicals, drugs and
pharmaceuticals, plastics and petrochemicals, dyes and pigments, fine and
specialty chemicals, pesticides and agrochemicals, and fertilizers.
• The Indian pesticide industry has advanced significantly in recent years,
producing more than 1,000 tons of pesticides annually. India is the 13th largest
exporter of pesticides and disinfectants in the world, and in terms of volume, is
the 12th largest producer of chemicals. The Indian agrochemical,
petrochemical, and pharmaceutical industries are some of the fastest growing
sectors in the economy. With an estimated worth of $28 billion, it accounts for
12.5 percent of the country's total industrial production and 16.2 percent of the
total exports from the Indian manufacturing sector.
• With a special focus on modernization, the Indian government takes an active
role in promoting and advancing the domestic chemical industry. The
Department of Chemicals and Petrochemicals, which has been part of the
Ministry of Chemicals and Fertilizers since 1991, is responsible for policy,
planning, development, and regulation of the industry. In the private sector,
numerous organizations, including the Indian Chemical Manufacturers
Association, the Chemicals and Petrochemicals Manufacturers Association, and
the Pesticides Manufacturers and Formulators Association of India, all work to
promote the growth of the industry and the export of Indian chemicals. The
Indian Chemical Manufacturers Association, for example, represents a large
number of Indian companies that produce and export a number of chemicals
that have legitimate commercial applications, but also could be used as
precursors and intermediates for chemical weapons production.
� The Indian fertilizer industry has succeeded in meeting almost fully the demand
of all chemical fertilizers except for MOP. The industry had a very humble

18
beginning in 1906, when the first manufacturing unit of Single Super
Phosphate (SSP) was set up in Ranipet near Chennai with an annual capacity of
6000 MT. The Fertilizer & Chemicals Travancore of India Ltd. (FACT) at Cochin
in Kerala and the Fertilizers Corporation of India (FCI) in Sindri in Bihar were
the first large sized -fertilizer plants set up in the forties and fifties with a view
to establish an industrial base to achieve self-sufficiency in food grains.
Subsequently, green revolution in the late sixties gave an impetus to the growth
of fertilizer industry in India. The seventies and eighties then witnessed a
significant addition to the fertilizer production capacity.
� Fertilizer sector is a very crucial for Indian economy because it provides a very
important input to agriculture. The fertilizer industry in India has played a
pivotal role in achieving self – sufficiency in food grains as well as in rapid and
sustained agriculture growth. India is the third largest producer and consumer
of fertilizers in the world after China and the United States. The growth of the
Indian fertilizer industry has been largely determined by the policies pursued by
the government. The government exercised extensive controls on the pricing,
distribution and movement of fertilizers. The industry is capital intensive and
the production process energy intensive with the combined cost of feedstock
and fuel accounting for anywhere between 55 and 80 per cent of cost of
production, depending on the type of fertilizers.
Key opportunities and challenges for industry
• Low penetration of pesticides:
Estimated size of the Indian economy is US $1 trillion of which Agriculture
accounts for 18%. The Agrochemical industry's size is estimated at US$1bn (Rs
5,000 crore) i.e. 0.1% of the country's total GDP and 0.6% of Agriculture GDP.
Meanwhile, the subsidy burden of urea for FY2009 is estimated at US$21.2
billion or 2% of the total GDP and 12% of agriculture GDP. We believe this

19
demonstrate the gross under penetration of agrochemical and the opportunity
that is available to the companies in the Sector.
• Biotech seeds threat to agrochemicals:
Scientific research has come up with seeds that have self-immunity towards
natural adversaries. This can be a potential threat to the business of
agrochemicals. Best example of such an introduction in the Indian market is
"Bt Cotton", which resulted in a decline in the consumption of agrochemicals by
cotton crop. However, off late there have been few reports of Bt Cotton unable to
develop immunity towards new type of pests.
• Patent expiry of molecules:
Agrochemicals are protected by patents to encourage innovation similar to the
Pharmaceutical industry. Going ahead, many molecules are likely to go off
patent throwing the market open for generic players. As per estimates, total
likely available opportunity through patent expiry stands at US
Determinants of Fertilize Demand
• Rainfall and irrigation facilities
• Relative prices of fertilizers
• Cropping pattern
• Government policies
Rising demand for fertilizers

20
� There has been significant growth in the consumption of fertilizers in last three
years due to overall good monsoon. The growth in NPK consumption was 9.50%
in 2004-05, 10.60 % in 2005-06 and 8.40% per cent in 2006-07.Against the
robust growth in consumption, domestic fertilizer production has remained
range – bound in the last decades. The surge in fertilizers demand and stagnant
to modest increase in production has widened the gap between consumption
and production causing larger dependence on imports. Therefore, the rising
demand for fertilizers is providing ample scope for the companies in this sector
to increase their production capacity and volumes thereby, driving the growth
of fertilizer sector.
� The installed capacity as on 30.01.2003 has reached a level of 121.10 lakh MT
of nitrogen (inclusive of an installed capacity of 208.42 lakh MT of urea after
reassessment of capacity) and 53.60 lakh MT of phosphatic nutrient, making
India the 3rd largest fertilizer producer in the world. The rapid build-up of
fertilizer production capacity in the country has been achieved as a result of a
favorable policy environment facilitating large investments in the public, co-
operative and private sectors. Presently, there are 57 large sized fertilizer plants
in the country manufacturing a wide range of nitrogenous, phosphatic and
complex fertilizers. Out of these, 29 unit produce urea, 20 units produce DAP
and complex fertilizers 13 plants manufacture Ammonium Sulphate (AS),
Calcium Ammonium Nitrate (CAN) and other low analysis nitrogenous
fertilizers. Besides, there are about 64 medium and small-scale units in
operation producing SSP
� The Indian fertilizer industry has come a long way since its early days post
independence. India today is one of the largest producer and consumer of
Fertilizers in the world. India’s production in terms of nutrients (N & P) reached
a level of 155 lakh MT in 2005-06 from 0.39 lakh MT in 1951-52. Similarly,
consumption of fertilizers in terms of nutrients (NPK) has also grown from
about 0.66 lakh MT in 1951-52 to nearly 184 lakh MT in 2004-05.

21
� The Indian Fertilizer industry, given its strategic importance in ensuring self–
sufficiency of food grain production in the country, has for decades, been under
Government control. The Government has over the years, provided subsidies/
concessions through the fertilizer companies to farmers and the manufacturers
have been compensated through various schemes. Though the Government
control helped in meeting the objective of ensuring creation of capacities and
ultimately achieving self-sufficiency in food grain production, it did not
encourage improving efficiencies in the sector.
� Burgeoning subsidy bill and the need to focus on fiscal prudence, Government
polices in recent times are aimed at encouraging efficiencies in the sector. Policy
measures like the new pricing scheme have made the operations of less efficient
players unviable. The Government polices today are oriented towards achieving
the stated objective of total deregulation in the sector. However, the uncertainty
over exact policy parameters and absence of a comprehensive long term policy
has not augured well for the industry. The financial year 2006-07 began with
practically no clarity on the policy parameters for both nitrogenous and
phosphatic fertilizers.
� Another important issue confronting the sector is with respect to the feedstock.
Natural gas which is the main feedstock for production of nitrogenous fertilizers
is available in limited quantities and the industry competes with the power
sector for its share. With the Government policy favoring conversion to gas
based units, the demand for gas is only expected to go up in the future, which
may in turn lead to further shortages.
� The Indian fertilizer industry has come a long way since its early days post
independence. India today is one of the largest producer and consumer of
Fertilisers in the world. India’s production in terms of nutrients (N & P) reached
a level of 155 lakh MT in 2005-06 from 0.39 lakh MT in 1951-52. Similarly,
consumption of fertilizers in terms of nutrients (NPK) has also grown from
about 0.66 lakh MT in 1951-52 to nearly 184 lakh MT in 2004-05. The Indian

22
Fertilizer industry, given its strategic importance in ensuring self– sufficiency of
food grain production in the country, has for decades, been under Government
control.
� The Government has over the years, provided subsidies/concessions through
the fertilizer companies to farmers and the manufacturers have been
compensated through various schemes. Though the Government control helped
in meeting the objective of ensuring creation of capacities and ultimately
achieving self-sufficiency in food grain production, it did not encourage
improving efficiencies in the sector. With the burgeoning subsidy bill and the
need to focus on fiscal prudence, Government polices in recent times are aimed
at encouraging efficiencies in the sector. Policy measures like the new pricing
scheme have made the operations of less efficient players unviable. The
Government polices today are oriented towards achieving the stated objective of
total deregulation in the sector. However, the uncertainty over exact policy
parameters and absence of a comprehensive long term policy has not augured
well for the industry. For instance, the financial year 2006-07 began with
practically no clarity on the policy parameters for both nitrogenous and
phosphatic fertilizers.
� Another important issue confronting the sector is with respect to the feedstock.
Natural gas which is the main feedstock for production of nitrogenous fertilizers
is available in limited quantities and the industry competes with the power
sector for its share. With the Government policy favouring conversion to gas
based units, the demand for gas is only expected to go up in the future, which
may in turn lead to further shortages. Similarly, in the case of phosphates, on
account of the limited availability of phosphoric acid and rock phosphate in the
country, domestic units are dependent to a large extent on imports. In view of
the limited availability of the main feedstock within the country, fertiliser
companies today are exploring the possibility of setting up joint ventures
abroad to tie up their feedstock requirements. Though a few joint venture
agreements have been signed with respect to supply of phosphoric acid, only a

23
couple of joint ventures have been established with respect to urea. Domestic
players have also not been able to enter into long term gas supply agreements
primarily due to differences over pricing.

24
_____________ ____ _________________________
Disclaimer:
This document prepared by our research analysts does not constitute an offer or solicitation
for the purchase or sale of any financial instrument or as an official confirmation of any
transaction. The information contained herein is from publicly available data or other
sources believed to be reliable but do not represent that it is accurate or complete and it
should not be relied on as such. Firstcall India Equity Advisors Pvt. Ltd. or any of it’s
affiliates shall not be in any way responsible for any loss or damage that may arise to any
person from any inadvertent error in the information contained in this report. This document
is provide for assistance only and is not intended to be and must not alone be taken as the
basis for an investment decision.

25
Firstcall India Equity Research: Email – [email protected]
B. Harikrishna Banking
B. Prathap IT
A. Rajesh Babu FMCG
C.V.S.L.Kameswari Pharma
U. Janaki Rao Capital Goods
E. Swethalatha Oil & Gas
D. Ashakirankumar Auto
Kavita Singh Diversified
Nimesh Gada Diversified
Priya Shetty Diversified
Neelam Dubey Diversified
Firstcall India also provides
Firstcall India Equity Advisors Pvt.Ltd focuses on, IPO’s, QIP’s, F.P.O’s,Takeover
Offers, Offer for Sale and Buy Back Offerings.
Corporate Finance Offerings include Foreign Currency Loan Syndications,
Placement of Equity / Debt with multilateral organizations, Short Term Funds
Management Debt & Equity, Working Capital Limits, Equity & Debt
Syndications and Structured Deals.
Corporate Advisory Offerings include Mergers & Acquisitions(domestic and
cross-border), divestitures, spin-offs, valuation of business, corporate
restructuring-Capital and Debt, Turnkey Corporate Revival – Planning &
Execution, Project Financing, Venture capital, Private Equity and Financial
Joint Ventures
Firstcall India also provides Financial Advisory services with respect to raising
of capital through FCCBs, GDRs, ADRs and listing of the same on International
Stock Exchanges namely AIMs, Luxembourg, Singapore Stock Exchanges and
other international stock exchanges.
For Further Details Contact:
3rd Floor,Sankalp,The Bureau,Dr.R.C.Marg,Chembur,Mumbai 400 071
Tel. : 022-2527 2510/2527 6077/25276089 Telefax : 022-25276089
E-mail: [email protected]
www.firstcallindiaequity.com