nadc, pdc guide
TRANSCRIPT
NADC, PDC Guide
Agilent Technologies PSA Seriesand VSA E4406A
Option BAE
This manual provides documentation for the following instruments:Transmitter Tester:
E4406A
Spectrum Analyzers:E4440A (3 Hz – 26.5 GHz)E4443A (3 Hz – 6.7 GHz)E4445A (3 Hz – 13.2 GHz)E4446A (3 Hz – 44.0 GHz)E4447A (3 Hz – 42.98 GHz)E4448A (3 Hz – 50.0 GHz)
Manufacturing Part Number: E4406-90311Supersedes E4406-90261
Printed in USA
May 2007
© Copyright 1999 - 2007 Agilent Technologies, Inc.

The information contained in this document is subject to change without notice.
Agilent Technologies makes no warranty of any kind with regard to this material, including but not limited to, the implied warranties of merchantability and fitness for a particular purpose. Agilent Technologies shall not be liable for errors contained herein or for incidental or consequential damages in connection with the furnishing, performance, or use of this material.
ContentsTab
le of C
on
tents
1. Introduction to NADC and PDCWhat does the Agilent PSA Series and VSA E4406A Option BAE do? . . . . . . . . . . . . . . . . . . . . . . . . . . . . . . . . . . . . . . . . . . . . . . . . . . 18Installing Optional Measurement Personalities . . . . . . . . . . . . . . . . . . . . . . . . . . . . . . . . . . . 19
Do You Have Enough Memory to Load All Your Personality Options? . . . . . . . . . . . . . . . . 19How to Predict Your Memory Requirements . . . . . . . . . . . . . . . . . . . . . . . . . . . . . . . . . . . . . 21Loading an Optional Measurement Personality . . . . . . . . . . . . . . . . . . . . . . . . . . . . . . . . . . 23Obtaining and Installing a License Key . . . . . . . . . . . . . . . . . . . . . . . . . . . . . . . . . . . . . . . . 24Viewing a License Key . . . . . . . . . . . . . . . . . . . . . . . . . . . . . . . . . . . . . . . . . . . . . . . . . . . . . . 25Using the Delete License Key on PSA . . . . . . . . . . . . . . . . . . . . . . . . . . . . . . . . . . . . . . . . . . 26Using the Uninstall Key on E4406A . . . . . . . . . . . . . . . . . . . . . . . . . . . . . . . . . . . . . . . . . . . 26Ordering Optional Measurement Personalities . . . . . . . . . . . . . . . . . . . . . . . . . . . . . . . . . . 27
2. Making NADC MeasurementsNADC and PDC Measurements . . . . . . . . . . . . . . . . . . . . . . . . . . . . . . . . . . . . . . . . . . . . . . . . 30Setting up and Making a Measurement . . . . . . . . . . . . . . . . . . . . . . . . . . . . . . . . . . . . . . . . . . 31
Making the Initial Signal Connection . . . . . . . . . . . . . . . . . . . . . . . . . . . . . . . . . . . . . . . . . . 31Using Instrument Mode and Measurement Presets . . . . . . . . . . . . . . . . . . . . . . . . . . . . . . . 31The 3 Steps to Set Up and Make Measurements . . . . . . . . . . . . . . . . . . . . . . . . . . . . . . . . . 32
Adjacent Channel Power (ACP) Measurements . . . . . . . . . . . . . . . . . . . . . . . . . . . . . . . . . . . . 33Configuring the Measurement System . . . . . . . . . . . . . . . . . . . . . . . . . . . . . . . . . . . . . . . . . 33Setting the MS . . . . . . . . . . . . . . . . . . . . . . . . . . . . . . . . . . . . . . . . . . . . . . . . . . . . . . . . . . . . 33Measurement Procedure. . . . . . . . . . . . . . . . . . . . . . . . . . . . . . . . . . . . . . . . . . . . . . . . . . . . . 34Troubleshooting Hints . . . . . . . . . . . . . . . . . . . . . . . . . . . . . . . . . . . . . . . . . . . . . . . . . . . . . . 37
Error Vector Magnitude (EVM) Measurements . . . . . . . . . . . . . . . . . . . . . . . . . . . . . . . . . . . . 39Configuring the Measurement System . . . . . . . . . . . . . . . . . . . . . . . . . . . . . . . . . . . . . . . . . 39Setting the MS . . . . . . . . . . . . . . . . . . . . . . . . . . . . . . . . . . . . . . . . . . . . . . . . . . . . . . . . . . . . 40Measurement Procedure. . . . . . . . . . . . . . . . . . . . . . . . . . . . . . . . . . . . . . . . . . . . . . . . . . . . . 40Troubleshooting Hints . . . . . . . . . . . . . . . . . . . . . . . . . . . . . . . . . . . . . . . . . . . . . . . . . . . . . . 44
Occupied Bandwidth Measurement . . . . . . . . . . . . . . . . . . . . . . . . . . . . . . . . . . . . . . . . . . . . . 45Configuring the Measurement System . . . . . . . . . . . . . . . . . . . . . . . . . . . . . . . . . . . . . . . . . 45Setting the MS . . . . . . . . . . . . . . . . . . . . . . . . . . . . . . . . . . . . . . . . . . . . . . . . . . . . . . . . . . . . 46Measurement Procedure. . . . . . . . . . . . . . . . . . . . . . . . . . . . . . . . . . . . . . . . . . . . . . . . . . . . . 46Changing the Display . . . . . . . . . . . . . . . . . . . . . . . . . . . . . . . . . . . . . . . . . . . . . . . . . . . . . . . 47
Spectrum (Frequency Domain) Measurements . . . . . . . . . . . . . . . . . . . . . . . . . . . . . . . . . . . . 48Configuring the Measurement System . . . . . . . . . . . . . . . . . . . . . . . . . . . . . . . . . . . . . . . . . 48Setting the BTS. . . . . . . . . . . . . . . . . . . . . . . . . . . . . . . . . . . . . . . . . . . . . . . . . . . . . . . . . . . . 49Measurement Procedure. . . . . . . . . . . . . . . . . . . . . . . . . . . . . . . . . . . . . . . . . . . . . . . . . . . . . 49
Waveform (Time Domain) Measurements . . . . . . . . . . . . . . . . . . . . . . . . . . . . . . . . . . . . . . . . 63Configuring the Measurement System . . . . . . . . . . . . . . . . . . . . . . . . . . . . . . . . . . . . . . . . . 63Measurement Procedure. . . . . . . . . . . . . . . . . . . . . . . . . . . . . . . . . . . . . . . . . . . . . . . . . . . . . 65
Using Basic Mode . . . . . . . . . . . . . . . . . . . . . . . . . . . . . . . . . . . . . . . . . . . . . . . . . . . . . . . . . . . 82Basic Mode in E4406A VSA Series Transmitter Testers . . . . . . . . . . . . . . . . . . . . . . . . . . . 82Basic Mode in PSA Series Spectrum Analyzers . . . . . . . . . . . . . . . . . . . . . . . . . . . . . . . . . . 82
Understanding Common Measurement Errors . . . . . . . . . . . . . . . . . . . . . . . . . . . . . . . . . . . . 83
3. NADC and PDC Key ReferenceInstrument Front Panel Highlights . . . . . . . . . . . . . . . . . . . . . . . . . . . . . . . . . . . . . . . . . . . . . 86
3

ContentsTa
ble
of
Co
nte
nts
Selected E4406A VSA and PSA Front-Panel Features . . . . . . . . . . . . . . . . . . . . . . . . . . . . .87NADC and PDC Mode Front Panel Keys . . . . . . . . . . . . . . . . . . . . . . . . . . . . . . . . . . . . . . . . . .89
FREQUENCY Channel Key Menu . . . . . . . . . . . . . . . . . . . . . . . . . . . . . . . . . . . . . . . . . . . . .89Measurement Control Key Menu . . . . . . . . . . . . . . . . . . . . . . . . . . . . . . . . . . . . . . . . . . . . . .90MODE Key Menu . . . . . . . . . . . . . . . . . . . . . . . . . . . . . . . . . . . . . . . . . . . . . . . . . . . . . . . . . . .90Mode Setup Key Menu . . . . . . . . . . . . . . . . . . . . . . . . . . . . . . . . . . . . . . . . . . . . . . . . . . . . . . .91
NADC and PDC Measurement Keys . . . . . . . . . . . . . . . . . . . . . . . . . . . . . . . . . . . . . . . . . . . . .95Adjacent Channel Power Keys . . . . . . . . . . . . . . . . . . . . . . . . . . . . . . . . . . . . . . . . . . . . . . . .95Error Vector Magnitude (EVM) Keys . . . . . . . . . . . . . . . . . . . . . . . . . . . . . . . . . . . . . . . . . .104Occupied Bandwidth Keys (PDC Only). . . . . . . . . . . . . . . . . . . . . . . . . . . . . . . . . . . . . . . . . 111Spectrum (Frequency Domain) Keys. . . . . . . . . . . . . . . . . . . . . . . . . . . . . . . . . . . . . . . . . . .115Waveform (Time Domain) Keys . . . . . . . . . . . . . . . . . . . . . . . . . . . . . . . . . . . . . . . . . . . . . . .134
4. NADC Programming CommandsSCPI Command Subsystems. . . . . . . . . . . . . . . . . . . . . . . . . . . . . . . . . . . . . . . . . . . . . . . . . . .154Programming Command CompatibilityAcross Model Numbers and Across Modes. . . . . . . . . . . . . . . . . . . . . . . . . . . . . . . . . . . . . . . .155
Across PSA Modes: Command Subsystem Similarities . . . . . . . . . . . . . . . . . . . . . . . . . . . .155Across PSA Modes: Specific Command Differences . . . . . . . . . . . . . . . . . . . . . . . . . . . . . . .157Using Applications in PSA Series vs. VSA E4406A . . . . . . . . . . . . . . . . . . . . . . . . . . . . . . .158
CALCulate Subsystem . . . . . . . . . . . . . . . . . . . . . . . . . . . . . . . . . . . . . . . . . . . . . . . . . . . . . . .160ACP - Limits . . . . . . . . . . . . . . . . . . . . . . . . . . . . . . . . . . . . . . . . . . . . . . . . . . . . . . . . . . . . .160Test Current Results Against all Limits . . . . . . . . . . . . . . . . . . . . . . . . . . . . . . . . . . . . . . .161Data Query . . . . . . . . . . . . . . . . . . . . . . . . . . . . . . . . . . . . . . . . . . . . . . . . . . . . . . . . . . . . . .161Calculate/Compress Trace Data Query . . . . . . . . . . . . . . . . . . . . . . . . . . . . . . . . . . . . . . . .161Calculate Peaks of Trace Data . . . . . . . . . . . . . . . . . . . . . . . . . . . . . . . . . . . . . . . . . . . . . . .171EVM - Limits . . . . . . . . . . . . . . . . . . . . . . . . . . . . . . . . . . . . . . . . . . . . . . . . . . . . . . . . . . . . .173CALCulate:MARKers Subsystem . . . . . . . . . . . . . . . . . . . . . . . . . . . . . . . . . . . . . . . . . . . . .175
CONFigure Subsystem . . . . . . . . . . . . . . . . . . . . . . . . . . . . . . . . . . . . . . . . . . . . . . . . . . . . . . .187Configure the Selected Measurement . . . . . . . . . . . . . . . . . . . . . . . . . . . . . . . . . . . . . . . . .187Configure Query . . . . . . . . . . . . . . . . . . . . . . . . . . . . . . . . . . . . . . . . . . . . . . . . . . . . . . . . . .187
DISPlay Subsystem . . . . . . . . . . . . . . . . . . . . . . . . . . . . . . . . . . . . . . . . . . . . . . . . . . . . . . . . . .188Adjacent Channel Power - View Selection . . . . . . . . . . . . . . . . . . . . . . . . . . . . . . . . . . . . . .188Error Vector Magnitude - View Selection . . . . . . . . . . . . . . . . . . . . . . . . . . . . . . . . . . . . . . .188QPSK Error Vector Magnitude - View Selection . . . . . . . . . . . . . . . . . . . . . . . . . . . . . . . . .189Select Display Format . . . . . . . . . . . . . . . . . . . . . . . . . . . . . . . . . . . . . . . . . . . . . . . . . . . . . .189Select Display Format . . . . . . . . . . . . . . . . . . . . . . . . . . . . . . . . . . . . . . . . . . . . . . . . . . . . . .189Spectrum - Y-Axis Scale/Div . . . . . . . . . . . . . . . . . . . . . . . . . . . . . . . . . . . . . . . . . . . . . . . . .190Spectrum - Y-Axis Reference Level . . . . . . . . . . . . . . . . . . . . . . . . . . . . . . . . . . . . . . . . . . .191Turn a Trace Display On/Off . . . . . . . . . . . . . . . . . . . . . . . . . . . . . . . . . . . . . . . . . . . . . . . . .192Waveform - Y-Axis Scale/Div . . . . . . . . . . . . . . . . . . . . . . . . . . . . . . . . . . . . . . . . . . . . . . . . .196Waveform - Y-Axis Reference Level . . . . . . . . . . . . . . . . . . . . . . . . . . . . . . . . . . . . . . . . . . .197
FETCh Subsystem. . . . . . . . . . . . . . . . . . . . . . . . . . . . . . . . . . . . . . . . . . . . . . . . . . . . . . . . . . .199Fetch the Current Measurement Results . . . . . . . . . . . . . . . . . . . . . . . . . . . . . . . . . . . . . .199
FORMat Subsystem . . . . . . . . . . . . . . . . . . . . . . . . . . . . . . . . . . . . . . . . . . . . . . . . . . . . . . . . .200Byte Order . . . . . . . . . . . . . . . . . . . . . . . . . . . . . . . . . . . . . . . . . . . . . . . . . . . . . . . . . . . . . . .200Numeric Data Format . . . . . . . . . . . . . . . . . . . . . . . . . . . . . . . . . . . . . . . . . . . . . . . . . . . . . .200
INITiate Subsystem. . . . . . . . . . . . . . . . . . . . . . . . . . . . . . . . . . . . . . . . . . . . . . . . . . . . . . . . . .202Take New Data Acquisition for Selected Measurement . . . . . . . . . . . . . . . . . . . . . . . . . . .202
4
ContentsTab
le of C
on
tents
Continuous or Single Measurements . . . . . . . . . . . . . . . . . . . . . . . . . . . . . . . . . . . . . . . . . 202Take New Data Acquisitions . . . . . . . . . . . . . . . . . . . . . . . . . . . . . . . . . . . . . . . . . . . . . . . . 203Restart the Measurement . . . . . . . . . . . . . . . . . . . . . . . . . . . . . . . . . . . . . . . . . . . . . . . . . . 203
INSTrument Subsystem. . . . . . . . . . . . . . . . . . . . . . . . . . . . . . . . . . . . . . . . . . . . . . . . . . . . . . 204Catalog Query . . . . . . . . . . . . . . . . . . . . . . . . . . . . . . . . . . . . . . . . . . . . . . . . . . . . . . . . . . . 204Select Application by Number . . . . . . . . . . . . . . . . . . . . . . . . . . . . . . . . . . . . . . . . . . . . . . . 204Select Application . . . . . . . . . . . . . . . . . . . . . . . . . . . . . . . . . . . . . . . . . . . . . . . . . . . . . . . . . 206
MEASure Group of Commands . . . . . . . . . . . . . . . . . . . . . . . . . . . . . . . . . . . . . . . . . . . . . . . . 209Command Interactions: MEASure, CONFigure, FETCh, INITiate and READ . . . . . . . . 209Adjacent Channel Power Ratio (ACP) Measurement . . . . . . . . . . . . . . . . . . . . . . . . . . . . 214Error Vector Magnitude Measurement . . . . . . . . . . . . . . . . . . . . . . . . . . . . . . . . . . . . . . . . 222Spectrum (Frequency Domain) Measurement . . . . . . . . . . . . . . . . . . . . . . . . . . . . . . . . . . 229Waveform (Time Domain) Measurement . . . . . . . . . . . . . . . . . . . . . . . . . . . . . . . . . . . . . . 232
READ Subsystem . . . . . . . . . . . . . . . . . . . . . . . . . . . . . . . . . . . . . . . . . . . . . . . . . . . . . . . . . . . 234Initiate and Read Measurement Data . . . . . . . . . . . . . . . . . . . . . . . . . . . . . . . . . . . . . . . . 234
SENSe Subsystem . . . . . . . . . . . . . . . . . . . . . . . . . . . . . . . . . . . . . . . . . . . . . . . . . . . . . . . . . . 235Adjacent Channel Power Measurement . . . . . . . . . . . . . . . . . . . . . . . . . . . . . . . . . . . . . . . 235Channel Commands . . . . . . . . . . . . . . . . . . . . . . . . . . . . . . . . . . . . . . . . . . . . . . . . . . . . . . . 241Signal Corrections Commands . . . . . . . . . . . . . . . . . . . . . . . . . . . . . . . . . . . . . . . . . . . . . . . 243Error Vector Magnitude Measurement . . . . . . . . . . . . . . . . . . . . . . . . . . . . . . . . . . . . . . . . 244F Input Signal Alignments . . . . . . . . . . . . . . . . . . . . . . . . . . . . . . . . . . . . . . . . . . . . . . . . . 247RF Power Commands . . . . . . . . . . . . . . . . . . . . . . . . . . . . . . . . . . . . . . . . . . . . . . . . . . . . . . 248Radio Standards Commands . . . . . . . . . . . . . . . . . . . . . . . . . . . . . . . . . . . . . . . . . . . . . . . . 250Spectrum (Frequency-Domain) Measurement . . . . . . . . . . . . . . . . . . . . . . . . . . . . . . . . . . 251Synchronization Commands . . . . . . . . . . . . . . . . . . . . . . . . . . . . . . . . . . . . . . . . . . . . . . . . 265Waveform (Time-Domain) Measurement . . . . . . . . . . . . . . . . . . . . . . . . . . . . . . . . . . . . . . 266
TRIGger Subsystem . . . . . . . . . . . . . . . . . . . . . . . . . . . . . . . . . . . . . . . . . . . . . . . . . . . . . . . . . 274Automatic Trigger Control . . . . . . . . . . . . . . . . . . . . . . . . . . . . . . . . . . . . . . . . . . . . . . . . . . 274Automatic Trigger Time . . . . . . . . . . . . . . . . . . . . . . . . . . . . . . . . . . . . . . . . . . . . . . . . . . . . 274External Trigger Delay . . . . . . . . . . . . . . . . . . . . . . . . . . . . . . . . . . . . . . . . . . . . . . . . . . . . . 275External Trigger Level . . . . . . . . . . . . . . . . . . . . . . . . . . . . . . . . . . . . . . . . . . . . . . . . . . . . . 275External Trigger Slope . . . . . . . . . . . . . . . . . . . . . . . . . . . . . . . . . . . . . . . . . . . . . . . . . . . . . 275Frame Trigger Adjust . . . . . . . . . . . . . . . . . . . . . . . . . . . . . . . . . . . . . . . . . . . . . . . . . . . . . . 276Frame Trigger Period . . . . . . . . . . . . . . . . . . . . . . . . . . . . . . . . . . . . . . . . . . . . . . . . . . . . . . 276Frame Trigger Sync Source . . . . . . . . . . . . . . . . . . . . . . . . . . . . . . . . . . . . . . . . . . . . . . . . . 277Frame Trigger Synchronization Offset . . . . . . . . . . . . . . . . . . . . . . . . . . . . . . . . . . . . . . . . 277Trigger Holdoff . . . . . . . . . . . . . . . . . . . . . . . . . . . . . . . . . . . . . . . . . . . . . . . . . . . . . . . . . . . 278Video (IF) Trigger Delay . . . . . . . . . . . . . . . . . . . . . . . . . . . . . . . . . . . . . . . . . . . . . . . . . . . 278Video (IF) Trigger Level . . . . . . . . . . . . . . . . . . . . . . . . . . . . . . . . . . . . . . . . . . . . . . . . . . . . 278Video (IF) Trigger Slope . . . . . . . . . . . . . . . . . . . . . . . . . . . . . . . . . . . . . . . . . . . . . . . . . . . . 279RF Burst Trigger Delay . . . . . . . . . . . . . . . . . . . . . . . . . . . . . . . . . . . . . . . . . . . . . . . . . . . . 279RF Burst Trigger Level . . . . . . . . . . . . . . . . . . . . . . . . . . . . . . . . . . . . . . . . . . . . . . . . . . . . 279RF Burst Trigger Slope . . . . . . . . . . . . . . . . . . . . . . . . . . . . . . . . . . . . . . . . . . . . . . . . . . . . 280
5. NADC and PDC ConceptsWhat is the NADC Communications System? . . . . . . . . . . . . . . . . . . . . . . . . . . . . . . . . . . . . 282What is the PDC Communications System?. . . . . . . . . . . . . . . . . . . . . . . . . . . . . . . . . . . . . . 285Adjacent Channel Power Measurement Concepts . . . . . . . . . . . . . . . . . . . . . . . . . . . . . . . . . 286
Purpose . . . . . . . . . . . . . . . . . . . . . . . . . . . . . . . . . . . . . . . . . . . . . . . . . . . . . . . . . . . . . . . . . 286
5

ContentsTa
ble
of
Co
nte
nts
Measurement Method . . . . . . . . . . . . . . . . . . . . . . . . . . . . . . . . . . . . . . . . . . . . . . . . . . . . . .286Troubleshooting Hints . . . . . . . . . . . . . . . . . . . . . . . . . . . . . . . . . . . . . . . . . . . . . . . . . . . . . .287
Error Vector Magnitude (EVM) Measurement Concepts . . . . . . . . . . . . . . . . . . . . . . . . . . . .288Purpose . . . . . . . . . . . . . . . . . . . . . . . . . . . . . . . . . . . . . . . . . . . . . . . . . . . . . . . . . . . . . . . . . .288Measurement Method . . . . . . . . . . . . . . . . . . . . . . . . . . . . . . . . . . . . . . . . . . . . . . . . . . . . . .288Troubleshooting Hints . . . . . . . . . . . . . . . . . . . . . . . . . . . . . . . . . . . . . . . . . . . . . . . . . . . . . .289
Occupied Bandwidth Measurement Concepts . . . . . . . . . . . . . . . . . . . . . . . . . . . . . . . . . . . . .290Purpose . . . . . . . . . . . . . . . . . . . . . . . . . . . . . . . . . . . . . . . . . . . . . . . . . . . . . . . . . . . . . . . . . .290Measurement Method . . . . . . . . . . . . . . . . . . . . . . . . . . . . . . . . . . . . . . . . . . . . . . . . . . . . . .290Troubleshooting Hints . . . . . . . . . . . . . . . . . . . . . . . . . . . . . . . . . . . . . . . . . . . . . . . . . . . . . .290
Spectrum (Frequency Domain) Measurement Concepts. . . . . . . . . . . . . . . . . . . . . . . . . . . . .291Purpose . . . . . . . . . . . . . . . . . . . . . . . . . . . . . . . . . . . . . . . . . . . . . . . . . . . . . . . . . . . . . . . . .291Measurement Method . . . . . . . . . . . . . . . . . . . . . . . . . . . . . . . . . . . . . . . . . . . . . . . . . . . . . .291Troubleshooting Hints . . . . . . . . . . . . . . . . . . . . . . . . . . . . . . . . . . . . . . . . . . . . . . . . . . . . . .291
Waveform (Time Domain) Measurement Concepts . . . . . . . . . . . . . . . . . . . . . . . . . . . . . . . . .292Purpose . . . . . . . . . . . . . . . . . . . . . . . . . . . . . . . . . . . . . . . . . . . . . . . . . . . . . . . . . . . . . . . . .292Measurement Method . . . . . . . . . . . . . . . . . . . . . . . . . . . . . . . . . . . . . . . . . . . . . . . . . . . . . .292
Other Sources of Measurement Information . . . . . . . . . . . . . . . . . . . . . . . . . . . . . . . . . . . . . .293Instrument Updates at www.agilent.com . . . . . . . . . . . . . . . . . . . . . . . . . . . . . . . . . . . . . . .293
6. NADC Menu MapsNADC Measurement Key Flow. . . . . . . . . . . . . . . . . . . . . . . . . . . . . . . . . . . . . . . . . . . . . . . . .296
6

List of CommandsL
ist of C
om
man
ds
:CALCulate:<measurement>:MARKer:AOFF . . . . . . . . . . . . . . . . . . . . . . . . . . . . . . . . . . . . . . . . . 178
:CALCulate:<measurement>:MARKer[1]|2|3|4:FUNCtion:RESult? . . . . . . . . . . . . . . . . . . . . . . 178
:CALCulate:<measurement>:MARKer[1]|2|3|4:MAXimum . . . . . . . . . . . . . . . . . . . . . . . . . . . . . 178
:CALCulate:<measurement>:MARKer[1]|2|3|4:MINimum . . . . . . . . . . . . . . . . . . . . . . . . . . . . . 179
:CALCulate:<measurement>:MARKer[1]|2|3|4:MODE POSition|DELTa . . . . . . . . . . . . . . . . . 179
:CALCulate:<measurement>:MARKer[1]|2|3|4:MODE POSition|DELTa|RMSDegree|RMSRadian|RFM|RMSJitter|OFF. . . . . . . . . . . . . . . . . . . . . . . . . . . . . . . . . . . . . 179
:CALCulate:<measurement>:MARKer[1]|2|3|4:MODE?. . . . . . . . . . . . . . . . . . . . . . . . . . . . . . . . 179
:CALCulate:<measurement>:MARKer[1]|2|3|4:TRACe <trace_name> . . . . . . . . . . . . . . . . . . . . 180
:CALCulate:<measurement>:MARKer[1]|2|3|4:TRACe? . . . . . . . . . . . . . . . . . . . . . . . . . . . . . . . 180
:CALCulate:<measurement>:MARKer[1]|2|3|4:X <param>. . . . . . . . . . . . . . . . . . . . . . . . . . . . . 184
:CALCulate:<measurement>:MARKer[1]|2|3|4:X:POSition <integer> . . . . . . . . . . . . . . . . . . . . 185
:CALCulate:<measurement>:MARKer[1]|2|3|4:X:POSition? . . . . . . . . . . . . . . . . . . . . . . . . . . . . 185
:CALCulate:<measurement>:MARKer[1]|2|3|4:X? . . . . . . . . . . . . . . . . . . . . . . . . . . . . . . . . . . . . 184
:CALCulate:<measurement>:MARKer[1]|2|3|4:Y? . . . . . . . . . . . . . . . . . . . . . . . . . . . . . . . . . . . . 185
:CALCulate:<measurement>:MARKer[1]|2|3|4[:STATe] OFF|ON|0|1 . . . . . . . . . . . . . . . . . . . 180
:CALCulate:<measurement>:MARKer[1]|2|3|4[:STATe]? . . . . . . . . . . . . . . . . . . . . . . . . . . . . . . . 180
:CALCulate:ACP:LIMit[:TEST] OFF|ON|0|1 . . . . . . . . . . . . . . . . . . . . . . . . . . . . . . . . . . . . . . . . 160
:CALCulate:ACP:LIMit[:TEST]? . . . . . . . . . . . . . . . . . . . . . . . . . . . . . . . . . . . . . . . . . . . . . . . . . . . . 160
:CALCulate:CLIMits:FAIL? . . . . . . . . . . . . . . . . . . . . . . . . . . . . . . . . . . . . . . . . . . . . . . . . . . . . . . . . 161
:CALCulate:CLIMits:FAIL? . . . . . . . . . . . . . . . . . . . . . . . . . . . . . . . . . . . . . . . . . . . . . . . . . . . . . . . . 213
:CALCulate:DATA<n>:COMPress? BLOCk|CFIT|MAXimum|MINimum|MEAN|DMEan|RMS|RMSCubed|SAMPle|SDEViation|PPHase[,<soffset>[,<length>[,<roffset>[,<rlimit>]]]]. . . . . . . . . . . . . . . . . . . . . . . . . . . . . . . . . . . . . . . . . . . 161
:CALCulate:DATA<n>:PEAKs? <threshold>,<excursion>[,AMPLitude|FREQuency|TIME] . . . 171
:CALCulate:DATA[n]? . . . . . . . . . . . . . . . . . . . . . . . . . . . . . . . . . . . . . . . . . . . . . . . . . . . . . . . . . . . . 161
:CALCulate:EVM:LIMit:F10 <percent> . . . . . . . . . . . . . . . . . . . . . . . . . . . . . . . . . . . . . . . . . . . . . . 173
:CALCulate:EVM:LIMit:F10? . . . . . . . . . . . . . . . . . . . . . . . . . . . . . . . . . . . . . . . . . . . . . . . . . . . . . . 173
:CALCulate:EVM:LIMit:IQOOffset <dB> . . . . . . . . . . . . . . . . . . . . . . . . . . . . . . . . . . . . . . . . . . . . . 173
:CALCulate:EVM:LIMit:IQOOffset? . . . . . . . . . . . . . . . . . . . . . . . . . . . . . . . . . . . . . . . . . . . . . . . . . 173
:CALCulate:EVM:LIMit:PEAK <percent> . . . . . . . . . . . . . . . . . . . . . . . . . . . . . . . . . . . . . . . . . . . . 173
:CALCulate:EVM:LIMit:PEAK? . . . . . . . . . . . . . . . . . . . . . . . . . . . . . . . . . . . . . . . . . . . . . . . . . . . . 173
7
List of CommandsL
ist
of
Co
mm
and
s
:CALCulate:EVM:LIMit:RMS <percent> . . . . . . . . . . . . . . . . . . . . . . . . . . . . . . . . . . . . . . . . . . . . . .174
:CALCulate:EVM:LIMit:RMS? . . . . . . . . . . . . . . . . . . . . . . . . . . . . . . . . . . . . . . . . . . . . . . . . . . . . . .174
:CALCulate:EVM:LIMit[:TEST] OFF|ON|0|1. . . . . . . . . . . . . . . . . . . . . . . . . . . . . . . . . . . . . . . . .174
:CALCulate:EVM:LIMit[:TEST]? . . . . . . . . . . . . . . . . . . . . . . . . . . . . . . . . . . . . . . . . . . . . . . . . . . . .174
:CALCulate:EVM:TTSWord?. . . . . . . . . . . . . . . . . . . . . . . . . . . . . . . . . . . . . . . . . . . . . . . . . . . . . . . .174
:CONFigure:<measurement> . . . . . . . . . . . . . . . . . . . . . . . . . . . . . . . . . . . . . . . . . . . . . . . . . . . . . . .187
:CONFigure:ACP . . . . . . . . . . . . . . . . . . . . . . . . . . . . . . . . . . . . . . . . . . . . . . . . . . . . . . . . . . . . . . . . .214
:CONFigure:EVM. . . . . . . . . . . . . . . . . . . . . . . . . . . . . . . . . . . . . . . . . . . . . . . . . . . . . . . . . . . . . . . . .222
:CONFigure:SPECtrum. . . . . . . . . . . . . . . . . . . . . . . . . . . . . . . . . . . . . . . . . . . . . . . . . . . . . . . . . . . .229
:CONFigure:WAVeform . . . . . . . . . . . . . . . . . . . . . . . . . . . . . . . . . . . . . . . . . . . . . . . . . . . . . . . . . . . .232
:CONFigure?. . . . . . . . . . . . . . . . . . . . . . . . . . . . . . . . . . . . . . . . . . . . . . . . . . . . . . . . . . . . . . . . . . . . .187
:DISPlay:ACP:VIEW BGRaph|SPECtrum . . . . . . . . . . . . . . . . . . . . . . . . . . . . . . . . . . . . . . . . . . . .188
:DISPlay:ACP:VIEW? . . . . . . . . . . . . . . . . . . . . . . . . . . . . . . . . . . . . . . . . . . . . . . . . . . . . . . . . . . . . .188
:DISPlay:EVMagnitude:VIEW POLar|CONStln|QUAD . . . . . . . . . . . . . . . . . . . . . . . . . . . . . . . . .188
:DISPlay:EVMagnitude:VIEW? . . . . . . . . . . . . . . . . . . . . . . . . . . . . . . . . . . . . . . . . . . . . . . . . . . . . .188
:DISPlay:EVMQpsk:VIEW POLar|ERRor. . . . . . . . . . . . . . . . . . . . . . . . . . . . . . . . . . . . . . . . . . . . .189
:DISPlay:EVMQpsk:VIEW?. . . . . . . . . . . . . . . . . . . . . . . . . . . . . . . . . . . . . . . . . . . . . . . . . . . . . . . . .189
:DISPlay:FORMat:TILE . . . . . . . . . . . . . . . . . . . . . . . . . . . . . . . . . . . . . . . . . . . . . . . . . . . . . . . . . . .189
:DISPlay:FORMat:ZOOM . . . . . . . . . . . . . . . . . . . . . . . . . . . . . . . . . . . . . . . . . . . . . . . . . . . . . . . . . .189
:DISPlay:SPECtrum[n]:WINDow[m]:TRACe:Y[:SCALe]:PDIVision <power>. . . . . . . . . . . . . . . . .190
:DISPlay:SPECtrum[n]:WINDow[m]:TRACe:Y[:SCALe]:PDIVision?. . . . . . . . . . . . . . . . . . . . . . . .190
:DISPlay:SPECtrum[n]:WINDow[m]:TRACe:Y[:SCALe]:RLEVel <power> . . . . . . . . . . . . . . . . . . .191
:DISPlay:SPECtrum[n]:WINDow[m]:TRACe:Y[:SCALe]:RLEVel?. . . . . . . . . . . . . . . . . . . . . . . . . .191
:DISPlay:TRACe[n][:STATe] OFF|ON|0|1 . . . . . . . . . . . . . . . . . . . . . . . . . . . . . . . . . . . . . . . . . . . .192
:DISPlay:TRACe[n][:STATe]? . . . . . . . . . . . . . . . . . . . . . . . . . . . . . . . . . . . . . . . . . . . . . . . . . . . . . . .192
:DISPlay:WAVeform[n]:WINDow[m]:TRACe:Y[:SCALe]:PDIVision <power> . . . . . . . . . . . . . . . . .196
:DISPlay:WAVeform[n]:WINDow[m]:TRACe:Y[:SCALe]:PDIVision? . . . . . . . . . . . . . . . . . . . . . . . .196
:DISPlay:WAVeform[n]:WINDow[m]:TRACe:Y[:SCALe]:RLEVel <power> . . . . . . . . . . . . . . . . . . .197
:DISPlay:WAVeform[n]:WINDow[m]:TRACe:Y[:SCALe]:RLEVel? . . . . . . . . . . . . . . . . . . . . . . . . . .197
:FETCh:<measurement>[n]? . . . . . . . . . . . . . . . . . . . . . . . . . . . . . . . . . . . . . . . . . . . . . . . . . . . . . . . .199
:FETCh:ACP[n]?. . . . . . . . . . . . . . . . . . . . . . . . . . . . . . . . . . . . . . . . . . . . . . . . . . . . . . . . . . . . . . . . . .214
8
List of CommandsL
ist of C
om
man
ds
:FETCh:EVM[n]? . . . . . . . . . . . . . . . . . . . . . . . . . . . . . . . . . . . . . . . . . . . . . . . . . . . . . . . . . . . . . . . . 222
:FETCh:SPECtrum[n]?. . . . . . . . . . . . . . . . . . . . . . . . . . . . . . . . . . . . . . . . . . . . . . . . . . . . . . . . . . . . 229
:FETCh:WAVeform[n]? . . . . . . . . . . . . . . . . . . . . . . . . . . . . . . . . . . . . . . . . . . . . . . . . . . . . . . . . . . . . 232
:FORMat:BORDer NORMal|SWAPped . . . . . . . . . . . . . . . . . . . . . . . . . . . . . . . . . . . . . . . . . . . . . . 200
:FORMat:BORDer? . . . . . . . . . . . . . . . . . . . . . . . . . . . . . . . . . . . . . . . . . . . . . . . . . . . . . . . . . . . . . . . 200
:FORMat[:DATA] ASCii|REAL,32|REAL,64. . . . . . . . . . . . . . . . . . . . . . . . . . . . . . . . . . . . . . . . . . 200
:FORMat[:DATA]?. . . . . . . . . . . . . . . . . . . . . . . . . . . . . . . . . . . . . . . . . . . . . . . . . . . . . . . . . . . . . . . . 200
:FORMat[:TRACe][:DATA] ASCii|INTeger,16|INTeger,32|REAL,32|REAL,64|UINTeger,16 . . 200
:FORMat[:TRACe][:DATA] ASCii|REAL[,32] . . . . . . . . . . . . . . . . . . . . . . . . . . . . . . . . . . . . . . . . . 200
:FORMat[:TRACe][:DATA]? . . . . . . . . . . . . . . . . . . . . . . . . . . . . . . . . . . . . . . . . . . . . . . . . . . . . . . . . 200
:FORMat[:TRACe][:DATA]? . . . . . . . . . . . . . . . . . . . . . . . . . . . . . . . . . . . . . . . . . . . . . . . . . . . . . . . . 200
:INITiate:<measurement> . . . . . . . . . . . . . . . . . . . . . . . . . . . . . . . . . . . . . . . . . . . . . . . . . . . . . . . . . 202
:INITiate:ACP . . . . . . . . . . . . . . . . . . . . . . . . . . . . . . . . . . . . . . . . . . . . . . . . . . . . . . . . . . . . . . . . . . . 214
:INITiate:CONTinuous OFF|ON|0|1 . . . . . . . . . . . . . . . . . . . . . . . . . . . . . . . . . . . . . . . . . . . . . . . 202
:INITiate:CONTinuous? . . . . . . . . . . . . . . . . . . . . . . . . . . . . . . . . . . . . . . . . . . . . . . . . . . . . . . . . . . . 202
:INITiate:EVM . . . . . . . . . . . . . . . . . . . . . . . . . . . . . . . . . . . . . . . . . . . . . . . . . . . . . . . . . . . . . . . . . . 222
:INITiate:RESTart . . . . . . . . . . . . . . . . . . . . . . . . . . . . . . . . . . . . . . . . . . . . . . . . . . . . . . . . . . . . . . . 203
:INITiate:SPECtrum. . . . . . . . . . . . . . . . . . . . . . . . . . . . . . . . . . . . . . . . . . . . . . . . . . . . . . . . . . . . . . 229
:INITiate:WAVeform . . . . . . . . . . . . . . . . . . . . . . . . . . . . . . . . . . . . . . . . . . . . . . . . . . . . . . . . . . . . . . 232
:INITiate[:IMMediate] . . . . . . . . . . . . . . . . . . . . . . . . . . . . . . . . . . . . . . . . . . . . . . . . . . . . . . . . . . . . 203
:INSTrument:CATalog? . . . . . . . . . . . . . . . . . . . . . . . . . . . . . . . . . . . . . . . . . . . . . . . . . . . . . . . . . . . 204
:INSTrument:CATalog[:FULL]? . . . . . . . . . . . . . . . . . . . . . . . . . . . . . . . . . . . . . . . . . . . . . . . . . . . . . 204
:INSTrument:NSELect <integer> . . . . . . . . . . . . . . . . . . . . . . . . . . . . . . . . . . . . . . . . . . . . . . . . . . . 204
:INSTrument:NSELect? . . . . . . . . . . . . . . . . . . . . . . . . . . . . . . . . . . . . . . . . . . . . . . . . . . . . . . . . . . . 204
:INSTrument[:SELect] BASIC|SERVICE|CDMA|CDMA2K|GSM|EDGEGSM|IDEN|WIDEN|NADC|PDC|WCDMA|CDMA1XEV . . . . . . . . . . . . . . . . . . . . . . . . . . . . . . . . . . . . . . . . . . . . . . . . . . . . . . . . . . . . 206
:INSTrument[:SELect] SA|PNOISE|BASIC|CDMA|CDMA2K|EDGEGSM|NADC|PDC|WCDMA|CDMA1XEV|NFIGURE|WLAN|TDSCDMA|TDDEMOD|MRECEIVE|EMC|DEMODULATION . . . . . . . . . . . . . . . . . . . . . . . . 206
:INSTrument[:SELect]? . . . . . . . . . . . . . . . . . . . . . . . . . . . . . . . . . . . . . . . . . . . . . . . . . . . . . . . . . . . 206
:MEASure:ACP[n]? . . . . . . . . . . . . . . . . . . . . . . . . . . . . . . . . . . . . . . . . . . . . . . . . . . . . . . . . . . . . . . . 214
9

List of CommandsL
ist
of
Co
mm
and
s
:MEASure:EVM[n]? . . . . . . . . . . . . . . . . . . . . . . . . . . . . . . . . . . . . . . . . . . . . . . . . . . . . . . . . . . . . . . .222
:MEASure:SPECtrum[n]? . . . . . . . . . . . . . . . . . . . . . . . . . . . . . . . . . . . . . . . . . . . . . . . . . . . . . . . . . .229
:MEASure:WAVeform[n]?. . . . . . . . . . . . . . . . . . . . . . . . . . . . . . . . . . . . . . . . . . . . . . . . . . . . . . . . . . .232
:READ:<measurement>[n]?. . . . . . . . . . . . . . . . . . . . . . . . . . . . . . . . . . . . . . . . . . . . . . . . . . . . . . . . .234
:READ:ACP[n]? . . . . . . . . . . . . . . . . . . . . . . . . . . . . . . . . . . . . . . . . . . . . . . . . . . . . . . . . . . . . . . . . . .214
:READ:EVM[n]? . . . . . . . . . . . . . . . . . . . . . . . . . . . . . . . . . . . . . . . . . . . . . . . . . . . . . . . . . . . . . . . . . .222
:READ:SPECtrum[n]? . . . . . . . . . . . . . . . . . . . . . . . . . . . . . . . . . . . . . . . . . . . . . . . . . . . . . . . . . . . . .229
:READ:WAVeform[n]?. . . . . . . . . . . . . . . . . . . . . . . . . . . . . . . . . . . . . . . . . . . . . . . . . . . . . . . . . . . . . .232
:TRIGger[:SEQuence]:AUTO:STATe OFF|ON|0|1 . . . . . . . . . . . . . . . . . . . . . . . . . . . . . . . . . . . . .274
:TRIGger[:SEQuence]:AUTO:STATe? . . . . . . . . . . . . . . . . . . . . . . . . . . . . . . . . . . . . . . . . . . . . . . . . .274
:TRIGger[:SEQuence]:AUTO[:TIME] <time> . . . . . . . . . . . . . . . . . . . . . . . . . . . . . . . . . . . . . . . . . .274
:TRIGger[:SEQuence]:AUTO[:TIME]? . . . . . . . . . . . . . . . . . . . . . . . . . . . . . . . . . . . . . . . . . . . . . . . .274
:TRIGger[:SEQuence]:EXTernal[1]|2:DELay <time> . . . . . . . . . . . . . . . . . . . . . . . . . . . . . . . . . . . .275
:TRIGger[:SEQuence]:EXTernal[1]|2:DELay?. . . . . . . . . . . . . . . . . . . . . . . . . . . . . . . . . . . . . . . . . .275
:TRIGger[:SEQuence]:EXTernal[1]|2:LEVel <voltage> . . . . . . . . . . . . . . . . . . . . . . . . . . . . . . . . . .275
:TRIGger[:SEQuence]:EXTernal[1]|2:LEVel? . . . . . . . . . . . . . . . . . . . . . . . . . . . . . . . . . . . . . . . . . .275
:TRIGger[:SEQuence]:EXTernal[1]|2:SLOPe NEGative|POSitive . . . . . . . . . . . . . . . . . . . . . . . . .275
:TRIGger[:SEQuence]:EXTernal[1]|2:SLOPe?. . . . . . . . . . . . . . . . . . . . . . . . . . . . . . . . . . . . . . . . . .276
:TRIGger[:SEQuence]:FRAMe:ADJust <time> . . . . . . . . . . . . . . . . . . . . . . . . . . . . . . . . . . . . . . . . .276
:TRIGger[:SEQuence]:FRAMe:PERiod <time> . . . . . . . . . . . . . . . . . . . . . . . . . . . . . . . . . . . . . . . . .276
:TRIGger[:SEQuence]:FRAMe:PERiod? . . . . . . . . . . . . . . . . . . . . . . . . . . . . . . . . . . . . . . . . . . . . . . .276
:TRIGger[:SEQuence]:FRAMe:SYNC EXTFront|EXTRear|OFF . . . . . . . . . . . . . . . . . . . . . . . . . .277
:TRIGger[:SEQuence]:FRAMe:SYNC:OFFSet <time> . . . . . . . . . . . . . . . . . . . . . . . . . . . . . . . . . . .277
:TRIGger[:SEQuence]:FRAMe:SYNC:OFFSet? . . . . . . . . . . . . . . . . . . . . . . . . . . . . . . . . . . . . . . . . .277
:TRIGger[:SEQuence]:FRAMe:SYNC? . . . . . . . . . . . . . . . . . . . . . . . . . . . . . . . . . . . . . . . . . . . . . . . .277
:TRIGger[:SEQuence]:HOLDoff <time> . . . . . . . . . . . . . . . . . . . . . . . . . . . . . . . . . . . . . . . . . . . . . . .278
:TRIGger[:SEQuence]:HOLDoff?. . . . . . . . . . . . . . . . . . . . . . . . . . . . . . . . . . . . . . . . . . . . . . . . . . . . .278
:TRIGger[:SEQuence]:IF:DELay <time> . . . . . . . . . . . . . . . . . . . . . . . . . . . . . . . . . . . . . . . . . . . . . .278
:TRIGger[:SEQuence]:IF:DELay? . . . . . . . . . . . . . . . . . . . . . . . . . . . . . . . . . . . . . . . . . . . . . . . . . . . .278
:TRIGger[:SEQuence]:IF:LEVel <ampl>. . . . . . . . . . . . . . . . . . . . . . . . . . . . . . . . . . . . . . . . . . . . . . .278
:TRIGger[:SEQuence]:IF:LEVel?. . . . . . . . . . . . . . . . . . . . . . . . . . . . . . . . . . . . . . . . . . . . . . . . . . . . .278
10
List of CommandsL
ist of C
om
man
ds
:TRIGger[:SEQuence]:IF:SLOPe NEGative|POSitive . . . . . . . . . . . . . . . . . . . . . . . . . . . . . . . . . . . 279
:TRIGger[:SEQuence]:IF:SLOPe? . . . . . . . . . . . . . . . . . . . . . . . . . . . . . . . . . . . . . . . . . . . . . . . . . . . 279
:TRIGger[:SEQuence]:RFBurst:DELay <time> . . . . . . . . . . . . . . . . . . . . . . . . . . . . . . . . . . . . . . . . 279
:TRIGger[:SEQuence]:RFBurst:DELay? . . . . . . . . . . . . . . . . . . . . . . . . . . . . . . . . . . . . . . . . . . . . . . 279
:TRIGger[:SEQuence]:RFBurst:LEVel <rel_power>. . . . . . . . . . . . . . . . . . . . . . . . . . . . . . . . . . . . . 279
:TRIGger[:SEQuence]:RFBurst:LEVel?. . . . . . . . . . . . . . . . . . . . . . . . . . . . . . . . . . . . . . . . . . . . . . . 279
:TRIGger[:SEQuence]:RFBurst:SLOPe NEGative|POSitive . . . . . . . . . . . . . . . . . . . . . . . . . . . . . 280
:TRIGger[:SEQuence]:RFBurst:SLOPe? . . . . . . . . . . . . . . . . . . . . . . . . . . . . . . . . . . . . . . . . . . . . . . 280
[:SENSe]:ACP:AVERage:COUNt <integer> . . . . . . . . . . . . . . . . . . . . . . . . . . . . . . . . . . . . . . . . . . . 235
[:SENSe]:ACP:AVERage:COUNt? . . . . . . . . . . . . . . . . . . . . . . . . . . . . . . . . . . . . . . . . . . . . . . . . . . . 235
[:SENSe]:ACP:AVERage:TCONtrol EXPonential|REPeat . . . . . . . . . . . . . . . . . . . . . . . . . . . . . . . 236
[:SENSe]:ACP:AVERage:TCONtrol? . . . . . . . . . . . . . . . . . . . . . . . . . . . . . . . . . . . . . . . . . . . . . . . . . 236
[:SENSe]:ACP:AVERage[:STATe] OFF|ON|0|1 . . . . . . . . . . . . . . . . . . . . . . . . . . . . . . . . . . . . . . . 235
[:SENSe]:ACP:AVERage[:STATe]? . . . . . . . . . . . . . . . . . . . . . . . . . . . . . . . . . . . . . . . . . . . . . . . . . . . 235
[:SENSe]:ACP:LIST:ALIMit <abs_powr>,<abs_powr>,<abs_powr>,<abs_powr>,<abs_powr> . . . 236
[:SENSe]:ACP:LIST:ALIMit? . . . . . . . . . . . . . . . . . . . . . . . . . . . . . . . . . . . . . . . . . . . . . . . . . . . . . . . 236
[:SENSe]:ACP:LIST:POWer INTeg|PEAK,INTeg|PEAK,INTeg|PEAK,INTeg|PEAK,INTeg|PEAK . . . . . . . . . . . . . . . . . . . . . . . . . . . . . . . . . . . . . . . . . . . . . . . . . 237
[:SENSe]:ACP:LIST:POWer? . . . . . . . . . . . . . . . . . . . . . . . . . . . . . . . . . . . . . . . . . . . . . . . . . . . . . . . 237
[:SENSe]:ACP:LIST:RLIMit <rel_powr>,<rel_powr>,<rel_powr>,<rel_powr>,<rel_powr> . . . . . . 238
[:SENSe]:ACP:LIST:RLIMit? . . . . . . . . . . . . . . . . . . . . . . . . . . . . . . . . . . . . . . . . . . . . . . . . . . . . . . . 238
[:SENSe]:ACP:LIST:STATe OFF|ON|0|1, OFF|ON|0|1, OFF|ON|0|1, OFF|ON|0|1, OFF|ON|0|1 . . . . . . . . . . . . . . . . . . . . . . . . . . . . . . . . . . . . . . . . . . . . . . . . . . . . . . . . . . . . . . . . . . . 238
[:SENSe]:ACP:LIST:STATe?. . . . . . . . . . . . . . . . . . . . . . . . . . . . . . . . . . . . . . . . . . . . . . . . . . . . . . . . 238
[:SENSe]:ACP:LIST:TEST ABSolute|AND|RELative|OR,ABSolute|AND|RELative|OR, ABSolute|AND|RELative|OR,ABSolute|AND|RELative|OR, ABSolute|AND|RELative|OR . . . . . . . . . . . . . . . . . . . . . . . . . . 238
[:SENSe]:ACP:LIST:TEST? . . . . . . . . . . . . . . . . . . . . . . . . . . . . . . . . . . . . . . . . . . . . . . . . . . . . . . . . 238
[:SENSe]:ACP:LIST[:FREQuency] <f_offset>,<f_offset>,<f_offset>,<f_offset>,<f_offset> . . . . . . . 237
[:SENSe]:ACP:LIST[:FREQuency]?. . . . . . . . . . . . . . . . . . . . . . . . . . . . . . . . . . . . . . . . . . . . . . . . . . 237
[:SENSe]:ACP:TRIGger:SOURce EXTernal[1]|EXTernal2|FRAMe|IF|IMMediate|RFBurst . . . . . . . . . . . . . . . . . . . . . . . . . . . . . . . . . . . . . . . . . . . . . . . . . . 239
[:SENSe]:ACP:TRIGger:SOURce? . . . . . . . . . . . . . . . . . . . . . . . . . . . . . . . . . . . . . . . . . . . . . . . . . . . 239
11

List of CommandsL
ist
of
Co
mm
and
s
[:SENSe]:ACP:TYPE PSDRef|TPRef . . . . . . . . . . . . . . . . . . . . . . . . . . . . . . . . . . . . . . . . . . . . . . . . .240
[:SENSe]:ACP:TYPE? . . . . . . . . . . . . . . . . . . . . . . . . . . . . . . . . . . . . . . . . . . . . . . . . . . . . . . . . . . . . .240
[:SENSe]:CHANnel:BURSt TCH|CCH . . . . . . . . . . . . . . . . . . . . . . . . . . . . . . . . . . . . . . . . . . . . . . .241
[:SENSe]:CHANnel:BURSt? . . . . . . . . . . . . . . . . . . . . . . . . . . . . . . . . . . . . . . . . . . . . . . . . . . . . . . . .241
[:SENSe]:CHANnel:SLOT <integer> . . . . . . . . . . . . . . . . . . . . . . . . . . . . . . . . . . . . . . . . . . . . . . . . .241
[:SENSe]:CHANnel:SLOT:AUTO OFF|ON|0|1. . . . . . . . . . . . . . . . . . . . . . . . . . . . . . . . . . . . . . . .241
[:SENSe]:CHANnel:SLOT:AUTO? . . . . . . . . . . . . . . . . . . . . . . . . . . . . . . . . . . . . . . . . . . . . . . . . . . .242
[:SENSe]:CHANnel:SLOT? . . . . . . . . . . . . . . . . . . . . . . . . . . . . . . . . . . . . . . . . . . . . . . . . . . . . . . . . .241
[:SENSe]:CORRection:BS[:RF]:LOSS <rel_power> . . . . . . . . . . . . . . . . . . . . . . . . . . . . . . . . . . . . . .243
[:SENSe]:CORRection:BS[:RF]:LOSS? . . . . . . . . . . . . . . . . . . . . . . . . . . . . . . . . . . . . . . . . . . . . . . . .243
[:SENSe]:CORRection:MS[:RF]:LOSS <rel_power> . . . . . . . . . . . . . . . . . . . . . . . . . . . . . . . . . . . . .243
[:SENSe]:CORRection:MS[:RF]:LOSS? . . . . . . . . . . . . . . . . . . . . . . . . . . . . . . . . . . . . . . . . . . . . . . .243
[:SENSe]:EVM:AVERage:COUNt <integer> . . . . . . . . . . . . . . . . . . . . . . . . . . . . . . . . . . . . . . . . . . .244
[:SENSe]:EVM:AVERage:COUNt? . . . . . . . . . . . . . . . . . . . . . . . . . . . . . . . . . . . . . . . . . . . . . . . . . . .244
[:SENSe]:EVM:AVERage:TCONtrol EXPonential|REPeat . . . . . . . . . . . . . . . . . . . . . . . . . . . . . . .244
[:SENSe]:EVM:AVERage:TCONtrol? . . . . . . . . . . . . . . . . . . . . . . . . . . . . . . . . . . . . . . . . . . . . . . . . .244
[:SENSe]:EVM:AVERage[:STATe] OFF|ON|0|1 . . . . . . . . . . . . . . . . . . . . . . . . . . . . . . . . . . . . . . .244
[:SENSe]:EVM:AVERage[:STATe]? . . . . . . . . . . . . . . . . . . . . . . . . . . . . . . . . . . . . . . . . . . . . . . . . . . .244
[:SENSe]:EVM:BSYNc:SOURce RFAMplitude|SWORd|NONE . . . . . . . . . . . . . . . . . . . . . . . . . . .245
[:SENSe]:EVM:BSYNc:SOURce? . . . . . . . . . . . . . . . . . . . . . . . . . . . . . . . . . . . . . . . . . . . . . . . . . . . .245
[:SENSe]:EVM:TRACe:PPSYmbol <integer>. . . . . . . . . . . . . . . . . . . . . . . . . . . . . . . . . . . . . . . . . . .245
[:SENSe]:EVM:TRACe:PPSYmbol? . . . . . . . . . . . . . . . . . . . . . . . . . . . . . . . . . . . . . . . . . . . . . . . . . .245
[:SENSe]:EVM:TRIGger:SOURce EXTernal[1]|EXTernal2|FRAMe|IF|IMMediate|RFBurst . .245
[:SENSe]:EVM:TRIGger:SOURce? . . . . . . . . . . . . . . . . . . . . . . . . . . . . . . . . . . . . . . . . . . . . . . . . . . .245
[:SENSe]:FEED RF|AREFerence|IFAlign . . . . . . . . . . . . . . . . . . . . . . . . . . . . . . . . . . . . . . . . . . . .247
[:SENSe]:FEED RF|IQ|IONLy|QONLy|AREFerence|IFALign . . . . . . . . . . . . . . . . . . . . . . . . . .247
[:SENSe]:FEED? . . . . . . . . . . . . . . . . . . . . . . . . . . . . . . . . . . . . . . . . . . . . . . . . . . . . . . . . . . . . . . . . .247
[:SENSe]:POWer[:RF]:ATTenuation <rel_power> . . . . . . . . . . . . . . . . . . . . . . . . . . . . . . . . . . . . . . .248
[:SENSe]:POWer[:RF]:ATTenuation? . . . . . . . . . . . . . . . . . . . . . . . . . . . . . . . . . . . . . . . . . . . . . . . . .248
[:SENSe]:POWer[:RF]:RANGe:AUTO OFF|ON|0|1 . . . . . . . . . . . . . . . . . . . . . . . . . . . . . . . . . . . .248
[:SENSe]:POWer[:RF]:RANGe:AUTO? . . . . . . . . . . . . . . . . . . . . . . . . . . . . . . . . . . . . . . . . . . . . . . . .248
12

List of CommandsL
ist of C
om
man
ds
[:SENSe]:POWer[:RF]:RANGe[:UPPer] <power> . . . . . . . . . . . . . . . . . . . . . . . . . . . . . . . . . . . . . . . 248
[:SENSe]:POWer[:RF]:RANGe[:UPPer]? . . . . . . . . . . . . . . . . . . . . . . . . . . . . . . . . . . . . . . . . . . . . . . 248
[:SENSe]:RADio:DEVice BS|MS . . . . . . . . . . . . . . . . . . . . . . . . . . . . . . . . . . . . . . . . . . . . . . . . . . . . 250
[:SENSe]:RADio:DEVice? . . . . . . . . . . . . . . . . . . . . . . . . . . . . . . . . . . . . . . . . . . . . . . . . . . . . . . . . . . 250
[:SENSe]:RADio:TRATe FULL|HALF . . . . . . . . . . . . . . . . . . . . . . . . . . . . . . . . . . . . . . . . . . . . . . . 250
[:SENSe]:RADio:TRATe? . . . . . . . . . . . . . . . . . . . . . . . . . . . . . . . . . . . . . . . . . . . . . . . . . . . . . . . . . . 250
[:SENSe]:SPECtrum:ACQuisition:PACKing AUTO|LONG|MEDium|SHORt . . . . . . . . . . . . . . 251
[:SENSe]:SPECtrum:ACQuisition:PACKing? . . . . . . . . . . . . . . . . . . . . . . . . . . . . . . . . . . . . . . . . . . 251
[:SENSe]:SPECtrum:ADC:DITHer[:STATe] AUTO|ON|OFF|2|1|0 . . . . . . . . . . . . . . . . . . . . . . 251
[:SENSe]:SPECtrum:ADC:DITHer[:STATe]? . . . . . . . . . . . . . . . . . . . . . . . . . . . . . . . . . . . . . . . . . . 251
[:SENSe]:SPECtrum:ADC:RANGe AUTO|APEak|APLock|M6|P0|P6|P12|P18|P24. . . . . . . . . . . . . . . . . . . . . . . . . . . . . . . . . . . . . . . . . . . . . . . . . . . . . . . . 252
[:SENSe]:SPECtrum:ADC:RANGe AUTO|APEak|APLock|NONE|P0|P6|P12|P18 . . . . . . . . . . . . . . . . . . . . . . . . . . . . . . . . . . . . . . . . . . . . . . . . . . . . . . . . . 252
[:SENSe]:SPECtrum:ADC:RANGe?. . . . . . . . . . . . . . . . . . . . . . . . . . . . . . . . . . . . . . . . . . . . . . . . . . 252
[:SENSe]:SPECtrum:AVERage:CLEar . . . . . . . . . . . . . . . . . . . . . . . . . . . . . . . . . . . . . . . . . . . . . . . 253
[:SENSe]:SPECtrum:AVERage:COUNt <integer> . . . . . . . . . . . . . . . . . . . . . . . . . . . . . . . . . . . . . . 253
[:SENSe]:SPECtrum:AVERage:COUNt?. . . . . . . . . . . . . . . . . . . . . . . . . . . . . . . . . . . . . . . . . . . . . . 253
[:SENSe]:SPECtrum:AVERage:TCONtrol EXPonential|REPeat . . . . . . . . . . . . . . . . . . . . . . . . . . 254
[:SENSe]:SPECtrum:AVERage:TCONtrol?. . . . . . . . . . . . . . . . . . . . . . . . . . . . . . . . . . . . . . . . . . . . 254
[:SENSe]:SPECtrum:AVERage:TYPE LOG|MAXimum|MINimum|RMS|SCALar . . . . . . . . . . 254
[:SENSe]:SPECtrum:AVERage:TYPE? . . . . . . . . . . . . . . . . . . . . . . . . . . . . . . . . . . . . . . . . . . . . . . . 254
[:SENSe]:SPECtrum:AVERage[:STATe] OFF|ON|0|1 . . . . . . . . . . . . . . . . . . . . . . . . . . . . . . . . . . 254
[:SENSe]:SPECtrum:AVERage[:STATe]? . . . . . . . . . . . . . . . . . . . . . . . . . . . . . . . . . . . . . . . . . . . . . 254
[:SENSe]:SPECtrum:BANDwidth|BWIDth:IF:AUTO OFF|ON|0|1 . . . . . . . . . . . . . . . . . . . . . . 255
[:SENSe]:SPECtrum:BANDwidth|BWIDth:IF:AUTO? . . . . . . . . . . . . . . . . . . . . . . . . . . . . . . . . . . 255
[:SENSe]:SPECtrum:BANDwidth|BWIDth:IF:FLATness OFF|ON|0|1 . . . . . . . . . . . . . . . . . . . 255
[:SENSe]:SPECtrum:BANDwidth|BWIDth:IF:FLATness?. . . . . . . . . . . . . . . . . . . . . . . . . . . . . . . 255
[:SENSe]:SPECtrum:BANDwidth|BWIDth:PADC OFF|ON|0|1 . . . . . . . . . . . . . . . . . . . . . . . . . 256
[:SENSe]:SPECtrum:BANDwidth|BWIDth:PADC? . . . . . . . . . . . . . . . . . . . . . . . . . . . . . . . . . . . . 256
[:SENSe]:SPECtrum:BANDwidth|BWIDth:PFFT:TYPE FLAT|GAUSsian . . . . . . . . . . . . . . . . . 257
[:SENSe]:SPECtrum:BANDwidth|BWIDth:PFFT:TYPE? . . . . . . . . . . . . . . . . . . . . . . . . . . . . . . . 257
13

List of CommandsL
ist
of
Co
mm
and
s
[:SENSe]:SPECtrum:BANDwidth|BWIDth:PFFT[:SIZE] <freq> . . . . . . . . . . . . . . . . . . . . . . . . . .256
[:SENSe]:SPECtrum:BANDwidth|BWIDth:PFFT[:SIZE]? . . . . . . . . . . . . . . . . . . . . . . . . . . . . . . .256
[:SENSe]:SPECtrum:BANDwidth|BWIDth[:RESolution] <freq> . . . . . . . . . . . . . . . . . . . . . . . . . .257
[:SENSe]:SPECtrum:BANDwidth|BWIDth[:RESolution]:AUTO OFF|ON|0|1 . . . . . . . . . . . . . .258
[:SENSe]:SPECtrum:BANDwidth|BWIDth[:RESolution]:AUTO?. . . . . . . . . . . . . . . . . . . . . . . . . .258
[:SENSe]:SPECtrum:BANDwidth|BWIDth[:RESolution]? . . . . . . . . . . . . . . . . . . . . . . . . . . . . . . .257
[:SENSe]:SPECtrum:DECimate[:FACTor] <integer> . . . . . . . . . . . . . . . . . . . . . . . . . . . . . . . . . . . .258
[:SENSe]:SPECtrum:DECimate[:FACTor]? . . . . . . . . . . . . . . . . . . . . . . . . . . . . . . . . . . . . . . . . . . . .258
[:SENSe]:SPECtrum:FFT:LENGth <integer> . . . . . . . . . . . . . . . . . . . . . . . . . . . . . . . . . . . . . . . . . .259
[:SENSe]:SPECtrum:FFT:LENGth:AUTO OFF|ON|0|1 . . . . . . . . . . . . . . . . . . . . . . . . . . . . . . . .259
[:SENSe]:SPECtrum:FFT:LENGth:AUTO? . . . . . . . . . . . . . . . . . . . . . . . . . . . . . . . . . . . . . . . . . . . .259
[:SENSe]:SPECtrum:FFT:LENGth? . . . . . . . . . . . . . . . . . . . . . . . . . . . . . . . . . . . . . . . . . . . . . . . . . .259
[:SENSe]:SPECtrum:FFT:RBWPoints <real> . . . . . . . . . . . . . . . . . . . . . . . . . . . . . . . . . . . . . . . . . .260
[:SENSe]:SPECtrum:FFT:RBWPoints? . . . . . . . . . . . . . . . . . . . . . . . . . . . . . . . . . . . . . . . . . . . . . . .260
[:SENSe]:SPECtrum:FFT:WINDow:DELay <real> . . . . . . . . . . . . . . . . . . . . . . . . . . . . . . . . . . . . . .260
[:SENSe]:SPECtrum:FFT:WINDow:DELay? . . . . . . . . . . . . . . . . . . . . . . . . . . . . . . . . . . . . . . . . . . .260
[:SENSe]:SPECtrum:FFT:WINDow:LENGth <integer> . . . . . . . . . . . . . . . . . . . . . . . . . . . . . . . . . .261
[:SENSe]:SPECtrum:FFT:WINDow:LENGth? . . . . . . . . . . . . . . . . . . . . . . . . . . . . . . . . . . . . . . . . . .261
[:SENSe]:SPECtrum:FFT:WINDow[:TYPE] BH4Tap|BLACkman|FLATtop|GAUSsian|HAMMing|HANNing|KB70|KB90|KB110|UNIForm. . . . . . . . . . . . . . . . . . . . . . . . . . . . . . . . .261
[:SENSe]:SPECtrum:FFT:WINDow[:TYPE]? . . . . . . . . . . . . . . . . . . . . . . . . . . . . . . . . . . . . . . . . . . .261
[:SENSe]:SPECtrum:FREQuency:SPAN <freq> . . . . . . . . . . . . . . . . . . . . . . . . . . . . . . . . . . . . . . . .262
[:SENSe]:SPECtrum:FREQuency:SPAN? . . . . . . . . . . . . . . . . . . . . . . . . . . . . . . . . . . . . . . . . . . . . .262
[:SENSe]:SPECtrum:SWEep:TIME:AUTO OFF|ON|0|1 . . . . . . . . . . . . . . . . . . . . . . . . . . . . . . . .263
[:SENSe]:SPECtrum:SWEep:TIME:AUTO . . . . . . . . . . . . . . . . . . . . . . . . . . . . . . . . . . . . . . . . . . . .263
[:SENSe]:SPECtrum:SWEep:TIME? . . . . . . . . . . . . . . . . . . . . . . . . . . . . . . . . . . . . . . . . . . . . . . . . .262
[:SENSe]:SPECtrum:SWEep:TIME[:VALue] <time> . . . . . . . . . . . . . . . . . . . . . . . . . . . . . . . . . . . .262
[:SENSe]:SPECtrum:TRIGger:SOURce EXTernal[1]|EXTernal2|FRAMe|IF|LINE|IMMediate|RFBurst. . . . . . . . . . . . . . . . . . . . . . . . . . . . . . . . . . . . . . . . . . . . .263
[:SENSe]:SPECtrum:TRIGger:SOURce? . . . . . . . . . . . . . . . . . . . . . . . . . . . . . . . . . . . . . . . . . . . . . .263
[:SENSe]:SYNC:BURSt:DELay <time> . . . . . . . . . . . . . . . . . . . . . . . . . . . . . . . . . . . . . . . . . . . . . . .265
[:SENSe]:SYNC:BURSt:DELay?. . . . . . . . . . . . . . . . . . . . . . . . . . . . . . . . . . . . . . . . . . . . . . . . . . . . .265
14

List of CommandsL
ist of C
om
man
ds
[:SENSe]:SYNC:STHReshold <rel_power> . . . . . . . . . . . . . . . . . . . . . . . . . . . . . . . . . . . . . . . . . . . . 265
[:SENSe]:SYNC:STHReshold? . . . . . . . . . . . . . . . . . . . . . . . . . . . . . . . . . . . . . . . . . . . . . . . . . . . . . . 265
[:SENSe]:WAVeform:ACQuistion:PACKing AUTO|LONG|MEDium|SHORt . . . . . . . . . . . . . . . 266
[:SENSe]:WAVeform:ACQuistion:PACKing? . . . . . . . . . . . . . . . . . . . . . . . . . . . . . . . . . . . . . . . . . . . 266
[:SENSe]:WAVeform:ADC:DITHer[:STATe] OFF|ON|0|1 . . . . . . . . . . . . . . . . . . . . . . . . . . . . . . . 266
[:SENSe]:WAVeform:ADC:DITHer[:STATe]? . . . . . . . . . . . . . . . . . . . . . . . . . . . . . . . . . . . . . . . . . . . 266
[:SENSe]:WAVeform:ADC:FILTer[:STATe] OFF|ON|0|1 . . . . . . . . . . . . . . . . . . . . . . . . . . . . . . . . 266
[:SENSe]:WAVeform:ADC:FILTer[:STATe]?. . . . . . . . . . . . . . . . . . . . . . . . . . . . . . . . . . . . . . . . . . . . 266
[:SENSe]:WAVeform:ADC:RANGe AUTO|APEak|APLock|GROund|M6|P0|P6|P12|P18|P24. . . . . . . . . . . . . . . . . . . . . . . . . . . . . . . . . . . . . . . . . . . . . . . . . . . . . . . . 267
[:SENSe]:WAVeform:ADC:RANGe AUTO|APEak|APLock|GROund|NONE|P0|P6|P12|P18 . . . . . . . . . . . . . . . . . . . . . . . . . . . . . . . . . . . . . . . . . . . . . . . . . . . . . . . . . 267
[:SENSe]:WAVeform:ADC:RANGe? . . . . . . . . . . . . . . . . . . . . . . . . . . . . . . . . . . . . . . . . . . . . . . . . . . 267
[:SENSe]:WAVeform:APERture? . . . . . . . . . . . . . . . . . . . . . . . . . . . . . . . . . . . . . . . . . . . . . . . . . . . . 268
[:SENSe]:WAVeform:AVERage:COUNt <integer> . . . . . . . . . . . . . . . . . . . . . . . . . . . . . . . . . . . . . . 268
[:SENSe]:WAVeform:AVERage:COUNt? . . . . . . . . . . . . . . . . . . . . . . . . . . . . . . . . . . . . . . . . . . . . . . 268
[:SENSe]:WAVeform:AVERage:TCONtrol EXPonential|REPeat . . . . . . . . . . . . . . . . . . . . . . . . . . 269
[:SENSe]:WAVeform:AVERage:TCONtrol? . . . . . . . . . . . . . . . . . . . . . . . . . . . . . . . . . . . . . . . . . . . . 269
[:SENSe]:WAVeform:AVERage:TYPE LOG|MAXimum|MINimum|RMS|SCALar . . . . . . . . . . . 269
[:SENSe]:WAVeform:AVERage:TYPE?. . . . . . . . . . . . . . . . . . . . . . . . . . . . . . . . . . . . . . . . . . . . . . . . 269
[:SENSe]:WAVeform:AVERage[:STATe] OFF|ON|0|1 . . . . . . . . . . . . . . . . . . . . . . . . . . . . . . . . . . 268
[:SENSe]:WAVeform:AVERage[:STATe]? . . . . . . . . . . . . . . . . . . . . . . . . . . . . . . . . . . . . . . . . . . . . . . 268
[:SENSe]:WAVeform:BANDwidth:RESolution]:ACTual? . . . . . . . . . . . . . . . . . . . . . . . . . . . . . . . . . 270
[:SENSe]:WAVeform:BANDwidth|BWIDth[:RESolution] <freq> . . . . . . . . . . . . . . . . . . . . . . . . . . 270
[:SENSe]:WAVeform:BANDwidth|BWIDth[:RESolution]:TYPE FLATtop|GAUSsian . . . . . . . . . 271
[:SENSe]:WAVeform:BANDwidth|BWIDth[:RESolution]:TYPE? . . . . . . . . . . . . . . . . . . . . . . . . . . 271
[:SENSe]:WAVeform:BANDwidth|BWIDth[:RESolution]? . . . . . . . . . . . . . . . . . . . . . . . . . . . . . . . 270
[:SENSe]:WAVeform:DECimate:STATe OFF|ON|0|1. . . . . . . . . . . . . . . . . . . . . . . . . . . . . . . . . . . 272
[:SENSe]:WAVeform:DECimate:STATe? . . . . . . . . . . . . . . . . . . . . . . . . . . . . . . . . . . . . . . . . . . . . . . 272
[:SENSe]:WAVeform:DECimate[:FACTor] <integer> . . . . . . . . . . . . . . . . . . . . . . . . . . . . . . . . . . . . 271
[:SENSe]:WAVeform:DECimate[:FACTor]? . . . . . . . . . . . . . . . . . . . . . . . . . . . . . . . . . . . . . . . . . . . . 271
[:SENSe]:WAVeform:SWEep:TIME <time>. . . . . . . . . . . . . . . . . . . . . . . . . . . . . . . . . . . . . . . . . . . . 272
15
List of CommandsL
ist
of
Co
mm
and
s
[:SENSe]:WAVeform:SWEep:TIME? . . . . . . . . . . . . . . . . . . . . . . . . . . . . . . . . . . . . . . . . . . . . . . . . . .272
[:SENSe]:WAVeform:TRIGger:SOURce EXTernal[1]|EXTernal2|FRAMe|IF|IMMediate|LINE|RFBurst. . . . . . . . . . . . . . . . . . . . . . . . . . . . . . . . . . . .272
[:SENSe]:WAVeform:TRIGger:SOURce? . . . . . . . . . . . . . . . . . . . . . . . . . . . . . . . . . . . . . . . . . . . . . . .272
16

Intro
du
ction
to N
AD
C an
d P
DC
1 Introduction to NADC and PDC
This chapter provides overall information on the NADC and PDC communications systems Option BAE and describes NADC and PDC measurements made by the analyzer. Installation instructions for adding this option to your analyzer are provided in this section, in case you purchased this option separately.
17

Introduction to NADC and PDCWhat does the Agilent PSA Series and VSA E4406A Option BAE do?
Intr
od
uct
ion
to
NA
DC
an
d P
DC
What does the Agilent PSA Series and VSA E4406A Option BAE do?This instrument can help determine if an NADC or PDC transmitter operates correctly. When configured for NADC, the instrument can be used to test an NADC transmitter according to the TIA/EIA standards, 627, 628, 629, IS-136, IS-137, and IS-138. When configured for PDC, the instrument can be used to test a PDC transmitter according to the Research and Development Center for Radio Systems (RCR) document, RCR STD-27F or RCR STD-27G.
This document defines complex and multiple-part measurements used to maintain an interference-free environment. For example, the document includes the testing method for carrier power. For NADC testing, the instrument automatically makes measurements based on the TIA/EIA standards. For PDC testing, the instrument automatically makes measurements based on the RCR standard. The detailed measurement result displays allow you to analyze NADC and PDC system performance. You may alter the measuring parameters for your specific measurement and analysis.
18 Chapter 1

Introduction to NADC and PDCInstalling Optional Measurement Personalities
Intro
du
ction
to N
AD
C an
d P
DC
Installing Optional Measurement PersonalitiesWhen you install a measurement personality, you need to follow a three step process:
1. Determine whether your memory capacity is sufficient to contain all the options you want to load. If not, decide which options you want to install now, and consider upgrading your memory. Details follow in “Do You Have Enough Memory to Load All Your Personality Options?” on page 19.
2. Install the measurement personality firmware into the instrument memory. Details follow in “Loading an Optional Measurement Personality” on page 23.
3. Enter a license key that activates the measurement personality. Details follow in “Obtaining and Installing a License Key” on page 24.
Adding measurement personalities requires the purchase of an upgrade kit for the desired option. The upgrade kit contains the measurement personality firmware and an entitlement certificate that is used to generate a license key from the internet website. A separate license key is required for each option on a specific instrument serial number and host ID.
For the latest information on Agilent Spectrum Analyzer options and upgrade kits, visit the following web location:
http://www.agilent.com/find/sa_upgrades
Do You Have Enough Memory to Load All Your Personality Options?
If you do not have memory limitations then you can skip ahead to the next section “Loading an Optional Measurement Personality” on page 23. If after installing your options you get error messages relating to memory issues, you can return to this section to learn more about how to optimize your configuration.
If you have 64 MBytes of memory installed in your instrument, you should have enough memory to install at least four optional personalities, with plenty of memory for data and states.
The optional measurement personalities require different amounts of memory. So the number of personalities that you can load varies. This is also impacted by how much data you need to save. If you are having memory errors you must swap the applications in or out of memory as needed. If you only have 48 MBytes of memory, you can upgrade your
Chapter 1 19
Introduction to NADC and PDCInstalling Optional Measurement Personalities
Intr
od
uct
ion
to
NA
DC
an
d P
DC
hardware to 64 MBytes.
Additional memory can be added to any PSA Series analyzer by installing Option 115. With this option installed, you can install all currently available measurement personalities in your analyzer and still have memory space to store more state and trace files than would otherwise be possible.
To see the size of your installed memory for PSA Series Spectrum Analyzers:
1. Ensure that the spectrum analyzer is in spectrum analyzer mode because this can affect the screen size.
2. Press System, More, Show Hdwr.
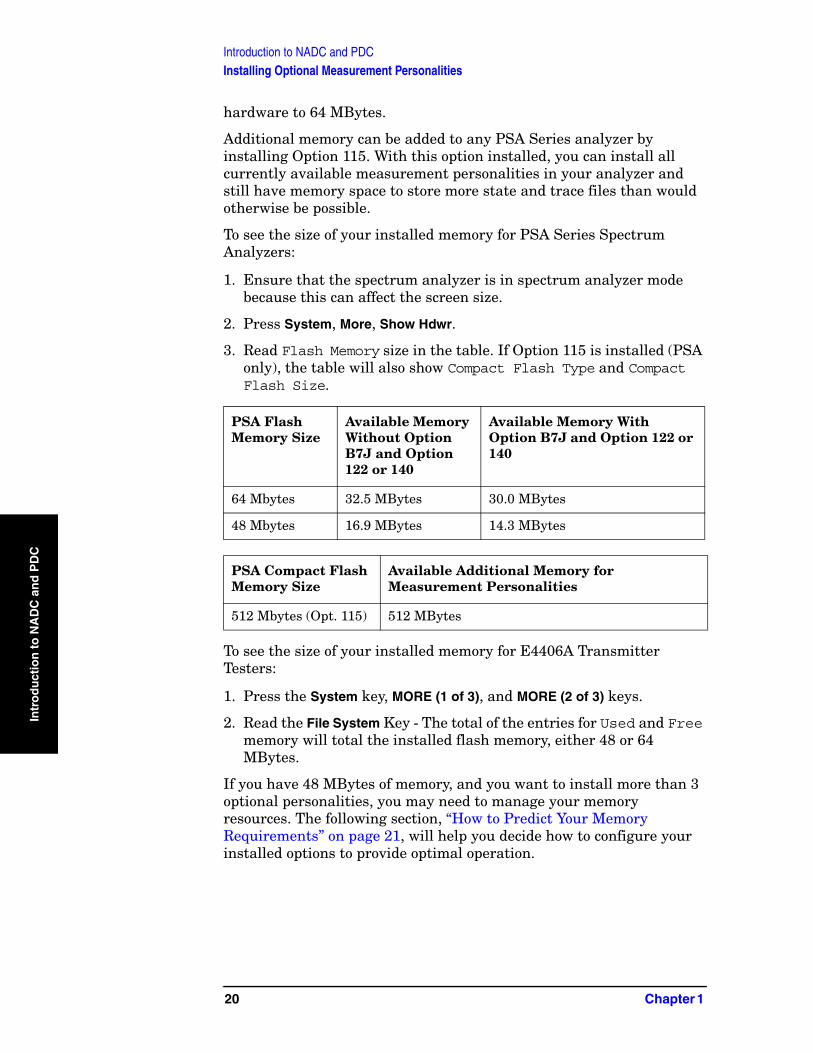
3. Read Flash Memory size in the table. If Option 115 is installed (PSA only), the table will also show Compact Flash Type and Compact Flash Size.
To see the size of your installed memory for E4406A Transmitter Testers:
1. Press the System key, MORE (1 of 3), and MORE (2 of 3) keys.
2. Read the File System Key - The total of the entries for Used and Free memory will total the installed flash memory, either 48 or 64 MBytes.
If you have 48 MBytes of memory, and you want to install more than 3 optional personalities, you may need to manage your memory resources. The following section, “How to Predict Your Memory Requirements” on page 21, will help you decide how to configure your installed options to provide optimal operation.
PSA Flash Memory Size
Available Memory Without Option B7J and Option 122 or 140
Available Memory With Option B7J and Option 122 or 140
64 Mbytes 32.5 MBytes 30.0 MBytes
48 Mbytes 16.9 MBytes 14.3 MBytes
PSA Compact Flash Memory Size
Available Additional Memory for Measurement Personalities
512 Mbytes (Opt. 115) 512 MBytes
20 Chapter 1

Introduction to NADC and PDCInstalling Optional Measurement Personalities
Intro
du
ction
to N
AD
C an
d P
DC
How to Predict Your Memory Requirements
If you plan to install many optional personalities, you should review your memory requirements, so you can determine whether you have enough memory (unless you have a PSA Series with Option 115). There is an Agilent “Memory Calculator” available online that can help you do this, or you can make a calculated approximation using the information that follows. You will need to know your instrument’s installed memory size as determined in the previous section and then select your desired applications.
NOTE If you have a PSA Series analyzer with Option 115, there is adequate memory to install all of the available optional personalities in your instrument.
To calculate the available memory on your E4406, see: http://sa.tm.agilent.com/E4406A/memory/
To calculate the available memory on your PSA, see: http://sa.tm.agilent.com/PSA/memory/
Select the “Memory Calculator” link. You can try any combination of available personalities to see if your desired configuration is compatible with your installed memory.
NOTE For PSA: After loading all your optional measurement personalities, you should have a reserve of ~2 MBytes memory to facilitate mode switching. Less available memory will increase mode switching time. For example, if you employ excessive free memory by saving files of states and/or data, your mode switching time can increase to more than a minute.
You can manually estimate your total memory requirements by adding up the memory allocations described in the following steps. Compare the desired total with the available memory that you identified in the previous section.
1. Program memory - Select option requirements from the table “Measurement Personality Options and Memory Required” on page 22.
2. For PSA only: shared libraries require 7.72 MBytes3. For PSA only: recommended mode swap space is 2 MBytes4. Screens - .gif files need 20-25 kBytes each5. State memory - State file sizes range from 21 kB for SA mode to
40 kB for W-CDMA. The state of every mode accessed since power-on will be saved in the state file. File sizes can exceed 150 kB each when several modes are accessed, for each state file saved.
TIP State memory retains settings for all states accessed before the Save State command. To reduce this usage to a minimum, reduce the modes accessed before the Save State is executed. You can set the PSA to boot into a selected mode by accessing the desired mode, then pressing the System, Power On/Preset, Power On keys and toggle the setting to Last.
Chapter 1 21
Introduction to NADC and PDCInstalling Optional Measurement Personalities
Intr
od
uct
ion
to
NA
DC
an
d P
DC
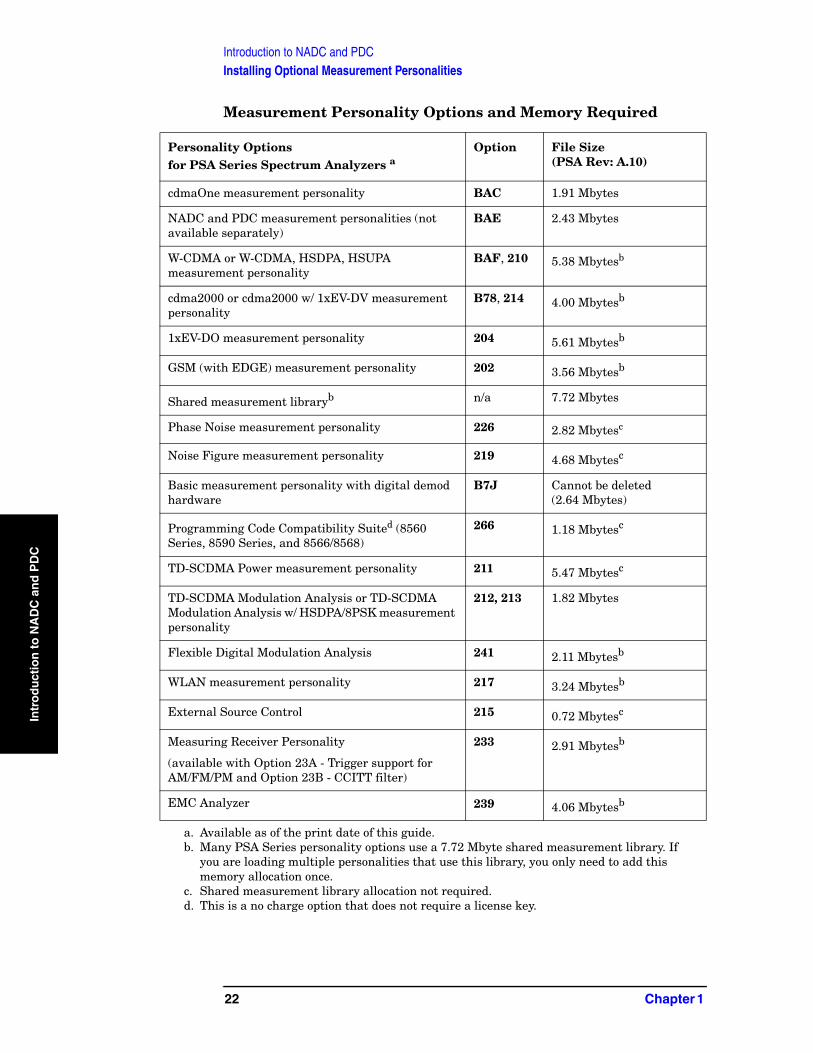
Measurement Personality Options and Memory Required
Personality Options for PSA Series Spectrum Analyzers a
Option File Size (PSA Rev: A.10)
cdmaOne measurement personality BAC 1.91 Mbytes
NADC and PDC measurement personalities (not available separately)
BAE 2.43 Mbytes
W-CDMA or W-CDMA, HSDPA, HSUPA measurement personality
BAF, 210 5.38 Mbytesb
cdma2000 or cdma2000 w/ 1xEV-DV measurement personality
B78, 214 4.00 Mbytesb
1xEV-DO measurement personality 204 5.61 Mbytesb
GSM (with EDGE) measurement personality 202 3.56 Mbytesb
Shared measurement libraryb n/a 7.72 Mbytes
Phase Noise measurement personality 226 2.82 Mbytesc
Noise Figure measurement personality 219 4.68 Mbytesc
Basic measurement personality with digital demod hardware
B7J Cannot be deleted(2.64 Mbytes)
Programming Code Compatibility Suited (8560 Series, 8590 Series, and 8566/8568)
266 1.18 Mbytesc
TD-SCDMA Power measurement personality 211 5.47 Mbytesc
TD-SCDMA Modulation Analysis or TD-SCDMA Modulation Analysis w/ HSDPA/8PSK measurement personality
212, 213 1.82 Mbytes
Flexible Digital Modulation Analysis 241 2.11 Mbytesb
WLAN measurement personality 217 3.24 Mbytesb
External Source Control 215 0.72 Mbytesc
Measuring Receiver Personality
(available with Option 23A - Trigger support for AM/FM/PM and Option 23B - CCITT filter)
233 2.91 Mbytesb
EMC Analyzer 239 4.06 Mbytesb
a. Available as of the print date of this guide.b. Many PSA Series personality options use a 7.72 Mbyte shared measurement library. If
you are loading multiple personalities that use this library, you only need to add this memory allocation once.
c. Shared measurement library allocation not required.d. This is a no charge option that does not require a license key.
22 Chapter 1

Introduction to NADC and PDCInstalling Optional Measurement Personalities
Intro
du
ction
to N
AD
C an
d P
DC
Memory Upgrade Kits
The PSA 64 MByte Memory Upgrade kit part number is E4440AU-ANE. The PSA Compact Flash Upgrade kit part number is E4440AU-115. The VSA 64 MByte Memory Upgrade kit part number is E4406AU-ANE.
For more information about memory upgrade kits contact your local sales office, service office, or see:http://www.agilent.com/find/sa_upgrades
Loading an Optional Measurement Personality
You must use a PC to load the desired personality option into the instrument memory. Loading can be done from a firmware CD-ROM or by downloading the update program from the internet. An automatic loading program comes with the files and runs from your PC.
You can check the Agilent internet website for the latest PSA firmware versions available for downloading:
http://www.agilent.com/find/psa_firmware
Personality Optionsfor E4406A Transmitter Tester a
Option File Size (E4406A Rev: A.10)
cdmaOne measurement personality BAC 1.82 Mbytes
NADC measurement personality BAE 1.10 Mbytes
PDC measurement personality BAE 1.23 Mbytes
W-CDMA or W-CDMA, HSDPA, HSUPA measurement personality
BAF, 210 5.00 Mbytes
cdma2000 or cdma2000 w/ 1xEV-DV measurement personality
B78, 214 3.88 Mbytes
1xEV-DO measurement personality 204 4.84 Mbytes
GSM (with EDGE) measurement personality
202 3.56 Mbytes
GSM measurement personality BAH 2.51 Mbytes
EDGE upgrade from BAH measurement personality
252 (202) 3.56 Mbytes
iDEN measurement personality HN1 2.10 Mbytes
WiDEN measurement personality HN1 1.58 Mbytes
Baseband I/Q Inputs B7C n/a (hardware only)
a. Available as of the print date of this guide.
Chapter 1 23

Introduction to NADC and PDCInstalling Optional Measurement Personalities
Intr
od
uct
ion
to
NA
DC
an
d P
DC
You can check the Agilent internet website for the latest E4406 firmware versions available for downloading:
http://www.agilent.com/find/e4406a_firmware
NOTE When you add a new option, or update an existing option, you will get the updated versions of all your current options as they are all reloaded simultaneously. This process may also require you to update the instrument core firmware so that it is compatible with the new option.
Depending on your installed hardware memory, you may not be able to fit all of the available measurement personalities in instrument memory at the same time. You may need to delete an existing option file from memory and load the one you want. Use the automatic update program that is provided with the files. Refer to the table showing “Measurement Personality Options and Memory Required” on page 22. The approximate memory requirements for the options are listed in this table. These numbers are worst case examples. Some options share components and libraries, therefore the total memory usage of multiple options may not be exactly equal to the combined total.
Obtaining and Installing a License Key
If you purchase an optional personality that requires installation, you will receive an “Entitlement Certificate” which may be redeemed for a license key specific to one instrument. Follow the instructions that accompany the certificate to obtain your license key.
To install a license key for the selected personality option, use the following procedure:
NOTE You can also use this procedure to reinstall a license key that has been deleted during an uninstall process, or lost due to a memory failure.
For PSA:
1. Press System, More, More, Licensing, Option to accesses the alpha editor. Use this alpha editor to enter letters (upper-case), and the front-panel numeric keys to enter numbers for the option designation. You will validate your option entry in the active function area of the display. Then, press the Enter key.
2. Press License Key to enter the letters and digits of your license key. You will validate your license key entry in the active function area of the display. Then, press the Enter key.
3. Press the Activate License key.
For E4406:
1. Press System, More, More, Install, Choose Option to accesses the alpha editor. Use this alpha editor to enter letters (upper-case), and the
24 Chapter 1

Introduction to NADC and PDCInstalling Optional Measurement Personalities
Intro
du
ction
to N
AD
C an
d P
DC
front-panel numeric keys to enter numbers for the option designation. You will validate your option entry in the active function area of the display. Then, press the Done key.
NOTE Before you enter the license key for the EDGE Retrofit Option 252, you must already have entered the license key for the GSM Option BAH.
2. Press License Key to enter the letters and digits of your license key. You will validate your license key entry in the active function area of the display. Then, press the Done key.
3. Press the Install Now key. The message “New option keys become active after reboot.” will appear, along with the Yes/No menu: press the Yes key and cycle the instrument power off and then on to complete your installation process, or press the No key to cancel the installation process.
Viewing a License Key
Measurement personalities purchased with your instrument have been installed and activated at the factory before shipment. The instrument requires a License Key unique to every measurement personality purchased. The license key is a hexadecimal number specific to your measurement personality, instrument serial number and host ID. It enables you to install, or reactivate that particular personality.
Use the following procedure to display the license key unique to your personality option that is already installed in your PSA:
Press System, More, More, Licensing, Show License. The System, Personality key displays the personalities loaded, version information, and whether the personality is licensed.
Use the following procedure to display the license key unique to your personality option that is already installed in your E4406:
Press System, More, More, Install, Choose Option to enter the letters and numbers for the option you want. You can see the key on the License Key menu key. Press the Done key.
NOTE You will want to keep a copy of your license key in a secure location. Press System, More, then Licensing, Show License Show System, and print out a copy of the display that shows the license numbers. If you should lose your license key, call your nearest Agilent Technologies service or sales office for assistance.
Chapter 1 25

Introduction to NADC and PDCInstalling Optional Measurement Personalities
Intr
od
uct
ion
to
NA
DC
an
d P
DC
Using the Delete License Key on PSA
This key will make the option unavailable for use, but will not delete it from memory. Write down the 12-digit license key for the option before you delete it. If you want to use that measurement personality later, you will need the license key to reactivate the personality firmware.
NOTE Using the Delete License key does not remove the personality from the instrument memory, and does not free memory to be available to install another option. If you need to free memory to install another option, refer to the instructions for loading firmware updates located at the URL : http://www.agilent.com/find/psa/
1. Press System, More, More, Licensing, Option. Pressing the Option key will activate the alpha editor menu. Use the alpha editor to enter the letters (upper-case) and the front-panel numeric keyboard to enter the digits (if required) for the option, then press the Enter key. As you enter the option, you will see your entry in the active function area of the display.
2. Press Delete License to remove the license key from memory.
Using the Uninstall Key on E4406A
This key will make the option unavailable for use, but will not delete it from memory. The message “Application Not Licensed” will appear in the Status/Info bar at the bottom of the display. Record the 12-digit license key for the option before you delete it. If you want to use that measurement personality later, you will need the license key to reactivate the personality firmware.
NOTE Using the Uninstall key does not remove the personality firmware from the instrument memory, and does not free memory to be available to install another option. If you need to free memory to install another option, refer to the instructions for loading firmware updates available at the URL: http://www.agilent.com/find/vsa/
1. Press System, More(1 of 3), More(2 of 3), Uninstall, Choose Option to access the alpha editor. Use this alpha editor to enter the letters (upper-case), and the front-panel numeric keys to enter the numbers (if required) for the installed option. You will validate your option entry in the active function area of the display. Then, press the Done key.
26 Chapter 1

Introduction to NADC and PDCInstalling Optional Measurement Personalities
Intro
du
ction
to N
AD
C an
d P
DC
2. Pressing the Uninstall Now key will activate the Yes/No menu: press the Yes key to continue your uninstall process, or press the No key to cancel the uninstall process.
3. Cycle the instrument power off and then on to complete the uninstall process.
Ordering Optional Measurement Personalities
When you order a personality option, you will receive an entitlement certificate. Then you will need to go to the Web site to redeem your entitlement certificate for a license key. You will need to provide your instrument serial number and host ID, and the entitlement certificate number.
Required Information: Front Panel Key Path:
Model #: (Ex. E4440A)
Host ID:__________________
System, Show System
Instrument Serial Number:__________________
System, Show System
Chapter 1 27

Introduction to NADC and PDCInstalling Optional Measurement Personalities
Intr
od
uct
ion
to
NA
DC
an
d P
DC
28 Chapter 1

Makin
g N
AD
C M
easurem
ents
2 Making NADC Measurements
This chapter describes procedures used for making measurements of NADC BS or MS. Instructions to help you set up and perform the measurements are provided, and examples of NADC measurement results are shown.
29

Making NADC MeasurementsNADC and PDC Measurements
Mak
ing
NA
DC
Mea
sure
men
ts
NADC and PDC MeasurementsOnce in the NADC or PDC mode the following measurements are available by pressing the Measure key.
• “Adjacent Channel Power (ACP) Measurements” on page 33
• “Error Vector Magnitude (EVM) Measurements” on page 39
• “Occupied Bandwidth Measurement” on page 45 (PDC Only)
• “Spectrum (Frequency Domain) Measurements” on page 48
• “Waveform (Time Domain) Measurements” on page 63
These are referred to as one-button measurements. When you press the key to select a measurement, it will become active using settings and a display unique to that measurement. Data acquisitions will automatically begin when trigger requirements, if any, are met.
30 Chapter 2

Making NADC MeasurementsSetting up and Making a Measurement
Makin
g N
AD
C M
easurem
ents
Setting up and Making a Measurement
Making the Initial Signal Connection
CAUTION Before connecting a signal to the instrument, make sure the instrument can safely accept the signal level provided. The signal level limits are marked next to the connectors on the front panel.
See “Input Key Menu” for details on selecting input ports and setting internal attenuation to prevent overloading the instrument.
For PSA only: The “Input Key Menu” also provides details of the internal preamplifier (Int Preamp) operation.
Using Instrument Mode and Measurement Presets
If you want to set your current measurement personality to a known, factory default state, press Preset. This initializes the instrument by returning the mode setup and all of the measurement setups in the mode to the factory default parameters.
NOTE For PSA, note that pressing the Preset key will switch instrument modes unless the type of preset is selected under System, Power On/Preset is set to Mode or Save User Preset.
To preset only the parameters that are specific to an active, selected measurement, press Meas Setup, then Restore Meas Defaults. Restore Meas Defaults will return all the measurement setup parameters to the factory defaults, but only for the currently selected measurement. The Restore Meas Defaults key may not appear on the first page of the Meas Setup menu. If not, press More until the key is available.
Chapter 2 31

Making NADC MeasurementsSetting up and Making a Measurement
Mak
ing
NA
DC
Mea
sure
men
ts
The 3 Steps to Set Up and Make Measurements
All measurements need to be set up in 3 steps: first at the Mode level, second at the Measurement level, then finally the result display may be adjusted.
1. Select and Set Up the Mode
Press MODE - All licensed, installed Modes available are shown. Press NADC, PDC, or select Basic mode to make measurements of signals with non-standard formats.
Press Mode Setup - Make any required adjustments to the mode settings. These settings apply to all measurement in the mode.
2. Select and Set Up the Measurement
Press MEASURE - Select a specific measurement to be performed (for example. ACP, Spectrum or Waveform). The measurement begins as soon as any required trigger conditions are met. The resulting data is shown on the display or is available for export.
Press Meas Setup - Make any adjustments as required to the selected measurement settings. The settings only apply to this measurement.
3. Select and Set Up a View of the Results
Press Trace/View - Select a display format for the current measurement data. Depending on the mode and measurement selected, other graphical and tabular data presentations may be available. X-Scale and Y-Scale adjustments may also be made now.
NOTE A setting may be reset at any time, and will be in effect on the next measurement cycle or View.
Step Primary Key Setup Keys Related Keys
1. Select & set up a Mode
MODE Mode Setup,Input (E4406A),Input/Output (PSA),FREQUENCY Channel
System
2. Select & set up a Measurement
MEASURE Meas Setup Meas Control, Restart
3. Select & set up a View of the Results
View/Trace (E4406A),Trace/View (PSA)
SPAN X Scale, AMPLITUDE Y Scale, Display, Next Window, Zoom
File, Save, Print, Print Setup, Marker, Search (E4406A), Peak Search (PSA)
32 Chapter 2

Making NADC MeasurementsAdjacent Channel Power (ACP) Measurements
Makin
g N
AD
C M
easurem
ents
Adjacent Channel Power (ACP) MeasurementsThis section explains how to make an adjacent channel power (ACP) measurement on an NADC or PDC mobile station. ACP is a measurement of the amount of interference, or power, in an adjacent frequency channel. The results are displayed as a bar graph or as spectrum data, along with measurement data at specified offset.
Configuring the Measurement System
The mobile station (MS) under test has to be set to transmit the RF power remotely through the system controller. This transmitting signal is connected to the instruments RF input port. Connect the equipment as shown.
Figure 2-1 Adjacent Channel Power Ratio Measurement System
1. Using the appropriate cables, adapters, and circulator, connect the output signal from the MS to the RF input port of the instrument.
2. Connect the base transmission station simulator or signal generator to the MS through a circulator to initiate a link constructed with the sync and pilot channels, if required.
3. Connect a BNC cable between the 10 MHz OUT port of the signal generator and the EXT REF IN port of the instrument.
4. Connect the system controller to the MS through the serial bus cable to control the MS operation.
Setting the MS
From the base transmission station simulator and the system
Chapter 2 33

Making NADC MeasurementsAdjacent Channel Power (ACP) Measurements
Mak
ing
NA
DC
Mea
sure
men
ts
controller, set up a call using loopback mode to transmit the RF power.
Measurement Procedure
Step 1. Press the Preset key to preset the instrument. The settings will default to IS-95 standards.
Step 2. Press MODE, then NADC or PDC to enable the NADC or PDC Mode measurements.
Step 3. Press the Mode Setup, Radio, Device keys and select MS.
Step 4. To use settings different than for an IS-95 signal, press the Meas Setup, Offsets, and Limits keys and select settings for your signal of interest. For more information see “Adjacent Channel Power Keys” on page 100.
Step 5. To set the measurement center frequency press the FREQUENCY Channel key, enter a numerical frequency using the front-panel keypad, and complete the entry by selecting a units key, like MHz. Depending on the measurement selected, you may have other keys available to select a channel or slot. For more information see “FREQUENCY Channel Key Menu” on page 94.
Step 6. Press the MEASURE, ACP keys to initiate the adjacent channel leakage power ratio measurement.
The following figure shows an example result of ACP(Total Pwr Ref) measurements in the bar graph window. The absolute and relative power levels on both sides of the carrier frequency are displayed in the graphic window and text window.
34 Chapter 2
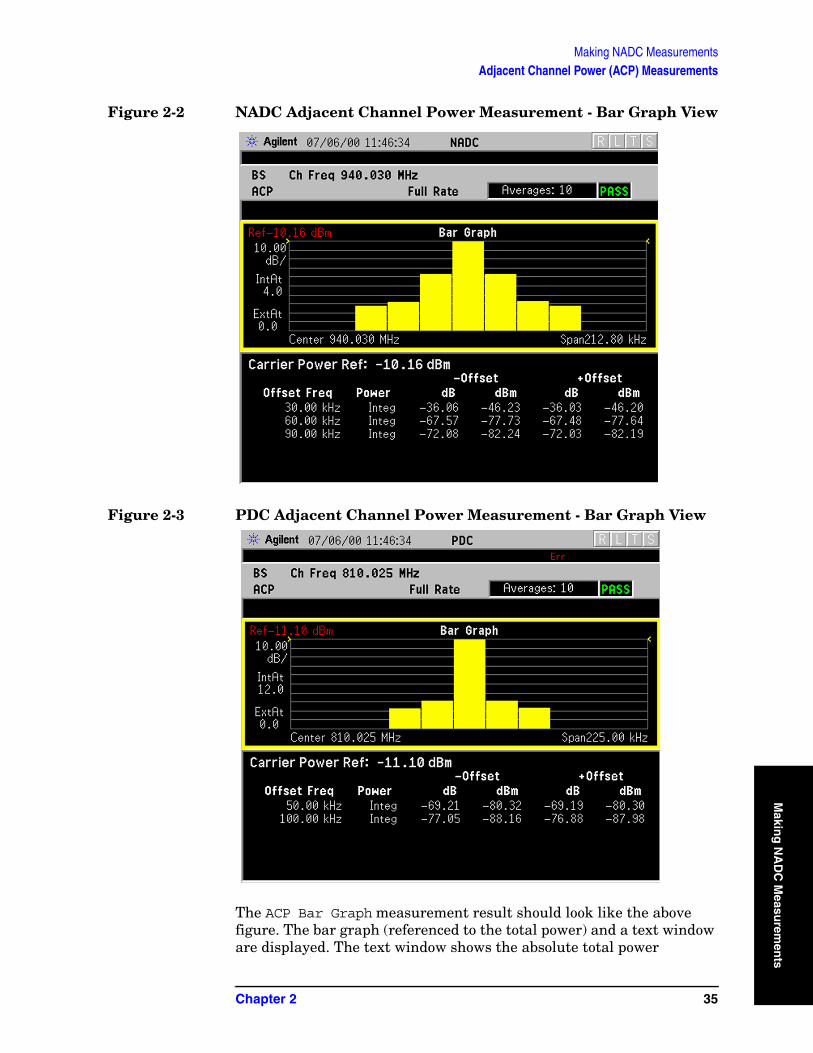
Making NADC MeasurementsAdjacent Channel Power (ACP) Measurements
Makin
g N
AD
C M
easurem
ents
Figure 2-2 NADC Adjacent Channel Power Measurement - Bar Graph View
Figure 2-3 PDC Adjacent Channel Power Measurement - Bar Graph View
The ACP Bar Graph measurement result should look like the above figure. The bar graph (referenced to the total power) and a text window are displayed. The text window shows the absolute total power
Chapter 2 35

Making NADC MeasurementsAdjacent Channel Power (ACP) Measurements
Mak
ing
NA
DC
Mea
sure
men
ts
reference, while the lower and upper offset channel power levels are displayed in both absolute and relative readings.
In the factory default condition, 5 of the total integration power levels, centered at the carrier frequency and and offset frequencies, are shown in the default result display. The corresponding measured data is shown in the text window. Depending on the Meas Type selection, one of the two following displays is obtained:
Bar Graph (Total Pwr Ref) - A histogram of powers referenced to the total power
Bar Graph (PSD Ref) - A histogram of powers referenced to the mean power spectral density of the carrier in dBm/Hz
Step 7. Press the View/Trace, Spectrum keys to see the ACP Spectrum graph view with the bandwidth marker lines in the graph window. In the factory default condition, the frequency spectrum with the FFT sweep type is displayed with the bandwidth marker lines in the graph window. The corresponding measured data in the text window is the total integration power levels, in dBc and dBm, within the defined bandwidth as shown in the figure below.
Figure 2-4 NADC Adjacent Channel Power Measurement - Spectrum View
36 Chapter 2

Making NADC MeasurementsAdjacent Channel Power (ACP) Measurements
Makin
g N
AD
C M
easurem
ents
Figure 2-5 PDC Adjacent Channel Power Measurement - Spectrum View
Step 8. If desired, select a Meas Type setting. Depending on the Meas Type setting, one of the two following displays is obtained:
Spectrum (Total Pwr Ref) - A spectrum display referenced to the total power
Spectrum (PSD Ref) - A spectrum display referenced to the mean power spectral density of the carrier in dBm/Hz
If Sweep Type is set to Swp, the swept frequency ACPR is displayed as shown below and only Spectrum is available for View/Trace.
While in this view, you can change the vertical scale by pressing the AMPLITUDE Y Scale key.
Troubleshooting Hints
The adjacent channel power ratio measurement can reveal degraded or defective parts in the transmitter section of the UUT. The following examples are some areas which can contribute to poor ACPR:
• DC power supply control of the transmitter power amplifier, RF power control of the pre-power amplifier stage, I/Q control of the baseband stage, or both.
• Gain and output power levels of the power amplifier, caused by degraded gain control, increased distortion, or both.
Chapter 2 37

Making NADC MeasurementsAdjacent Channel Power (ACP) Measurements
Mak
ing
NA
DC
Mea
sure
men
ts
• Amplifier linearity.
Power amplifiers are one of the final stage elements of a base or mobile transmitter and are a critical part of meeting the important power and spectral efficiency specifications. Since ACPR measures the spectral response of the amplifier to a complex wideband signal, it is a key measurement linking amplifier linearity and other performance characteristics to the stringent system specifications.
NOTE If an external attenuator is used, be sure to use the Ext RF Atten key to include the attenuation value in the displayed measurement result.
For more information on ACP measurements see “Adjacent Channel Power Keys” on page 100
If you have a problem, and get an error message, see “Understanding Common Measurement Errors” on page 83.
38 Chapter 2

Making NADC MeasurementsError Vector Magnitude (EVM) Measurements
Makin
g N
AD
C M
easurem
ents
Error Vector Magnitude (EVM) MeasurementsThis section explains how to make an Error Vector Magnitude (EVM) measurement on a NADC or PDC mobile station. EVM is a measurement of the amount of phase and frequency errors in a modulated signal, as compared with a perfectly modulated signal. The results are displayed as a polar graph of the symbol state constellation, or as graphs of individual eror parameters, along with summary measurement data.
Configuring the Measurement System
The mobile station (MS) under test has to be set to transmit the RF power remotely through the system controller. This transmitting signal is connected to the instruments RF input port. Connect the equipment as shown.
Figure 2-6 Error Vector Magnitude Measurement System
1. Using the appropriate cables, adapters, and circulator, connect the output signal from the MS to the RF input port of the instrument.
2. Connect the base transmission station simulator or signal generator to the MS through a circulator to initiate a link constructed with the sync and pilot channels, if required.
3. Connect a BNC cable between the 10 MHz OUT port of the signal generator and the EXT REF IN port of the instrument.
4. Connect the system controller to the MS through the serial bus cable to control the MS operation.
Chapter 2 39

Making NADC MeasurementsError Vector Magnitude (EVM) Measurements
Mak
ing
NA
DC
Mea
sure
men
ts
Setting the MS
From the base transmission station simulator (signal generator) and the system controller, set up a call using loopback mode to transmit the RF power.
Measurement Procedure
Step 1. Press the Preset key to preset the instrument. The settings will default to NADC or PDC standards.
Step 2. Press MODE, then NADC or PDC to enable the NADC or PDC Mode measurements.
Step 3. Press the Mode Setup, Radio, Device keys and select MS.
Step 4. To use settings different than for a standard signal, press the Meas Setup, Offsets, and Limits keys and select settings for your signal of interest. For more information see “Error Vector Magnitude (EVM) Keys” on page 104.
Step 5. Press the FREQUENCY Channel key, enter the frequency in MHz, and then press the MHz key to set the center frequency.
Step 6. Press the MEASURE, NADC keys to initiate the EVM measurement.
The next figure shows an example of a measurement result with the graphic and text windows. The measured summary data is shown in the left window and the dynamic vector trajectory of the I/Q demodulated signal is shown in a polar vector display in the right window.
40 Chapter 2

Making NADC MeasurementsError Vector Magnitude (EVM) Measurements
Makin
g N
AD
C M
easurem
ents
Figure 2-7 EVM Measurement - Polar Vector (Default) View
When Device is set to MS, the First 10 Symbols EVM result is also shown in the left window.
Step 7. To select another display, press the View/Trace key and select I/Q Measured Polar Constln. The measured summary data is shown in the left window and the dynamic vector constellation of the I/Q demodulated signal is shown as a polar vector display in the right window, as shown in below.
Figure 2-8 EVM Measurement - Polar Constln
Chapter 2 41

Making NADC MeasurementsError Vector Magnitude (EVM) Measurements
Mak
ing
NA
DC
Mea
sure
men
ts
Step 8. Select I/Q Error (Quad-View) to display four windows that show EVM, Mag Error and Phase Error graphs, and the EVM summary data text.
Figure 2-9 EVM Measurement - Quad View
Step 9. Adjust the display: Press the Display key to accesse the menu to allow the following selections for changing the graph displays:
• Pts/Symb Displayed - Allows you to specify the number of displayed points per symbol, either 1 or 5. The default setting is 5.
• Symbol Dots - Allows you to toggle the symbol dots between On and Off. The default setting is On.
NOTE When either EVM, Phase Error or Mag Error window is active (the window is bordered by color) in the I/Q Error (Quad-View) display, the Span X Scale key accesses the menu to allow the following selections:
• Scale/Div - Allows you to define the horizontal scale by changing the symbol value per division. The range is 1 to 100 symbols per division. The default setting is 16.1 (for BS) or 15.6 for MS) symbols per division.
• Ref Value - Allows you to set the symbol reference value ranging from 0 to 1000 symbols. The default setting is 0.
• Ref Position - Allows you to set the reference position to either Left, Ctr (center) or Right. The default setting is Left.
• Scale Coupling - Allows you to toggle the scale coupling function
42 Chapter 2

Making NADC MeasurementsError Vector Magnitude (EVM) Measurements
Makin
g N
AD
C M
easurem
ents
between On and Off. The default setting is On. This function automatically determines the scale per division and reference value by the magnitude of the measurement results.
NOTE When either EVM: or Mag Error: window is active (the window is bordered by color) in the I/Q Error (Quad-View) display, the AMPLITUDE Y Scale key accesses the menu to allow the following selections:
• Scale/Div - Allows you to define the vertical scale by changing the value per division. The range is 0.1 to 50% per division. The default setting is 20.0%. However, since the Scale Coupling default is set to On, this value is automatically determined by the measurement results.
• Ref Value - Allows you to set the reference value ranging from 0 to 500%. The default setting is 0%.
• Ref Position - Allows you to set the reference position to either Top, Ctr (center) or Bot (bottom). For the EVM: graph, the default setting is Bot. For the Mag Error: graph the default setting is Ctr.
• Scale Coupling - Allows you to toggle the scale coupling function between On and Off. The default setting is On. This function automatically determines the scale per division and reference value by the magnitude of the measurement results.
NOTE When the Phase Error: window is active ( the window is bordered by color) in the I/Q Error display, the AMPLITUDE Y Scale key accesses the menu to allow the following selections:
• Scale/Div - Allows you to define the vertical scale by changing the value per division. The range is 0.01 to 3600 degrees. The default setting is 20.0 degrees per division. However, since the Scale Coupling default is set to On, this value is automatically determined by the measurement results.
• Ref Value - Allows you to set the reference value ranging from 0 to 500%. The default setting is 0%.
• Ref Position - Allows you to set the reference position to either Top, Ctr (center) or Bot (bottom). For the EVM graph, the default setting is Bot. For the Mag Error graph, the default setting is Ctr.
• Scale Coupling - Allows you to toggle the scale coupling function between On and Off. The default setting is On. This function automatically determines the scale per division and reference value by the magnitude of the measurement results.
Chapter 2 43

Making NADC MeasurementsError Vector Magnitude (EVM) Measurements
Mak
ing
NA
DC
Mea
sure
men
ts
Troubleshooting Hints
First use the spectrum (frequency domain) measurement to verify that the signal is present and approximately centered on the display.
Poor phase error indicates a problem at the I/Q baseband generator, filters, modulator, or a combination of these, in the transmitter circuitry. The output amplifier in the transmitter can also create distortion that causes unacceptably high phase error. In a real system, poor phase error will reduce the ability of a receiver to correctly demodulate the signal, especially in marginal signal conditions.
44 Chapter 2

Making NADC MeasurementsOccupied Bandwidth Measurement
Makin
g N
AD
C M
easurem
ents
Occupied Bandwidth MeasurementThis section explains how to make an Occupied Bandwidth measurement on aPDC mobile station. This is the frequency bandwidth in which 99% of the total power is measured, based on Fast Fourier Transform (FFT) theory.
Configuring the Measurement System
The mobile station (MS) under test has to be set to transmit the RF power remotely through the system controller. This transmitting signal is connected to the instruments RF input port. Connect the equipment as shown.
Figure 2-10 Occupied Bandwidth Measurement System
1. Using the appropriate cables, adapters, and circulator, connect the output signal from the MS to the RF input port of the instrument.
2. Connect the base transmission station simulator or signal generator to the MS through a circulator to initiate a link constructed with the sync and pilot channels, if required.
3. Connect a BNC cable between the 10 MHz OUT port of the signal generator and the EXT REF IN port of the instrument.
4. Connect the system controller to the MS through the serial bus cable to control the MS operation.
Chapter 2 45
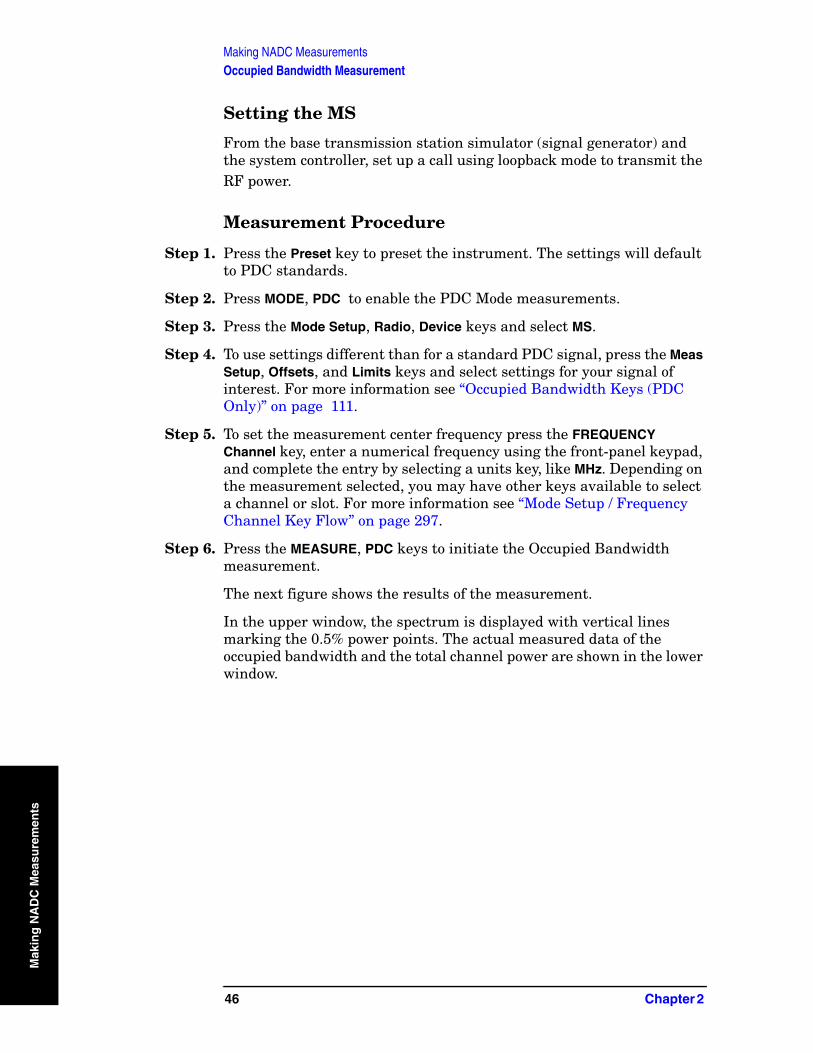
Making NADC MeasurementsOccupied Bandwidth Measurement
Mak
ing
NA
DC
Mea
sure
men
ts
Setting the MS
From the base transmission station simulator (signal generator) and the system controller, set up a call using loopback mode to transmit the RF power.
Measurement Procedure
Step 1. Press the Preset key to preset the instrument. The settings will default to PDC standards.
Step 2. Press MODE, PDC to enable the PDC Mode measurements.
Step 3. Press the Mode Setup, Radio, Device keys and select MS.
Step 4. To use settings different than for a standard PDC signal, press the Meas Setup, Offsets, and Limits keys and select settings for your signal of interest. For more information see “Occupied Bandwidth Keys (PDC Only)” on page 111.
Step 5. To set the measurement center frequency press the FREQUENCY Channel key, enter a numerical frequency using the front-panel keypad, and complete the entry by selecting a units key, like MHz. Depending on the measurement selected, you may have other keys available to select a channel or slot. For more information see “Mode Setup / Frequency Channel Key Flow” on page 297.
Step 6. Press the MEASURE, PDC keys to initiate the Occupied Bandwidth measurement.
The next figure shows the results of the measurement.
In the upper window, the spectrum is displayed with vertical lines marking the 0.5% power points. The actual measured data of the occupied bandwidth and the total channel power are shown in the lower window.
46 Chapter 2

Making NADC MeasurementsOccupied Bandwidth Measurement
Makin
g N
AD
C M
easurem
ents
Figure 2-11 Occupied Bandwidth Measurement - (Default) Result
Changing the Display
The AMPLITUDE Y Scale key accesses the menu to allow the following selections:
• Scale/Div - Allows you to change the vertical scale per division. The range is 0.10 to 20.00 dB per division with 0.01 dB resolution. The default setting is 10.00 dB.
• Ref Value - Allows you to set the reference value ranging from − 250.00 to +250.00 dBm with 0.01 dB resolution. This value is automatically determined in 10 dB steps by the magnitude of measurement results because Scale Coupling is defaulted to On.
• Ref Position - Allows you to set the reference position to either Top, Ctr (center) or Bot (bottom). The default setting is Top.
• Scale Coupling - Allows you to toggle the scale coupling function between On and Off. The default setting is On. If set to On, Ref Value automatically changes to the appropriate value by 10 dB increments according to the channel power level.
Chapter 2 47

Making NADC MeasurementsSpectrum (Frequency Domain) Measurements
Mak
ing
NA
DC
Mea
sure
men
ts
Spectrum (Frequency Domain) MeasurementsThis section explains how to make a frequency domain measurement on a NADC and PDC cellular base station. An adjacent or an interfering signal can also be applied, if desired, during spectrum measurements.
If installed, you may use PSA Option 122, the 80 MHz Bandwidth Digitizer hardware, or PSA Option 140, the 40 MHz Bandwidth Digitizer hardware to perform spectrum measurements of wideband signals using Basic Mode.
Configuring the Measurement System
This example shows a base station (BTS) under test set up to transmit RF power, and being controlled remotely by a system controller. The transmitting signal is connected to the analyzer RF input port. Connect the equipment as shown.
Figure 2-12 Spectrum Measurement System
1. Using the appropriate cables, adapters, and circulator, connect the output signal of the BTS to the RF input of the instrument.
2. Connect the base transmission station simulator or signal generator to the BTS through a circulator to initiate a link constructed with sync and pilot channels, if required.
3. Connect a BNC cable between the 10 MHz OUT port of the signal generator and the EXT REF IN port of the instrument.
4. Connect the system controller to the BTS through the serial bus cable to control the BTS operation.
48 Chapter 2
Making NADC MeasurementsSpectrum (Frequency Domain) Measurements
Makin
g N
AD
C M
easurem
ents
Setting the BTS
From the base transmission station simulator and the system controller, set up a call using loopback mode to allow the BTS to transmit an RF signal.
Measurement Procedure
Step 1. Press the Preset key to preset the instrument.
Step 2. Press the MODE, NADC or PDC Basic keys to enable the NADC or PDC Basic Mode measurements.
Step 3. To set the measurement center frequency press the FREQUENCY Channel key, enter a numerical frequency using the front-panel keypad, and complete the entry by selecting a units key, like MHz.
Step 4. Press the SPAN key, enter a numerical span using the front-panel keypad, and press the MHz key to set the measurement span in MHz.
Step 5. Press the MEASURE key to initiate the spectrum measurement, which is the default measurement for NADC and PDC Basic.
NOTE A display with both a Spectrum window and an I/Q Waveform window will appear when you activate a Spectrum measurement. The active window is outlined in green. Changes to FREQUENCY, Span, or Amplitude settings will affect only the active window. Use the Next Window key to select a different window, and the Zoom key to enlarge a window.
The default diaplay shows both Current (yellow trace) and Average (blue trace) data. To make viewing the display easier, you can view either the Current trace or Average separately.
• Press Trace/View, Trace Display, and select the trace(s) desired for display.
Chapter 2 49

Making NADC MeasurementsSpectrum (Frequency Domain) Measurements
Mak
ing
NA
DC
Mea
sure
men
ts
Figure 2-13 Spectrum Measurement - Spectrum and I/Q Waveform (Default View)
Figure 2-14 Spectrum Measurement - Spectrum and I/Q Waveform (Default View)
The spectrum measurement result should look like the above figure. The measurement result values are shown in the summary result window.
50 Chapter 2

Making NADC MeasurementsSpectrum (Frequency Domain) Measurements
Makin
g N
AD
C M
easurem
ents
Step 6. Press the View/Trace key to display a menu allowing selection of another measurement result display including the following:
• Spectrum - Provides a combination view of the spectrum graph in parameters of power versus frequency with semi-log graticules, and the I/Q waveform graph in parameters of voltage and time. Changes to the frequency span or power will sometimes affect data acquisition. This is equivalent to changing the selected window with the Next Window key.
Spectrum (Time Domain) I/Q Waveform - (PSA only) This graph is shown below the Spectrum graph in the default dual-window display. I/Q Waveform provides a view of the I/Q waveform in parameters of voltage versus time in linear scale. Changes to sweep time or resolution bandwidth can affect data acquisition.
Figure 2-15 Spectrum (Time Domain) Measurement - I/Q Waveform Result
Chapter 2 51
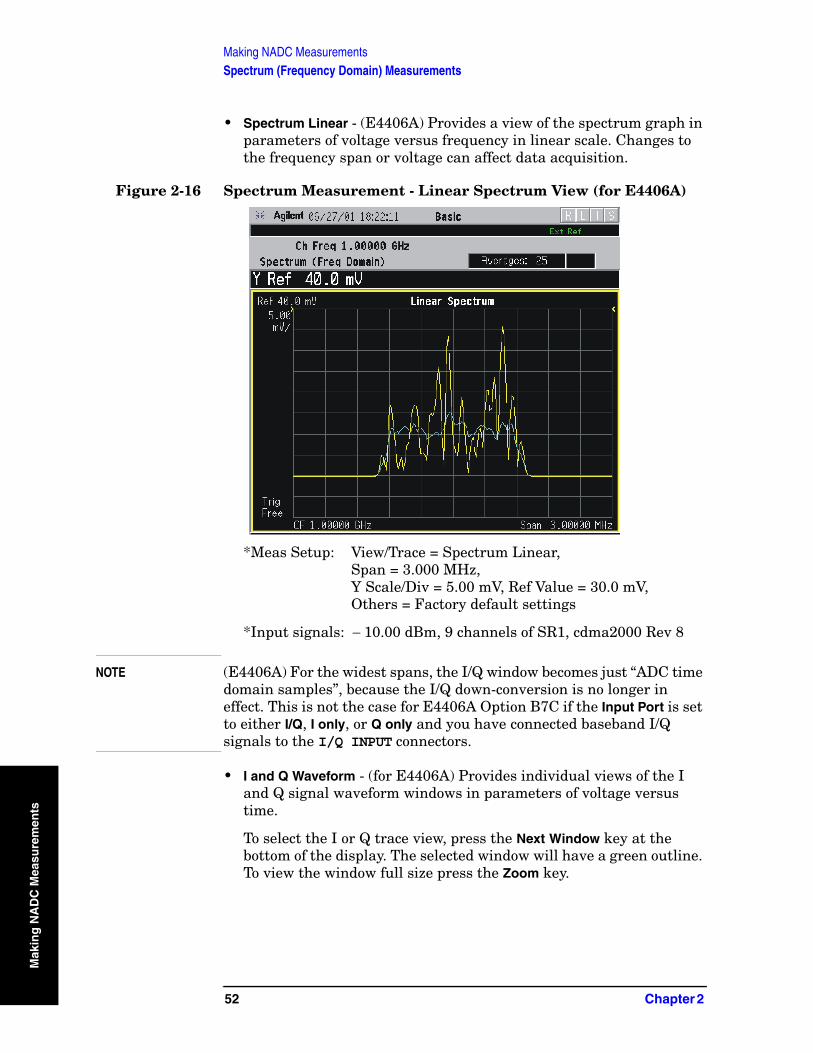
Making NADC MeasurementsSpectrum (Frequency Domain) Measurements
Mak
ing
NA
DC
Mea
sure
men
ts
• Spectrum Linear - (E4406A) Provides a view of the spectrum graph in parameters of voltage versus frequency in linear scale. Changes to the frequency span or voltage can affect data acquisition.
Figure 2-16 Spectrum Measurement - Linear Spectrum View (for E4406A)
*Meas Setup: View/Trace = Spectrum Linear,Span = 3.000 MHz,Y Scale/Div = 5.00 mV, Ref Value = 30.0 mV,Others = Factory default settings
*Input signals: − 10.00 dBm, 9 channels of SR1, cdma2000 Rev 8
NOTE (E4406A) For the widest spans, the I/Q window becomes just “ADC time domain samples”, because the I/Q down-conversion is no longer in effect. This is not the case for E4406A Option B7C if the Input Port is set to either I/Q, I only, or Q only and you have connected baseband I/Q signals to the I/Q INPUT connectors.
• I and Q Waveform - (for E4406A) Provides individual views of the I and Q signal waveform windows in parameters of voltage versus time.
To select the I or Q trace view, press the Next Window key at the bottom of the display. The selected window will have a green outline. To view the window full size press the Zoom key.
52 Chapter 2
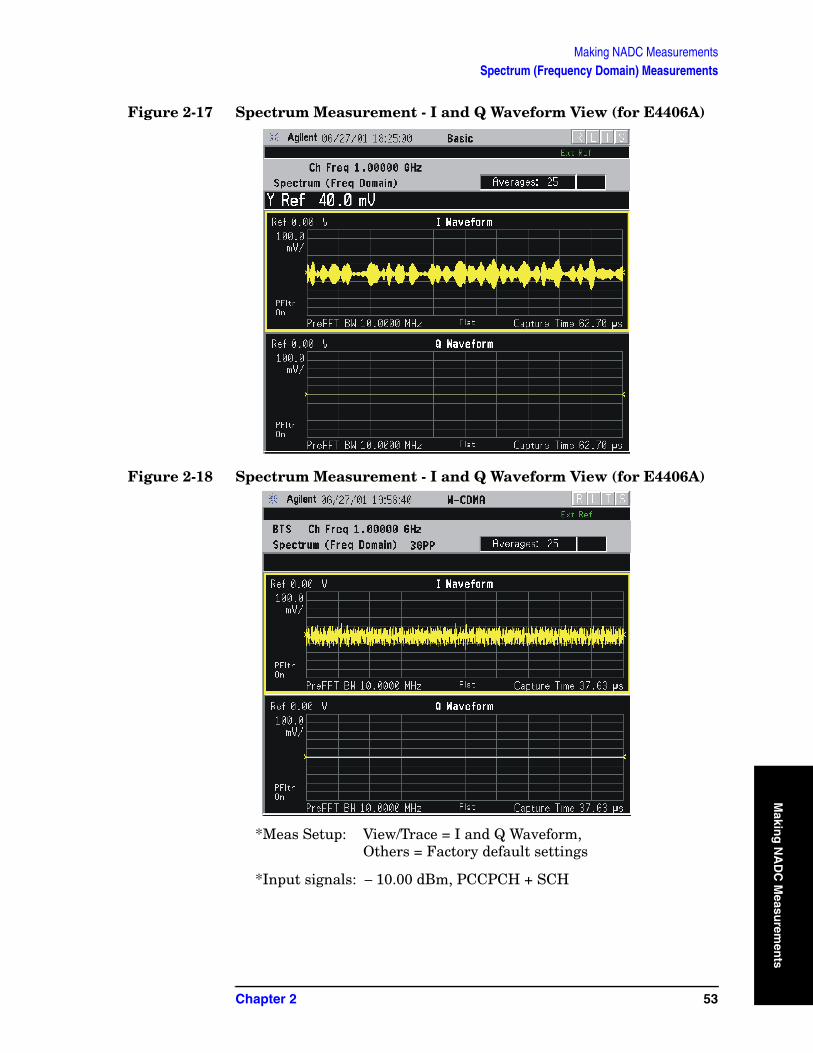
Making NADC MeasurementsSpectrum (Frequency Domain) Measurements
Makin
g N
AD
C M
easurem
ents
Figure 2-17 Spectrum Measurement - I and Q Waveform View (for E4406A)
Figure 2-18 Spectrum Measurement - I and Q Waveform View (for E4406A)
*Meas Setup: View/Trace = I and Q Waveform,Others = Factory default settings
*Input signals: − 10.00 dBm, PCCPCH + SCH
Chapter 2 53

Making NADC MeasurementsSpectrum (Frequency Domain) Measurements
Mak
ing
NA
DC
Mea
sure
men
ts
Figure 2-19 Spectrum Measurement - I and Q Waveform View (for E4406A)
*Meas Setup: View/Trace = I and Q Waveform,AMPLITUDE Y Scale = 5.00 mV,Others = Factory default settings
*Input signals: − 10.00 dBm, 9 channels of SR1, cdma2000 Rev 8
Figure 2-20 Spectrum Measurement - I and Q Waveform View (for E4406A)
*Meas Setup: View/Trace = I and Q Waveform,Others = Factory default settings
*Input signals: − 10.00 dBm, Pilot channel, 1xEV-DO
54 Chapter 2

Making NADC MeasurementsSpectrum (Frequency Domain) Measurements
Makin
g N
AD
C M
easurem
ents
Figure 2-21 Spectrum Measurement - I and Q Waveform View (for E4406A)
*Meas Setup: View/Trace = I and Q WaveformSpan = 500.000 kHz,Y Scale/Div = 5.0 mV, Ref Value = 0.0 V,Others = Factory default settings
*Input signals: − 20.00 dBm, EDGE pattern data (PN9)
• I/Q Polar - (for E4406A) Provides a view of the I/Q signal displayed in a polar vector graph.
Chapter 2 55

Making NADC MeasurementsSpectrum (Frequency Domain) Measurements
Mak
ing
NA
DC
Mea
sure
men
ts
Figure 2-22 Spectrum Measurement - I/Q Polar View (for E4406A)
Figure 2-23 Spectrum Measurement - I/Q Polar View (for E4406A)
*Meas Setup: View/Trace = I/Q Polar,Others = Factory default settings
*Input signals: − 10.00 dBm, PCCPCH + SCH
56 Chapter 2
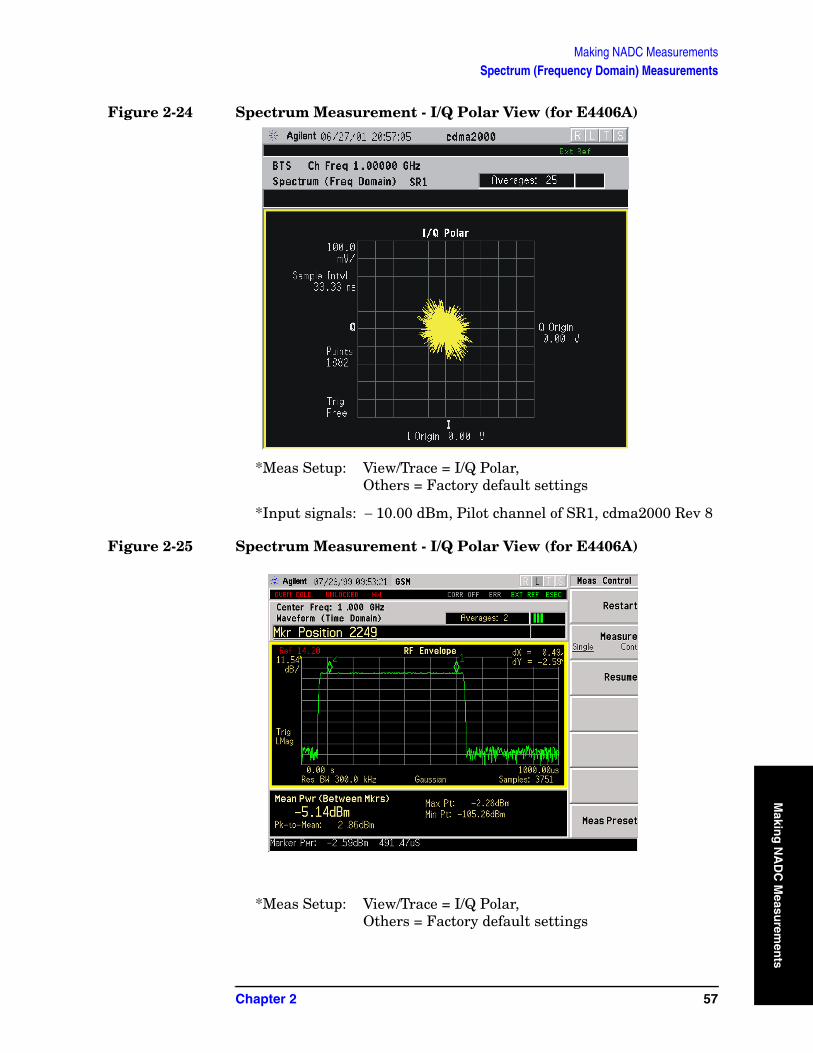
Making NADC MeasurementsSpectrum (Frequency Domain) Measurements
Makin
g N
AD
C M
easurem
ents
Figure 2-24 Spectrum Measurement - I/Q Polar View (for E4406A)
*Meas Setup: View/Trace = I/Q Polar,Others = Factory default settings
*Input signals: − 10.00 dBm, Pilot channel of SR1, cdma2000 Rev 8
Figure 2-25 Spectrum Measurement - I/Q Polar View (for E4406A)
*Meas Setup: View/Trace = I/Q Polar,Others = Factory default settings
Chapter 2 57
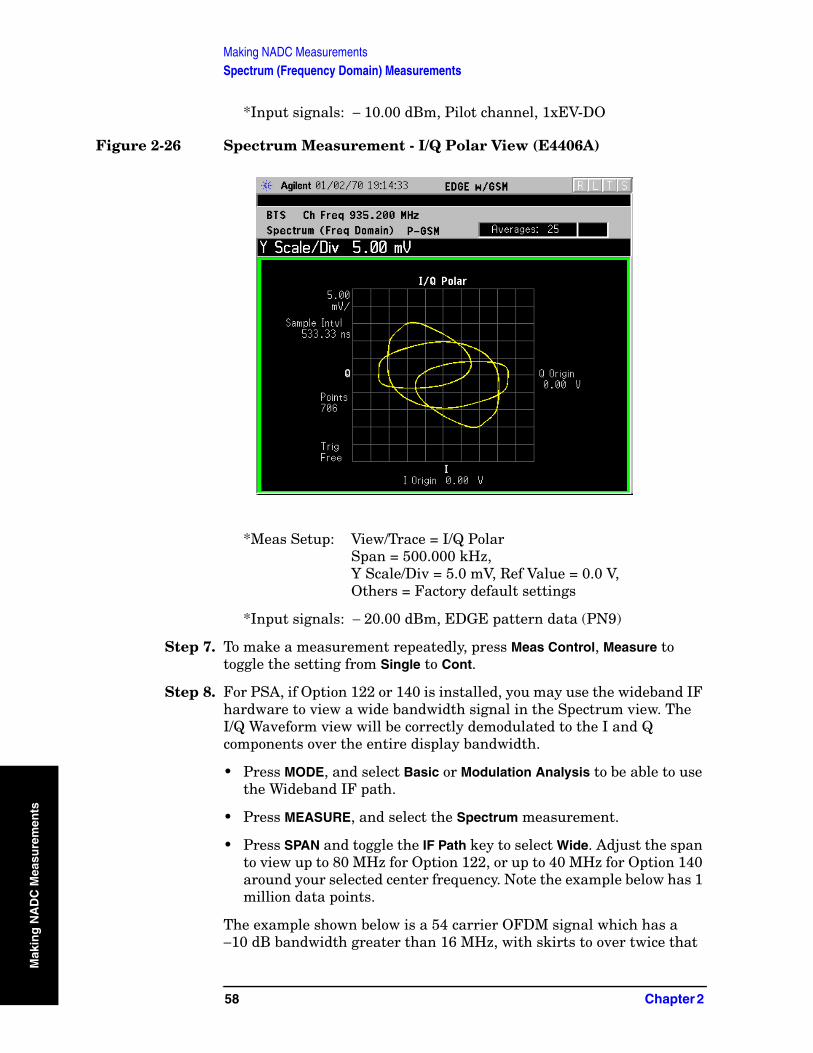
Making NADC MeasurementsSpectrum (Frequency Domain) Measurements
Mak
ing
NA
DC
Mea
sure
men
ts
*Input signals: − 10.00 dBm, Pilot channel, 1xEV-DO
Figure 2-26 Spectrum Measurement - I/Q Polar View (E4406A)
*Meas Setup: View/Trace = I/Q PolarSpan = 500.000 kHz,Y Scale/Div = 5.0 mV, Ref Value = 0.0 V,Others = Factory default settings
*Input signals: − 20.00 dBm, EDGE pattern data (PN9)
Step 7. To make a measurement repeatedly, press Meas Control, Measure to toggle the setting from Single to Cont.
Step 8. For PSA, if Option 122 or 140 is installed, you may use the wideband IF hardware to view a wide bandwidth signal in the Spectrum view. The I/Q Waveform view will be correctly demodulated to the I and Q components over the entire display bandwidth.
• Press MODE, and select Basic or Modulation Analysis to be able to use the Wideband IF path.
• Press MEASURE, and select the Spectrum measurement.
• Press SPAN and toggle the IF Path key to select Wide. Adjust the span to view up to 80 MHz for Option 122, or up to 40 MHz for Option 140 around your selected center frequency. Note the example below has 1 million data points.
The example shown below is a 54 carrier OFDM signal which has a −10 dB bandwidth greater than 16 MHz, with skirts to over twice that
58 Chapter 2
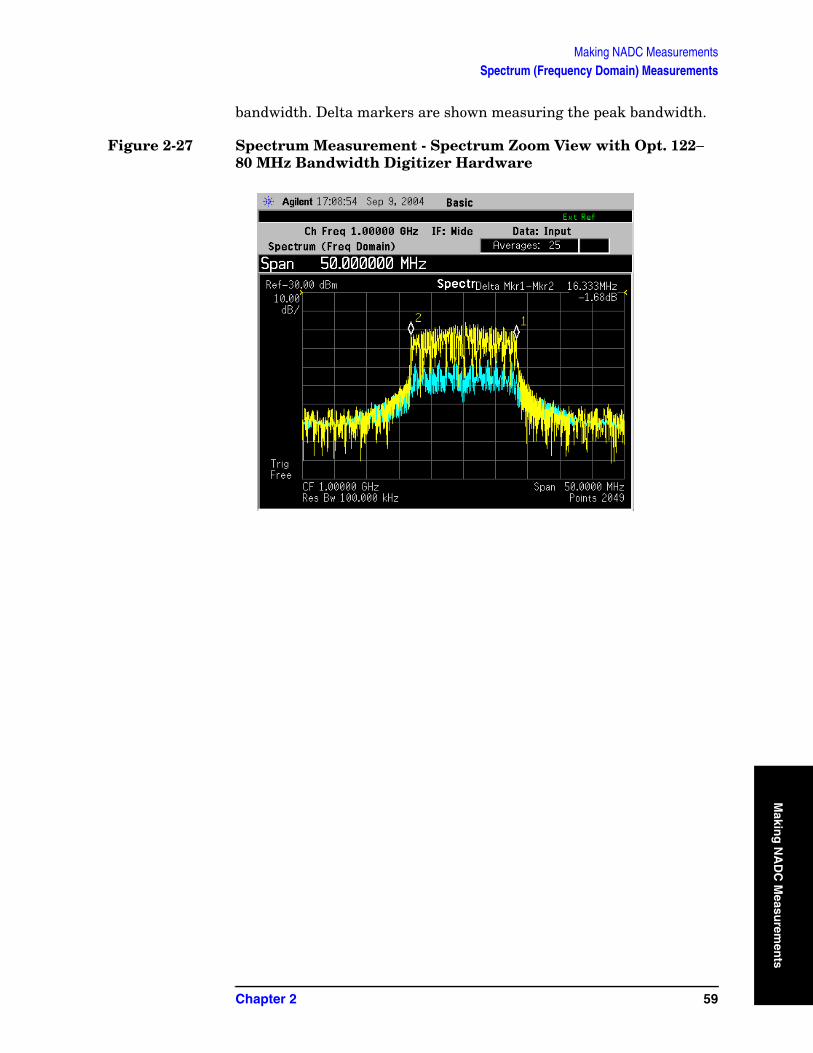
Making NADC MeasurementsSpectrum (Frequency Domain) Measurements
Makin
g N
AD
C M
easurem
ents
bandwidth. Delta markers are shown measuring the peak bandwidth.
Figure 2-27 Spectrum Measurement - Spectrum Zoom View with Opt. 122− 80 MHz Bandwidth Digitizer Hardware
Chapter 2 59
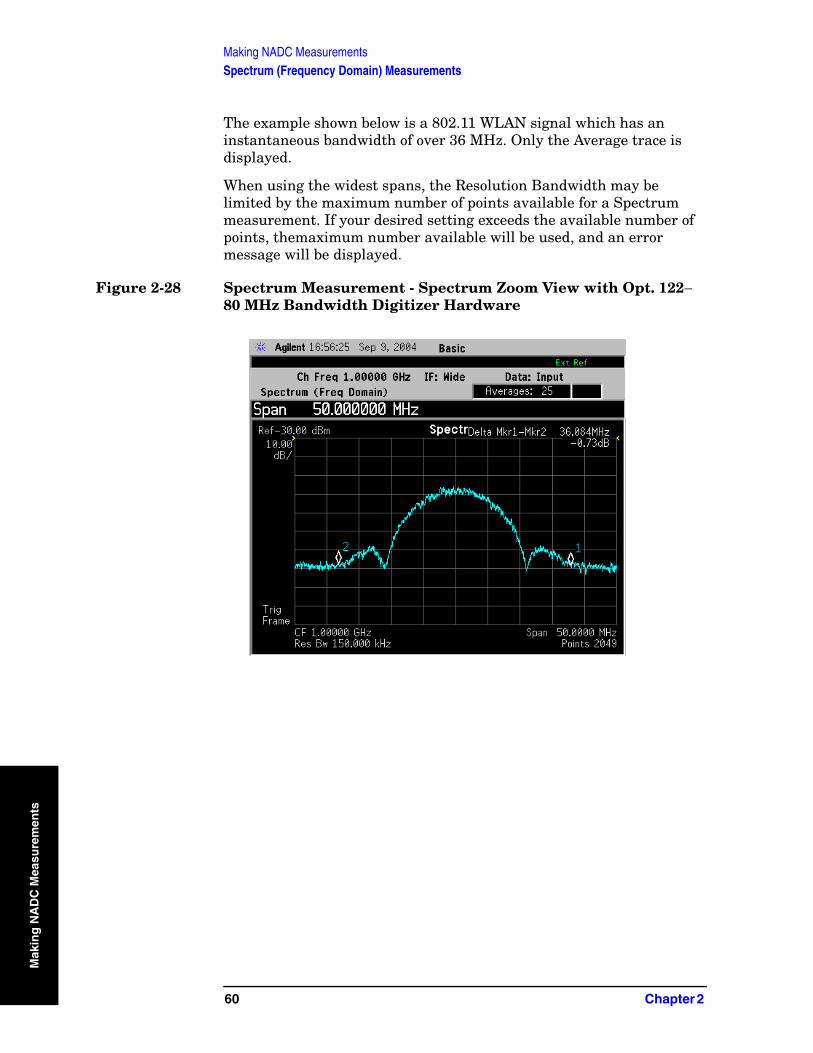
Making NADC MeasurementsSpectrum (Frequency Domain) Measurements
Mak
ing
NA
DC
Mea
sure
men
ts
The example shown below is a 802.11 WLAN signal which has an instantaneous bandwidth of over 36 MHz. Only the Average trace is displayed.
When using the widest spans, the Resolution Bandwidth may be limited by the maximum number of points available for a Spectrum measurement. If your desired setting exceeds the available number of points, themaximum number available will be used, and an error message will be displayed.
Figure 2-28 Spectrum Measurement - Spectrum Zoom View with Opt. 122− 80 MHz Bandwidth Digitizer Hardware
60 Chapter 2

Making NADC MeasurementsSpectrum (Frequency Domain) Measurements
Makin
g N
AD
C M
easurem
ents
The example shown below is a Spectrum View of the center 20 MHz of a Noise Power Ratio measurement. If you extend the Span to the full 80 MHz bandwidth, individual carriers displayed may merge, as they can be limited by screen resolution and resolution bandwidth. Only the Average data trace is displayed in the example below.
Figure 2-29 Spectrum Measurement - Spectrum View with Opt. 122− 80 MHz Bandwidth Digitizer Hardware
Chapter 2 61

Making NADC MeasurementsSpectrum (Frequency Domain) Measurements
Mak
ing
NA
DC
Mea
sure
men
ts
The wideband signal example shown below is 16 W-CDMA carriers, each occupying 5 MHz of bandwidth. The full 80 MHz of available demodulation bandwidth for the Spectrum measurement is used. Only the Average trace is displayed. Note the demodulated composite I/Q waveform for the entire 80 Mhz BW signal in the I/Q Waveform window below. A peak search marker has been applied to the composite waveform.
Figure 2-30 Spectrum Measurement - Spectrum Zoom View with Opt. 122− 80 MHz Bandwidth Digitizer Hardware
Step 9. Press the Meas Setup, More (1 of 2) keys to check the keys available to change the measurement parameters from the default condition.
For more details about using PSA Wide Bandwidth BW Digitizing Hardware Options 122 and 140, including detailed functional descriptions and SCPI commands and concepts, see the PSA Basic Mode Guide.
For more details about changing measurement parameters, see the “Spectrum (Frequency Domain) Measurement Concepts”.
62 Chapter 2
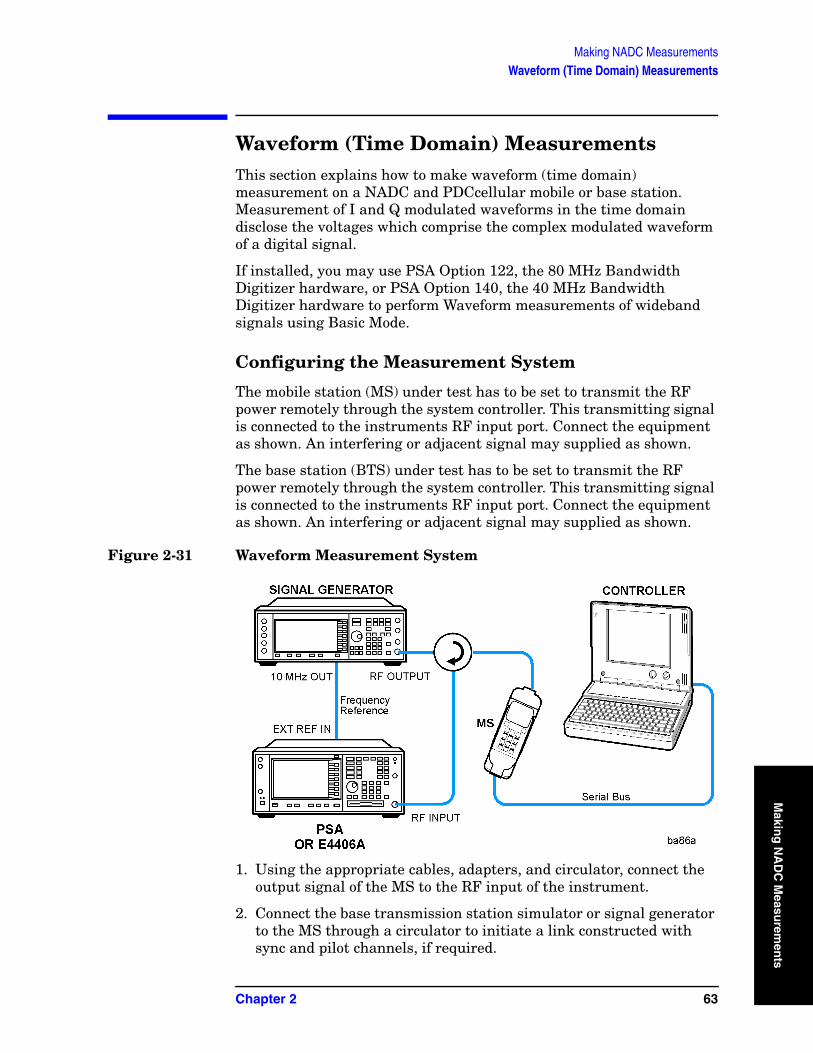
Making NADC MeasurementsWaveform (Time Domain) Measurements
Makin
g N
AD
C M
easurem
ents
Waveform (Time Domain) MeasurementsThis section explains how to make waveform (time domain) measurement on a NADC and PDCcellular mobile or base station. Measurement of I and Q modulated waveforms in the time domain disclose the voltages which comprise the complex modulated waveform of a digital signal.
If installed, you may use PSA Option 122, the 80 MHz Bandwidth Digitizer hardware, or PSA Option 140, the 40 MHz Bandwidth Digitizer hardware to perform Waveform measurements of wideband signals using Basic Mode.
Configuring the Measurement System
The mobile station (MS) under test has to be set to transmit the RF power remotely through the system controller. This transmitting signal is connected to the instruments RF input port. Connect the equipment as shown. An interfering or adjacent signal may supplied as shown.
The base station (BTS) under test has to be set to transmit the RF power remotely through the system controller. This transmitting signal is connected to the instruments RF input port. Connect the equipment as shown. An interfering or adjacent signal may supplied as shown.
Figure 2-31 Waveform Measurement System
1. Using the appropriate cables, adapters, and circulator, connect the output signal of the MS to the RF input of the instrument.
2. Connect the base transmission station simulator or signal generator to the MS through a circulator to initiate a link constructed with sync and pilot channels, if required.
Chapter 2 63

Making NADC MeasurementsWaveform (Time Domain) Measurements
Mak
ing
NA
DC
Mea
sure
men
ts
3. Connect a BNC cable between the 10 MHz OUT port of the signal generator and the EXT REF IN port of the instrument.
4. Connect the system controller to the MS through the serial bus cable to control the MS operation.
5. Connect an external trigger, if needed. Press Mode Setup, Trigger to access a menu to set up inputs and levels for all triggers. You must then select the appropriate trigger under the Meas Setup, Trigger menu to direct the measurement to use your trigger settings.
Setting the MS From the base transmission station simulator (signal generator) and the system controller, set up a call using loopback mode for the MS to transmit the RF signal.
Figure 2-32 Waveform Measurement System
1. Using the appropriate cables, adapters, and circulator, connect the output signal of the BTS to the RF input of the instrument.
2. Connect the base transmission station simulator or signal generator to the BTS through a circulator to initiate a link constructed with sync and pilot channels, if required.
3. Connect a BNC cable between the 10 MHz OUT port of the signal generator and the EXT REF IN port of the instrument.
4. Connect the system controller to the BTS through the serial bus cable to control the BTS operation.
5. Connect an external trigger, if needed. Press Mode Setup, Trigger to access a menu to set up inputs and levels for all triggers. You must then select the appropriate trigger under the Meas Setup, Trigger menu to direct the measurement to use your trigger settings.
Setting the BTS From the mobile simulator (signal generator) and the system controller,
64 Chapter 2

Making NADC MeasurementsWaveform (Time Domain) Measurements
Makin
g N
AD
C M
easurem
ents
set up a call using loopback mode for the BTS to transmit the RF signal.
Measurement Procedure
Step 1. Press the Preset key to preset the instrument.
Step 2. Press the MODE, NADC or PDCBasic keys to enable the NADC or PDCBasic Mode measurements.
Step 3. Press the Mode Setup, Radio, Device keys to toggle the device to MS.
Step 4. To set the measurement center frequency press the FREQUENCY Channel key, enter a numerical frequency using the front-panel keypad, and complete the entry by selecting a units key, like MHz.
Step 5. Press the SPAN key, enter a numerical span using the front-panel keypad, and press the MHz key to set the measurement span in MHz.
Step 6. Press the MEASURE key to initiate the Waveform measurement.
The default diaplay shows both Current (yellow trace) and Average (blue trace) data. To make viewing the display easier, you can view either the Current or Average trace separately.
• Press Trace/View, Trace Display, and select the trace(s) desired for display.
Step 7. Press SPAN X Scale, and the up or down arrow keys until the waveform is shown at a convenient time scale for viewing.
If installed, you may use the 80 MHz Bandwidth hardware to view a wideband signal in the RF Envelope view.
Press SPAN and select the Wideband RF Path. Adjust the span to view up to 80 MHz around your selected center frequency.
The next figure shows an example of an RF Envelope (key is called Signal Envelope on VSA) result for a waveform (time domain) measurement. The measured values for the mean power and peak-to-mean power are shown in the text window.
Chapter 2 65
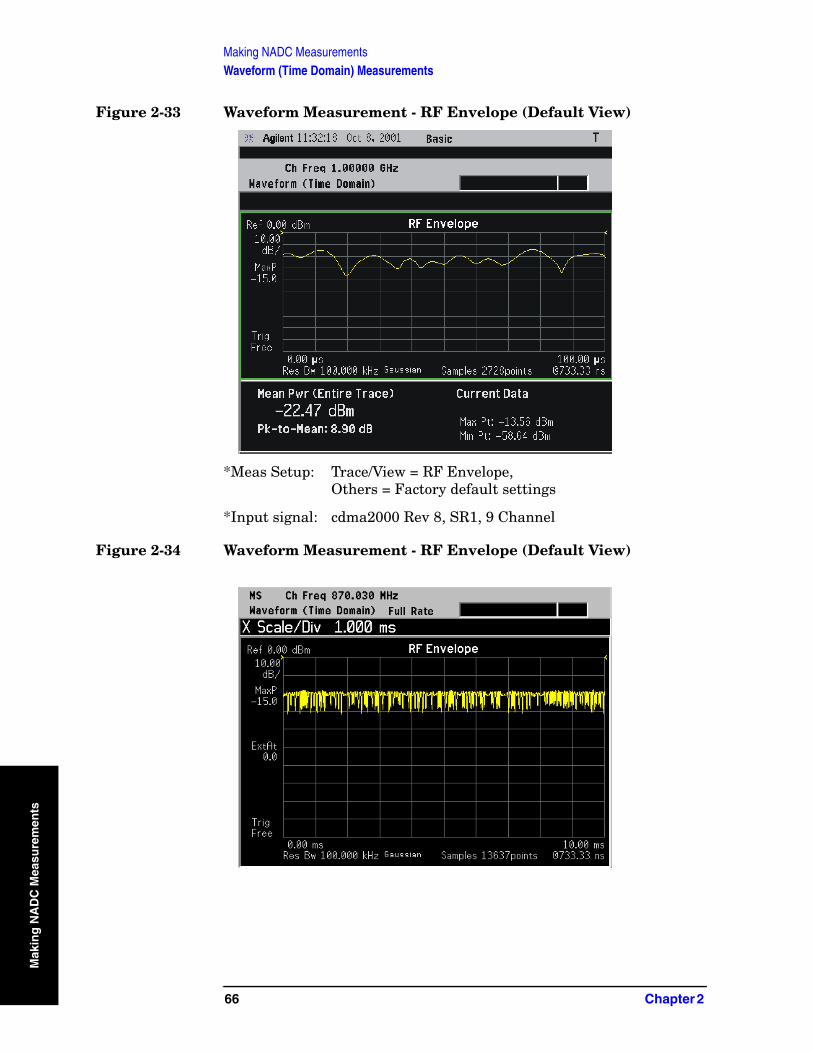
Making NADC MeasurementsWaveform (Time Domain) Measurements
Mak
ing
NA
DC
Mea
sure
men
ts
Figure 2-33 Waveform Measurement - RF Envelope (Default View)
*Meas Setup: Trace/View = RF Envelope,Others = Factory default settings
*Input signal: cdma2000 Rev 8, SR1, 9 Channel
Figure 2-34 Waveform Measurement - RF Envelope (Default View)
66 Chapter 2

Making NADC MeasurementsWaveform (Time Domain) Measurements
Makin
g N
AD
C M
easurem
ents
Figure 2-35 Waveform Measurement - RF Envelope (Default View)
Step 8. Press the Trace/View (PSA) or View/Trace (E4406A) key to display the menu allowing selection of the other Waveform views, including the following:
• Linear Envelope - (for E4406A Option B7C) Provides a combination view of a linear signal envelope graph and a phase graph with linear graticules. Use the Next Window and Zoom keys to select and enlarge either graph.
Chapter 2 67
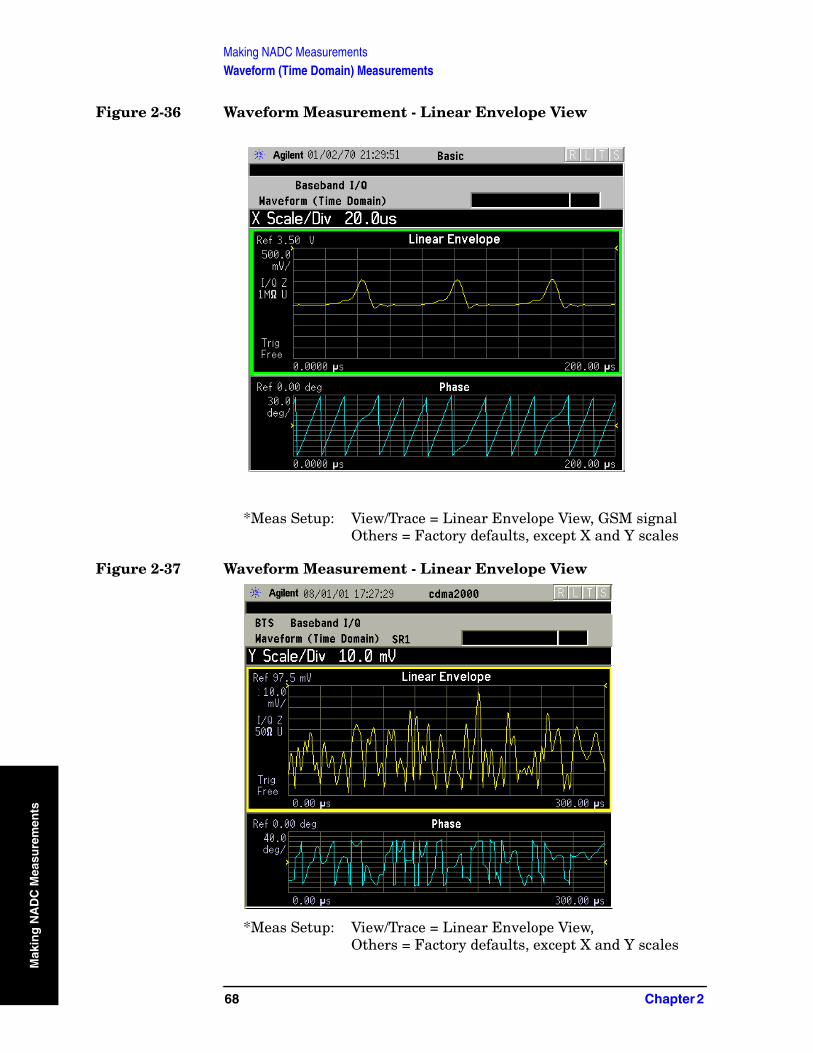
Making NADC MeasurementsWaveform (Time Domain) Measurements
Mak
ing
NA
DC
Mea
sure
men
ts
Figure 2-36 Waveform Measurement - Linear Envelope View
*Meas Setup: View/Trace = Linear Envelope View, GSM signalOthers = Factory defaults, except X and Y scales
Figure 2-37 Waveform Measurement - Linear Envelope View
*Meas Setup: View/Trace = Linear Envelope View,Others = Factory defaults, except X and Y scales
68 Chapter 2

Making NADC MeasurementsWaveform (Time Domain) Measurements
Makin
g N
AD
C M
easurem
ents
*Input signal: cdma2000 Rev 8, SR1, 9 Channel
Figure 2-38 Waveform Measurement - Linear Envelope View
*Meas Setup: View/Trace = Linear Envelope View,Others = Factory defaults, except X and Y scales
*Input signal: W-CDMA (3GPP 3.4 12-00), 1 DPCH,
Chapter 2 69

Making NADC MeasurementsWaveform (Time Domain) Measurements
Mak
ing
NA
DC
Mea
sure
men
ts
Figure 2-39 Waveform Measurement - Linear Envelope View
*Meas Setup: View/Trace = Linear Envelope View, Others = Factory defaults, except X and Y scales
*Input signal: EDGE Standard pattern (4-1’s and 4-0’s)
• I/Q Waveform - Provides a view of the I and Q waveforms together on the same graph in parameters of voltage versus time in linear scale. Changes to the sweep time or resolution bandwidth can affect data acquisition.
70 Chapter 2

Making NADC MeasurementsWaveform (Time Domain) Measurements
Makin
g N
AD
C M
easurem
ents
Figure 2-40 Waveform Measurement - I/Q Waveform View
Figure 2-41 Waveform Measurement - I/Q Waveform View
Chapter 2 71

Making NADC MeasurementsWaveform (Time Domain) Measurements
Mak
ing
NA
DC
Mea
sure
men
ts
Figure 2-42 Waveform Measurement - I/Q Waveform View
NOTE For the widest spans, the I/Q Waveform window becomes just “ADC time domain samples”, because the I/Q down-conversion is no longer in effect.
NOTE For the widest spans the I/Q Waveform window becomes just “ADC time domain samples”, because the I/Q down-conversion is no longer in effect.
• I and Q Waveform - (for E4406A Option B7C) Provides a combination view of the I and Q signal waveform graphs in the linear scales.
72 Chapter 2

Making NADC MeasurementsWaveform (Time Domain) Measurements
Makin
g N
AD
C M
easurem
ents
Figure 2-43 Waveform Measurement - I and Q Waveform View
Figure 2-44 Waveform Measurement - I and Q Waveform View
Chapter 2 73
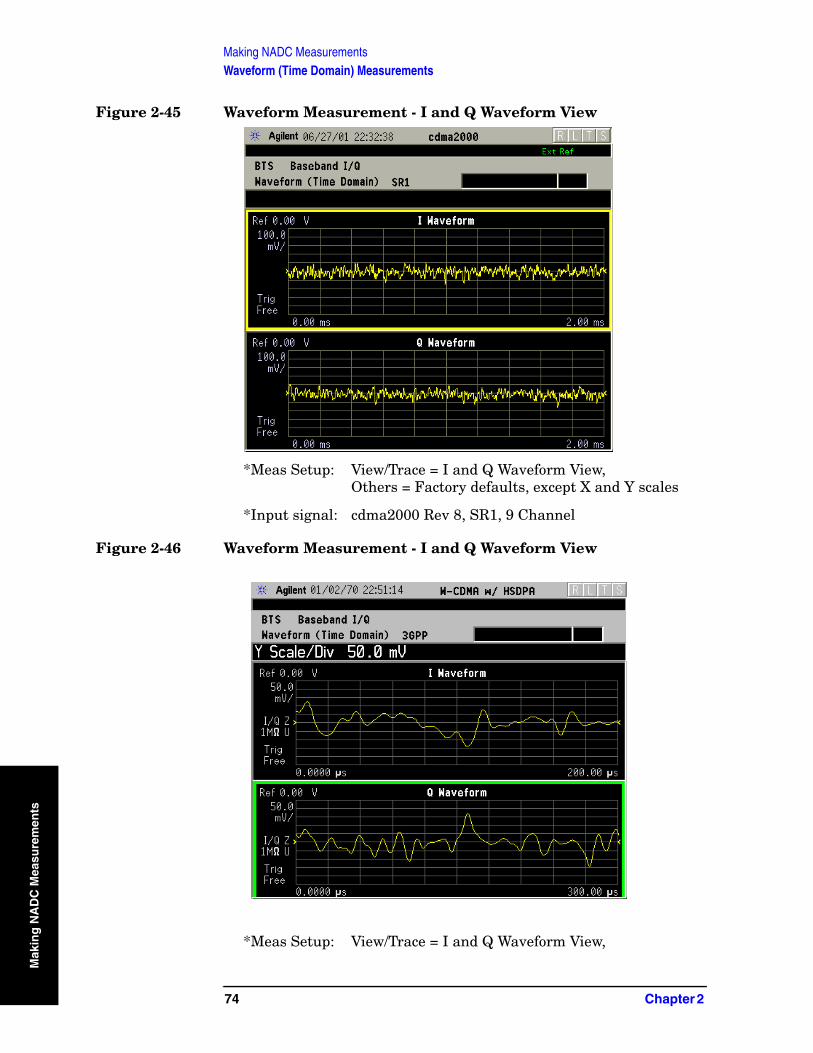
Making NADC MeasurementsWaveform (Time Domain) Measurements
Mak
ing
NA
DC
Mea
sure
men
ts
Figure 2-45 Waveform Measurement - I and Q Waveform View
*Meas Setup: View/Trace = I and Q Waveform View,Others = Factory defaults, except X and Y scales
*Input signal: cdma2000 Rev 8, SR1, 9 Channel
Figure 2-46 Waveform Measurement - I and Q Waveform View
*Meas Setup: View/Trace = I and Q Waveform View,
74 Chapter 2

Making NADC MeasurementsWaveform (Time Domain) Measurements
Makin
g N
AD
C M
easurem
ents
Others = Factory defaults, except X and Y scales
*Input signal: W-CDMA (3GPP 3.4 12-00), 1 DPCH,
• I/Q Polar - (E4406A) Provides a view of the I/Q signal in a polar vector graph.
Figure 2-47 Waveform Measurement - I/Q Polar View
Chapter 2 75

Making NADC MeasurementsWaveform (Time Domain) Measurements
Mak
ing
NA
DC
Mea
sure
men
ts
Figure 2-48 Waveform Measurement - I/Q Polar View
Figure 2-49 Waveform Measurement - I/Q Polar View
*Meas Setup: View/Trace = I/Q Polar View,Others = Factory defaults, except X and Y scales
*Input signal: cdma2000 Rev 8, SR1, 9 Channel
76 Chapter 2

Making NADC MeasurementsWaveform (Time Domain) Measurements
Makin
g N
AD
C M
easurem
ents
Figure 2-50 Waveform Measurement - I/Q Polar View
*Meas Setup: View/Trace = I/Q Polar View,Others = Factory defaults, except X and Y scales
*Input signal: W-CDMA (3GPP 3.4 12-00), 1 DPCH,
Figure 2-51 Waveform Measurement - I/Q Polar View
*Meas Setup: View/Trace = I/Q Polar, Trigger Source = Ext Rear,Others = Factory default settings
*Input signal: − 10 dBm, Idle slot, 1xEV-DO
Chapter 2 77
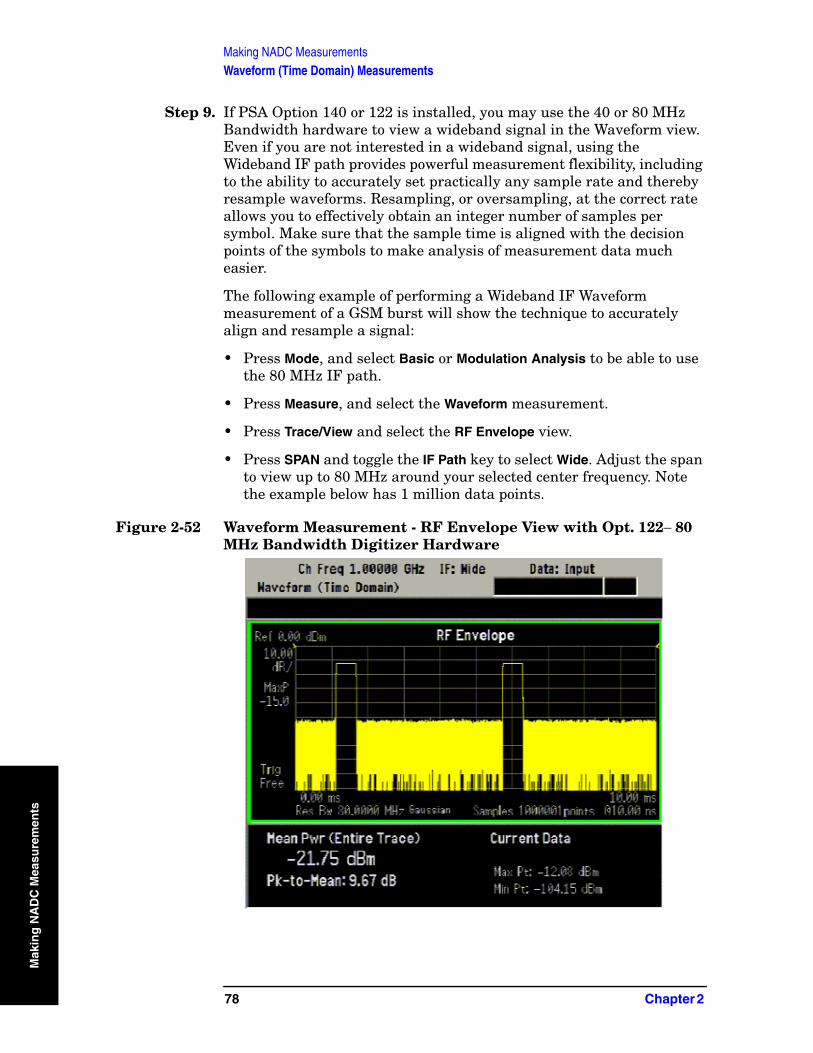
Making NADC MeasurementsWaveform (Time Domain) Measurements
Mak
ing
NA
DC
Mea
sure
men
ts
Step 9. If PSA Option 140 or 122 is installed, you may use the 40 or 80 MHz Bandwidth hardware to view a wideband signal in the Waveform view. Even if you are not interested in a wideband signal, using the Wideband IF path provides powerful measurement flexibility, including to the ability to accurately set practically any sample rate and thereby resample waveforms. Resampling, or oversampling, at the correct rate allows you to effectively obtain an integer number of samples per symbol. Make sure that the sample time is aligned with the decision points of the symbols to make analysis of measurement data much easier.
The following example of performing a Wideband IF Waveform measurement of a GSM burst will show the technique to accurately align and resample a signal:
• Press Mode, and select Basic or Modulation Analysis to be able to use the 80 MHz IF path.
• Press Measure, and select the Waveform measurement.
• Press Trace/View and select the RF Envelope view.
• Press SPAN and toggle the IF Path key to select Wide. Adjust the span to view up to 80 MHz around your selected center frequency. Note the example below has 1 million data points.
Figure 2-52 Waveform Measurement - RF Envelope View with Opt. 122− 80 MHz Bandwidth Digitizer Hardware
78 Chapter 2

Making NADC MeasurementsWaveform (Time Domain) Measurements
Makin
g N
AD
C M
easurem
ents
• Make sure that your samples are synchronized to the decision points of the signal of interest. In this case we will use the internal Frame Timer to trigger our measurement. A GSM frame is 4.615383 ms long.
Press Mode Setup, Trigger, select Frame Timer, then select Period. Enter 4.615383 ms. This only sets the frame timer period. You must direct the measurement to use the Frame Timer in the next step:
Press Meas Setup, Trigger Source and select Frame.
For other measurements, an external trigger may be applied to an External Trigger Input, on either the front or the real panels. You must specify that trigger selection in this menu.
• In this example, we want to capture an entire GSM burst of 144 symbols (plus guard). A GSM burst is approximately 4.6 ms, so we will set our Meas Time to 5 ms:
Press Meas Setup, Meas Time and enter 5 ms.
• In this resampling example, we want to take exactly 10 samples per GSM symbol. The GSM symbol rate is 270.833 kHz, so we want a sample rate of 2.70833 MHz. Option 122 Wideband IF hardware lets us set the desired sample rate, as follows: sample rate = 5/4 IF Bandwidth. That means we need set an IF BW of 2.16667 MHz.
Press Meas Setup, IF BW and enter 2.16667 MHz.
You can also access the sample rate key directly:
Press Meas Setup, Wideband Setup, and Sample Rate keys. Enter the Sample Rate frequency. The Sample Rate and IF BW settings are coupled. The 5/4 ratio will be preserved regardless of which setting is used.
• Your measurement result should look like Figure 2-53
Chapter 2 79
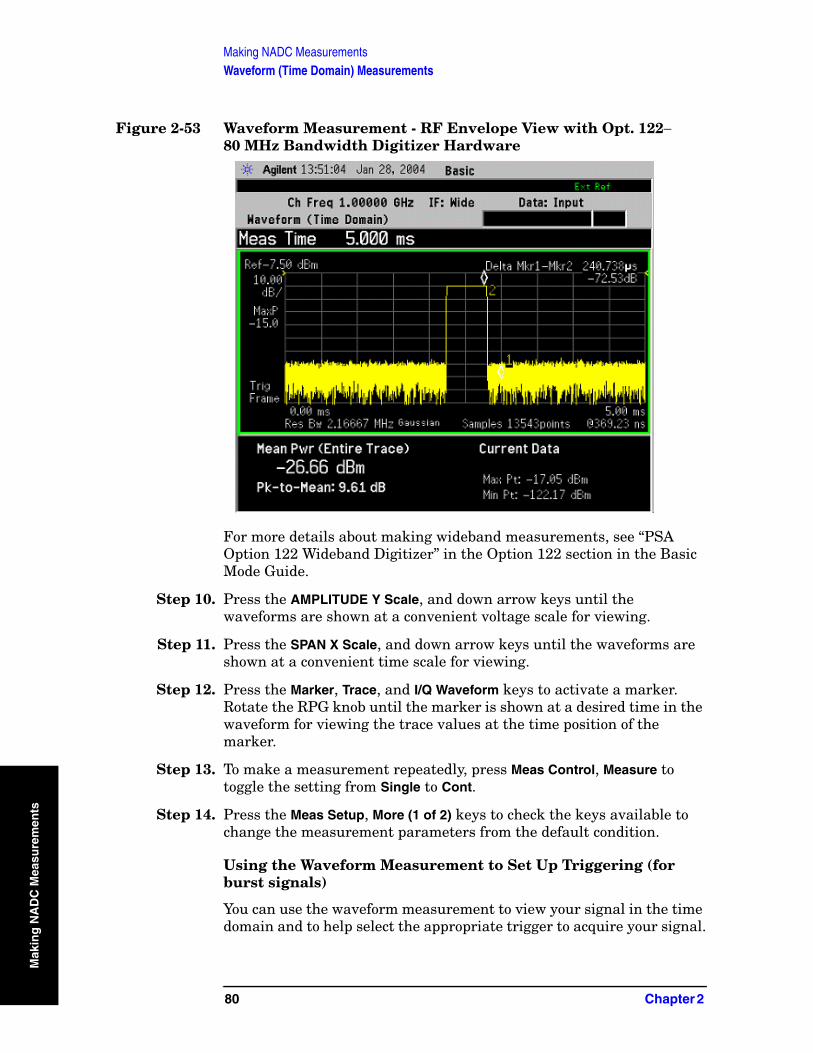
Making NADC MeasurementsWaveform (Time Domain) Measurements
Mak
ing
NA
DC
Mea
sure
men
ts
Figure 2-53 Waveform Measurement - RF Envelope View with Opt. 122− 80 MHz Bandwidth Digitizer Hardware
For more details about making wideband measurements, see “PSA Option 122 Wideband Digitizer” in the Option 122 section in the Basic Mode Guide.
Step 10. Press the AMPLITUDE Y Scale, and down arrow keys until the waveforms are shown at a convenient voltage scale for viewing.
Step 11. Press the SPAN X Scale, and down arrow keys until the waveforms are shown at a convenient time scale for viewing.
Step 12. Press the Marker, Trace, and I/Q Waveform keys to activate a marker. Rotate the RPG knob until the marker is shown at a desired time in the waveform for viewing the trace values at the time position of the marker.
Step 13. To make a measurement repeatedly, press Meas Control, Measure to toggle the setting from Single to Cont.
Step 14. Press the Meas Setup, More (1 of 2) keys to check the keys available to change the measurement parameters from the default condition.
Using the Waveform Measurement to Set Up Triggering (for burst signals)
You can use the waveform measurement to view your signal in the time domain and to help select the appropriate trigger to acquire your signal.
80 Chapter 2
Making NADC MeasurementsWaveform (Time Domain) Measurements
Makin
g N
AD
C M
easurem
ents
Step 1. Press MEASURE, Waveform (Time Domain) to activate the waveform measurement view.
Step 2. Press SPAN X Scale, Scale/Div, to adjust the scale of the x-axis to view the complete signal waveform. Use the front-panel keypad to input the scale/div, then press a units key, like µs, to complete the entry.
Step 3. Press Meas Setup, Trig Source, then select one of the available trigger sources (free run is the default setting).
Step 4. Press Trigger (or for E4406A press Mode Setup, Trigger Setup), then choose a trigger mode to set up the trigger conditions.
In the trigger mode, set the delay, peak level, and positive or negative edge slope trigger. You can also set up trigger holdoff, auto trigger timing, and frame timer settings.
For more details about using PSA Option 122, 80 MHz BW Digitizing Hardware, and PSA Option 140, 40 MHz Digitizing Hardware, including detailed function descriptions, SCPI commands, and concepts, see the PSA Basic Mode Guide.
For more details about changing measurement parameters, see “Waveform (Time Domain) Measurement Concepts” on page 292.
Chapter 2 81

Making NADC MeasurementsUsing Basic Mode
Mak
ing
NA
DC
Mea
sure
men
ts
Using Basic Mode Basic mode is a standard feature of E4406A Transmitter Testers, and is part of Option B7J for the PSA Series Spectrum Analyzers. Basic mode is not related to a particular communications standard. That is, it does not default to measurement settings that are for any specific standard. You may want to use Basic Mode if you are making measurements on a signal that is not based on a specific digital communications standard.
Basic Mode in E4406A VSA Series Transmitter Testers
There are five generic measurements available under the MEASURE key in Basic mode:
• Adjacent Channel Power (ACP)• Channel Power• Power Statistics CCDF• Spectrum measurement (frequency domain).• Waveform measurement (time domain)
The ACP, Channel Power, and Power Stat CCDF measurements are fully described in the VSA Series User’s Guide. Please refer to that manual for complete information on these measurements.
Spectrum and Waveform Measurements
These measurements provide a spectrum measurement mode that is similar to a standard spectrum analyzer, and a waveform measurement mode that is similar to a microwave oscilloscope. Unlike those standard analyzers, these measurements are optimized for digitally modulated signals, so they can be used to output the measured I/Q data.
For your convenience, Spectrum and Waveform measurements are also available in this mode, with the same functionality, so you can refer to the sections included in this chapter for information about using them.
Basic Mode in PSA Series Spectrum Analyzers
There are three generic measurements available under the MEASURE key in Basic mode:
• Spectrum measurement (frequency domain).• Waveform measurement (time domain)• Power Statistics CCDF
These Spectrum, Waveform, and CCDF measurements are also available in this mode, with the same functionality, so you can refer to the sections included in this chapter for information about using them.
82 Chapter 2

Making NADC MeasurementsUnderstanding Common Measurement Errors
Makin
g N
AD
C M
easurem
ents
Understanding Common Measurement ErrorsDuring the execution of your measurement you may encounter problems which generate error codes. Reference to the following common errors may be helpful.
If Err is shown in the annunciator bar, press the System, Show Errors hard and soft keys to read the detailed error information.
• Measurement Instability- Low Input Signal Level
If the input signal level is too low to make a valid measurement no code domain power will be displayed in the Power graph window. In this situation, no error message can be displayed to indicate the nature of the fault. If you cannot increase the power into the tester, you need to increase the input sensitivity by adjusting the ADC range.
Press Meas Setup, More (1 of 3), More (2 of 3), Advanced, ADC Range, and then Manual keys. Increase the setting from the − 6 dB (for E4406A) or None (for PSA) default to 6 dB, for example. Another option is to use the Auto setting (the Auto setting is not used as the default to improve measurement speed).
Press Restart to make another measurement and observe the results. Re-adjust the ADC as necessary to obtain a valid measurement.
• Error Code 16 “Input overload”
This error means that your measurement has erroneous results due to the excessive input power level. To correct this condition, the input signal level must be reduced by using the internal or the external attenuator, or both.
Press the Mode Setup, Input, Input Atten keys to enter an attenuation value to reduce the transmitted power from the MS. This allowable range is up to 40 dB.
If you want to attenuate more than 40 dB, connect your external attenuator between the RF INPUT port and the DUT. Be sure to add its attenuation value to the readings of the measurement result.
To automate this calculation, press the Mode Setup, Input, Ext Atten keys to enter the additional attenuation value. The allowable range is up to 100 dB. The power readings of the measurement will take into account the external attenuation value.
• Error Code 601 “Signal too noisy”
This error means that your input signal is too noisy to capture the correct I/Q components. To make a more stable measurement the trigger source may need to be set to Frame, for example.
Chapter 2 83

Making NADC MeasurementsUnderstanding Common Measurement Errors
Mak
ing
NA
DC
Mea
sure
men
ts
• Error Code 604 “Can not correlate to input signal”
This error means that the tester has failed to find any active channels in the input signal as specified. To improve the correlation some critical parameter needs to be adjusted, like the input signal level or scramble code, for example.
For more details consult the chapter in this book dedicated to the measurement in question, or see the “Instrument Messages and Functional Tests” manual.
84 Chapter 2
NA
DC
and
PD
C K
ey Referen
ce
3 NADC and PDC Key Reference
This chapter provides detailed descriptions of the keys used to set up and make NADC and PDC measurements, including Mode Setup, Meas Setup, and MEASURE. Keys that allow you to see different presentations of the measurement results are also described, including View/Trace, and Display, showing the associated screens.
85

NADC and PDC Key ReferenceInstrument Front Panel Highlights
NA
DC
an
d P
DC
Key
Ref
eren
ce
Instrument Front Panel HighlightsThe most commonly used function keys on the VSA and PSA front panels are located as shown in the illustrations below. The operation of the keys is briefly explained on the following page. Refer to your User’s Guide for complete details on all keys.
Figure 3-1 Selected E4406A VSA Series Front Panel Feature Locations
86 Chapter 3
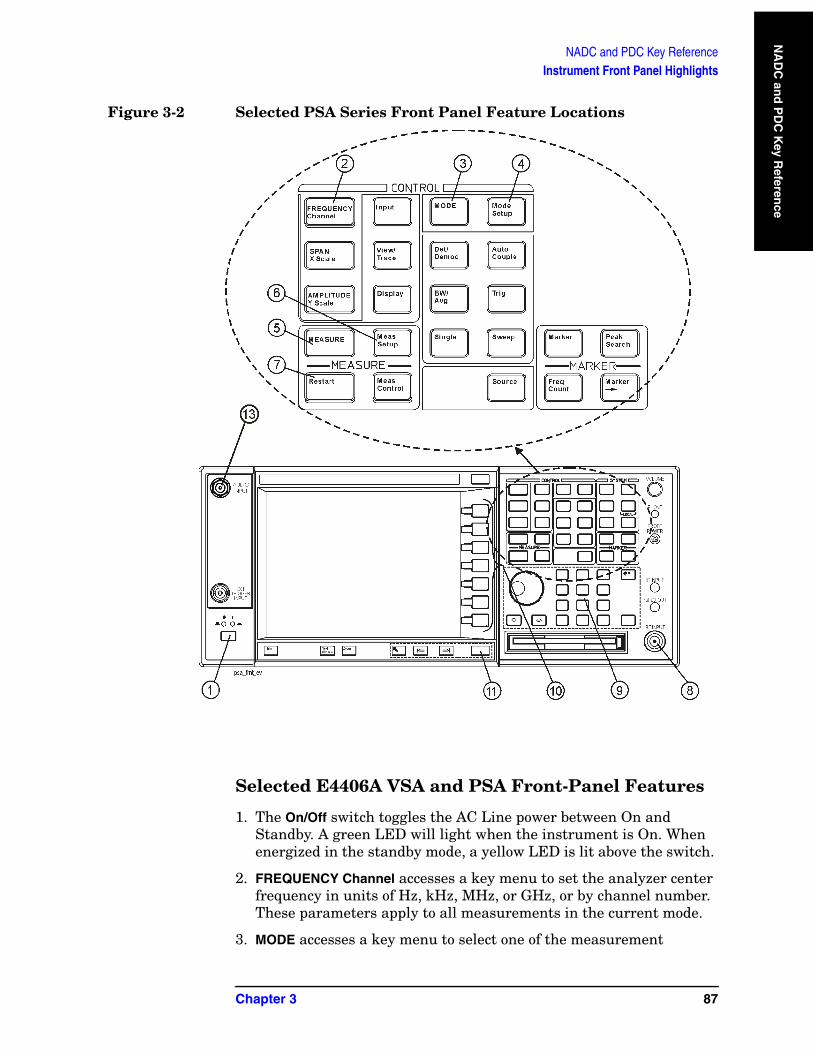
NADC and PDC Key ReferenceInstrument Front Panel Highlights
NA
DC
and
PD
C K
ey Referen
ce
Figure 3-2 Selected PSA Series Front Panel Feature Locations
Selected E4406A VSA and PSA Front-Panel Features
1. The On/Off switch toggles the AC Line power between On and Standby. A green LED will light when the instrument is On. When energized in the standby mode, a yellow LED is lit above the switch.
2. FREQUENCY Channel accesses a key menu to set the analyzer center frequency in units of Hz, kHz, MHz, or GHz, or by channel number. These parameters apply to all measurements in the current mode.
3. MODE accesses a key menu to select one of the measurement
Chapter 3 87

NADC and PDC Key ReferenceInstrument Front Panel Highlights
NA
DC
an
d P
DC
Key
Ref
eren
ce
personalities installed in the instrument. Each mode is independent from all other modes.
4. Mode Setup accesses a key menu that sets parameters specific to the current mode and can affect all measurements within that mode.
5. MEASURE accesses a display key menu to initiate one of the various measurements that are specific to the current mode.
6. Meas Setup accesses the menus of test parameters that are specific to the current measurement.
7. Restart causes a measurement to start again from the initial process according to the current measurement setup parameters.
8. RF INPUT port: Type N connector for the E4406A VSA and E4443A, E4445A, and E4440A PSAs. It is a 2.4 mm connector on the E4446A and E4448A PSAs and a 3.5 mm connector on all PSAs with Opt BAB. The maximum input power level is shown next to the port.
9. The Data Entry keypad is used to enter numeric values. Keypad entries are displayed in the active function area of the screen and become valid for the current measurement upon pressing the Enter key or selecting a unit of measurement, depending on the parameter.
10.The Display Menu keys allow you either to activate a feature or to access a more detailed sub-menu. An arrow on the right side of a softkey label indicates that the key has a further selection menu. The active menu key is highlighted, however, grayed-out keys are currently unavailable for use or only show information. If a menu has multiple pages, succesive pages are accessed by pressing the More key located at the bottom of the menu.
11.Return allows you to exit the current menu and display the previous menu. If you are on the first page of a mult-page menu (a menu with (1 of 3) for example), the Return key will exit from that menu.When you activate another measurement, the return list is cleared. The Return key will not return you to a previously activated mode, nor will it alter any values you have entered in previous menus.
12.Baseband I/Q Inputs (E4406A Option B7C only) allow you to analyze signals at baseband frequencies. See “Using Option B7C Baseband I/Q Inputs” on page 1.
13.BNC Audio Input (PSA Option 233 Measuring Receiver only) provides a 100 kOhm input for audio measurements. The frequency range is 20 Hz to 250 kHz. The safe input level is 7 Vrms or 20 V DC.
88 Chapter 3
NADC and PDC Key ReferenceNADC and PDC Mode Front Panel Keys
NA
DC
and
PD
C K
ey Referen
ce
NADC and PDC Mode Front Panel Keys
NOTE Only front panel keys affected by selection of NADC or PDC mode are described here. For a complete description of all front panel keys see the E4406A VSA User’s Guide or the PSA Series User’s and Programmer’s Reference Volume 1.
FREQUENCY Channel Key Menu
Key Path: FREQUENCY Channel
The FREQUENCY Channel key menu allows you to set the desired center frequency, burst type and slot by providing the following selections:
• Center Freq - Enter a frequency value that corresponds to the desired RF channel to be measured. This is the current instrument center frequency for any measurement function.
• Burst Type - Choose a burst type from the following selections: (available only when Device under Radio is set to MS.) Burst Type is used only when making EVM measurements.
— Traffic (TCH) - Sets to the traffic channel burst signal (burst length of 324 bits or 162 symbols).
— Control (CCH) - Sets to the control channel burst signal (burst length of 280 bits or 140 symbols).
• Slot (Std) - Allows you to toggle the slot selection function between Auto and Man, and also to specify the particular timeslot to be measured when Man is selected. This is used only when making EVM measurements.
— Auto - In auto, the measurement is made on the first timeslot found to have any one of the valid sync words, corresponding to slots 1 to 6. The measurement may be made on various timeslots if more than one timeslot has a valid sync word.
— Man - In manual, the measurement is made on the first timeslot found to have the selected sync word in the range of 1 to 6. The measurement will be made only on the specified timeslot.
Frequency Channel Default Settings
Center Frequency 1.00000 GHz
Burst Typea Traffic (TCH)
Slot (Std) 1, Auto
a. This is used only when Device is MS.
Chapter 3 89

NADC and PDC Key ReferenceNADC and PDC Mode Front Panel Keys
NA
DC
an
d P
DC
Key
Ref
eren
ce
Measurement Control Key Menu
Key Path: Meas Control
Meas Control Key menu:
• Measure softkey. Press Meas Control, Measure to toggle between Single and Cont (for continuous) measurement states (This is not he same as the front panel MEASURE key which is used to select measurements). When set to Single, the measurement will continue until it has reached the specified number of averages set by the average counter. When set to Continuous, the measurement will run continuously, and perform averaging according to the current average type (repeat or exponential). The default setting is continuous.
• Pause key. Press Meas Control, Pause to pause the current measurement. Once toggled, the label of the Pause key changes to read Resume. The Resume key, once pressed, continues the active measurement from the point at which it was paused.
• Restart key. The Restart front panel key repeats the current measurement from the beginning, while retaining the current measurement settings.
MODE Key Menu
Key Path: MODE
To access the NADC measurement personality press the MODE key and select the NADC key.
To access the PDC measurement personality press the MODE key and select the PDC key.
Mode settings are persistent. When you switch from one mode to another mode, the settings you have chosen for the modes will remain active until you change them. This allows you to switch back and forth between modes without having to reset settings each time. Presetting the instrument or powering the instrument off and on will return all mode settings to their default values.
90 Chapter 3

NADC and PDC Key ReferenceNADC and PDC Mode Front Panel Keys
NA
DC
and
PD
C K
ey Referen
ce
Mode Setup Key Menu
NOTE You must be in NADC or PDC mode, and have selected ACP under the MEASURE menu for the following menus to become available.
Selections made under the Mode Setup menu apply to all measurements in the current mode only. Settings will not persist across NADC and PDC unless setting are applied in both modes.
Key Path: Mode Setup
• Radio
— Traffic Rate - Allows you to toggle the traffic rate between Full and Half.
— Device - Allows you to toggle the test device between BTS (Base Station) and MS (Mobile Station).
• Input
NOTE You can also access this menu from the front-panel Input key
— RF Input Range - Allows you to toggle the RF input range between Auto and Man (manual). Auto is not used for Spectrum measurements. If Auto is chosen, the instrument automatically sets the attenuator based on the carrier power level, where it is tuned. Once you change the Max Total Pwr or Input Atten value with the RPG knob, for example, the RF Input Range key is automatically set to Man. If there are multiple carriers present, the total power might overdrive the front end amplifiers. In this case you need to set the RF Input Range to Man and enter the expected maximum total power by activating the Max Total Pwr key. Man is also useful to hold the input attenuation constant for the best relative power accuracy. For single carriers it is generally recommended to set this to Auto.
— Max Total Pwr - Allows you to set the maximum total power from the UUT (Unit Under Test). The range is − 200.00 to +50.00 dBm with 0.01 dB resolution. This is the expected maximum value of the mean carrier power referenced to the output of the UUT; it may include multiple carriers. The Max Total Pwr setting is coupled together with the Input Atten and Ext Atten settings. Once you change the Max Total Pwr value with the RPG knob, for example, the RF Input Range key is automatically set to Man.
Radio Default Settings
Traffic Rate Full
Device BTS
Chapter 3 91

NADC and PDC Key ReferenceNADC and PDC Mode Front Panel Keys
NA
DC
an
d P
DC
Key
Ref
eren
ce
— Input Atten - Allows you to control the input attenuator setting. The range is 0 to 40 dB with 1 dB resolution. The Input Atten key reads out the actual hardware value that is used for the current measurement. If more than one input attenuator value is used in a single measurement, the value used at the carrier frequency will be displayed. The Input Atten setting is coupled together with the Max Total Pwr setting. Once you change the Input Atten value with the RPG knob, for example, the RF Input Range key is automatically set to Man.
— Ext Atten - Allows you to enter the external attenuation value for either BS or MS. The range is − 50.00 to +50.00 dB with 0.01 dB resolution. This will allow the instrument to display the measurement results referenced to the output of the UUT.
NOTE The Max Total Pwr and Input Atten settings are coupled together, so changing the input Max Total Pwr setting by x dB changes the Input Atten setting by x dB. When you switch to a different measurement, the Max Total Pwr setting is kept constant, but the Input Atten may change if the two measurements have different mixer margins. Therefore, you can set the input attenuator manually, or you can set it indirectly by specifying the expected maximum power from the UUT.
• Trigger
NOTE The actual trigger source is selected separately for each measurement under the Meas Setup key. Also available by pressing the front-panel Trig key.
— RF Burst (Wideband), Video (IF Envlp), Ext Front, or Ext Rear - Pressing one of these trigger keys will access a menu used to specify the Delay, Level and Slope settings for each trigger source as follows:
❏ Delay - Allows you to enter numerical values to modify the
Input Default Settings
RF Input Range Autoa
a. Auto is not used for Spectrum measurements.
Max Total Power − 15.00 dBmb
b. This may differ if the maximum input power is more than − 15.00 dBm.
Input Atten 0.00 dBb
Ext Atten MS 0.00 dB
Ext Atten BS 0.00 dB
92 Chapter 3

NADC and PDC Key ReferenceNADC and PDC Mode Front Panel Keys
NA
DC
and
PD
C K
ey Referen
ce
delay time. The range is − 500.000 to +500.000 ms with 1 ns resolution. For trigger delay use a positive value, and for pre-trigger use a negative value.
❏ Level - Allows you to enter a numerical value to adjust the trigger level depending on the trigger source selected.
For RF Burst selection, the RF level range is − 200.00 to 0.00 dB with 0.01 dB resolution, relative to the peak RF signal level. The realistic range can be down to − 20 dB.For Video selection, the video level range is − 200.00 to +50.00 dBm with 0.01 dB resolution at the RF input. The realistic range can be down to around − 40 dBm, depending on the noise level of the signal.For Ext Front or Ext Rear selection, the level range is − 5.00 to +5.00 V with 1 mV resolution.
❏ Slope Pos Neg - Allows you to toggle the trigger slope between Pos at the rising edge and Neg at the falling edge of the burst signal.
— Trig Holdoff - Allows you to set the period of time before the next trigger can occur. The range is 0.000 to 500.0 ms with 1 µs resolution.
— Auto Trig - Allows you to specify a time for a trigger timeout. The range is 0.000 to 1000 sec with 1 µs resolution. If no trigger occurs by the specified time, a trigger is automatically generated.
— Frame Timer - Allows you to access the Frame Timer menu to manually control the frame timer:
• Period - Allows you to set the period of the frame clock. The range is 1.000 to 559.0 ms. Finest resolution is 1 ns. When Traffic Rate is Full, the default is 20.0 ms. When Traffic Rate is Half, the default is 40.0 ms.
Chapter 3 93

NADC and PDC Key ReferenceNADC and PDC Mode Front Panel Keys
NA
DC
an
d P
DC
Key
Ref
eren
ce
• Burst
— Delay - Allows you to set the delay time after searching a threshold level of NADC bursts. The range is − 500.0 to +500.0 ms with 1 ns resolution.
— Search Threshold - Allows you to set the threshold level used in search for NADC bursts after data is acquired. The range is − 200.00 to − 0.01 dB with 0.01 dB resolution. The realistic lower
range can be down to the noise floor level of the signal.
Trigger Default Settings
RF Burst:
Delay 0.000 sec
Peak Level − 10.0 dB
Slope Pos
Video:
Delay 0.000 s
Level − 30.00 dBm
Slope Pos
Ext Front & Ext Rear:
Delay 0.000 s
Level 2.00 V
Slope Pos
Trig Holdoff 10.00 ms
Auto Trig 100.0 ms, On
Frame Timer Period 20.00000 ms when Traffic Rate is Full40.00000 ms when Traffic Rate is Half
Burst Default Settings
Delay 0.000 s
Search Threshold − 30.00 dB
94 Chapter 3
NADC and PDC Key ReferenceNADC and PDC Measurement Keys
NA
DC
and
PD
C K
ey Referen
ce
NADC and PDC Measurement Keys
Adjacent Channel Power Keys
NOTE You must be in NADC or PDC mode, and have selected ACP under the MEASURE menu for the following menus to become available.
To access the NADC measurement personality press the MODE key and select NADC.
To access the PDC measurement personality press the MODE key and select PDC.
Meas Setup Key Menu
Key Path: Meas Setup
• Avg Number - Allows you to select whether averages are made or not, and allows you to change the number of N averages that are made.
• Avg Mode - Allows you to choose either exponential or repeat averaging. This selection only effects the averaging after the number of N averages is reached (set using the Averages, Avg Bursts, or Avg Number key).
— Exponential averaging: When Measure is set at Cont, data acquisitions will continue indefinitely. After N averages, exponential averaging is used with a weighting factor of N (the displayed average count stops at N). Exponential averaging weights new data more than old data, which allows tracking of slow-changing signals. The weighting factor N is set using the Averages, Avg Bursts, or Avg Number key.
— Repeat averaging: When Measure is set at Cont, data acquisitions will continue indefinitely. After N averages is reached, all previous result data is cleared and the average count is set back to 1. This is equivalent to being in Measure Single and pressing the Restart key when the Single measurement finishes.
• Trig Source Key Menu
Changing the selection in the Trig Source menu alters the trigger source for the selected measurement only. Not all of the selections are available for all measurements. Note that the RF Burst (Wideband), Video (IF Envlp), Ext Front, and Ext Rear menu keys found in the Trigger menu enable you to change settings to modify the delay, level, and slope for each of these trigger sources. Choose one of the following sources:
— Free Run (Immediate) - The trigger occurs at the time the data is
Chapter 3 95

NADC and PDC Key ReferenceNADC and PDC Measurement Keys
NA
DC
an
d P
DC
Key
Ref
eren
ce
requested, completely asynchronous to the RF or IF signal.
— RF Burst (Wideband) - An internal wideband RF burst trigger that has an automatic level control for burst signals. It triggers on a level that is relative to the peak of the signal passed by the RF. If the data sent is all 0 bits, this trigger will give erratic or falsely high EVM results.
— Video (IF Envlp) - An internal IF envelope trigger. It triggers on an absolute threshold level of the signal passed by the IF.
— Ext Front - Activates the front panel external trigger input (EXT TRIGGER INPUT). The external trigger must be a signal between − 5 and +5 volts.
— Ext Rear - Activates the rear panel external trigger input (TRIGGER IN). The external trigger must be a signal between − 5 and +5 volts.
— Frame - Uses the internal frame clock to generate a trigger signal. The clock parameters are controlled under the Mode Setup key or the measurement firmware, but not both. See the specific measurement for details.
— Line - Activates an internal line trigger. Sweep triggers occur at intervals synchronized to the line frequency.
NOTE Rear panel TRIGGER 1 OUT and TRIGGER 2 OUT connectors are coupled to the selected trigger source. These trigger outputs are always on the rising edge with a pulse width of at least 1 µs.
• Limit Test - Allows you to toggle the limit test function between On and Off. If set to On, Abs Limit and/or Rel Lim (Car) need to be specified to execute pass/fail tests with the logical judgement under the Fail key. Pass or fail results are shown in the active display window with the number of averages. In the text window, a red character F is shown on the right side of each measurement result, either relative or absolute, if it exceeds the limits with its logical judgement.
• Ofs & Limits - Allows you to access the menu to change the following parameters for pass/fail tests:
Offset - Allows you to access the memory selection menu to store 5 offset frequency values in A through E. Only one selection at a time (A, B, C, D, or E) is shown on this key label. The default selection is A.
Offset Freq - Allows you to enter an offset frequency value and toggle the offset frequency function between On and Off, according to each offset key selected. The allowable range is 0 Hz to 200.000 kHz. While this key is activated, enter an offset value from the numeric keypad by terminating with one of the
96 Chapter 3

NADC and PDC Key ReferenceNADC and PDC Measurement Keys
NA
DC
and
PD
C K
ey Referen
ce
frequency unit keys shown.
For NADC measurements offsets A, B and C are defaulted to 30.000 kHz On, 60.000 kHz On, and 90.000 kHz On, respectively. Offset D is temporarily defaulted to 120.000 kHz Off while offset E is defaulted to 0.00 Hz Off. One offset frequency value selected from the Offset menu is shown on this key label. The default state shows 30.000 kHz On.
For PDC measurements offsets A and B are defaulted to 50.000 kHz On and 100.000 kHz On, respectively, while offsets C, D and E are defaulted to 0.0 Hz Off. One offset frequency value selected from the Offset menu is shown on this key label. The default state shows 50.000 kHz On
Offset Power - (NADC Only) Allows you to select either one of the following power measurement methods:
Integ (integration) - Measures the total power within the NADC bandwidth of 32.8 kHz with the root-raised cosine weighting filter.
Peak - In a 1 kHz resolution bandwidth, the peak frequency amplitude across the 30 kHz channel is reported. When averaging is on, an rms average is computed prior to the peak selection. This creates a banded limit line measurement, similar to other standards which call for a close-in spurious response measurement. Limits can be relative or absolute. When the limits are relative, the average power in the reference channel, normalized to a 1 kHz bandwidth, is used to compute the ratio.
Abs Limit - Allows you to enter an absolute limit value ranging from − 200.00 to +50.00 dBm with the best resolution of 0.01 dB.
For NADC the default settings for offsets A, B, D and E are 0.00 dBm, while offset C is defaulted to − 13.00 dBm to make the OR logical judgement with its relative limit of − 45.00 dB.
For PDC the default settings for all offsets 0.00 dBm.
Fail - Allows you to access the following menu to select one of the logic keys for fail conditions between the measurement results and the test limits:
AND - Fail is shown if one of the relative ACP measurement results is larger than Rel Lim (Car) AND one of the absolute ACP measurement results is larger than Abs Limit. This is the default setting for offsets D and E.
OR - Fail is shown if one of the relative ACP measurement results is larger than Rel Lim (Car) OR one of the absolute ACP measurement results is larger than Abs Limit. This is the default setting for offset C.
Chapter 3 97
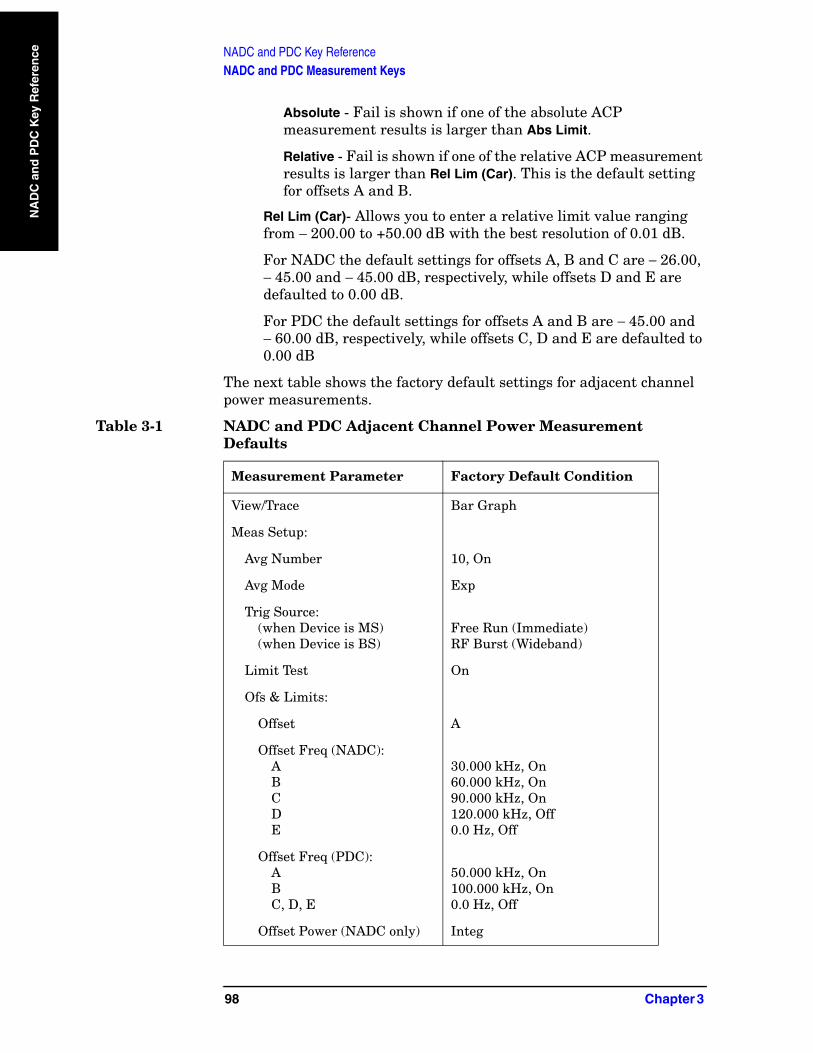
NADC and PDC Key ReferenceNADC and PDC Measurement Keys
NA
DC
an
d P
DC
Key
Ref
eren
ce
Absolute - Fail is shown if one of the absolute ACP measurement results is larger than Abs Limit.
Relative - Fail is shown if one of the relative ACP measurement results is larger than Rel Lim (Car). This is the default setting for offsets A and B.
Rel Lim (Car)- Allows you to enter a relative limit value ranging from − 200.00 to +50.00 dB with the best resolution of 0.01 dB.
For NADC the default settings for offsets A, B and C are − 26.00, − 45.00 and − 45.00 dB, respectively, while offsets D and E are defaulted to 0.00 dB.
For PDC the default settings for offsets A and B are − 45.00 and − 60.00 dB, respectively, while offsets C, D and E are defaulted to 0.00 dB
The next table shows the factory default settings for adjacent channel power measurements.
Table 3-1 NADC and PDC Adjacent Channel Power Measurement Defaults
Measurement Parameter Factory Default Condition
View/Trace Bar Graph
Meas Setup:
Avg Number 10, On
Avg Mode Exp
Trig Source:(when Device is MS)(when Device is BS)
Free Run (Immediate)RF Burst (Wideband)
Limit Test On
Ofs & Limits:
Offset A
Offset Freq (NADC):ABCDE
30.000 kHz, On60.000 kHz, On90.000 kHz, On120.000 kHz, Off0.0 Hz, Off
Offset Freq (PDC):ABC, D, E
50.000 kHz, On100.000 kHz, On0.0 Hz, Off
Offset Power (NADC only) Integ
98 Chapter 3

NADC and PDC Key ReferenceNADC and PDC Measurement Keys
NA
DC
and
PD
C K
ey Referen
ce
Abs Limit (NADC):A, B, D, EC
0.00 dBm− 13.00 dBm
Abs Limit (PDC):A, B, C, D, E 0.00 dBm
Fail:A, BCD, E
RelativeORAND
Rel Lim (Car) (NADC):AB, CD, E
− 26.00 dB− 45.00 dB0.00 dB
Rel Limit (Car) (PDC):ABC, D, E
− 45.00 dB− 60.00 dB0.00 dB
Table 3-1 NADC and PDC Adjacent Channel Power Measurement Defaults
Measurement Parameter Factory Default Condition
Chapter 3 99

NADC and PDC Key ReferenceNADC and PDC Measurement Keys
NA
DC
an
d P
DC
Key
Ref
eren
ce
View/Trace Key Menu
Key Path: View/Trace
Selections under the View/Trace key menu allow you see different data presentations as follows:
• Bar Graph - (NADC) In the factory default condition, 7 of the total integration power levels, centered at the carrier frequency and ±30 kHz, ±60 kHz and ±90 kHz offset frequencies, are shown in the bar graph window. The corresponding measured data is shown in the text window as shown in Figure 3-3 on page 100.
Figure 3-3 Adjacent Channel Power Measurement - NADC Bar Graph View
100 Chapter 3

NADC and PDC Key ReferenceNADC and PDC Measurement Keys
NA
DC
and
PD
C K
ey Referen
ce
Bar Graph - (PDC) In the factory default condition, 5 of the total integration power levels within 21.0 kHz bandwidth, centered at the carrier frequency and ±50 kHz and ±100 kHz offset frequencies, are shown in the bar graph window. The corresponding measured data is shown in the text window as shown in Figure 3-4 on page 101.
Figure 3-4 Adjacent Channel Power Measurement - PDC Bar Graph View
Chapter 3 101

NADC and PDC Key ReferenceNADC and PDC Measurement Keys
NA
DC
an
d P
DC
Key
Ref
eren
ce
• Spectrum - (NADC) Once this view is selected, Figure 3-5 on page 102 changes as shown below. In the factory default condition, the swept frequency spectrum is displayed with the bandwidth marker lines in the spectrum graph window. The corresponding measured data in the text window is the total integration power within the defined bandwidth. While in this view, you can change the vertical scale by pressing the AMPLITUDE Y Scale key.
Figure 3-5 Adjacent Channel Power Measurement - NADC Spectrum View
102 Chapter 3

NADC and PDC Key ReferenceNADC and PDC Measurement Keys
NA
DC
and
PD
C K
ey Referen
ce
Spectrum - (PDC) Once this view is selected, Figure 3-6 on page 103 changes as shown below. In the factory default condition, the swept frequency spectrum is displayed with the bandwidth marker lines in the spectrum graph window. The corresponding measured data in the text window is the total integration power within the defined bandwidth of 21.0 kHz. While in this view, you can change the vertical scale by pressing the AMPLITUDE Y Scale key.
Figure 3-6 Adjacent Channel Power Measurement - PDC Spectrum View
Chapter 3 103

NADC and PDC Key ReferenceNADC and PDC Measurement Keys
NA
DC
an
d P
DC
Key
Ref
eren
ce
Error Vector Magnitude (EVM) Keys
NOTE You must be in NADC or PDC mode, and have selected EVM under the MEASURE menu for the following menus to become available.
To access the NADC measurement personality press the MODE key and select NADC.
To access the PDC measurement personality press the MODE key and select PDC.
Meas Setup Key Menu
Key Path: Meas Setup
• Avg Number On Off - Allows you to select whether averages are made or not, and allows you to change the number of N averages that are made.
• Avg Mode Exp Repeat - Allows you to choose either exponential or repeat averaging. This selection only effects the averaging after the number of N averages is reached (set using the Averages, Avg Bursts, or Avg Number key).
— Exponential averaging - When Measure is set at Cont, data acquisitions will continue indefinitely. After N averages, exponential averaging is used with a weighting factor of N (the displayed average count stops at N). Exponential averaging weights new data more than old data, which allows tracking of slow-changing signals. The weighting factor N is set using the Averages, Avg Bursts, or Avg Number key.
— Repeat averaging - When Measure is set at Cont, data acquisitions will continue indefinitely. After N averages is reached, all previous result data is cleared and the average count is set back to 1. This is equivalent to being in Measure Single and pressing the Restart key when the Single measurement finishes.
• Trig Source Key Menu
Changing the selection in the Trig Source menu alters the trigger source for the selected measurement only. Not all of the selections are available for all measurements. Note that the RF Burst (Wideband), Video (IF Envlp), Ext Front, and Ext Rear menu keys found in the Trigger menu enable you to change settings to modify the delay, level, and slope for each of these trigger sources. Choose one of the following sources:
— Free Run (Immediate) - The trigger occurs at the time the data is requested, completely asynchronous to the RF or IF signal.
— RF Burst (Wideband) - An internal wideband RF burst trigger that has an automatic level control for burst signals. It triggers on a
104 Chapter 3
NADC and PDC Key ReferenceNADC and PDC Measurement Keys
NA
DC
and
PD
C K
ey Referen
ce
level that is relative to the peak of the signal passed by the RF. If the data sent is all 0 bits, this trigger will give erratic or falsely high EVM results.
— Video (IF Envlp) - An internal IF envelope trigger. It triggers on an absolute threshold level of the signal passed by the IF.
— Ext Front - Activates the front panel external trigger input (EXT TRIGGER INPUT). The external trigger must be a signal between − 5 and +5 volts.
— Ext Rear - Activates the rear panel external trigger input (TRIGGER IN). The external trigger must be a signal between − 5 and +5 volts.
— Frame - Uses the internal frame clock to generate a trigger signal. The clock parameters are controlled under the Mode Setup key or the measurement firmware, but not both. See the specific measurement for details.
— Line - Activates an internal line trigger. Sweep triggers occur at intervals synchronized to the line frequency.
NOTE Rear panel TRIGGER 1 OUT and TRIGGER 2 OUT connectors are coupled to the selected trigger source. These trigger outputs are always on the rising edge with a pulse width of at least 1 µs.
• Burst Sync
Pressing the Burst Sync key allows you to choose the source used to synchronize the measurement to the “point 0” of the NADC burst.
For NADC the “point 0” is defined as the start of symbol 1 in timeslot 1. For PDC the “point 0” is defined as the start of symbol 0 in timeslot 0.
Pressing the Burst Sync key will bring up a menu with the following choices:
— Sync Word - Synchronizes the measurement to the sync word, which is one of the six possible 28-bit NADC timeslot synchronization words contained in the signal. This is the default setting when Device is set to MS.
— RF Amptd - Synchronizes the measurement to the rising edge of the bursted RF carrier. The Search Threshold setting in the Burst menu under Mode Setup applies to this RF Amptd selection.
— None - Measurements are made without synchronizing with the NADC burst. This is the default when Device is set to BS.
• Limit Test - Allows you to toggle the limit test function between On and Off. If set to On, the Limits key needs to be pressed to specify the limit values for rms EVM, peak EVM and origin offset. Pass or fail
Chapter 3 105
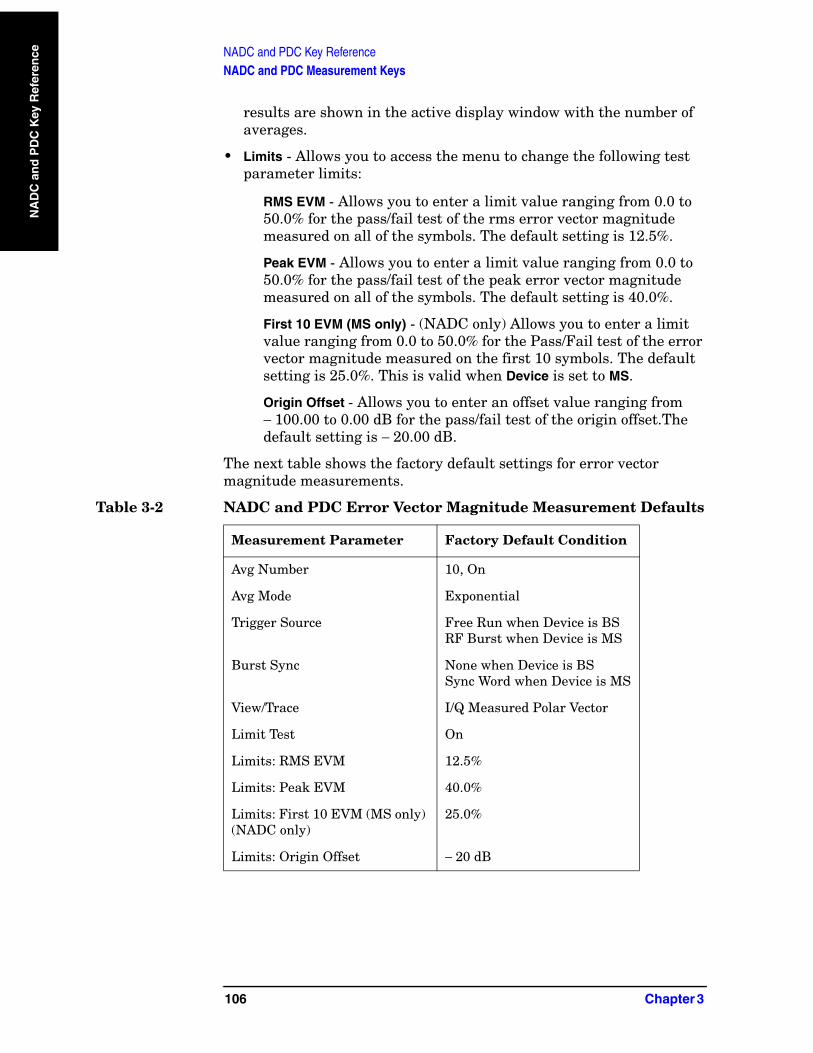
NADC and PDC Key ReferenceNADC and PDC Measurement Keys
NA
DC
an
d P
DC
Key
Ref
eren
ce
results are shown in the active display window with the number of averages.
• Limits - Allows you to access the menu to change the following test parameter limits:
RMS EVM - Allows you to enter a limit value ranging from 0.0 to 50.0% for the pass/fail test of the rms error vector magnitude measured on all of the symbols. The default setting is 12.5%.
Peak EVM - Allows you to enter a limit value ranging from 0.0 to 50.0% for the pass/fail test of the peak error vector magnitude measured on all of the symbols. The default setting is 40.0%.
First 10 EVM (MS only) - (NADC only) Allows you to enter a limit value ranging from 0.0 to 50.0% for the Pass/Fail test of the error vector magnitude measured on the first 10 symbols. The default setting is 25.0%. This is valid when Device is set to MS.
Origin Offset - Allows you to enter an offset value ranging from − 100.00 to 0.00 dB for the pass/fail test of the origin offset.The default setting is − 20.00 dB.
The next table shows the factory default settings for error vector magnitude measurements.
Table 3-2 NADC and PDC Error Vector Magnitude Measurement Defaults
Measurement Parameter Factory Default Condition
Avg Number 10, On
Avg Mode Exponential
Trigger Source Free Run when Device is BSRF Burst when Device is MS
Burst Sync None when Device is BSSync Word when Device is MS
View/Trace I/Q Measured Polar Vector
Limit Test On
Limits: RMS EVM 12.5%
Limits: Peak EVM 40.0%
Limits: First 10 EVM (MS only) (NADC only)
25.0%
Limits: Origin Offset − 20 dB
106 Chapter 3

NADC and PDC Key ReferenceNADC and PDC Measurement Keys
NA
DC
and
PD
C K
ey Referen
ce
View/Trace Key Menu
Key Path: View/Trace
Selections under the View/Trace key menu allow you see different data presentations as follows:
• I/Q Measured Polar Vector - The measured summary data is shown in the left window and the dynamic vector trajectory of the I/Q demodulated signal is shown as a polar vector display in the right window, as shown in Figure 3-7 on page 107.
NOTE For NADC only, when Device is set to MS, the First 10 Symbols EVM result is also shown in the left window
Figure 3-7 Error Vector Magnitude Measurement - Polar Vector View
Chapter 3 107
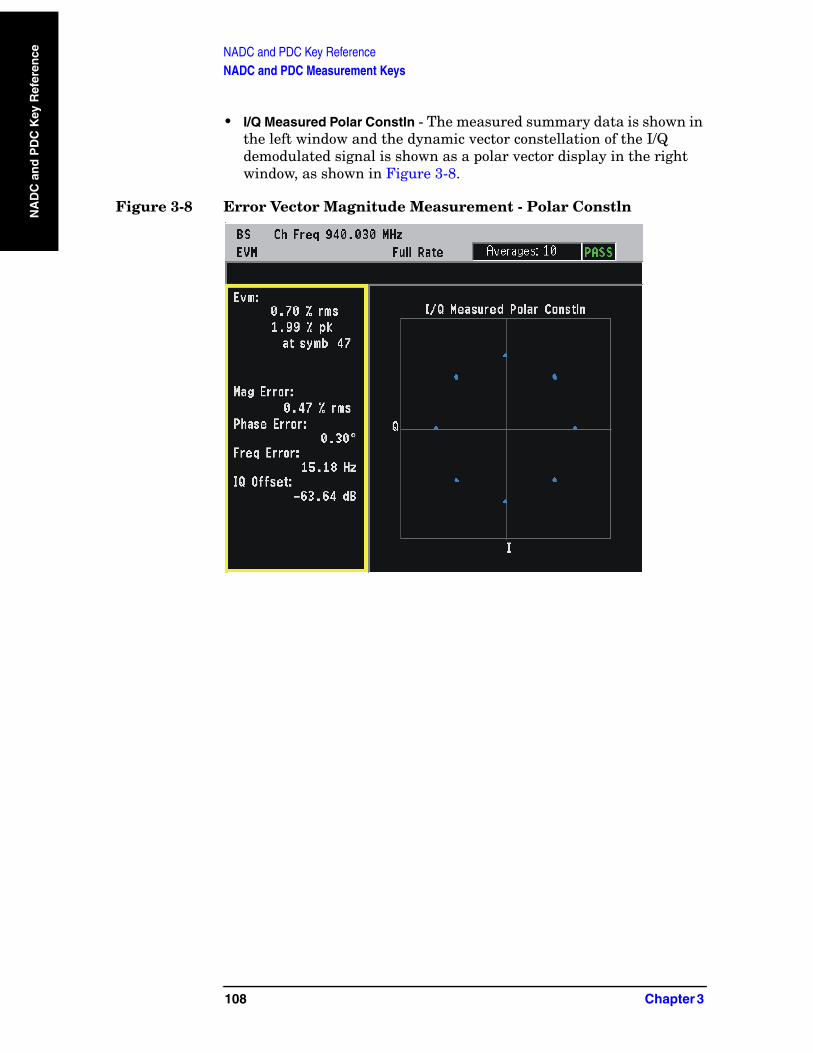
NADC and PDC Key ReferenceNADC and PDC Measurement Keys
NA
DC
an
d P
DC
Key
Ref
eren
ce
• I/Q Measured Polar Constln - The measured summary data is shown in the left window and the dynamic vector constellation of the I/Q demodulated signal is shown as a polar vector display in the right window, as shown in Figure 3-8.
Figure 3-8 Error Vector Magnitude Measurement - Polar Constln
108 Chapter 3

NADC and PDC Key ReferenceNADC and PDC Measurement Keys
NA
DC
and
PD
C K
ey Referen
ce
• I/Q Error (Quad-View) - Four display windows show EVM, Mag Error and Phase Error graphs, and the EVM summary data text.
Figure 3-9 Error Vector Magnitude Measurement - Quad View
Chapter 3 109

NADC and PDC Key ReferenceNADC and PDC Measurement Keys
NA
DC
an
d P
DC
Key
Ref
eren
ce
Display Key Menu
Key Path: Display
The Display key accesses menus to allow the following selections to change the graphs displayed:
• Pts/Symb Displayed - Allows you to specify the number of displayed points per symbol, either 1 or 5. The default setting is 5.
• Symbol Dots - Allows you to toggle the symbol dots between On and Off. The default setting is On.
NOTE When either EVM, Phase Error or Mag Error window is active in the I/Q Error (Quad-View) display, the Span X Scale key accesses the menu to allow the following selections:
• Scale/Div - Allows you to define the horizontal scale by changing the symbol value per division. The range is 1 to 100 symbols per division.
For NADC the default setting is 16.1 (for BS) or 15.6 for MS) symbols per division.
For PDC the default setting is 13.7 (for BS) or 13.4 (for MS) symbols per division.
• Ref Value - Allows you to set the symbol reference value ranging from 0 to 1000 symbols. The default setting is 0.
• Ref Position - Allows you to set the reference position to either Left, Ctr (center) or Right. The default setting is Left.
• Scale Coupling - Allows you to toggle the scale coupling function between On and Off. The default setting is On. This function automatically determines the scale per division and reference value by the magnitude of the measurement results.
NOTE When either EVM: or Mag Error: window is active in the I/Q Error (Quad-View) display, the AMPLITUDE Y Scale key accesses the menu to allow the following selections:
• Scale/Div - Allows you to define the vertical scale by changing the value per division. The range is 0.1 to 50% per division. The default setting is 20.0%. However, since the Scale Coupling default is set to On, this value is automatically determined by the measurement results.
• Ref Value - Allows you to set the reference value ranging from 0 to 500%. The default setting is 0%.
• Ref Position - Allows you to set the reference position to either Top, Ctr (center) or Bot (bottom). For the EVM: graph, the default setting is Bot. For the Mag Error: graph the default setting is Ctr.
110 Chapter 3

NADC and PDC Key ReferenceNADC and PDC Measurement Keys
NA
DC
and
PD
C K
ey Referen
ce
• Scale Coupling - Allows you to toggle the scale coupling function between On and Off. The default setting is On. This function automatically determines the scale per division and reference value by the magnitude of the measurement results.
NOTE When the Phase Error: window is active in the I/Q Error display, the AMPLITUDE Y Scale key accesses the menu to allow the following selections:
• Scale/Div - Allows you to define the vertical scale by changing the value per division. The range is 0.01 to 3600 degrees. The default setting is 20.0 degrees per division. However, since the Scale Coupling default is set to On, this value is automatically determined by the measurement results.
• Ref Value - Allows you to set the reference value ranging from 0 to 500%. The default setting is 0%.
• Ref Position - Allows you to set the reference position to either Top, Ctr (center) or Bot (bottom). For the EVM graph, the default setting is Bot. For the Mag Error graph, the default setting is Ctr.
• Scale Coupling - Allows you to toggle the scale coupling function between On and Off. The default setting is On. This function automatically determines the scale per division and reference value by the magnitude of the measurement results.
Occupied Bandwidth Keys (PDC Only)
Meas Setup Key Menu
NOTE You must be in PDC mode, and have selected Occupied Bandwidth under the MEASURE menu for the following menus to become available
To access the PDC measurement personality press the MODE key and select PDC.
Key Path: Meas Setup
Make sure the Occupied Bandwidth measurement is selected under the Measure menu. The Meas Setup key accesses the menu which allows you to modify the averaging and trigger source for this measurement. However, the trigger source does not include Frame and Line. In addition, the following occupied bandwidth measurement parameters can be modified:
• Avg Number On Off - Allows you to select whether averages are made or not, and allows you to change the number of N averages that are made.
• Avg Mode Exp Repeat - Allows you to choose either exponential or
Chapter 3 111

NADC and PDC Key ReferenceNADC and PDC Measurement Keys
NA
DC
an
d P
DC
Key
Ref
eren
ce
repeat averaging. This selection only effects the averaging after the number of N averages is reached (set using the Averages, Avg Bursts, or Avg Number key).
— Exponential averaging - When Measure is set at Cont, data acquisitions will continue indefinitely. After N averages, exponential averaging is used with a weighting factor of N (the displayed average count stops at N). Exponential averaging weights new data more than old data, which allows tracking of slow-changing signals. The weighting factor N is set using the Averages, Avg Bursts, or Avg Number key.
— Repeat averaging - When Measure is set at Cont, data acquisitions will continue indefinitely. After N averages is reached, all previous result data is cleared and the average count is set back to 1. This is equivalent to being in Measure Single and pressing the Restart key when the Single measurement finishes.
• Trig Source Key Menu
Changing the selection in the Trig Source menu alters the trigger source for the selected measurement only. Not all of the selections are available for all measurements. Note that the RF Burst (Wideband), Video (IF Envlp), Ext Front, and Ext Rear menu keys found in the Trigger menu enable you to change settings to modify the delay, level, and slope for each of these trigger sources. Choose one of the following sources:
— Free Run (Immediate) - The trigger occurs at the time the data is requested, completely asynchronous to the RF or IF signal.
— RF Burst (Wideband) - An internal wideband RF burst trigger that has an automatic level control for burst signals. It triggers on a level that is relative to the peak of the signal passed by the RF. If the data sent is all 0 bits, this trigger will give erratic or falsely high EVM results.
— Video (IF Envlp) - An internal IF envelope trigger. It triggers on an absolute threshold level of the signal passed by the IF.
— Ext Front - Activates the front panel external trigger input (EXT TRIGGER INPUT). The external trigger must be a signal between − 5 and +5 volts.
— Ext Rear - Activates the rear panel external trigger input (TRIGGER IN). The external trigger must be a signal between − 5 and +5 volts.
— Frame - Uses the internal frame clock to generate a trigger signal. The clock parameters are controlled under the Mode Setup key or the measurement firmware, but not both. See the specific measurement for details.
— Line - activates an internal line trigger. Sweep triggers occur at
112 Chapter 3
NADC and PDC Key ReferenceNADC and PDC Measurement Keys
NA
DC
and
PD
C K
ey Referen
ce
intervals synchronized to the line frequency.
NOTE Rear panel TRIGGER 1 OUT and TRIGGER 2 OUT connectors are coupled to the selected trigger source. These trigger outputs are always on the rising edge with a pulse width of at least 1 µs.
• Limit Test - Allows you to toggle the limit test function between On and Off. Pass or fail results are shown in the active display window with the number of averages.
• Limit - Allows you to specify the frequency limit value ranging from 10.000 to 60.000 kHz with 0.1 kHz resolution. The default value is 32.000 kHz.
Chapter 3 113
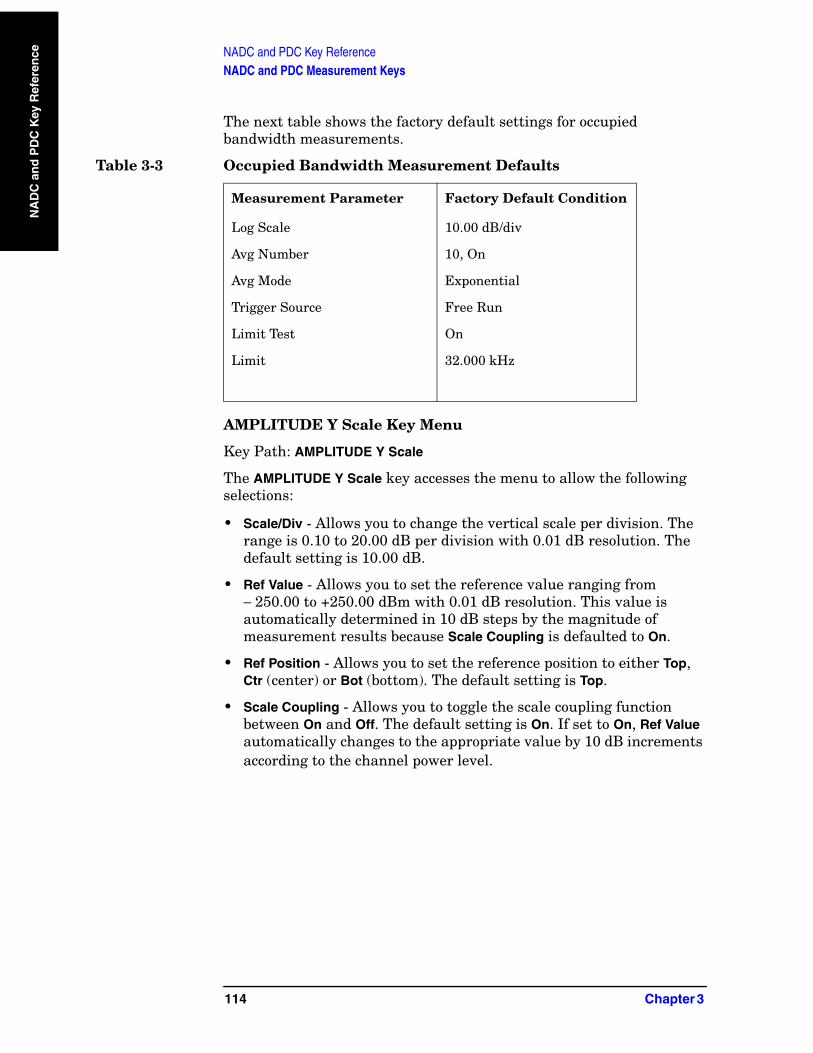
NADC and PDC Key ReferenceNADC and PDC Measurement Keys
NA
DC
an
d P
DC
Key
Ref
eren
ce
The next table shows the factory default settings for occupied bandwidth measurements.
AMPLITUDE Y Scale Key Menu
Key Path: AMPLITUDE Y Scale
The AMPLITUDE Y Scale key accesses the menu to allow the following selections:
• Scale/Div - Allows you to change the vertical scale per division. The range is 0.10 to 20.00 dB per division with 0.01 dB resolution. The default setting is 10.00 dB.
• Ref Value - Allows you to set the reference value ranging from − 250.00 to +250.00 dBm with 0.01 dB resolution. This value is automatically determined in 10 dB steps by the magnitude of measurement results because Scale Coupling is defaulted to On.
• Ref Position - Allows you to set the reference position to either Top, Ctr (center) or Bot (bottom). The default setting is Top.
• Scale Coupling - Allows you to toggle the scale coupling function between On and Off. The default setting is On. If set to On, Ref Value automatically changes to the appropriate value by 10 dB increments according to the channel power level.
Table 3-3 Occupied Bandwidth Measurement Defaults
Measurement Parameter Factory Default Condition
Log Scale 10.00 dB/div
Avg Number 10, On
Avg Mode Exponential
Trigger Source Free Run
Limit Test On
Limit 32.000 kHz
114 Chapter 3

NADC and PDC Key ReferenceNADC and PDC Measurement Keys
NA
DC
and
PD
C K
ey Referen
ce
Spectrum (Frequency Domain) Keys
NOTE You must have selected Spectrum under the MEASURE menu to access these menus
Meas Setup Key Menu
Key Path: Meas Setup
• Span - Modifies the frequency span. The range is 10 Hz to 10 MHz with 1 Hz resolution, depending on the Res BW setting. Changing the span causes the resolution bandwidth to change automatically, and will affect data acquisition time. For PSA Option 122 wideband operation, the maximum span is 80 MHz. For PSA Option 140 wideband operation, the maximum span is 40 MHz.
• Res BW - Sets the resolution bandwidth for the FFT, and to toggle its mode between Auto and Man (manual). If set to Auto, the resolution bandwidth is set to Span/50 (2% of the span). If set to Man, you can enter a value ranging from 100.0 mHz to 3.00000 MHz. A narrower bandwidth will result in a longer data acquisition time.
• Wideband Setup (PSA Options 122 and 140 only.) configures the wideband hardware path.
— Wideband IF Gain - Sets the gain for the wideband IF path in 2 dB steps from − 12 to +12 dB. You must have selected IF Path Wide. Increasing the gain can increase the amplitude of small signals as long as you don’t overdrive the hardware. Wideband gain should usually be adjusted after setting the input attenuation.
— Wideband Filtering - Accesses the keys to configure the optional channel filter. The default is no filtering.
❏ Filter Type - Selects None for no filtering, or Raised Cosine, RRC (root-raised cosine), Nyquist, Root Nyquist, and Gaussian.
❏ Filter Alpha - Selects the filter alpha.
❏ Filter BW - Selects the filter bandwidth. Bandwidth is not entered as a frequency. The value is entered as a ratio of the current instrument sampling rate (that is, BW/sample rate).
— Wideband Advanced - These keys are only for the PSA Option 122 or140 in wideband operation. Accesses the advanced settings for the wideband IF hardware path.
NOTE Parameters under the Wideband Advanced key seldom need to be changed. Any changes from the default advanced values may result in invalid measurement data.
Chapter 3 115

NADC and PDC Key ReferenceNADC and PDC Measurement Keys
NA
DC
an
d P
DC
Key
Ref
eren
ce
❏ ADC Corr - Turning corrections on performs an ADC calibration to reduce the spectral image and applies the corrections.
❏ IF Flat Corr - Turns IF flatness corrections on and off for the Option 122 or 140 wideband IF. This control is independent of the narrowband IF flatness control.
❏ Analog Filter - Manually selects the 80 MHz (Option 122), 40 MHz (Option 140), or 36 MHz anti-alias filter, which overides the automatic selection of the bandwidth.
❏ WB ADC Dither - Toggles the ADC dither function on/off.. The “ADC dither” refers to the introduction of noise to the digitized steps of the analog-to-digital converter; the result is an improvement in amplitude accuracy. The wideband dither control does not affect the ADC dither in the narrowband IF path.
❏ FFT Window - Accesses the following selection menu. Unless you are familiar with FFT windows, use the flat top filter (the default filter).
— Flat Top - Selects this filter for best amplitude accuracy by reducing scalloping error.
— Uniform - Select this filter to have no window active by using the uniform setting.
— Hanning - Press this key to activate the Hanning filter.
— Hamming - Press this key to activate the Hamming filter.
— Gaussian - Press this key to activate the Gaussian filter with the roll-off factor (alpha) of 3.5.
— Blackman - Press this key to activate the Blackman filter.
— Blackman Harris - Press this key to activate the Blackman Harris filter.
— K-B 70dB/90dB/110dB (Kaiser-Bessel) - Select one of the Kaiser-Bessel filters with sidelobes at −70, −90, or −110 dBc.
❏ FFT Size - Accesses the menu to change the following parameters:
— Length Ctrl - Toggles the FFT and window length setting function between Auto and Man (manual).
— Min Pts in RBW - Sets the minimum number of data points that will be used inside the resolution bandwidth. The range is 0.10 to 100.00 points with 0.01 resolution. This key is grayed out if Length Ctrl is set to Man.
— Window Length - Enters the FFT window length in the
116 Chapter 3

NADC and PDC Key ReferenceNADC and PDC Measurement Keys
NA
DC
and
PD
C K
ey Referen
ce
number of capture samples, ranging from 8 to 1048576. This length represents the actual quantity of I/Q samples that are captured for processing by the FFT (“Capture Time” is the associated parameter shown on the screen). This key is grayed out if Length Control is set to Auto.
— FFT Length - Enters the FFT length in the number of captured samples, ranging from 8 to 1048576. The FFT length setting is automatically limited so that it is equal to or greater than the FFT window length setting. Any amount greater than the window length is implemented by zero-padding. This key is grayed out if Length Control is set to Auto.
• Average
— Avg Number - llows you to select whether averages are made or not, and allows you to change the number of N averages that are made.
— Avg Mode - Allows you to choose either Exp (exponential) or Repeat. This selection only affects the averaging result after the number of N averages is reached. The N is set using the Avg Number key.
❏ Normal averaging: Normal (linear) averaging is always used until the specified number of N averages is reached. When the Measure key under Meas Control is set to Single, data acquisition is stopped when the number of N averages is reached, thus Avg Mode has no effect in the single measurement mode.
❏ Exponential averaging: When Measure is set to Cont, data acquisition will continue indefinitely. Exponential averaging is used with a weighting factor of N (the displayed count of averages stops at N). Exponential averaging weights new data more heavily than old data, which allows tracking of slow-changing signals. The weighting factor N is set using the Avg Number key.
❏ Repeat averaging: When Measure is set to Cont, data acquisition will continue indefinitely. After the number of N averages is reached, all previous result data is cleared and the average count displayed is set back to 1. This is equivalent to being in Measure Single and pressing the Restart key each time the single measurement finishes.
— Avg Type - Accesses the menu of the following average types only for making spectrum (frequency domain) and waveform (time domain) measurements:
❏ Pwr Avg (RMS) - Executes the true power averaging which is calculated by averaging the rms voltage. This is the most
Chapter 3 117
NADC and PDC Key ReferenceNADC and PDC Measurement Keys
NA
DC
an
d P
DC
Key
Ref
eren
ce
accurate type.
❏ Log-Pwr Avg (Video) - Simulates the traditional spectrum analyzer type of averaging by calculating the log of the power. This type of averaging will underestimate the power when the signal is noise-like.
❏ Voltage Avg - Executes voltage averaging.
❏ Maximum - Captures peak voltage data. Simulates the traditional spectrum analyzer peak hold function.
❏ Minimum - Captures the minimum voltage data, similar to the maximum function.
— Time Avg Num - Changes the number of time averages to be made when using the Option 122 or 140 wideband hardware (PSA only). This averaging requires a frame trigger and is much faster than the standard averaging. This hardware averaging is done on the complex voltage time trace data before any measurement application averaging is done. Both types of averaging can be done on the same measurement data.
When time averaging is being done, each trace update represents N fresh data acquisitions averaged together, where N is the number of averages. You cannot access the individual time records that are being averaged in the hardware averager.
NOTE If your triggering is not set correctly, the signal can be averaged away to nothing. A HW Average message is displayed to show that the averaging is on.
• Trig Source
Key path: Meas Setup, Trig Source
NOTE Changing the selection in the Trig Source menu alters the trigger source for the selected measurement only.
— Free Run (Immediate) - A trigger occurs at the time the data is requested, completely asynchronous with the RF or IF signal.
— Video (Envlp) - An internal IF envelope trigger that occurs at the absolute threshold level of the IF signal level.
— RF Burst (Wideband) - An internal wideband RF burst trigger that has automatic level control for burst signals. It triggers at the level that is set relative to the peak RF signal (12 MHz bandwidth) input level. (Not available for Option 122 or 140 when using the wideband IF path.)
— Ext Front - Activates the front panel external trigger input (EXT TRIGGER INPUT) port. The external signal must be between − 5.00
118 Chapter 3

NADC and PDC Key ReferenceNADC and PDC Measurement Keys
NA
DC
and
PD
C K
ey Referen
ce
and +5.00 V with 1 or 10 mV resolution.
— Ext Rear - Activates the rear-panel external trigger input (TRIGGER IN) port. The external signal must be between − 5.00 and +5.00 V with 1 or 10 mV resolution.
— Frame - Uses the internal frame clock to generate a trigger signal. The clock parameters are controlled under the Mode Setup key or the measurement firmware, but not both. Refer to the specific measurement section for details.
— Line - Sets the trigger to the internal line mode. Sweep triggers occur at intervals synchronous to the line frequency. See the specific measurement section for details.
• IF Path - (Only for PSA with Option B7J and either Option 122 or 140 installed.) Selects either the standard narrowband IF hardware path or the wideband hardware.
• Restore Meas Defaults - Presets only the settings that are specific to the selected measurement by pressing Meas Setup, More (1 of 2), Restore Meas Defaults - This will set the measure setup parameters, for the currently selected measurement only, to the factory defaults.
• (Narrowband) Advanced Accesses the menu to change the following parameters.
NOTE The advanced features should be used only if you are familiar with their operation. Changes from the default values may result in invalid data.
The Narrowband key is only present if you have Option B7J and either Option 122 or 140 installed. Parameters that are under the (Narrowband) Advanced key only affect the standard narrow band IF path. The wideband IF advanced functions are found under the Wideband Advanced key.
— Pre-ADC BPF - Toggles the pre-ADC bandpass filter function between On and Off. The pre-ADC bandpass filter is useful for rejecting nearby signals, so that sensitivity within the span range can be improved by increasing the ADC range gain.
— Pre-FFT Fltr - Toggles the pre-FFT filter between Flat (flat top) and Gaussian. The pre-FFT filter defaults to a flat top filter which has better amplitude accuracy. The Gaussian filter has better pulse response.
— Pre-FFT BW - Toggles the pre-FFT bandwidth function between Auto and Man (manual). The pre-FFT bandwidth filter can be set between 1 Hz and 10 MHz. If set to Auto, this pre-FFT bandwidth is nominally 50% wider than the span. This bandwidth determines the ADC sampling rate.
— FFT Window - Accesses the following selection menu. Unless you
Chapter 3 119
NADC and PDC Key ReferenceNADC and PDC Measurement Keys
NA
DC
an
d P
DC
Key
Ref
eren
ce
are familiar with FFT windows, use the flat top filter (the default filter).
❏ Flat Top - Selects this filter for best amplitude accuracy by reducing scalloping error.
❏ Uniform - Select this filter to have no window active by using the uniform setting.
❏ Hanning - Press this key to activate the Hanning filter.
❏ Hamming - Press this key to activate the Hamming filter.
❏ Gaussian - Press this key to activate the Gaussian filter with the roll-off factor (alpha) of 3.5.
❏ Blackman - Press this key to activate the Blackman filter.
❏ Blackman Harris - Press this key to activate the Blackman Harris filter.
❏ K-B 70dB/90dB/110dB (Kaiser-Bessel) - Select one of the Kaiser-Bessel filters with sidelobes at − 70, − 90, or − 110 dBc.
— FFT Size - Accesses the menu to change the following parameters:
❏ Length Ctrl - Toggles the FFT and window length setting function between Auto and Man (manual).
❏ Min Pts in RBW - Sets the minimum number of data points that will be used inside the resolution bandwidth. The range is 0.10 to 100.00 points with 0.01 resolution. This key is grayed out if Length Ctrl is set to Man.
❏ Window Length - Enters the FFT window length in the number of capture samples, ranging from 8 to 1048576. This length represents the actual quantity of I/Q samples that are captured for processing by the FFT (“Capture Time” is the associated parameter shown on the screen). This key is grayed out if Length Control is set to Auto.
❏ FFT Length - Enters the FFT length in the number of captured samples, ranging from 8 to 1048576. The FFT length setting is automatically limited so that it is equal to or greater than the FFT window length setting. Any amount greater than the window length is implemented by zero-padding. This key is grayed out if Length Control is set to Auto.
— ADC Range - Accesses the menu to define one of the following ADC ranging functions:
❏ Auto - Sets the ADC range automatically. For most FFT spectrum measurements, the auto feature should not be selected. An exception is when measuring a signal which is “bursty”, in which case auto can maximize the time domain dynamic range, if FFT results are less important to you than
120 Chapter 3

NADC and PDC Key ReferenceNADC and PDC Measurement Keys
NA
DC
and
PD
C K
ey Referen
ce
time domain results.
❏ Auto Peak - Sets the ADC range automatically to the peak signal level. Auto peak is a compromise that works well for both CW and burst signals.
❏ Auto Peak Lock - Select this to hold the ADC range automatically at the peak signal level. Auto peak lock is more stable than auto peak for CW signals, but should not be used for “bursty” signals.
❏ Manual - Accesses the selection menu of values, − 6 to +24 dB for E4406A or None to +18 dB for PSA, to set the ADC range level. Also note that manual ranging is best for CW signals.
— Data Packing - Selects Auto (the default) or the Short (16 bit), Medium (24 bit) and Long (32 bit) methods of data packing. The short, medium, and long methods are not compatible with all settings and should not be used unless you are familiar with data packing methods. Auto is the preferred choice.
❏ Auto - The data packing value most appropriate for current instrument settings is selected automatically.
❏ Short (16 bit) - Select this to pack data every 16 bits.
❏ Medium (24 bit) - Select this to pack data every 24 bits.
❏ Long (32 bit) - Select this to pack data every 32 bits.
— ADC Dither - Toggles the ADC dither function between Auto, On, and Off. When set to Auto (the default), the ADC dither function will be activated when a narrow bandwidth is being measured, and deactivated when a wide bandwidth is being measured. “ADC dither” refers to the introduction of noise to the digitized steps of the analog-to-digital converter; the result is an improvement in amplitude accuracy. Use of the ADC dither, however, reduces dynamic range by approximately 3 dB.
— Decimation - Toggles the decimation function between Auto and Man, and to set the decimation value. Auto is the preferred setting, and the only setting that guarantees alias-free FFT spectrum measurements. If you are familiar with the decimation feature, you can change the decimation value by setting to Man, but be aware that aliasing can result in higher values. Decimation numbers 1 to 1000 describe the factor by which the number of points are reduced. The default setting is 0, which results in no data point reduction. Decimation by 3 keeps every 3rd sample, throwing away the 2 in between.
— IF Flatness - Toggles the IF flatness function between On and Off. If set to On (the default), the IF flatness feature causes background amplitude corrections to be performed on the FFT spectrum. The Off setting is used for adjustment and
Chapter 3 121

NADC and PDC Key ReferenceNADC and PDC Measurement Keys
NA
DC
an
d P
DC
Key
Ref
eren
ce
troubleshooting of the test instrument.
The following table shows the factory default settings for spectrum (frequency domain) measurements.
Table 3-4 Spectrum (Frequency Domain) Measurement Defaults
Measurement Parameter Factory Default Condition
Trace Display All
Res BW 20.0000 kHz; Auto
Averaging:Avg NumberAvg ModeAvg TypeTime Avg Num (Opt. 122 or 140)
25; OnExpLog-Pwr Avg (Video)1
Trig Source Free Run (Immediate)
Region/Limits:
RegionUpper MaskLower MaskOffset StartOffset StopInterval
AA: − 40.00 dB; OnA: − 100.00 dB; Off A: − 667.0 µsA: − 25.0 µsA: 642.0 µs
IF Path (requires Option B7J and Option 122 or 140)
Narrow
Wideband IF Gain (Opt. 122 or 140)
0.00 dB
Wideband Filtering (Opt. 122 or 140
Filter TypeFilter AlphaFilter BW
None0.300.50
Spectrum View:SPANAMPLITUDE Y Scale - Scale/Div
1.000 MHz (VSA), 10.000 MHz (PSA)10.00 dB
I/Q Waveform View:Capture TimeAMPLITUDE Y Scale - Scale/Div
188.00 µs100.0 mV60 mV
Spectrum Linear View:SPANAMPLITUDE Y Scale - Scale/Div
(for E4406A)1.00000 MHz100.0 mV
I and Q Waveform View:Capture TimeAMPLITUDE Y Scale - Scale/Div
(for E4406A)188.00µs100.0 mV
122 Chapter 3

NADC and PDC Key ReferenceNADC and PDC Measurement Keys
NA
DC
and
PD
C K
ey Referen
ce
I/Q Polar View:I/Q Scale/DivI or Q Origin
(for E4406A)100.0 mV0.00 V
(Narrowband) Advanced
Pre-ADC BPF On
Pre-FFT Filter Flat
Pre-FFT BW 1.55000 MHz; Auto
FFT Window Flat Top (High Amptd Acc)
FFT Size:Length ControlMin Points/RBWWindow LengthFFT Length
Auto3.100000706 (VSA), 566 (PSA)1024
ADC Range Auto Peak
Data Packing Auto
ADC Dither Auto
Decimation 0; Auto
IF Flatness On
Wideband Advanced (Option 122 or 140 PSA only)
ADC Correction On
IF Flatness Corrections On
Analog Filter Auto, 80 MHz (Opt 122), 40 MHz (Opt 140)
WB ADC Dither On
FFT Window Flat Top (High Amptd Acc)
FFT Size:Length ControlMin Points/RBWWindow LengthFFT Length
Auto3.100236 (Opt. 122), 118 (Opt. 140)256 (Opt. 122), 128 (Opt. 140)
Table 3-4 Spectrum (Frequency Domain) Measurement Defaults
Measurement Parameter Factory Default Condition
Chapter 3 123
NADC and PDC Key ReferenceNADC and PDC Measurement Keys
NA
DC
an
d P
DC
Key
Ref
eren
ce
View/Trace Key Menu
The View/Trace key allows you to select the desired view of the measurement from the following. You can use the Next Window key to move between the multiple windows (if any) and make it full size by pressing the Zoom key.
• Spectrum - Provides a combination view of the spectrum graph in parameters of power versus frequency with semi-log graticules, and the I/Q waveform graph in parameters of voltage and time. Changes to frequency span or power will sometimes affect data acquisition. This is equivalent to changing the selected window with the Next key.
124 Chapter 3

NADC and PDC Key ReferenceNADC and PDC Measurement Keys
NA
DC
and
PD
C K
ey Referen
ce
Figure 3-10 Spectrum Measurement - Spectrum and I/Q Waveform (Default View)
Figure 3-11 Spectrum Measurement - Spectrum and I/Q Waveform (Default View)
The Spectrum measurement result should look like the above
Chapter 3 125

NADC and PDC Key ReferenceNADC and PDC Measurement Keys
NA
DC
an
d P
DC
Key
Ref
eren
ce
figure. The measurement result values are shown in the summary result window.
• Spectrum (Time Domain) I/Q Waveform - (Key for PSA only) This graph is shown below the Spectrum graph in the default dual-window display. I/Q Waveform provides a view of the I/Q waveform in parameters of voltage versus time in linear scale. Changes to sweep time or resolution bandwidth can affect data acquisition. Pressing this button is equivalent to pressing the Next Window button on the front panel. Press the Zoom key to view this display full-screen.
126 Chapter 3

NADC and PDC Key ReferenceNADC and PDC Measurement Keys
NA
DC
and
PD
C K
ey Referen
ce
• Spectrum Linear - (for E4406A) Provides a view of the spectrum graph in parameters of voltage versus frequency in linear scale. Changes to frequency span or voltage can affect data acquisition.
Figure 3-12 Spectrum Measurement - Linear Spectrum View (for E4406A)
*Meas Setup: View/Trace = Spectrum Linear,Span = 3.000 MHz,Y Scale/Div = 5.00 mV, Ref Value = 30.0 mV,Others = Factory default settings
*Input signals: − 10.00 dBm, 9 channels of SR1, cdma2000 Rev 8
NOTE (for E4406A) For the widest spans, the I/Q window becomes just “ADC time domain samples”, because the I/Q down-conversion is no longer in effect. This is not the case for E4406A Option B7C if the Input Port is set to either I/Q, I only, or Q only and you have connected baseband I/Q signals to the I/Q INPUT connectors.
• I and Q Waveform - (for E4406A) Provides individual views of the I and Q signal waveform windows in parameters of voltage versus time.
To select the I or Q trace view, press the Next key at the bottom of the display. The selected window will have a green outline. To view the window full size press the Zoom key.
Chapter 3 127

NADC and PDC Key ReferenceNADC and PDC Measurement Keys
NA
DC
an
d P
DC
Key
Ref
eren
ce
Figure 3-13 Spectrum Measurement - I and Q Waveform View (for E4406A)
Figure 3-14 Spectrum Measurement - I and Q Waveform View (for E4406A)
• I/Q Polar - (for E4406A) Provides a view of the I/Q signal displayed in a polar vector graph.
128 Chapter 3

NADC and PDC Key ReferenceNADC and PDC Measurement Keys
NA
DC
and
PD
C K
ey Referen
ce
Figure 3-15 Spectrum Measurement - I/Q Polar View (for E4406A)
*Meas Setup: View/Trace = I/Q Polar,Others = Factory default settings
*Input signals: −10.00 dBm, Pilot channel, 1xEV-DO
Figure 3-16 Spectrum Measurement - I/Q Polar View (for E4406A)
Chapter 3 129

NADC and PDC Key ReferenceNADC and PDC Measurement Keys
NA
DC
an
d P
DC
Key
Ref
eren
ce
• Trace Display - Press this key to reveal the trace selection menu. The currently selected trace type is shown on the Trace Display key.
— All - Views both the current trace and the average trace.
— Average - Views only the average trace (in blue color). See the Meas Setup, Average keys to select different types of averaging.
— Current - Views only the trace (in yellow color) for the latest data acquisition.
— I Trace - (for E4406A) Views only the I signal trace.
— Q Trace - (for E4406A) Views only the Q signal trace.
SPAN X Scale Key Menu
NOTE The Spectrum or Linear Spectrum (for E4406A) window must be active in the Spectrum or Spectrum Linear (for E4406A) view to access the following Span X Scale key menu:
• Span - Modifies the frequency span. The range is 10.000 Hz to 10.000 MHz with 1 Hz resolution, depending on the Res BW setting. Changing the span causes the resolution bandwidth to change automatically, and will affect data acquisition time. The Span key is also accessible under the Meas Setup menu.
• IF Path - This key is only available if you have Option B7J and either Option 122 or 140. Selects either the standard narrowband IF hardware path or the wideband hardware path.
NOTE The I/Q Waveform (for E4406A) window must be active in the Spectrum or Spectrum Linear (for E4406A) view to access the following Span X Scale key menu:
• Scale/Div - Sets the horizontal scale by changing a time value per division. The range is 1.00 ns to 1.00 s per division. The default setting is 18.8 ms per division. However, since the Scale Coupling default is On, this value is automatically determined by the measurement results. When you set a value manually, Scale Coupling automatically changes to Off.
• Ref Value - Sets the reference value ranging from −1.00 to 10.0 s. The default setting is 0.00 s. However, since the Scale Coupling default is On, this value is automatically determined by the measurement results. When you set a value manually, Scale Coupling automatically changes to Off.
• Ref Position - Sets the reference position to either Left, Ctr (center) or Right. The default setting is Left.
• Scale Coupling - Toggles the scale coupling function between On and
130 Chapter 3
NADC and PDC Key ReferenceNADC and PDC Measurement Keys
NA
DC
and
PD
C K
ey Referen
ce
Off. The default setting is On. Upon pressing the Restart front-panel key or Restart softkey under the Meas Control menu, this function automatically determines the scale per division and reference values based on the measurement results. When you set a value to either Scale/Div or Ref Value manually, Scale Coupling automatically changes to Off.
NOTE The I/Q Polar window must be active in the I/Q Polar view (for E4406A), for the SPAN X Scale key to access the following menu:
• I/Q Scale/Div - Sets the vertical and horizontal scales by changing the value per division. The range is 1.00 nV to 20.00 V per division. The default setting is 100.0 mV.
• I Origin or Q Origin - Sets the reference value ranging from −250.00 to 250.00 V. The default setting is 0.00 V.
AMPLITUDE Y Scale Key Menu
NOTE The Spectrum or Linear Spectrum (for E4406A) window must be active in the Spectrum or Spectrum Linear (for E4406A) view to access the following AMPLITUDE Y Scale key menu:
• Scale/Div - Sets the vertical scale by changing an amplitude value per division. The range is 0.10 dB to 20.00 dB per division or 1.00 nV to 20.00 V per division, respectively. The default setting is 10.00 dB or 100.0 mV. However, since the Scale Coupling default is On, this value is automatically determined by the measurement results. When you set a value manually, Scale Coupling automatically changes to Off.
• Ref Value - Sets the reference value ranging from −250.00 to 250.00 dBm or −250.00 to 250.00 V. The default setting is 0.00 dBm or 0.00 V. However, since the Scale Coupling default is On, this value is automatically determined by the measurement results. When you set a value manually, Scale Coupling automatically changes to Off.
• Ref Position - Sets the reference position to either Top, Ctr (center) or Bot (bottom). The default setting is Ctr.
• Scale Coupling - Toggles the scale coupling function between On and Off. The default setting is On. Upon pressing the Restart front-panel key or Restart softkey under the Meas Control menu, this function automatically determines the scale per division and reference values based on the measurement results. When you set a value to either Scale/Div or Ref Value manually, Scale Coupling automatically changes to Off.
NOTE The I or Q Waveform window must be active in the I and Q Waveform view (for E4406A) for the AMPLITUDE Y Scale key to access the following menu:
Chapter 3 131

NADC and PDC Key ReferenceNADC and PDC Measurement Keys
NA
DC
an
d P
DC
Key
Ref
eren
ce
• Scale/Div - Sets the vertical scale by changing the amplitude value per division. The range is 1.00 nV to 20.00 V per division. The default setting is 100.0 mV. However, since the Scale Coupling default is On, this value is automatically determined by the measurement results. When you set a value manually, Scale Coupling automatically changes to Off.
• Ref Value - Sets the reference value ranging from −250.00 to 250.00 V. The default setting is 0.00 V. However, since the Scale Coupling default is On, this value is automatically determined by the measurement results. When you set a value manually, Scale Coupling automatically changes to Off.
• Ref Position - Sets the reference position to either Top, Ctr (center) or Bot (bottom). The default setting is Ctr.
• Scale Coupling - Toggles the scale coupling function between On and Off. The default setting is On. The Restart front-panel key or Restart softkey under the Meas Control menu, this function automatically determines the scale per division and reference values by the measurement results. When you set a value to either Scale/Div or Ref Value manually, Scale Coupling automatically changes to Off.
NOTE The I/Q Polar window must be active in the I/Q Polar view (for E4406A), for the AMPLITUDE Y Scale key to access the following menu:
• I/Q Scale/Div - Sets the vertical and horizontal scales by changing the value per division. The range is 1.00 nV to 20.00 V per division. The default setting is 100.0 mV.
• I Origin or Q Origin - Sets the reference value ranging from −250.00 to 250.00 V. The default setting is 0.00 V.
Display Key Menu
The Display Key is not active for this measurement.
Marker Key Menu
• Select 1 2 3 4 - Activates up to four markers with the corresponding numbers, respectively. The selected number is underlined and its function is defined by pressing the Function key. The default is 1.
• Normal - Activates the selected marker to read the frequency and amplitude of the marker position on the spectrum trace. Marker position is controlled by the RPG knob.
• Delta - Reads the differences in frequency and amplitude between the selected marker and the next marker.
• Function Off - Selects the marker function to be Band Power, Noise, or Off. The default is Off. If set to Band Power, you need to select Delta.
132 Chapter 3

NADC and PDC Key ReferenceNADC and PDC Measurement Keys
NA
DC
and
PD
C K
ey Referen
ce
• Trace Spectrum - Places the selected marker on the Spectrum, Spectrum Avg, Spectrum Linear (for E4406A), Spectrum Avg Linear (for E4406A), I/Q Waveform, I Waveform (for E4406A), or Q Waveform (for E4406A) or I/Q Waveform trace. The default is Spectrum.
• Off - Turns off the selected marker.
• Shape Diamond - Accesses the menu to define the selected marker shape to be Diamond, Line, Square, or Cross. The default shape is Diamond.
• Marker All Off - Turns off all of the markers.
Peak Search Key
The front panel Search key performs a peak search when pressed. A marker will automatically be activated at the highest peak.
Chapter 3 133

NADC and PDC Key ReferenceNADC and PDC Measurement Keys
NA
DC
an
d P
DC
Key
Ref
eren
ce
Waveform (Time Domain) Keys
NOTE You must have selected Waveform under the MEASURE menu to access these menus.
Measurement Setup Key Menu
Key Path: Meas Setup
• Sweep Time - Specifies the measurement acquisition time which is used as the length of the time capture record. The range is 1.0 µs to 100.0 s, depending upon the resolution bandwidth setting and the available internal memory size for acquisition points.
• Meas Time - Specifies the measurement acquisition time which is used as the length of the time capture record. The range is 10 ns and 100.0 s, depending upon the resolution bandwidth setting and the available internal memory size for acquisition points.
• Res BW - Sets the measurement bandwidth. The range is 10 Hz to 8 MHz using the Gaussian filter selected from RBW Filter under the Advanced menu, or 10 Hz to 10 MHz using the Flat top filter selected from RBW Filter. A larger bandwidth results in a larger number of acquisition points and reduces the maximum value allowed for the sweep time.
• IF BW - For PSA Option 122 or 140 only. Sets the measurement bandwidth. In wideband operation the range is 10 kHz to 80 MHz.(Option 122) or 10 kHz to 40 MHz (Option 140). The narrowband range is 10 Hz to 10 MHz. A larger bandwidth results in a larger number of acquisition points and reduces the maximum value allowed for the measurement time.
• Wideband Setup configures the wideband hardware path. This functionality is only available with the wideband options (122 or 140, PSA only).
— Wideband IF Gain - Sets the gain for the wideband IF path. You must have selected IF Path Wide. Increasing the gain can increase the amplitude of small signals as long as you don’t overdrive the hardware
— Wideband Filtering - Accesses the menu to configure several aspects of the wideband filter.
❏ Filter Type - Selects None for no filtering, or Raised Cosine, RRC (root-raised cosine), Nyquist, Root Nyquist, Gaussian and Flat Top.
❏ Filter Alpha - Selects the filter alpha.
❏ Filter BW - Selects filter bandwidth. Bandwidht is not entered as a frequency. The value is entered as a ratio of the current
134 Chapter 3

NADC and PDC Key ReferenceNADC and PDC Measurement Keys
NA
DC
and
PD
C K
ey Referen
ce
instrument sampling rate (i.e. BW/sample rate).
— Sample Rate - Allows arbitrary sample rates with 5 digits of resolution from 12.5 kHz to 100 MHz. Sample rate is coupled with the selected filter shape and bandwidth, and with the maximum available captured data.
— Block Size - This key is for information only. Block size is coupled with the IF bandwidth and the measurement time.
— Wideband Advanced - Accesses the advanced settings for the Option 122 wideband IF hardware path (PSA only).
NOTE Parameters under the Wideband Advanced key seldom need to be changed. Any changes from the default advanced values may result in invalid measurement data.
❏ ADC Corr Turning corrections on performs an ADC calibration to reduce the spectral image and applies the corrections.
❏ IF Flat Corr turns IF flatness corrections on and off for the Option 122 or 140 wideband IF. This control is independent of the narrowband IF flatness control.
❏ Analog Filter manually selects the 80 MHz (Opt 122), 40 MHz (Opt 140), or 36 MHz anti-alias filter, which overides the automatic selection of the bandwidth.
❏ WB ADC Dither Toggles the ADC dither function on/off.. The “ADC dither” refers to the introduction of noise to the digitized steps of the analog-to-digital converter; the result is an improvement in amplitude accuracy. The wideband dither control does not affect the ADC dither in the narrowband IF path.
❏ Trig Interp This is an advanced function that usually does not need to be changed. During normal operation trigger interpolation is on and the trigger offset is 0 seconds. At low sample rates the trigger interpolation can cause hardware unlock errors, so you may want to turn it off. You must have an external trigger source to use this functionality.
• Average
— Avg Number - Changes the number of N averages.
— Avg Mode - Toggles the averaging mode between Exp (exponential) and Repeat. This selection only affects the averaging result after the number of N averages is reached. The N is set using the Avg Number key.
❏ Normal averaging: Normal (linear) averaging is always used until the specified number of N averages is reached. When the Measure key under Meas Control is set to Single, data
Chapter 3 135

NADC and PDC Key ReferenceNADC and PDC Measurement Keys
NA
DC
an
d P
DC
Key
Ref
eren
ce
acquisition is stopped when the number of N averages is reached, thus Avg Mode has no effect in the single measurement mode.
❏ Exponential averaging: When Measure is set to Cont, data acquisition will continue indefinitely. Exponential averaging is used with a weighting factor of N (the displayed count of averages stops at N). Exponential averaging weights new data more heavily than old data, which allows tracking of slow-changing signals. The weighting factor N is set using the Avg Number key.
❏ Repeat averaging: When Measure is set to Cont, data acquisition will continue indefinitely. After the number of N averages is reached, all previous result data is cleared and the average count displayed is set back to 1. This is equivalent to being in Measure Single and pressing the Restart key each time the single measurement finishes.
— Avg Type - Accesses the menu of the following average types only for making spectrum (frequency domain) and waveform (time domain) measurements:
❏ Pwr Avg (RMS) - Executes the true power averaging which is calculated by averaging the rms voltage. This is the most accurate type.
❏ Log-Pwr Avg (Video) - Simulates the traditional spectrum analyzer type of averaging by calculating the log of the power. This type of averaging will underestimate the power when the signal is noise-like.
❏ Voltage Avg - Executes voltage averaging.
❏ Maximum - Captures peak voltage data. Simulates the traditional spectrum analyzer peak hold function.
❏ Minimum - Captures the minimum voltage data, similar to the maximum function.
CAUTION If triggering is set incorrectly, averaged signal results can approach zero. “HW Average” is displayed when averaging is ON.
TIP If your measurement results vary or provide unexpected values, try turning Averaging OFF and execute single, non-averaged measurements to check your triggering setup. Press Meas Control, Measure, Single to make non-continuous measurements.
• Trig Source
Key path: Meas Setup, Trig Source
136 Chapter 3
NADC and PDC Key ReferenceNADC and PDC Measurement Keys
NA
DC
and
PD
C K
ey Referen
ce
NOTE Changing the selection in the Trig Source menu alters the trigger source for the selected measurement only.
— Free Run (Immediate) - A trigger occurs at the time the data is requested, completely asynchronous with the RF or IF signal.
— Video (Envlp) - An internal IF envelope trigger that occurs at the absolute threshold level of the IF signal level.
— RF Burst (Wideband) - An internal wideband RF burst trigger that has the automatic level control for burst signals. It triggers at the level that is set relative to the peak RF signal (12 MHz bandwidth) input level. (Not available for Option 122 or 140 when using the wideband IF path.)
— Ext Front - Activates the front panel external trigger input (EXT TRIGGER INPUT) port. The external signal must be between −5.00 and +5.00 V with 1 or 10 mV resolution.
— Ext Rear - Activates the rear-panel external trigger input (TRIGGER IN) port. The external signal must be between − 5.00 and +5.00 V with 1 or 10 mV resolution.
— Frame - Uses the internal frame clock to generate a trigger signal. The clock parameters are controlled under the Mode Setup key or the measurement firmware, but not both. Refer to the specific measurement section for details.
— Line - Sets the trigger to the internal line mode. Sweep triggers occur at intervals synchronous to the line frequency. See the specific measurement section for details.
• IF Path Only for PSA with Option B7J and either Option 122 or 140 installed. Selects either the standard narrowband IF hardware path or the wideband hardware path.
• Restore Meas Defaults - Presets only the settings that are specific to the selected measurement by pressing Meas Setup, More (1 of 2), Restore Meas Defaults. This will set the measure setup parameters, for the currently selected measurement only, to the factory defaults.
• (Narrowband) Advanced Accesses the menu to change the following parameters.
CAUTION The advanced features should be used only if you are familiar with their operation. Changes from the default values may result in invalid data.
The Narrowband key label word is only present if you have Option B7J and either Option 122 or 140 installed. Parameters that are under the (Narrowband) Advanced key only affect the standard narrow band IF path. The wideband IF advanced functions are found under the Wideband Advanced key.
Chapter 3 137

NADC and PDC Key ReferenceNADC and PDC Measurement Keys
NA
DC
an
d P
DC
Key
Ref
eren
ce
— Pre-ADC BPF - Toggles the pre-ADC bandpass filter function between On or Off. The default setting is Off. The pre-ADC bandpass filter is useful for rejecting nearby signals, so that sensitivity within the span range can be improved by increasing the ADC range gain.
— RBW Filter - Toggles the resolution bandwidth filter selection between Flat and Gaussian. If set to Gaussian, the filter provides more even time-domain response, particularly for “bursts”. If set to Flat, the filter provides a flatter bandwidth but is less accurate for “pulse responses”. A flat top filter also requires less memory and allows longer data acquisition times. For most waveform applications, the Gaussian filter is recommended. The resolution bandwidth range is 10 Hz to 8 MHz using the Gaussian filter or 10 Hz to 10 MHz using the Flat top filter.
— ADC Range - Accesses the menu to select one of the ADC ranging functions:
❏ Auto - Automatically adjusts the signal range for optimal measurement results.
❏ AutoPeak - Continuously searches for the highest peak signal.
❏ AutoPeakLock - Adjusts the range for the highest peak signal it identifies. It retains the range settings determined by that peak signal, even when the peak signal is no longer present.
❏ Manual - Accesses the selection menu of values, − 6 to +24 dB for E4406A or None to +18 dB for PSA, to set the ADC range level. Also note that manual ranging is best for CW signals.
— Data Packing - Selects Auto (the default) or the Short (16 bit), Medium (24 bit) and Long (32 bit) methods of data packing. The short, medium, and long methods are not compatible with all settings and should not be used unless you are familiar with data packing methods. Auto is the preferred choice.
❏ Auto - The data packing value most appropriate for current instrument settings is selected automatically.
❏ Short (16 bit) - Select this to pack data every 16 bits.
❏ Medium (24 bit) - Select this to pack data every 24 bits.
❏ Long (32 bit) - Select this to pack data every 32 bits.
— ADC Dither - Toggles the ADC dither function between On and Off. The default setting is Off. If set to On, the ADC dither refers to the introduction of noise to the digitized steps of the analog-to-digital converter, and results in better amplitude linearity and resolution in low level signals. However, it also results in reduced dynamic range by approximately 3 dB.
— Decimation - Toggles the decimation function between On and Off,
138 Chapter 3

NADC and PDC Key ReferenceNADC and PDC Measurement Keys
NA
DC
and
PD
C K
ey Referen
ce
and to set the decimation value. Decimation allows longer acquisition times for a given bandwidth by eliminating data points. Long time captures can be limited by the instrument data acquisition memory. Decimation numbers 1 to 4 describe the factor by which the number of points are reduced. The default setting is 1, which results in no data point reduction.
Chapter 3 139
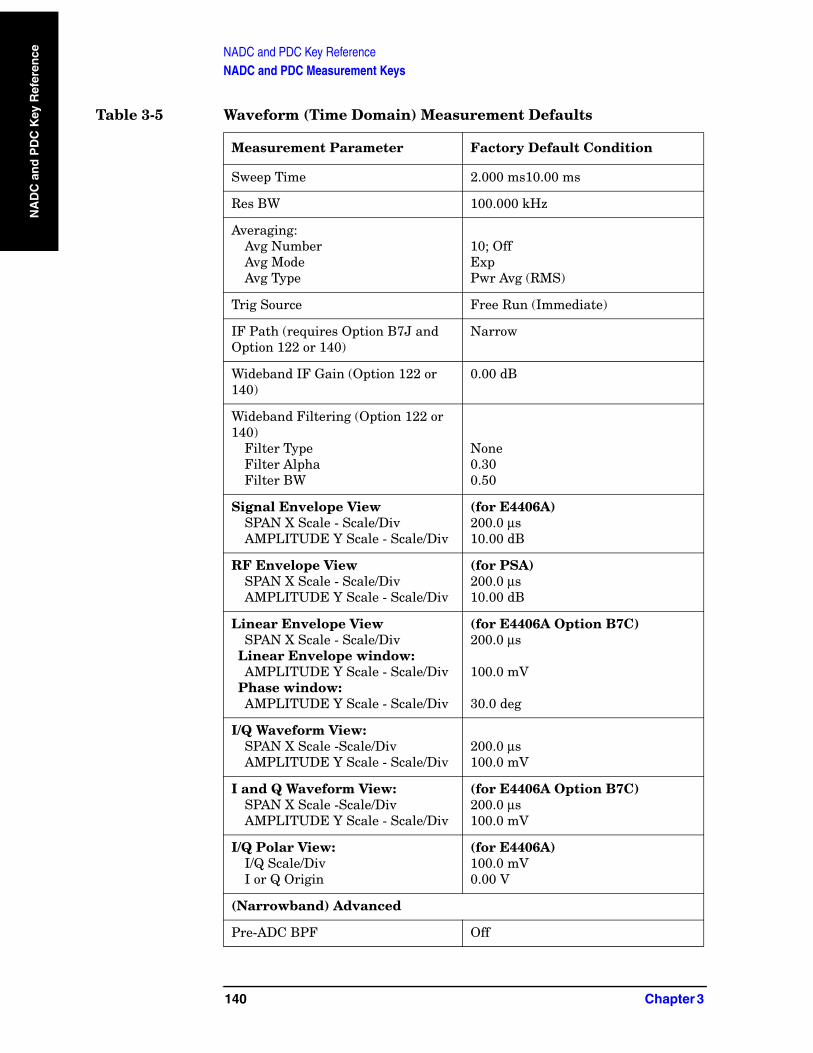
NADC and PDC Key ReferenceNADC and PDC Measurement Keys
NA
DC
an
d P
DC
Key
Ref
eren
ce
Table 3-5 Waveform (Time Domain) Measurement Defaults
Measurement Parameter Factory Default Condition
Sweep Time 2.000 ms10.00 ms
Res BW 100.000 kHz
Averaging:Avg NumberAvg ModeAvg Type
10; OffExpPwr Avg (RMS)
Trig Source Free Run (Immediate)
IF Path (requires Option B7J and Option 122 or 140)
Narrow
Wideband IF Gain (Option 122 or 140)
0.00 dB
Wideband Filtering (Option 122 or 140)
Filter TypeFilter AlphaFilter BW
None0.300.50
Signal Envelope ViewSPAN X Scale - Scale/DivAMPLITUDE Y Scale - Scale/Div
(for E4406A)200.0 µs10.00 dB
RF Envelope ViewSPAN X Scale - Scale/DivAMPLITUDE Y Scale - Scale/Div
(for PSA)200.0 µs10.00 dB
Linear Envelope ViewSPAN X Scale - Scale/Div
Linear Envelope window:AMPLITUDE Y Scale - Scale/Div
Phase window:AMPLITUDE Y Scale - Scale/Div
(for E4406A Option B7C)200.0 µs
100.0 mV
30.0 deg
I/Q Waveform View:SPAN X Scale -Scale/DivAMPLITUDE Y Scale - Scale/Div
200.0 µs100.0 mV
I and Q Waveform View:SPAN X Scale -Scale/DivAMPLITUDE Y Scale - Scale/Div
(for E4406A Option B7C)200.0 µs100.0 mV
I/Q Polar View:I/Q Scale/DivI or Q Origin
(for E4406A)100.0 mV0.00 V
(Narrowband) Advanced
Pre-ADC BPF Off
140 Chapter 3

NADC and PDC Key ReferenceNADC and PDC Measurement Keys
NA
DC
and
PD
C K
ey Referen
ce
RBW Filter Gaussian
ADC Range Auto
Data Packing Auto
ADC Dither Off
Decimation Off
Wideband Advanced (Option 122 or 140)
ADC Correction On
IF Flatness Corrections On
Analog Filter Auto, 80 MHz (Opt 122), 40 MHz (Opt 140)
WB ADC Dither On
Trigger Interpolation On
Table 3-5 Waveform (Time Domain) Measurement Defaults
Measurement Parameter Factory Default Condition
Chapter 3 141
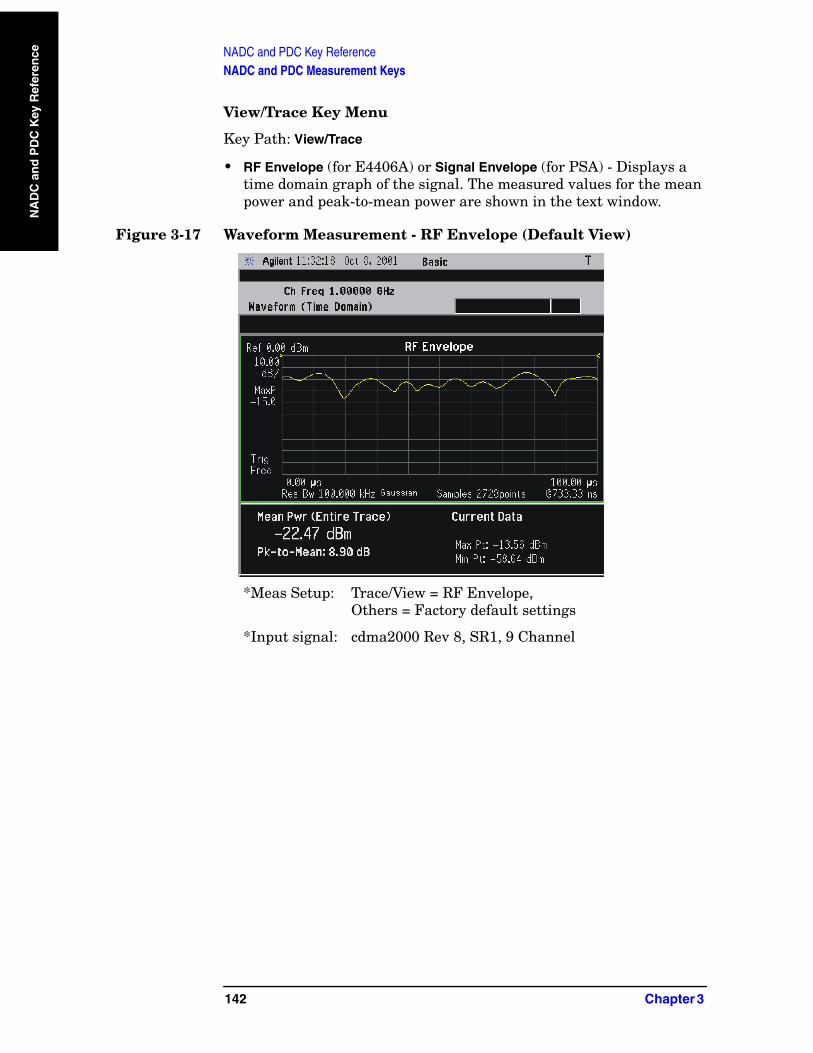
NADC and PDC Key ReferenceNADC and PDC Measurement Keys
NA
DC
an
d P
DC
Key
Ref
eren
ce
View/Trace Key Menu
Key Path: View/Trace
• RF Envelope (for E4406A) or Signal Envelope (for PSA) - Displays a time domain graph of the signal. The measured values for the mean power and peak-to-mean power are shown in the text window.
Figure 3-17 Waveform Measurement - RF Envelope (Default View)
*Meas Setup: Trace/View = RF Envelope,Others = Factory default settings
*Input signal: cdma2000 Rev 8, SR1, 9 Channel
142 Chapter 3

NADC and PDC Key ReferenceNADC and PDC Measurement Keys
NA
DC
and
PD
C K
ey Referen
ce
Figure 3-18 Waveform Measurement - RF Envelope (Default View)
Figure 3-19 Waveform Measurement - RF Envelope (Default View)
• Linear Envelope - (for E4406A Option B7C) Provides a combination view of a linear signal envelope graph and a phase graph with linear graticules. Use the Next Window and Zoom keys to select and enlarge either graph.
Chapter 3 143
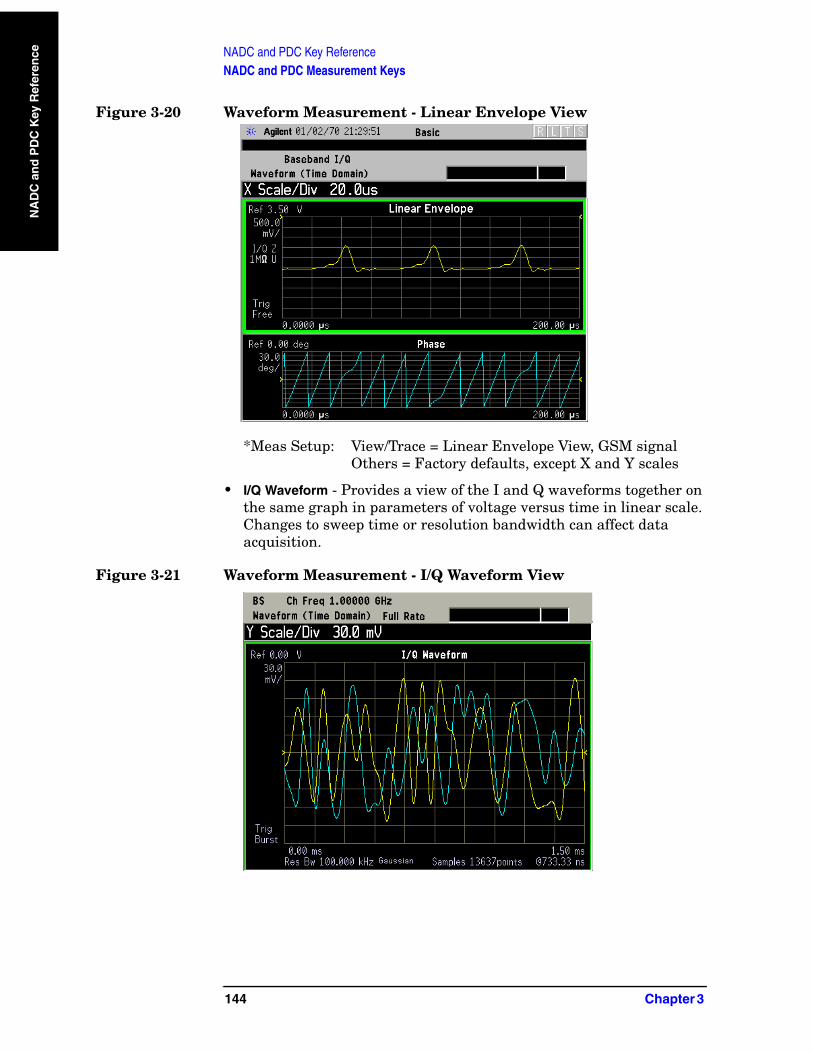
NADC and PDC Key ReferenceNADC and PDC Measurement Keys
NA
DC
an
d P
DC
Key
Ref
eren
ce
Figure 3-20 Waveform Measurement - Linear Envelope View
*Meas Setup: View/Trace = Linear Envelope View, GSM signalOthers = Factory defaults, except X and Y scales
• I/Q Waveform - Provides a view of the I and Q waveforms together on the same graph in parameters of voltage versus time in linear scale. Changes to sweep time or resolution bandwidth can affect data acquisition.
Figure 3-21 Waveform Measurement - I/Q Waveform View
144 Chapter 3

NADC and PDC Key ReferenceNADC and PDC Measurement Keys
NA
DC
and
PD
C K
ey Referen
ce
Figure 3-22 Waveform Measurement - I/Q Waveform View
NOTE For the widest spans, the I/Q Waveform window becomes just “ADC time domain samples”, because the I/Q down-conversion is no longer in effect.
• I and Q Waveform - (for E4406A Option B7C) Provides a combination view of the I and Q signal waveform graphs in the linear scales.
Figure 3-23 Waveform Measurement - I and Q Waveform View
Chapter 3 145
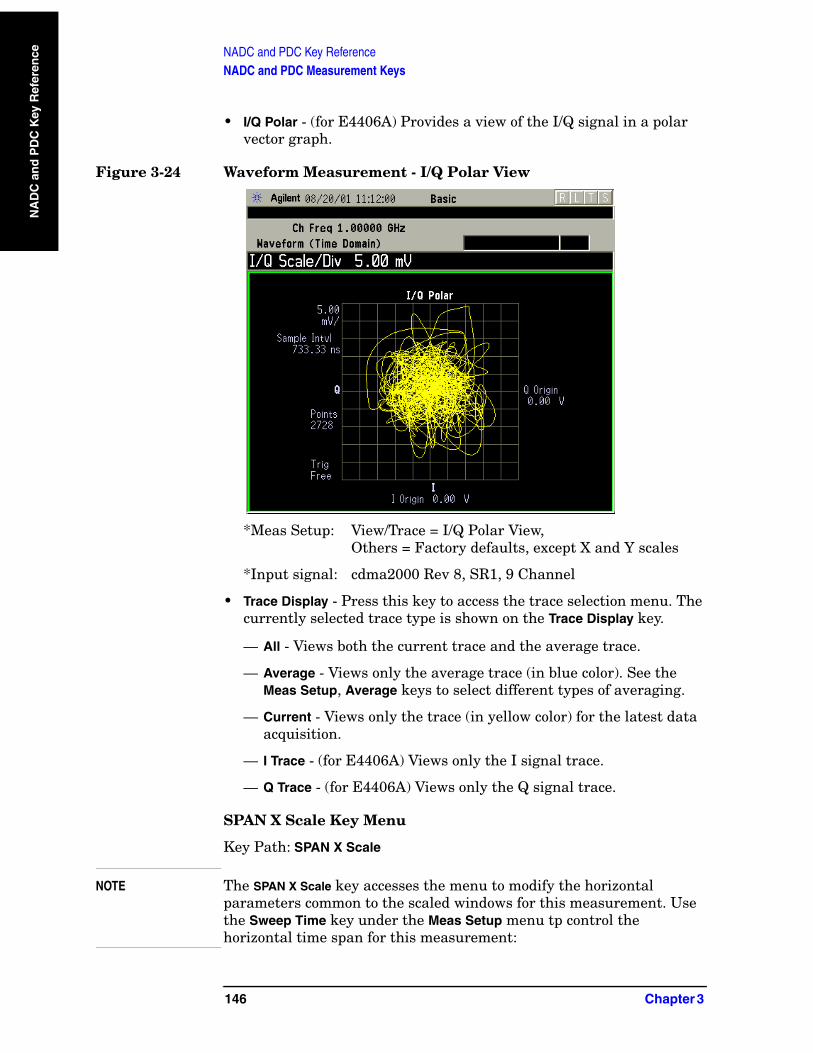
NADC and PDC Key ReferenceNADC and PDC Measurement Keys
NA
DC
an
d P
DC
Key
Ref
eren
ce
• I/Q Polar - (for E4406A) Provides a view of the I/Q signal in a polar vector graph.
Figure 3-24 Waveform Measurement - I/Q Polar View
*Meas Setup: View/Trace = I/Q Polar View,Others = Factory defaults, except X and Y scales
*Input signal: cdma2000 Rev 8, SR1, 9 Channel
• Trace Display - Press this key to access the trace selection menu. The currently selected trace type is shown on the Trace Display key.
— All - Views both the current trace and the average trace.
— Average - Views only the average trace (in blue color). See the Meas Setup, Average keys to select different types of averaging.
— Current - Views only the trace (in yellow color) for the latest data acquisition.
— I Trace - (for E4406A) Views only the I signal trace.
— Q Trace - (for E4406A) Views only the Q signal trace.
SPAN X Scale Key Menu
Key Path: SPAN X Scale
NOTE The SPAN X Scale key accesses the menu to modify the horizontal parameters common to the scaled windows for this measurement. Use the Sweep Time key under the Meas Setup menu tp control the horizontal time span for this measurement:
146 Chapter 3
NADC and PDC Key ReferenceNADC and PDC Measurement Keys
NA
DC
and
PD
C K
ey Referen
ce
• Scale/Div - Sets the horizontal scale by changing a time value per division. The range is 1.0 ns to 1.000 s per division with 0.01 ns resolution. The default setting is 200.0 µs per division. However, since the Scale Coupling default is On, this value is automatically determined by the measurement result. When you set a value manually, Scale Coupling automatically changes to Off.
• Ref Value - Sets the reference value ranging from − 1.0 to 10.0 s. The default setting is 0.00 s. However, since the Scale Coupling default is On, this value is automatically determined by the measurement result. When you set a value manually, Scale Coupling automatically changes to Off.
• Ref Position - Sets the reference position to either Left, Ctr (center) or Right. The default setting is Left.
• Scale Coupling - Toggles the scale coupling function between On and Off. The default setting is On. Upon pressing the Restart front-panel key or Restart softkey under the Meas Control menu, this function automatically determines the scale per division and reference values based on the measurement results. When you set a value to either Scale/Div or Ref Value manually, Scale Coupling automatically changes to Off.
NOTE For E4406A, if the I/Q Polar window is active in the I/Q Polar view, the SPAN X Scale key accesses the following menu:
• I/Q Scale/Div - Sets the vertical and horizontal scales by changing a value per division. The range is 1.00 nV to 20.00 V per division. The default setting is 100.0 mV.
• I or Q Origin - Sets the reference value ranging from − 250.00 to 250.00 V. The default setting is 0.00 V.
Chapter 3 147

NADC and PDC Key ReferenceNADC and PDC Measurement Keys
NA
DC
an
d P
DC
Key
Ref
eren
ce
AMPLITUDE Y Scale Key Menu
Key Path: AMPLITUDE Y Scale
NOTE If the RF Envelope (for PSA) or Signal Envelope (for E4406A) window is active in the RF Envelope (for PSA) or Signal Envelope (for E4406A) view, the AMPLITUDE Y Scale key accesses the following menu:
• Scale/Div - Sets the vertical scale by changing an amplitude value per division. The range is 0.10 to 20.00 dB per division with 0.01 dB resolution. The default setting is 10.00 dB per division. However, since the Scale Coupling default is On, this value is automatically determined by the measurement result. When you set a value manually, Scale Coupling automatically changes to Off.
• Ref Value - Sets the reference value ranging from − 250.00 to 250.00 dBm. The default setting is 0.00 dBm. However, since the Scale Coupling default is On, this value is automatically determined by the measurement result. When you set a value manually, Scale Coupling automatically changes to Off.
• Ref Position - Sets the reference position to either Top, Ctr (center) or Bot (bottom). The default setting is Top.
• Scale Coupling - Toggles the scale coupling function between On and Off. The default setting is On. Upon pressing the Restart front-panel key or Restart softkey under the Meas Control menu, this function automatically determines the scale per division and reference values based on the measurement results. When you set a value to either Scale/Div or Ref Value manually, Scale Coupling automatically changes to Off.
NOTE For E4406A with Option B7C, if the Linear Envelope window is active in the Linear Envelope view, the AMPLITUDE Y Scale key accesses the following menu:
• Scale/Div - Sets the vertical scale by changing an amplitude value per division. The range is 1.00 nV to 20.00 V per division. The default setting is 100.0 mV per division. However, since the Scale Coupling default is On, this value is automatically determined by the measurement result. When you set a value manually, Scale Coupling automatically changes to Off.
• Ref Value - Sets the reference value ranging from − 250.00 to 250.00 V. The default setting is 0.00 V. However, since the Scale Coupling default is On, this value is automatically determined by the measurement result. When you set a value manually, Scale Coupling automatically changes to Off.
• Ref Position - Sets the reference position to either Top, Ctr (center) or Bot (bottom). The default setting is Top.
148 Chapter 3

NADC and PDC Key ReferenceNADC and PDC Measurement Keys
NA
DC
and
PD
C K
ey Referen
ce
• Scale Coupling - Toggles the scale coupling function between On and Off. The default setting is On. Upon pressing the Restart front-panel key or Restart softkey under the Meas Control menu, this function automatically determines the scale per division and reference values based on the measurement results. When you set a value to either Scale/Div or Ref Value manually, Scale Coupling automatically changes to Off.
NOTE For E4406A with Option B7C, if the Phase window is active in the Linear Envelope view, the AMPLITUDE Y Scale key accesses the menu to modify the following parameters:
• Scale/Div - Sets the vertical scale by changing an amplitude value per division. The range is 0.10 to 3600.0 deg per division. The default setting is 30.00 deg. However, since the Scale Coupling default is On, this value is automatically determined by the measurement result. When you set a value manually, Scale Coupling automatically changes to Off.
• Ref Value - Sets the reference value ranging from − 36000.0 to 36000.0 deg. The default setting is 0.00 deg. However, since the Scale Coupling default is On, this value is automatically determined by the measurement result. When you set a value manually, Scale Coupling automatically changes to Off.
• Ref Position - Sets the reference position to either Top, Ctr (center) or Bot (bottom). The default setting is Ctr.
• Scale Coupling - Toggles the scale coupling function between On and Off. The default setting is On. Upon pressing the Restart front-panel key or Restart softkey under the Meas Control menu, this function automatically determines the scale per division and reference values based on the measurement results. When you set a value to either Scale/Div or Ref Value manually, Scale Coupling automatically changes to Off.
NOTE If the I/Q Waveform window is active in the I/Q Waveform view (or the I Waveform, or Q Waveform window is active in the I and Q Waveform view for E4406A with Option B7C), the AMPLITUDE Y Scale key accesses the menu to modify the following parameters:
• Scale/Div - Sets the vertical scale by changing an amplitude value per division. The range is 1.00 nV to 20.00 V per division. The default setting is 100.0 mV. However, since the Scale Coupling default is On, this value is automatically determined by the measurement result. When you set a value manually, Scale Coupling automatically changes to Off.
• Ref Value - Sets the reference value ranging from −250.00 to 250.00 V. The default setting is 0.00 V. However, since the Scale Coupling
Chapter 3 149

NADC and PDC Key ReferenceNADC and PDC Measurement Keys
NA
DC
an
d P
DC
Key
Ref
eren
ce
default is On, this value is automatically determined by the measurement result. When you set a value manually, Scale Coupling automatically changes to Off.
• Ref Position - Sets the reference position to either Top, Ctr (center) or Bot (bottom). The default setting is Ctr.
• Scale Coupling - Toggles the scale coupling function between On and Off. The default setting is On. Upon pressing the Restart front-panel key or Restart softkey under the Meas Control menu, this function automatically determines the scale per division and reference values based on the measurement results. When you set a value to either Scale/Div or Ref Value manually, Scale Coupling automatically changes to Off.
NOTE For E4406A, if the I/Q Polar window is active in the I/Q Polar view, the SPAN X Scale or AMPLITUDE Y Scale key accesses the menu to modify the following parameters:
• I/Q Scale/Div - Sets the vertical and horizontal scales by changing a value per division. The range is 1.00 nV to 20.00 V per division. The default setting is 100.0 mV.
• I or Q Origin - Sets the reference value ranging from −250.00 to 250.00 V. The default setting is 0.00 V.
Display Key Menu
The Display key is not available for this measurement.
Marker Key Menu
Key Path: Marker
The Marker front-panel key accesses the menu to configure the markers.
• Select 1 2 3 4 - Activates up to four markers with the corresponding numbers, respectively. The selected number is underlined and its function is defined by pressing the Function key. The default is 1.
• Normal - Activates the selected marker to read the time position and amplitude of the marker on the RF envelope or Signal Envelope trace. The marker position is controlled by the RPG knob.
• Delta - Reads the differences in frequency and either time position or amplitude, between the selected marker and the next marker.
• Function Off - Selects the marker function to be Band Power, Noise, or Off. The default is Off. If set to Band Power, you need to select Delta.
• Trace - Places the selected marker on RF Envelope (for PSA), Signal Envelope (for E4406A), or I/Q Waveform. Also, for E4406A with Option B7C, you can place the marker on Linear Envelope, Linear Phase, I Waveform, or Q Waveform.
150 Chapter 3
NADC and PDC Key ReferenceNADC and PDC Measurement Keys
NA
DC
and
PD
C K
ey Referen
ce
• Off - Turns off the selected marker.
• Shape Diamond - Accesses the menu to define the selected marker shape to be Diamond, Line, Square, or Cross. The default shape is Diamond.
• Marker All Off - Turns off all of the markers.
Peak Search Key
Key Path: Search
The front panel Search key performs a peak search when pressed. A marker will automatically be activated at the highest peak.
NOTE In the Waveform measurement, the Mean Pwr (Entire Trace) value plus the Pk-to-Mean value will sum to equal the current Max Pt. value as shown in the data window below the RF Envelope or Signal Envelope display. If you do a marker peak search (Search) with averaging turned off, the marker will find the same maximum point. However, if you turn averaging on, the Pk-to-Mean value will use the highest peak found for any acquisition during averaging, while the marker peak will look for the peak of the display, which is the result of n-averages. This will usually result in differing values for the maximum point.
Chapter 3 151

NADC and PDC Key ReferenceNADC and PDC Measurement Keys
NA
DC
an
d P
DC
Key
Ref
eren
ce
152 Chapter 3

NA
DC
Pro
gram
min
g C
om
man
ds
4 NADC Programming Commands
These commands are only available when the NADC mode has been selected using INSTrument:SELect NADC.If NADC mode is selected, commands that are unique to another mode are not available.
153
NADC Programming CommandsSCPI Command Subsystems
NA
DC
Pro
gra
mm
ing
Co
mm
and
s
SCPI Command Subsystems
“CALCulate Subsystem” on page 160
“CONFigure Subsystem” on page 187
“DISPlay Subsystem” on page 188
“FETCh Subsystem” on page 199
“FORMat Subsystem” on page 200
“INITiate Subsystem” on page 202
“INSTrument Subsystem” on page 204
“MEASure Group of Commands” on page 209
“READ Subsystem” on page 234
“SENSe Subsystem” on page 235
“TRIGger Subsystem” on page 274
154 Chapter 4

NADC Programming CommandsProgramming Command Compatibility Across Model Numbers and Across Modes
NA
DC
Pro
gram
min
g C
om
man
ds
Programming Command CompatibilityAcross Model Numbers and Across Modes
Across PSA Modes: Command Subsystem Similarities
When you select different modes you get different sets of available programming commands. That is, only the commands that are appropriate for the current mode are available. Also, some commands have the same syntax in different modes but have different ranges or settings that are only appropriate to the current mode.
The following table shows which command subsystems are the same across different modes. If there is no “X” by a particular subsystem, then the set of available commands is different in those modes. Command ranges or defaults may also be different. Refer to the programming command descriptions in the documentation for each mode for details.
Command Subsystem Same command set is available:
SA mode compared with the application modes: Digital Modulation, Basic, WLAN, W-CDMA, cdmaOne, cdma2000, 1xEV-DO, GSM, EDGE, NADC, PDC, or Measuring Receiver
Same command set is available:
SA mode compared with the application modes: Phase Noise, Noise Figure, TD-SCDMA
IEEE common commands X X
ABORt X X
CALCulate
CALibration X X
CONFigure
COUPle not available in these application modes
not available in these application modes
DISPlay
FETCh
FORMat X
HCOPy X X
INITiate
Chapter 4 155

NADC Programming CommandsProgramming Command Compatibility Across Model Numbers and Across Modes
NA
DC
Pro
gra
mm
ing
Co
mm
and
s
INPut not available in these application modesX
MEASure
MEMory X X
MMEMory X X
MMEMory:STORe:TRACe not available in these application modes
X
READ
[SENSe]
[SENSe:]CHANnel
[SENSe:]CORRection
[SENSe:]FEED
[SENSe:]FREQuency:CENTer
X
[SENSe:]FREQuency:<other subsystems>
not available in these application modes
not available in these application modes
[SENSe:]<measurement>
[SENSe:]POWer
[SENSe:]RADio
[SENSe:]SYNC
STATus X X
SYSTem X X
TRACe not available in these application modes
X
TRIGger
UNIT X X
Command Subsystem Same command set is available:
SA mode compared with the application modes: Digital Modulation, Basic, WLAN, W-CDMA, cdmaOne, cdma2000, 1xEV-DO, GSM, EDGE, NADC, PDC, or Measuring Receiver
Same command set is available:
SA mode compared with the application modes: Phase Noise, Noise Figure, TD-SCDMA
156 Chapter 4

NADC Programming CommandsProgramming Command Compatibility Across Model Numbers and Across Modes
NA
DC
Pro
gram
min
g C
om
man
ds
Across PSA Modes: Specific Command Differences
Some programming commands operate differently depending on which Mode the analyzer is set to.
Command Spectrum Analysis, Phase Noise and Noise Figure Mode
Basic, cdmaOne, cdma2000, 1xEV-DO, W-CDMA, GSM, EDGE, NADC, PDC Modes
CONFigure:<measurement>
Accesses the measurement and sets the instrument settings to the defaults. Averaging is turned on and set to 10. The instrument is put in single measurement mode. It does not initiate a measurement. Use INIT:IMM to make one measurement.
Accesses the measurement and sets the instrument settings to the defaults. If you were already in single measurement mode, it takes one measurement and then waits. If you were in continuous measurement mode it continues to measure.
*ESE default Default is 255 which means that every error/status bit change that has occurred will be returned with a *ESR? query. You must set the value of *ESE to choose only the bits/status that you want returned.
Default is 0 which means that none of the error/status bit changes that have occurred will be returned with a *ESR? query. You must set the value of *ESE to choose the bits/status that you want returned.
TRIGger commands
For these modes, only one trigger source can be selected and it will be common across the modes. Also, only one value can be set for the trigger delay, level, or polarity.
For these modes, a unique trigger source can be selected for each mode. Also, each trigger source can have unique settings for the its delay, level, and polarity.
Saving and recalling traces
Traces can only be saved when in the Spectrum Analysis mode (MMEM:STOR:TRAC). This is because the instrument state must be saved along with the trace data and the state data varies depending on the number of modes currently available in the instrument.
Chapter 4 157

NADC Programming CommandsProgramming Command Compatibility Across Model Numbers and Across Modes
NA
DC
Pro
gra
mm
ing
Co
mm
and
s
Using Applications in PSA Series vs. VSA E4406A
NOTE This information only applies to the application modes: Basic, cdmaOne, cdma2000, 1xEV-DO, W-CDMA, GSM, EDGE, NADC, and PDC.
Command PSA Series VSA E4406A: A.04.00 VSA E4406A: A.05.00
*RST Resets instrument, putting it in continuous measurement mode. Use INIT:CONT OFF to select single measurement mode and INIT:IMM to start one measurement.
Resets instrument, putting it in single measurement mode. One measurement is initiated when the command is sent.
Resets instrument, putting it in single measurement mode. No measurement is initiated when the command is sent. Use INIT:IMM to start one measurement.
CONFigure:<measurement>
Accesses the measurement and sets the instrument settings to the defaults. If you were already in single measurement mode, it takes one measurement and then waits.
Same as PSA.
Accesses the measurement and sets the instrument settings to the defaults. If you were already in single measurement mode, it takes one measurement and then waits.
Accesses the measurement and sets the instrument settings to the defaults. If you were already in single measurement mode, it does not initiate a measurement. Use INIT:IMM to make one measurement.
*ESE default Default is 255 which means that every error/status bit change that has occurred will be returned with a *ESR? query. You must set the value of *ESE to choose only the bits/status that you want returned.
Default is 0 which means that none of the error/status bit changes that have occurred will be returned with a *ESR? query. You must set the value of *ESE to choose the bits/status that you want returned.
Same as VSA A.04.00.
Default is 0 which means that none of the error/status bit changes that have occurred will be returned with a *ESR? query. You must set the value of *ESE to choose the bits/status that you want returned.
*LRN The command is not available.
The command is available.
The command is available.
158 Chapter 4

NADC Programming CommandsProgramming Command Compatibility Across Model Numbers and Across Modes
NA
DC
Pro
gram
min
g C
om
man
ds
TRIGger commands
In Spectrum Analysis mode only one value can be set for the trigger’s source, delay, level, or polarity.
Basic, GSM, EDGE, cdmaOne, cdma2000, W-CDMA, NADC, PDC modes function the same as VSA
You can select a unique trigger source for each mode. Each trigger source can have unique settings for the delay, level, and polarity parameters.
Same as VSA A.04.00.
You can select a unique trigger source for each mode. Each trigger source can have unique settings for the delay, level, and polarity parameters.
AUTO ON|OFF control and setting manual values
We recommend that you set a function’s automatic state to OFF, before you send it your manual value.
Some functions will turn off the automatic mode when you send a specific manual value, but others will not. This also varies with the instrument model.
We recommend that you set a function’s automatic state to OFF, before you send it your manual value.
Some functions will turn off the automatic mode when you send a specific manual value, but others will not. This also varies with the instrument model.
We recommend that you set a function’s automatic state to OFF, before you send it your manual value.
Some functions will turn off the automatic mode when you send a specific manual value, but others will not. This also varies with the instrument model.
Command PSA Series VSA E4406A: A.04.00 VSA E4406A: A.05.00
Chapter 4 159

NADC Programming CommandsCALCulate Subsystem
NA
DC
Pro
gra
mm
ing
Co
mm
and
s
CALCulate SubsystemThis subsystem is used to perform post-acquisition data processing. In effect, the collection of new data triggers the CALCulate subsystem. In this instrument, the primary functions in this subsystem are markers and limits.
The SCPI default for data output format is ASCII. The format can be changed to binary with FORMat:DATA which transports faster over the bus.
ACP - Limits
Adjacent Channel Power—Limit Test
:CALCulate:ACP:LIMit[:TEST] OFF|ON|0|1
:CALCulate:ACP:LIMit[:TEST]?
Turn limit test on or off.
Factory Preset: On
Remarks: You must be in the NADC, PDC mode to use this command. Use INSTrument:SELect to set the mode.
160 Chapter 4

NADC Programming CommandsCALCulate Subsystem
NA
DC
Pro
gram
min
g C
om
man
ds
Test Current Results Against all Limits
:CALCulate:CLIMits:FAIL?
Queries the status of the current measurement limit testing. It returns a 0 if the measured results pass when compared with the current limits. It returns a 1 if the measured results fail any limit tests.
Data Query
:CALCulate:DATA[n]?
Returns the designated measurement data for the currently selected measurement and sub-opcode.
n = any valid sub-opcode for the current measurement. See the “MEASure Group of Commands” on page 209 for information on the data that can be returned for each measurement.
For sub-opcodes that return trace data use the :CALCulate:DATA[n]:COMPress? command below.
Calculate/Compress Trace Data Query
:CALCulate:DATA<n>:COMPress? BLOCk|CFIT|MAXimum|MINimum|MEAN|DMEan|RMS|RMSCubed|SAMPle|SDEViation|PPHase[,<soffset>[,<length>[,<roffset>[,<rlimit>]]]]
Returns compressed data for the specified trace data. The data is returned in the same units as the original trace and only works with the currently selected measurement. The command is used with a sub-opcode <n> since measurements usually return several types of trace data. See the following table for the sub-opcodes for the trace data names that are available in each measurement. For sub-opcodes that return scalar data use the :CALCulate:DATA[n]? command above.
This command is used to compress or decimate a long trace to extract and return only the desired data. A typical example would be to acquire N frames of GSM data and return the mean power of the first burst in each frame. The command can also be used to identify the best curve fit for the data.
• BLOCk or block data - returns all the data points from the region of the trace data that you specify. For example, it could be used to return the data points of an input signal over several timeslots, excluding the portions of the trace data that you do not want.
• CFIT or curve fit - applies curve fitting routines to the data. <soffset> and <length> are required to define the data that you
Chapter 4 161

NADC Programming CommandsCALCulate Subsystem
NA
DC
Pro
gra
mm
ing
Co
mm
and
s
want. <roffset> is an optional parameter for the desired order of the curve equation. The query will return the following values: the x-offset (in seconds) and the curve coefficients ((order + 1) values).
MIN, MAX, MEAN, DME, RMS, RMSC, SAMP, SDEV and PPH return one data value for each specified region (or <length>) of trace data, for as many regions as possible until you run out of trace data (using <roffset> to specify regions). Or they return the number regions you specify (using <rlimit>) ignoring any data beyond that.
• MINimum - returns the minimum data point for the specified region(s) of trace data For I/Q trace data, the minimum magnitude of the I/Q pairs is returned.
• MAXimum - returns the maximum data point for the specified region(s) of trace data. For I/Q trace data, the maximum magnitude of the I/Q pairs is returned.
• MEAN - returns the arithmetic mean of the data point values for the specified region(s) of trace data. For I/Q trace data, the mean of the magnitudes of the I/Q pairs is returned. See the following equations.
Note: If the original trace data is in dB, this function returns the arithmetic mean of those log values, not log of the mean power, which is a more useful value.
Equation 4-1 Mean Value of Data Points for Specified Region(s)
where Xi is a data point value, and n is the number of data points in the specified region(s).
Equation 4-2 Mean Value of I/Q Data Pairs for Specified Region(s)
where |Xi| is the magnitude of an I/Q pair, and n is the number of I/Q pairs in the specified region(s).
• DMEan - returns the mean power (in dB/dBm) of the data point values for the specified region(s) of trace data. See the following equation:
Figure 4-1 DMEan Value of Data Points for Specified Region(s)
MEAN 1n--- Xi
Xi region(s)∈∑=
MEAN 1n--- Xi
Xi region(s)∈∑=
162 Chapter 4

NADC Programming CommandsCALCulate Subsystem
NA
DC
Pro
gram
min
g C
om
man
ds
• RMS - returns the arithmetic rms of the data point values for the specified region(s) of trace data. See the following equation.
For I/Q trace data, the rms of the magnitudes of the I/Q pairs is returned. See the following equation.
Note: This function is very useful for I/Q trace data. However, if the original trace data is in dB, this function returns the rms of the log values which is not usually needed.
Equation 4-3 RMS Value of Data Points for Specified Region(s)
where Xi is a data point value, and n is the number of data points in the specified region(s).
Equation 4-4 RMS Value of I/Q Data Pairs for Specified Region(s)
where Xi is the complex value representation of an I/Q pair, Xi* its conjugate complex number, and n is the number of I/Q pairs in the specified region(s).
Once you have the rms value for a region of I/Q trace data, you may want to calculate the mean power. You must convert this rms I/Q value (peak volts) to power in dB.
• RMSCubed - returns the arithmetic rms of the cubed voltage normalized data point values for the specified region(s) of I/Q trace data by following the formula which is specifically defined for calculating the “Cubic Metric.” This formula is described in the 3GPP TS.25.101 release-7 document. The RMSCubed parameter can be used on any set of I/Q pairs (DATA0) with units of points, not
DME 10 log10× 1n--- Xi
10------⎝ ⎠⎛ ⎞
Xi region(s)∈∑⎝ ⎠
⎜ ⎟⎛ ⎞
=
RMS 1n--- Xi2
Xi region(s)∈∑=
RMS 1n--- Xi Xi*
Xi region(s)∈∑=
10 log× 10 rms value( )2×[ ]
Chapter 4 163

NADC Programming CommandsCALCulate Subsystem
NA
DC
Pro
gra
mm
ing
Co
mm
and
s
time.
Equation 4-5 RMSC Values of I/Q Data Pairs for Specified Region(s)
where Xi is the complex value representation of an I/Q pair, Xi* its conjugate complex number, and n is the number of I/Q pairs in the specified region(s).
• SAMPle - returns the first data value for the specified region(s) of trace data. For I/Q trace data, the first I/Q pair is returned.
• SDEViation - returns the arithmetic standard deviation for the data point values for the specified region(s) of trace data. See the following equation.
For I/Q trace data, the standard deviation of the magnitudes of the I/Q pairs is returned. See the following equation.
Equation 4-6 Standard Deviation of Data Point Values for Specified Region(s)
where Xi is a data point value, X is the arithmetic mean of the data point values for the specified region(s), and n is the number of data points in the specified region(s).
Equation 4-7 Standard Deviation of I/Q Data Pair Values for Specified Region(s)
20 n XiXi*
XiXi*
Xi region(s)∈∑
--------------------------------------------------
⎝ ⎠⎜ ⎟⎜ ⎟⎜ ⎟⎜ ⎟⎜ ⎟⎛ ⎞3
Xi region(s)∈∑log=
RMSC 20 1n--- XiXi*
1n--- XiXi*
Xi region(s)∈∑
-------------------------------------------------
⎝ ⎠⎜ ⎟⎜ ⎟⎜ ⎟⎜ ⎟⎛ ⎞ 3
⎩ ⎭⎪ ⎪⎪ ⎪⎨ ⎬⎪ ⎪⎪ ⎪⎧ ⎫
Xi reagion(s)∈∑
2
log=
SDEV 1n--- Xi X–( )2
Xi region(s)∈∑=
SDEV 1n--- Xi X–( )2
Xi region(s)∈∑=
164 Chapter 4

NADC Programming CommandsCALCulate Subsystem
NA
DC
Pro
gram
min
g C
om
man
ds
where |Xi| is the magnitude of an I/Q pair, X is the mean of the magnitudes for the specified region(s), and n is the number of data points in the specified region(s).
• PPHase - returns the pairs of rms power (dBm) and arithmetic mean phase (radian) for every specified region and frequency offset (Hz). The number of pairs is defined by the specified number of regions. The command can be used for I/Q vector (n=0) in Waveform (time domain) measurement and all parameters are specified by data point in PPH.
The rms power of the specified region may be expressed as:
Power = 10 x log [10 x (RMS I/Q value)] + 10.
where Xi is the complex value representation of an I/Q pair, Xi* its conjugate complex number, and n is the number of I/Q pairs in the specified region.
The arithmetic mean phase of the specified region may be expressed as:
Where Yi is the unwrapped phase of I/Q pair with applying frequency correction and n is the number of I/Q pairs in the specified region.
The frequency correction is made by the frequency offset calculated by the arithmetic mean of every specified region’s frequency offset. Each frequency offset is calculated by the least square method against the unwrapped phase of I/Q pair.
Figure 4-2 Sample Trace Data - Constant Envelope
The RMS I/Q value (peak volts) 1n--- XiXi*
Xi region∈∑=
Phase 1n--- Yi
Yi region∈∑=
t0
soffset
length
roffset
If rlimit is set to 3, this last chunk of data will be ignored.
Chapter 4 165

NADC Programming CommandsCALCulate Subsystem
NA
DC
Pro
gra
mm
ing
Co
mm
and
s
Figure 4-3 Sample Trace Data - Not Constant Envelope
<soffset> - start offset is an optional real number (in seconds). It specifies the amount of data at the beginning of the trace that will be ignored before the decimation process starts. It is the time from the start of the trace to the point where you want to start using the data. The default value is zero.
<length> - is an optional real number (in seconds). It defines how much data will be compressed into one value. This parameter has a default value equal to the current trace length.
<roffset> - repeat offset is an optional real number (in seconds). It defines the beginning of the next field of trace elements to be compressed. This is relative to the beginning of the previous field. This parameter has a default value equal to the <length> variable.
<rlimit> - repeat limit is an optional integer. It specifies the number of data items that you want returned. It will ignore any additional items beyond that number. You can use the Start offset and the Repeat limit to pick out exactly what part of the data you want to use. The default value is all the data.
Example: To query the mean power of a set of GSM bursts:
1. Set the waveform measurement sweep time to acquire at least one burst.
2. Set the triggers such that acquisition happens at a known position relative to a burst.
3. Then query the mean burst levels using, CALC:DATA2:COMP? MEAN,24e-6,526e-6 (These parameter values correspond to GSM signals, where 526e-6 is the length of the burst in the slot and you just want 1 burst.)
t0
soffset
length
roffset
If rlimit is set to 3, this chunk of data and any additional data will be ignored.
166 Chapter 4

NADC Programming CommandsCALCulate Subsystem
NA
DC
Pro
gram
min
g C
om
man
ds
NOTE There is a more detailed example in the “Improving the Speed of Your Measurements” section in the E4406A Programmer’s Guide. There is also a sample program in the Programming Fundamentals chapter of that book, and a copy of it is on the documentation CD-ROM.
Remarks: The optional parameters must be entered in the specified order. For example, if you want to specify <length>, you must also specify <soffset>.
This command uses the data in the format specified by FORMat:DATA, returning either binary or ASCII data.
History: Added in revision A.03.00
Changed in revision A.05.00
Measurement Available Traces Markers Available?
ACP - adjacent channel power
(Basic, cdmaOne, cdma2000, W-CDMA, iDEN, WiDEN, NADC, PDC modes)
no traces
(n=0)a for I/Q points
no markers
BER - bit error rate
(iDEN, WiDEN mode)
no traces
(n=0)a for I/Q data
no markers
CDPower - code domain power
(cdmaOne mode)
POWer (n=2)a
TIMing (n=3)a
PHASe (n=4)a
(n=0)a for I/Q points
yes
CDPower - code domain power
(cdma2000 mode)
CDPower (n=2)a
EVM (n=5)a
MERRor (n=6)a
PERRor (n=7)a
SPOWer (n=9)a
CPOWer (n=10)a
(n=0)a for I/Q points
yes
Chapter 4 167

NADC Programming CommandsCALCulate Subsystem
NA
DC
Pro
gra
mm
ing
Co
mm
and
s
CDPower - code domain power
(W-CDMA mode)
CDError (n=13)a
CDPower (n=2)a
EVM (n=5)a
MERRor (n=6)a
PERRor (n=7)a
SPOWer (n=9)a
CPOWer (n=10)a
(n=0)a for I/Q points
yes
CHPower - channel power
(Basic, cdmaOne, cdma2000, W-CDMA modes)
SPECtrum (n=2)a
(n=0)a for I/Q points
no markers
CSPur - spurs close
(cdmaOne mode)
SPECtrum (n=2)a
ULIMit (n=3)a
(n=0)a for I/Q points
yes
EEVM - EDGE error vector magnitude
(EDGE mode)
EVMerror (n=2)a
MERRor (n=3)a
PERRor (n=4)a
(n=0)a for I/Q points
yes
EORFspectr - EDGE output RF spectrum
(EDGE mode)
RFEMod (n=2)a
RFESwitching (n=3)a
SPEMod (n=4)a
LIMMod (n=5)a
(n=0)a for I/Q points
yes, only for a single offset
yes, only for multiple offsets
EPVTime - EDGE power versus time
(EDGE mode)
RFENvelope (n=2)a
UMASk (n=3)a
LMASk (n=4)a
(n=0)a for I/Q points
yes
Measurement Available Traces Markers Available?
168 Chapter 4

NADC Programming CommandsCALCulate Subsystem
NA
DC
Pro
gram
min
g C
om
man
ds
ETSPur - EDGE transmit band spurs
(EDGE mode)
SPECtrum (n=2)a
ULIMit (n=3)a
(n=0)a for I/Q points
yes
EVM - error vector magnitude
(NADC, PDC modes)
EVM (n=2)a
MERRor (n=3)a
PERRor (n=4)a
(n=0)a for I/Q points
yes
EVMQpsk - QPSK error vector magnitude
(cdma2000, W-CDMA modes)
EVM (n=2)a
MERRor (n=3)a
PERRor (n=4)a
(n=0)a for I/Q points
yes
IM - intermodulation
(cdma2000, W-CDMA modes)
SPECtrum (n=2)a
(n=0)a for I/Q points
yes
MCPower - multi-carrier power
(W-CDMA mode)
no traces
(n=0)a for I/Q points
no markers
OBW - occupied bandwidth
(cdmaOne, cdma2000, iDEN, WiDEN, PDC, W-CDMA modes)
no traces
(n=0)a for I/Q points
no markers
ORFSpectrum - output RF spectrum
(GSM, EDGE mode)
RFEMod (n=2)a
RFESwitching (n=3)a
SPEMod (n=4)a
LIMMod (n=5)a
(n=0)a for I/Q points
yes, only for a single offset
yes, only for multiple offsets
PFERror - phase and frequency error
(GSM, EDGE mode)
PERRor (n=2)a
PFERror (n=3)a
RFENvelope (n=4)a
(n=0)a for I/Q points
yes
Measurement Available Traces Markers Available?
Chapter 4 169
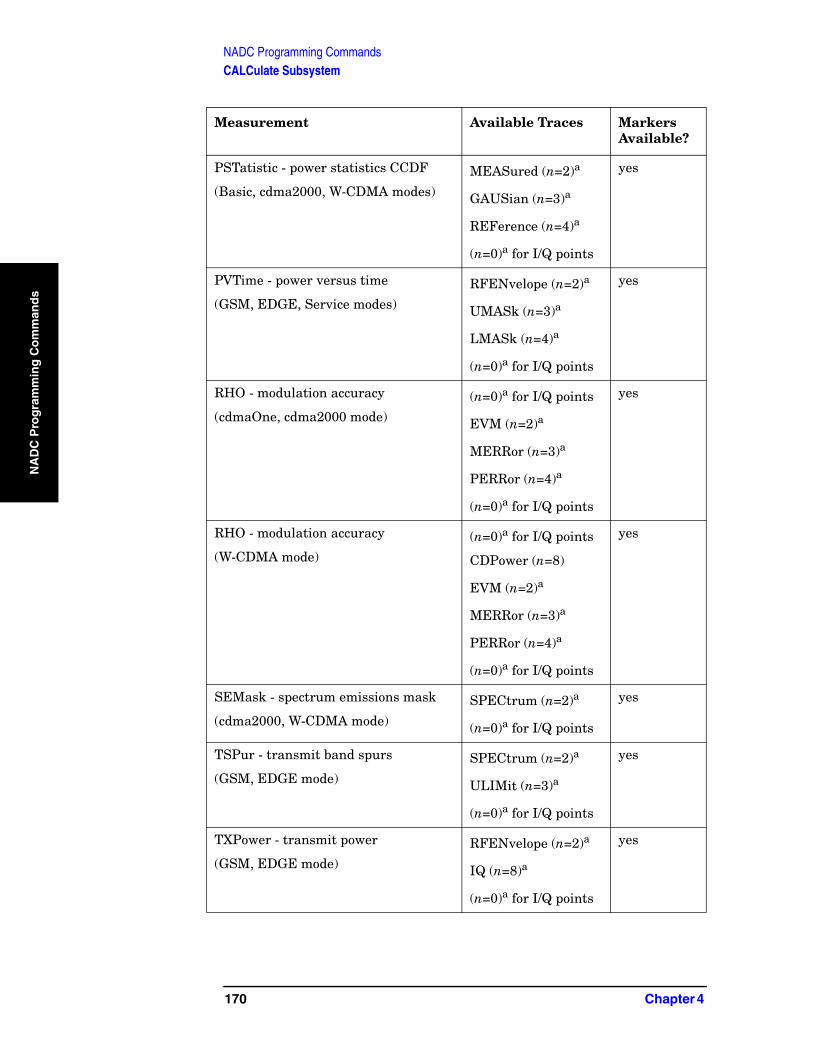
NADC Programming CommandsCALCulate Subsystem
NA
DC
Pro
gra
mm
ing
Co
mm
and
s
PSTatistic - power statistics CCDF
(Basic, cdma2000, W-CDMA modes)
MEASured (n=2)a
GAUSian (n=3)a
REFerence (n=4)a
(n=0)a for I/Q points
yes
PVTime - power versus time
(GSM, EDGE, Service modes)
RFENvelope (n=2)a
UMASk (n=3)a
LMASk (n=4)a
(n=0)a for I/Q points
yes
RHO - modulation accuracy
(cdmaOne, cdma2000 mode)
(n=0)a for I/Q points
EVM (n=2)a
MERRor (n=3)a
PERRor (n=4)a
(n=0)a for I/Q points
yes
RHO - modulation accuracy
(W-CDMA mode)
(n=0)a for I/Q points
CDPower (n=8)
EVM (n=2)a
MERRor (n=3)a
PERRor (n=4)a
(n=0)a for I/Q points
yes
SEMask - spectrum emissions mask
(cdma2000, W-CDMA mode)
SPECtrum (n=2)a
(n=0)a for I/Q points
yes
TSPur - transmit band spurs
(GSM, EDGE mode)
SPECtrum (n=2)a
ULIMit (n=3)a
(n=0)a for I/Q points
yes
TXPower - transmit power
(GSM, EDGE mode)
RFENvelope (n=2)a
IQ (n=8)a
(n=0)a for I/Q points
yes
Measurement Available Traces Markers Available?
170 Chapter 4
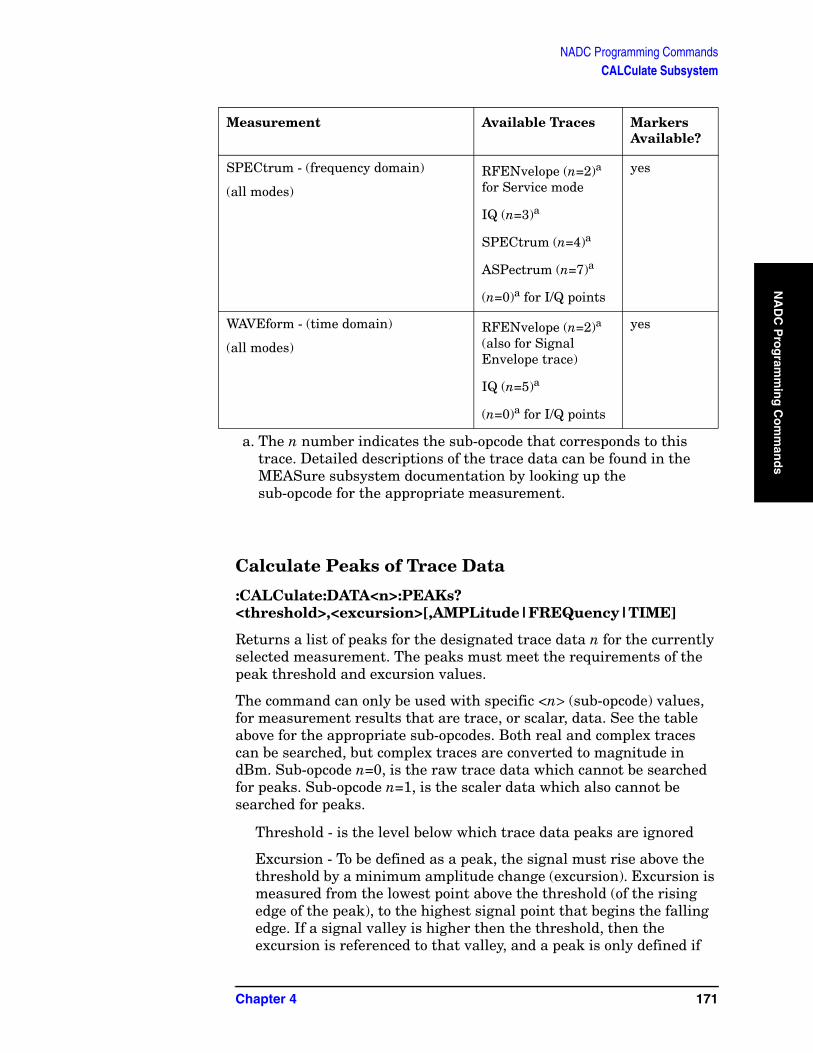
NADC Programming CommandsCALCulate Subsystem
NA
DC
Pro
gram
min
g C
om
man
ds
Calculate Peaks of Trace Data
:CALCulate:DATA<n>:PEAKs? <threshold>,<excursion>[,AMPLitude|FREQuency|TIME]
Returns a list of peaks for the designated trace data n for the currently selected measurement. The peaks must meet the requirements of the peak threshold and excursion values.
The command can only be used with specific <n> (sub-opcode) values, for measurement results that are trace, or scalar, data. See the table above for the appropriate sub-opcodes. Both real and complex traces can be searched, but complex traces are converted to magnitude in dBm. Sub-opcode n=0, is the raw trace data which cannot be searched for peaks. Sub-opcode n=1, is the scaler data which also cannot be searched for peaks.
Threshold - is the level below which trace data peaks are ignored
Excursion - To be defined as a peak, the signal must rise above the threshold by a minimum amplitude change (excursion). Excursion is measured from the lowest point above the threshold (of the rising edge of the peak), to the highest signal point that begins the falling edge. If a signal valley is higher then the threshold, then the excursion is referenced to that valley, and a peak is only defined if
SPECtrum - (frequency domain)
(all modes)
RFENvelope (n=2)a for Service mode
IQ (n=3)a
SPECtrum (n=4)a
ASPectrum (n=7)a
(n=0)a for I/Q points
yes
WAVEform - (time domain)
(all modes)
RFENvelope (n=2)a (also for Signal Envelope trace)
IQ (n=5)a
(n=0)a for I/Q points
yes
a. The n number indicates the sub-opcode that corresponds to this trace. Detailed descriptions of the trace data can be found in the MEASure subsystem documentation by looking up the sub-opcode for the appropriate measurement.
Measurement Available Traces Markers Available?
Chapter 4 171
NADC Programming CommandsCALCulate Subsystem
NA
DC
Pro
gra
mm
ing
Co
mm
and
s
the signal following that valley exceeds the excursion.
Amplitude - lists the peaks in order of descending amplitude, so the highest peak is listed first. This is the default peak order listing if the optional parameter is not specified.
Frequency - lists the peaks in order of occurrence, left to right across the x-axis
Time - lists the peaks in order of occurrence, left to right across the x-axis
Example: Select the spectrum measurement.
Use CALC:DATA4:PEAK? -40,10,FREQ to identify the peaks above −40 dBm, with excursions of at least 10 dB, in order of increasing frequency.
Query Results: Returns a list of floating-point numbers. The first value in the list is the number of peak points that follow. A peak point consists of two values: a peak amplitude followed by the its corresponding frequency (or time).
If no peaks are found the peak list will consist of only the number of peaks, (0).
The peak list is limited to 100 peaks. Peaks in excess of 100 are ignored.
Remarks: This command uses the data setting specified by the FORMat:DATA command and can return real 32-bit, real 64-bit, or ASCII data. The default data format is ASCII.
History: For E4406A:Added in revision A.03.00 and later
172 Chapter 4
NADC Programming CommandsCALCulate Subsystem
NA
DC
Pro
gram
min
g C
om
man
ds
EVM - Limits
Error Vector Magnitude—First 10 Symbols EVM Limit
:CALCulate:EVM:LIMit:F10 <percent>
:CALCulate:EVM:LIMit:F10?
Set the first 10 symbols EVM limit in percent. This functionality is only for mobile testing.
Factory Preset: 25.0%
Range: 0 to 50%
Remarks: You must be in the NADC mode to use this command. Use INSTrument:SELect to set the mode.
History: For E4406A:Version A.02.00 or later
Error Vector Magnitude—I/Q Origin Offset Error Limit
:CALCulate:EVM:LIMit:IQOOffset <dB>
:CALCulate:EVM:LIMit:IQOOffset?
Set the I/Q origin offset error limit in dB.
Factory Preset: − 20 dB
Range: − 100 dB to 0 dB
Remarks: You must be in the NADC or PDC mode to use this command. Use INSTrument:SELect to set the mode.
History: Version A.02.00 or later
Error Vector Magnitude—Peak EVM Limit
:CALCulate:EVM:LIMit:PEAK <percent>
:CALCulate:EVM:LIMit:PEAK?
Set the peak EVM limit in percent.
Factory Preset: 40.0%
Range: 0 to 50%
Remarks: You must be in the NADC or PDC mode to use this command. Use INSTrument:SELect to set the mode.
History: For E4406A:Version A.02.00 or later
Chapter 4 173

NADC Programming CommandsCALCulate Subsystem
NA
DC
Pro
gra
mm
ing
Co
mm
and
s
Error Vector Magnitude—RMS EVM Limit
:CALCulate:EVM:LIMit:RMS <percent>
:CALCulate:EVM:LIMit:RMS?
Set the RMS EVM limit in percent.
Factory Preset: 12.5%
Range: 0 to 50%
Remarks: You must be in the NADC or PDC mode to use this command. Use INSTrument:SELect to set the mode.
History: For E4406A:Version A.02.00 or later
Error Vector Magnitude—Limit Test
:CALCulate:EVM:LIMit[:TEST] OFF|ON|0|1
:CALCulate:EVM:LIMit[:TEST]?
Turn limit test on or off.
Factory Preset: On
Remarks: You must be in the NADC or PDC mode to use this command. Use INSTrument:SELect to set the mode.
History: For E4406A:Version A.02.00 or later
Error Vector Magnitude—Time to Sync Word
:CALCulate:EVM:TTSWord?
Query returns the time between the trigger and the start of the first sync word.
Default Unit: Seconds
Remarks: You must be in the NADC or PDC mode to use this command. Use INSTrument:SELect to set the mode.
History: For E4406A:Version A.03.00 or later
174 Chapter 4

NADC Programming CommandsCALCulate Subsystem
NA
DC
Pro
gram
min
g C
om
man
ds
CALCulate:MARKers Subsystem
Markers can be put on your displayed measurement data to supply information about specific points on the data. Some of the things that markers can be used to measure include: precise frequency at a point, minimum or maximum amplitude, and the difference in amplitude or frequency between two points.
When using the marker commands you must specify the measurement in the SCPI command. We recommend that you use the marker commands only on the current measurement. Many marker commands will return invalid results, when used on a measurement that is not current. (This is true for commands that do more than simply setting or querying an instrument parameter.) No error is reported for these invalid results.
You must make sure that the measurement is completed before trying to query the marker value. Using the MEASure or READ command, before the marker command, forces the measurement to complete before allowing the next command to be executed.
Each measurement has its own instrument state for marker parameters. Therefore, if you exit the measurement, the marker settings in each measurement are saved and are then recalled when you change back to that measurement.
Basic Mode - <measurement> key words
• ACPr - no markers (E4406A only)• CHPower - no markers (E4406A only)• PSTatistic - markers available (E4406A only)• SPECtrum - markers available• WAVeform - markers available
Service Mode - <measurement> key words
• PVTime - no markers• SPECtrum - markers available• WAVeform - markers available
1xEV-DO Mode - <measurement> key words
• CDPower - markers available• CHPower - no markers• EVMQpsk - markers available• IM - markers available• OBW - no markers• PSTatistic - markers available• PVTime - markers available• RHO - markers available
Chapter 4 175

NADC Programming CommandsCALCulate Subsystem
NA
DC
Pro
gra
mm
ing
Co
mm
and
s
• SEMask - markers available• SPECtrum - markers available• WAVeform - markers available
cdmaOne Mode - <measurement> key words
• ACPr - no markers• CHPower - no markers• CDPower - markers available• CSPur - markers available• RHO - markers available• SPECtrum - markers available• WAVeform - markers available
cdma2000 Mode - <measurement> key words
• ACP - no markers• CDPower - markers available• CHPower - no markers• EVMQpsk - markers available• IM - markers available• OBW - no markers• PSTatistic - markers available• RHO - markers available• SEMask - markers available• SPECtrum - markers available• WAVeform - markers available
GSM (with EDGE) Mode - <measurement> key words
• EEVM - markers available• EORFspectr - markers available• EPVTime - no markers• ETSPur - markers available• ORFSpectrum - markers available• PFERror - markers available• PVTime - no markers• SPECtrum - markers available• TSPur - markers available• TXPower - no markers• WAVeform - markers available
GSM Mode - <measurement> key words
• ORFSpectrum - markers available• PFERror - markers available• PVTime - no markers• SPECtrum - markers available• TSPur - markers available• TXPower - no markers• WAVeform - markers available
176 Chapter 4

NADC Programming CommandsCALCulate Subsystem
NA
DC
Pro
gram
min
g C
om
man
ds
iDEN Mode - <measurement> key words
• ACP - no markers• BER - no markers• OBW - no markers• SPECtrum - markers available• WAVeform - markers available
NADC Mode - <measurement> key words
• ACP - no markers• EVM - markers available• SPECtrum - markers available• WAVeform - markers available
PDC Mode - <measurement> key words
• ACP - no markers• EVM - markers available• OBW - no markers• SPECtrum - markers available• WAVeform - markers available
W-CDMA Mode - <measurement> key words
• ACP - no markers• CDPower - markers available• CHPower - no markers• EVMQpsk - markers available• IM - markers available• MCPower - no markers• OBW - no markers• PSTatistic - markers available• RHO - markers available• SEMask - markers available• SPECtrum - markers available• WAVeform - markers available
Example:
Suppose you are using the Spectrum measurement in your measurement personality. To position marker 2 at the maximum peak value of the trace that marker 2 is currently on, the command is:
:CALCulate:SPECtrum:MARKer2:MAXimum
You must make sure that the measurement is completed before trying to query the marker value. Use the MEASure or READ command before using the marker command. This forces the measurement to complete before allowing the next command to be executed.
Chapter 4 177

NADC Programming CommandsCALCulate Subsystem
NA
DC
Pro
gra
mm
ing
Co
mm
and
s
Markers All Off on All Traces
:CALCulate:<measurement>:MARKer:AOFF
Turns off all markers on all the traces in the specified measurement.
Example: CALC:SPEC:MARK:AOFF
Remarks: The keyword for the current measurement must be specified in the command. (Some examples include: SPECtrum, WAVeform)
Front PanelAccess: Marker, More, Marker All Off
Marker Function Result
:CALCulate:<measurement>:MARKer[1]|2|3|4:FUNCtion:RESult?
Queries the result of the currently active marker function. The measurement must be completed before querying the marker.A particular measurement may not have all the types of markers available.
The marker must have already been assigned to a trace. Use :CALCulate:<measurement>:MARKer[1]|2|3|4:TRACe to assign a
marker to a particular trace.
Example: CALC:SPEC:MARK:FUNC:RES?
Remarks: The keyword for the current measurement must be specified in the command. (Some examples include: SPECtrum, WAVeform)
Front PanelAccess: Marker, Marker Function
Marker Peak (Maximum) Search
:CALCulate:<measurement>:MARKer[1]|2|3|4:MAXimum
Places the selected marker on the highest point on the trace that is assigned to that particular marker number.
The marker must have already been assigned to a trace. Use :CALCulate:<measurement>:MARKer[1]|2|3|4:TRACe to assign a
marker to a particular trace.
Example: CALC:SPEC:MARK1:MAX
Remarks: The keyword for the current measurement must be specified in the command. (Some examples include:
178 Chapter 4
NADC Programming CommandsCALCulate Subsystem
NA
DC
Pro
gram
min
g C
om
man
ds
SPECtrum, WAVeform)
Front PanelAccess: Search
Marker Peak (Minimum) Search
:CALCulate:<measurement>:MARKer[1]|2|3|4:MINimum
Places the selected marker on the lowest point on the trace that is assigned to that particular marker number.
The marker must have already been assigned to a trace. Use :CALCulate:<measurement>:MARKer[1]|2|3|4:TRACe to assign a
marker to a particular trace.
Example: CALC:SPEC:MARK2 MIN
Remarks: The keyword for the current measurement must be specified in the command. (Some examples include: SPECtrum, WAVeform)
Marker Mode
E4406A (all modes):
PSA Series (Basic, cdmaOne, cdma2000, W-CDMA, GSM/EDGE, NADC, PDC modes):
:CALCulate:<measurement>:MARKer[1]|2|3|4:MODE POSition|DELTa
PSA Series (Phase Noise mode only):
:CALCulate:<measurement>:MARKer[1]|2|3|4:MODE POSition|DELTa|RMSDegree|RMSRadian|RFM|RMSJitter|OFF
:CALCulate:<measurement>:MARKer[1]|2|3|4:MODE?
E4406A/PSA: Selects the type of marker to be a normal position-type marker or a delta marker. A specific measurement may not have both types of markers. For example, several measurements only have position markers
PSA Phase Noise Mode: Selects the type of marker to be a normal position-type marker, a delta marker or an RMS measurement marker.
The marker must have already been assigned to a trace. Use :CALCulate:<measurement>:MARKer[1]|2|3|4:TRACe to assign a
marker to a particular trace.
Example: CALC:SPEC:MARK:MODE DELTA
Chapter 4 179

NADC Programming CommandsCALCulate Subsystem
NA
DC
Pro
gra
mm
ing
Co
mm
and
s
Remarks: For the delta mode only markers 1 and 2 are valid.
The keyword for the current measurement must be specified in the command. (Some examples include: SPECtrum, WAVeform)
Front PanelAccess: Marker, Marker [Delta]
Marker On/Off
:CALCulate:<measurement>:MARKer[1]|2|3|4[:STATe] OFF|ON|0|1
:CALCulate:<measurement>:MARKer[1]|2|3|4[:STATe]?
Turns the selected marker on or off.
The marker must have already been assigned to a trace. Use :CALCulate:<measurement>:MARKer[1]|2|3|4:TRACe to assign a
marker to a particular trace.
Example: CALC:SPEC:MARK2: on
Remarks: The keyword for the current measurement must be specified in the command. (Some examples include: SPECtrum, AREFerence, WAVeform)
The WAVeform measurement only has two markers available.
Front PanelAccess: Marker, Select then Marker Normal or Marker On Off
Marker to Trace
:CALCulate:<measurement>:MARKer[1]|2|3|4:TRACe <trace_name>
:CALCulate:<measurement>:MARKer[1]|2|3|4:TRACe?
Assigns the specified marker to the designated trace. Not all types of measurement data can have markers assigned to them.
Example: With the WAVeform measurement selected, a valid command is CALC:SPEC:MARK2:TRACE rfenvelope.
Range: The names of valid traces are dependent upon the selected measurement. See the following table for the available trace names. The trace name assignment is independent of the marker number.
Remarks: The keyword for the current measurement must be
180 Chapter 4

NADC Programming CommandsCALCulate Subsystem
NA
DC
Pro
gram
min
g C
om
man
ds
specified in the command. (Some examples include: SPECtrum, WAVeform)
Front PanelAccess: Marker, Marker Trace
Measurement Available Traces Markers Available?
ACP - adjacent channel power
(Basic, cdmaOne, cdma2000, W-CDMA, iDEN (E4406A only), NADC, PDC modes)
no traces
(n=0)a for I/Q points
no markers
BER - bit error rate
(iDEN mode, E4406A only)
no traces
(n=0)a for I/Q data
no markers
CDPower - code domain power
(cdmaOne mode)
POWer (n=2)a
TIMing (n=3)a
PHASe (n=4)a
(n=0)a for I/Q points
yes
CDPower - code domain power
(cdma2000, W-CDMA, 1xEV-DO modes)
CDPower (n=2)a
EVM (n=5)a
MERRor (n=6)a
PERRor (n=7)a
SPOWer (n=9)a
CPOWer (n=10)a
(n=0)a for I/Q points
yes
CHPower - channel power
(Basic, cdmaOne, cdma2000, W-CDMA, 1xEV-DO modes)
SPECtrum (n=2)a
(n=0)a for I/Q points
no markers
CSPur - spurs close
(cdmaOne mode)
SPECtrum (n=2)a
ULIMit (n=3)a
(n=0)a for I/Q points
yes
EEVM - EDGE error vector magnitude
(EDGE mode)
EVMerror (n=2)a
MERRor (n=3)a
PERRor (n=4)a
(n=0)a for I/Q points
yes
Chapter 4 181

NADC Programming CommandsCALCulate Subsystem
NA
DC
Pro
gra
mm
ing
Co
mm
and
s
EORFspectr - EDGE output RF spectrum
(EDGE mode)
RFEMod (n=2)a
RFESwitching (n=3)a
SPEMod (n=4)a
LIMMod (n=5)a
(n=0)a for I/Q points
yes, only for a single offset
yes, only for multiple offsets
EPVTime - EDGE power versus time
(EDGE mode)
RFENvelope (n=2)a
UMASk (n=3)a
LMASk (n=4)a
(n=0)a for I/Q points
yes
ETSPur - EDGE transmit band spurs
(EDGE mode)
SPECtrum (n=2)a
ULIMit (n=3)a
(n=0)a for I/Q points
yes
EVM - error vector magnitude
(NADC, PDC modes)
EVM (n=2)a
MERRor (n=3)a
PERRor (n=4)a
(n=0)a for I/Q points
yes
EVMQpsk - QPSK error vector magnitude
(cdma2000, W-CDMA, 1xEV-DO modes)
EVM (n=2)a
MERRor (n=3)a
PERRor (n=4)a
(n=0)a for I/Q points
yes
IM - intermodulation
(cdma2000, W-CDMA, 1xEV-DO modes)
SPECtrum (n=2)a
(n=0)a for I/Q points
yes
MCPower - multi-carrier power
(W-CDMA mode)
no traces
(n=0)a for I/Q points
no markers
OBW - occupied bandwidth
(cdmaOne, cdma2000, iDEN (E4406A only), PDC, W-CDMA, 1xEV-DO modes)
no traces
(n=0)a for I/Q points
no markers
Measurement Available Traces Markers Available?
182 Chapter 4
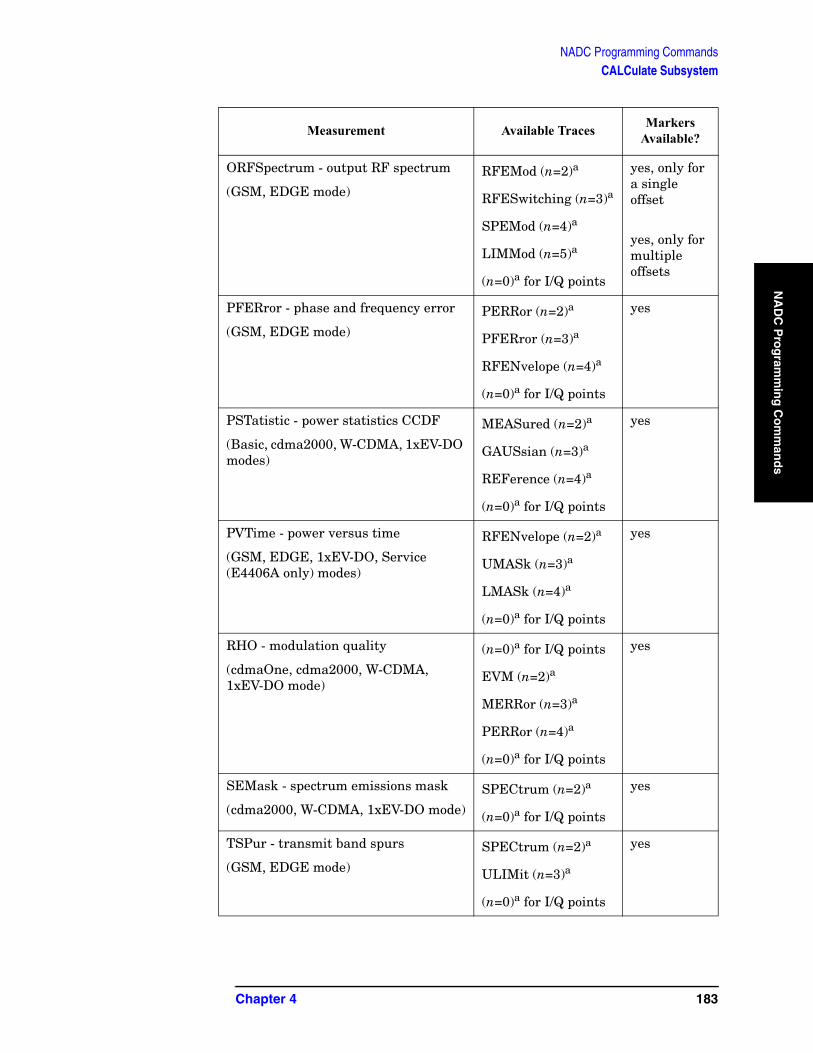
NADC Programming CommandsCALCulate Subsystem
NA
DC
Pro
gram
min
g C
om
man
ds
ORFSpectrum - output RF spectrum
(GSM, EDGE mode)
RFEMod (n=2)a
RFESwitching (n=3)a
SPEMod (n=4)a
LIMMod (n=5)a
(n=0)a for I/Q points
yes, only for a single offset
yes, only for multiple offsets
PFERror - phase and frequency error
(GSM, EDGE mode)
PERRor (n=2)a
PFERror (n=3)a
RFENvelope (n=4)a
(n=0)a for I/Q points
yes
PSTatistic - power statistics CCDF
(Basic, cdma2000, W-CDMA, 1xEV-DO modes)
MEASured (n=2)a
GAUSsian (n=3)a
REFerence (n=4)a
(n=0)a for I/Q points
yes
PVTime - power versus time
(GSM, EDGE, 1xEV-DO, Service (E4406A only) modes)
RFENvelope (n=2)a
UMASk (n=3)a
LMASk (n=4)a
(n=0)a for I/Q points
yes
RHO - modulation quality
(cdmaOne, cdma2000, W-CDMA, 1xEV-DO mode)
(n=0)a for I/Q points
EVM (n=2)a
MERRor (n=3)a
PERRor (n=4)a
(n=0)a for I/Q points
yes
SEMask - spectrum emissions mask
(cdma2000, W-CDMA, 1xEV-DO mode)
SPECtrum (n=2)a
(n=0)a for I/Q points
yes
TSPur - transmit band spurs
(GSM, EDGE mode)
SPECtrum (n=2)a
ULIMit (n=3)a
(n=0)a for I/Q points
yes
Measurement Available Traces Markers Available?
Chapter 4 183

NADC Programming CommandsCALCulate Subsystem
NA
DC
Pro
gra
mm
ing
Co
mm
and
s
Marker X Value
:CALCulate:<measurement>:MARKer[1]|2|3|4:X <param>
:CALCulate:<measurement>:MARKer[1]|2|3|4:X?
Position the designated marker on its assigned trace at the specified X value. The parameter value is in X-axis units (which is often frequency or time).
The marker must have already been assigned to a trace. Use :CALCulate:<measurement>:MARKer[1]|2|3|4:TRACe to assign a
marker to a particular trace.
The query returns the current X value of the designated marker. The measurement must be completed before querying the marker.
Example: CALC:SPEC:MARK2:X 1.2e6 Hz
Range: For Phase Noise mode: Graph Start Offset and Stop
TXPower - transmit power
(GSM, EDGE mode)
RFENvelope (n=2)a
IQ (n=8)a
(n=0)a for I/Q points
yes
SPECtrum - (frequency domain)
(all modes)
RFENvelope (n=2)a for Service mode(E4406A only)
IQ (n=3)a
SPECtrum (n=4)a
ASPectrum (n=7)a
(n=0)a for I/Q points
yes
WAVEform - (time domain)
(all modes)
RFENvelope (n=2)a (also for Signal Envelope trace)
IQ (n=5)a
(n=0)a for I/Q points
yes
a. The n number indicates the sub-opcode that corresponds to this trace. Detailed descriptions of the trace data can be found in the MEASure subsystem documentation by looking up the sub-opcode for the appropriate measurement.
Measurement Available Traces Markers Available?
184 Chapter 4

NADC Programming CommandsCALCulate Subsystem
NA
DC
Pro
gram
min
g C
om
man
ds
Offset frequencies.
Default Unit: Matches the units of the trace on which the marker is positioned
Remarks: The keyword for the current measurement must be specified in the command. (Some examples include: LPLot, ACP, WAVeform)
Front PanelAccess: Marker, <active marker>, RPG
Marker X Position
:CALCulate:<measurement>:MARKer[1]|2|3|4:X:POSition <integer>
:CALCulate:<measurement>:MARKer[1]|2|3|4:X:POSition?
Position the designated marker on its assigned trace at the specified X position. A trace is composed of a variable number of measurement points. This number changes depending on the current measurement conditions. The current number of points must be identified before using this command to place the marker at a specific location.
The marker must have already been assigned to a trace. Use :CALCulate:<measurement>:MARKer[1]|2|3|4:TRACe to assign a
marker to a particular trace.
The query returns the current X position for the designated marker. The measurement must be completed before querying the marker.
Example: CALC:SPEC:MARK:X:POS 500
Range: 0 to a maximum of (3 to 920,000)
Remarks: The keyword for the current measurement must be specified in the command. (Some examples include: SPECtrum, WAVeform)
Front PanelAccess: Marker, <active marker>, RPG
Marker Readout Y Value
:CALCulate:<measurement>:MARKer[1]|2|3|4:Y?
Readout the current Y value for the designated marker on its assigned trace. The value is in the Y-axis units for the trace (which is often dBm).
The marker must have already been assigned to a trace. Use :CALCulate:<measurement>:MARKer[1]|2|3|4:TRACe to assign a
marker to a particular trace.
Chapter 4 185

NADC Programming CommandsCALCulate Subsystem
NA
DC
Pro
gra
mm
ing
Co
mm
and
s
The measurement must be completed before querying the marker.
Example: CALC:SPEC:MARK1:Y?
Default Unit: Matches the units of the trace on which the marker is positioned
Remarks: The keyword for the current measurement must be specified in the command. (Some examples include: LPLot, ACP, WAVeform)
186 Chapter 4

NADC Programming CommandsCONFigure Subsystem
NA
DC
Pro
gram
min
g C
om
man
ds
CONFigure SubsystemThe CONFigure commands are used with several other commands to control the measurement process. The full set of commands are described in the section “MEASure Group of Commands” on page 209.
Selecting measurements with the CONFigure/FETCh/MEASure/READ commands sets the instrument state to the defaults for that measurement and to make a single measurement. Other commands are available for each measurement to allow you to change: settings, view, limits, etc. Refer to:
SENSe:<measurement>, SENSe:CHANnel, SENSe:CORRection, SENSe:DEFaults, SENSe:DEViation, SENSe:FREQuency, SENSe:PACKet, SENSe:POWer, SENSe:RADio, SENSe:SYNC
CALCulate:<measurement>, CALCulate:CLIMits
DISPlay:<measurement>
TRIGger
The INITiate[:IMMediate] or INITiate:RESTart commands will initiate the taking of measurement data without resetting any of the measurement settings that you have changed from their defaults.
Configure the Selected Measurement
:CONFigure:<measurement>
A CONFigure command must specify the desired measurement. It will set the instrument settings for that measurement’s standard defaults, but should not initiate the taking of data. The available measurements are described in the MEASure subsystem.
NOTE If CONFigure initiates the taking of data, the data should be ignored. Other SCPI commands can be processed immediately after sending CONFigure. You do not need to wait for the CONF command to complete this 'false' data acquisition.
Configure Query
:CONFigure?
The CONFigure query returns the name of the current measurement.
Chapter 4 187
NADC Programming CommandsDISPlay Subsystem
NA
DC
Pro
gra
mm
ing
Co
mm
and
s
DISPlay SubsystemThe DISPlay controls the selection and presentation of textual, graphical, and TRACe information. Within a DISPlay, information may be separated into individual WINDows.
Adjacent Channel Power - View Selection
:DISPlay:ACP:VIEW BGRaph|SPECtrum
:DISPlay:ACP:VIEW?
Select the adjacent channel power measurement display of bar graph or spectrum.
You may want to disable the spectrum trace data part of the measurement so you can increase the speed of the rest of the measurement display. Use SENSe:ACP:SPECtrum:ENABle to turn on or off the spectrum trace. (Basic and cdmaOne modes only)
Factory Preset: Bar Graph (BGRaph)
Remarks: For E4406A you must be in the Basic, cdmaOne, cdma2000, W-CDMA, NADC or PDC mode to use this command. Use INSTrument:SELect to set the mode.
For PSA you must be in the cdmaOne, cdma2000, W-CDMA, NADC or PDC mode to use this command. Use INSTrument:SELect to set the mode.
Front PanelAccess: ACP, View/Trace
Error Vector Magnitude - View Selection
:DISPlay:EVMagnitude:VIEW POLar|CONStln|QUAD
:DISPlay:EVMagnitude:VIEW?
Select the view of EVM measurement
Factory Preset: POLar
Remarks: You must be in the NADC or PDC mode to use this command. Use INSTrument:SELect to set the mode.
188 Chapter 4
NADC Programming CommandsDISPlay Subsystem
NA
DC
Pro
gram
min
g C
om
man
ds
QPSK Error Vector Magnitude - View Selection
:DISPlay:EVMQpsk:VIEW POLar|ERRor
:DISPlay:EVMQpsk:VIEW?
Set the view of QPSK EVM measurement.
POLar: provides a combination view of the I/Q measured polar constellation graph and the summary data.
ERRor: provides a combination view of the EVM vs. symbol, phase error vs. symbol, magnitude error vs.symbol graphs, and the summary data.
Factory Preset: POLar
Remarks: You must be in the W-CDMA mode to use this command. Use INSTrument:SELect to set the mode.
Select Display Format
:DISPlay:FORMat:TILE
Selects the viewing format that displays multiple windows of the current measurement data simultaneously. Use DISP:FORM:ZOOM to return the display to a single window.
Remarks: For PSA you must be in the Basic, cdmaOne,cdma2000, 1xEV-DO, W-CDMA, GSM (w/EDGE), NADC, or PDC mode to use this command. Use INSTrument:SELect to set the mode
Front PanelAccess: Zoom (toggles between Tile and Zoom)
Select Display Format
:DISPlay:FORMat:ZOOM
Selects the viewing format that displays only one window of the current measurement data (the current active window). Use DISP:FORM:TILE to return the display to multiple windows.
Remarks: For PSA you must be in the Basic, cdmaOne,cdma2000, 1xEV-DO, W-CDMA, GSM (w/EDGE), NADC, or PDC mode to use this command. Use INSTrument:SELect to set the mode
Front PanelAccess: Zoom (toggles between Tile and Zoom)
Chapter 4 189

NADC Programming CommandsDISPlay Subsystem
NA
DC
Pro
gra
mm
ing
Co
mm
and
s
Spectrum - Y-Axis Scale/Div
:DISPlay:SPECtrum[n]:WINDow[m]:TRACe:Y[:SCALe]:PDIVision <power>
:DISPlay:SPECtrum[n]:WINDow[m]:TRACe:Y[:SCALe]:PDIVision?
Sets the amplitude reference level for the y-axis.
n − selects the view, the default is Spectrum.
m − selects the window within the view. The default is 1.
— n=1, m=1 Spectrum
— n=1, m=2 I/Q Waveform
— n=1, m=2 I and Q Waveform (Basic, W-CDMA, cdma2000)
— n=1, m=3 numeric data (Service mode, E4406A only)
— n=1, m=4 RF envelope (Service mode, E4406A only)
— n=2, m=1 I Waveform (Option B7C, E4406A only)
— n=2, m=2 Q Waveform (Option B7C, E4406A only)
— n=3, m=1 I/Q Polar (Basic, W-CDMA, cdma2000)
— n=4, m=1 Linear Spectrum (Basic, W-CDMA, cdma2000)
Factory Preset: 10 dB per division, for Spectrum
100 mV per division, for I/Q Waveform
Range: 0.1 dB to 20 dB per division, for Spectrum
1 nV to 20 V per division, for I/Q Waveform
Default Unit: 10 dB per division, for Spectrum
Remarks: May affect input attenuator setting.
For E4406A to use this command, the appropriate mode should be selected with INSTrument:SELect.
For PSA you must be in Basic, cdmaOne, cdma2000, 1xEV-DO, W-CDMA GSM w/EDGE, NADC, or PDC mode. Set the mode with INSTrument:SELect.
Front PanelAccess: When in Spectrum measurement:
AMPLITUDE Y Scale, Scale/Div.
History: For PSA:Added revision A.02.00
190 Chapter 4

NADC Programming CommandsDISPlay Subsystem
NA
DC
Pro
gram
min
g C
om
man
ds
For E4406A:Modified revision A.05.00
Spectrum - Y-Axis Reference Level
:DISPlay:SPECtrum[n]:WINDow[m]:TRACe:Y[:SCALe]:RLEVel <power>
:DISPlay:SPECtrum[n]:WINDow[m]:TRACe:Y[:SCALe]:RLEVel?
Sets the amplitude reference level for the y-axis.
n, selects the view, the default is RF envelope.
— n=1, m=1 Spectrum
— n=1, m=2 I/Q Waveform
— n=1, m=2 I and Q Waveform (Basic, W-CDMA, cdma2000)
— n=1, m=3 numeric data (Service mode, E4406A only)
— n=1, m=4 RF envelope (Service mode, E4406A only)
— n=2, m=1 I Waveform (Option B7C, E4406A only)
— n=2, m=2 Q Waveform (Option B7C, E4406A only)
— n=3, m=1 I/Q Polar (Basic, W-CDMA, cdma2000)
— n=4, m=1 Linear Spectrum (Basic, W-CDMA, cdma2000)
m − selects the window within the view. The default is 1.
Factory Preset: 0 dBm, for Spectrum
Range: −250 to 250 dBm, for Spectrum
Default Unit: dBm, for Spectrum
Remarks: May affect input attenuator setting.
For E4406A to use this command, the appropriate mode should be selected with INSTrument:SELect.
For PSA you must be in Basic, cdmaOne, cdma2000, 1xEV-DO, W-CDMA GSM w/EDGE, NADC, or PDC mode. Set the mode with INSTrument:SELect.
Front PanelAccess: When in Spectrum measurement:
AMPLITUDE Y Scale, Ref Level
History: For PSA:Added revision A.02.00
For E4406A:
Chapter 4 191

NADC Programming CommandsDISPlay Subsystem
NA
DC
Pro
gra
mm
ing
Co
mm
and
s
Modified revision A.05.00
Turn a Trace Display On/Off
:DISPlay:TRACe[n][:STATe] OFF|ON|0|1
:DISPlay:TRACe[n][:STATe]?
Controls whether the specified trace is visible or not.
n is a sub-opcode that is valid for the current measurement. See the “MEASure Group of Commands” on page 209 for more information about sub-opcodes.
Factory Preset: On
Range: The valid traces and their sub-opcodes are dependent upon the selected measurement. See the following table.
The trace name assignment is independent of the window number.
Remarks: For E4406A to use this command, the appropriate mode should be selected with INSTrument:SELect.
Remarks: For PSA you must be in the Basic, cdmaOne,cdma2000, 1xEV-DO, W-CDMA, GSM (w/EDGE), NADC, or PDC mode to use this command. Use INSTrument:SELect to set the mode
Front PanelAccess: Display, Display Traces
Measurement Available Traces Markers Available?
ACP - adjacent channel power
(Basic, cdmaOne, cdma2000, W-CDMA, iDEN (E4406A only), NADC, PDC modes)
no traces
(n=0)a for I/Q points
no markers
BER - bit error rate
(iDEN mode, E4406A only)
no traces
(n=0)a for I/Q data
no markers
CDPower - code domain power
(cdmaOne mode)
POWer (n=2)a
TIMing (n=3)a
PHASe (n=4)a
(n=0)a for I/Q points
yes
192 Chapter 4

NADC Programming CommandsDISPlay Subsystem
NA
DC
Pro
gram
min
g C
om
man
ds
CDPower - code domain power
(cdma2000, 1xEV-DO, W-CDMA modes)
(n=0)a for I/Q raw data
CDPower (n=2)a
EVM (n=5)a
MERRor (n=6)a
PERRor (n=7)a
SPOWer (n=9)a
CPOWer (n=10)a
yes
CHPower - channel power
(Basic, cdmaOne, cdma2000, 1xEV-DO, W-CDMA modes)
SPECtrum (n=2)a
(n=0)a for I/Q raw data
no markers
CSPur - spurs close
(cdmaOne mode)
SPECtrum (n=2)a
ULIMit (n=3)a
(n=0)a for I/Q points
yes
EEVM - EDGE error vector magnitude
(EDGE mode)
EVMerror (n=2)a
MERRor (n=3)a
PERRor (n=4)a
(n=0)a for I/Q points
yes
EORFspectr - EDGE output RF spectrum
(EDGE mode)
RFEMod (n=2)a
RFESwitching (n=3)a
SPEMod (n=4)a
LIMMod (n=5)a
(n=0)a for I/Q points
yes, only for a single offset
yes, only for multiple offsets
EPVTime - EDGE power versus time
(EDGE mode)
RFENvelope (n=2)a
UMASk (n=3)a
LMASk (n=4)a
(n=0)a for I/Q points
yes
Measurement Available Traces Markers Available?
Chapter 4 193

NADC Programming CommandsDISPlay Subsystem
NA
DC
Pro
gra
mm
ing
Co
mm
and
s
ETSPur - EDGE transmit band spurs
(EDGE mode)
SPECtrum (n=2)a
ULIMit (n=3)a
(n=0)a for I/Q points
yes
EVM - error vector magnitude
(NADC, PDC modes)
EVM (n=2)a
MERRor (n=3)a
PERRor (n=4)a
(n=0)a for I/Q points
yes
EVMQpsk - QPSK error vector magnitude
(cdma2000, 1xEV-DO, W-CDMA modes)
EVM (n=2)a
MERRor (n=3)a
PERRor (n=4)a
(n=0)a for I/Q raw data
yes
IM - intermodulation
(cdma2000, 1xEV-DO, W-CDMA modes)
SPECtrum (n=2)a
(n=0)a for I/Q raw data
yes
MCPower - multi-carrier power
(W-CDMA mode)
no traces
(n=0)a for I/Q points
no markers
OBW - occupied bandwidth
(cdmaOne, cdma2000, 1xEV-DO, iDEN (E4406A only), PDC, W-CDMA modes)
no traces
(n=0)a for I/Q raw data
no markers
ORFSpectrum - output RF spectrum
(GSM, EDGE mode)
RFEMod (n=2)a
RFESwitching (n=3)a
SPEMod (n=4)a
LIMMod (n=5)a
(n=0)a for I/Q points
yes, only for a single offset
yes, only for multiple offsets
PFERror - phase and frequency error
(GSM, EDGE mode)
PERRor (n=2)a
PFERror (n=3)a
RFENvelope (n=4)a
(n=0)a for I/Q points
yes
Measurement Available Traces Markers Available?
194 Chapter 4

NADC Programming CommandsDISPlay Subsystem
NA
DC
Pro
gram
min
g C
om
man
ds
PSTatistic - power statistics CCDF
(Basic, cdma2000, 1xEV-DO, W-CDMA modes)
MEASured (n=2)a
GAUSian (n=3)a
REFerence (n=4)a
(n=0)a for I/Q points
yes
PVTime - power versus time
(GSM, EDGE, 1xEV-DO, Service (E4406A only) modes)
(n=0)a for I/Q raw data
RFENvelope (n=2)a
UMASk (n=3)a
LMASk (n=4)a
yes
RHO - modulation quality
(cdmaOne, cdma2000, W-CDMA mode)
(n=0)a for I/Q raw data
EVM (n=2)a
MERRor (n=3)a
PERRor (n=4)a
(n=5)a for I/Q corrected trace data
yes
RHO - modulation quality
(1xEV-DO mode)
(n=0)a for I/Q raw data
(n=1)a for various summary results
EVM (n=2)a
MERRor (n=3)a
PERRor (n=4)a
(n=5)a for I/Q corrected trace data
yes
SEMask - spectrum emissions mask
(cdma2000, 1xEV-DO, W-CDMA mode)
SPECtrum (n=2)a
(n=0)a for I/Q raw data
yes
TSPur - transmit band spurs
(GSM, EDGE mode)
SPECtrum (n=2)a
ULIMit (n=3)a
(n=0)a for I/Q points
yes
Measurement Available Traces Markers Available?
Chapter 4 195

NADC Programming CommandsDISPlay Subsystem
NA
DC
Pro
gra
mm
ing
Co
mm
and
s
Waveform - Y-Axis Scale/Div
:DISPlay:WAVeform[n]:WINDow[m]:TRACe:Y[:SCALe]:PDIVision <power>
:DISPlay:WAVeform[n]:WINDow[m]:TRACe:Y[:SCALe]:PDIVision?
Sets the scale per division for the y-axis.
n, selects the view, the default is RF envelope.
n=1, m=1 RF envelope
n=2, m=1 I/Q Waveform
n=2, m=1 I and Q Waveform (Option B7C, E4406A only)
TXPower - transmit power
(GSM, EDGE mode)
RFENvelope (n=2)a
IQ (n=8)a
(n=0)a for I/Q points
yes
SPECtrum - (frequency domain)
(all modes)
RFENvelope (n=2)a for Service mode(E4406A only)
IQ (n=3)a
SPECtrum (n=4)a
ASPectrum (n=7)a
(n=0)a for I/Q raw data
yes
WAVEform - (time domain)
(all modes)
RFENvelope (n=2)a (also for Signal Envelope trace)
IQ (n=5)a
(n=0)a for I/Q raw data
yes
a. The n number indicates the sub-opcode that corresponds to this trace. Detailed descriptions of the trace data can be found in the MEASure subsystem documentation by looking up the sub-opcode for the appropriate measurement.
Measurement Available Traces Markers Available?
196 Chapter 4

NADC Programming CommandsDISPlay Subsystem
NA
DC
Pro
gram
min
g C
om
man
ds
n=4, m=1 I/Q Polar (Basic, W-CDMA, cdma2000)
n=5, m=1 Linear Envelope (Option B7C, E4406A only)
m, selects the window within the view. The default is 1.
Factory Preset: 10 dBm, for RF envelope
Range: .1 dB to 20 dB, for RF envelope
Default Unit: dBm, for RF envelope
Remarks: May affect input attenuator setting.
For E4406A to use this command, the appropriate mode should be selected with INSTrument:SELect.
For PSA you must be in Basic, cdmaOne, cdma2000, 1xEV-DO, W-CDMA GSM w/EDGE, NADC, or PDC mode. Set the mode with INSTrument:SELect.
Front PanelAccess: When in Waveform measurement:
AMPLITUDE Y Scale, Scale/Div.
History: For PSA:Added revision A.02.00
For E4406A:Modified revision A.05.00
Waveform - Y-Axis Reference Level
:DISPlay:WAVeform[n]:WINDow[m]:TRACe:Y[:SCALe]:RLEVel <power>
:DISPlay:WAVeform[n]:WINDow[m]:TRACe:Y[:SCALe]:RLEVel?
Sets the amplitude reference level for the y-axis.
n, selects the view, the default is RF envelope.
n=1, m=1 RF envelope
n=2, m=1 I/Q Waveform
n=2, m=1 I and Q Waveform (Option B7C, E4406A only)
n=4, m=1 I/Q Polar (Basic, W-CDMA, cdma2000)
n=5, m=1 Linear Envelope (Option B7C, E4406A only)
m, selects the window within the view. The default is 1.
Factory Preset: 0 dBm, for RF envelope
Range: −250 to 250 dBm, for RF envelope
Chapter 4 197
NADC Programming CommandsDISPlay Subsystem
NA
DC
Pro
gra
mm
ing
Co
mm
and
s
Default Unit: dBm, for RF envelope
Remarks: May affect input attenuator setting.
For E4406A to use this command, the appropriate mode should be selected with INSTrument:SELect.
For PSA you must be in Basic, cdmaOne, cdma2000, 1xEV-DO, W-CDMA GSM w/EDGE, NADC, or PDC mode. Set the mode with INSTrument:SELect.
Front PanelAccess: When in Waveform measurement:
AMPLITUDE Y Scale, Ref Level
History: For PSA:Added revision A.02.00
For E4406A:Modified revision A.05.00
198 Chapter 4

NADC Programming CommandsFETCh Subsystem
NA
DC
Pro
gram
min
g C
om
man
ds
FETCh SubsystemThe FETCh? queries are used with several other commands to control the measurement process. These commands are described in the section on the “MEASure Group of Commands” on page 209. These commands apply only to measurements found in the MEASURE menu.
This command puts selected data from the most recent measurement into the output buffer (new data is initiated/measured). Use FETCh if you have already made a good measurement and you want to look at several types of data (different [n] values) from the single measurement. FETCh saves you the time of re-making the measurement. You can only fetch results from the measurement that is currently active.
If you need to make a new measurement, use the READ command, which is equivalent to an INITiate[:IMMediate] followed by a FETCh.
:FETCh <meas>? will return valid data only when the measurement is in one of the following states:
idleinitiatedpaused
Fetch the Current Measurement Results
:FETCh:<measurement>[n]?
A FETCh? command must specify the desired measurement. It will return the valid results that are currently available, but will not initiate the taking of any new data. You can only fetch results from the measurement that is currently selected. The code number n selects the kind of results that will be returned. The available measurements and data results are described in the “MEASure Group of Commands” on page 209.
Chapter 4 199

NADC Programming CommandsFORMat Subsystem
NA
DC
Pro
gra
mm
ing
Co
mm
and
s
FORMat SubsystemThe FORMat subsystem sets a data format for transferring numeric and array information. For PSA the TRACe[:DATA] command is affected by FORMat subsystem commands.
Byte Order
:FORMat:BORDer NORMal|SWAPped
:FORMat:BORDer?
Selects the binary data byte order for numeric data transfer. In normal mode the most significant byte is sent first. In swapped mode the least significant byte is first. (PCs use the swapped order.) Binary data byte order functionality does not apply to ASCII.
Factory Preset: Normal
Remarks: You must be in the Basic, cdma2000, 1xEV-DO, W-CDMA, GSM (w/EDGE), NADC, or PDC mode to use this command. Use INSTrument:SELect to set the mode.
Numeric Data Format
PSA/VSA Basic, cdmaOne, cdma2000, 1xEV-DO, W-CDMA, GSM, EDGE, NADC, PDC modes:
:FORMat[:DATA] ASCii|REAL,32|REAL,64
:FORMat[:DATA]?
PSA Spectrum Analysis mode only:
:FORMat[:TRACe][:DATA] ASCii|INTeger,16|INTeger,32|REAL,32|REAL,64|UINTeger,16
:FORMat[:TRACe][:DATA]?
PSA Noise Figure mode only:
:FORMat[:TRACe][:DATA] ASCii|REAL[,32]
:FORMat[:TRACe][:DATA]?
VSA/PSA application modes: This command controls the format of data input/output, that is any data transfer across any remote port. The REAL and ASCII formats will format data in the current display units. The format of state data cannot be changed. It is always in a machine
200 Chapter 4

NADC Programming CommandsFORMat Subsystem
NA
DC
Pro
gram
min
g C
om
man
ds
readable format only.
ASCII - Amplitude values are in ASCII, in amplitude units, separated by commas. ASCII format requires more memory than the binary formats. Therefore, handling large amounts of this type of data, will take more time and storage space.
Integer,16 - Binary 16-bit integer values in internal units (dBm), in a definite length block. **PSA, SA mode only.
Integer,32 - Binary 32-bit integer values in internal units (dBm), in a definite length block.
Real,32 or Real,64 - Binary 32-bit (or 64-bit) real values in amplitude unit, in a definite length block. Transfers of real data are done in a binary block format.
UINTeger,16 - Binary 16-bit unsigned integer that is uncorrected ADC values, in a definite length block. This format is almost never applicable with current measurement data.
A definite length block of data starts with an ASCII header that begins with # and indicates how many additional data points are following in the block. Suppose the header is #512320.
• The first digit in the header (5) tells you how many additional digits/bytes there are in the header.
• The 12320 means 12 thousand, 3 hundred, 20 data bytes follow the header.
• Divide this number of bytes by your selected data format bytes/point, either 8 (for real 64), or 4 (for real 32). In this example, if you are using real 64 then there are 1540 points in the block.
Example: FORM REAL,64
Factory Preset: ASCII
Real,32 for Spectrum Analysis mode
ASCII for Basic, cdmaOne, cdma2000, 1xEV-DO, W-CDMA, GSM with EDGE, NADC, PDC modes
Remarks: The acceptable settings for this command change for the different modes as described above.
Chapter 4 201
NADC Programming CommandsINITiate Subsystem
NA
DC
Pro
gra
mm
ing
Co
mm
and
s
INITiate SubsystemThe INITiate subsystem is used to initiate a trigger for a measurement. They only initiate measurements from the MEASURE front panel key or the “MEASure Group of Commands” on page 209. Refer to the TRIGger and ABORt subsystems for related commands.
Take New Data Acquisition for Selected Measurement
:INITiate:<measurement>
For PSA this command is not available for measurements in the instrument modes: Spectrum Analysis, or Phase Noise.
This command initiates a trigger cycle for the measurement specified, but does not return data. The available measurement names are described in the MEASure subsystem..
If your selected measurement is not currently active it will change to the measurement in your INIT:<meas> command and initiate a trigger cycle.
Example: INIT:ACP
Continuous or Single Measurements
:INITiate:CONTinuous OFF|ON|0|1
:INITiate:CONTinuous?
Selects whether a trigger is continuously initiated or not. Each trigger initiates a single, complete, measurement operation.
When set to ON another trigger cycle is initiated at the completion of each measurement.
When set to OFF, the trigger system remains in the “idle” state until an INITiate[:IMMediate] command is received. On receiving the INITiate[:IMMediate] command, it will go through a single trigger/measurement cycle, and then return to the “idle” state.
Example: INIT:CONT ON
Factory Preset: On
*RST: Off (recommended for remote operation)
Front PanelAccess: Meas Control, Measure Cont Single
202 Chapter 4
NADC Programming CommandsINITiate Subsystem
NA
DC
Pro
gram
min
g C
om
man
ds
Take New Data Acquisitions
:INITiate[:IMMediate]
The instrument must be in the single measurement mode. If INIT:CONT is ON, then the command is ignored. The desired measurement must be selected and waiting. The command causes the system to exit the “waiting” state and go to the “initiated” state.
The trigger system is initiated and completes one full trigger cycle. It returns to the “waiting” state on completion of the trigger cycle. Depending upon the measurement and the number of averages, there may be multiple data acquisitions, with multiple trigger events, for one full trigger cycle.
This command triggers the instrument, if external triggering is the type of trigger event selected. Otherwise, the command is ignored. Use the TRIGer[:SEQuence]:SOURce EXT command to select the external trigger.
Example: INIT:IMM
Remarks: See also the *TRG command and the TRIGger subsystem.
Front PanelAccess: Meas Control, Measure Cont Single
Restart the Measurement
:INITiate:RESTart
This command applies to measurements found in the MEASURE menu. It restarts the current measurement from the “idle” state regardless of its current operating state. It is equivalent to:
INITiate[:IMMediate]
ABORt (for continuous measurement mode)
Example: INIT:REST
Front PanelAccess: Restart
or
Meas Control, Restart
Chapter 4 203

NADC Programming CommandsINSTrument Subsystem
NA
DC
Pro
gra
mm
ing
Co
mm
and
s
INSTrument SubsystemThis subsystem includes commands for querying and selecting instrument measurement (personality option) modes.
Catalog Query
For E4406A, :INSTrument:CATalog[:FULL]?
For PSA, :INSTrument:CATalog?
Returns a comma separated list of strings which contains the names of all the installed applications. These names can only be used with the INST:SELECT command.
For E4406A if the optional keyword FULL is specified, each name is immediately followed by its associated instrument number. These instrument numbers can only be used with the INST:NSELect command.
Example:(PSA) INST:CAT?
Query response: ”CDMA”4,”PNOISE”14
Example:(E4406A) INST:CAT:FULL?
Query response: ”BASIC”8,“GSM”3,”CDMA”4,”SERVICE”1
Select Application by Number
:INSTrument:NSELect <integer>
:INSTrument:NSELect?
Select the measurement mode by its instrument number. The actual available choices depends upon which applications are installed in the instrument. For E4406A these instrument numbers can be obtained with INST:CATalog:FULL?
1 = SA (PSA)1 = SERVICE (E4406)3 = GSM (E4406)4 = CDMA (cdmaOne) (E4406/PSA)5 = NADC (E4406/PSA)6 = PDC (E4406/PSA)8 = BASIC (E4406/PSA)9 = WCDMA (W-CDMA with HSDPA/HSUPA) (E4406/PSA)
204 Chapter 4

NADC Programming CommandsINSTrument Subsystem
NA
DC
Pro
gram
min
g C
om
man
ds
10 = CDMA2K (cdma2000 with 1xEV-DV) (E4406/PSA)11 = IDEN (E4406)12 = WIDEN (E4406)13 = EDGEGSM (E4406/PSA)14 = PNOISE (phase noise) (PSA)15 = CMDA1XEV (1xEV-D0) (E4406/PSA)18 = WLAN (PSA)211 = TDSCDMA (PSA)212 = TDDEMOD (PSA)219 = NFIGURE (noise figure) (PSA)231 = LINK (89600 VSA Link software)233 = MRECEIVE (PSA)239 = EMC (EMC Analyzer) (PSA)241 = DMODULATION (PSA)
Chapter 4 205

NADC Programming CommandsINSTrument Subsystem
NA
DC
Pro
gra
mm
ing
Co
mm
and
s
NOTE If you are using the SCPI status registers and the analyzer mode is changed, the status bits should be read, and any errors resolved, prior to switching modes. Error conditions that exist prior to switching modes cannot be detected using the condition registers after the mode change. This is true unless they recur after the mode change, although transitions of these conditions can be detected using the event registers.
Changing modes resets all SCPI status registers and mask registers to their power-on defaults. Hence, any event or condition register masks must be re-established after a mode change. Also note that the power up status bit is set by any mode change, since that is the default state after power up.
Example: INST:NSEL 5
Factory Preset: Persistent state with factory default of 1 (PSA)
Persistent state with factory default of 8 (E4406A, BASIC)
Range: 1 to x, where x depends upon which applications are installed.
Front PanelAccess: MODE
Select Application
VSA E4406A:
:INSTrument[:SELect] BASIC|SERVICE|CDMA|CDMA2K|GSM|EDGEGSM|IDEN|WIDEN|NADC|PDC|WCDMA|CDMA1XEV
PSA Series:
:INSTrument[:SELect] SA|PNOISE|BASIC|CDMA|CDMA2K|EDGEGSM|NADC|PDC|WCDMA|CDMA1XEV|NFIGURE|WLAN|TDSCDMA|TDDEMOD|MRECEIVE|EMC|DEMODULATION
:INSTrument[:SELect]?
Select the measurement mode. The actual available choices depend upon which modes (measurement applications) are installed in the instrument. A list of the valid choices is returned with the INST:CAT? query.
Once an instrument mode is selected, only the commands that are valid for that mode can be executed.
1 = SA (PSA)1 = SERVICE (E4406)
206 Chapter 4

NADC Programming CommandsINSTrument Subsystem
NA
DC
Pro
gram
min
g C
om
man
ds
3 = GSM (E4406)4 = CDMA (cdmaOne) (E4406/PSA)5 = NADC (E4406/PSA)6 = PDC (E4406/PSA)8 = BASIC (E4406/PSA)9 = WCDMA (W-CDMA with HSDPA/HSUPA) (E4406/PSA)10 = CDMA2K (cdma2000 with 1xEV-DV) (E4406/PSA)11 = IDEN (E4406)12 = WIDEN (E4406)13 = EDGEGSM (E4406/PSA)14 = PNOISE (phase noise) (PSA)15 = CMDA1XEV (1xEV-D0) (E4406/PSA)18 = WLAN (PSA)211 = TDSCDMA (PSA)212 = TDDEMOD (PSA)219 = NFIGURE (noise figure) (PSA)231 = LINK (89600 VSA Link software)233 = MRECEIVE (PSA)239 = EMC (EMC Analyzer) (PSA)241 = DMODULATION (PSA)
Chapter 4 207

NADC Programming CommandsINSTrument Subsystem
NA
DC
Pro
gra
mm
ing
Co
mm
and
s
NOTE If you are using the status bits and the analyzer mode is changed, the status bits should be read, and any errors resolved, prior to switching modes. Error conditions that exist prior to switching modes cannot be detected using the condition registers after the mode change. This is true unless they recur after the mode change, although transitions of these conditions can be detected using the event registers.
Changing modes resets all SCPI status registers and mask registers to their power-on defaults. Hence, any event or condition register masks must be re-established after a mode change. Also note that the power up status bit is set by any mode change, since that is the default state after power up.
Example: PSA Series instruments: INST:SEL NADC
Factory Preset:(PSA) Persistent state with factory default of Spectrum
Analyzer mode
Factory Preset:(E4406A) Persistent state with factory default of Basic mode.
Front PanelAccess: MODE
208 Chapter 4
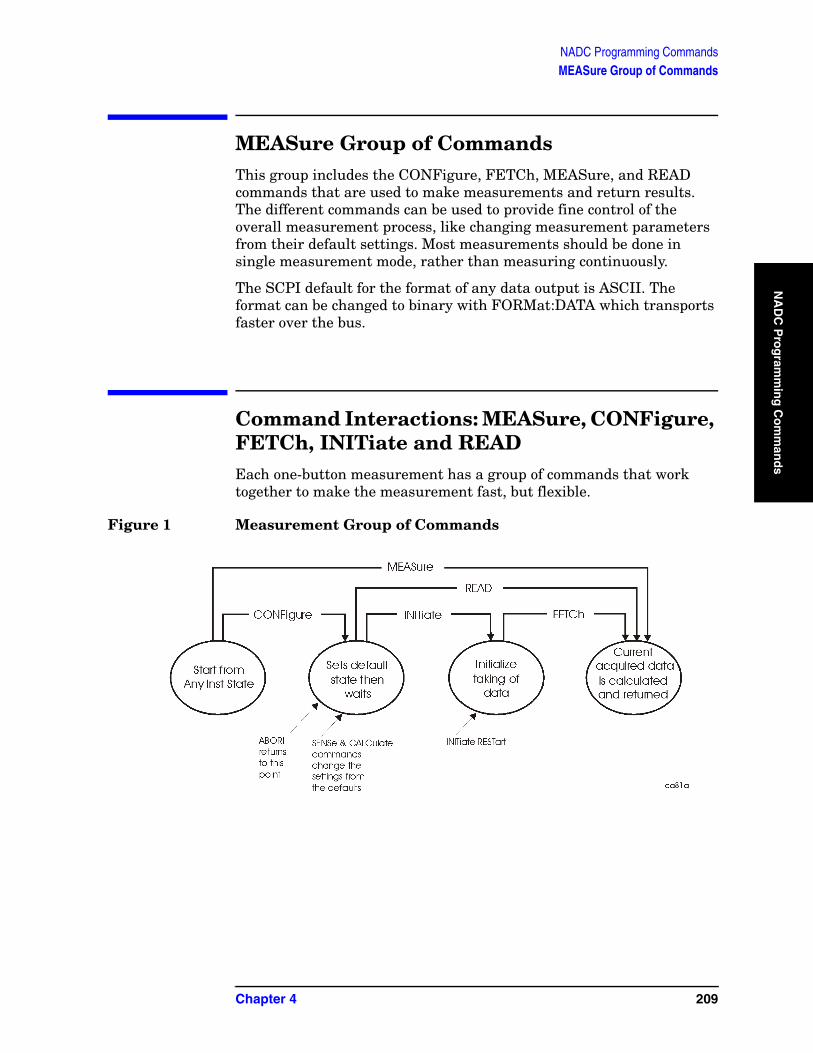
NADC Programming CommandsMEASure Group of Commands
NA
DC
Pro
gram
min
g C
om
man
ds
MEASure Group of CommandsThis group includes the CONFigure, FETCh, MEASure, and READ commands that are used to make measurements and return results. The different commands can be used to provide fine control of the overall measurement process, like changing measurement parameters from their default settings. Most measurements should be done in single measurement mode, rather than measuring continuously.
The SCPI default for the format of any data output is ASCII. The format can be changed to binary with FORMat:DATA which transports faster over the bus.
Command Interactions: MEASure, CONFigure, FETCh, INITiate and READEach one-button measurement has a group of commands that work together to make the measurement fast, but flexible.
Figure 1 Measurement Group of Commands
Chapter 4 209

NADC Programming CommandsMEASure Group of Commands
NA
DC
Pro
gra
mm
ing
Co
mm
and
s
Measure Commands:
:MEASure:<measurement>[n]?
This is a fast single-command way to make a measurement using the factory default instrument settings. These are the settings and units that conform to the Mode Setup settings (e.g. radio standard) that you have currently selected.
• Stops the current measurement (if any) and sets up the instrument for the specified measurement using the factory defaults
• Initiates the data acquisition for the measurement
• Blocks other SCPI communication, waiting until the measurement is complete before returning results.
• If the function does averaging, it is turned on and the number of averages is set to 10.
• After the data is valid it returns the scalar results, or the trace data, for the specified measurement. The type of data returned may be defined by an [n] value that is sent with the command.
The scalar measurement results will be returned if the optional [n] value is not included, or is set to 1. If the [n] value is set to a value other than 1, the selected trace data results will be returned. See each command for details of what types of scalar results or trace data results are available.
ASCII is the default format for the data output. Older versions of Spectrum Analysis and Phase Noise mode measurements only use ASCII.) The binary data formats should be used for handling large blocks of data since they are smaller and faster than the ASCII format. Refer to the FORMat:DATA command for more information.
If you need to change some of the measurement parameters from the factory default settings you can set up the measurement with the CONFigure command. Use the commands in the SENSe:<measurement> and CALCulate:<measurement> subsystems to change the settings. Then you can use the READ? command to initiate the measurement and query the results. See Figure 1.
If you need to repeatedly make a given measurement with settings other than the factory defaults, you can use the commands in the SENSe:<measurement> and CALCulate:<measurement> subsystems to set up the measurement. Then use the READ? command to initiate the measurement and query results.
Measurement settings persist if you initiate a different measurement and then return to a previous one. Use READ:<measurement>? if you want to use those persistent settings. If you want to go back to the default settings, use MEASure:<measurement>?.
210 Chapter 4
NADC Programming CommandsMEASure Group of Commands
NA
DC
Pro
gram
min
g C
om
man
ds
Configure Commands:
:CONFigure:<measurement>
This command stops the current measurement (if any) and sets up the instrument for the specified measurement using the factory default instrument settings. It sets the instrument to single measurement mode but should not initiate the taking of measurement data unless INIT:CONTinuous is ON. If you change any measurement settings after using the CONFigure command, the READ command can be used to initiate a measurement without changing the settings back to their defaults. In Spectrum Analysis mode the CONFigure command also turns the averaging function on and sets the number of averages to 10 for all measurements.
In instruments with firmware older then A.05.00 CONFigure initiates the taking of data. This data should be ignored. Other SCPI commands can be processed immediately after sending CONFigure. You do not need to wait for the CONF command to complete this initial 'false' data acquisition.
The CONFigure? query returns the current measurement name.
Fetch Commands:
:FETCh:<measurement>[n]?
This command puts selected data from the most recent measurement into the output buffer. Use FETCh if you have already made a good measurement and you want to return several types of data (different [n] values, e.g. both scalars and trace data) from a single measurement. FETCh saves you the time of re-making the measurement. You can only FETCh results from the measurement that is currently active, it will not change to a different measurement.
If you need to get new measurement data, use the READ command, which is equivalent to an INITiate followed by a FETCh.
The scalar measurement results will be returned if the optional [n] value is not included, or is set to 1. If the [n] value is set to a value other than 1, the selected trace data results will be returned. See each command for details of what types of scalar results or trace data results are available. The binary data formats should be used for handling large blocks of data since they are smaller and transfer faster then the ASCII format. (FORMat:DATA)
FETCh may be used to return results other than those specified with the original READ or MEASure command that you sent.
Chapter 4 211

NADC Programming CommandsMEASure Group of Commands
NA
DC
Pro
gra
mm
ing
Co
mm
and
s
INITiate Commands:
:INITiate:<measurement>
This command is not available for measurements in all the instrument modes:
• Initiates a trigger cycle for the specified measurement, but does not output any data. You must then use the FETCh<meas> command to return data. If a measurement other than the current one is specified, the instrument will switch to that measurement and then initiate it.
For example, suppose you have previously initiated the ACP measurement, but now you are running the channel power measurement. If you send INIT:ACP? it will change from channel power to ACP and will initiate an ACP measurement.
• Does not change any of the measurement settings. For example, if you have previously started the ACP measurement and you send INIT:ACP? it will initiate a new ACP measurement using the same instrument settings as the last time ACP was run.
• If your selected measurement is currently active (in the idle state) it triggers the measurement, assuming the trigger conditions are met. Then it completes one trigger cycle. Depending upon the measurement and the number of averages, there may be multiple data acquisitions, with multiple trigger events, for one full trigger cycle. It also holds off additional commands on GPIB until the acquisition is complete.
READ Commands:
:READ:<measurement>[n]?
• Does not preset the measurement to the factory default settings. For example, if you have previously initiated the ACP measurement and you send READ:ACP? it will initiate a new measurement using the same instrument settings.
• Initiates the measurement and puts valid data into the output buffer. If a measurement other than the current one is specified, the instrument will switch to that measurement before it initiates the measurement and returns results.
For example, suppose you have previously initiated the ACP measurement, but now you are running the channel power measurement. Then you send READ:ACP? It will change from channel power back to ACP and, using the previous ACP settings, will initiate the measurement and return results.
• Blocks other SCPI communication, waiting until the measurement is complete before returning the results
If the optional [n] value is not included, or is set to 1, the scalar measurement results will be returned. If the [n] value is set to a value other than 1, the selected trace data results will be returned. See each command for details of what types of scalar results or trace data results are available. The binary data formats should be used when handling large blocks of data since they are smaller and faster then the ASCII format. (FORMat:DATA)
212 Chapter 4

NADC Programming CommandsMEASure Group of Commands
NA
DC
Pro
gram
min
g C
om
man
ds
Current Measurement Query (Remote Command Only)
This command returns the name of the measurement that is currently running.
Remote Command:
:CONFigure?
Example: CONF?
Test Current Results Against all Limits (Remote Command Only)
Queries the status of the current measurement limit testing. It returns a 0 if the measured results pass when compared with the current limits. It returns a 1 if the measured results fail any limit tests.
Remote Command:
:CALCulate:CLIMits:FAIL?
Example: CALC:CLIM:FAIL?
Chapter 4 213

NADC Programming CommandsMEASure Group of Commands
NA
DC
Pro
gra
mm
ing
Co
mm
and
s
Adjacent Channel Power Ratio (ACP) Measurement
For E4406A this measures the total rms power in the specified channel and in 5 offset channels. You must be in Basic, cdmaOne, cdma2000, W-CDMA, iDEN, NADC or PDC mode to use these commands. Use INSTrument:SELect to set the mode.
For PSA this measures the total rms power in the specified channel and in 5 offset channels. You must be in cdmaOne, cdma2000, W-CDMA, NADC or PDC mode to use these commands. Use INSTrument:SELect to set the mode.
The general functionality of CONFigure, FETCh, MEASure, and READ are described at the beginning of this section. See the SENSe:ACP commands for more measurement related commands.
:CONFigure:ACP
:INITiate:ACP
:FETCh:ACP[n]?
:READ:ACP[n]?
:MEASure:ACP[n]?
For Basic mode, a channel frequency and power level can be defined in the command statement to override the default standard setting. A comma must precede the power value as a place holder for the frequency, when no frequency is sent.
History: E4406A:Added to Basic mode, version A.03.00 or later
Front PanelAccess: Measure, ACP or ACPR
After the measurement is selected, press Restore Meas Defaults to restore factory defaults.
Measurement Results Available
Measurement Type
n Results Returned
0 Returns unprocessed I/Q trace data, as a series of trace point values, in volts. The I values are listed first in each pair, using the 0 through even-indexed values. The Q values are the odd-indexed values.
214 Chapter 4

NADC Programming CommandsMEASure Group of Commands
NA
DC
Pro
gram
min
g C
om
man
ds
n=1 (or not specified)
NADC and PDC mode
Returns 22 scalar results, in the following order:
1. Center frequency – absolute power (dBm)2. Center frequency – absolute power (W)3. Negative offset frequency (1) – relative power (dB)4. Negative offset frequency (1) – absolute power (dBm)5. Positive offset frequency (1) – relative power (dB)6. Positive offset frequency (1) – absolute power (dBm)
. . .
1. Positive offset frequency (5) – relative power (dB)2. Positive offset frequency (5) – absolute power (dBm)
n=1 (or not specified)
iDEN modeE4406A
Returns 13 scalar results, in the following order:
1. Center frequency – relative power (dB)2. Center frequency – absolute power (dBm)3. Lower offset frequency – relative power (dB)4. Lower offset freq– absolute power (dBm)5. Upper offset frequency – relative power (dB)6. Upper offset frequency – absolute power (dBm)7. Total power (dBm)8. Offset frequency (Hz)9. Reference BW (Hz)10.Offset BW (Hz)11. Carrier/center frequency (Hz)12.Frequency span (Hz)13.Average count
Total power reference
n=1 (or not specified)
Basic, cdmaOne, cdma2000, W-CDMA mode
Returns 24 scalar results, in the following order:
1. Center frequency - relative power (dB)2. Center frequency - absolute power (dBm)3. Center frequency - relative power (dB) (same as value 1)4. Center frequency - absolute power (dBm) (same as value 2)5. Negative offset frequency (1) - relative power (dB),6. Negative offset frequency (1) - absolute power (dBm)7. Positive offset frequency (1) - relative power (dB)8. Positive offset frequency (1) - absolute power (dBm)
. . .
1. Positive offset frequency (5) - relative power (dB)2. Positive offset frequency (5) - absolute power (dBm)
NOTE Center frequency relative power is relative to the center frequency absolute power and therefore, is always equal to 0.00 dB.
Measurement Type
n Results Returned
Chapter 4 215

NADC Programming CommandsMEASure Group of Commands
NA
DC
Pro
gra
mm
ing
Co
mm
and
s
Power spectral density reference
n=1 (or not specified)
Basic, cdmaOne, cdma2000, W-CDMA mode
Returns 24 scalar results, in the following order:
1. Center frequency - relative power (dB)2. Center frequency - absolute power (dBm/Hz)3. Center frequency - relative power (dB) (same as value 1)4. Center frequency - absolute power (dBm/Hz) (same as value
2)5. Negative offset frequency (1) - relative power (dB)6. Negative offset frequency (1) - absolute power (dBm/Hz)7. Positive offset frequency (1) - relative power (dB)8. Positive offset frequency (1) - absolute power (dBm/Hz)
. . .
1. Positive offset frequency (5) - relative power (dB)2. Positive offset frequency (5) - absolute power (dBm/Hz)
NOTE Center frequency relative power is relative to the center frequency absolute power and therefore, is always equal to 0.00 dB.
2
NADC and PDC mode
Returns 10 scalar values of the pass/fail (0=passed, or 1=failed) results determined by testing the absolute power of the offset frequencies:
1. Negative offset frequency (1) absolute power2. Positive offset frequency (1) absolute power
. . .
1. Negative offset frequency (5) absolute power2. Positive offset frequency (5) absolute power
2
iDEN mode
Returns 3 scalar values of the histogram absolute power trace:
1. Lower offset frequency − absolute power2. Reference frequency − absolute power3. Upper offset frequency − absolute power
Measurement Type
n Results Returned
216 Chapter 4

NADC Programming CommandsMEASure Group of Commands
NA
DC
Pro
gram
min
g C
om
man
ds
Total power reference
2
Basic, cdmaOne, cdma2000, W-CDMA mode
Returns 11 scalar values (in dBm) corresponding to the total power histogram display. The values are returned in ascending frequency order:
1. Negative offset frequency (5)2. Negative offset frequency (4)3. Negative offset frequency (3)
. . .
1. Center frequency2. Positive offset frequency (1)3. Positive offset frequency (2)
. . .
1. Positive offset frequency (5)
3
NADC and PDC mode
Returns 10 scalar values of the pass/fail (0=passed, or 1=failed) results determined by testing the relative power of the offset frequencies:
1. Negative offset frequency (1) relative power2. Positive offset frequency (1) relative power
. . .
1. Negative offset frequency (5) relative power2. Positive offset frequency (5) relative power
3
iDEN modeE4406A
Returns 3 scalar values of the histogram relative power trace:
1. Lower offset frequency − relative power2. Reference frequency − relative power3. Upper offset frequency − relative power
Power spectral density reference
3
Basic, cdmaOne, cdma2000, W-CDMA mode
Returns 11 scalar values (in dBm/Hz) corresponding to the power spectral density histogram display. The values are returned in ascending frequency order:
1. Negative offset frequency (5)2. Negative offset frequency (4)
. . .
1. Center frequency2. Positive offset frequency (1)
. . .
1. Positive offset frequency (5)
Measurement Type
n Results Returned
Chapter 4 217

NADC Programming CommandsMEASure Group of Commands
NA
DC
Pro
gra
mm
ing
Co
mm
and
s
4
NADC and PDC mode
Returns the frequency-domain spectrum trace (data array) for the entire frequency range being measured.
In order to return spectrum data, the ACP display must be in the spectrum view and you must not turn off the spectrum trace.
4
iDEN modeE4406A
Returns 4 absolute power values for the reference and offset channels.
1. Reference channel − absolute power2. Reference channel − absolute power (duplicate of above)3. Lower offset channel − absolute power4. Upper offset channel − absolute power
(For cdma2000 and W-CDMA the data is only available with spectrum display selected)
4
Basic, cdmaOne, cdma2000, W-CDMA mode
Returns the frequency-domain spectrum trace data for the entire frequency range being measured.
With the spectrum view selected (DISPlay:ACP:VIEW SPECtrum) and the spectrum trace on (SENSe:ACP:SPECtrum:ENABle):
• In FFT mode (SENSe:ACP:SWEep:TYPE FFT) the number of trace points returned are 343 (cdma2000) or 1715 (W-CDMA). This is with the default span of 5 MHz (cdma2000) or 25 MHz (W-CDMA). The number of points also varies if another offset frequency is set.
• In sweep mode (SENSe:ACP:SWEep:TYPE SWEep), the number of trace points returned is 601 (for cdma2000 or W-CDMA) for any span.
With bar graph display selected, one point of –999.0 will be returned.
5
iDEN modeE4406A
Returns 4 relative power values for the reference and offset channels:
1. Reference channel − relative power2. Reference channel − relative power (duplicate of above)3. Lower offset channel − relative power4. Upper offset channel − relative power
Total power reference
5
Basic, cdmaOne, cdma2000, W-CDMA mode
Returns 12 scalar values (in dBm) of the absolute power of the center and the offset frequencies:
1. Upper adjacent chan center frequency2. Lower adjacent chan center frequency3. Negative offset frequency (1)4. Positive offset frequency (1)
. . .
1. Negative offset frequency (5)2. Positive offset frequency (5)
Measurement Type
n Results Returned
218 Chapter 4

NADC Programming CommandsMEASure Group of Commands
NA
DC
Pro
gram
min
g C
om
man
ds
Power spectral density reference
5
Basic, cdmaOne, cdma2000, W-CDMA mode
Returns 12 scalar values (in dBm/Hz) of the absolute power of the center and the offset frequencies:
1. Upper adjacent chan center frequency2. Lower adjacent chan center frequency3. Negative offset frequency (1)4. Positive offset frequency (1)
. . .
1. Negative offset frequency (5)2. Positive offset frequency (5)
6
iDEN modeE4406A
Returns 4 pass/fail test results for the absolute power of the reference and offset channels:
1. Reference channel absolute power pass/fail2. Reference channel absolute power pass/fail (duplicate of
above)3. Lower offset channel absolute power pass/fail4. Upper offset channel absolute power pass/fail
Total power reference
6
Basic, cdmaOne, cdma2000, W-CDMA mode
Returns 12 scalar values (total power in dB) of the power relative to the carrier at the center and the offset frequencies:
1. Upper adjacent chan center frequency2. Lower adjacent chan center frequency3. Negative offset frequency (1)4. Positive offset frequency (1)5. Negative offset frequency (5)
. . .
1. Negative offset frequency (5)2. Positive offset frequency (5)
Power spectral density reference
6
Basic, cdmaOne, cdma2000, W-CDMA mode
Returns 12 scalar values (power spectral density in dB) of the power relative to the carrier at the center and offset frequencies:
1. Upper adjacent chan center frequency2. Lower adjacent chan center frequency3. Negative offset frequency (1)4. Positive offset frequency (1)
. . .
1. Negative offset frequency (5)2. Positive offset frequency (5)
Measurement Type
n Results Returned
Chapter 4 219
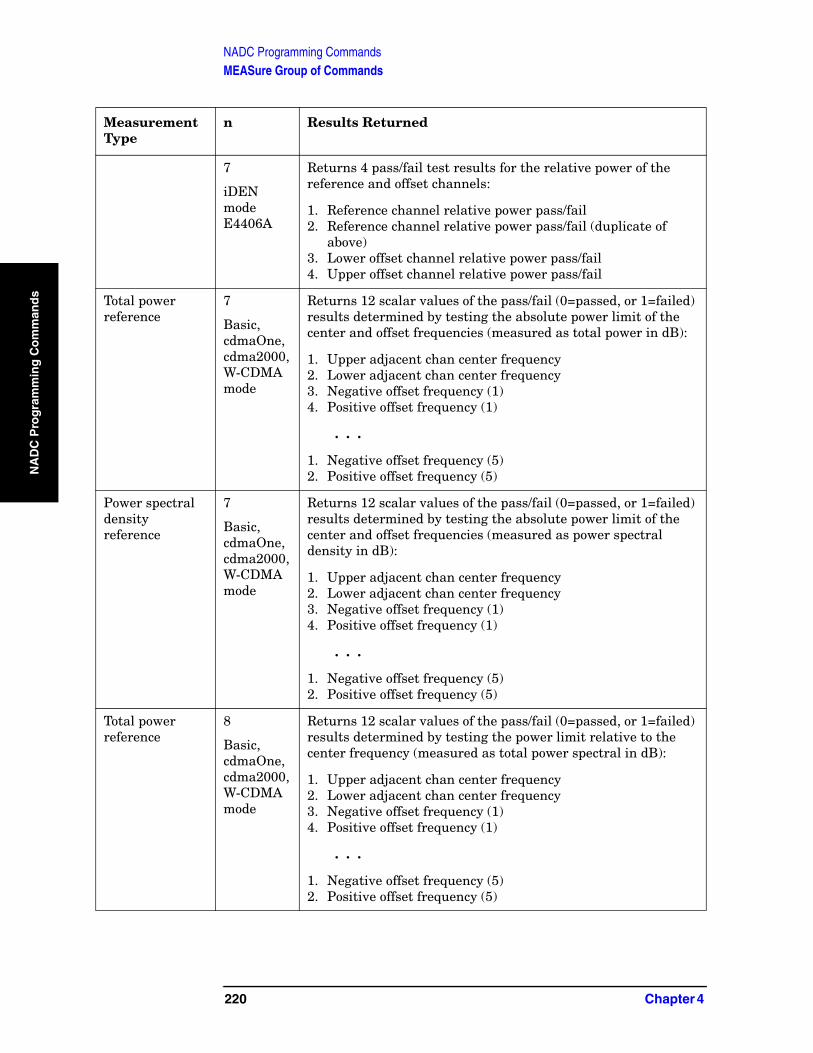
NADC Programming CommandsMEASure Group of Commands
NA
DC
Pro
gra
mm
ing
Co
mm
and
s
7
iDEN modeE4406A
Returns 4 pass/fail test results for the relative power of the reference and offset channels:
1. Reference channel relative power pass/fail2. Reference channel relative power pass/fail (duplicate of
above)3. Lower offset channel relative power pass/fail4. Upper offset channel relative power pass/fail
Total power reference
7
Basic, cdmaOne, cdma2000, W-CDMA mode
Returns 12 scalar values of the pass/fail (0=passed, or 1=failed) results determined by testing the absolute power limit of the center and offset frequencies (measured as total power in dB):
1. Upper adjacent chan center frequency2. Lower adjacent chan center frequency3. Negative offset frequency (1)4. Positive offset frequency (1)
. . .
1. Negative offset frequency (5)2. Positive offset frequency (5)
Power spectral density reference
7
Basic, cdmaOne, cdma2000, W-CDMA mode
Returns 12 scalar values of the pass/fail (0=passed, or 1=failed) results determined by testing the absolute power limit of the center and offset frequencies (measured as power spectral density in dB):
1. Upper adjacent chan center frequency2. Lower adjacent chan center frequency3. Negative offset frequency (1)4. Positive offset frequency (1)
. . .
1. Negative offset frequency (5)2. Positive offset frequency (5)
Total power reference
8
Basic, cdmaOne, cdma2000, W-CDMA mode
Returns 12 scalar values of the pass/fail (0=passed, or 1=failed) results determined by testing the power limit relative to the center frequency (measured as total power spectral in dB):
1. Upper adjacent chan center frequency2. Lower adjacent chan center frequency3. Negative offset frequency (1)4. Positive offset frequency (1)
. . .
1. Negative offset frequency (5)2. Positive offset frequency (5)
Measurement Type
n Results Returned
220 Chapter 4

NADC Programming CommandsMEASure Group of Commands
NA
DC
Pro
gram
min
g C
om
man
ds
Power spectral density reference
8
Basic, cdmaOne, cdma2000, W-CDMA mode
Returns 12 scalar values of the pass/fail (0=passed, or 1=failed) results determined by testing the power limit relative to the center frequency (measured as power spectral density in dB):
1. Upper adjacent chan center frequency2. Lower adjacent chan center frequency3. Negative offset frequency (1)4. Positive offset frequency (1)
. . .
1. Negative offset frequency (5)2. Positive offset frequency (5)
Measurement Type
n Results Returned
Chapter 4 221

NADC Programming CommandsMEASure Group of Commands
NA
DC
Pro
gra
mm
ing
Co
mm
and
s
Error Vector Magnitude Measurement
This measures the vector error of the magnitude of each symbol. You must be in the NADC or PDC mode to use these commands. Use INSTrument:SELect to set the mode.
The general functionality of CONFigure, FETCh, MEASure, and READ are described at the beginning of this section. See the SENSe:EVM commands for more measurement related commands.
:CONFigure:EVM
:INITiate:EVM
:FETCh:EVM[n]?
:READ:EVM[n]?
:MEASure:EVM[n]?
History: Version A.02.00 or later
Front PanelAccess: Measure, EVM
After the measurement is selected, press Restore Meas Defaults to restore factory defaults.
Measurement Results Available
n Results Returned
0 Returns unprocessed I/Q trace data, as a data array of trace point values, in volts.
222 Chapter 4
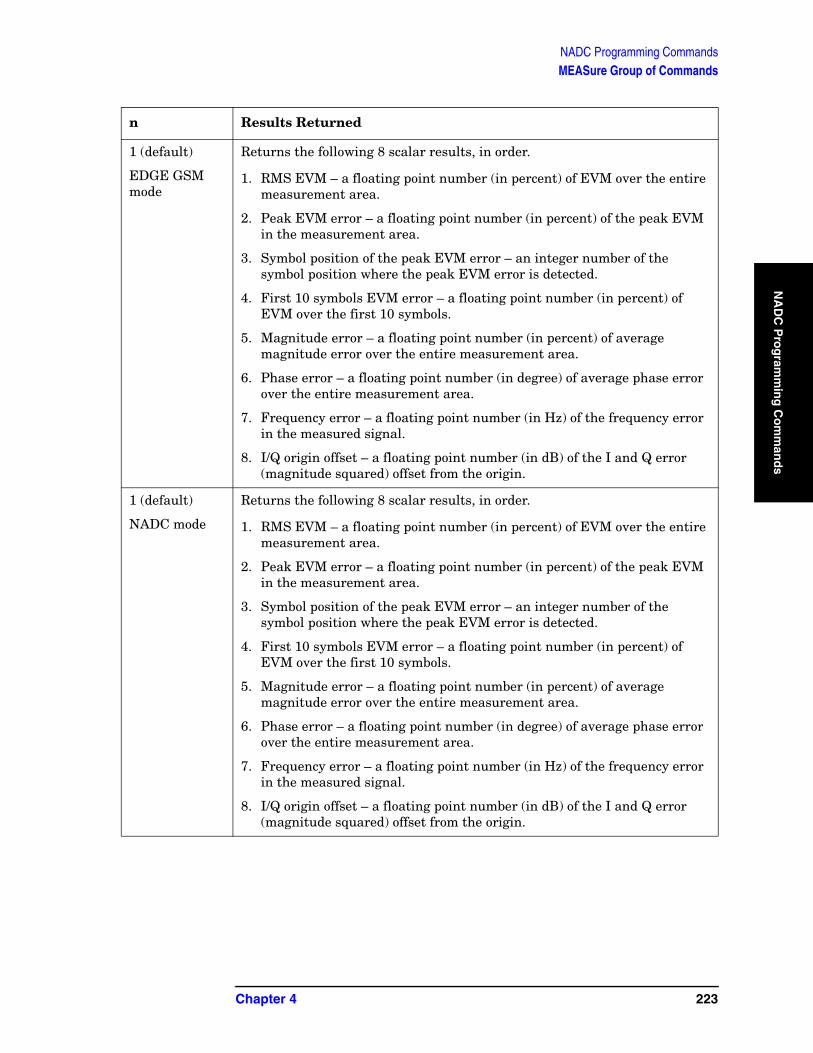
NADC Programming CommandsMEASure Group of Commands
NA
DC
Pro
gram
min
g C
om
man
ds
1 (default)
EDGE GSM mode
Returns the following 8 scalar results, in order.
1. RMS EVM – a floating point number (in percent) of EVM over the entire measurement area.
2. Peak EVM error – a floating point number (in percent) of the peak EVM in the measurement area.
3. Symbol position of the peak EVM error – an integer number of the symbol position where the peak EVM error is detected.
4. First 10 symbols EVM error – a floating point number (in percent) of EVM over the first 10 symbols.
5. Magnitude error – a floating point number (in percent) of average magnitude error over the entire measurement area.
6. Phase error – a floating point number (in degree) of average phase error over the entire measurement area.
7. Frequency error – a floating point number (in Hz) of the frequency error in the measured signal.
8. I/Q origin offset – a floating point number (in dB) of the I and Q error (magnitude squared) offset from the origin.
1 (default)
NADC mode
Returns the following 8 scalar results, in order.
1. RMS EVM – a floating point number (in percent) of EVM over the entire measurement area.
2. Peak EVM error – a floating point number (in percent) of the peak EVM in the measurement area.
3. Symbol position of the peak EVM error – an integer number of the symbol position where the peak EVM error is detected.
4. First 10 symbols EVM error – a floating point number (in percent) of EVM over the first 10 symbols.
5. Magnitude error – a floating point number (in percent) of average magnitude error over the entire measurement area.
6. Phase error – a floating point number (in degree) of average phase error over the entire measurement area.
7. Frequency error – a floating point number (in Hz) of the frequency error in the measured signal.
8. I/Q origin offset – a floating point number (in dB) of the I and Q error (magnitude squared) offset from the origin.
n Results Returned
Chapter 4 223

NADC Programming CommandsMEASure Group of Commands
NA
DC
Pro
gra
mm
ing
Co
mm
and
s
1 (default)
PDC mode
Returns the following 7 scalar results, in order.
1. RMS EVM – a floating point number (in percent) of EVM over the entire measurement area.
2. Peak EVM error – a floating point number (in percent) of peak EVM in the measurement area.
3. Symbol position of the peak EVM error – an integer number of the symbol position where the peak EVM error is detected.
4. Magnitude error – a floating point number (in percent) of average magnitude error over the entire measurement area.
5. Phase error – a floating point number (in degree) of average phase error over the entire measurement area.
6. Frequency error – a floating point number (in Hz) of the frequency error in the measured signal.
7. I/Q origin offset – a floating point number (in dB) of the I and Q error (magnitude squared) offset from the origin.
2 Returns series of floating point numbers (in percent) that represent each sample in the EVM trace. The first number is the symbol 0 decision point and there are 5 points per symbol. Therefore, the decision points are at 0, 5, 10, 15. . . .
3 Returns series of floating point numbers (in percent) that represent each sample in the magnitude error trace. The first number is the symbol 0 decision point and there are 5 points per symbol. Therefore, the decision points are at 0, 5, 10, 15. . . .
4 Returns series of floating point numbers (in degree) that represent each sample in the phase error trace. The first number is the symbol 0 decision point and there are 5 points per symbol. Therefore, the decision points are at 0, 5, 10, 15 . . .
5 Returns series of floating point numbers that alternately represent I and Q pairs of the corrected measured trace. The magnitude of each I and Q pair are normalized to 1.0. The first number is the in-phase (I) sample of symbol 0 decision point and the second is the quadrature-phase (Q) sample of symbol 0 decision point. As in the EVM, there are 5 points per symbol, so the series of numbers is:
1st number = I of the symbol 0 decision point2nd number = Q of the symbol 0 decision point
. . .(2 × 5) + 1 (or 11th) number = I of the symbol 1 decision point(2 × 5) + 2 (or 12th) number = Q of the symbol 1 decision point
. . .(2 × 5) × N + 1 number = I of the symbol N decision point(2 × 5) × N + 2 number = Q of the symbol N decision point
n Results Returned
224 Chapter 4

NADC Programming CommandsMEASure Group of Commands
NA
DC
Pro
gram
min
g C
om
man
ds
6
NADC mode
Returns the following 4 scalar values of 1 or 0, in the order given. The pass/fail results (0=passed, or 1=failed) are determined by testing the EVM, peak EVM, first 10 symbols EVM and IQ origin offsets.
Test result of EVMTest result of peak EVMTest result of first 10 symbols EVMTest result of IQ origin offset
6
PDC mode
Returns the following 3 scalar values of 1 or 0, in the order given. The pass/fail results (0=passed, or 1=failed) are determined by testing the EVM, peak EVM, and IQ origin offsets.
Test result of EVMTest result of peak EVMTest result of IQ origin offset
0 Modulation Analysis Mode
Returns processed raw, unprocessed I/Q trace data, as a data array of trace point values, in volts. The I values are listed first in each pair, using the 0 through even-indexed values. The Q values are the odd-indexed values.
n Results Returned
Chapter 4 225

NADC Programming CommandsMEASure Group of Commands
NA
DC
Pro
gra
mm
ing
Co
mm
and
s
not specifiedor n=1 Modulation Analysis Mode
Returns 26 comma separated floating point numbers in the following order:
1. EVM (rms) Avg has units of percent. The calculation is based on the composite of the phase error and magnitude error, between the measured signal and the ideal signal. If averaging is on, this is the average of the individual rms measurements.
2. EVM (rms) Max has units of percent. The calculation is based on the composite of the phase error and magnitude error, between the measured signal and the ideal signal. This is the maximum of the individual rms measurements.
3. EVM (peak) Avg has units of percent. The calculation is based on the composite of the phase error and magnitude error, between the measured signal and the ideal signal. If averaging is on, this is the average of the individual peak measurements.
4. Symbol position of the EVM (peak) Avg error – an integer number of the symbol position where the last averaged peak EVM error is detected.
5. EVM (peak) Max has units of percent. The calculation is based on the composite of the phase error and magnitude error, between the measured signal and the ideal signal. If averaging is on, this is the maximum of the individual peak measurements.
6. Symbol position of the EVM (peak) Max error – an integer number of the symbol position where the maximum peak EVM error is detected.
7. Magnitude Error rms Avg (with units of percent) is the rms error between the measured (compensated) magnitude and the ideal magnitude. If averaging is on, this is the average of the individual rms measurements.
8. Magnitude Error rms Max (with units of percent) is the rms error between the measured (compensated) magnitude and the ideal magnitude. This is the maximum of the individual rms measurements.
9. Magnitude Error (peak) Average (with units of percent) is the peak error between the measured (compensated) magnitude and the ideal magnitude. If averaging is on, this is the average of the individual peak measurements.
10.Symbol position of the Magnitude Error (peak) Avg – an integer number representing the symbol position where the last averaged peak magnitude error was detected.
11. Magnitude Error (peak) Max (with units of percent) is the peak error between the measured (compensated) magnitude and the ideal magnitude. This is the maximum of the individual peak measurements.
n Results Returned
226 Chapter 4

NADC Programming CommandsMEASure Group of Commands
NA
DC
Pro
gram
min
g C
om
man
ds
Not specified orn = 1
12.Symbol position of the Magnitude Error (peak) Max – an integer number representing the symbol position where the maximum peak magnitude error was detected.
13.Phase Error (rms) Average (with units in degrees) is the rms error between the measured (compensated) phase and the ideal phase. If averaging is on, this is the average of the individual rms measurements.
14.Phase Error (rms) Max (with units in degrees) is the rms error between the measured (compensated) phase and the ideal phase. This is the maximum of the individual rms measurements.
15.Phase Error Average Peak (with units in degrees) is the peak error between the measured (compensated) phase and the ideal phase. If averaging is on, this is the average of the individual peak measurements.
16.Symbol position of the Phase Error (peak) Avg – an integer number representing the symbol position where the last averaged peak Phase error was detected.
17.Phase Error (peak) Max (with units in degrees) is the peak phase error between the measured phase and the ideal phase. This is the maximum of the individual peak measurements.
18.Symbol position of the Phase Error (peak) Max – an integer number representing the symbol position where the maximum peak Phase error was detected.
19.Frequency Error Avg of the measured signal, has units of Hz. This is based on the linear best fit of the uncorrected measured phase. If averaging is on, this is the average of the individual frequency error measurements.
20.Frequency Error Max of the measured signal, has units of Hz. This is based on the linear best fit of the uncorrected measured phase. This is the maximum of the individual frequency error measurements.
21. I/Q Offset Avg (with units of dB) is the dc error offset of I/Q, from the origin. If averaging is on, this is the average of the individual carrier feed-through measurements.
22. I/Q Offset Max (with units of dB) is the dc error offset of I/Q, from the origin. This is the maximum of the individual carrier feed-through measurements.
23.Amplitude Droop Error Avg has units dB/symbol. This is the linear best fit of the amplitude slope of the measured signal. If averaging is on, this is the average of the individual measurements.
24.Amplitude Droop Error Max has units dB/symbol. This is the linear best fit of the amplitude slope of the measured signal. This is the maximum of the individual measurements.
25.Trace Time Sample is a floating point number (in seconds) of the time between samples for the Corrected I/Q trace. This is the time between I/Q pairs.
n Results Returned
Chapter 4 227

NADC Programming CommandsMEASure Group of Commands
NA
DC
Pro
gra
mm
ing
Co
mm
and
s
Not specified or N=1
26.Corrected I/Q Vector Trace Length is an integer (in number of samples) representing the number of samples returned by the Corrected I/Q Trace. In other words, this number divided by 2 represents the number of sample pairs in the trace.
2 EVM Trace - Returns a trace of the error vector magnitude (EVM), as trace point values in percent. The first value is the symbol 0 decision point. The trace is interpolated for the currently selected points/symbol displayed on the front panel. The number of trace points depends on the current measurement interval setting. For GSM, one NAN will be returned as this is an unsupported trace.
3 Mag Error Trace - Returns a trace of the magnitude error, as trace point values in percent. The first value is the symbol 0 decision point. The trace is interpolated for the currently selected points/symbol displayed on the front panel. The number of trace points depends on the current measurement interval setting. For GSM, one NAN will be returned as this is an unsupported trace.
4 Phase Error Trace - Returns a trace of the phase error, as trace point values in percent. The first value is the symbol 0 decision point. The trace is interpolated for the currently selected points/symbol displayed on the front panel. The number of trace points depends on the current measurement interval setting.
5 Measured Polar Vector IQ trace - Returns a trace of the IQ measured polar vector IQ complex data array, as trace point values in dB. The first value is the symbol 0 (I component) decision point. The second value is the symbol O (Q component) decision point, and so on. The trace is interpolated for the currently selected points/symbol displayed on the front panel. The number of trace points depends on the current measurement interval setting.
n Results Returned
228 Chapter 4
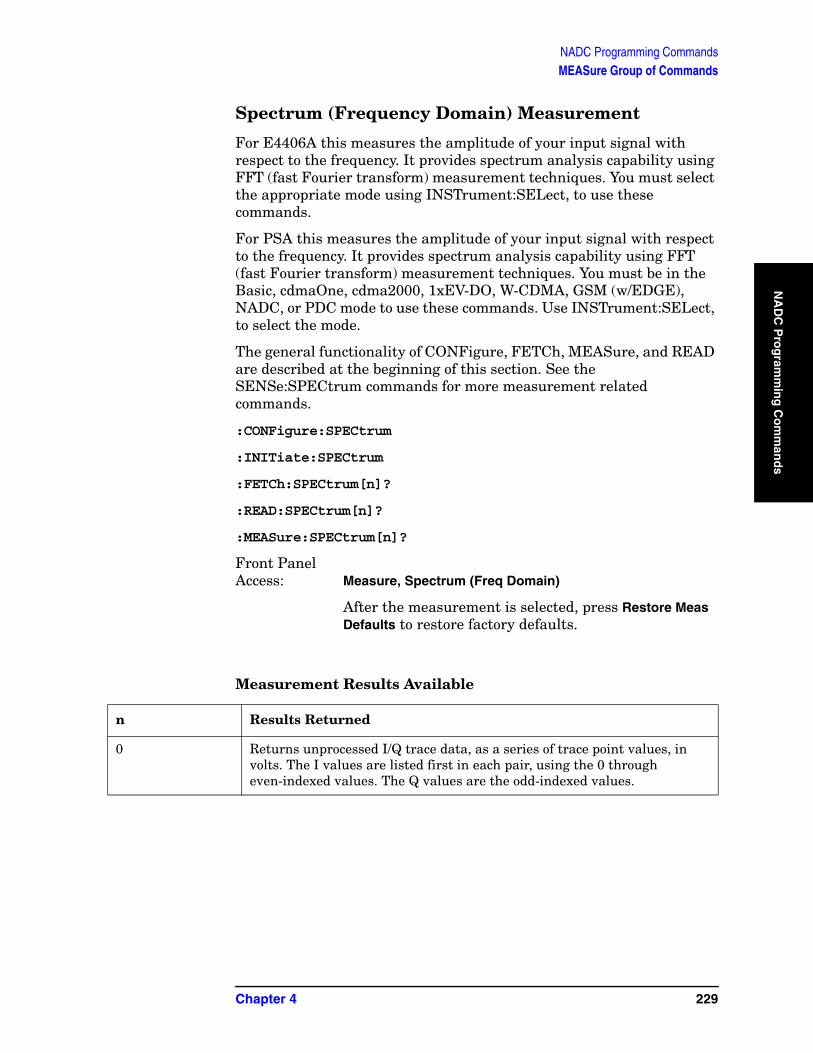
NADC Programming CommandsMEASure Group of Commands
NA
DC
Pro
gram
min
g C
om
man
ds
Spectrum (Frequency Domain) Measurement
For E4406A this measures the amplitude of your input signal with respect to the frequency. It provides spectrum analysis capability using FFT (fast Fourier transform) measurement techniques. You must select the appropriate mode using INSTrument:SELect, to use these commands.
For PSA this measures the amplitude of your input signal with respect to the frequency. It provides spectrum analysis capability using FFT (fast Fourier transform) measurement techniques. You must be in the Basic, cdmaOne, cdma2000, 1xEV-DO, W-CDMA, GSM (w/EDGE), NADC, or PDC mode to use these commands. Use INSTrument:SELect, to select the mode.
The general functionality of CONFigure, FETCh, MEASure, and READ are described at the beginning of this section. See the SENSe:SPECtrum commands for more measurement related commands.
:CONFigure:SPECtrum
:INITiate:SPECtrum
:FETCh:SPECtrum[n]?
:READ:SPECtrum[n]?
:MEASure:SPECtrum[n]?
Front PanelAccess: Measure, Spectrum (Freq Domain)
After the measurement is selected, press Restore Meas Defaults to restore factory defaults.
Measurement Results Available
n Results Returned
0 Returns unprocessed I/Q trace data, as a series of trace point values, in volts. The I values are listed first in each pair, using the 0 through even-indexed values. The Q values are the odd-indexed values.
Chapter 4 229
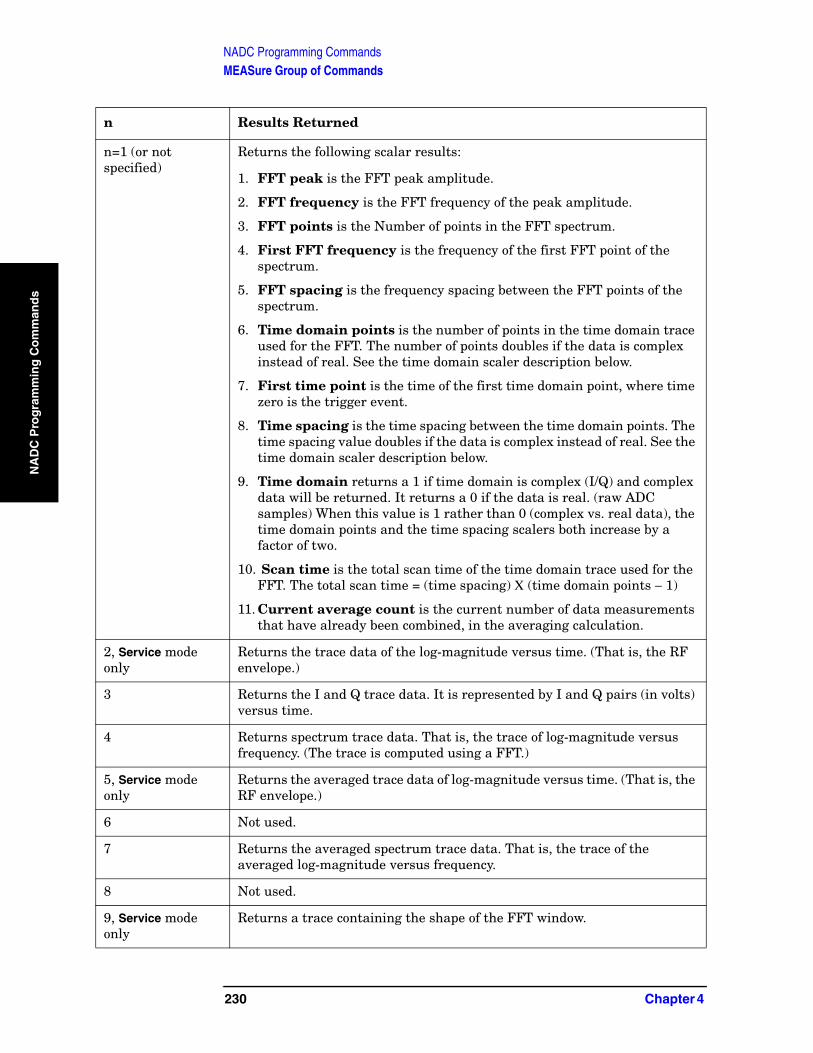
NADC Programming CommandsMEASure Group of Commands
NA
DC
Pro
gra
mm
ing
Co
mm
and
s
n=1 (or not specified)
Returns the following scalar results:
1. FFT peak is the FFT peak amplitude.
2. FFT frequency is the FFT frequency of the peak amplitude.
3. FFT points is the Number of points in the FFT spectrum.
4. First FFT frequency is the frequency of the first FFT point of the spectrum.
5. FFT spacing is the frequency spacing between the FFT points of the spectrum.
6. Time domain points is the number of points in the time domain trace used for the FFT. The number of points doubles if the data is complex instead of real. See the time domain scaler description below.
7. First time point is the time of the first time domain point, where time zero is the trigger event.
8. Time spacing is the time spacing between the time domain points. The time spacing value doubles if the data is complex instead of real. See the time domain scaler description below.
9. Time domain returns a 1 if time domain is complex (I/Q) and complex data will be returned. It returns a 0 if the data is real. (raw ADC samples) When this value is 1 rather than 0 (complex vs. real data), the time domain points and the time spacing scalers both increase by a factor of two.
10. Scan time is the total scan time of the time domain trace used for the FFT. The total scan time = (time spacing) Χ (time domain points − 1)
11. Current average count is the current number of data measurements that have already been combined, in the averaging calculation.
2, Service mode only
Returns the trace data of the log-magnitude versus time. (That is, the RF envelope.)
3 Returns the I and Q trace data. It is represented by I and Q pairs (in volts) versus time.
4 Returns spectrum trace data. That is, the trace of log-magnitude versus frequency. (The trace is computed using a FFT.)
5, Service mode only
Returns the averaged trace data of log-magnitude versus time. (That is, the RF envelope.)
6 Not used.
7 Returns the averaged spectrum trace data. That is, the trace of the averaged log-magnitude versus frequency.
8 Not used.
9, Service mode only
Returns a trace containing the shape of the FFT window.
n Results Returned
230 Chapter 4

NADC Programming CommandsMEASure Group of Commands
NA
DC
Pro
gram
min
g C
om
man
ds
10, Service mode only
Returns trace data of the phase of the FFT versus frequency.
11, cdma2000, 1xEV-DO, W-CDMA, Basic modes only
Returns linear spectrum trace data values in Volts RMS.
12, cdma2000, 1xEV-DO, W-CDMA, Basic modes only
Returns averaged linear spectrum trace data values in Volts RMS.
n Results Returned
Chapter 4 231

NADC Programming CommandsMEASure Group of Commands
NA
DC
Pro
gra
mm
ing
Co
mm
and
s
Waveform (Time Domain) Measurement
For E4406A this measures the amplitude of your input signal with respect to the frequency. It provides spectrum analysis capability using FFT (fast Fourier transform) measurement techniques. You must select the appropriate mode using INSTrument:SELect, to use these commands.
For PSA this measures the amplitude of your input signal with respect to the frequency. It provides spectrum analysis capability using FFT (fast Fourier transform) measurement techniques. You must be in the Basic, cdmaOne, cdma2000, 1xEV-DO, W-CDMA, GSM (w/EDGE), NADC, or PDC mode to use these commands. Use INSTrument:SELect, to select the mode.
The general functionality of CONFigure, FETCh, MEASure, and READ are described at the beginning of this section. See the SENSe:WAVeform commands for more measurement related commands.
:CONFigure:WAVeform
:INITiate:WAVeform
:FETCh:WAVeform[n]?
:READ:WAVeform[n]?
:MEASure:WAVeform[n]?
Front PanelAccess: Measure, Waveform (Time Domain)
After the measurement is selected, press Restore Meas Defaults to restore factory defaults.
Measurement Results Available
n Results Returned
0
(see also 5)
Returns unprocessed I/Q trace data, as a series of trace point values, in volts. The I values are listed first in each pair, using the 0 through even-indexed values. The Q values are the odd-indexed values.
232 Chapter 4
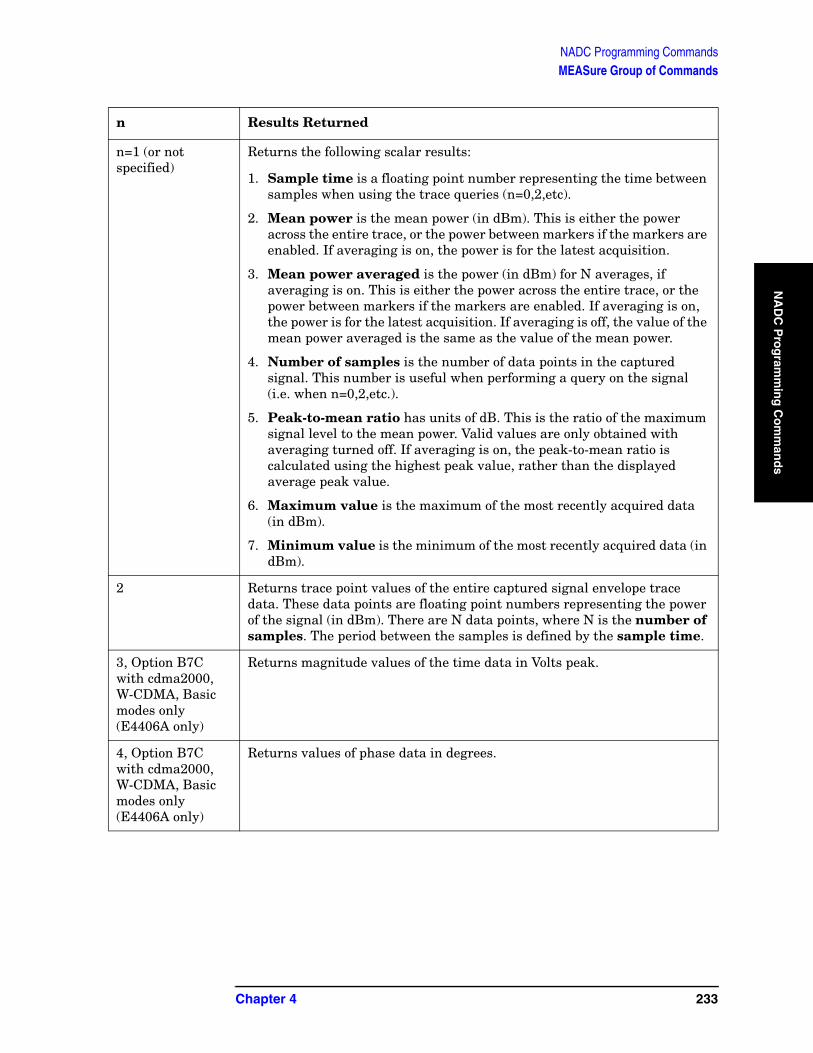
NADC Programming CommandsMEASure Group of Commands
NA
DC
Pro
gram
min
g C
om
man
ds
n=1 (or not specified)
Returns the following scalar results:
1. Sample time is a floating point number representing the time between samples when using the trace queries (n=0,2,etc).
2. Mean power is the mean power (in dBm). This is either the power across the entire trace, or the power between markers if the markers are enabled. If averaging is on, the power is for the latest acquisition.
3. Mean power averaged is the power (in dBm) for N averages, if averaging is on. This is either the power across the entire trace, or the power between markers if the markers are enabled. If averaging is on, the power is for the latest acquisition. If averaging is off, the value of the mean power averaged is the same as the value of the mean power.
4. Number of samples is the number of data points in the captured signal. This number is useful when performing a query on the signal (i.e. when n=0,2,etc.).
5. Peak-to-mean ratio has units of dB. This is the ratio of the maximum signal level to the mean power. Valid values are only obtained with averaging turned off. If averaging is on, the peak-to-mean ratio is calculated using the highest peak value, rather than the displayed average peak value.
6. Maximum value is the maximum of the most recently acquired data (in dBm).
7. Minimum value is the minimum of the most recently acquired data (in dBm).
2 Returns trace point values of the entire captured signal envelope trace data. These data points are floating point numbers representing the power of the signal (in dBm). There are N data points, where N is the number of samples. The period between the samples is defined by the sample time.
3, Option B7C with cdma2000, W-CDMA, Basic modes only(E4406A only)
Returns magnitude values of the time data in Volts peak.
4, Option B7C with cdma2000, W-CDMA, Basic modes only(E4406A only)
Returns values of phase data in degrees.
n Results Returned
Chapter 4 233

NADC Programming CommandsREAD Subsystem
NA
DC
Pro
gra
mm
ing
Co
mm
and
s
READ SubsystemThe READ? commands are used with several other commands and are documented in the section on the “MEASure Group of Commands” on page 209.
Initiate and Read Measurement Data
:READ:<measurement>[n]?
A READ? query must specify the desired measurement. It will cause a measurement to occur without changing any of the current settings and will return any valid results. The code number n selects the kind of results that will be returned. The available measurements and data results are described in the “MEASure Group of Commands” on page 209.
234 Chapter 4

NADC Programming CommandsSENSe Subsystem
NA
DC
Pro
gram
min
g C
om
man
ds
SENSe SubsystemThese commands are used to set the instrument state parameters so that you can measure a particular input signal. Some SENSe commands are only for use with specific measurements found under the MEASURE key menu or the “MEASure Group of Commands” on page 209. The measurement must be active before you can use these commands.
The SCPI default for the format of any data output is ASCII. The format can be changed to binary with FORMat:DATA which transports faster over the bus.
Adjacent Channel Power Measurement
Commands for querying the adjacent channel power measurement results and for setting to the default values are found in the “MEASure Group of Commands” on page 209. The equivalent front panel keys for the parameters described in the following commands, are found under the Meas Setup key, after the ACP or ACPR measurement has been selected from the MEASURE key menu.
Adjacent Channel Power—Average Count
[:SENSe]:ACP:AVERage:COUNt <integer>
[:SENSe]:ACP:AVERage:COUNt?
Set the number of data acquisitions that will be platform averaged. After the specified number of average counts, the average mode (termination control) setting determines the average action.
Factory Preset: 10 for cdma2000, W-CDMA
20 for Basic, cdmaOne, iDEN (E4406A)
Range: 1 to 10,000
Remarks: Use INSTrument:SELect to set the mode.
Front PanelAccess: Meas Setup
Adjacent Channel Power—Averaging State
[:SENSe]:ACP:AVERage[:STATe] OFF|ON|0|1
[:SENSe]:ACP:AVERage[:STATe]?
Turn the averaging function On or Off.
Factory Preset: On
Chapter 4 235

NADC Programming CommandsSENSe Subsystem
NA
DC
Pro
gra
mm
ing
Co
mm
and
s
Off for iDEN mode (E4406A)
Remarks: Use INSTrument:SELect to set the mode.
Front PanelAccess: Meas Setup
Adjacent Channel Power—Averaging Termination Control
[:SENSe]:ACP:AVERage:TCONtrol EXPonential|REPeat
[:SENSe]:ACP:AVERage:TCONtrol?
Select the type of termination control used for averaging. This determines the averaging action after the specified number of data acquisitions (average count) is reached.
EXPonential – Each successive data acquisition after the average count is reached, is exponentially weighted and combined with the existing average.
REPeat – After reaching the average count, the averaging is reset and a new average is started.
Factory Preset: REPeat for PSA cdmaOne, cdma2000, W-CDMA
REPeat for E4406A Basic, cdmaOne, cdma2000, W-CDMA
EXPonential for E4406A iDEN
EXPonential for NADC, PDC
Remarks: Use INSTrument:SELect to set the mode.
Adjacent Channel Power—Offset Frequency Absolute Limit
[:SENSe]:ACP:LIST:ALIMit <abs_powr>,<abs_powr>,<abs_powr>,<abs_powr>,<abs_powr>
[:SENSe]:ACP:LIST:ALIMit?
Set the absolute limit on offset frequencies relative to the carrier. You can turn off (not use) specific offsets with the [:SENSe]:ACP:LIST:STATe command.
Factory Preset:
Mode Offset A Offset B Offset C Offset D Offset E
NADC 0 dBm 0 dBm −13 dBm 0 dBm 0 dBm
PDC 0 dBm 0 dBm 0 dBm 0 dBm 0 dBm
236 Chapter 4

NADC Programming CommandsSENSe Subsystem
NA
DC
Pro
gram
min
g C
om
man
ds
Range: −200 to 50 dBm
Remarks: You must be in the NADC, cdmaOne, or PDC mode to use this command. Use INSTrument:SELect to set the mode.
Adjacent Channel Power—Offset Frequency
[:SENSe]:ACP:LIST[:FREQuency] <f_offset>,<f_offset>,<f_offset>,<f_offset>,<f_offset>
[:SENSe]:ACP:LIST[:FREQuency]?
Define the offset frequencies. You can turn off (not use) specific offsets with the [:SENSe]:ACP:LIST:STATe command.
Factory Preset:
Range: 10 Hz to 45 MHz
0 to 200 kHz
Default Unit: Hz
Remarks: You must be in the NADC, cdmaOne, or PDC mode to use this command. Use INSTrument:SELect to set the mode.
Adjacent Channel Power—Offset Frequency Power Mode
[:SENSe]:ACP:LIST:POWer INTeg|PEAK,INTeg|PEAK,INTeg|PEAK,INTeg|PEAK,INTeg|PEAK
[:SENSe]:ACP:LIST:POWer?
Define the power measurement mode for each of the offset frequencies. You can turn off (not use) specific offsets with the SENS:ACP:LIST:STATe command.
Factory Preset: INTeg, INTeg, INTeg, INTeg, INTeg
Remarks: You must be in the NADC mode to use this command. Use INSTrument:SELect to set the mode.
Mode Offset A Offset B Offset C Offset D Offset E
NADC 30 kHz 60 kHz 90 kHz 120 kHz 0 Hz
PDC 50 kHz 100 kHz 0 kHz 0 kHz 0 kHz
Chapter 4 237
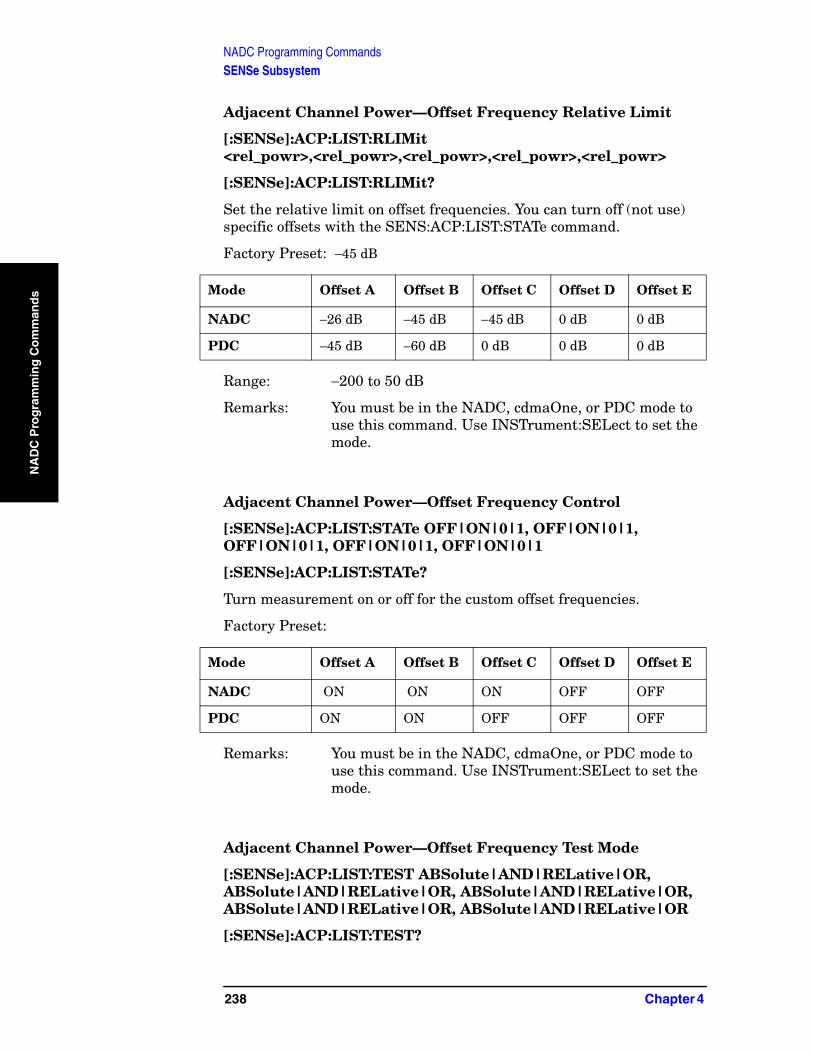
NADC Programming CommandsSENSe Subsystem
NA
DC
Pro
gra
mm
ing
Co
mm
and
s
Adjacent Channel Power—Offset Frequency Relative Limit
[:SENSe]:ACP:LIST:RLIMit <rel_powr>,<rel_powr>,<rel_powr>,<rel_powr>,<rel_powr>
[:SENSe]:ACP:LIST:RLIMit?
Set the relative limit on offset frequencies. You can turn off (not use) specific offsets with the SENS:ACP:LIST:STATe command.
Factory Preset: −45 dB
Range: −200 to 50 dB
Remarks: You must be in the NADC, cdmaOne, or PDC mode to use this command. Use INSTrument:SELect to set the mode.
Adjacent Channel Power—Offset Frequency Control
[:SENSe]:ACP:LIST:STATe OFF|ON|0|1, OFF|ON|0|1, OFF|ON|0|1, OFF|ON|0|1, OFF|ON|0|1
[:SENSe]:ACP:LIST:STATe?
Turn measurement on or off for the custom offset frequencies.
Factory Preset:
Remarks: You must be in the NADC, cdmaOne, or PDC mode to use this command. Use INSTrument:SELect to set the mode.
Adjacent Channel Power—Offset Frequency Test Mode
[:SENSe]:ACP:LIST:TEST ABSolute|AND|RELative|OR,ABSolute|AND|RELative|OR, ABSolute|AND|RELative|OR,ABSolute|AND|RELative|OR, ABSolute|AND|RELative|OR
[:SENSe]:ACP:LIST:TEST?
Mode Offset A Offset B Offset C Offset D Offset E
NADC −26 dB −45 dB −45 dB 0 dB 0 dB
PDC −45 dB −60 dB 0 dB 0 dB 0 dB
Mode Offset A Offset B Offset C Offset D Offset E
NADC ON ON ON OFF OFF
PDC ON ON OFF OFF OFF
238 Chapter 4
NADC Programming CommandsSENSe Subsystem
NA
DC
Pro
gram
min
g C
om
man
ds
Define the type of testing to be done for the five custom offset frequencies. You can turn off (not use) specific offsets with the SENS:ACP:LIST:STATe command.
Factory Preset: RELative, RELative, OR, AND, AND for NADC, PDC mode
Remarks: You must be in the NADC, cdmaOne, or PDC mode to use this command. Use INSTrument:SELect to set the mode.
Adjacent Channel Power—Trigger Source
[:SENSe]:ACP:TRIGger:SOURce EXTernal[1]|EXTernal2|FRAMe|IF|IMMediate|RFBurst
[:SENSe]:ACP:TRIGger:SOURce?
Select the trigger source used to control the data acquisitions.
EXTernal 1 – front panel external trigger input
EXTernal 2 – rear panel external trigger input
FRAMe – internal frame trigger from front panel input
IF – internal IF envelope (video) trigger
IMMediate – the next data acquisition is immediately taken, capturing the signal asynchronously (also called free run).
RFBurst – wideband RF burst envelope trigger that has automatic level control for periodic burst signals.
Factory Preset: IMMediate for BS
RFBurst for MS
Remarks: For PSA you must be in cdmaOne, NADC, or PDC mode to use this command. Use INSTrument:SELect to set the mode.
For E4406A you must be in Basic, cdmaOne, iDEN, NADC, or PDC mode to use this command. Use INSTrument:SELect to set the mode.
In Basic mode, for offset frequencies >12.5 MHz, the external triggers will be a more reliable trigger source than RF burst. Also, you can use the Waveform measurement to set up trigger delay.
History: E4406A:Added revision A.04.00 or later
Chapter 4 239

NADC Programming CommandsSENSe Subsystem
NA
DC
Pro
gra
mm
ing
Co
mm
and
s
Adjacent Channel Power—Power Reference
[:SENSe]:ACP:TYPE PSDRef|TPRef
[:SENSe]:ACP:TYPE?
Selects the measurement type. This allows you to make absolute and relative power measurements of either total power or the power normalized to the measurement bandwidth.
Power Spectral Density Reference (PSDRef) - the power spectral density is used as the power reference
Total Power Reference (TPRef) - the total power is used as the power reference
Factory Preset: Total power reference (TPRef)
Remarks:
For E4406A you must be in the Basic, cdmaOne, cdma2000, W-CDMA, NADC, or PDC mode to use this command. Use INSTrument:SELect to set the mode.
For PSA you must be in the cdmaOne, cdma2000, W-CDMA, NADC, or PDC mode to use this command. Use INSTrument:SELect to set the mode.
240 Chapter 4

NADC Programming CommandsSENSe Subsystem
NA
DC
Pro
gram
min
g C
om
man
ds
Channel Commands
Burst Type
[:SENSe]:CHANnel:BURSt TCH|CCH
[:SENSe]:CHANnel:BURSt?
Set the burst type for mobile station testing.
Traffic Channel (TCH) – burst for traffic channel
Control Channel (CCH) – burst for control channel
Factory Preset: TCH
Remarks: The command is only applicable for mobile station testing, device = MS.
You must be in the NADC or PDC mode to use this command. Use INSTrument:SELect to set the mode.
Time Slot number
[:SENSe]:CHANnel:SLOT <integer>
[:SENSe]:CHANnel:SLOT?
Select the slot number that you want to measure.
In GSM mode the measurement frame is divided into the eight expected measurement timeslots.
Factory Preset: 0 for GSM, EDGE, PDC mode
1 for NADC mode
Range: 0 to 5 for PDC mode
1 to 6 for NADC mode
0 to 7 for GSM, EDGE mode
Remarks: You must be in GSM, EDGE, NADC, or PDC mode to use this command. Use INSTrument:SELect to set the mode.
Front PanelAccess: Mode Setup, Radio, Frequency Hopping Repetition
Factor
Time Slot Auto
[:SENSe]:CHANnel:SLOT:AUTO OFF|ON|0|1
Chapter 4 241
NADC Programming CommandsSENSe Subsystem
NA
DC
Pro
gra
mm
ing
Co
mm
and
s
[:SENSe]:CHANnel:SLOT:AUTO?
Select auto or manual control for slot searching. The feature is only supported in external and frame trigger source modes. In external trigger mode when timeslot is set on, the demodulation measurement is made on the nth timeslot specified by the external trigger point + n timeslots, where n is the selected timeslot value 0 to 7. In frame trigger mode when timeslot is set on, then demodulation measurement is only made on the nth timeslot specified by bit 0 of frame reference burst + n timeslots, where n is the selected timeslot value 0 to 7 and where the frame reference burst is specified by Ref Burst and Ref TSC (Std) combination.
Factory Preset: ON, for NADC, PDC mode
OFF, for GSM, EDGE mode
Remarks: The command is only applicable for mobile station testing, device = MS.
You must be in GSM, EDGE, NADC, or PDC mode to use this command.Use INSTrument:SELect to set the mode.
History: E4406A:Added GSM mode, version A.03.00 or later
242 Chapter 4

NADC Programming CommandsSENSe Subsystem
NA
DC
Pro
gram
min
g C
om
man
ds
Signal Corrections Commands
Correction for Base Station RF Port External Attenuation
[:SENSe]:CORRection:BS[:RF]:LOSS <rel_power>
[:SENSe]:CORRection:BS[:RF]:LOSS?
Set the correction equal to the external attenuation used when measuring base stations.
Factory Preset: 0 dB
Range: −50 to 100 dB for cdmaOne, iDEN (E4406A)
−50 to 50 dB for NADC or PDC
Default Unit: dB
Remarks: You must be in the iDEN (E4406A), cdmaOne, NADC or PDC mode to use this command. Use INSTrument:SELect to set the mode.
Value is global to the current mode.
Correction for MS RF Port External Attenuation
[:SENSe]:CORRection:MS[:RF]:LOSS <rel_power>
[:SENSe]:CORRection:MS[:RF]:LOSS?
Set the correction equal to the external attenuation used when measuring mobile stations.
Factory Preset: 0.0 dB
Range: −50 to 100.0 dB for cdmaOne, GSM, EDGE, iDEN
−100.0 to 100.0 dB for cdma2000, W-CDMA, 1xEV-DO
−50.0 to 50.0 dB for NADC, PDC
Default Unit: dB
Remarks: For E4406A you must be in the cdmaOne, GSM, EDGE (w/GSM), cdma2000, W-CDMA, iDEN, NADC, PDC, or 1xEV-DO mode to use this command. Use INSTrument:SELect to set the mode.
For PSA you must be in the cdmaOne, GSM (w/EDGE), cdma2000, W-CDMA, NADC, PDC, or 1xEV-DO mode to use this command. Use INSTrument:SELect to set the mode.
Value is global to the current mode.
Chapter 4 243
NADC Programming CommandsSENSe Subsystem
NA
DC
Pro
gra
mm
ing
Co
mm
and
s
Error Vector Magnitude Measurement
Commands for querying the error vector magnitude measurement results and for setting to the default values are found in the “MEASure Group of Commands” on page 209. The equivalent front panel keys for the parameters described in the following commands, are found under the Meas Setup key, after the EVM measurement has been selected from the MEASURE key menu.
Error Vector Magnitude—Average Count
[:SENSe]:EVM:AVERage:COUNt <integer>
[:SENSe]:EVM:AVERage:COUNt?
Set the number of data acquisitions that will be averaged. After the specified number of average counts, the average mode (termination control) setting determines the average action.
Factory Preset: 10
Range: 1 to 10,000
Remarks: You must be in the NADC or PDC mode to use this command. Use INSTrument:SELect to set the mode.
Error Vector Magnitude—Averaging State
[:SENSe]:EVM:AVERage[:STATe] OFF|ON|0|1
[:SENSe]:EVM:AVERage[:STATe]?
Turn average on or off.
Factory Preset: ON
Remarks: You must be in the NADC or PDC mode to use this command. Use INSTrument:SELect to set the mode.
Error Vector Magnitude—Averaging Termination Control
[:SENSe]:EVM:AVERage:TCONtrol EXPonential|REPeat
[:SENSe]:EVM:AVERage:TCONtrol?
Select the type of termination control used to averaging. This determines the averaging action after the specified number of data acquisitions (average count) is reached.
EXPonential – Each successive data acquisition after the average count is reached, is exponentially weighted and combined with the existing average.
REPeat – After reaching the average count, the averaging is reset
244 Chapter 4

NADC Programming CommandsSENSe Subsystem
NA
DC
Pro
gram
min
g C
om
man
ds
and a new average is started.
Factory Preset: EXPonential
Remarks: You must be in the NADC or PDC mode to use this command. Use INSTrument:SELect to set the mode.
Error Vector Magnitude—Burst Synchronization Source
[:SENSe]:EVM:BSYNc:SOURce RFAMplitude|SWORd|NONE
[:SENSe]:EVM:BSYNc:SOURce?
Select the method of synchronizing the measurement to the bursts.
RFAMplitude – The burst sync approximates the start and stop of the useful part of the burst without demodulation of the burst. The measurement is then synchronized with the center point of the burst.
SWORd – The measurement is synchronized with the synch word.
NONE – The measurement is performed without searching burst.
Factory Preset: NONE for BS
SWORd for MS
Remarks: You must be in the NADC or PDC mode to use this command. Use INSTrument:SELect to set the mode.
Error Vector Magnitude—Points/Symbol
[:SENSe]:EVM:TRACe:PPSYmbol <integer>
[:SENSe]:EVM:TRACe:PPSYmbol?
Select the points/symbol for EVM measurement. Only 1 or 5 are valid entries.
Factory Preset: 5
Range: 1, 5
Remarks: You must be in the NADC or PDC mode to use this command. Use INSTrument:SELect to set the mode.
Error Vector Magnitude—Trigger Source
[:SENSe]:EVM:TRIGger:SOURce EXTernal[1]|EXTernal2|FRAMe|IF|IMMediate|RFBurst
[:SENSe]:EVM:TRIGger:SOURce?
Chapter 4 245

NADC Programming CommandsSENSe Subsystem
NA
DC
Pro
gra
mm
ing
Co
mm
and
s
Select the trigger source used to control the data acquisitions.
EXTernal 1 – front panel external trigger input
EXTernal 2 – rear panel external trigger input
IF – internal IF envelope (video) trigger
IMMediate – the next data acquisition is immediately taken, capturing the signal asynchronously (also called free run)
FRAMe – internal frame trigger from front panel input
RFBurst – wideband RF burst envelope trigger that has automatic level control for periodic burst signals
Factory Preset: IMMediate for BS
RFBurst for MS
Remarks: You must be in the NADC or PDC mode to use this command. Use INSTrument:SELect to set the mode.
246 Chapter 4

NADC Programming CommandsSENSe Subsystem
NA
DC
Pro
gram
min
g C
om
man
ds
F Input Signal Alignments
Select the Input Signal
(PSA)[:SENSe]:FEED RF|AREFerence|IFAlign
(E4406A)[:SENSe]:FEED RF|IQ|IONLy|QONLy|AREFerence|IFALign
[:SENSe]:FEED?
Selects the input signal. The default input signal is taken from the front panel RF input port. For calibration and testing purposes the input signal can be taken from an internal 321.4 MHz IF alignment signal or an internal 50 MHz amplitude reference source.
For E4406A if the baseband IQ option (Option B7C) is installed, I and Q input ports are added to the front panel. The I and Q ports accept the in-phase and quadrature components of the IQ signal, respectively. The input signal can be taken from either or both ports.
RF selects the signal from the front panel RF INPUT port.
IQ selects the combined signals from the front panel optional I and Q input ports. (E4406A with Option B7C in Basic, W-CDMA, cdma2000, EDGE(w/GSM) modes)
IONLy selects the signal from the front panel optional I input port.(E4406A with Option B7C in Basic mode)
QONLy selects the signal from the front panel optional Q input port. (E4406A with Option B7C in Basic mode)
AREFerence selects the internal 50 MHz amplitude reference signal.
IFALign selects the internal, 321.4 MHz, IF alignment signal.
Factory Preset: RF
Front PanelAccess: Input, Input Port
History: E4406A:modified in version A.05.00
Chapter 4 247

NADC Programming CommandsSENSe Subsystem
NA
DC
Pro
gra
mm
ing
Co
mm
and
s
RF Power Commands
RF Port Input Attenuation
[:SENSe]:POWer[:RF]:ATTenuation <rel_power>
[:SENSe]:POWer[:RF]:ATTenuation?
Set the RF input attenuator. This value is set at its auto value if RF input attenuation is set to auto.
Factory Preset: 0 dB
12 dB for iDEN (E4406A)
Range: 0 to 40 dB
Default Unit: dB
Front PanelAccess: Input, Input Atten
RF Port Power Range Auto
[:SENSe]:POWer[:RF]:RANGe:AUTO OFF|ON|0|1
[:SENSe]:POWer[:RF]:RANGe:AUTO?
Select the RF port power range to be set either automatically or manually.
ON - power range is automatically set as determined by the actual measured power level at the start of a measurement.
OFF - power range is manually set
Factory Preset: ON
Remarks: You must be in the cdmaOne, GSM, EDGE, NADC, PDC, cdma2000, W-CDMA, mode to use this command. Use INSTrument:SELect to set the mode.
Front PanelAccess: Input, Max Total Pwr (at UUT)
RF Port Power Range Maximum Total Power
[:SENSe]:POWer[:RF]:RANGe[:UPPer] <power>
[:SENSe]:POWer[:RF]:RANGe[:UPPer]?
Set the maximum expected total power level at the radio unit under test. This value is ignored if RF port power range is set to auto. External attenuation required above 30 dBm.
248 Chapter 4

NADC Programming CommandsSENSe Subsystem
NA
DC
Pro
gram
min
g C
om
man
ds
Factory Preset: − 15.0 dBm
Range: − 100.0 to 80.0 dBm for EDGE, GSM
− 100.0 to 27.7 dBm for cdmaOne, iDEN (E4406A)
− 200.0 to 50.0 dBm for NADC, PDC
− 200.0 to 100.0 dBm for cdma2000, W-CDMA
Default Unit: dBm
Remarks: Global to the current mode. This is coupled to the RF input attenuation
For E4406A you must be in the Service, cdmaOne, EDGE(w/GSM), GSM, iDEN, NADC, PDC, cdma2000, or W-CDMA mode to use this command. Use INSTrument:SELect to set the mode.
For PSA you must be in the cdmaOne, GSM, EDGE, NADC, PDC, cdma2000, or W-CDMA mode to use this command. Use INSTrument:SELect to set the mode.
Front PanelAccess: Input, Max Total Pwr (at UUT)
Chapter 4 249

NADC Programming CommandsSENSe Subsystem
NA
DC
Pro
gra
mm
ing
Co
mm
and
s
Radio Standards Commands
Radio Device Under Test
[:SENSe]:RADio:DEVice BS|MS
[:SENSe]:RADio:DEVice?
Select the type of radio device to be tested.
BS – Base station transceiver test
MS – Mobile station transceiver test
Factory Preset: BS
Remarks: You must be in the NADC, or PDC mode to use this command. Use INSTrument:SELect to set the mode.
Global to current mode.
Front PanelAccess: Mode Setup, Radio, Device
Radio Traffic Rate
[:SENSe]:RADio:TRATe FULL|HALF
[:SENSe]:RADio:TRATe?
Select the traffic rate.
FULL – full traffic rate (a slot is every 20 ms)
HALF – half traffic rate (a slot is every 40 ms)
Factory Preset: FULL
Remarks: You must be in the NADC or PDC mode to use this command. Use INSTrument:SELect to set the mode.
250 Chapter 4

NADC Programming CommandsSENSe Subsystem
NA
DC
Pro
gram
min
g C
om
man
ds
Spectrum (Frequency-Domain) Measurement
Commands for querying the spectrum measurement results and for setting to the default values are found in the “MEASure Group of Commands” on page 209. The equivalent front panel keys for the parameters described in the following commands, are found under the Meas Setup key, after the Spectrum (Freq Domain) measurement has been selected from the MEASURE key menu.
Spectrum—Data Acquisition Packing
[:SENSe]:SPECtrum:ACQuisition:PACKing AUTO|LONG|MEDium|SHORt
[:SENSe]:SPECtrum:ACQuisition:PACKing?
Select the amount of data acquisition packing. This is an advanced control that normally does not need to be changed.
Factory Preset: AUTO
Remarks: To use this command for E4406A, the appropriate mode should be selected with INSTrument:SELect.
For PSA you must be in the Basic, cdmaOne, cdma2000, 1xEV-DO, W-CDMA, GSM, EDGE, NADC, or PDC mode to use this command. Use INSTrument:SELect to set the mode.
Spectrum—ADC Dither
[:SENSe]:SPECtrum:ADC:DITHer[:STATe] AUTO|ON|OFF|2|1|0
[:SENSe]:SPECtrum:ADC:DITHer[:STATe]?
Turn the ADC dither on or off. This is an advanced control that normally does not need to be changed.
Factory Preset: AUTO
Remarks: To use this command for E4406A, the appropriate mode should be selected with INSTrument:SELect.
For PSA you must be in the Basic, cdmaOne, cdma2000, 1xEV-DO, W-CDMA, GSM, EDGE, NADC, or PDC mode to use this command. Use INSTrument:SELect to set the mode.
Spectrum—ADC Range
E4406A
Chapter 4 251
NADC Programming CommandsSENSe Subsystem
NA
DC
Pro
gra
mm
ing
Co
mm
and
s
[:SENSe]:SPECtrum:ADC:RANGe AUTO|APEak|APLock|M6|P0|P6|P12|P18|P24
PSA[:SENSe]:SPECtrum:ADC:RANGe AUTO|APEak|APLock|NONE|P0|P6|P12|P18
[:SENSe]:SPECtrum:ADC:RANGe?
Select the range for the gain-ranging that is done in front of the ADC. This is an advanced control that normally does not need to be changed. Auto peak ranging is the default for this measurement. If you are measuring a CW signal please see the description below.
• AUTO - automatic range
For FFT spectrums - auto ranging should not be not be used. An exception to this would be if you know that your signal is “bursty”. Then you might use auto to maximize the time domain dynamic range as long as you are not very interested in the FFT data.
• Auto Peak (APEak) - automatically peak the range
For CW signals, the default of auto-peak ranging can be used, but a better FFT measurement of the signal can be made by selecting one of the manual ranges that are available: M6, P0 - P24.Auto peaking can cause the ADC range gain to move monotonically down during the data capture. This movement should have negligible effect on the FFT spectrum, but selecting a manual range removes this possibility. Note that if the CW signal being measured is close to the auto-ranging threshold, the noise floor may shift as much as 6 dB from sweep to sweep.
• Auto Peak Lock (APLock) - automatically peak lock the range
For CW signals, auto-peak lock ranging may be used. It will find the best ADC measurement range for this particular signal and will not move the range as auto-peak can. Note that if the CW signal being measured is close to the auto-ranging threshold, the noise floor may shift as much as 6 dB from sweep to sweep.For “bursty” signals, auto-peak lock ranging should not be used. The measurement will fail to operate, since the wrong (locked) ADC range will be chosen often and overloads will occur in the ADC.
• NONE - (PSA) turns off any auto-ranging without making any changes to the current setting.
• M6 - (E4406A) manually selects an ADC range that subtracts 6 dB of fixed gain across the range. Manual ranging is best for CW signals.
• P0 to P18 - (PSA) manually selects ADC ranges that add 0 to 18 dB of fixed gain across the range. Manual ranging is best for CW
252 Chapter 4
NADC Programming CommandsSENSe Subsystem
NA
DC
Pro
gram
min
g C
om
man
ds
signals.
• P0 to 24 - (E4406A) manually selects ADC ranges that add 0 to 24 dB of fixed gain across the range. Manual ranging is best for CW signals.
Factory Preset: APEak
Remarks: To use this command for E4406A, the appropriate mode should be selected with INSTrument:SELect.
For PSA you must be in the Basic, cdmaOne, cdma2000, 1xEV-DO, W-CDMA, GSM, EDGE, NADC, or PDC mode to use this command. Use INSTrument:SELect to set the mode.
Spectrum—Average Clear
[:SENSe]:SPECtrum:AVERage:CLEar
The average data is cleared and the average counter is reset.
Remarks: To use this command for E4406A, the appropriate mode should be selected with INSTrument:SELect.
For PSA you must be in the Basic, cdmaOne, cdma2000, 1xEV-DO, W-CDMA, GSM, EDGE, NADC, or PDC mode to use this command. Use INSTrument:SELect to set the mode.
Spectrum—Number of Averages
[:SENSe]:SPECtrum:AVERage:COUNt <integer>
[:SENSe]:SPECtrum:AVERage:COUNt?
Set the number of ‘sweeps’ that will be averaged. After the specified number of ‘sweeps’ (average counts), the averaging mode (terminal control) setting determines the averaging action.
Factory Preset: 25
Range: 1 to 10,000
Remarks: To use this command for E4406A, the appropriate mode should be selected with INSTrument:SELect.
For PSA you must be in the Basic, cdmaOne, cdma2000, 1xEV-DO, W-CDMA, GSM, EDGE, NADC, or PDC mode to use this command. Use INSTrument:SELect to set the mode.
Chapter 4 253
NADC Programming CommandsSENSe Subsystem
NA
DC
Pro
gra
mm
ing
Co
mm
and
s
Spectrum—Averaging State
[:SENSe]:SPECtrum:AVERage[:STATe] OFF|ON|0|1
[:SENSe]:SPECtrum:AVERage[:STATe]?
Turn averaging on or off.
Factory Preset: ON
Remarks: To use this command for E4406A, the appropriate mode should be selected with INSTrument:SELect.
For PSA you must be in the Basic, cdmaOne, cdma2000, 1xEV-DO, W-CDMA, GSM, EDGE, NADC, or PDC mode to use this command. Use INSTrument:SELect to set the mode.
Spectrum—Averaging Mode
[:SENSe]:SPECtrum:AVERage:TCONtrol EXPonential|REPeat
[:SENSe]:SPECtrum:AVERage:TCONtrol?
Select the type of termination control used for the averaging function. This determines the averaging action after the specified number of ‘sweeps’ (average count) is reached.
EXPonential - Each successive data acquisition after the average count is reached, is exponentially weighted and combined with the existing average.
REPeat - After reaching the average count, the averaging is reset and a new average is started.
Factory Preset: EXPonential
Remarks: To use this command for E4406A, the appropriate mode should be selected with INSTrument:SELect.
For PSA you must be in the Basic, cdmaOne, cdma2000, 1xEV-DO, W-CDMA, GSM, EDGE, NADC, or PDC mode to use this command. Use INSTrument:SELect to set the mode.
Spectrum—Averaging Type
[:SENSe]:SPECtrum:AVERage:TYPE LOG|MAXimum|MINimum|RMS|SCALar
[:SENSe]:SPECtrum:AVERage:TYPE?
Select the type of averaging.
254 Chapter 4
NADC Programming CommandsSENSe Subsystem
NA
DC
Pro
gram
min
g C
om
man
ds
LOG − The log of the power is averaged. (This is also known as video averaging.)
MAXimum − The maximum values are retained.
MINimum − The minimum values are retained.
RMS − The power is averaged, providing the rms of the voltage.
SCALar − The voltage is averaged.
Factory Preset: LOG
Remarks: To use this command for E4406A, the appropriate mode should be selected with INSTrument:SELect.
For PSA you must be in the Basic, cdmaOne, cdma2000, 1xEV-DO, W-CDMA, GSM, EDGE, NADC, or PDC mode to use this command. Use INSTrument:SELect to set the mode.
Spectrum— Select Pre-FFT Bandwidth
[:SENSe]:SPECtrum:BANDwidth|BWIDth:IF:AUTO OFF|ON|0|1
[:SENSe]:SPECtrum:BANDwidth|BWIDth:IF:AUTO?
Select auto or manual control of the pre-FFT BW.
Factory Preset: AUTO, 1.55 MHz
Remarks: To use this command for E4406A, the appropriate mode should be selected with INSTrument:SELect.
For PSA you must be in the Basic, cdmaOne, cdma2000, 1xEV-DO, W-CDMA, GSM, EDGE, NADC, or PDC mode to use this command. Use INSTrument:SELect to set the mode.
Front PanelAccess: Measure, Spectrum, Meas Setup, More, Advanced,
Pre-FFT BW.
Spectrum — IF Flatness Corrections
[:SENSe]:SPECtrum:BANDwidth|BWIDth:IF:FLATness OFF|ON|0|1
[:SENSe]:SPECtrum:BANDwidth|BWIDth:IF:FLATness?
Turns IF flatness corrections on and off.
Factory Preset: ON
Chapter 4 255

NADC Programming CommandsSENSe Subsystem
NA
DC
Pro
gra
mm
ing
Co
mm
and
s
Remarks: To use this command for E4406A, the appropriate mode should be selected with INSTrument:SELect.
For PSA you must be in the Basic, cdmaOne, cdma2000, 1xEV-DO, W-CDMA, GSM, EDGE, NADC, or PDC mode to use this command. Use INSTrument:SELect to set the mode.
Front PanelAccess: Measure, Spectrum, Meas Setup, More, Advanced,
Pre-FFT BW
Spectrum—Pre-ADC Bandpass Filter
[:SENSe]:SPECtrum:BANDwidth|BWIDth:PADC OFF|ON|0|1
[:SENSe]:SPECtrum:BANDwidth|BWIDth:PADC?
Turn the pre-ADC bandpass filter on or off. This is an advanced control that normally does not need to be changed.
Remarks: To use this command for E4406A, the appropriate mode should be selected with INSTrument:SELect.
For PSA you must be in the Basic, cdmaOne, cdma2000, 1xEV-DO, W-CDMA, GSM, EDGE, NADC, or PDC mode to use this command. Use INSTrument:SELect to set the mode.
Spectrum—Pre-FFT BW
[:SENSe]:SPECtrum:BANDwidth|BWIDth:PFFT[:SIZE] <freq>
[:SENSe]:SPECtrum:BANDwidth|BWIDth:PFFT[:SIZE]?
Set the pre-FFT bandwidth. This is an advanced control that normally does not need to be changed.
Frequency span, resolution bandwidth, and the pre-FFT bandwidth settings are normally coupled. If you are not auto-coupled, there can be combinations of these settings that are not valid.
Factory Preset: 1.55 MHz
1.25 MHz for cdmaOne
155.0 kHz, for iDEN mode (E4406A)
Range: 1 Hz to 10.0 MHz
Remarks: To use this command for E4406A, the appropriate mode should be selected with INSTrument:SELect.
For PSA you must be in the Basic, cdmaOne,
256 Chapter 4
NADC Programming CommandsSENSe Subsystem
NA
DC
Pro
gram
min
g C
om
man
ds
cdma2000, 1xEV-DO, W-CDMA, GSM, EDGE, NADC, or PDC mode to use this command. Use INSTrument:SELect to set the mode.
Spectrum—Pre-FFT BW Filter Type
[:SENSe]:SPECtrum:BANDwidth|BWIDth:PFFT:TYPE FLAT|GAUSsian
[:SENSe]:SPECtrum:BANDwidth|BWIDth:PFFT:TYPE?
Select the type of pre-FFT filter that is used. This is an advanced control that normally does not need to be changed.
Flat top (FLAT)- a filter with a flat amplitude response, which provides the best amplitude accuracy.
GAUSsian - a filter with Gaussian characteristics, which provides the best pulse response.
Factory Preset: FLAT
Remarks: To use this command for E4406A, the appropriate mode should be selected with INSTrument:SELect.
For PSA you must be in the Basic, cdmaOne, cdma2000, 1xEV-DO, W-CDMA, GSM, EDGE, NADC, or PDC mode to use this command. Use INSTrument:SELect to set the mode.
Spectrum—Resolution BW
[:SENSe]:SPECtrum:BANDwidth|BWIDth[:RESolution] <freq>
[:SENSe]:SPECtrum:BANDwidth|BWIDth[:RESolution]?
Set the resolution bandwidth for the FFT. This is the bandwidth used for resolving the FFT measurement. It is not the pre-FFT bandwidth. This value is ignored if the function is auto-coupled.
Frequency span, resolution bandwidth, and the pre-FFT bandwidth settings are normally coupled. If you are not auto-coupled, there can be combinations of these settings that are not valid.
Factory Preset: 20.0 kHz
250.0 Hz, for iDEN mode (E4406A)
Range: 0.10 Hz to 3.0 MHz
Remarks: To use this command for E4406A, the appropriate mode should be selected with INSTrument:SELect.
For PSA you must be in the Basic, cdmaOne,
Chapter 4 257

NADC Programming CommandsSENSe Subsystem
NA
DC
Pro
gra
mm
ing
Co
mm
and
s
cdma2000, 1xEV-DO, W-CDMA, GSM, EDGE, NADC, or PDC mode to use this command. Use INSTrument:SELect to set the mode.
Spectrum—Resolution BW Auto
[:SENSe]:SPECtrum:BANDwidth|BWIDth[:RESolution]:AUTO OFF|ON|0|1
[:SENSe]:SPECtrum:BANDwidth|BWIDth[:RESolution]:AUTO?
Select auto or manual control of the resolution BW. The automatic mode couples the resolution bandwidth setting to the frequency span.
Factory Preset: ON
OFF, for iDEN mode (E4406A)
Remarks: To use this command for E4406A, the appropriate mode should be selected with INSTrument:SELect.
For PSA you must be in the Basic, cdmaOne, cdma2000, W-CDMA, GSM, EDGE, NADC, or PDC mode to use this command. Use INSTrument:SELect to set the mode.
Decimation of Spectrum Display
[:SENSe]:SPECtrum:DECimate[:FACTor] <integer>
[:SENSe]:SPECtrum:DECimate[:FACTor]?
Sets the amount of data decimation done by the hardware and/or the software. Decimation by n keeps every nth sample, throwing away each of the remaining samples in the group of n. For example, decimation by 3 keeps every third sample, throwing away the two in between. Similarly, decimation by 5 keeps every fifth sample, throwing away the four in between.
Using zero (0) decimation selects the automatic mode. The measurement will then automatically choose decimation by “1” or “2” as is appropriate for the bandwidth being used.
This is an advanced control that normally does not need to be changed.
Factory Preset: 0
Range: 0 to 1,000, where 0 sets the function to automatic
Remarks: To use this command for E4406A, the appropriate mode should be selected with INSTrument:SELect.
For PSA you must be in the Basic, cdmaOne,
258 Chapter 4

NADC Programming CommandsSENSe Subsystem
NA
DC
Pro
gram
min
g C
om
man
ds
cdma2000, 1xEV-DO, W-CDMA, GSM, EDGE, NADC, or PDC mode to use this command. Use INSTrument:SELect to set the mode.
History: E4406A:Version A.02.00 or later
Spectrum—FFT Length
[:SENSe]:SPECtrum:FFT:LENGth <integer>
[:SENSe]:SPECtrum:FFT:LENGth?
Set the FFT length. This value is only used if length control is set to manual. The value must be greater than or equal to the window length value. Any amount greater than the window length is implemented by zero-padding. This is an advanced control that normally does not need to be changed.
Factory Preset: 706
Range: min, depends on the current setting of the spectrum window length
max, 1,048,576
Remarks: To use this command for E4406A, the appropriate mode should be selected with INSTrument:SELect.
For PSA you must be in the Basic, cdmaOne, cdma2000, 1xEV-DO, W-CDMA, GSM, EDGE, NADC, or PDC mode to use this command. Use INSTrument:SELect to set the mode.
History: E4406A:Short form changed from LENgth to LENGth, A.03.00
Spectrum—FFT Length Auto
[:SENSe]:SPECtrum:FFT:LENGth:AUTO OFF|ON|0|1
[:SENSe]:SPECtrum:FFT:LENGth:AUTO?
Select auto or manual control of the FFT and window lengths.
This is an advanced control that normally does not need to be changed.
On - the window lengths are coupled to resolution bandwidth, window type (FFT), pre-FFT bandwidth (sample rate) and SENSe:SPECtrum:FFT:RBWPoints.
Off - lets you set SENSe:SPECtrum:FFT:LENGth and SENSe:SPECtrum:FFT:WINDow:LENGth.
Chapter 4 259

NADC Programming CommandsSENSe Subsystem
NA
DC
Pro
gra
mm
ing
Co
mm
and
s
Factory Preset: ON
Remarks: To use this command for E4406A, the appropriate mode should be selected with INSTrument:SELect.
For PSA you must be in the Basic, cdmaOne, cdma2000, 1xEV-DO, W-CDMA, GSM, EDGE, NADC, or PDC mode to use this command. Use INSTrument:SELect to set the mode.
History: E4406A:Short form changed from LENgth to LENGth, A.03.00
Spectrum—FFT Minimum Points in Resolution BW
[:SENSe]:SPECtrum:FFT:RBWPoints <real>
[:SENSe]:SPECtrum:FFT:RBWPoints?
Set the minimum number of data points that will be used inside the resolution bandwidth. The value is ignored if length control is set to manual. This is an advanced control that normally does not need to be changed.
Factory Preset: 1.30
Range: 0.1 to 100
Remarks: To use this command for E4406A, the appropriate mode should be selected with INSTrument:SELect.
For PSA you must be in the Basic, cdmaOne, cdma2000, 1xEV-DO, W-CDMA, GSM, EDGE, NADC, or PDC mode to use this command. Use INSTrument:SELect to set the mode.
Spectrum—Window Delay
[:SENSe]:SPECtrum:FFT:WINDow:DELay <real>
[:SENSe]:SPECtrum:FFT:WINDow:DELay?
Set the FFT window delay to move the FFT window from its nominal position of being centered within the time capture. This function is not available from the front panel. It is an advanced control that normally does not need to be changed.
Factory Preset: 0
Range: −10.0 to +10.0s
Default Unit: seconds
Remarks: To use this command for E4406A, the appropriate mode
260 Chapter 4

NADC Programming CommandsSENSe Subsystem
NA
DC
Pro
gram
min
g C
om
man
ds
should be selected with INSTrument:SELect.
For PSA you must be in the Basic, cdmaOne, cdma2000, 1xEV-DO, W-CDMA, GSM, EDGE, NADC, or PDC mode to use this command. Use INSTrument:SELect to set the mode.
Spectrum—Window Length
[:SENSe]:SPECtrum:FFT:WINDow:LENGth <integer>
[:SENSe]:SPECtrum:FFT:WINDow:LENGth?
Set the FFT window length. This value is only used if length control is set to manual. This is an advanced control that normally does not need to be changed.
Factory Preset: 706
Range: 8 to 1,048,576
Remarks: To use this command for E4406A, the appropriate mode should be selected with INSTrument:SELect.
For PSA you must be in the Basic, cdmaOne, cdma2000, 1xEV-DO, W-CDMA, GSM, EDGE, NADC, or PDC mode to use this command. Use INSTrument:SELect to set the mode.
History: E4406A:Short form changed from LENgth to LENGth, A.03.00
Spectrum—FFT Window
[:SENSe]:SPECtrum:FFT:WINDow[:TYPE] BH4Tap|BLACkman|FLATtop|GAUSsian|HAMMing|HANNing|KB70|KB90|KB110|UNIForm
[:SENSe]:SPECtrum:FFT:WINDow[:TYPE]?
Select the FFT window type.
BH4Tap - Blackman Harris with 4 taps
BLACkman - Blackman
FLATtop - flat top, the default (for high amplitude accuracy)
GAUSsian - Gaussian with alpha of 3.5
HAMMing - Hamming
HANNing - Hanning
KB70, 90, and 110 - Kaiser Bessel with sidelobes at −70, −90, or −110
Chapter 4 261

NADC Programming CommandsSENSe Subsystem
NA
DC
Pro
gra
mm
ing
Co
mm
and
s
dBc
UNIForm - no window is used. (This is the unity response.)
Factory Preset: FLATtop
Remarks: This selection affects the acquisition point quantity and the FFT size, based on the resolution bandwidth selected.
To use this command for E4406A, the appropriate mode should be selected with INSTrument:SELect.
For PSA you must be in the Basic, cdmaOne, cdma2000, 1xEV-DO, W-CDMA, GSM, EDGE, NADC, or PDC mode to use this command. Use INSTrument:SELect to set the mode.
Spectrum—Frequency Span
[:SENSe]:SPECtrum:FREQuency:SPAN <freq>
[:SENSe]:SPECtrum:FREQuency:SPAN?
Set the frequency span to be measured.
Factory Preset: 1.0 MHz
100.0 kHz for iDEN mode (E4406A)
Range: 10 Hz to 10.0 MHz (15 MHz when Service mode is selected)
Default Unit: Hz
Remarks: The actual measured span will generally be slightly wider due to the finite resolution of the FFT.
To use this command for E4406A, the appropriate mode should be selected with INSTrument:SELect.
For PSA you must be in the Basic, cdmaOne, cdma2000, 1xEV-DO, W-CDMA, GSM, EDGE, NADC, or PDC mode to use this command. Use INSTrument:SELect to set the mode.
Spectrum—Sweep (Acquisition) Time
[:SENSe]:SPECtrum:SWEep:TIME[:VALue] <time>
[:SENSe]:SPECtrum:SWEep:TIME?
Set the sweep (measurement acquisition) time. It is used to specify the length of the time capture record. If the value you specifiy is less than
262 Chapter 4

NADC Programming CommandsSENSe Subsystem
NA
DC
Pro
gram
min
g C
om
man
ds
the capture time required for the specified span and resolution bandwidth, the value is ignored. The value is set at its auto value when auto is selected. This is an advanced control that normally does not need to be changed.
Factory Preset: 188.0 µs
15.059 ms, for iDEN mode (E4406A)
Range: 100 ns to 10 s
Default Unit: seconds
Remarks: To use this command for E4406A, the appropriate mode should be selected with INSTrument:SELect.
For PSA you must be in the Basic, cdmaOne, cdma2000, 1xEV-DO, W-CDMA, GSM, EDGE, NADC, or PDC mode to use this command. Use INSTrument:SELect to set the mode.
Spectrum—Sweep (Acquisition) Time Auto
[:SENSe]:SPECtrum:SWEep:TIME:AUTO OFF|ON|0|1
[:SENSe]:SPECtrum:SWEep:TIME:AUTO
Select auto or manual control of the sweep (acquisition) time. This is an advanced control that normally does not need to be changed.
AUTO - couples the Sweep Time to the Frequency Span and Resolution BW
Manual - the Sweep Time is uncoupled from the Frequency Span and Resolution BW.
Factory Preset: AUTO
Remarks: To use this command for E4406A, the appropriate mode should be selected with INSTrument:SELect.
For PSA you must be in the Basic, cdmaOne, cdma2000, 1xEV-DO, W-CDMA, GSM, EDGE, NADC, or PDC mode to use this command. Use INSTrument:SELect to set the mode.
Spectrum—Trigger Source
[:SENSe]:SPECtrum:TRIGger:SOURce EXTernal[1]|EXTernal2|FRAMe|IF|LINE|IMMediate|RFBurst
[:SENSe]:SPECtrum:TRIGger:SOURce?
Select the trigger source used to control the data acquisitions.
Chapter 4 263

NADC Programming CommandsSENSe Subsystem
NA
DC
Pro
gra
mm
ing
Co
mm
and
s
EXTernal1 - front panel external trigger input
EXTernal2 - rear panel external trigger input
FRAMe - internal frame timer from front panel input
IF - internal IF envelope (video) trigger
LINE - internal line trigger
IMMediate - the next data acquisition is immediately taken (also called free run)
RFBurst - wideband RF burst envelope trigger that has automatic level control for periodic burst signals
Factory Preset: IMMediate (free run)
RFBurst, for GSM, iDEN mode
Remarks: To use this command for E4406A, the appropriate mode should be selected with INSTrument:SELect.
For PSA you must be in the Basic, cdmaOne, cdma2000, 1xEV-DO, W-CDMA, GSM, EDGE, NADC, or PDC mode to use this command. Use INSTrument:SELect to set the mode.
264 Chapter 4

NADC Programming CommandsSENSe Subsystem
NA
DC
Pro
gram
min
g C
om
man
ds
Synchronization Commands
Burst Sync Delay
[:SENSe]:SYNC:BURSt:DELay <time>
[:SENSe]:SYNC:BURSt:DELay?
Set the delay for the burst measurement position from the reference position that is determined by sync word or the burst rising/falling edges.
Factory Preset: 0 sec
Range: − 500 ms to 500 ms
Default Unit: seconds
Remarks: You must be in the iDEN (E4406A), NADC or PDC mode to use this command. Use INSTrument:SELect to set the mode.
Burst Search Threshold
[:SENSe]:SYNC:STHReshold <rel_power>
[:SENSe]:SYNC:STHReshold?
Set the power threshold, relative to the peak power, that is used to determine the burst rising edge and falling edge.
Factory Preset: − 30 dB
Range: − 200 to − 0.01 dB
Default Unit: dB
Remarks: You must be in the iDEN (E4406A), NADC or PDC mode to use this command. Use INSTrument:SELect to set the mode.
Front PanelAccess: Mode Setup, Trigger, Burst Search Threshold
Chapter 4 265
NADC Programming CommandsSENSe Subsystem
NA
DC
Pro
gra
mm
ing
Co
mm
and
s
Waveform (Time-Domain) Measurement
Commands for querying the waveform measurement results and for setting to the default values are found in the “MEASure Group of Commands” on page 209. The equivalent front panel keys for the parameters described in the following commands, are found under the Meas Setup key, after the Waveform (Time Domain) measurement has been selected from the MEASURE key menu.
Waveform—Data Acquisition Packing
[:SENSe]:WAVeform:ACQuistion:PACKing AUTO|LONG|MEDium|SHORt
[:SENSe]:WAVeform:ACQuistion:PACKing?
This is an advanced control that normally does not need to be changed.
Factory Preset: AUTO
Remarks: To use this command for E4406A, the appropriate mode should be selected with INSTrument:SELect.
For PSA you must be in the Basic, cdmaOne, cdma2000, 1xEV-DO, W-CDMA, GSM, EDGE, NADC, or PDC mode to use this command. Use INSTrument:SELect to set the mode.
Waveform—ADC Dither State
[:SENSe]:WAVeform:ADC:DITHer[:STATe] OFF|ON|0|1
[:SENSe]:WAVeform:ADC:DITHer[:STATe]?
This is an Advanced control that normally does not need to be changed.
Factory Preset: OFF
Remarks: To use this command for E4406A, the appropriate mode should be selected with INSTrument:SELect.
For PSA you must be in the Basic, cdmaOne, cdma2000, 1xEV-DO, W-CDMA, GSM, EDGE, NADC, or PDC mode to use this command. Use INSTrument:SELect to set the mode.
Waveform—Pre-ADC Bandpass Filter
[:SENSe]:WAVeform:ADC:FILTer[:STATe] OFF|ON|0|1
[:SENSe]:WAVeform:ADC:FILTer[:STATe]?
Turn the pre-ADC bandpass filter on or off. This is an Advanced control
266 Chapter 4

NADC Programming CommandsSENSe Subsystem
NA
DC
Pro
gram
min
g C
om
man
ds
that normally does not need to be changed.
Preset: OFF
Remarks: To use this command for E4406A, the appropriate mode should be selected with INSTrument:SELect.
For PSA you must be in the Basic, cdmaOne, cdma2000, 1xEV-DO, W-CDMA, GSM, EDGE, NADC, or PDC mode to use this command. Use INSTrument:SELect to set the mode.
Waveform—ADC Range
E4406A[:SENSe]:WAVeform:ADC:RANGe AUTO|APEak|APLock|GROund|M6|P0|P6|P12|P18|P24
PSA[:SENSe]:WAVeform:ADC:RANGe AUTO|APEak|APLock|GROund|NONE|P0|P6|P12|P18
[:SENSe]:WAVeform:ADC:RANGe?
Select the range for the gain-ranging that is done in front of the ADC. This is an Advanced control that normally does not need to be changed.
AUTO - automatic range
Auto Peak (APEak) - automatically peak the range
Auto Peak Lock (APLock)- automatically peak lock the range
GROund - ground
NONE - (PSA) turn off auto-ranging without making any changes to the current setting.
M6 - (E4406A) subtracts 6 dB of fixed gain across the range
P0 to P18 - (PSA) adds 0 to 18 dB of fixed gain across the range
P0 to P24 - (E4406A) adds 0 to 24 dB of fixed gain across the range
Factory Preset: AUTO
Remarks: To use this command for E4406A, the appropriate mode should be selected with INSTrument:SELect.
For PSA you must be in the Basic, cdmaOne, cdma2000, 1xEV-DO, W-CDMA, GSM, EDGE, NADC, or PDC mode to use this command. Use INSTrument:SELect to set the mode.
Chapter 4 267
NADC Programming CommandsSENSe Subsystem
NA
DC
Pro
gra
mm
ing
Co
mm
and
s
Waveform - Query Aperture Setting
[:SENSe]:WAVeform:APERture?
Returns the waveform sample period (aperture) based on current resolution bandwidth, filter type, and decimation factor. Sample rate is the reciprocal of period.
Remarks: To use this command for E4406A, the appropriate mode should be selected with INSTrument:SELect.
For PSA you must be in the Basic, cdmaOne, cdma2000, 1xEV-DO, W-CDMA, GSM, EDGE, NADC, or PDC mode to use this command. Use INSTrument:SELect to set the mode.
Waveform—Number of Averages
[:SENSe]:WAVeform:AVERage:COUNt <integer>
[:SENSe]:WAVeform:AVERage:COUNt?
Set the number of sweeps that will be averaged. After the specified number of sweeps (average counts), the averaging mode (terminal control) setting determines the averaging action.
Factory Preset: 10
Range: 1 to 10,000
Remarks: To use this command for E4406A, the appropriate mode should be selected with INSTrument:SELect.
For PSA you must be in the Basic, cdmaOne, cdma2000, 1xEV-DO, W-CDMA, GSM, EDGE, NADC, or PDC mode to use this command. Use INSTrument:SELect to set the mode.
Waveform—Averaging State
[:SENSe]:WAVeform:AVERage[:STATe] OFF|ON|0|1
[:SENSe]:WAVeform:AVERage[:STATe]?
Turn averaging on or off.
Factory Preset: OFF
Remarks: To use this command for E4406A, the appropriate mode should be selected with INSTrument:SELect.
For PSA you must be in the Basic, cdmaOne, cdma2000, 1xEV-DO, W-CDMA, GSM, EDGE, NADC, or PDC mode to use this command. Use
268 Chapter 4
NADC Programming CommandsSENSe Subsystem
NA
DC
Pro
gram
min
g C
om
man
ds
INSTrument:SELect to set the mode.
Waveform—Averaging Mode
[:SENSe]:WAVeform:AVERage:TCONtrol EXPonential|REPeat
[:SENSe]:WAVeform:AVERage:TCONtrol?
Select the type of termination control used for the averaging function. This determines the averaging action after the specified number of ‘sweeps’ (average count) is reached.
EXPonential - Each successive data acquisition after the average count is reached, is exponentially weighted and combined with the existing average.
REPeat - After reaching the average count, the averaging is reset and a new average is started.
Factory Preset: EXPonential
Remarks: To use this command for E4406A, the appropriate mode should be selected with INSTrument:SELect.
For PSA you must be in the Basic, cdmaOne, cdma2000, 1xEV-DO, W-CDMA, GSM, EDGE, NADC, or PDC mode to use this command. Use INSTrument:SELect to set the mode.
Waveform—Averaging Type
[:SENSe]:WAVeform:AVERage:TYPE LOG|MAXimum|MINimum|RMS|SCALar
[:SENSe]:WAVeform:AVERage:TYPE?
Select the type of averaging.
LOG - The log of the power is averaged. (This is also known as video averaging.)
MAXimum - The maximum values are retained.
MINimum - The minimum values are retained.
RMS - The power is averaged, providing the rms of the voltage.
Factory Preset: RMS
Remarks: To use this command for E4406A, the appropriate mode should be selected with INSTrument:SELect.
For PSA you must be in the Basic, cdmaOne, cdma2000, 1xEV-DO, W-CDMA, GSM, EDGE, NADC,
Chapter 4 269
NADC Programming CommandsSENSe Subsystem
NA
DC
Pro
gra
mm
ing
Co
mm
and
s
or PDC mode to use this command. Use INSTrument:SELect to set the mode.
Waveform—Resolution BW
[:SENSe]:WAVeform:BANDwidth|BWIDth[:RESolution] <freq>
[:SENSe]:WAVeform:BANDwidth|BWIDth[:RESolution]?
Set the resolution bandwidth. This value is ignored if the function is auto-coupled.
Factory Preset: 100.0 kHz for NADC, PDC, cdma2000, W-CDMA, Basic, Service (E4406A)500.0 kHz for GSM2.0 MHz for cdmaOne
Range: 1.0 kHz to 8.0 MHz when [:SENSe]:WAVeform:BANDwidth|BWIDth [:RESolution]:TYPE GAUSsian
1.0 kHz to 10.0 MHz when [:SENSe]:WAVeform:BANDwidth|BWIDth [:RESolution]:TYPE FLATtop
Remarks: To use this command for E4406A, the appropriate mode should be selected with INSTrument:SELect.
For PSA you must be in the Basic, cdmaOne, cdma2000, 1xEV-DO, W-CDMA, GSM, EDGE, NADC, or PDC mode to use this command. Use INSTrument:SELect to set the mode.
Bandwidths > 6.7 MHz will require a slight increase in measurement time.
Waveform - Query Actual Resolution Bandwidth
[:SENSe]:WAVeform:BANDwidth:RESolution]:ACTual?
Due to memory constraints the actual resolution bandwidth value may vary from the value entered by the user. For most applications the resulting difference in value is inconsequential but for some it is necessary to know the actual value; this query retrieves the actual resolution bandwidth value.
Remarks: To use this command for E4406A, the appropriate mode should be selected with INSTrument:SELect.
For PSA you must be in the Basic, cdmaOne, cdma2000, 1xEV-DO, W-CDMA, GSM, EDGE, NADC, or PDC mode to use this command. Use
270 Chapter 4

NADC Programming CommandsSENSe Subsystem
NA
DC
Pro
gram
min
g C
om
man
ds
INSTrument:SELect to set the mode.
History: E4406A:Version A.05.00 or later
Waveform—Resolution BW Filter Type
[:SENSe]:WAVeform:BANDwidth|BWIDth[:RESolution]:TYPE FLATtop|GAUSsian
[:SENSe]:WAVeform:BANDwidth|BWIDth[:RESolution]:TYPE?
Select the type of Resolution BW filter that is used. This is an Advanced control that normally does not need to be changed.
FLATtop - a filter with a flat amplitude response, which provides the best amplitude accuracy.
GAUSsian - a filter with Gaussian characteristics, which provides the best pulse response.
Factory Preset: GAUSsian
Remarks: To use this command for E4406A, the appropriate mode should be selected with INSTrument:SELect.
For PSA you must be in the Basic, cdmaOne, cdma2000, 1xEV-DO, W-CDMA, GSM, EDGE, NADC, or PDC mode to use this command. Use INSTrument:SELect to set the mode.
Waveform—Decimation of Waveform Display
[:SENSe]:WAVeform:DECimate[:FACTor] <integer>
[:SENSe]:WAVeform:DECimate[:FACTor]?
Set the amount of data decimation done on the IQ data stream. For example, if 4 is selected, three out of every four data points will be thrown away. So every 4th data point will be kept.
Factory Preset: 1
Range: 1 to 4
Remarks: To use this command for E4406A, the appropriate mode should be selected with INSTrument:SELect.
For PSA you must be in the Basic, cdmaOne, cdma2000, 1xEV-DO, W-CDMA, GSM, EDGE, NADC, or PDC mode to use this command. Use INSTrument:SELect to set the mode.
Chapter 4 271

NADC Programming CommandsSENSe Subsystem
NA
DC
Pro
gra
mm
ing
Co
mm
and
s
Waveform—Control Decimation of Waveform Display
[:SENSe]:WAVeform:DECimate:STATe OFF|ON|0|1
[:SENSe]:WAVeform:DECimate:STATe?
Set the amount of data decimation done by the hardware in order to decrease the number of acquired points in a long capture time. This is the amount of data that the measurement ignores.
Factory Preset: OFF
Remarks: To use this command for E4406A, the appropriate mode should be selected with INSTrument:SELect.
For PSA you must be in the Basic, cdmaOne, cdma2000, 1xEV-DO, W-CDMA, GSM, EDGE, NADC, or PDC mode to use this command. Use INSTrument:SELect to set the mode.
Waveform—Sweep (Acquisition) Time
[:SENSe]:WAVeform:SWEep:TIME <time>
[:SENSe]:WAVeform:SWEep:TIME?
Set the measurement acquisition time. It is used to specify the length of the time capture record.
Factory Preset: 2.0 ms
10.0 ms, for NADC, PDC
15.0 ms, for iDEN mode (E4406A)
Range: 1 µs to 100 s
Default Unit: seconds
Remarks: To use this command for E4406A, the appropriate mode should be selected with INSTrument:SELect.
For PSA you must be in the Basic, cdmaOne, cdma2000, 1xEV-DO, W-CDMA, GSM, EDGE, NADC, or PDC mode to use this command. Use INSTrument:SELect to set the mode.
Waveform—Trigger Source
[:SENSe]:WAVeform:TRIGger:SOURce EXTernal[1]|EXTernal2|FRAMe|IF|IMMediate|LINE|RFBurst
[:SENSe]:WAVeform:TRIGger:SOURce?
Select the trigger source used to control the data acquisitions.
272 Chapter 4
NADC Programming CommandsSENSe Subsystem
NA
DC
Pro
gram
min
g C
om
man
ds
EXTernal 1 - front panel external trigger input
EXTernal 2 - rear panel external trigger input
FRAMe - internal frame timer from front panel input
IF - internal IF envelope (video) trigger
IMMediate - the next data acquisition is immediately taken (also called free run)
LINE - internal line trigger
RFBurst - wideband RF burst envelope trigger that has automatic level control for periodic burst signals
Factory Preset: IMMediate (free run), for Basic, cdmaOne, NADC, PDC mode
RFBurst, for GSM, iDEN (E4406A) modes
Remarks: To use this command for E4406A, the appropriate mode should be selected with INSTrument:SELect.
For PSA you must be in the Basic, cdmaOne, cdma2000, 1xEV-DO, W-CDMA, GSM, EDGE, NADC, or PDC mode to use this command. Use INSTrument:SELect to set the mode.
Chapter 4 273

NADC Programming CommandsTRIGger Subsystem
NA
DC
Pro
gra
mm
ing
Co
mm
and
s
TRIGger SubsystemThe Trigger Subsystem is used to set the controls and parameters associated with triggering the data acquisitions. Other trigger-related commands are found in the INITiate and ABORt subsystems.
The trigger parameters are global within a selected Mode. The commands in the TRIGger subsystem set up the way the triggers function, but selection of the trigger source is made from each measurement. There is a separate trigger source command in the SENSe:<meas> subsystem for each measurement. The equivalent front panel keys for the parameters described in the following commands, can be found under the Mode Setup, Trigger key.
Automatic Trigger Control
:TRIGger[:SEQuence]:AUTO:STATe OFF|ON|0|1
:TRIGger[:SEQuence]:AUTO:STATe?
Turns the automatic trigger function on and off. This function causes a trigger to occur if the designated time has elapsed and no trigger occurred. It can be used with unpredictable trigger sources, like external or burst, to make sure a measurement is initiated even if a trigger doesn’t occur. Use TRIGger[:SEQuence]:AUTO[:TIME] to set the time limit.
Factory Presetand *RST Off for cdma2000, W-CDMA, NADC, PDC, 1xEV-DO
Front PanelAccess Mode Setup, Trigger, Auto Trig
Automatic Trigger Time
:TRIGger[:SEQuence]:AUTO[:TIME] <time>
:TRIGger[:SEQuence]:AUTO[:TIME]?
After the measurement is activated the instrument will take a data acquisition immediately upon receiving a signal from the selected trigger source. If no trigger signal is received by the end of the time specified in this command, a data acquisition is taken anyway. TRIGger[:SEQuence]:AUTO:STATE must be on.
Factory Preset: 100.0 ms
Range: 1.0 ms to 1000.0 s
0.0 to 1000.0 s for cdma2000, W-CDMA, 1xEV-DO
274 Chapter 4

NADC Programming CommandsTRIGger Subsystem
NA
DC
Pro
gram
min
g C
om
man
ds
Default Unit: seconds
Front PanelAccess Mode Setup, Trigger, Auto Trig
External Trigger Delay
:TRIGger[:SEQuence]:EXTernal[1]|2:DELay <time>
:TRIGger[:SEQuence]:EXTernal[1]|2:DELay?
Set the trigger delay when using an external trigger. Set the trigger value to zero (0) seconds to turn off the delay.
EXT or EXT1is the front panel trigger input.
EXT2 is the rear panel trigger input.
Factory Preset: 0.0 s
Range: − 100.0 ms to 500.0 ms
Default Unit: seconds
Front PanelAccess: Mode Setup, Trigger, Ext Rear (or Ext Front), Delay
External Trigger Level
:TRIGger[:SEQuence]:EXTernal[1]|2:LEVel <voltage>
:TRIGger[:SEQuence]:EXTernal[1]|2:LEVel?
Set the trigger level when using an external trigger input.
EXT or EXT1is the front panel trigger input
EXT2 is the rear panel trigger input
Factory Preset: 2.0 V
Range: − 5.0 to + 5.0 V
Default Unit: volts
Front PanelAccess: Mode Setup, Trigger, Ext Rear (or Ext Front), Level
External Trigger Slope
:TRIGger[:SEQuence]:EXTernal[1]|2:SLOPe NEGative|POSitive
Chapter 4 275

NADC Programming CommandsTRIGger Subsystem
NA
DC
Pro
gra
mm
ing
Co
mm
and
s
:TRIGger[:SEQuence]:EXTernal[1]|2:SLOPe?
Sets the trigger slope of an external trigger input to either NEGative or POSitive.
EXT or EXT1is the front panel trigger input.
EXT2 is the rear panel trigger input.
Factory Preset: Positive
Front PanelAccess: Mode Setup, Trigger, Ext Rear (or Ext Front), Slope
Frame Trigger Adjust
:TRIGger[:SEQuence]:FRAMe:ADJust <time>
Lets you advance the phase of the frame trigger by the specified amount. It does not change the period of the trigger waveform. If the command is sent multiple times, it advances the phase of the frame trigger more each time it is sent.
Factory Preset: 0.0 s
Range: 0.0 to 10.0 s
Default Unit: seconds
Front PanelAccess: None
Frame Trigger Period
:TRIGger[:SEQuence]:FRAMe:PERiod <time>
:TRIGger[:SEQuence]:FRAMe:PERiod?
Set the frame period that you want when using the external frame timer trigger. If the traffic rate is changed, the value of the frame period is initialized to the preset value.
Factory Preset: 250.0 µs for Basic, cdmaOne
4.615383 ms, for GSM
26.666667 ms for cdma2000 and 1xEV-DO
10.0 ms (1 radio frame) for W-CDMA
90.0 ms for iDEN (E4406A)
20.0 ms with rate=full for NADC, PDC
40.0 ms with rate=half for NADC, PDC
Range: 0.0 ms to 559.0 ms for Basic, cdmaOne, GSM,
276 Chapter 4
NADC Programming CommandsTRIGger Subsystem
NA
DC
Pro
gram
min
g C
om
man
ds
cdma2000, W-CDMA, 1xEV-DO
1.0 ms to 559.0 ms for iDEN (E4406A), NADC, PDC
Default Unit: seconds
Front PanelAccess: Mode Setup, Trigger, Frame Timer, Period
Frame Trigger Sync Source
:TRIGger[:SEQuence]:FRAMe:SYNC EXTFront|EXTRear|OFF
:TRIGger[:SEQuence]:FRAMe:SYNC?
Selects the input port location for the external frame trigger that you are using.
Factory Preset: Off
Remarks: You must be in the Basic, cdmaOne, EDGE (w/GSM), GSM, iDEN (E4406A), NADC, PDC, Service mode to use this command. Use INSTrument:SELect to set the mode.
Front PanelAccess: Mode Setup, Trigger, Frame Timer, Sync Source
History Changed firmware revision A.05.00.
Frame Trigger Synchronization Offset
:TRIGger[:SEQuence]:FRAMe:SYNC:OFFSet <time>
:TRIGger[:SEQuence]:FRAMe:SYNC:OFFSet?
Lets you adjust the frame triggering with respect to the external trigger input that you are using.
Factory Preset: 0.0 s
Range: 0.0 to 10.0 s
Default Unit: seconds
Remarks: You must be in the Basic, cdmaOne, GSM, EDGE, iDEN (E4406A), NADC, PDC, Service mode to use this command. Use INSTrument:SELect to set the mode.
History: Revision A.03.27 or later
Front PanelAccess: Mode Setup, Trigger, Frame Timer, Offset
Chapter 4 277
NADC Programming CommandsTRIGger Subsystem
NA
DC
Pro
gra
mm
ing
Co
mm
and
s
Trigger Holdoff
:TRIGger[:SEQuence]:HOLDoff <time>
:TRIGger[:SEQuence]:HOLDoff?
Set a value of the holdoff time between triggers. After a trigger, another trigger will not be allowed until the holdoff time expires. This parameter affects all trigger sources.
Factory Preset: 0.0 s
20.0 ms for iDEN (E4406A)
10.0 ms for NADC or PDC
Range: 0.0 to 500.0 ms
Default Unit: seconds
Front PanelAccess: Mode Setup, Trigger, Trigger Holdoff
Video (IF) Trigger Delay
:TRIGger[:SEQuence]:IF:DELay <time>
:TRIGger[:SEQuence]:IF:DELay?
Set a value of the trigger delay of the IF (video) trigger (signal after the resolution BW filter).
Factory Preset: 0.0 s
Range: − 100.0 ms to 500.0 ms
Default Unit: seconds
Front PanelAccess: Mode Setup, Trigger, Video (IF Envlp), Delay
Video (IF) Trigger Level
:TRIGger[:SEQuence]:IF:LEVel <ampl>
:TRIGger[:SEQuence]:IF:LEVel?
Set the trigger level when using the IF (video) trigger.
278 Chapter 4
NADC Programming CommandsTRIGger Subsystem
NA
DC
Pro
gram
min
g C
om
man
ds
Factory Preset: − 6.0 dBm for cdmaOne, GSM, EDGE, Basic, Service (E4406A), cdma2000, W-CDMA, 1xEV-DO
− 20.0 dBm for iDEN (E4406A)
− 30.0 dBm for NADC, PDC
Range: − 200.0 to 50.0 dBm
Default Unit: dBm
Front PanelAccess: Mode Setup, Trigger, Video (IF Envlp), Level
Video (IF) Trigger Slope
:TRIGger[:SEQuence]:IF:SLOPe NEGative|POSitive
:TRIGger[:SEQuence]:IF:SLOPe?
Sets the trigger slope when using the IF (video) trigger, to either NEGative or POSitive.
Factory Preset: Positive
Front PanelAccess: Mode Setup, Trigger, Video (IF Envlp), Slope
RF Burst Trigger Delay
:TRIGger[:SEQuence]:RFBurst:DELay <time>
:TRIGger[:SEQuence]:RFBurst:DELay?
Set the trigger delay when using the RF burst (wideband) trigger.
Factory Preset: 0.0 µs
Range: − 100.0 ms to 500.0 ms
Default Unit: seconds
Front PanelAccess: Mode Setup, Trigger, RF Burst, Delay
RF Burst Trigger Level
:TRIGger[:SEQuence]:RFBurst:LEVel <rel_power>
:TRIGger[:SEQuence]:RFBurst:LEVel?
Chapter 4 279

NADC Programming CommandsTRIGger Subsystem
NA
DC
Pro
gra
mm
ing
Co
mm
and
s
Set the trigger level when using the RF Burst (wideband) Trigger. The value is relative to the peak of the signal. RF Burst is also known as RF Envelope.
Factory Preset: − 6.0 dB
Range: − 25.0 to 0.0 dB
− 200.0 to 0.0 dB for NADC, PDC
Default Unit: dB
Front PanelAccess: Mode Setup, Trigger, RF Burst, Peak Level
RF Burst Trigger Slope
:TRIGger[:SEQuence]:RFBurst:SLOPe NEGative|POSitive
:TRIGger[:SEQuence]:RFBurst:SLOPe?
Set the trigger slope when using the RF Burst (wideband) Trigger.
Factory Preset: Positive
Remarks: You must be in the cdmaOne, cdma2000, W-CDMA mode to use this command. Use :INSTrument:SELect to set the mode.
Front PanelAccess: Mode Setup, Trigger, RF Burst, Slope
280 Chapter 4

NA
DC
and
PD
C C
on
cepts
5 NADC and PDC Concepts
This chapter provides details about the NADC and PDC communications systems, and explains how the various measurements are performed by the instrument. Suggestions for optimizing and troubleshooting your setup are provided, along with a list of related Agilent documents that are referenced for further information.
281

NADC and PDC ConceptsWhat is the NADC Communications System?
NA
DC
an
d P
DC
Co
nce
pts
What is the NADC Communications System?The North American Dual-Mode Cellular (NADC) is one of the cellular communications systems. NADC is also referred to as North American Digital Cellular, or American Digital Cellular (ADC). Occasionally it is also referred to as Digital Advanced Mobile Phone Service (D-AMPS) or NADC-TDMA.
The NADC communications system is defined in the Electronics Industry Alliance (EIA) and Telecommunication Industry Association (TIA) standard documents. The following is a list of all relevant and applicable standard documents:
• TIA/EIA IS-136.1
TDMA Cellular/PCS - Radio Interface - Mobile Station - Base Station Compatibility - Digital Control Channel
• TIA/EIA IS-136.2
TDMA Cellular/PCS - Radio Interface - Mobile Station - Base Station Compatibility - Traffic Channels and FSK Control Channel
• TIA/EIA IS-137
TDMA Cellular/PCS - Radio Interface - Minimum Performance Standards for Mobile Stations
• TIA/EIA IS-138
TDMA Cellular/PCS - Radio Interface - Minimum Performance Standards for Base Stations
• TIA/EIA-627
800 MHz Cellular System, TDMA Radio Interface, Dual-Mode Mobile Station - Base Station Compatibility Standard (ANSI/TIA/EIA-627-96), which replaced IS-54-B
• TIA/EIA-628
800 MHz Cellular System, TDMA Radio Interface, Minimum Performance Standards for Dual-Mode Mobile Stations (TIA/EIA-628-96), which replaced IS-55-A
• TIA/EIA-629
800 MHz Cellular System, TDMA Radio Interface, Minimum Performance Standards for Base Stations Supporting Dual-Mode Mobile Stations (ANSI/TIA/EIA-629-96), which replaced IS-56-A
Each base station retains the analog control channels and analog traffic channels of the advanced mobile phone service (AMPS) system. In addition, a base station can have digital traffic channels. The mobile stations are dual mode and access the network through the analog
282 Chapter 5

NADC and PDC ConceptsWhat is the NADC Communications System?
NA
DC
and
PD
C C
on
cepts
control channel. They are capable of using either analog or digital traffic channel. Digital control channel and digital only mobile stations are also currently being produced.
The AMPS system and the analog part of the NADC IS-54 system employ a frequency division multiple access (FDMA). FDMA means that each traffic channel is assigned to a separate RF frequency. A pair of frequencies, 45 MHz apart (80 MHz apart for 1900 MHz band), is used to provide full duplex operation of the NADC system. The RF channel spacing is 30 kHz. The modulation for the analog portion is frequency modulation (FM).
The digital part of the NADC system employs a combination of FDMA and time division multiple access (TDMA). The NADC time division multiple access structure allows up to six users to share a single carrier frequency. The TDMA frame structure divides time on a carrier into a stream of frames. Each frame is 40 ms long consisting of 6 timeslots; thus, one timeslot is 6.67 ms long. A digital traffic channel is defined by a carrier frequency (or channel number) and a timeslot number. Each user must transmit data only on his carrier frequency, at a time defined by timeslot number. Currently, 2 timeslots per frame are required for each user because more time is required to transmit voice using full-rate speech codecs presently available. When half-rate speech codecs are incorporated into the system, each traffic channel will require just one timeslot per frame.
NADC digital mobile stations transmit a burst of data when their assigned timeslot occurs. This means a mobile station transmits a bursted amplitude modulation signal, ramping transmission power on and off. An NADC digital base station transmits continuously, switching digital modulation on at the appropriate timeslots.
The digital modulation format used in the NADC system is the π/4 differential quadrature phase shift keying (π/4 DQPSK). The π/4 DQPSK modulation causes both phase and amplitude variations on the RF signal. The quadrature nature of this modulation allows 2 bits to be transmitted at the same time on orthogonal carriers. These 2 bits make one NADC symbol. The digital modulation operates at 162 symbols, or 324 bits in each timeslot. Since there are 1944 bits in 6 timeslots and 25 frames in one second, the transmission bit rate is 48,600 bits per second.
The key objectives of the NADC system are to increase the subscriber capacity, provide more secure voice communications, and be backwards compatible with the existing AMPS analog cellular system.
Since the system transmits all information in a digital form, it will be much harder to listen to someone else’s cellular phone conversation. This is a key benefit for people using cellular phones that convey confidential information. The NADC is backwards compatible with the existing AMPS system so that analog cellular phones would not be obsolete. Therefore, all NADC mobiles have the capability to operate
Chapter 5 283

NADC and PDC ConceptsWhat is the NADC Communications System?
NA
DC
an
d P
DC
Co
nce
pts
.000 MHz
.000 MHz
using the existing analog base stations as well as the digital base stations.
Following is a summary of the NADC air interface. Note that the frequency range is the same as the analog cellular. Since it is a dual-mode system, NADC will use the same frequency band currently assigned to the AMPS cellular. The available channels are divided into analog and digital channels. The channel spacing is 30 kHz each, and the RX/TX frequency difference is 45 MHz as in the AMPS cellular. NADC has a RX/TX time spacing of 1.85 ms. It uses the π/4 DQPSK modulation and the modulation rate is 24.3 ksymbols/sec. NADC will initially allow 3 users per frequency pair and will allow 6 when implemented with the half-rate voice coder. One frame is 40 ms and consists of 6 timeslots that are each 6.667 ms long. There are 162 symbols per timeslot and the symbol period is 41.16 µs.
Uplink 825.030 to 848.970 MHz 824.040 to 825
800 MHz Downlink 870.030 to 893.970 MHz 869.040 to 870
Channel Numbers 1 to 799 991 to 1023
Uplink 1850.040 to 1909.920 MHz
1900 MHz Downlink 1930.080 to 1989.990 MHz
Channel Numbers 2 to 1998
284 Chapter 5

NADC and PDC ConceptsWhat is the PDC Communications System?
NA
DC
and
PD
C C
on
cepts
What is the PDC Communications System?Personal Digital Cellular (PDC) is one of the cellular communications systems.
The PDC communications system is defined in the Research and Development Center for Radio Systems document, RCR STD-27, the Personal Digital Cellular Telecommunication System Standard.
The PDC system is a digital communications system that employs a combination of a frequency division multiple access (FDMA) and a time division multiple access (TDMA). A pair of frequencies (130 or 50 MHz apart in the 800 MHz bands and 48 MHz apart in the 1500 MHz band) is used to provide the full duplex operation with RF channels spacing 50 kHz each with interleaving by 25 kHz.
One TDMA frame is structured with 6 timeslots, so each channel frequency can support up to 6 timeslots. Currently, two timeslots of each frame are used for one traffic channel, which is required for the full-rate speech codec. When half-rate speech codecs are incorporated into the system, each traffic channel will require just one timeslot per frame. One frame is 40 ms long and each timeslot is 6.667 ms long. Thus, the mobile stations have burst carriers that are turned on for two timeslots (full-rate codec) or one timeslot (half-rate codec). When an RF channel is in use by a digital base station, the base station carrier will be turned on for one entire frame. This is true even if only one traffic channel is in use on that RF channel. However, the carrier power can be different at each timeslot.
The digital modulation format used in the PDC system is π/4 differential quadrature phase shift keying (π/4 DQPSK). The π/4 DQPSK modulation causes both phase and amplitude variations on the RF signal. The quadrature nature of this modulation allows 2 bits to be transmitted at the same time on orthogonal carriers. There are 140 symbol periods in each timeslot, and each symbol contains 2 bits of information. Therefore, there are 280 bits in each timeslot. Since there are 1,680 bits in 6 timeslots and 25 frames in one second, the transmission bit rate is 42,000 bits per second.
800 MHz Uplink 940 to 958 MHz 887 to 889 MHz
Downlink 810 to 828 MHz 832 to 834 MHz
800 MHz Uplink 898 to 901 MHz 915 to 940MHz
Downlink 843 to 846 MHz 860 to 885 MHz
1500 MHz Uplink 1429 to 1453 MHz
Downlink 1477 to 1501 MHz
Chapter 5 285

NADC and PDC ConceptsAdjacent Channel Power Measurement Concepts
NA
DC
an
d P
DC
Co
nce
pts
Adjacent Channel Power Measurement Concepts
Purpose
To maintain a quality call by avoiding channel interference, it is quite important to measure and reduce an adjacent channel power (ACP) transmitted from a mobile phone. The characteristics of adjacent channel power are mainly determined by the transmitter design, including a digital filter called a root Nyquist filter.
For NADC, adjacent channel power is defined by the standard as the total power within the defined bandwidth, centered at ∆f kHz offset from the carrier frequency. The carrier is modulated by the standard coding test signal which has the same coding speed as the NADC modulation signal. The following specifications from the TIA/EIA IS-136, IS-137 and IS-138 standards apply to both base stations and mobile stations:
(1) At ± 30 kHz offsets: Less than − 26 dBc
(2) At ± 60 kHz offsets: Less than − 45 dBc
(3) At ± 90 kHz offsets: Less than − 45 dBc or − 13 dBm, whichever is the lowest power
For Tx power >50 W: − 60 dBc
For PDC, adjacent channel power is defined by the standard as the total power within the defined bandwidth, centered at ∆f kHz offset from the carrier frequency. The carrier is modulated by the standard coding test signal which has the same coding speed as the PDC modulation signal. The following specifications from the RCR STD-27 standards apply to both base stations and mobile stations:
(1) At ± 50 kHz offset: Less than − 45 dB
(2) At ± 100 kHz offset: Less than − 60 dB
Measurement Method
This measurement analyzes the total power levels within the defined bandwidth at given offset frequencies on both sides of the carrier frequency using Fast Fourier Transform (FFT).
When measuring NADC signals, if Offset Power is set to Integ (integration), the total power within the 32.8 kHz bandwidth, using the root-raised cosine weighting filter, is measured at each offset frequency. The equivalent 3 dB bandwidth is 24.3 kHz. If Offset Power is set to Peak, the total peak power is measured with 1 kHz resolution
286 Chapter 5

NADC and PDC ConceptsAdjacent Channel Power Measurement Concepts
NA
DC
and
PD
C C
on
cepts
bandwidth through the entire NADC bandwidth of 30 kHz.
For PDC signals, the ACP measurement analyzes the total power levels within the defined bandwidth of 21.0 kHz at given offset frequencies on both sides of the carrier frequency using Fast Fourier Transform (FFT).
The measurement functions, such as averaging, trigger source, limit test, offsets and limits, need to be set up to make a measurement and pass/fail test based on the channel width and weighting prescribed in the related standard. The test result is displayed in either a bar graph window or spectrum window. Both the absolute power levels and the power levels relative to the center power band are displayed in the text window. When Spectrum View is selected, the vertical scale can be varied for your optimum observation by pressing the AMPLITUDE Y Scale front-panel key.
Troubleshooting Hints
The adjacent channel power measurements suggest to us numerous faults in the transmitter section of the UUT, as follows:
(1) Faults caused by a malfunction of the baseband circuitry consisting of a code generator, a digital filter, digital-to-analog converters, 90-degree phase shifter, and I/Q modulators.
(2) Faults due to high phase noise levels from the local oscillators.
(3) Faults due to excessive noise floor levels from the up-converter, output amplifier, and/or analog filters.
Chapter 5 287

NADC and PDC ConceptsError Vector Magnitude (EVM) Measurement Concepts
NA
DC
an
d P
DC
Co
nce
pts
Error Vector Magnitude (EVM) Measurement Concepts
Purpose
Phase and frequency errors are the measures of modulation quality for NADC and PDC systems. Since NADC and PDC both use the π/4 DQPSK modulation technique, the phase and frequency accuracies of the transmitter are critical to the communications system performance and ultimately affect range.
NADC and PDC receivers rely on the phase and frequency quality of the π/4 DQPSK modulation signal in order to achieve the expected carrier to noise ratio. A transmitter with high phase and frequency errors will often still be able to support phone calls during a functional test. However, it will tend to provide difficulty for mobiles trying to maintain service at the edge of the cell with low signal levels or under difficult fading and Doppler conditions.
Measurement Method
The phase error of the unit under test is measured by computing the difference between the phase of the transmitted signal and the phase of a theoretically perfect signal.
The instrument samples the transmitter output in order to capture the actual phase trajectory. This is then demodulated and the ideal phase trajectory is mathematically derived. Subtracting one from the other results in an error signal.
For base stations, the NADC and PDC standards specify that the phase error should not exceed 5 degrees rms or 20 degrees peak, and that the mean frequency error across the burst must not exceed 0.05 ppm. These specifications hold true for normal and extreme temperature conditions, and with exposure to vibration.
This measurement allows you to display these errors numerically and graphically on the instrument display. There are graphs for EVM, Phase Error and Mag Error in the graph windows. In the text window, there are EVM: in % rms, in % peak at the highest symbol number, in % rms on the first 10 symbols (only when Device is MS), Mag Error: in % rms, Phase Error: in degrees, Freq Error: in Hz, and I/Q Offset: in dB.
288 Chapter 5
NADC and PDC ConceptsError Vector Magnitude (EVM) Measurement Concepts
NA
DC
and
PD
C C
on
cepts
Troubleshooting Hints
First use the Spectrum (frequency domain) measurement to verify that the signal is present and approximately centered on the display.
Poor phase error indicates a problem at the I/Q baseband generator, filters, modulator, or a combination of these, in the transmitter circuitry. The output amplifier in the transmitter can also create distortion that causes unacceptably high phase error. In a real system, poor phase error will reduce the ability of a receiver to correctly demodulate the signal, especially in marginal signal conditions.
Chapter 5 289

NADC and PDC ConceptsOccupied Bandwidth Measurement Concepts
NA
DC
an
d P
DC
Co
nce
pts
Occupied Bandwidth Measurement Concepts
Purpose
To utilize the limited resource of radio frequency bands to provide as many communication channels as possible, it is critical to measure and control the occupied bandwidth transmitted from a mobile phone. This occupied bandwidth is defined as the frequency bandwidth in which 99% of the total power is measured.
The occupied bandwidth of a mobile phone tends to be improved if its adjacent channel power is reduced. To provide as many channels as possible to meet the increasing number of subscribers, both of these characteristics of a mobile phone need to be measured and analyzed for further performance improvement.
Measurement Method
This measurement is made to analyze the frequency bandwidth in which 99% of the total power is measured, based on Fast Fourier Transform (FFT) theory.
In the actual measuring process, first the total channel power is measured using a sampling method. Then each power sample is integrated up to 0.5% of the total power from the lowest and highest frequency sides to determine the low and high limit frequencies. The difference derived from these frequencies is the occupied bandwidth.
The measurement functions, such as averaging, trigger source, limit test, and limit, need to be set up to make a measurement and pass or fail test. The test results are displayed in the graphic window and in the text window.
Troubleshooting Hints
The occupied bandwidth measurements can suggest some defective parts in the I/Q modulator section of the UUT.
290 Chapter 5
NADC and PDC ConceptsSpectrum (Frequency Domain) Measurement Concepts
NA
DC
and
PD
C C
on
cepts
Spectrum (Frequency Domain) Measurement Concepts
Purpose
The spectrum measurement provides spectrum analysis capability for the instrument. The control of the measurement was designed to be familiar to those who are accustomed to using swept spectrum analyzers.
This measurement is FFT (Fast Fourier Transform) based. The FFT-specific parameters are located in the Advanced menu. Also available under basic mode spectrum measurements is anI/Q window, which shows the I and Q signal waveforms in parameters of voltage versus time. The advantage of having an I/Q view available while in the spectrum measurement is that it allows you to view complex components of the same signal without changing settings or measurements.
Measurement Method
The measurement uses digital signal processing to sample the input signal and convert it to the frequency domain. With the instrument tuned to a fixed center frequency, samples are digitized at a high rate, converted to I and Q components with DSP hardware, and then converted to the frequency domain with FFT software.
For E4406A Option B7C, this measurement is available for both the RF input and baseband I/Q inputs. For details on Baseband I/Q operation see the section on “Using Option B7C Baseband I/Q Inputs”.
Troubleshooting Hints
Changes made by the user to advanced spectrum settings, particularly to ADC range settings, can inadvertently result in spectrum measurements that are invalid and cause error messages to appear. Care needs to be taken when using advanced features.
Chapter 5 291
NADC and PDC ConceptsWaveform (Time Domain) Measurement Concepts
NA
DC
an
d P
DC
Co
nce
pts
Waveform (Time Domain) Measurement Concepts
Purpose
The waveform measurement is a generic measurement for viewing the input signal waveforms in the time domain. This measurement is how the instrument performs the zero span functionality found in traditional spectrum analyzers.
Basic mode waveform measurement data may be displayed using either a Signal Envelope window, or an I/Q window which shows the I and Q signal waveforms in parameters of voltage versus time. The advantage of having an I/Q view available while making a waveform measurement is that it allows you to view complex components of the same signal without changing settings or measurements.
For E4406A, an I/Q Polar display is also available to view the I and Q waveforms in a polar plot. This display shows the instantaneous relationship between the I and Q waveform voltages.
The waveform measurement can be used to perform general purpose power measurements in the time domain with excellent accuracy.
Measurement Method
The instrument makes repeated power measurements at a set frequency, similar to the way a swept-tuned spectrum analyzer makes zero span measurements. The input analog signal is converted to a digital signal, which then is processed into a representation of a waveform measurement. The measurement relies on a high rate of sampling to create an accurate representation of a time domain signal.
For E4406A with Option B7C, this measurement is available for use with both the RF input and baseband I/Q inputs. For details on Baseband I/Q operation see the section on “Using Option B7C Baseband I/Q Inputs”.
292 Chapter 5

NADC and PDC ConceptsOther Sources of Measurement Information
NA
DC
and
PD
C C
on
cepts
Other Sources of Measurement InformationAdditional measurement application information is available through your local Agilent Technologies sales and service office. The following application notes explain digital communications measurements in much greater detail than discussed in this guide.
• Application Note 1298Digital Modulation in Communications Systems - An Introductionpart number 5965-7160E
• Application Note 1324Understanding PDC and NADC Transmitter Measurements for Base Transceiver Stations and Mobile Stationspart number 5968-5537E
Instrument Updates at www.agilent.com
These web locations can be used to access the latest information about the instrument, including the latest firmware version.
http://www.agilent.com/find/psa
http://www.agilent.com/find/vsa
Chapter 5 293

NADC and PDC ConceptsOther Sources of Measurement Information
NA
DC
an
d P
DC
Co
nce
pts
294 Chapter 5

NA
DC
Men
u M
aps
6 NADC Menu Maps
These menu maps are in alphabetical order by the front panel key label or oval cross-reference label. You can locate detailed information about each key/function at the page number listed in the figure title for each menu.
295

NADC Menu MapsNADC Measurement Key Flow
NA
DC
Men
u M
aps
NADC Measurement Key FlowThe key flow diagrams, shown in a hierarchical manner on the following pages, will help the user to grasp the overall functional relationships for the front-panel keys and the softkeys displayed at the extreme right side of the screen. The diagrams are:
“Mode Setup / Frequency Channel Key Flow” on page 297“ACP Measurement Key Flow” on page 298“EVM Measurement Key Flow” on page 299“Spectrum Measurement Key Flow (1 of 3)” on page 300“Waveform Measurement Key Flow (1 of 2)” on page 303
Use these flow diagrams as follows:
1. There are some basic conventions:An oval represents one of the front-panel keys.This box represents one of the softkeys displayed.Default conditions are shown as much as possible (underlined).2. Start from the extreme upper left corner of each measurement diagram to the right direction.3. Proceed from the top to the bottom.4. When defining a key from auto to manual, for example, just press that key one time.5. When entering a numeric value of Frequency, for example, use the numeric keypad by terminating with the appropriate unit selection from the keys displayed.6. When entering a numeric value of Slot, for example, use the numeric keypad by terminating with the Enter front-panel key.7. Instead of using the numeric keypad to enter a value, it may be easier to use the RPG knob or Up/Down keys depending on the input field of a parameter.
Mode Setup
Radio
Device BS | MS
296 Chapter 6
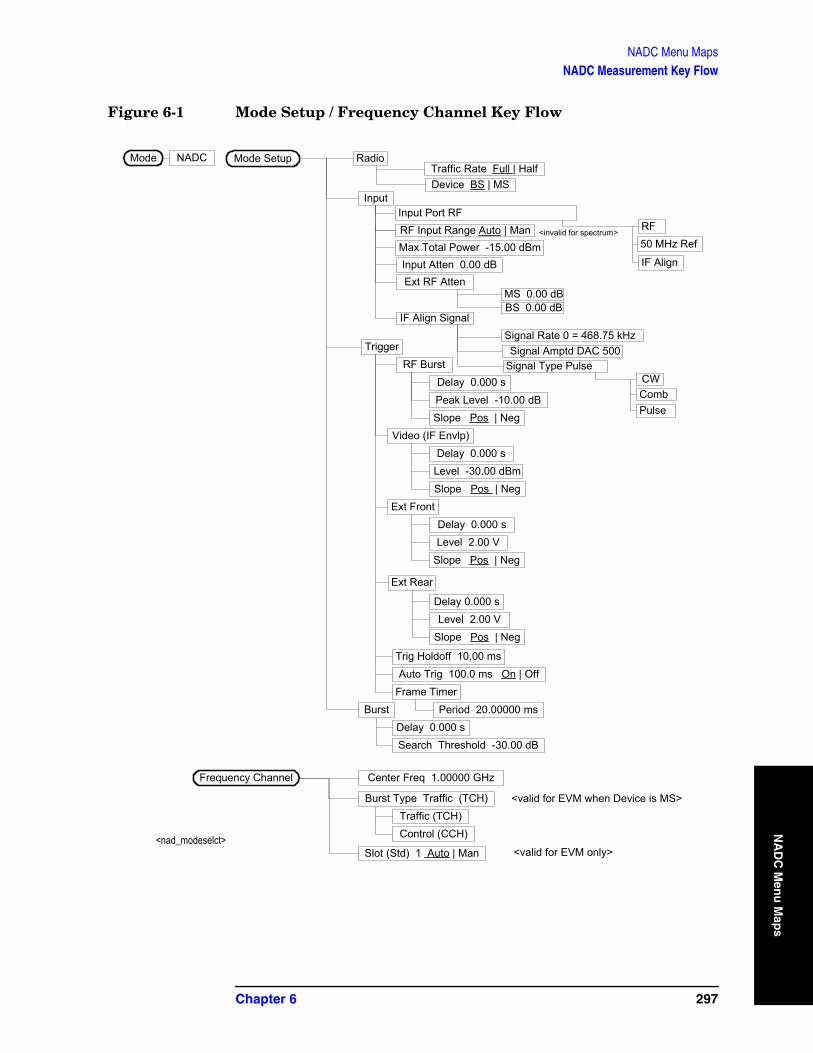
NADC Menu MapsNADC Measurement Key Flow
NA
DC
Men
u M
aps
Figure 6-1 Mode Setup / Frequency Channel Key Flow
Mode NADC RadioTraffic Rate Full | HalfDevice BS | MS
Input
Mode Setup
Signal Type Pulse
RF Input Range Auto | ManMax Total Power -15.00 dBmInput Atten 0.00 dB
<invalid for spectrum>
Ext RF AttenMS 0.00 dBBS 0.00 dB
IF Align Signal
Signal Amptd DAC 500
Input Port RFRF
IF Align
50 MHz Ref
CW
PulseComb
<nad_modeselct>
BurstDelay 0.000 sSearch Threshold -30.00 dB
Center Freq 1.00000 GHz
Burst Type Traffic (TCH)Traffic (TCH)Control (CCH)
Slot (Std) 1 Auto | Man
Frequency Channel
<valid for EVM when Device is MS>
<valid for EVM only>
TriggerRF Burst
Delay 0.000 sPeak Level -10.00 dBSlope Pos | Neg
Video (IF Envlp)Delay 0.000 s
Level -30.00 dBmSlope Pos | Neg
Ext FrontDelay 0.000 sLevel 2.00 V
Slope Pos | Neg
Ext Rear
Delay 0.000 sLevel 2.00 V
Slope Pos | Neg
Trig Holdoff 10.00 msAuto Trig 100.0 ms On | Off
Frame TimerPeriod 20.00000 ms
Signal Rate 0 = 468.75 kHz
Chapter 6 297
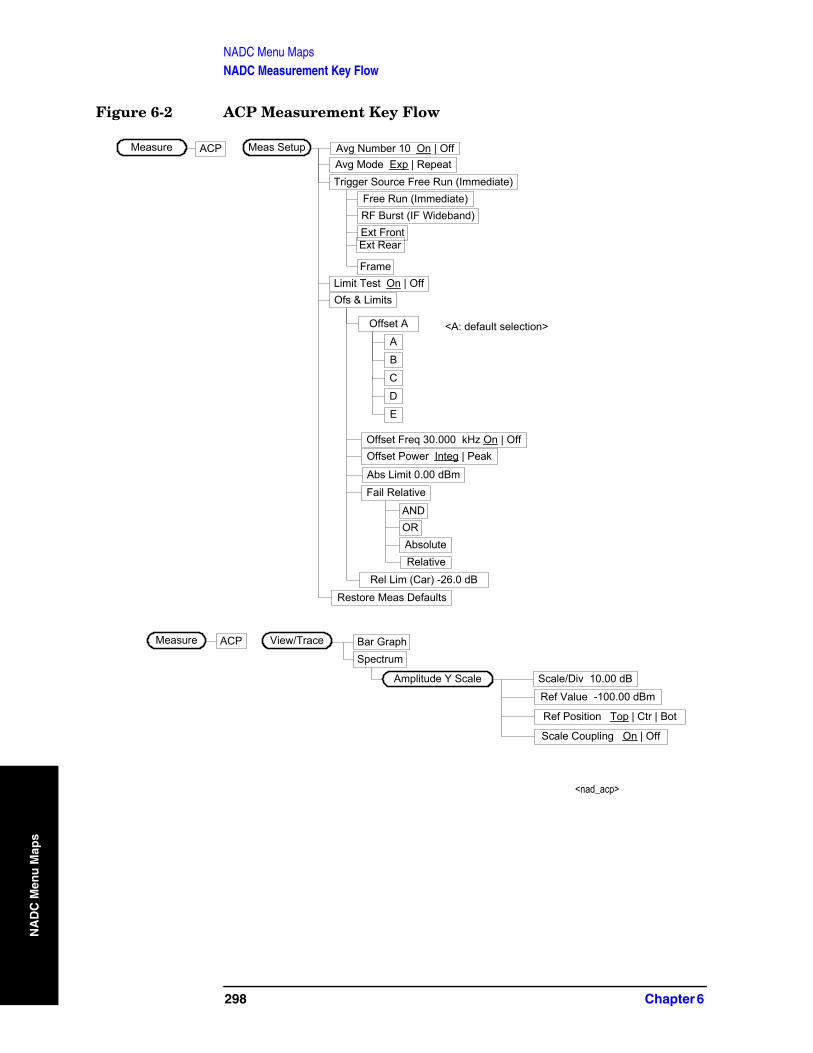
NADC Menu MapsNADC Measurement Key Flow
NA
DC
Men
u M
aps
Figure 6-2 ACP Measurement Key Flow
ACP Avg Number 10 On | OffAvg Mode Exp | RepeatTrigger Source Free Run (Immediate)
Free Run (Immediate) RF Burst (IF Wideband)Ext FrontExt Rear
FrameLimit Test On | OffOfs & Limits
Measure Meas Setup
Bar Graph
Scale/Div 10.00 dB
Ref Value -100.00 dBm
Ref Position Top | Ctr | Bot
Scale Coupling On | Off
ACPMeasure View/Trace
Amplitude Y Scale
<nad_acp>
Offset Freq 30.000 kHz On | OffOffset Power Integ | Peak
Fail Relative
ANDORAbsoluteRelative
Rel Lim (Car) -26.0 dB
Abs Limit 0.00 dBm
Restore Meas Defaults
Offset A
A
C
B
D
E
<A: default selection>
Spectrum
298 Chapter 6

NADC Menu MapsNADC Measurement Key Flow
NA
DC
Men
u M
aps
Figure 6-3 EVM Measurement Key Flow
EVM Avg Number 10 On | OffAvg Mode Exp | RepeatTrig Source Free Run (Immediate)
Free Run (Immediate)Video (IF Envlp)RF Burst (IF Wideband)Ext FrontExt RearFrame
Burst Sync NoneSync WordRF AmptdNone
Limit Test On | OffLimits
RMS EVM 12.5 PcntPeak EVM 40.0 Pcnt
Origin Offset -20.00 dBRestore Meas Defaults
I/Q Measured Polar VectorI/Q Measured Polar ConstlnI/Q Error (Quad-View)
Scale/Div 16.10 SymRef Value 0.000 SymRef Position Left | Ctr | RightScale Coupling On | OffScale/Div 0.0100 Pcnt
Ref Value 0.00 PcntRef Position Top | Ctr | Bot
Scale Coupling On | Off
Pts/Symb Displayed 1 | 5Symbol Dots On | Off
Meas SetupMeasure
View/Trace
Display
EVMMeasure
EVMMeasure
First 10 EVM (MS only) 25.0 Pcnt
Span X Scale
Amplitude Y Scale
<nad_evm>
Chapter 6 299
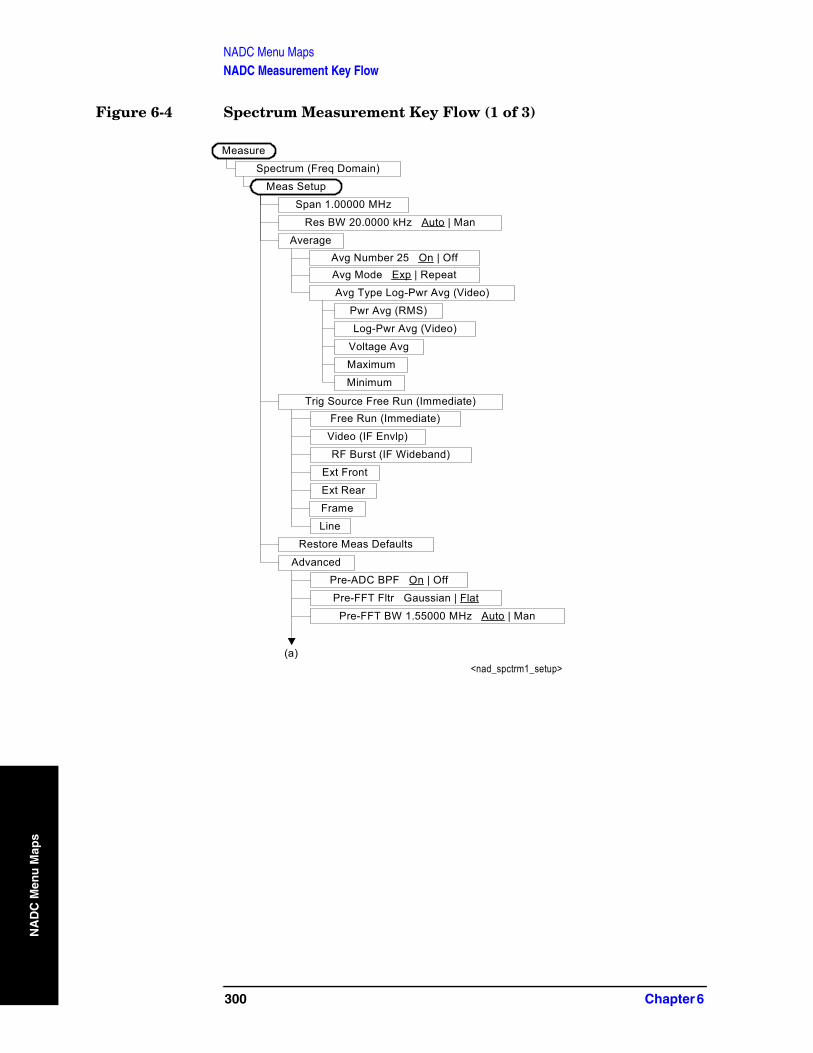
NADC Menu MapsNADC Measurement Key Flow
NA
DC
Men
u M
aps
Figure 6-4 Spectrum Measurement Key Flow (1 of 3)
Spectrum (Freq Domain)
Span 1.00000 MHz
Avg Mode Exp | Repeat
Avg Type Log-Pwr Avg (Video)
Res BW 20.0000 kHz Auto | Man
Avg Number 25 On | Off
Pwr Avg (RMS)
Log-Pwr Avg (Video)
Voltage Avg
Maximum
Minimum
Trig Source Free Run (Immediate)Free Run (Immediate)
Video (IF Envlp)
RF Burst (IF Wideband)
Ext Front
Ext Rear
Frame
Line
Restore Meas Defaults
Advanced
Pre-ADC BPF On | Off
Pre-FFT Fltr Gaussian | Flat
Pre-FFT BW 1.55000 MHz Auto | Man
Measure
Meas Setup
(a)
Average
<nad_spctrm1_setup>
300 Chapter 6
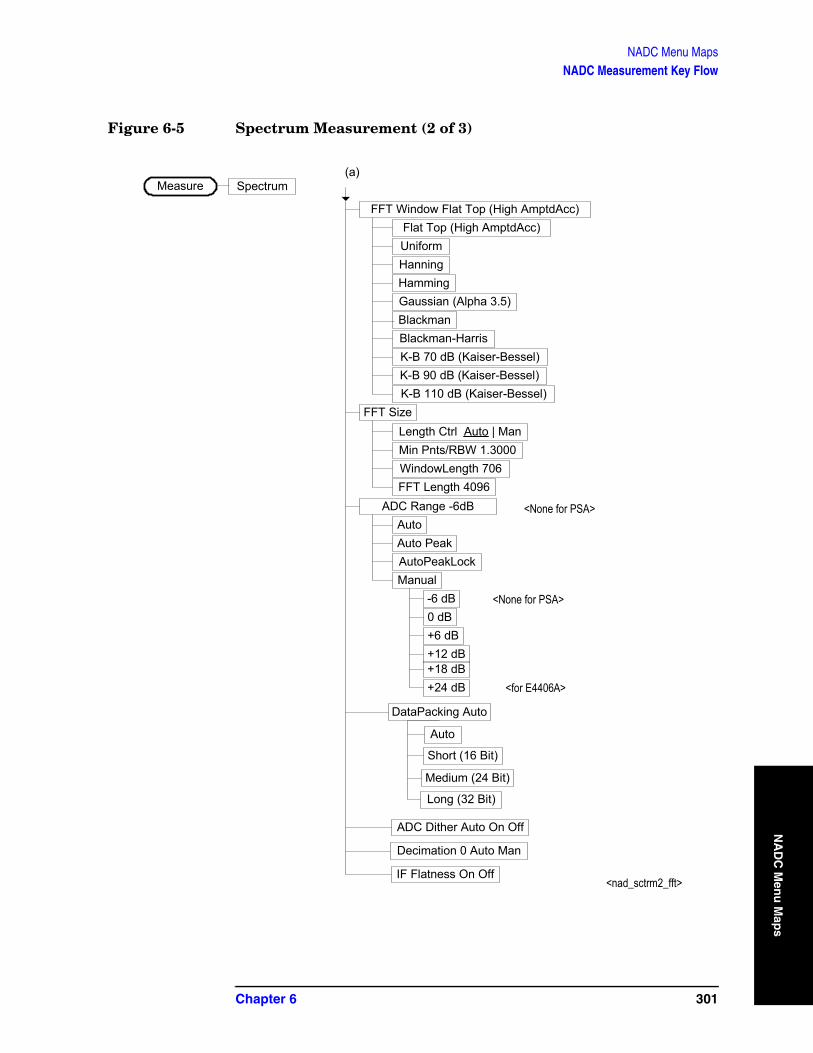
NADC Menu MapsNADC Measurement Key Flow
NA
DC
Men
u M
aps
Figure 6-5 Spectrum Measurement (2 of 3)
(a)
FFT Window Flat Top (High AmptdAcc)Flat Top (High AmptdAcc) UniformHanningHammingGaussian (Alpha 3.5)BlackmanBlackman-HarrisK-B 70 dB (Kaiser-Bessel)K-B 90 dB (Kaiser-Bessel)K-B 110 dB (Kaiser-Bessel)
FFT SizeLength Ctrl Auto | ManMin Pnts/RBW 1.3000WindowLength 706FFT Length 4096
ADC Range -6dB
Measure Spectrum
AutoAuto PeakAutoPeakLockManual
-6 dB0 dB+6 dB+12 dB+18 dB+24 dB
IF Flatness On Off
Decimation 0 Auto Man
ADC Dither Auto On Off
DataPacking Auto
Auto
Short (16 Bit)
Medium (24 Bit)
Long (32 Bit)
<nad_sctrm2_fft>
<None for PSA>
<None for PSA>
<for E4406A>
Chapter 6 301

NADC Menu MapsNADC Measurement Key Flow
NA
DC
Men
u M
aps
Figure 6-6 Spectrum Measurement (3 of 3)
Spectrum
I/Q Waveform
Trace Display All
AllAverage (or Max & Min)Current
Select 1 | 2 | 3 | 4NormalDeltaFunction Off
Band PowerNoiseOff
Trace SpectrumSpectrum
I/Q WaveformOffShape Diamond
DiamondLineSquareCross
Marker All Off
SpectrumMeasure View/Trace
MarkerSpectrumMeasure
Span 1.00000 MHz
Scale/Div 10.00 dBRef Value 0.00 dBm Ref Position Top | Ctr | Bot Scale Coupling On | Off
Span X Scale
Amplitude Y Scale
Scale/Div 18.8 usRef Value 0.00 s Ref Position Left | Ctr | Right Scale Coupling On | Off
Scale/Div 60.0 mVRef Value 0.00 V Ref Position Top | Ctr | Bot Scale Coupling On | Off
Span X Scale
Amplitude Y Scale
Spectrum Avg
<nad_spctrm3_vwtrc>
302 Chapter 6

NADC Menu MapsNADC Measurement Key Flow
NA
DC
Men
u M
aps
Figure 6-7 Waveform Measurement Key Flow (1 of 2)
Sweep Time 10.00 msRes BW 100.000 kHzAverage
Avg Number 10 On | OffAvg Mode Exp | RepeatAvg Type Pwr Avg (RMS)
Pwr AvgLog-Pwr Avg (Video)Voltage AvgMaximumMinimum
Trig Source Free Run (Immediate)
Measure
Meas Setup
Waveform (Time Domain)
<nad_wvform1_setup>
Free Run (Immediate)Video (IF Envlp)RF Burst (IF Wideband)Ext FrontExt RearFrameLine
Restore Meas DefaultsAdvanced
Pre-ADC BPF On | OffRBW Filter Gaussian | FlatADC Range -6 dB
AutoAuto PeakAutoPeakLockManual
-6 dB0 dB+6 dB+12 dB+18 dB+24 dB
<None for PSA>
<None for PSA>
<for E4406A>
Chapter 6 303

NADC Menu MapsNADC Measurement Key Flow
NA
DC
Men
u M
aps
Figure 6-8 Waveform Measurement Key Flow (2 of 2)
RF Envelope
I/Q Waveform
View/Trace
Span X Scale Scale/Div 100.0usRef Value 0.00 sRef Position Left | Ctr | RightScale Coupling On | Off
Amplitude Y Scale Scale/Div 10.00 dBRef Value 0.00 dBRef Position Top | Ctr | BotScale Coupling On | Off
Span X Scale Scale/Div 1.00 msRef Value 0.00 sRef Position Left | Ctr | RightScale Coupling On | Off
Amplitude Y Scale Scale/Div 100.0 mV
Ref Value 0.00 VRef Position Top | Ctr | BotScale Coupling On | Off
Measure
Waveform (Time Domain)
Select 1 | 2 | 3 | 4NormalDeltaFunction Off
Band PowerNoiseOff
Trace RF EnvelopeRF Envelope
I/Q WaveformOffShape Diamond
DiamondLineSquareCross
Marker All Off
Marker
<nad_wvform2_vwtrc>
<Signal Envelope for E4406A>
<Signal Envelope for E4406A>
304 Chapter 6

Index
Ind
ex
Aabsolute limit
ACP, 236ACP
absolute limits, 236limit testing, 160, 237offset frequencies, 238relative limits, 238trigger source, 239view of data, 188
ACP Meas Setup keys, 298ACP View/Trace keys, 298ACPR
testing choices, 240acquisition packing
WAVeform, 266active license key, 25
how to locate, 25ADC Corr key, 116, 135ADC Dither key
spectrum measurement, 121ADC dithering
SPECtrum, 251WAVeform, 266
ADC filterWAVeform, 266
ADC rangeSPECtrum, 252WAVeform, 267
ADC Range keyspectrum measurement, 120
ADC ranging functionautomatic control, 138automatic peak control, 138automatic peak lock, 138manual control, 138
adjacent channel powerkey reference, 95measuring, 46, 111, 286, 288,
290adjacent channel power
measurement, 235adjacent channel power ratio
measurement, 214, 235See also ACPR
Advanced menuspectrum, 119waveform
waveformadvanced set-
tings, 137advanced menu
ADC dither, 138ADC ranging function, 138decimation, 138pre-ADC bandpass filter, 138
resolution bandwidth filter, 138Amp Y Scale keys
Waveform, 303amplitude
input range, 248maximizing input signal, 248
Analog Filter key, 116, 135applications
currently available, 204applications, selecting, 204, 206ASCII data format, 200attenuation
setting, 248averaging
ACP, 235, 236ACPR, 235, 236EVM, 244SPECtrum, 253, 254transmit band spurs, 268WAVeform, 268, 269
Bbandwidth
SPECtrum, 257, 258WAVeform, 270, 271
base stationloss correction, 243
base station testing, 250basic mode, 82binary data order, 200Block Size key, 135burst synchronization, 245burst trigger
level, 279byte order of data, 200
Ccaptured data block size
(wideband IF), 135captured data sample rate
(wideband IF), 135CDMA measurement, 235cdma2000 measurement, 214,
235cdmaOne measurement, 214changing
instrument settings, 235Choose Option key, 24code, programming
compatibility across PSA modes, 155, 157
compatibility, PSA series versus VSA, 158
commandscompatibility across PSA modes,
155, 157CONFigure, 211
FETCh, 211MEASure, 210PSA series versus VSA
compatibility, 158READ, 212
compatibility, programmingacross PSA modes, 155PSA series versus VSA, 158
CONFigure command use, 209CONFigure commands, 211continuous vs. single
measurement mode, 202control measurement commands,
202correction
base station loss, 243mobile station loss, 243
correctionswideband ADC corrections, 116,
135current measurement, 187current measurement, query, 213curve fit the data, 171
Ddata
querying, 161, 171data block size, 135data decimation, 258
WAVeform, 271, 272data format, 200data from measurements, 209Data Packing
spectrum measurement, 121, 138
data sample rate, 135Decimation
spectrum measurement, 121decimation
SPECtrum, 258decimation of data
WAVeform, 271, 272default states, 31, 90default values, setting remotely,
211deleting an
application/personality, 19delta markers, 179display
spectrum window, 190, 191, 196, 197
tiling, 189trace, 192window tile, 189zoom, 189
display ACP data, 188display commands, 188
305
Index
Ind
ex
display EVM data, 188Display keys
EVM, 299dithering of ADC
WAVeform, 266dithering the ADC, 251
Eerror vector magnitude
measurement, 222, 244key reference, 104
error vector measurementSee also EVM
EVMaveraging, 244burst synchronization, 245limit testing, 173, 174points per symbol, 245sync word, 174trigger source, 245view of data, 188
EVM Display keys, 299EVM Meas Setup keys, 299EVM View/Trace keys, 299external trigger
delay, 275level, 275slope, 276
FFETCh command use, 209FETCh commands, 211FFT
SPECtrum, 259, 260, 261FFT bandwidth, SPECtrum, 255,
256, 257FFT Length key, 117, 120FFT Size menu, 116, 120FFT Window key., 116, 119filter
gain setup (wideband), 115, 134setup (wideband), 115, 134type (wideband), 134
Filter Alpha key, 115, 134Filter BW key, 115, 134Filter Type key, 115, 134Flat Top key, 115, 134format, data, 200frame trigger adjustment, 276,
277frame trigger period, 276frame trigger sync mode, 277frequencies offset
ACP, 238frequency span
SPECtrum, 262
front panel key map, 297, 298, 299, 300, 301, 302, 303
GGaussian key, 115, 134
II and Q waveform view
I or Q waveform window, 131I waveform window, 149Q waveform window, 149
I or Q waveform windowamplitude Y scale, 131
reference position, 132reference value, 132scale coupling, 132scale per division, 132
span X scalereference position, 130, 147reference value, 130, 147scale coupling, 130, 147scale per division, 130, 147
I originI/Q polar window, 147, 150
I Origin key, 131, 132I waveform window
amplitude Y scale, 149reference position, 150scale coupling, 150scale per division, 149
I/Q data output, 82I/Q data results, 229, 232I/Q Polar view
waveform measurement, 147, 150
I/Q polar viewI/Q polar window, 131, 132,
147, 150I/Q polar window
amplitude Y scale, 132I/Q scale per division, 131, 132Q Origin, 131, 132
I origin, 147, 150I/Q scale per division, 147, 150Q origin, 147, 150span X scale, 131, 132
I Origin, 131, 132I/Q scale per division
I/Q polar window, 147, 150I/Q Scale/Div key, 131, 132I/Q waveform view
I/Q waveform window, 149I/Q waveform window, 147
amplitude Y scale, 149reference position, 150reference value, 149scale coupling, 150
scale per division, 149iDEN averaging, 244iDEN limit testing, 237iDEN offset frequencies, 238iDEN trigger source, 239, 245IF BW key, 134IF filter
gain setup, 115, 134setup, 134type, 134
IF Flat Corr key, 116, 135IF Flatness
advanced spectrum feature, 121IF path filter
alpha, 115, 134bandwidth, 115, 134setup, 115type, 115
IF Path key, 119, 137IF setup, 115, 134IF trigger delay, 278IF trigger level, 278IF trigger slope, 279initial signal connection, 31initiate measurement, 202, 203input attenuation, 248input port selection, 247input power
maximum, 248range, 248
Install Now key, 24Installing and Obtaining a license
key, 23installing measurement
personalities, 19instrument configuration, 204internal reference selection, 247IQ port selection, 247
Kkey map
ACP Meas Setup, 298ACP View/Trace, 298EVM Display, 299EVM Meas Setup, 299EVM View/Trace, 299NADC Mode Setup, 297Spectrum Marker, 302Spectrum View/Trace, 302Waveform Amp Y Scale, 303Waveform Marker, 303Waveform Span X Scale, 303Waveform View/Trace, 303
LLength Ctrl key, 116, 120Length key, 116, 120
306

Index
Ind
ex
license keyobtaining and installing, 23
limit line testing, 161, 213limit testing
ACP, 160, 236, 237, 238EVM, 173, 174NADC, 160, 173, 174PDC, 160, 173, 174
linear envelope viewlinear envelope window, 148phase window, 149
linear envelope window, 147amplitude Y scale, 148
reference position, 148reference value, 148scale coupling, 149scale per division, 148
linear spectrum windowamplitude Y scale
reference position, 131reference value, 131scale coupling, 131scale per division, 131
span, 130loading an
application/personality, 19
Mmajor functional keys, 86making measurements, 209Marker keys
Spectrum, 302Waveform, 303
markers, 175assigning them to traces, 180maximum, 178minimum, 179off, 180trace assignment, 184, 185turn off, 178type, 179valid measurement, 175value, 185value of, 178x-axis location, 184, 185y-axis, 185
maximum value of trace data, 171mean value of trace data, 171Meas Setup keys
ACP, 298EVM, 299Spectrum
key mapSpectrum Meas
Setup, 300,301
Waveformkey map
Waveform MeasSetup, 303
Meas Time key, 134MEASure command use, 209MEASure commands, 210measure setup
restore measurement defaults, 119, 137
measurementadjacent channel power, 235adjacent channel power ratio,
235error vector magnitude, 244markers, 175query current, 187spectrum (frequency domain),
251waveform (time domain), 266
measurement modescurrently available, 204selecting, 204, 206
measurement setupaveraging mode, 117, 135
exponential, 117, 136averaging number, 117, 135averaging type, 117, 136
log power average (video), 118, 136
maximum voltage average, 118, 136
minimum voltage average, 118, 136
power average (rms), 117, 136voltage average, 118, 136
time averaging number, 118measurements
adjacent channel power ratio, 214
CONF/FETC/MEAS/READ commands, 209
control of, 202error vector magnitude, 222getting results, 209query current, 213setting default values remotely,
211single/continuous, 202spectrum (frequency domain),
229waveform (time domain), 232
measuring I/Q data, 229, 232measuring in the time domain, 80Min Pts in RBW key, 116, 120minimum value of trace data, 171missing options, 19
mobile stationloss correction, 243
mobile station testing, 250Mode Setup keys
NADC, 297
NNADC
averaging, 244burst power threshold, 265limit testing, 236, 237, 238offset frequencies, 238trigger source, 239, 245
NADC measurement, 222, 235, 244
NADC Mode Setup keys, 297normal marker, 179
Ooffset frequencies
ACP, 238Option 122 wideband selection,
119, 137options
loading/deleting, 19options not in instrument
memory, 19
Ppacking
SPECtrum, 251pass/fail test, 161, 213PDC
averaging, 244burst power threshold, 265limit testing, 236, 237, 238offset frequencies, 238trigger source, 239, 245
PDC measurement, 222, 235, 244PDC Occupied Bandwidth
measurementkey reference, 111
personalitiescurrently available, 204selecting, 204, 206
personality options not in instrument, 19
phase window, 147amplitude Y scale, 149
reference position, 149reference value, 149scale per division, 149
points per symbolEVM, 245
pre-ADC bandpass filterSPECtrum, 256
307
Index
Ind
ex
Pre-ADC BPF keyspectrum measurement, 119
pre-FFT bandwidth, SPECtrum, 255, 256, 257
Pre-FFT BW key, 119Pre-FFT Fltr key, 119preset, 31
factory defaults, 31preset states, 31, 90procedure
using the waveform measurement, 80
programmingcompatibility among PSA
modes, 155, 157compatibility, PSA series versus
VSA, 158PSA series versus VSA
(programming compatibility), 158
QQ origin
I/Q Polar window, 147, 150I/Q polar window, 147, 150
Q Origin key, 131, 132Q waveform window
amplitude Y scale, 149reference position, 150reference value, 149scale coupling, 150scale per division, 149
QPSKEVMview selection, 189
query data, 161, 171
RRaised Cosine Key, 115, 134READ command use, 209READ commands, 212real number data format, 200rear panel external trigger
delay, 275slope, 276
reference, selecting internal, 247relative limit
ACP, 238Res BW key
spectrum measurement, 115waveform measurement, 134
restart measurement, 203results, waveform measurement,
292return data, 161, 171RF input, selection, 247RMS of trace data, 171Root Nyquist key, 115, 134
RRC (root raised cosine) key, 115, 134
SSample Rate key, 135sampling trace data, 171selecting the
wideband/narrowband path, 119, 137
set up the wideband IF, 115, 134signal envelope view
signal envelope window, 148signal envelope window, 147
amplitude Y scale, 148reference position, 148reference value, 148scale coupling, 148scale per division, 148
single vs. continuous measurement mode, 202
spanselecting IF path, 119, 137SPECtrum, 262
Span keyspectrum measurement, 115
Span X Scale keysWaveform, 303
SPECtrumacquisition packing, 251ADC range, 252data decimation, 258FFT length, 259FFT resolution BW, 260FFT window, 261FFT window delay, 260frequency span, 262sweep time, 262, 263trigger source, 263
spectrumall traces, 130, 146averaged trace, 130, 146changing views, 51, 124current trace, 130, 146I signal trace, 130, 146next window selection, 124Q signal trace, 130, 146span X scale, 130trace display, 130, 146view/trace, 51, 124zoom a window, 124
Spectrum (Frequency Domain) key, 115, 291
spectrum (frequency domain) measurement, 229, 251
See also SPECtrumSpectrum Marker keys, 302
Spectrum Meas Setup keys, 300, 301
spectrum measurementbasic mode, 82method, 291results, 49, 124
spectrum measurement display, 190, 191, 196, 197
Spectrum View/Trace keys, 302standard deviation of trace data,
171start measurement, 202, 203state
changing, 235sweep time
SPECtrum, 262, 263WAVeform, 272
Sweep Time key, 134symbol, points per, 245sync word
NADC/PDC, 174synchronization
EVM, 245NADC, 265PDC, 265
Ttest limits, 161, 213
NADC, 160, 173, 174PDC, 160, 173, 174
tile the display, 189time averaging, 118time domain measurement, 232,
266time domain measurements, 134,
292time slot auto, 242time slot number, 241trace data
processing, 171trace display, 192trace format, 200trace names for markers, 180trace/view selection
magnitude & phase graph view, 70, 144
transmit band spurs - averaging state, 268
triggerauto time, 274burst level, 279commands, 274delay, 275delay, IF, 278external, 275, 276frame adjustment, 276, 277frame period, 276
308

Index
Ind
ex
frame sync mode, 277holdoff, 278level, 275level, IF, 278on/off, 274slope, 276slope, IF, 279SPECtrum, 263timeout, 274trigger source, 118, 137
external front input, 118, 137external rear input, 119, 137frame clock, 119, 137free run (immediate), 118, 137line, 119, 137RF burst (wideband), 118, 137video (IF envelope), 118, 137
WAVeform, 272trigger measurement, 202, 203trigger source
ACP, 239EVM, 245
triggering setup help, waveform measurement, 80
UUninstall Now, 26uninstalling measurement
personalities, 19
Vview ACP data, 188view commands, 188view EVM data, 188view/trace
I/Q waveforms, 52, 127linear spectrum and phase
graphs, 52, 127spectrum graph, 51, 124
View/Trace keysACP, 298EVM, 299Spectrum, 302Waveform, 303
view/trace selectionI and Q Waveform view, 72, 145I and Q waveform view, 131I/Q polar waveform view, 75,
146I/Q waveform graph window,
51, 126I/Q Waveform view, 72, 145linear envelope and phase view,
67, 143Spectrum I/Q Waveform view,
51, 126spectrum linear
linear spectrum window, 130, 131
viewing the time domain, 80VSA versus PSA series
(programming compatibility), 158
WWAVeform
acquisition packing, 266ADC dithering, 266ADC filter, 266ADC range, 267data decimation, 271, 272sweep time, 272trigger source, 272
waveformchanging displays, 146I and Q waveform view, 149I/Q waveform view, 149linear envelope view, 149method, 292resolution bandwidth, 134results, 65span X scale, 146sweep time, 146using markers, 150
Waveform (Time Domain) key, 292
Waveform (Time Domain) Key Menus, 134
waveform (time domain) measurement, 232, 266
See also WAVeformWaveform Amp Y Scale keys, 303Waveform Marker keys, 303Waveform Meas Setup keys, 303waveform measurement, 80, 134
basic mode, 82display, 150I/Q Polar view, 147, 150results, 65
Waveform Span X Scale keys, 303Waveform View/Trace keys, 303WB ADC Dither key, 116, 135W-CDMA (3GPP) measurement,
214W-CDMA (Trial & ARIB)
measurement, 214W-CDMA measurement, 235Wideband Advanced key, 115, 135wideband filter alpha, 115, 134wideband filter bandwidth, 115,
134wideband filter type, 134Wideband Filtering key, 115, 134wideband IF
advanced settings, 116, 135wideband IF data block size, 135wideband IF data sample rate,
135wideband IF filter type, 115Wideband IF Gain key, 115, 134Wideband IF Setup key, 115, 134wideband path selection, 119, 137Window Length key, 116, 120
Zzero span measurement, 232, 266zoom the display, 189
309

Index
Ind
ex
310