nacsvm pred - airccj.org · computer science & information technology (cs & it) 85...
TRANSCRIPT

Sundarapandian et al. (Eds): ICAITA, SAI, SEAS, CDKP, CMCA, CS & IT 08,
pp. 83–95, 2012. © CS & IT-CSCP 2012 DOI : 10.5121/csit.2012.2508
NACSVMPred: A MACHINE LEARNING
APPROACH FOR PREDICTION OF NAC
PROTEINS IN RICE USING SUPPORT VECTOR
MACHINES
Hemalatha N. 1,*
, Rajesh M. K. 2 and Narayanan N. K.
3
1AIMIT, St. Aloysius College, Mangalore, India
[email protected] 2Division of Crop Improvement, Central Plantation Crops Research Institute,
Kasaragod 671124, India [email protected]
3School of Information Science and Technology, Kannur University, Kannur,
India. [email protected]
ABSTRACT
NAC proteins are plant-specific transcriptional factors with diversified roles in various
developmental processes and stress responses. Development of genome wide prediction tools
for NAC proteins will substantially have an impact on rice gene annotation. NACSVMPred is an
effort in this direction for computational genome-scale prediction of NAC proteins in rice by
integrating compositional and evolutionary information of proteins. Support vector machine
(SVM)-based modules were first developed using traditional amino acid, dipeptide (i+1),
tripeptide (i+2), four-parts composition and PSSM and an overall accuracy of 79%, 93%, 93%,
79% and 100% respectively was achieved. Further, two hybrid modules were developed based
on amino acid, dipeptide and tripeptide composition, which achieved an overall accuracy of
83% and 79%. NACSVMPred was also evaluated with PSI-BLAST, which resulted in a lower
accuracy of 50%. The different statistical analyses carried out revealed that the proposed
algorithm is useful for rice genome annotation, specifically predicting NAC proteins.
KEYWORDS
SVM, NAC, RBF, PSSM
1. INTRODUCTION
Rice (Oryza sativa L.) is an indispensable grain being the staple food for more than one-third of
the world's population. Rice is truly a way of life for many societies who are dependent on rice-
based production systems for their livelihood. Rice production is subjected to a number of
stresses, both abiotic and biotic, and potential yields are seldom achieved because of the effect of
these stresses. Abiotic stresses adversely affect the growth and productivity of rice-based farming
systems. Present day challenges like global climate change, less water availability, urbanization
etc. exacerbate these situations. These factors have lead to a mounting interest among researchers
on investigations on tolerance to abiotic stress. Incorporation of stress tolerance into high-
yielding rice varieties has proven to be a very effective approach to developing varieties that can
cope with these extreme situations.

84 Computer Science & Information Technology (CS & IT)
The mechanism of molecular response of plants to abiotic stresses has been investigated by
detailed studies of genes unregulated under the specific stress conditions. One class of important
transcription factors induced during abiotic stress tolerance is NAC. NACs are genes encoding a polypeptide containing a plant-specific highly conserved N-terminal domain, NAC (for NAM,
ATAF1, 2, and CUC2) and are represented by approximately 140 genes in rice [1]. These
transcription factors regulate gene expression by binding to specific cis-acting promoter elements,
thereby activating or repressing the transcriptional rates of their target genes [2, 3]. The
identification and functional characterization of these transcription factors therefore assumes
importance for the reconstruction of transcriptional regulatory networks.
In comparison to experimental methods, computational prediction techniques are fast and highly accurate for high-throughput analysis of large-scale genome sequences. Development of a fully
automatic prediction system for NAC transcription factors in rice is a systematic attempt in this
direction. In this work, a new prediction method NACSVMPred has been developed, based on a
powerful machine learning technique viz., Support Vector Machine (SVM) for the prediction of
NAC proteins in indica rice (Oryza sativa L. ssp. indica). This was developed using the
evolutionary and compositional features of a protein sequence and the performance of the model
was evaluated using cross-validation techniques. Finally, a web-based server was developed
based on the best approach, based on accuracy, to provide service to the rice research community,
where the users have the option to query their sequence/sequences for the prediction of stress-
responsive NAC proteins in rice.
2. MATERIALS AND METHODS
2.1. Dataset
An important concern during the development of a prediction method is the selection of a dataset.
In the present study, the data set consisting of 95 NAC proteins of indica rice and another set of
95 NAC proteins from diverse plant families viz., Arabidopsis (Arabidopsis thaliana ), soybean (Glycine max), wheat (Triticum aestivum), poplar (Populus trichocarpa), maize (Zea mays) and
cotton (Gossypium hirsutum) were taken from Uniprot Knowledgebase. ‘All Plants’ dataset was
used to cross-check the performance of our species-specific classifier (indica rice) on some non-
trained plants. The 95 NAC proteins of indica rice, of which some where uncharacterized
proteins, were confirmed to be of NAC family through Prosite and Pfam databases. Out of 95
NAC proteins, 10 were randomly selected for the creation of test set and remaining 85 proteins
were used for positive dataset / training set. Non-NAC protein sequences were used as the
negative data set. This was done to ensure redundancy of proteins in test set and training set and
these were used for independent dataset test as training set and test set were entirely different.
Similar method was applied for all plants model also.
2.2. Support Vector Machine
Support vector machine (SVM), initially conceived by Cortes and Vapnik [4, 5], is conceptually
simple, and easy to implement algorithm. It is defined as a computer algorithm that learns by
example to assign labels to objects [6]. SVMs are becoming popular in a wide variety of
biological applications like classifying objects as diverse as protein and DNA sequences,
microarray expression profiles and mass spectra [7]. An SVM is a mathematical entity, an
algorithm for maximizing a particular mathematical function with respect to a given collection of
data. For constructing an optimal hyperplane, SVM employees an iterative training algorithm which is used to minimize an error function. In the present study, we have used SVMlight [8], a
freely downloadable package of SVM to predict the NAC proteins. A number of parameters can
be chosen in this software apart from inbuilt kernel function including linear, polynomial and
radial basis function (RBF). To achieve maximum accuracy, we have attempted seven different
Computer Science & Information Technology (CS & IT) 85
compositional and evolutionary approaches based on various features of a protein sequence which
are further explained below.
2.3. Features and Modules
2.3.1. Amino-acid composition
Amino-acid composition is the fraction of each amino acid which occurs in a protein sequence.
The fraction of all 20 natural amino acids was calculated using the following equation:
Fraction of amino acid = ����� ������ �� ����� ���� ������ ������ �� ����� ����� �� �������
(1)
2.3.2. Traditional dipeptide composition
Traditional dipeptide composition gives global information about each protein sequence utilizing
the sequence order effects. This representation gives a fixed pattern length of 400 (20x20) which
encompasses the information of the amino-acid composition along with the local order of amino
acids. The fraction of each dipeptide was calculated according to the equation:
Fraction of dep (i + 1) = ����� ������ �� ��� (�%&)����� ������ �� ��� �������� ����������
(2)
2.3.3. Tripeptide composition
This composition not only reflects the total amino acid composition but also the sequence order
effects [9,10]. This representation gives a fixed pattern length of 8000 (20x400) which
encompasses the information of the amino-acid composition along with the local order of amino
acids and fraction of each tripeptide was calculated using Equation 3,
Fraction of tripep (i + n) = ����� ������ �� ������(�%�) ����� ������ �� ��� �������� �����������
(3)
Where n=2 and tripep (i + n) is one of 8000 tripeptides.
2.3.4. Four parts composition
In this feature extraction method each protein sequence was divided into four equal parts based on
length. This type of composition has shown good results as evident from some earlier studies [10,
11]. The occurrence of each amino acid in divided part was calculated separately using Eq. (1)
and then a combined fixed pattern length of 80 (20 x 4) was formed in order to gather more
information about the protein sequence.
2.3.5. Hybrid SVM module(s)
The prediction accuracy of NACSVMPred was further evaluated with various hybrid approaches
by combining different features of a protein sequence.
Hybrid approach- 1
In this approach, we developed a hybrid module by combining amino acid composition and
dipeptide composition features of a protein sequence as calculated by using Equation (1) and (2),
respectively. This module was provided with an SVM input vector pattern of 420 (20 + 400) i.e.
20 for amino acid and 400 for dipeptide composition.
Hybrid approach-2
In the second approach we developed another hybrid module by combining amino acid
composition and tripeptide composition (i + 2) as calculated using Eq. (1) and (3), respectively.
86 Computer Science & Information Technology (CS & IT)
The SVM input vector pattern thus formed was 8020-dimensional (20 for amino acid and 8000
for tripeptide).
2.3.6. Position-specific scoring matrix (PSSM)
PSSM based module was another approach constructed by combining the evolutionary
information of a protein sequence stored in the matrix called as PSSM. This information is
expressed in a position-specific scoring table called profile which is created from a group of
sequences previously aligned by PSI-BLAST against the non-redundant (NR) database at
GenBank. It is a method for detecting distantly related proteins by sequence comparison by
adopting PSSM matrix extracted from sequence profiles as input data [12]. The PSSM matrix gives the log-odds score for finding a particular matching amino acid in a target sequence (Figure
1). This method differs from other composition methods of sequence comparison because any
number of known sequences can be used to construct the profile allowing more information to be
used in the testing of the target sequence. The PSSM provides a matrix of dimension n rows and
20 columns for a protein input sequence of n amino acid residues where 20 columns represent the
occurrence of each type of 20 amino acids. The PSSM matrix of a protein sequence generated
from the profiles of PSI-BLAST was used to generate a 400-dimensional (20 x 20) input vector to
the SVM by summing up all rows in the PSSM matrix of the same amino acid in the primary
sequence the range of 0-1 by using the function ('(�������)
(��)����(�������) where X is the individual
score of each amino acid and maximum, minimum are the corresponding maximum and
minimum value of score in each row of the matrix (Fig 1).
2.4. Measurement of Performance of NACSVMPred
In statistical prediction, the effectiveness of a predictor is generally examined using either single
independent dataset test, cross-validation test or jackknife test. Among these mentioned, the
jackknife test is considered to be most rigorous and objective one, as illustrated by a
comprehensive review [13]. However jackknife test method takes much longer time to train a
predictor based on SVM and therefore, in our present work, only 10-fold cross-validation and
independent data set validation techniques were adopted for performance measurement. For 10-fold cross-validation, the relevant dataset was partitioned randomly into ten equally sized sets.
The training and testing was carried out ten times with each distinct set used for testing and the
remaining nine sets for training. In the independent dataset test, none of the data to be tested
occurs in the training dataset used to train the predictor and the selection of data used for the
testing dataset could be quite arbitrary.
2.5. Evaluation Parameters
In this work we adopted five frequently considered evaluation criteria’s namely accuracy (Ac),
sensitivity (Sn), specificity (Sp), precision (Pr) and Mathew’s Correlation Coefficient (MCC).
Most of the information retrieval papers report precision and accuracy, while bioinformatics,
medical and machine learning papers tend to report sensitivity and specificity apart from the
MCC. Accuracy (Ac) defines the correct ratio between both positive (+) and negative (-) data sets
(Eq. 6). The sensitivity (Sn), sometimes called as recall too, and specificity (Sp) represent the
correct prediction ratios of positive (+) and negative data (-) sets of NAC proteins respectively
(Eq. 4 and 5).

Computer Science & Information Technology (CS & IT) 87
Figure 1. Flow chart of the algorithm to generate PSSM matrix of 20x20 dimension from the
input pattern of nx20 dimension matrix used as input pattern for various models of SVM
Precision is the proportion of the predicted positive cases that were correct (Eq.7). However,
when the numbers of positive and negative data differ too much from each other, the Mathew
correlation coefficient (MCC) should be included to evaluate the prediction performance of the
developed tool (Eq. 8). The MCC is another measure used in machine learning for judging the
quality of binary (two-class) as well as multi-labeled classifications and is considered to be the
most robust parameter of any class prediction method. The value of MCC ranges from -1 to 1, and a positive MCC value stands for better prediction performance. Among the data with positive
hits by NACSVMPred, the real positives are defined as true positives (TP), while the others are
defined as false positives (FP).
Sensitivity = *+
*+%,- x 100 (4)
Specificity = *-
,+%*- x 100 (5)
Accuracy = *+%*-
*+%*-%,+%,- x 100 (6)
Precision = *+
*+%,+ x 100 (7)
MCC = (*+ . *-)( (,+ . ,-)
/(*+%,+)(*+%,-)(*-%,+)(*-%,- (8)
where TP and TN are truly or correctly predicted positive NAC protein and negative (non- NAC
protein), respectively. FP and FN are falsely or wrongly predicted NAC and non-NAC proteins,
respectively.
2.6. Sequence Similarity Search
PSI-BLAST is a method to search for the similarities between a protein query sequence and all
the sequences in a protein database. Contrary to BLAST, this search method uses the position
specific scoring matrix (PSSM) to score matches between query and database sequences. The
advantage of using a profile to search a database is that it often detects close relationships

88 Computer Science & Information Technology (CS & IT)
between proteins that are structurally or functionally distant. Here we have used PSI-BLAST in
place of normal BLAST because of former’s capacity to detect remote homology of NAC
proteins against Swiss Prot database and result was analysed.
2.7. ROC Curves
The performance of a binary classifier can be explained with ROC curve which is a graphical plot
drawn by varying threshold values. The analysis of ROC curve helps to characterize the
prediction for individual locations [14, 15]. ROC curve is a graph created by plotting the fraction
of false positives (FPR) against true positives (TPR) at various threshold settings. The area under
the curve (AUC) represented in the ROC curve further measures the classifier accuracy.
3. RESULTS AND DISCUSSION
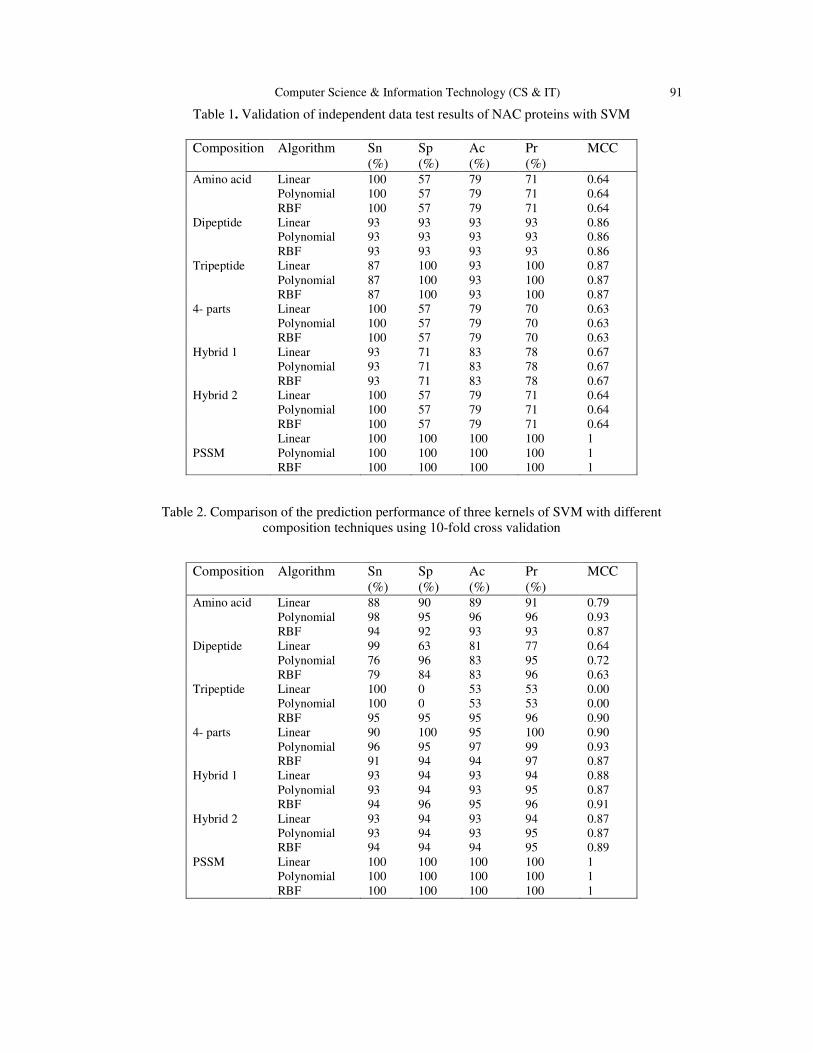
Here we have carried out 10-fold cross-validation and independent data test validation to evaluate
the performance of NACSVMPred (Table 1 and Table 2). Cross validation and independent data test result from the table shows that cross validation have better results for different composition
methods compared to independent data test. From Table 1 and 2, it is clear that PSSM method has
100% accuracy with respect to all the three kernels of SVM compared to all the other six
composition methods and hence PSSM was selected to be the best model for NACSVMPred.
3.1. Statistical Tests of the Best Classifier
In the 10-fold cross-validation test, the best overall sensitivity was achieved from PSSM which
has 100% accuracy over the other composition methods. Performance comparison of overall
accuracies achieved by various composition methods is represented graphically in Figure 2. This
classifier achieved an overall prediction accuracy of 100 % with a high-confidence MCC of 1.
Sensitivity and specificity are two competing but nonexclusive measures of quality useful for
testing the performance of any classification methods. The MCC provides a balanced measure between the sensitivity and specificity for each class. An ideal classification method should have
both sensitivity and specificity values close to 100% and MCC value equal to 1.
3.2. Composition Based Modules
The amino-acid composition based module with polynomial kernel achieved a maximum
accuracy of 96 % with MCC of 0.93. A module based on traditional dipeptide composition (i + 1)
was implemented which gave more information about frequency and local order of residues. This
module could achieve a maximum accuracy of 83% with MCC of 0.72. Tripeptide (i+ 2)
composition based module was also developed to have more comprehensive information on the
sequence order effects and this could achieve an accuracy of 95% with MCC of 0.9 . The four
parts composition method achieved maximum accuracy of 97% with MCC of 0.93. All the above
validation test results are based on 10-fold cross-validation. The detailed performance of amino acid, traditional dipeptide, higher order peptide, PSSM and four parts composition based modules
with cross validation are presented in Table 2.
On analyzing independent test validation, it could be observed that amino-acid composition
achieved an accuracy of 79% with MCC of 0.64, dipeptide composition achieved an accuracy of
93% with MCC of 0.86, tripeptide (i+ 2) composition based module achieved an accuracy of 93%
with MCC of 0.87 and four parts composition method achieved maximum accuracy of 79% with
MCC of 0.63 for all the three kernels. The detailed performance of amino acid, traditional
dipeptide, higher order peptide, PSSM and four parts composition based modules with
independent data test validation are presented in Table 1. From Tables 1 and 2, it is clearly
evident that best performance results are achieved for 10-fold cross validation for the various
composition based modules irrespective of PSSM based module which has an accuracy of 100%
for both validation.
Computer Science & Information Technology (CS & IT) 89
3.3. Hybrid Based Modules
In addition to the above composition methods, hybrid methods were applied which was the
combination of various features of a protein sequence. The first hybrid method, hybrid 1was
developed by combining amino acid feature with dipeptide feature of a protein sequence which
achieved an accuracy of 83% with MCC of 0.67 (all three kernels) for independent data test and
95% accuracy for RBF kernel with MCC of 0.91 in the case of 10-fold cross validation test. The
second hybrid method, hybrid 2, was developed by combining amino acid and tripeptide composition which also obtained a little less accuracy of 79% and MCC value of 0.64 was
obtained for independent data test and 94% for RBF kernel with an MCC value of 0.89 for cross
validation data test. The above results shows that for hybrid based modules also cross validation
test results has an upper hand over independent test results (Table 1 and 2). The performance
comparison of both composition and hybrid based method for cross validation are shown in the
figure 2.
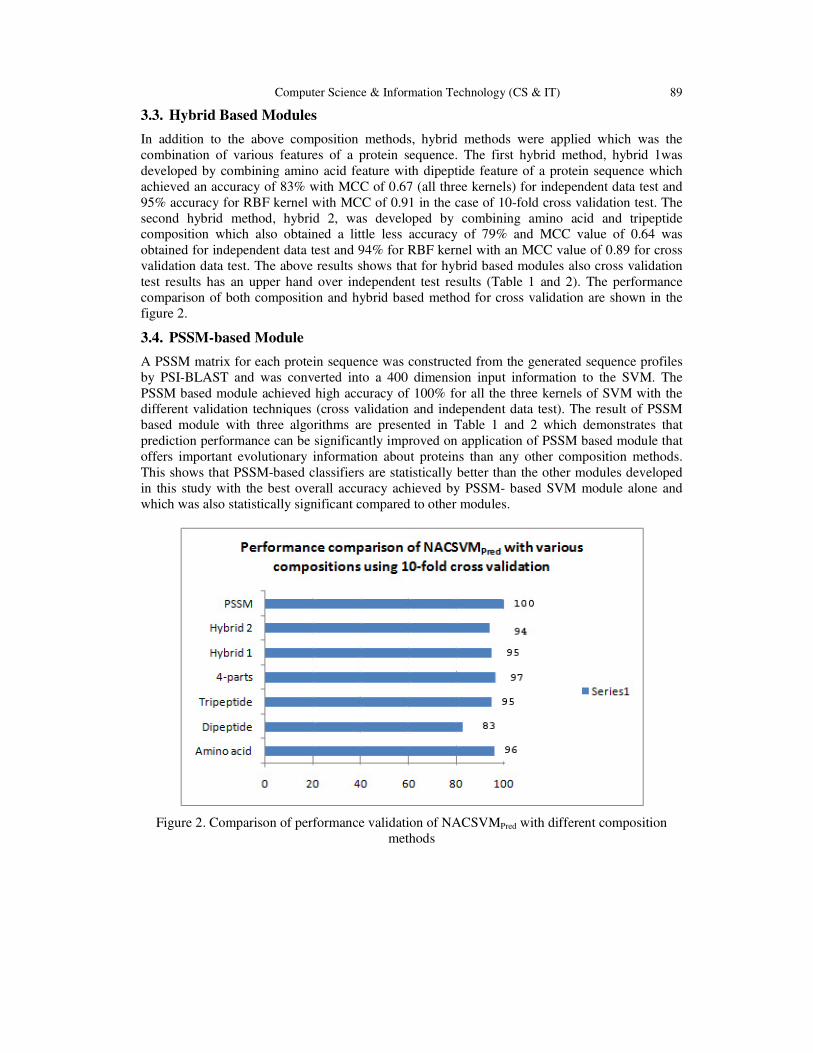
3.4. PSSM-based Module
A PSSM matrix for each protein sequence was constructed from the generated sequence profiles
by PSI-BLAST and was converted into a 400 dimension input information to the SVM. The
PSSM based module achieved high accuracy of 100% for all the three kernels of SVM with the different validation techniques (cross validation and independent data test). The result of PSSM
based module with three algorithms are presented in Table 1 and 2 which demonstrates that
prediction performance can be significantly improved on application of PSSM based module that
offers important evolutionary information about proteins than any other composition methods.
This shows that PSSM-based classifiers are statistically better than the other modules developed
in this study with the best overall accuracy achieved by PSSM- based SVM module alone and
which was also statistically significant compared to other modules.
Figure 2. Comparison of performance validation of NACSVMPred with different composition
methods
90 Computer Science & Information Technology (CS & IT)
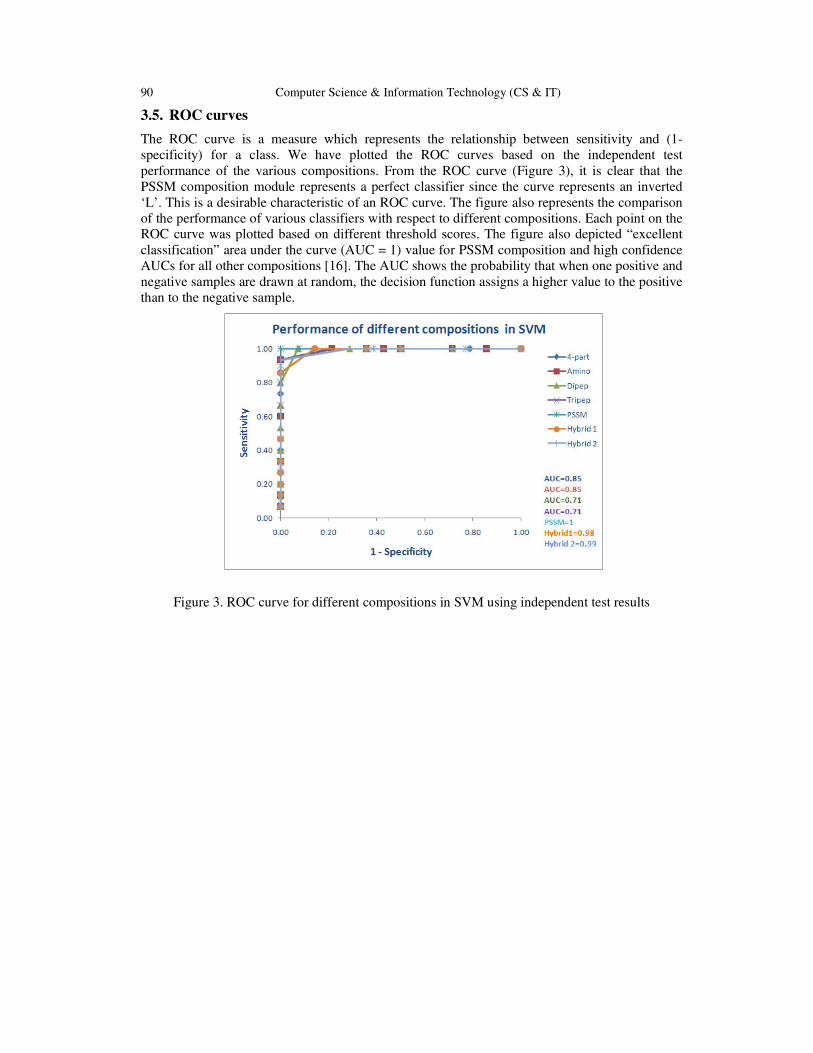
3.5. ROC curves
The ROC curve is a measure which represents the relationship between sensitivity and (1-
specificity) for a class. We have plotted the ROC curves based on the independent test
performance of the various compositions. From the ROC curve (Figure 3), it is clear that the
PSSM composition module represents a perfect classifier since the curve represents an inverted
‘L’. This is a desirable characteristic of an ROC curve. The figure also represents the comparison
of the performance of various classifiers with respect to different compositions. Each point on the ROC curve was plotted based on different threshold scores. The figure also depicted “excellent
classification” area under the curve (AUC = 1) value for PSSM composition and high confidence
AUCs for all other compositions [16]. The AUC shows the probability that when one positive and
negative samples are drawn at random, the decision function assigns a higher value to the positive
than to the negative sample.
Figure 3. ROC curve for different compositions in SVM using independent test results
Computer Science & Information Technology (CS & IT) 91
Table 1. Validation of independent data test results of NAC proteins with SVM
Table 2. Comparison of the prediction performance of three kernels of SVM with different
composition techniques using 10-fold cross validation
Composition Algorithm Sn
(%)
Sp
(%)
Ac
(%)
Pr
(%)
MCC
Amino acid Linear 100 57 79 71 0.64
Polynomial 100 57 79 71 0.64
RBF 100 57 79 71 0.64
Dipeptide Linear 93 93 93 93 0.86
Polynomial 93 93 93 93 0.86
RBF 93 93 93 93 0.86
Tripeptide Linear 87 100 93 100 0.87
Polynomial 87 100 93 100 0.87
RBF 87 100 93 100 0.87
4- parts Linear 100 57 79 70 0.63
Polynomial 100 57 79 70 0.63
RBF 100 57 79 70 0.63
Hybrid 1 Linear 93 71 83 78 0.67
Polynomial 93 71 83 78 0.67
RBF 93 71 83 78 0.67
Hybrid 2 Linear 100 57 79 71 0.64
Polynomial 100 57 79 71 0.64
RBF 100 57 79 71 0.64
Linear 100 100 100 100 1
PSSM Polynomial 100 100 100 100 1
RBF 100 100 100 100 1
Composition Algorithm Sn
(%)
Sp
(%)
Ac
(%)
Pr
(%)
MCC
Amino acid Linear 88 90 89 91 0.79
Polynomial 98 95 96 96 0.93
RBF 94 92 93 93 0.87
Dipeptide Linear 99 63 81 77 0.64
Polynomial 76 96 83 95 0.72
RBF 79 84 83 96 0.63
Tripeptide Linear 100 0 53 53 0.00
Polynomial 100 0 53 53 0.00
RBF 95 95 95 96 0.90
4- parts Linear 90 100 95 100 0.90
Polynomial 96 95 97 99 0.93
RBF 91 94 94 97 0.87
Hybrid 1 Linear 93 94 93 94 0.88
Polynomial 93 94 93 95 0.87
RBF 94 96 95 96 0.91
Hybrid 2 Linear 93 94 93 94 0.87
Polynomial 93 94 93 95 0.87
RBF 94 94 94 95 0.89
PSSM Linear 100 100 100 100 1
Polynomial 100 100 100 100 1
RBF 100 100 100 100 1

92 Computer Science & Information Technology (CS & IT)
3.6. Sequence Similarity Search
To summarize evolutionary information about the proteins, the homology of a protein with other
related sequences provides a broad range of information about each functional encoded protein
and is carried out through sequence similarity search PSI-BLAST. This was used to compare a
protein sequence with a created database to generate the homology of the given sequence with
other related sequences in the database [17]. This provided a broad range of information about
each functional encoded protein. A 10-fold cross-validation was conducted with no significant hits and an average accuracy of 53% was obtained (Table 3). This result suggests that similarity
based search tools alone cannot be efficient and reliable as compared to different composition
based modules based on computational methods.
Table 3: Prediction result of NAC proteins with similarity search (10-fold cross validation)
Test No. of sequences
given
Correctly
predicted
Accuracy
(%)
1 20 10 50
2 20 10 50
3 20 10 50
4 20 8 40
5 20 10 50
6 20 11 55
7 20 10 50
8 20 10 50
9 15 11 73.3
10 15 10 66.7
Average 53.5
3.7. Comparison of NACSVMPred with ‘All Plant’ method
To strengthen the fact that a species-specific predictor(s) is much more advantageous than ‘All
Plant’ method, we trained a corresponding method using the same encoding method as used in
NACSVMPred on a dataset derived from all the plant species, and then compared the performance
of two methods on the rice independent dataset. To train the all-plant method a dataset consisting
of six plants, namely Arabidopsis, soybean, wheat, poplar, maize and cotton were downloaded
from Uniprot knowledgebase consisting of 95 sequences in total. As we wanted to compare the
performance of rice independent dataset on both the NACSVMPred and ‘All Plant’ method and to
obtain fair result we made sure that All Plant training dataset were independent of rice sequences.
Thus we made sure that both the NACSVMPred as well as the ‘All Plant’ classifier had not been
trained from any of the sequences in the rice independent dataset.
Finally, the traditional amino acid composition based classifier for ‘All Plant’ dataset was
developed using the independent dataset approach and rice independent dataset was tested on the
model files generated from the ‘All Plant’ classifier. Statistical parameters were calculated as
done in NACSVMPred and these were compared with the amino acid based classifier of
NACSVMPred .Though the best classifier obtained in NACSVMPred was from PSSM matrix using
evolutionary information of a protein sequence, but for comparison we have used simpler
composition method for ‘All Plant’ module. Results are presented in Table 5 which shows that
species specific tools are much superior to ‘All Plant’ tool.
Computer Science & Information Technology (CS & IT) 93
Table 4. Comparison of performance of NAC proteins with All-Plant tool and NACSVMPred
Method Algorithm Sn
(%)
Sp
(%)
Ac
(%)
Pr
(%)
MCC
All-Plant
Linear 100
50
76
68
0.58
Polynomial 93 57 76 70 0.55
RBF 100 50 76 68 0.58
NACSVMPred
Linear 88 90 89 91 0.79
Polynomial 98 95 96 96 0.93
RBF 94 92 93 93 0.87
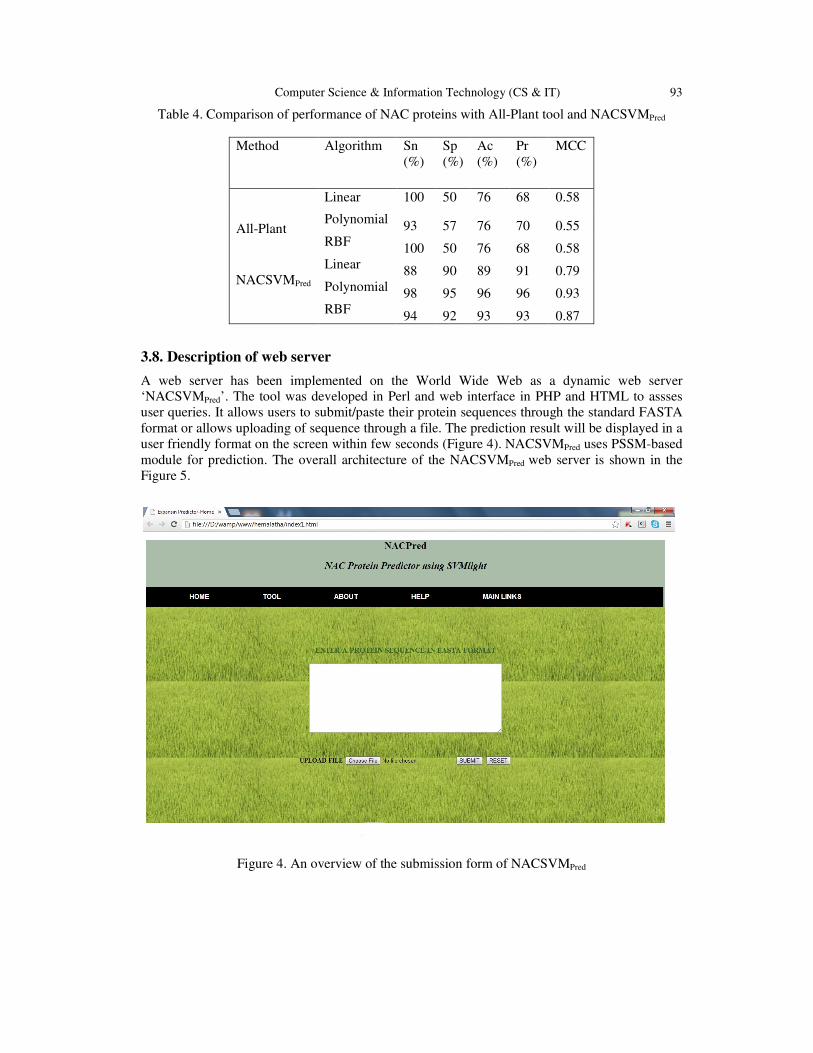
3.8. Description of web server
A web server has been implemented on the World Wide Web as a dynamic web server ‘NACSVMPred’. The tool was developed in Perl and web interface in PHP and HTML to assses
user queries. It allows users to submit/paste their protein sequences through the standard FASTA
format or allows uploading of sequence through a file. The prediction result will be displayed in a
user friendly format on the screen within few seconds (Figure 4). NACSVMPred uses PSSM-based
module for prediction. The overall architecture of the NACSVMPred web server is shown in the
Figure 5.
Figure 4. An overview of the submission form of NACSVMPred

94 Computer Science & Information Technology (CS & IT)
Figure 5. Schematic diagram showing the flow of steps in developing the web based tool
4. CONCLUSIONS
Finding new protein-coding genes is one of the most important goals of genome sequencing
projects, especially for genomes with little experimental data. There is a dearth of accurate gene
prediction programs with respect to various functionalities in rice. Thus, the availability of
systems/tools that can predict location from sequence is essential to the full characterization of
expressed proteins. Computational tools provide faster and accurate access to predictions for any
organism.
Identification of NAC proteins from sequence databases is difficult due to poor sequence
similarity. In this work, we present a new method for NAC prediction based on SVM, a simple
machine learning technique. The performance was found to be highly satisfactory. Comparison
between different kernels of SVM was also carried out to validate the accuracy. Very high
prediction accuracies for the validation tests show that NACSVMPred is a potentially useful tool
for the prediction of NAC proteins.
REFERENCES
[1] Y. Fang, J. You, K. Xie, W. Xie & L. Xiong, (2008) “Systematic sequence analysis and identification
of tissue-specific or stress-responsive genes of NAC transcription factor family in rice”, Molecular
Genetics and Genomics, Vol. 280, No. 6, pp 547-563.
[2] J. L. Riechmann, J. Heard, G. Martin, L. Reuber, C. Jiang, J. Keddie, L. Adam, O. Pineda, O. J.
Ratcliffe, R. R. Samaha, R. Creelman, M. Pilgrim, P. Broun, J. Z. Zhang, D. Ghandehari, B. K.
Sherman & G. Yu, (2000) “Arabidopsis transcription factors: genome-wide comparative analysis
among eukaryotes”, Science , Vol. 290, No. 5499, pp 2105-2110.
[3] G.A. Wray, M.W. Hahn, E. Abouheif, J. P. Balhoff, M. Pizer, M. V. Rockman & L.A. Romano,
( 2003) “The evolution of transcriptional regulation in eukaryotes”, Molecular Biology and
Evolution, Vol. 20, No. 9, pp 1377-1419.
[4] C. Cortes & V. Vapnik, (1995) “Support vector networks”, Machine Learning, Vol. 20, No. 5, pp
273–297.
[5] V. Vapnik, (1995) The Nature of Statistical Learning Theory, Springer, New York.
[6] B. E. Boser, I. M. Guyon, & V. N. Vapnik, (1992) “A training algorithm for optimal margin
classifiers”, in 5th Annual ACM Workshop on COLT, D. Haussler, Ed. Pittsburgh, PA: ACM Press, pp
144–152.
[7] W.S. Noble, ( 2004) “Support vector machine applications in computational biology”, in Kernel
Methods in Computational Biology, B. Sch olkopf, K. Tsuda & J. P. Vert, Eds. Cambridge, MA: MIT
Press, pp 71–92 .

Computer Science & Information Technology (CS & IT) 95
[8] T. Joachims, (1999) “Making large-scale SVM learning practical”, in Advances in Kernel Methods :
Support Vector Learning, B. Sch olkopf, C. Burges & A. Smola, Eds. Cambridge, MA: MIT Press, pp
41–56.
[9] A. Garg, M. Bhasin & G. P. S. Raghava, ( 2005) “Support vector machine-based method for
subcellular localization of human proteins using amino acid compositions, their order, and similarity
search”, Journal of biological Chemistry, Vol. 280, pp 14427–14432.
[10] M. Wang, A. Li, D. Xie , Z. Fan & H. Feng, (2005) “Improving prediction of protein sub-cellular
localization using evolutionary information and sequence-order information”, 27th Annual
International Conference of the IEEE-EMBS, pp 4434– 4436.
[11] D. Xie, A. Li, M. Wang, Z. Fan & H. Feng, (2005) “LOCSVMPSI: a web server for subcellular
localization of eukaryotic proteins using SVM and profile of PSI-BLAST”, Nucleic Acids Research,
Vol.33, pp 105–110.
[12] D. T. Jones, (1999) “Protein secondary structure prediction based on position-specific matrices”,
Journal of Molecular Biology, Vol. 292, pp 195-202.
[13] K. C. Chou & C. T. Zhang, (1995) “Prediction of protein structural classes”, Critical Reviews in
Biochemistry and Molecular Biology, Vol. 30, pp 275–349.
[14] J. A. Swets, (1988) “Measuring the accuracy of diagnostic systems”, Science, Vol. 240, pp 1285–
1293.
[15] M. H. Zweig & G. Campbell, (1993) “Receiver-operating characteristic (ROC) plots: a fundamental
evaluation tool in clinical medicine”, Clinical Chemistry, Vol. 39, pp 561–577.
[16] D.W. Hosmer & S. Lemeshow, (2000) “Applied Logistic Regression”, Ed. 2, John Wiley and Sons,
New York, pp 156–164.
[18] S. F. Altschul, T. L. Madden, A. A. Schaffer, J. Zhang, Z. Zhang, W. Miller & D.J. Lipman, (1997)
“Gapped Blast and PSI-Blast: a new generation of protein database search programs”, Nucleic Acids
Research, Vol. 25, pp 3389–3402.
Authors
N. Hemalatha is a part time research scholar in the Department of Information
Technology, Kannur University, India. She is currently working as Assistant Professor
in the Computer Science Department of St. Aloysius College, Mangalore, India. Her
research interests are in the areas of machine learning and Bioinformatics.
M. K. Rajesh, PhD, is a Senior Scientist in the Biotechnology Section at Central
Plantation Crop Research Institute, Kasaragod, India. His primary areas of scientific
expertise include plant tissue culture, plant molecular biology and bioinformatics.
N. K. Narayanan, PhD, is a Senior Professor in the Department of Information
Technology, School of Information Science and Technology, Kannur University,
India. He earned a PhD in the area of signal processing from Cochin University of
science & Technology in 1990. His current research interests include bioinformatics,
image processing, pattern recognition, neural networks, and speech signal processing.