n9073a-1fp w-cdma measurement application n9073a-2fp hsdpa …
TRANSCRIPT

N9073A-1FP W-CDMA Measurement ApplicationN9073A-2FP HSDPA/HSUPA Measurement ApplicationAgilent X-Series SignalAnalyzers (MXA/EXA)
Technical Overview with Self-Guided Demonstration
N9073A W-CDMA measurement application provides one-button measurements and modulation analysis capabilities to help your design, evaluation, and manufacturing of 3GPP-based base stations and user equipments.

2
Accelerate the speed of product development and manufacturing with preconfigured parameters for 3GPP conformance tests in RF measurements and modulation analysis
The complexity of the 3GPP standards demands flexibility and excellent modulation analysis for system development and evaluation. Expand your measurement capabilities with the N9073A W-CDMA measurement application for W-CDMA and HSDPA/HSUPA (high speed downlink packet access/high speed uplink packet access) for more convenience throughout 3GPP system development and manufacturing.
• Simplify test systems with RF power measurements, spur searches, digital demodulations, and general spectrum analysis in one analyzer.
• Expedite troubleshooting and design verification with numerous features and an intuitive user interface.
• Streamline manufacturing with speed, reliability, and ease-
of-use.
• Track the latest 3GPP standard requirements with continuous firmware updates.
Run the N9073A W-CDMA measurement application on an Agilent X-Series (MXA/EXA) signal analyzer to optimize its performance. The Agilent N9020A MXA signal analyzer offers the highest performance in a midrange analyzer up to 26.5 GHz with powerful one-button measurements, a great feature set, and the fastest measurement speed. The Agilent N9010A EXA signal analyzer is the industry's fastest economy-class signal analyzer offering similar features and functionality to the MXA at a lower price point.
N9073A W-CDMA measurement application has two options as follows:
• N9073A-1FP: W-CDMA measurement application
• N9073A-2FP: HSDPA/HSUPA measurement application
N9073A-1FP W-CDMA measurement application sets up key transmitter tests for analyzing systems based on Technical Specifications Group TS25.141 and TS34.121 in 3GPP Release 99 though 6. N9073A-2FP is also needed to enable modulation analysis of HSDPA and HSUPA signals like downlink HS-PDSCH in 16QAM and E-DPCCH with spreading factor 2 defined in 3GPP Release 5 and 6.
The features of N9073A-1FP and 2FP have backwards compatibility with Agilent PSA/E4406A measurement personalities: Option BAF for W-CDMA and Option 210 for HSDPA/HSUPA.
This technical overview includes:
• Product overview with available measurements
• Demonstration guide
• Key specifications of the W-CDMA measurement application for
X-Series signal analyzers
• Ordering information
• Related literature
All demonstrations utilize the MXAor EXA signal analyzers with N9073A-1FP and 2FP and the Agilent N5182A MXG vector signal generator with N7600B Signal Studio software. Keystrokes surrounded by [ ] indicate front-panel keys, while softkeys, located on the right edge of the display, are indicated in bold type.
MXA signal analyzer with N9073A W-CDMA measurement application

3
Available measurements N9073A-1FP W-CDMA measurement application
• Channel power
• ACP (adjacent channel power) for ACLR
• Spectrum emission mask
• Spurious emissions
• Occupied bandwidth
• Power statistics CCDF
• Code domain analysis
• Modulation accuracy (composite EVM)
• Power control (slot power, PRACH power and slot phase for UE phase discontinuity)
• QPSK EVM
• Monitor spectrum1
• IQ waveform2
1 Monitor spectrum is a simple frequency domain measurement. If you need to have more tools like markers and trace math, please use Swept SA in spectrum analyzer mode.
2 IQ waveform provides I/Q sampled time domain traces.
N9073A-2FP HSDPA/HSUPA measurement application adds the following capabilities to 1FP (*)
*1FP is a mandatory option for 2FP to enable following modulation analysis features.
• Code domain analysis• Pre-defined test model 5• HS-PDSCH 16QAM/QPSK auto-
detection• Demodulated bits in binary/
hexadecimal format• Adaptive modulation and coding
(AMC) signal analysis• Correct power beta calculation
based on DPCH/E-DPCH configuration defined in 3GPP TS25.213
• E-RGCH/E-AGCH/E-HICH analysis in downlink
• E-DPCCH and E-DPDCH in SF2 demodulation in uplink
• Modulation accuracy• HSDPA and HSUPA signal for
EVM measurements
Available Measurements

4
Demonstration preparation
The following instruments and software are required for the Agilent MXG N5182A and the X-Series instrument in order to perform these demonstrations. Please update the instrument firmware and software to the latest version, available at www.agilent.com/find/mxg, www.agilent.com/find/mxa, and www.agilent.com/find/exa.
Instruments Model number Required options
Agilent MXG vector N5182A • 503 or 506 – frequency range at signal generator 3 GHz or 6 GHz • 651, 652 or 654 – internal baseband generator • UNV – Enhanced dynamic range (required for better ACP performance)
Signal Studio software N7600B • 3GPP W-CDMA FDD
X-Series signal analyzers N9020A MXA • 503, 508 (507 for EXA), 513, or 526 firmware revision – frequency range up to 26.5 GHz A.01.14 or later • EA3 – Electric attenuator, 3.6 GHz (recommended) N9010A EXA • P0x – Preampifier (recommended) A.01.2x or later • N9020A-B25 – Analysis bandwidth 25 MHz (required for analysis over 10 MHz up to 25 MHz bandwidth such as 4-carrier CCDF in W-CDMA downlink)
X-Series measurement N9073A • 1FP W-CDMA measurement application application • 2FP HSDPA/HSUPA measurement application
Controller PC for • Install N7600B to generate and Signal Studio download the signal waveform into the Agilent MXG via GPIB or LAN (TCP/IP). Please refer the online documentation for installation and setup.
Demonstration Preparation

5
Instructions Software operations
On the Signal Studio software:
Start the Signal Studio software. Start > Program > Agilent Signal Studio > 3GPP W-CDMA
Configure the Agilent MXG as a Follow the Signal Studio instructions to connect to hardware connected via GPIB or the Agilent N5182A MXG.LAN (TCP/IP).
Set the basic parameters of the Click Signal Generator at the Hardware on the signal at center frequency 2.14 GHz, explorer menu at the left hand. amplitude –20 dBm and RF Output Press [Preset] green button on the top.turned ON. Frequency = 2.14 GHz, Amplitude = –20 dBm, RF Output = On, ALC = On
Select the predefined test model Click Carrier 1 under Waveform Setup on the in waveform setup. Default setting explorer menu at the left hand.must be W-CDMA FDD Downlink Channel Configuration = Test Model 1 + 64 DPCHwith Test Model 1 + 64 DPCH. Pull down the Channel Configuration menu to see how many predefined configurations are available for W-CDMA FDD Downlink.
Confirm the test signal condition Click Channel Setup to see each channel in detail channel setup. parameters, states and CDP/CCDF display.
Download the signal to Agilent MXG. Press Generate and Download button on the top tool bar. If you encounter any errors, please refer the online help of Signal Studio software.
Save the signal file for future reuse. File > Save As… > WCDMA_Demo1.scp (Name it as you like.)
Export the waveform file for File > Export Waveform Data > Demo1.wfm future reuse. (Name it as you like.)
To configure these instruments, connect the Agilent MXG’s 50 Ω RF output to X-Series analyzer's 50 Ω RF input with a 50 Ω RF cable. Turn on the power in both instruments.
Now, set up the Agilent MXG and Signal Studio software to generate a W-CDMA signal (test model 1).
Demonstration Preparation (continued)

6
Channel Power
Channel powerThe channel power measurement identifies the channel power within a specific bandwidth (default of 5-MHz, as per 3GPP W-CDMA technical specifications) and the power spectral density (PSD) in dBm/Hz.
Control the following channel power measurement parameters:
• Integration bandwidth (defaults to 5 MHz)
• Number of trace averages (default to 200)
• Data points displays, 101 to 20001 (default to 1001)
• Turn on RRC filter with flexible filter alpha value (default to Off)
• Trigger source: free run, video, line, external-1/2, RF burst, and periodic timer (default to free run)
Instructions Keystrokes
On the X-Series analyzer W-CDMA mode:
Move to W-CDMA mode. If [Mode Preset] [Mode] W-CDMA with N9073A-2FP installed, the key must HSDPA/HSUPAbe W-CDMA with HSDPA/HSUPA.
Choose transmitter radio device for [Mode Setup] Radio Device BTS MSbase station (downlink).
Set a center frequency at 2.14 GHz. [FREQ] [2.14] GHz
Run a channel power measurement. [Meas] Channel Power
Figure 1. Channel power in W-CDMA mode

7
ACP
Adjacent channel power (ACP)Reducing transmitter channel leakage allows for more channels to be transmitted simultaneously, which, in turn, increases base station efficiency. The ACP, designated by the 3GPP W-CDMA specifications as the adjacent channel leakage power ratio (ACLR), is a measure of the power in adjacent channels relative to the transmitted power. The standard requires the power of both the transmitted and adjacent channels be measured through root raised cosine (RRC) filter with a roll-off factor of 0.22.
• Measure up to 12 carriers for multi-carrier ACP (Figure 3 shows 4-carrier W-CDMP ACP sample)
• Adjust integration bandwidth
• Select up to six channel offsets
• Choose channel offset frequency
• Adjust and display both absolute and relative power
• View bar graph over spectrum trace
• Use built-in averaging detector (RMS) for speed and accuracy
• Turn on RRC filter with flexible filter alpha value
• Noise correction On/Off (default to Off)
Instructions Keystrokes
On the X-Series analyzer W-CDMA mode:
Measure ACP with Test Model 1 + [Meas] ACP64 DPCH at 2.14 GHz.
Adjust the power level by [AMPTD] Attenuation > [up] [down] arrow keys changing attenuation. (to add or reduce attenuations)
Adjust the limit for one offset pair. [Meas Setup] Offset/Limits > Offset A > More > Notice as green PASS indicator in Rel Lim (Car) > [–90] dBthe upper left corner changes to a red FAIL when the signal does not meet limit requirements.
Compare the measured result [Meas Setup] More > Noise Correction On Offwith noise correction turned On. A better ACP result is achieved with noise correction (Figure 2).

8
Figure 2. ACP with fail indicator on limit test and noise correction
Figure 3. ACP with four-carrier W-CDMA (sample screen)
ACP (continued)

9
Spectrum Emission Mask (SEM)
Spectrum emission mask (SEM)The spectrum emission mask measurement required by 3GPP specifications encompasses different power limits and different measurement bandwidths (resolution bandwidths) at various frequency offsets. Figure 4 is a diagram of the specification requirements for power density versus frequency offset from carrier (excerpt from the 3GPP TS25.104 v.6.9.0). Completing the many measurements required to comply with this standard is made quick and easy with anX-Series signal analyzer.
Instructions Keystrokes
On the X-Series analyzer W-CDMA mode:
Activate a spectrum emission [Meas] Spectrum Emission Maskmask measurement.
Set the preference level at 0 dBm. [AMPTD] Ref Value [0] dBm
Choose the type of values to display. [View/Display] Abs Pwr Freq or Rel Pwr Freq or Observe the measurement values Integrated Powerchange in the lower window to reflect the selected value type (Figure 5).
View customizable offsets and limits. [Meas Setup] Offset/Limits > More > LimitsMeasurement parameters as well as limit values may be customized for any of the six offset pairs A through F or for any individual offset.
Figure 4. W-CDMA specifications for SEM (from TS 25.104 v.6.9.0)
Frequency separation ∆f from the carrier [MHz]
Illustrative diagram of spectrum emission mask
Note:The default settings in SEM take account the test tolerances defined in TS25.141.

10
Figure 5. Spectrum emission mask
Spectrum Emission Mask (SEM) (continued)

11
Spurious Emissions
Spurious emissionsThe spurious emissions measurement identifies and determines the power level of spurious emissions in 3GPP defined frequency bands. The measurement allows the user to set pass/fail limits and a reported spur threshold value. The results are conveniently displayed in a result table that can show up to 200 values.
Note:When RMS detector is used in an X-Series analyzer, VBW is automatically set to RBW:VBW as 10:1.
Instructions Keystrokes
On the X-Series analyzer W-CDMA mode:
Move to the spurious emissions. [Meas] Spurious emissions
Edit the range table as shown in [Meas Setup] Range Tablethe table below. This is modified for the carrier at 2.14-GHz.
Range Start Stop RBW Filter Abs Start Limit
1 9 kHz 150 kHz 1 kHz Gaussian –36 dBm
2 150 kHz 30 MHz 10 kHz Gaussian –36 dBm
3 30 MHz 1 GHz 100 kHz Gaussian –36 dBm
4 1 GHz 2.1 GHz 1 MHz Gaussian –30 dBm
5 2.1 GHz 2.1 GHz 1 MHz Gaussian –25 dBm
6 2.1 GHz 2.1275 GHz 1 MHz Gaussian –15 dBm
7 2.1525 GHz 2.18 GHz 1 MHz Gaussian –15 dBm
8 2.18 GHz 2.18 GHz 1 MHz Gaussian –25 dBm
9 2.18 GHz 12.75 GHz 1 MHz Gaussian –30 dBm
Run a single spurious measurement. [Single]
Search a spurious detected as fifth [Meas Setup] Spur > 5 [Enter](Figure 6).
This demo procedure shows how to edit the range table and how to look up spurious detected. The range table refers to 3GPP TS25.141 v7.4.0 Section 6.5.3.7.2 (Band I, Category B).

12
Figure 6. Spurious emissions
Spurious Emissions (continued)
Note: The instrument shows a warning status at the bottom line as “AC coupled: Accy unspec’d < 10-MHz”. This comes out when the measured frequency set to below 10 MHz. Please refer to the instrument User’s Guide for more details.

13
Occupied Bandwidth
Occupied bandwidthThe 3GPP specifications require the occupied bandwidth (OBW) of a transmitted W-CDMA signal to be less than 5 MHz, where occupied bandwidth is defined as the bandwidth containing 99% of the total channel power.
• Changeable occupied bandwidth % power
• Measure 99% occupied bandwidth and the x dB bandwidth as well
Instructions Keystrokes
On the X-Series analyzer W-CDMA mode:
Measure the occupied bandwidth [Meas] Occupied Bandwidth(Figure 7). [Meas Setup]
Figure 7. Occupied bandwidth
In this measurement, the total power of the displayed span is measured. Then the power is measured inward from the right and left extremes until 0.5% of the power accounted for in each of the upper and lower part of the span. The calculated difference is the occupied bandwidth. In accordance with the 3GPP specification, the N9073A W-CDMA mode defaults to a 5 MHz PASS/FAIL limit values.

14
Power Statistics CCDF
Power Statistics CCDFThe complementary cumulative distortion function (CCDF) is a plot of peak-to-average power ratio (PAR) versus probability and fully characterized the power statistics of a signal. It is a key tool for power amplifier design for W-CDMA and HSDPA base stations, which is particularly challenging because the amplifier must be capable of handling the high PAR which the signal exhibits while maintaining good adjacent channel leakage performance. Designing multi-carrier power amplifiers pushes complexity yet another step further.
• Set a reference trace, compare to Gaussian noise trace
• Select measurement bandwidth and measurement interval
• Choose trigger source: video, line, external-1/2, RF burst, and periodic timer
Instructions Keystrokes
On the X-Series analyzer W-CDMA mode:
Measure the CDDF and check the [Meas] Power Stat CCDFsetup menus (Figure 8).
This exercise illustrates the simplicity of measuring CCDF for W-CDMA.
If W-CDMA multi-carrier power amplifier (MCPA) needs to be measured in CCDF, N9020A-B25 is required for wider analysis bandwidth up to 25 MHz available on MXA N9020A. EXA N9010A can measure CCDF with < 10 MHz bandwidth.

15
Figure 9. CCDF with four-carrier W-CDMA in 25 MHz bandwidth (sample with MXA N9020A plus B25)
Figure 8. CCDF
Power Statistics CCDF (continued)

16
Code Domain
Code domain analysis The code domain analysis measurement provides a variety of different results and traces.
First, code domain power analysis measures the distribution of signal power across the set of code channels, normalized to the total signal power. This measurement helps to verify that each code channel is operating at its proper level and helps to identify problems throughout the transmitter design from coding to the RF section. System imperfections, such as amplifier non-linearity, will present themselves as an undesired distribution of power in the code domain.
• Measure peak EVM, RMS EVM, phase and magnitude error, total power and channel power
• Re-demodulate data using manually adjustable parameters: select a code channel from 0 to 511 and set the symbol rate for 7.5-ksps to 960 ksps
• Select from multiple synchronization options, set sync type CPICH, SCH, symbol based, antenna-2 CPICH in STTD, SCH Antenna-1 or 2 in TSTD for downlink
• PRACH message synchronization with preamble signature detection and DPCCH sync for uplink
Now analyze the W-CDMA signal in code domain measurement.
Instructions Keystrokes
On the X-Series analyzer W-CDMA mode:
Run a code domain measurement. [Meas] Code Domain
Specify the synchronization start [Meas Setup] Sync Start Slot 0 On/Offslot number.
Change to Single measurement. [Single]
Look at the power and symbol rate [Marker] [32] [Enter]of a specific channel with a marker. It’s PICH (paging indicator channel) at C8(16).
Examine characteristics of the code [Marker->] Mkr -> Despread
channel with the active marker at C8(16) (Figure 10).
Show I and Q symbol bits. [View/Display] Demod Bits
Shift the selected slot to the symbol [Meas Setup] Meas Offset or power off gap. rotate Knob or use [up] [down] arrow keys
Change bit format from binary (0,1) to [Meas Setup] Symbol Analysis > tri-state (0, 1, X) to make burst off DTX/Burst Detect On/Offperiod more visible in demodulated bits (Figure 11).

17
Code Domain (continued)
Figure 11. Code domain symbol power and demodulated bits (power off period shown in XXXX)
Figure 10. Code domain power graph with a marker at PICH, C8(16)
• Select pre-defined test models for enforced active channel identification
• View power graph and metrics, CDP and CDE graphs, I/Q error, code domain quad view, or demod bits
• Increase analysis depth using 8 or 16 frames with capture interval
• Add advanced symbol analysis for compressed mode, burst/DTX and closed loop diversity

18
Code Domain (continued)
HSDPA in 3GPP release 5 or laterRelease 5 of 3GPP specifications add high speed downlink packed access (HSDPA) in an effort to make the system more efficient for packet data applications to increasing peak data rates and reducing packet latency. Theoretical peak data rate is approximately 14 Mbps in maximum. To improve W-CDMA system performance, HSDPA makes a number of changes to the radio interface, that mainly affect the physical layer:
• New high-speed downlink channels, HS-PDSCH (high speed physical downlink shared channel) in
16 QAM modulation in addition to QPSK modulation and HS-SCCH
(high speed shared control channel) carrying UE identity and channel parameters of the associated
HS-PDSCH
• New uplink control channel, HS-DPCCH
• Fast link adaptation using adaptive modulation and coding (AMC)
• Use of hybrid automatic-repeat-request (HARQ)
Instructions Software operations
On the Signal Studio software:
Modify the waveform setup from Click Carrier 1 under Waveform Setup on the W-CDMA FDD downlink with explorer menu at the left hand.Test Model 1 + 64 DPCH to Channel Configuration = Test Model 5 + Test Model 5 + 8 HS-PDSCH. 8 HS-PDSCH
Confirm the test signal condition Click Channel Setup to see each channel in detail channel setup. parameters, states and CDP/CCDF display.
Download the signal to the Press Generate and Download on the top tool bar. Agilent MXG.
Now change the signal from W-CDMA test mode 1 to HSDPA test model 5 + 8 HS-PDSCH.

19
Code Domain (continued)
Code domain in W-CDMA mode has flexibility to customize measurements for your particular needs. Setting the capture interval determines the measurement length – short for fast measurements or long for in-depth analysis to monitor any variance in time domain. Test models in downlink are pre-programmed to allow you for enforced active channel identification.
Instructions Keystrokes
On the X-Series analyzer W-CDMA mode:
Return to the power graph. [View/Display] Power Graph & Metrics
Use predefined test model for [Meas Setup] Symbol Boundary > active channel identification. Predefined Test Models > Test Model 5 w/8 HSPDSCH
Change measurement from [Single]continuous to single.
Look at the power and symbol [Marker] [140] [Enter] rate of a selected HS-PDSCH.
Despread the marked code channel, [Marker->] Mkr -> DespreadHS-PDSCH at C4(4).
Switch the view to observe the [View/Display] Code Domain (Quad View)selected HS-PDSCH (Figure 12).
Change the view for demodulated [View/Display] Demod Bitsbits, move the selected window to the [Next Window] bottom, and switch bit format from binary to hexadecimal (Figure 13). [View/Display] Demod Bits > Demod Bit Format Binary|Hex
Now examine the HSDPA test model 5 in code domain analysis.

20
Code Domain (continued)
Figure 13. Code domain demodulated bits in hexadecimal format
Figure 12. Code domain quad view with HS-PDSCH in 16QAM symbol analysis
Code domain quad view:Upper left: Code domain power graph Upper right: Symbol power trace in yellow, chip power trace in aqua blue. Lower left: I/Q symbol constellation of the selected code channel. Lower right: Symbol analysis results of the selected code channel.
Demodulated bits:Lower window contains demodulated bits of the selected code channel in measured interval.

21
Following features are available for HSUPA with N9073A-2FP
• Auto-detection of E-DPDCH in spreading factor 2 and 4
• E-DPCCH power beta calculation based on 3GPP standard configuration
• Adaptive modulation analysis capability
Instructions Keystrokes
On the X-Series analyzer W-CDMA mode:
Change the radio device for [Mode Setup] Radio Device BTS MSuplink code domain analysis. [FREQ] [1.95] GHz
Return to the power graph. [View/Display] Power Graph & Metrics
Look at the power and symbol rate [Marker] [130] [Enter] of a selected E-DPDCH.
Change configuration for correct [Meas Setup] DPCH/E-DPCH Config -> 3 beta calculations and run a single (no DPDCH) [Single] [Restart]measurement (Figure 14).
Despread the marked code channel, [Marker->] Mkr -> DespreadE-DPDCH.
Check the symbol analysis results [View/Display] Code Domain (Quad View)in code domain quad view (Figure 15).
Now examine the HSUPA signal with E-DPDCH in SF 2 and SF 4.
Code Domain (continued)
HSUPA in 3GPP release 6High speed uplink packed access (HSUPA) is a new technology over W-CDMA and HSDPA defined in 3GPP release 6 to improve the uplink data rate. It is also described as E-DCH (enhanced dedicated channel) in 3GPP standards. Theoretically, it may improve the uplink data rate to 5.76 Mbps with new uplink physical channels of E-DPCCH (E-DCH dedicated physical control channel) and E-DPDCH (E-DCH dedicated physical data channel). In downlink, there are three physical channels for HSUPA as E-AGCH (E-DCH absolute grant channel), E-RGCH (E-DCH relative grant channel) and E-HICH (E-DCH HARQ indicator channel).
Instructions Software operations
On the Signal Studio software:
Delete carrier 1 W-CDMA FDD Click Carrier 1 under Waveform Setup on the downlink signal. explorer menu at the left hand. Press [X] on the tool bar or use [Delete] on your PC keyboard.
Put a carrier of W-CDMA FDD Press [+] on the tool bar, and select W-CDMA uplink for new configuration. FDD Uplink from the drop-down menu.
Set a center frequency at 1.95 GHz Press [Preset] green button on the topfor uplink. Frequency = 1.95 GHz, Amplitude = -20 dBm, RF Output = On, ALC = On
Change the channel configuration Channel Configuration = from default DPCCH to DPCCH + E-DPCCH + 4 E-DPDCHDPCCH + E-DPCCH + 4 E-DPDCH.
Confirm the test signal condition Click Channel Setup to see each channel in detail channel setup. parameters, states and CDP/CCDF display.
Download the signal to the Press Generate and Download on the top tool bar.Agilent MXG.
Now change the signal from HSDPA downlink test model 5 to HSUPA uplink signal.

22
Figure 15. Code domain quad view with E-DPDCH in SF2 symbol analysis
Figure 14. Code domain power graph with HSUPA signal
Code Domain (continued)

23
Modulation Accuracy (Composite EVM)
Modulation accuracy (composite EVM)Error vector magnitude (EVM) is defined in 3GPP conformance tests for both downlink and uplink. EVM is a common modulation quality metric widely used in digital communications. Mod accuracy (composite EVM) measures the EVM of the multi-code channel signal. It is valuable for evaluating the quality of the transmitter for a multi-channel signal, detecting spreading or scrambling errors, identifying certain problems between baseband and RF sections, and analyzing errors that cause high interference in the signal.
Instructions Keystrokes
On the X-Series analyzer W-CDMA mode:
Go to modulation accuracy [Meas] Mod Accuracy (Composite EVM)measurement in a single [Single]measurement control (Figure 16).Observe the I/Q measured polar vector display on the right and the quantitative data provided on the left.
View magnitude error, phase [View/Display] I/Q Errorerror, and EVM plots over 15 slots (1 frame) (Figure 17).
Key features in modulation accuracy:
Common in downlink/uplink:
• Composite EVM, peak CDE, and phase/magnitude/frequency error measurements
• Capture interval up to 15 slots (1 frame) for 3GPP release 6 requirement
• Various views of I/Q polar graph, I/Q error, code domain power, and
slot CDE/EVM
• Capture time summary table and peak/average metrics for easier result analysis
• Multi-channel estimator to align individual code channels to the pilot channel and reduce phase error influence
• Optional internal preamplifier to measure low-level signals
Downlink:
• Auto detection of W-CDMA and HSDPA channel configurations
• Space time transmit diversity (STTD) measurements for dual antenna measurements
• Select multiple synchronization options, set sync type from CPICH, SCH, symbol based, antenna-2 CPICH in STTD, SCH antenna-1 or 2 in TSTD
Uplink:
• Auto detection of W-CDMA, HSDPA, and HSUPA channel configurations
• PRACH message synchronization with preamble signature detectionand DPCCH sync

24
Available view and traces in modulation accuracyI/Q measured polar graph: Metrics (left) and I/Q measured polar vector graph (right). The I/Q polar traces are not averaged, even if the averaging turned On.
I/Q Error: Three windows of EVM (upper), magnitude error (middle) and phase error (lower) during the captured 1 frame length as chip traces. When sync start slot number set, I/Q error view shows which slot has any problems in EVM, magnitude error, and/or phase error.
Code domain power: Power bar graph in upper and metrics in lower windows. Each code channels detected as active are listed with code number, power and CDE in dB.
Peak/avg metrics: Numeric result table with average and peak hold statistic results.
Capture time summary: The summary table provides measurement results of multiple slots for conformance tests. It highlights the peak (or worst) slot values in yellow.
Slot CDE/EVM: The three windows shown are EVM (upper), peak CDE (middle), and frequency error (lower). They are calculated on a slot basis.
Figure 17. Error plots over 15 slots
Figure 16. Modulation accuracy of HSUPA signal
Modulation Accuracy (Composite EVM) (continued)

25
Figure 18. Capture time summary
Modulation Accuracy (Composite EVM) (continued)
Instructions Keystrokes
On the X-Series analyzer W-CDMA mode:
View code domain power to check [View/Display] Code Domain Powerthe channel power and CDE. [Next Window] Look through the list by expanding [Zoom] the view with the zoom key.
View the Peak/avg metrics to [View/Display] Peak/Avg Metricsmonitor the worst value over the averaging period.
View the result summary table [View/Display] Capture Time Summaryover the captured 15 slots. Find the average over the captured period on the bottom (Figure 18).
View the EVM, peak CDE, and [View/Display] Slot CDE/EVMfrequency error results in the slot-based trace.

26
Power Control
Power controlThe power control measurement capability is one of the major functions of a W-CDMA (3GPP) digital radio system. This power control measurement provides a solution for users to make 3GPP uplink conformance tests, and can be used to accurately design, characterize, evaluate, and verify 3GPP transmitters, components, and devices for mobile stations.
The power control measurement includes three types of measurements:
• Slot power measures uplink slot power level (Figure 19).
• PRACH power measures uplink PRACH preamble power level and message power level (Figure 20).
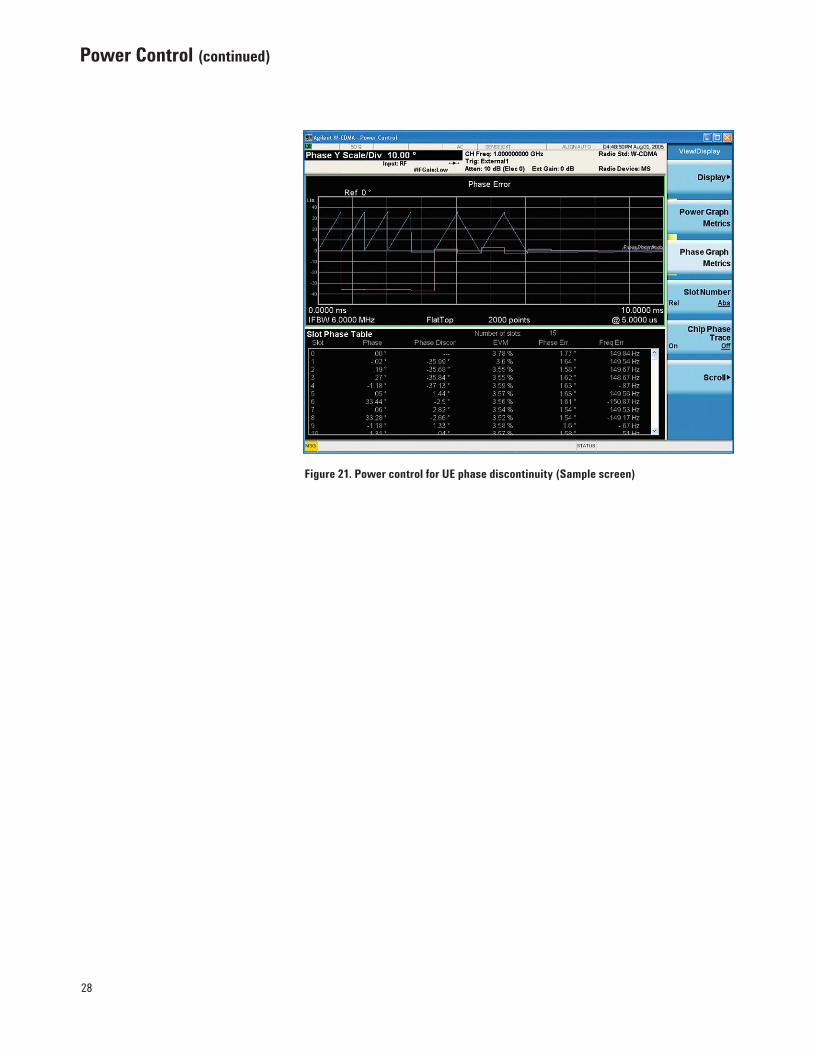
• Slot phase measures phase error, frequency error and EVM of uplink slots in addition to their slot power. It is designed for 3GPP UE phase discontinuity (Figure 21).
The slot power measurement measures uplink slot power level.
The PRACH power measurement measures uplink PRACH preamble power level and message power level.
The slot phase measurement measures phase error, frequency error, and EVM of uplink slots in addition to their slot power.
The slot power and PRACH power measurement can be done using two methods:
• Waveform method is asynchronous. It provides results using a specified information bandwidth and a specified filter type for the number of frames, 1 through 8, specified by the capture interval. It is faster than the chip power method because there is no synchronization with DPCCH.
• Chip power method is synchronized to chip timing. It re-samples the power measurement results based on the chip clock timing of the radio system. Because of the synchronization to accurate chip timing, it is slower than the waveform method.
The slot phase measurement is always made based on synchronized chip timing.
Note:When BTS is selected in Radio Device, power control measurement is enabled, but this measurement is designed for uplink power control analysis. As for downlink power control, it can be measured in code domain measurement to see the symbol power trace for the selected code channel.
Please refer to Figures 19, 20, and 21 for a samples of power control measurement capabilities. Test signals are used in samples at 1 GHz.

27
Figure 19. Power control for slot power (Sample screen)
Figure 20. Power control for PRACH power (Sample screen)
Power Control (continued)
28
Figure 21. Power control for UE phase discontinuity (Sample screen)
Power Control (continued)

29
QPSK EVM
QPSK EVMThe quadrature phase shift keying (QPSK) error vector magnitude (EVM) measurement is a measure of phase and amplitude modulation quality that relates the performance of the actual signal compared to an ideal signal as a percentage, as calculated over the course of the ideal constellation. These phase and frequency errors are measures of modulation quality for the W-CDMA (3GPP) system, and can be quantified through QPSK EVM measurements. This is just for a single channel signal in QPSK modulation. It is useful in troubleshooting when the W-CDMA signal fails the synchronization. Any single code channel in QPSK can be measured EVM without de-scrambling. It can be used for PRACH preamble EVM by using longer measure interval up to 4096 chip. For multiple code channels signal, modulation accuracy (composite EVM) measurement is available in W-CDMA mode.
Instructions Software operations
On the Signal Studio software:
Change the channel configuration Channel Configuration = DPCCHfrom HSUPA configuration to DPCCH only.
Confirm the test signal condition Click Channel Setup to see each channel in detail channel setup. parameters, states and CDP/CCDF display.
Download the signal to the Press Generate and Download button on the top Agilent MXG. tool bar.
Instructions Keystrokes
On the X-Series analyzer W-CDMA mode:
Run a measurement of QPSK [MEAS] QPSK EVMEVM (Figure 22).
Switch the view to I/Q error [View/Display] I/Q Errorquad view (Figure 23).

30
Figure 23. QPSK EVM in I/Q error quad view
Figure 22. QPSK EVM in polar graph
QPSK EVM (continued)

31
N9073A Key Specifications
W-CDMA and HSDPA/HSUPA measurement applications
Conformance with 3GPP TS 25.141 base station requirements Note: Those tolerances marked as 95% are derived from 95th percentile
3GPP required test Instrument instrument tolerance tolerance interval Supplemental informationSub-clause Name (as of 2006-03) for MXA N9020A with EXA specifications1
Standard sections (Measurement name)
6.2.1 Maximum output power ±0.7 dB (95%) ±0.23 dB (95%) ±0.30 dB (95%, EXA) (channel power)
6.2.2 CPICH power accuracy ±0.8 dB (95%) ±0.25 dB (95%) ±0.32 dB (95%, EXA) (code domain)
6.3 Frequency error ±12 Hz (95%) ±5 Hz (100%) Excluding timebase error (modulation accuracy)
6.4.2 Power control steps (code domain) 1 dB step ±0.1 dB (95%) ±0.03 dB (100%) Ten 1 dB steps ±0.1 dB (95%) ±0.03 dB (100%)
6.4.3 Power dynamic range ±1.1 dB (95%) ±0.14 dB (100%)
6.4.4 Total power dynamic range ±0.3 dB (95%) ±0.06 dB (100%) (code domain)
6.5.1 Occupied bandwidth ±100 kHz (95%) ±10 kHz (100%)
6.5.2.1 Spectrum emission mask ±1.5 dB (95%) ±0.27 dB (95%) Absolute peak ±0.34 dB (95%, EXA)
6.5.2.2 ACLR 5 MHz offset ±0.8 dB (95%) ±0.49 dB (100%) ±1.07 dB (100%, EXA) 10 MHz offset ±0.8 dB (95%) ±0.44 dB (100%) ±1.00 dB (100%, EXA)
6.5.3 Spurious emissions f <= 2.2 GHz ±1.5 dB (95%) ±0.29 dB (95%) ±0.41 dB (95%, EXA) 2.2 GHz < f <= 4 GHz ±2.0 dB (95%) ±1.17 dB (95%) ±1.22 dB (95%, EXA) 4 GHz < f ±4.0 dB (95%) ±1.54 dB (95%) ±1.59 dB (95%, EXA)
6.7.1 EVM (modulation accuracy) ±2.5 % (95%) ±0.5 % (100%) EVM in the range of 12.5% to 22.5%
6.7.2 Peak code domain error ±1.0 dB (95%) ±1.0 dB (100%) (modulation accuracy)
6.7.3 Time alignment error in Tx ±26 nsec (95%) ±1.25 nsec (100%) diversity (modulation accuracy) [= 0.1 Tc]
observations with 95% confidence. Those tolerances marked as 100% are derived from 100% limits tested observations. Only the 100% limit tested observations are covered by the product warranty.
1. MXA specifi cations are applicable to EXA unless stated in supplemental information.

32
N9073A Key Specifications (continued)
Channel power MXA N9020A EXA N9010A
Minimum power at RF input –50 dBm (nominal) –50 dBm (nominal)
Absolute power accuracy ±0.82 dB (±0.23 dB 95% confidence) ±0.94 dB (±0.30 dB 95% confidence)(Atten = 10 dB)
Measurement floor –83.8 dBm (nominal) –79.8 dBm (nominal)
Adjacent channel power (ACPR, ACLR)
Single carrier
Minimum power at RF input –36 dBm (nominal)
ACPR accuracy RRC weighted, 3.84 MHz noise BW, method = IBW or fast Radio Offset frequency MS (UE) 5 MHz ±0.14 dB (ACPR –30 to –36 dBc) ±0.22 dB (ACPR –30 to –36 dBc) MS (UE) 10 MHz ±0.21 dB (ACPR –40 to –46 dBc) ±0.34 dB (ACPR –40 to –46 dBc) BTS 5 MHz ±0.49 dB (ACPR –42 to –48 dBc) ±1.07 dB (ACPR –42 to –48 dBc) BTS 10 MHz ±0.44 dB (ACPR –48 to –53 dBc) ±1.00 dB (ACPR –48 to –53 dBc) BTS 5 MHz ±0.21 dB (–48 dBc non coherent ACPR) ±0.44 dB (–48 dBc non coherent ACPR)
Dynamic range RRC weighted, 3.84 MHz noise BW Noise Offset Dynamic range Optimum ML Dynamic range Optimum ML correction frequency Method (typical) (nominal) (typical) (nominal) Off 5 MHz IBW –73 dB –8 dBm –68 dB –8 dBm Off 5 MHz Fast –72 dB –9 dBm –67 dB –9 dBm Off 10 MHz IBW –79 dB –2 dBm –74 dB –2 dBm On 5 MHz IBW –78 dB –8 dBm –73 dB –8 dBm On 10 MHz IBW –82 dB –2 dBm –76 dB –2 dBm
RRC weighting accuracy White noise in adjacent channel 0.00 dB (nominal) 0.00 dB (nominal) TOI-induced spectrum 0.001 dB (nominal) 0.001 dB (nominal) rms CW error 0.012 dB (nominal) 0.012 dB (nominal)
Multiple carriers
ACPR dynamic range –70 dB (nominal) (two carriers, 5 MHz offset)
ACPR accuracy (two carriers, ±0.42 dB (nominal) 5 MHz offset, –48 dBc ACPR)
ACPR dynamic range Dynamic range Optimum ML (four carriers, 5 MHz offset) (nominal) (nominal) –72 dB (NC on) –64 dB (NC off) –18 dB (NC off) –21 dB (NC on)
ACPR accuracy (four carriers, ±0.39 dB (NC off, optimum ML –18 dBm (nominal)) 5 MHz offset, BTS, incoherent TOI, ±0.15 dB (NC on, optimum ML –21 dBm (nominal)) ACPR range –42 to –48 dB)

33
Spectrum emission mask MXA N9020A EXA N9010A
Dynamic range, 81.9 dB, (88.2 dB typical) 76.5 dB, (83.9 dB typical)relative 2.515 MHz offset
Sensitivity, absolute 2.515 MHz offset –99.7 dBm, (–104.7 dBm typical) –94.7 dBm, (–100.7 dBm typical)
Accuracy, 2.515 MHz offset Relative ±0.12 dB ±0.12 dB Absolute (20 to 30 °C) ±0.88 dB, (±0.27 dB 95% confidence) ±1.05 dB, (±0.34 dB 95% confidence)
Spurious emissionsTable-driven spurious signals, search across regions
Dynamic range, relative 95.3 dB, (100.3 dB typical) 91.9 dB, (97.1 dB typical)
Sensitivity, absolute –84.4 dBm, (–89.4 dBm typical) –79.4 dBm, (–85.4 dBm typical)
Accuracy Attenuation = 10 dB Attenuation = 10 dB Frequency range 20 Hz to 3.6 GHz ±0.29 dB (95% confidence) ±0.41 dB (95% confidence, 9 kHz to 3.6 GHz) 3.5 GHz to 8.4 GHz ±1.17 dB (95% confidence) ±1.22 dB (95% confidence, 3.5 kHz to 7.0 GHz) 8.3 GHz to 13.6 GHz ±1.54 dB (95% confidence) ±1.59 dB (95% confidence, 6.9 kHz to 13.6 GHz)
Occupied bandwidth
Minimum power at RF input –30 dBm (nominal) –30 dBm (nominal)
Frequency accuracy ±10 kHz (RBW = 30 kHz, ±10 kHz (RBW = 30 kHz, Number of points = 1001, span = 10 MHz) Number of points = 1001, span = 10 MHz)
Power statistics CCDF
Histogram resolution 0.01 dB 0.01 dB
N9073A Key Specifications (continued)

34
N9073A Key Specifications (continued)
Code domainBTS measurements, –25 dBm ≤ mixer level ≤ –15 dBm, 20 to 30 °C
Code domain power MXA N9020A EXA N9010A
Absolute accuracy ±0.25 dB (95% confidence) ±0.32 dB (95% confidence)(–10 dBc CPICH, Atten = 10 dB)
Relative accuracy CDP range between 0 and –10 dBc ±0.015 dB ±0.015 dB CDP range between –10 to –30 dBc ±0.06 dB ±0.06 dB CDP range between –30 to –40 dBc ±0.07 dB ±0.07 dB
Accuracy, power control steps CDP range between 0 and –10 dBc ±0.03 dB ±0.03 dB CDP range between –10 to –30 dBc ±0.12 dB ±0.12 dB
Accuracy, power dynamic range CDP range 0 to –40 dBc ±0.14 dB ±0.14 dB
Symbol power vs time
Relative accuracy in symbol power vs. time CDP range between 0 and –10 dBc ±0.015 dB ±0.015 dB CDP range between –10 to –30 dBc ±0.06 dB ±0.06 dB CDP range between –30 to –40 dBc ±0.07 dB ±0.07 dB
Accuracy, symbol error vector magnitude CDP range between 0 to –25 dBc ±1.0% (nominal) ±1.0% (nominal)
Modulation accuracy (composite EVM) BTS measurements, –25 dBm ≤ mixer level ≤ –15 dBm, 20 to 30 °C
Composite EVM accuracy ±1.0%, (±0.5% in the range of 12.5% to 22.5%) ±1.0%, (±0.5% in the range of 12.5% to 22.5%)
Peak code domain error accuracy ±1.0 dB ±1.0 dB
I/Q origin offset, DUT maximum offset –10 dBc (nominal) –10 dBc (nominal)
I/Q origin offset, analyzer noise floor –50 dBc (nominal) –50 dBc (nominal)
Frequency error range ±3 kHz (nominal) ±3 kHz (nominal)
Frequency error accuracy ±5 Hz + (transmitter frequency x ±5 Hz + (transmitter frequency x frequency reference accuracy) frequency reference accuracy)
Time offset Relative frame offset accuracy ±5.0 nsec (nominal) ±5.0 nsec (nominal) Relative offset accuracy (for ±1.25 nsec ±1.25 nsec STTD diff mode)

35
N9073A Key Specifications (continued)
Power control MXA N9020A EXA N9010AUsing 5 MHz resolution BW
Absolute power measurement Accuracy 0 to –20 dBm ±0.7 dB (nominal) ±0.7 dB (nominal) Accuracy –20 to –60 dBm ±1.0 dB (nominal) ±1.0 dB (nominal)
Relative power measurement accuracy Step range ±1.5 dB ±0.1 dB (nominal) ±0.1 dB (nominal) Step range ±3.0 dB ±0.15 dB (nominal) ±0.15 dB (nominal) Step range ±4.5 dB ±0.2 dB (nominal) ±0.2 dB (nominal) Step range ±26.0 dB ±0.3 dB (nominal) ±0.3 dB (nominal)
QPSK EVM –25 dBm ≤ Mixer level ≤ –15 dBm, 20 to 30 °C
EVM Range 0 to 25% 0 to 25% Floor 1.5% 1.6% Accuracy ±1.0% ±1.0%
I/Q origin offset DUT maximum offset –10 dBc (nominal) –10 dBc (nominal) Analyzer noise floor –50 dBc (nominal) –50 dBc (nominal)
Frequency error Range ±30 kHz (nominal) ±30 kHz (nominal) Accuracy ±5 Hz + (transmitter frequency x ±5 Hz + (transmitter frequency x frequency reference accuracy) frequency reference accuracy)

36
N9073A W-CDMA Measurement Application Ordering Information
N9073A W-CDMA measurement application ordering informationFor further information, refer to the MXA configuration guide, 5989-4943EN and EXA configuration guide, 5989-6531EN.
Instruments Model number Required options
MXA signal analyzer N9020A • 503, 508, 513, or 526 – frequency range up to 26.5 GHz • EA3 – Electric attenuator, 3.6 GHz (recommended) • P0x – Preampifier (recommended) • B25 – Analysis bandwidth 25 MHz (required for analysis over 10 MHz up to 25 MHz bandwidth such as 4-carrier CCDF in W-CDMA downlink)
EXA signal analyzer N9010A • 503, 507, 513, or 526 – frequency range up to 26.5 GHz • EA3 – Electric attenuator, 3.6 GHz (recommended) • P03 – Preampifier (recommended)
X-Series measurement N9073A • 1FP W-CDMA measurement application application • 2FP HSDPA/HSUPA measurement application

37
Related literature
Publication title Publication type Publication number
Agilent MXA Signal Analyzer
Agilent MXA Signal Analyzer Brochure 5989-5047EN
Agilent MXA Signal Analyzer Data Sheet 5989-4942EN
Agilent MXA Signal Analyzer Configuration Guide 5989-4943EN
Agilent EXA Signal Analyzer
Agilent EXA Signal Analyzer Brochure 5989-6527EN
Agilent EXA Signal Analyzer Data Sheet 5989-6529EN
Agilent EXA Signal Analyzer Configuration Guide 5989-6531EN
Agilent X-Series Signal Analyzers
Agilent X-Series Signal Analyzer (MXA/EXA) Demonstration Guide 5989-6126EN
Agilent X-Series Signal Analyzers Technical Overview 5989-5352EN(MXA/EXA) W-CDMA, HSDPA/HSUPA
Agilent X-Series Signal Analyzers Technical Overview 5989-5353EN(MXA/EXA) 802.16 OFDMA
Agilent X-Series Signal Analyzers Technical Overview 5989-5354EN(MXA/EXA) Phase Noise
Agilent X-Series Signal Analyzers Technical Overview 5989-6532EN(MXA/EXA) GSM/EDGE
Using Agilent X-Series Signal Analyzers Application Note 5989-4944EN(MXA/EXA) for Measuring and Troubleshooting Digitally Modulated Signals
Using Agilent X-Series Signal Analyzers Application Note 5989-4946EN(MXA/EXA) Preselector Tuning for AmplitudeAccuracy in Microwave Spectrum Analysis
Maximizing Measurement Speed with ApplicationNote 5989-4947ENAgilent X-Series Signal Analyzers (MXA/EXA)
Product Web site
For the most up-to-date and complete application and product information, please visit our product Web site at:
www.agilent.com/find/mxawww.agilent.com/find/exa

www.agilent.com/fi nd/emailupdatesGet the latest information on the products and applications you select.
www.agilent.com/fi nd/agilentdirectQuickly choose and use your test equipment solutions with confi dence.
Agilent Email Updates
Agilent Direct
www.agilent.comFor more information on Agilent Technologies’ products, applications or services, please contact your local Agilent offi ce. The com-plete list is available at:www.agilent.com/fi nd/contactus
AmericasCanada (877) 894-4414 Latin America 305 269 7500United States (800) 829-4444
Asia Pacifi cAustralia 1 800 629 485China 800 810 0189Hong Kong 800 938 693India 1 800 112 929Japan 81 426 56 7832Korea 080 769 0800Malaysia 1 800 888 848Singapore 1 800 375 8100Taiwan 0800 047 866Thailand 1 800 226 008
EuropeAustria 0820 87 44 11Belgium 32 (0) 2 404 93 40 Denmark 45 70 13 15 15Finland 358 (0) 10 855 2100France 0825 010 700Germany 01805 24 6333* *0.14€/minuteIreland 1890 924 204Italy 39 02 92 60 8484Netherlands 31 (0) 20 547 2111Spain 34 (91) 631 3300Sweden 0200-88 22 55Switzerland (French) 41 (21) 8113811(Opt 2)Switzerland (German) 0800 80 53 53 (Opt 1)United Kingdom 44 (0) 118 9276201Other European Countries: www.agilent.com/fi nd/contactusRevised: May 7, 2007
Product specifi cations and descriptions in this document subject to change without notice.
© Agilent Technologies, Inc. 2006, 2007Printed in USA, September 27, 20075989-5352EN
Remove all doubtOur repair and calibration services will get your equipment back to you, performing like new, when prom-ised. You will get full value out of your Agilent equipment through-out its lifetime. Your equipment will be serviced by Agilent-trained technicians using the latest factory calibration procedures, automated repair diagnostics and genuine parts. You will always have the utmost confi dence in your measurements.
Agilent offers a wide range of ad-ditional expert test and measure-ment services for your equipment, including initial start-up assistance onsite education and training, as well as design, system integration, and project management.
For more information on repair and calibration services, go to:
www.agilent.com/fi nd/openAgilent Open simplifi es the processof connecting and programmingtest systems to help engineersdesign, validate and manufacture electronic products. Agilent offersopen connectivity for a broad range of system-ready instruments, open industry software, PC-standard I/O and global support, which are combined to more easily integrate test system development.
AgilentOpen
www.agilent.com/fi nd/removealldoubt