n90-16688 - nasa · n90-16688 1989 nasa/asee ... bode plot format. 32. iv. results and discussion...
TRANSCRIPT
N90-16688
1989 NASA/ASEE SUMMER FACULTY FELLOWSHIP PROGRAM
SJOHN F. KENNEDY SPACE CENTER
UNIVERSITY OF CENTRAL FLORIDA
STUDY OF METAL CORROSION USING AC IMPEDANCE
TECHNIQUES IN THE STS LAUNCH ENVIRONMENT
PREPARED BY:
ACADEMIC RANK:
UNIVERSITY AND DEPARTMENT:
NASA/KSC
DIVISION:
BRANCH:
NASA COLLEAGUE:
DATE:
CONTRACT NUMBER:
Dr. Luz M. Cage
Associate Professor
Randolph-Macon Woman's College
Chemistry Department
Materials Science Laboratory
Materials Testing Branch
Mr. Louis G. MacDowell III
August 11, 1989
University of Central Florida
NASA-NGT-60002 Supplement: 2
24
https://ntrs.nasa.gov/search.jsp?R=19900007372 2018-07-16T19:48:02+00:00Z
ACKNOWLEDGEMENT
I would like to thank my NASA colleague, Louis G. MacDowell,
III, for providing me with the opportunity and orientation to
pursue this research. I would also like to thank the people
in the Materials Science Laboratory who made me feel welcome
at the Kennedy Space Center. I am grateful to NASA/ASEE for
my selection as a faculty fellow in the 1989 NASA/ASEE
program at the Kennedy Space Center. The expertise and
kindness of the program director, Dr. E. Ramon ||osler, is
also gladly acknowledged.
25
ABSTRACT
AC impedance measurements were performed to investigate the
corrosion resistance of 19 alloys under conditions similar to
the STS launch environment. The alloys were: Zirconium 702,
llastelloy C-22, Inconel 625, llastelloy C-276, llastelloy C-4,
Inconel 600, 7Mo + N, Ferralium 255, Inco Alloy G-3, 20Cb-3,
SS 904L, Inconel.825, SS 304LN, SS 316L, SS 317L, ES 2205, SS
304L, llastelloy B-2, and Monel 400. AC impedance data were
gathered for each alloy after one hour immersion time in each
of the following three electrolyte solutions: 3.55_ NaCl,
3.55% NaCI-0.1N IICI, and 3.55_ NaCI-I.0N HCI. The data were
analyzed qualitatively using the Nyquist plot and
quantitatively using the Bode plot. Polarization resistance,
Rp, values were obtained using the Bode plot. Zirconium 702
was the most corrosion resistant alloy in the three
electrolytes. The ordering of the other alloys according to
their resistance to corrosion varied as the concentration of
hydrochloric acid in the electrolyte increased. The corrosion
resistance of Zirconium 702 and Ferralium 255 increased as
the concentration of hydrochloric acid in the electrolyte
increased. The corrosion resistance of the other 17 alloys
decreased as the concentration of the hydrochloric acid in
the electrolyte increased.
26
SUMMARY
AC impedance techniques were used to study the corrosion of
19 alloys under conditions similar to the STS launchenvironment which is highly corrosive. The 19 alloys were:
Zirconium 702, Hastelloy C-22, Inconel 625, Hastelloy C-276,
Hastelloy C-4, Inconel 600, 7Mo + N, Ferrallum 255, Inco
Alloy G=3, 20Cb_3, SS 904L, Inconel 825, SS 304LN, SS 316L,
SS 317L, ES 2205, SS 304L, IIastelloy B-2, and Monel 400. AC
impedance data were acquired for each of the alloys after onehour immersion in each of the following three electrolytes:
3.55% NaCI, 3.55% NaCI-0.1N HCl, and 3.55% NaCI-I.0N HCI.
The data were analyzed qualitatively by using the Nyquist
plot and quantitatively by using the Bode plot. Rp valueswere obtained from the Bode plot. The corrosion resistance
for 17 of the 19 alloys decreased as the concentration of
hydrochloric acid in the electrolyte increased. The corrosionresistance of Zirconium 702 and Ferralium 255 increased as
the concentration of hydrochloric acid in the electrolyte
increased. The most corrosion resistant alloy in the three
electrolytes was Zirconium 702. The ordering of the alloys interms of their resistance to corrosion was different in the
three electrolytes.
A good correlation was found between the ac impedance dataand the dc polarization data even though the Rp values were
different. It is postulated that the Rp values obtained by
using ac impedance techniques are more accurate. A
comparison with the beach corrosion data led to theconclusion that there is, in general, a good correlation
between the materials that performed well in both tests as
well as between those that performed poorly. However, the
ordering of the materials according to their resistance tocorrosion was different in both tests. It can be concluded
that ac impedance techniques can be used to choose whatmaterials should be subjected to long-term corrosion testing.
27
Section
I
II
III
IV
V
V I
TABLE OF CONTENTS
Title
INTRODUCTION
MATERIALS AND EQUIPMENT
2.1 ..Candidate Alloys
2.2 AC Impedance Measurements
PROCEDURE FOR AC IMPEDANCE MEASUREMENTS
RESULTS AND DISCUSSION
4.1 Theoretical Background
4.2 Results and Analysis of Data
4.3 Comparison with DC Polarization Results
4.4 Comparison with Beach Corrosion Data
CONCLUSIONS
FUTURE WORK
REFERENCES
28
Figure 1.
Figure 2,
Figure 3.
Figure 4.
Figure 5.
Figure 6.
Figure 7.
Figure 8.
Figure 9.
Figure i0.
Figure 11.
Figure 12.
Figure 13.
LIST OF FIGURES
Equivalent Circuit for a Simple ElectrochemicalCell
Nyquist Plot for Equivalent Circuit in Figure 1
Bode Plot for Equivalent Circuit in Figure I
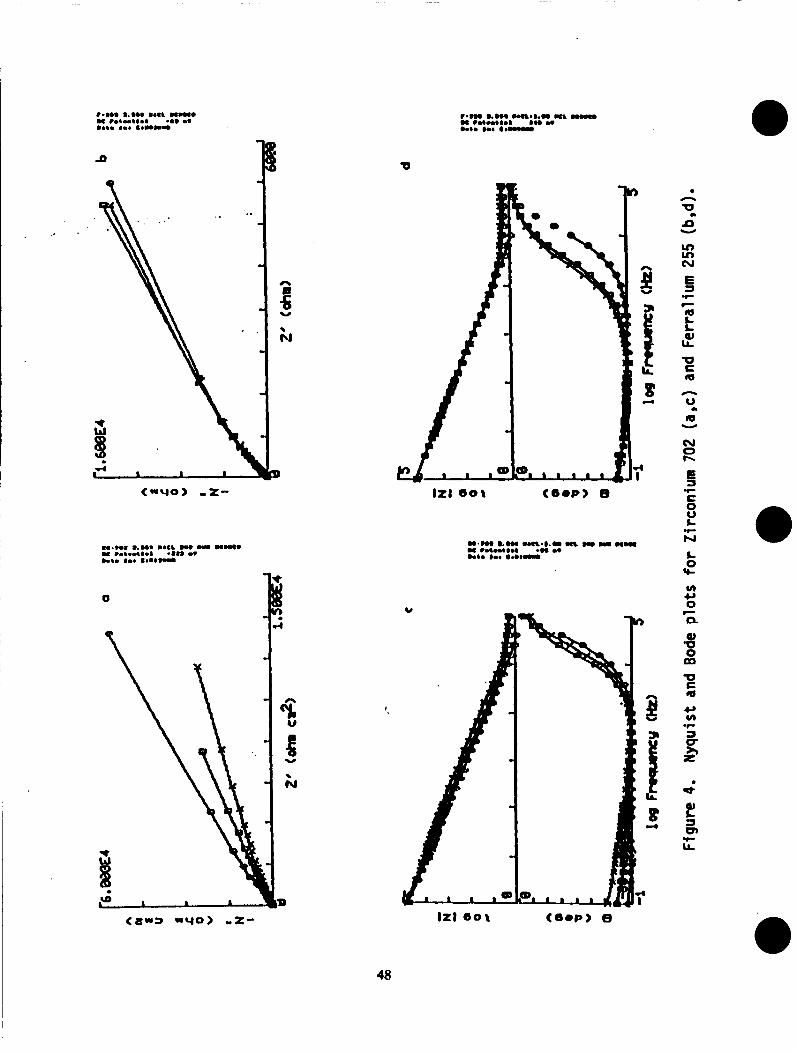
Nyquist and Bode Plots for Zirconium 702 {a,c)
and Ferralium 255 (b,d)
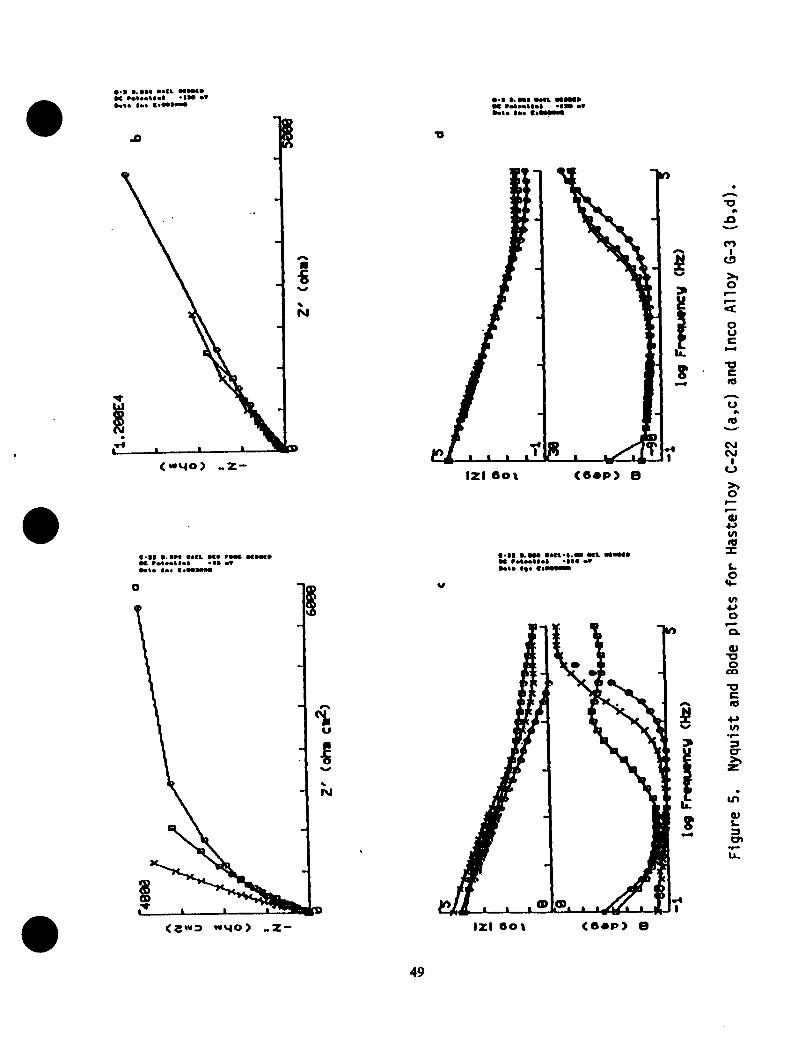
Nyquist and Bode Plots for Hastello¥ C-22 (a.c)
and Inco Alloy G-3 (b,d)
Nyquist and Bode Plots for Hastelloy C-4 (a.c)
and Inconel 625 (b,d)
Nyquist and Bode Plots for Hastelloy C-276 (a.c)
and Hastelloy B-2 (b,d)
Nyquist and Bode Plots for Monel 400 (a,c) and
20Cb-3 (b,d)
Nyquist and Bode Plots for ES 2205 (a,c) and
7Mo + N (b,d)
Nyquist and Bode Plots for SS 304L (a,c) and SS
304LN (b,d)
Nyquist and Bode Plots for Inconel 600 {a,c) and
Inconel 825 (b,d)
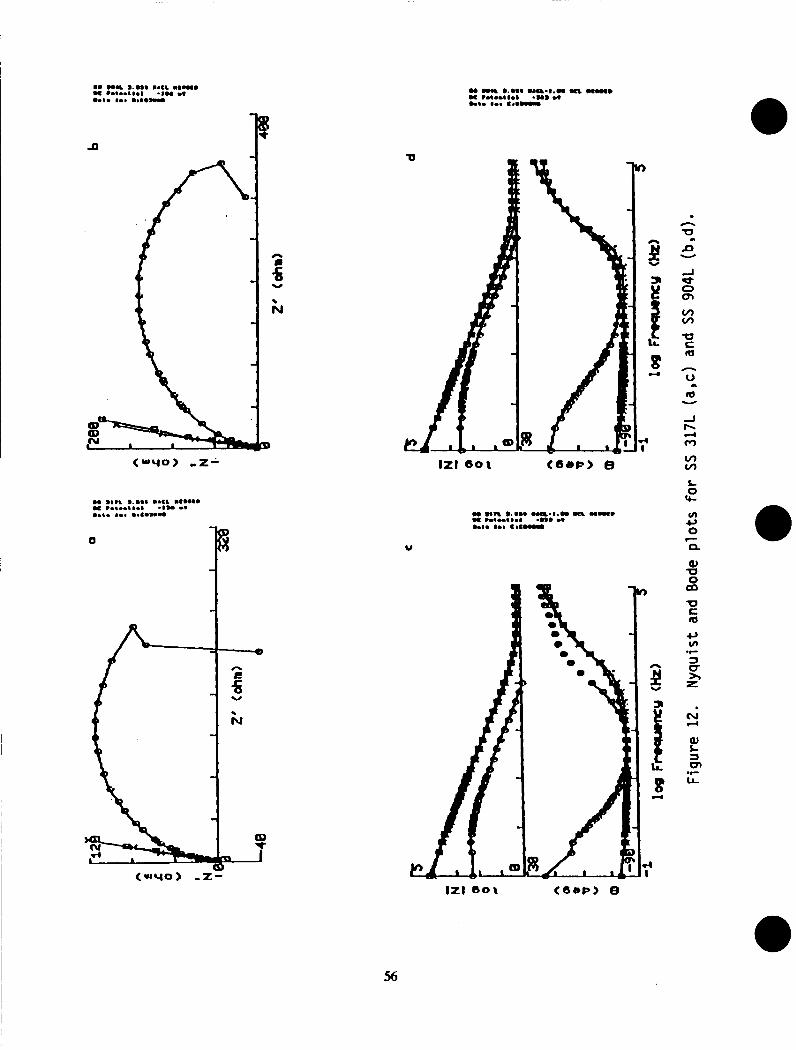
Nyquist and Bode Plots for SS 317L (a,c) and SS
904L (b,d)
Nyquist and Bode Plots for SS 316L (a,b)
29
STUDY OF METAL CORROSION USING AC IMPEDANCE TECHNIQUES IN THE
STS LAUNCH ENVIRONMENT
I. INTRODUCTION
Flexible metal hoses are used in various supply lines that
service the Orbiter at the launch pad. These convoluted
flexible hoses were originally constructed of 304L stainless
steel. The severely corrosive environment at the launch site
caused pitting corrosion in many of these flex hose lines. In
the case of vacuum jacketed cryogenic lines, failure of the
flex hose by pitting causes a loss of vacuum and subsequent
loss of insulation.
The corrosive environment at the launch site is due to the
very high chloride content caused by the proximity of the
ocean and to the generation of seventeen tons of concentrated
hydrochloric acid as a fuel combustion product of the Solid
Rocket Boosters during a launch. These corrosive conditions
cause severe pitting on some of the commonly used steel
alloys.
A previous investigation was undertaken in order to evaluate
19 metal alloys with the purpose of finding a more corrosion
resistant replacement material for 304L stainless steel. The
tests performed in that investigation were: electrochemical
corrosion testing, accelerated corrosion testing in a salt
fog chamber, long term exposure at the beach corrosion
testing site, and pitting corrosion tests in ferric chloride
solution. These tests led to the conclusion that the most
corrosion resistant alloys were, in descending order,
Hastelloy C-22, Inconel 625, Hastelloy C-276, Hastelloy C-4,
and Inco Alloy G-3. Of these top five alloys, the |[astelloy
C-22 stood out as being the best of the alloys tested. The
details of this investigation are found in report MTB-325-
87A (I). Furthermore, on the basis of corrosion resistance
combined with weld and mechanical properties, Hastelloy C-22
was determined to be the best material for the construction
of flex hoses to be used in fuel lines servicing the Orbiter
at the launch site.
The electrochemical corrosion testing done previously was
based on the use of de polarization techniques. In the
present investigation, ac impedance techniques will be used
in order to study the corrosion of the 19 alloys under three
different electrolyte conditions: neutral 3.55_ NaCI, 3.55%
NaCI-0.1N HCl, and 3.55% NaCI-I.0N HCl. The 3.55_ NaCI-0.1N
HCI electrolyte provides an environment for the corrosion of
the alloys similar to the conditions at the launch pad.
II. MATERIALS AND EQUIPMENT
2.1 CANDIDATE ALLOYS
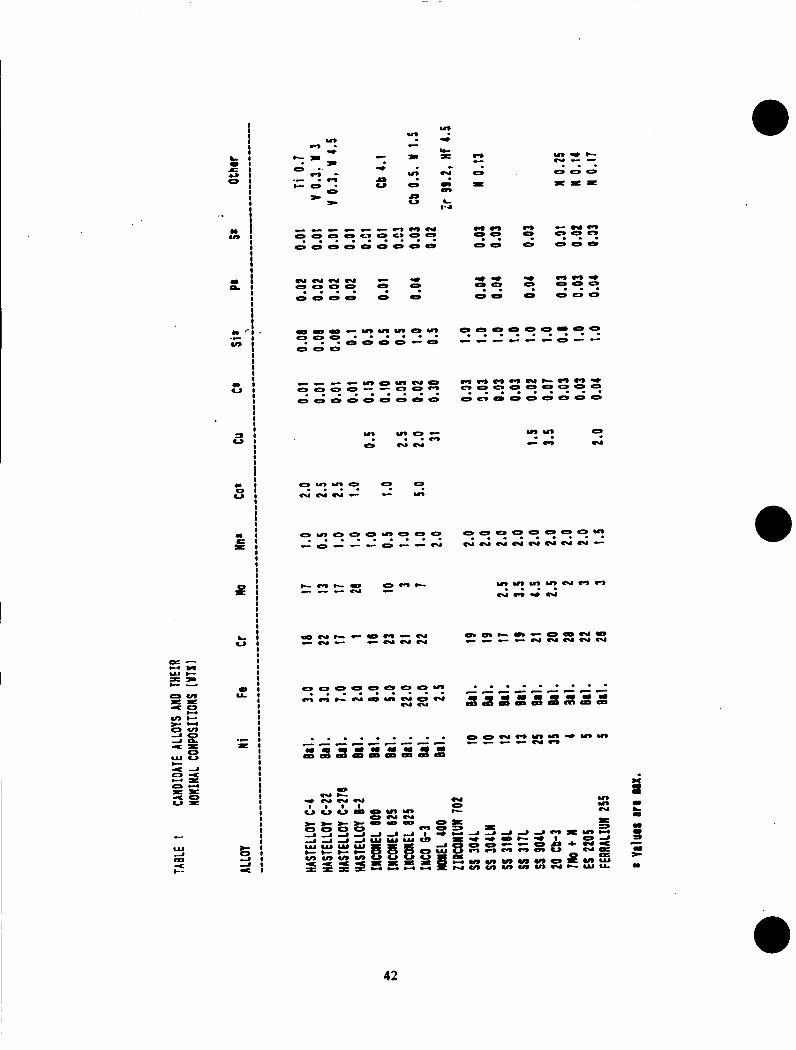
The nineteen alloys tested and their nominal compositions in
weight..percent-are shown in Table I. The choice of these
alloys for the previous investigation was based on theirreported resistance to corrosion.
2.2 AC IMPEDANCE MEASUREMENTS
A model 378 Electrochemical Impedance system manufactured byEG&G Princeton Applied Research Corporation was used for allelectrochemical impedance measurements. The system includes:(1) the Model 273 Computer-Controlled Potentiostat/
Galvanostat, (2) the Model 5301A Computer-Controlled Lock-InAmplifier, (3) the IBM XT Microcomputer with peripherals, andthe Model 378 Electrochemical Impedance Software.
Specimens were flat coupons 1.59 cm {5/8") in diameter. The
specimen holder in the electrochemical cell is designed such
that the exposed metal surface area is i cm 2'
The electrochemical cell included a saturated calomel
reference electrode {SCE), 2 graphite rod counter electrodes,the metal working electrode, and a bubbler/vent tube. Eachalloy was studied under three different electrolyteconditions: aerated 3.55_ neutral NaCl, aerated 3.55% NaC1-
0.1N HCl {similar to the conditions at the launch site), andaerated 3.55% NaCl-I.0N ltC1 {more aggressive than theconditions at the launch site}. All solutions were preparedusing deionized water.
31

III. PROCEDURE FOR AC IMPEDANCE MEASUREMENTS
The test specimens were polished with 600-grit paper, wiped
with methyl-ethyl ketone, ultrasonically degreased for five
minutes in a detergent solution, rinsed with deionized water,
and dried. Each specimen was observed under the microscope
and weighed before and after each experiment to monitor
changes caused b_ corrosion on its appearance and weight.
The electrolyte solution was aerated for at least 15 minutes
before immersion of the test specimen. Aeration continued
throughout the test.
AC impedance measurements were performed under each of the
three electrolyte conditions chosen. After immersion in the
electrolyte, the sample was allowed to equilibrate for 3600
seconds before the instrument started acquiring data. It was
determined previously that after 3600 seconds, the corrosion
potential had usually stabilized (2).
AC impedance measurements were gathered in the frequency
range from 100 kHz to 0.1001Hz. A combination of two methods
was employed to obtain the data over this wide range of
frequencies: (I) phase-sensitive lock-in detection for
measurements from 5 Hz to 100 kHz, and (2) the FFT {fast
Fourier transform) technique for measurements from 0.1001Hz
to 11Hz. The data from lock-in {single-sine) and FFT (multi-
sine) were automatically merged by the IBM XT microcomputer
dedicated software.
The conditions for the lock-in experiments were: initial
frequency, 100 kHz; final frequency, 5 Hz; points/decade, 5;
AC amplitude, 5 mV; DC potential, 0 vs OC (open circuit);
condition time, 0 seconds; condition potential, 0 V; open
circuit delay, 3600 seconds. The open circuit potential was
monitored with a voltmeter.
The conditions for the FFT experiments were: base frequency,
0.I001Hz; data cycles, 5; AC amplitude, I0 mV; DC potential,
0 vs OC; open circuit delay, 0 seconds. The open circuit
potential was monitored with a voltmeter.
The data for each experiment were plotted in the Nyquist and
Bode plot format.
32
IV. RESULTS AND DISCUSSION
4.1 THEORETICAL BACKGROUND
AC impedance techniques offer some distinct advantages over
dc techniques (3). First, the small excitation amplitudes
that are used, generally in the ranges of 5 to 10 mV peak-to-peak, cause only minimal perturbations of the electrochemical
system, thus reddcing errors caused by the measuringtechnique itself. Second, the technique offers valuableinformation about the mechanisms and kinetics of
electrochemical processes such as corrosion. Third,
measurements can be made in low conductivity solutions wheredc techniques are subject to serious potential-controlerrors.
Despite the advantages of the ac impedance techniques
mentioned above, their application requires sophisticatedtechniques in order to interpret the data and extract
meaningful results. The application of ac impedancemeasurements to study corrosion has so far resulted in the
publication of a large amount of experimental data without
much interpretation. The technique is at the present time in
a transition from the data collection stage to the dataanalysis stage (4).
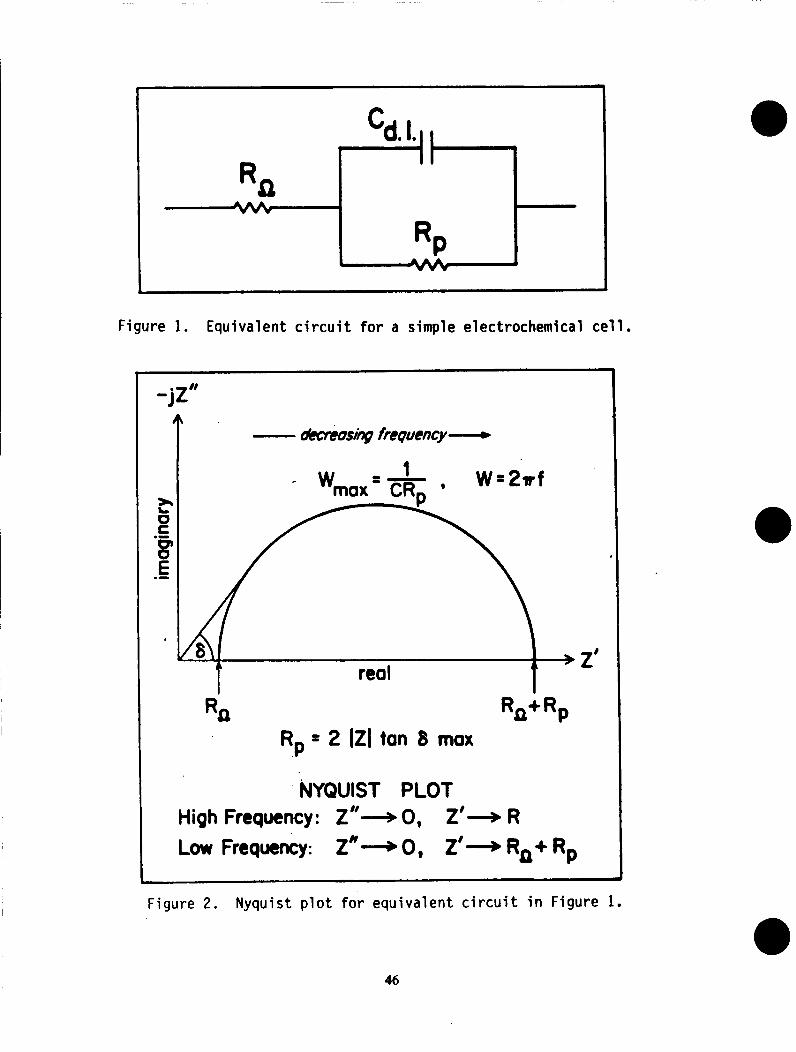
AC impedance measurements are based on the fact that an
electrochemical system, such as those studied in this
investigation, can be represented by an equivalent electrical
circuit. The equivalent circuit for a simple electrochemical
cell is shown in Figure 1 {5). The circuit elements RA, Rp,and Cdl represent the uncompensated resistance {resistance
from the reference to the working electrode}, the
polarization resistance {resistance to electrochemical
oxidation}, and the capacitance very close to the metal
surface {at the double layer}. There are several formats thatcan be used for the graphical representation of the ac
impedance data (3,6,7). Each format offers specific
advantages for revealing certain characteristics of a giventest system. It was determined at the beginning of this
research, that the most suitable formats for plotting the acimpedance data were the Nyquist and the Bode plots.
The Nyquist plot is also known as a Cole-Cole plot or a
complex impedance plane diagram. Figure 2 {5) shows the
Nyquist plot for the equivalent circuit shown in Figure 1.
The imaginary component of the impedance (Z") is plottedversus the real component of the impedance (Z') for each
excitation frequency. As indicated in Figure 2, this plot can
be used to calculate the values of RA, Rp, and Cdl.
The Bode plot for the equivalent circuit in Figure 1 is shown
in Figure 3 (5). This graphical representation of the ac
impedance data involves plotting both the phase angle {@_ and
33
the log of absolute impedance (loglZ:) versus the log of the
frequency (w = 2_f). As indicated on the figure, values for
RA, Rp, and Cdl can also be obtained from the Bode plot. Of
special interest for this research is the determination of
the Rp values which can be used to calculate the corrosion
rate of an electrode material in a given electrolyte (3,8).
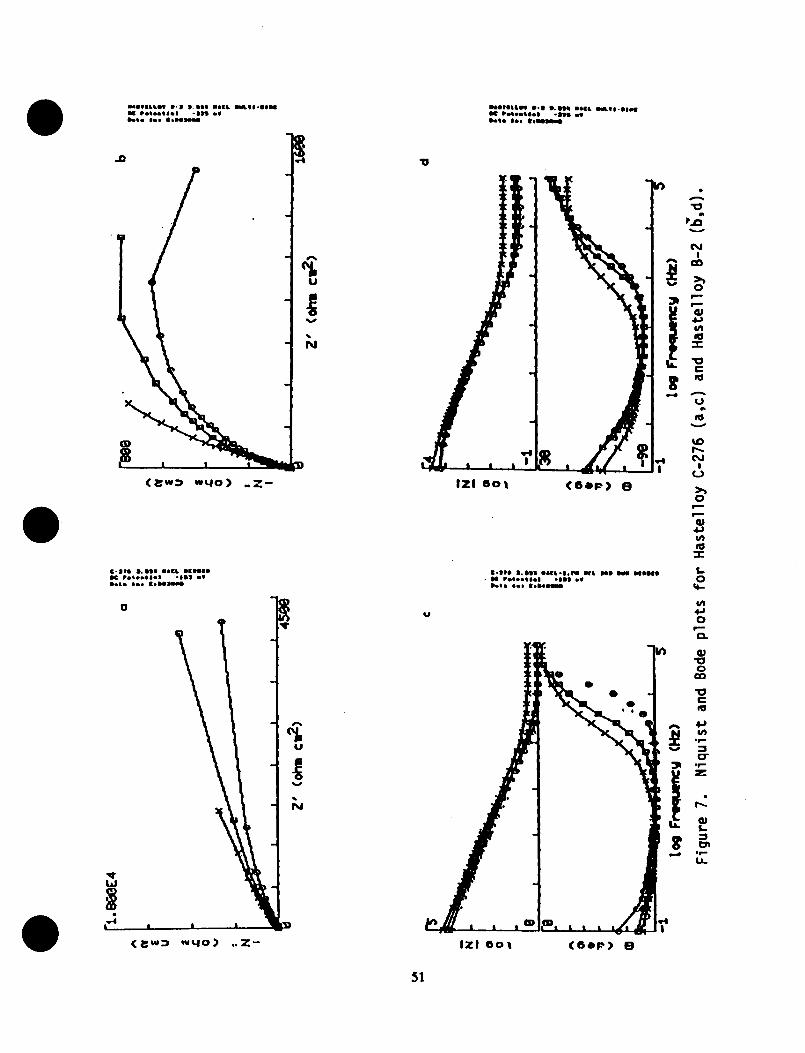
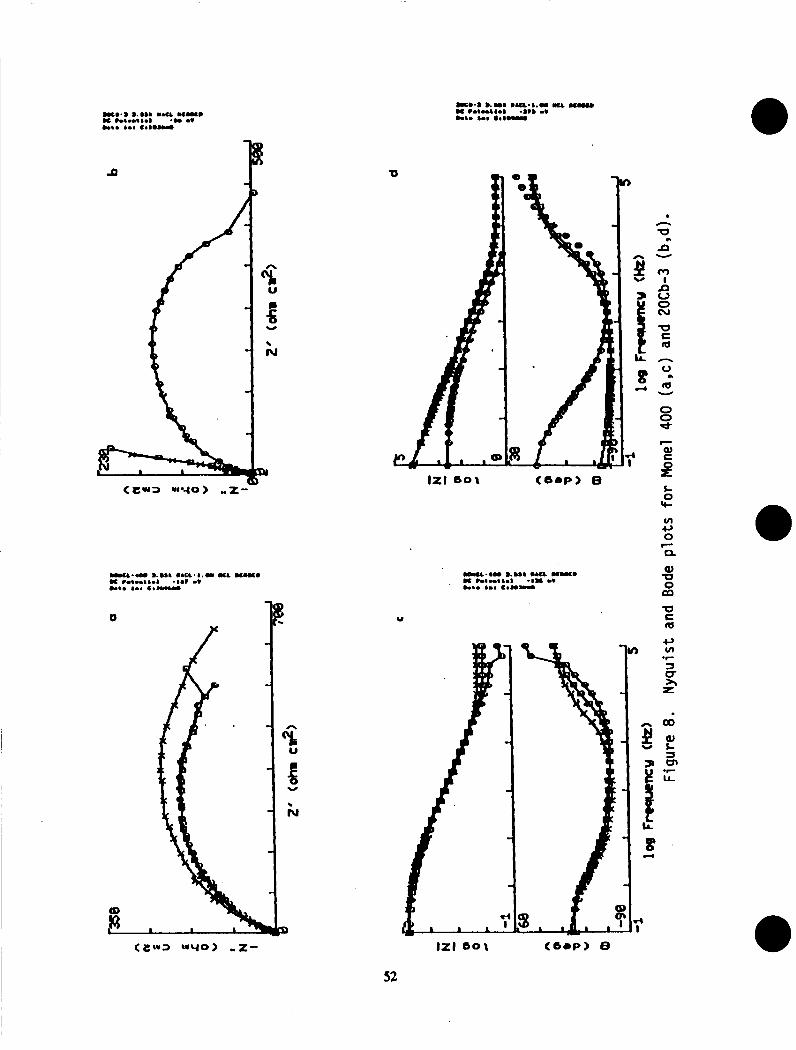
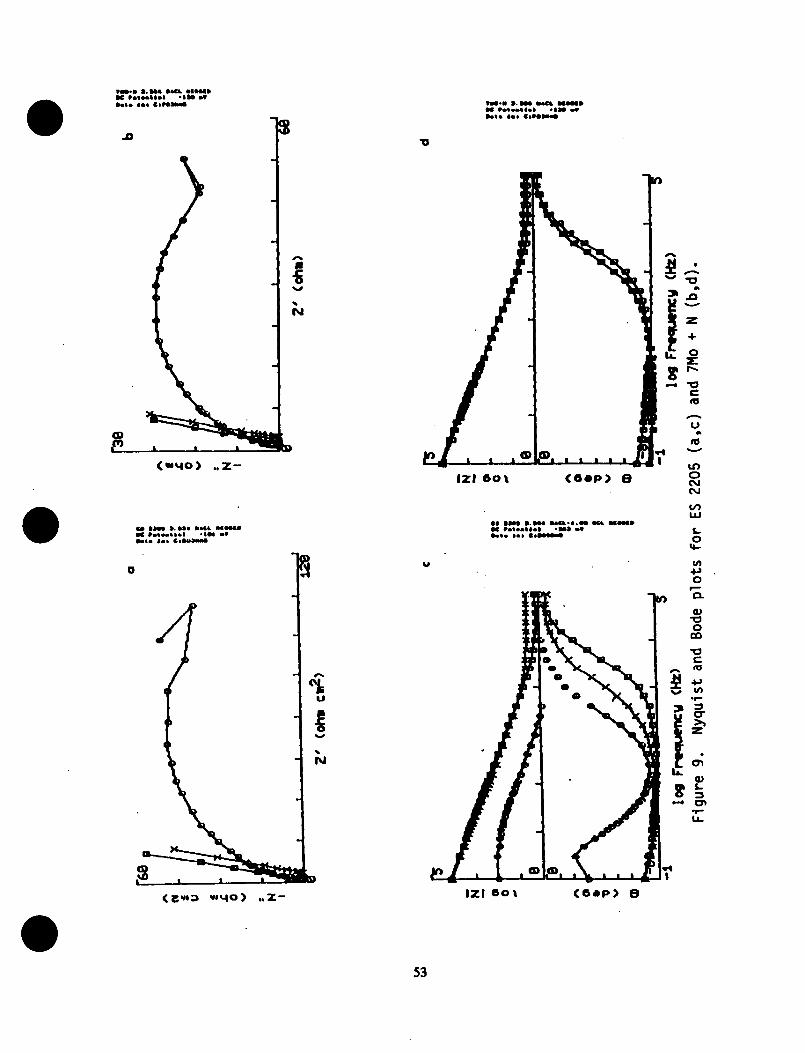
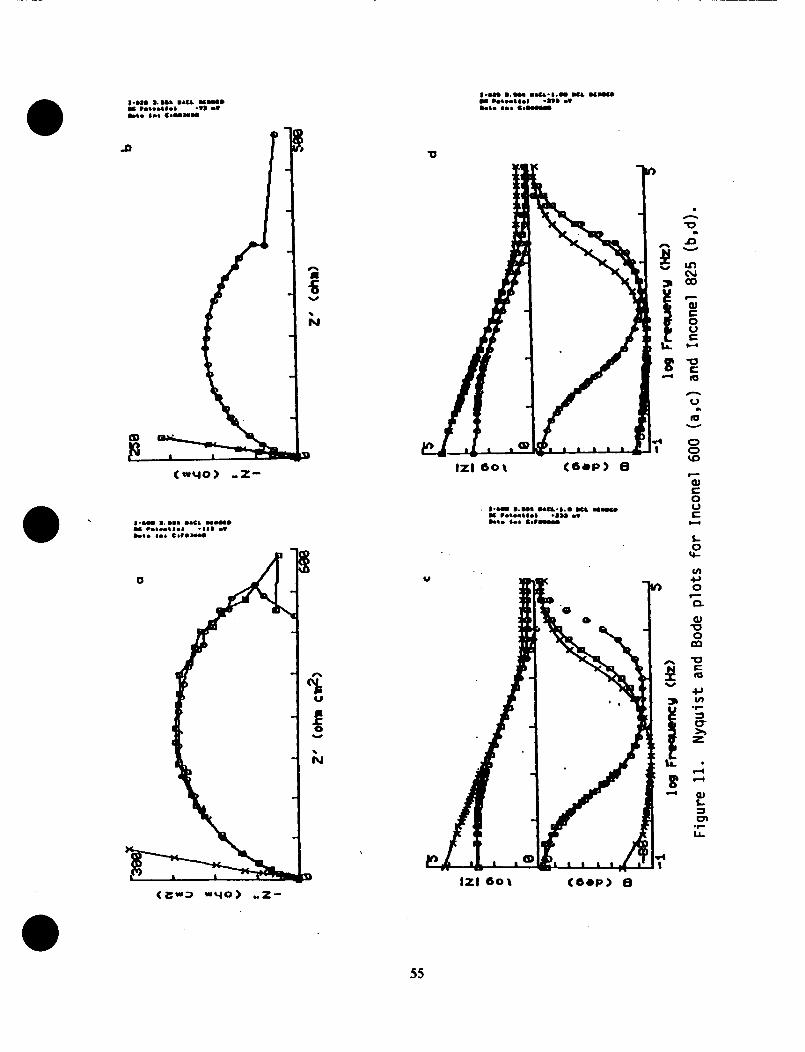
4.2 RESULTS AND DISCUSSION
The Bode plots included in this report appear in the form of
two separate graphs: loglZ[ versus log Frequency (Hz) and 8
versus log Frequency (Hz). Nyquist (at the top) and Bode
(at the bottom) plots for the 19 alloys used in this
investigation are shown in Figures 4-13. None of the Nyquist
plots obtained in this investigation exhibited the ideal
semicircle shown in Figure 2. Experimentally, it has been
observed that deviations from the results expected for simple
equivalent circuits occur for real, corroding systems (S,9).
Some of the deviations that have been observed for real
systems are: a semicircle with its center depressed below the
real axis, a partial semicircle, and a partial semicircle
that changes shape at the low frequency end. Impedance data
that result in a Nyquist plot in the form of a depressed or
partial semicircle can still be used to calculate Rp values.
Several authors have described computer modeling of
electrochemical impedance (10,11). The usual approach is to
curve-fit the semicircle that results from a single time
constant capacitive response. This approach allows an
estimate to be made of the low frequency intersection of the
semicircle response with the real axis. This procedure is
especially important when the response still has a large
imaginary contribution at low frequency resulting in a
partial semicircle. Deviations that result in a Nyquist plot.
with the shape of a partial semicircle that changes at the
low frequency end require a more complex computer program
which contains more circuit elements. The time limitations of
this research prevented the use of the methods just mentioned
to analyze the Nyquist plots for the 19 alloys.
Valuable qualitative information can be extracted by
comparing the Nyquist plots shown in Figures 4-13. Each
Eigure shows the change in the Nyquist plot for a one hour
immersion time of the alloy in the three different
electrolytes: (X) 3.55% NaCI, (a) 3.55% NaC1-0.1N HCI and (o)
3.55% NaCI-I.0N HCI. The change in the corrosion rate, which
is inversely proportional to Rp, can be estimated
qualitatively by looking at the change in the Nyquist plot.
Zirconium 702 (Figure 4a) stands out as being the most
corrosion resistant alloy under the conditions used in this
study. Its Rp was not only the highest but it also sl_owed the
least chan_e upon increasing the concentration of the
hydrochloric acid from 0.0N to 0.1N to 1.0N; that is,
Zirconium 702 became more corrosion resistant as the
concentration of hydrochloric acid increased. This finding
34
agrees with the known fact that Zirconium is resistant to
hydrochloric acid at all concentrations up to boiling
temperatures. However, there are indications that the metal
is vulnerable to pitting in seawater (12). Ferralium 255
{Figure 4b) also became more corrosion resistent upon
increasing the concentration of the acid. Its Rp values were
similar in the three electrolytes but lower than those for
Zirconium 702. The change in Rp for the other 17 alloys upon
increasing the concentration of the acid in the electrolyte
was in the opposite direction to that observed for Zirconium
702 and Ferralium 255; they became less resistant to
corrosion as the concentration of the acid increased.
Hastelloy C-22 (Figure 5a), Inco Alloy G-3 [Figure 5b),
Hastelloy C-4 (Figure 6a), Inconel 625 {Figure 6b), Hastelloy
C-276 (Figure 7a), and Hastelloy B-2 (Figure 7b) have similar
Nyquist plots showing the decrease in Rp as the concentration
of the acid increases. The decrease in Rp appears as an
increase in the curvature of the partial semicircle. Monel
400 {Figure 8a) shows partial semicircles with a slight
decrease in Rp caused by increasing the acid concentration.
The semicircle obtained in 3.55% NaCI-0.1N HCI has a feature
at the end (a straight line with a positive slope) that has
been associated with a Warburg impedance (13). This behavior
has been explained by postulating an extra impedance term in
the equivalent circuit that is associated with diffusion
controlled processes. 20Cb-3, ES 2205, and 7Mo + N {Figures
8b, 9a, 9b) show similar changes in the Nyquist plot. No
drastic change in the Rp values is observed when the
concentration of hydrochloric acid increases from O.0N to
0.1N (as indicated by the two parallel lines in the Nyquist
plot). However, there is a significant change in the Nyquist
plot when the concentration of the acid is increased to 1.0N
that results in a considerable decrease in Rp. The turn at
the low frequency end of the curve is probably an indication
of a diffusion process taking place. SS 304L (Figure lOs)
shows a Nyguist plot that is different from all the others.
It should be pointed out that one of the experiments
involving SS 304L resulted in the partial breakdown of the
surface of the metal sample. Data from that experiment were
discarded. The complex Nyquist plot obtained for SS 304L in
3.55% NaCI-1.0N HCI is similar to the Nyquist plot obtained
for a pin-holed coal tar epoxy coating on mild steel |13). SS
304LN (Figure 10b) showed good resistance to corrosion in
neutral 3.55% HaCl but similar low resistance to corrosion
{low Rp values) in 3.55% NaCI-0.1N HCI and 3.55_ NaCI-I.ON
I|Cl. Inconel 600 (Figure 11a) showed a similar behavior.
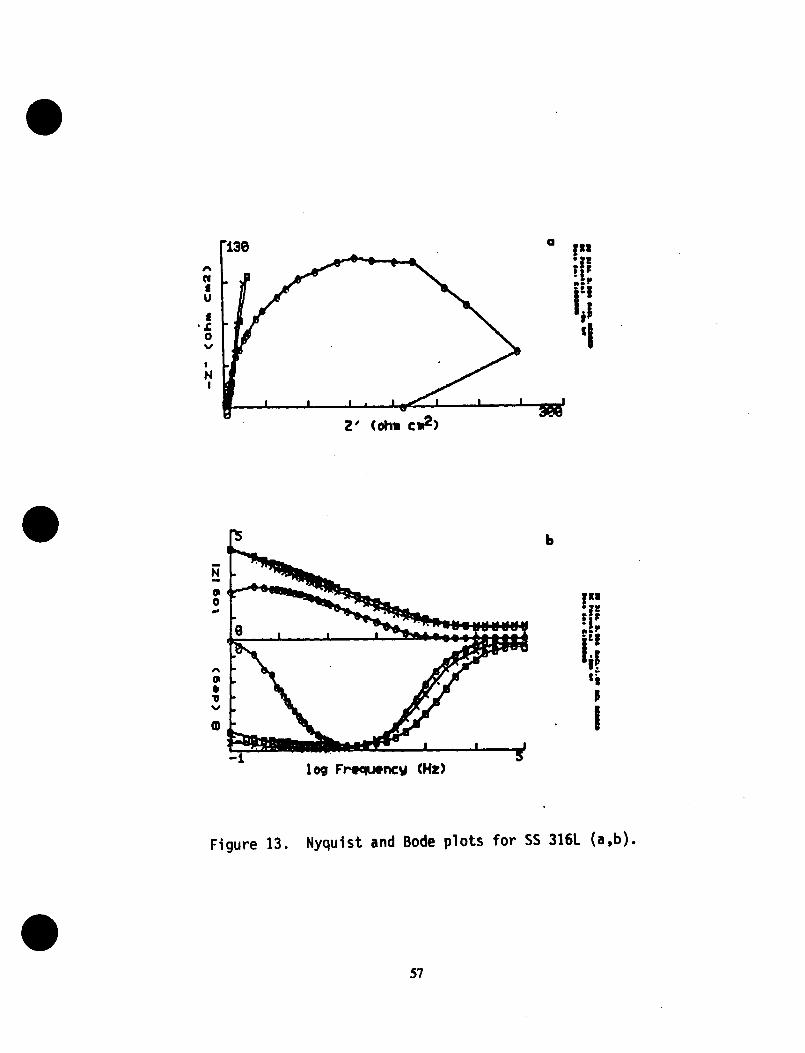
Tnconel 825, SS 317L, SS 904L, end SS 316L {Figures llb, 12a,
12b, 13a) show a similar behavior indicating comparable
resistance to corrosion in 3.55_ N_CI and 3.55_ NaCI-0.1N HCI
and a considerably lower resistance to corrosion in 3.55_
NaCI-1.0N HCI.
Since the Nyquist plots obtained in this investigation did
not resemble the ideal Nyquist plot shown in Figure 2,
35
calculation of Rp values from those plots was not pursued. It
was decided that the Bode plot is a more straightforward
means of presenting the data in order to calculate Rp. In a
Bode plot, the impedance of a "perfect capacitance" can be
represented as a straight line with a slope of -I and a phase
angle of -90 °. A "resistor" will plot as a horizontal line
for the log:Zl with a phase angle of 0°. A Warburg impedance
is a straight line with a slope of -I/2 and a phase angle of
-45 ° (14). Thedata gathered for the 19 alloys, when plotted
in theBode format (lower plot in Figures 4-13) were
interpreted as shown in Figure 3. The value of Z at the
lowest frequency (0.I001Hz) is the sum of Rp and R while
the value of Z at the highest frequency (100.020 kl|z) is R .
The values for Rp obtained from the Bode plot data after one
hour immersion in the three different electrolytes are given
in Table 2. These values indicate that Zirconium 702 is the
most corrosion resistant alloy under the conditions used in
this study. The ranking of the other 18 alloys differs for
the three electrolytes. In general, it can be concluded that
for all the alloys, with the exception of Zirconium 702 arid
Ferralium 255, the Rp values decrease as the concentration of
hydrochloric acid increases in the electrolyte. The changes
in Rp can thus be followed qualitatively by examining the
data in the Nyquist plot format and quantitatively by using
the Bode plot format.
4.3 COMPARISON WITH DC POLARIZATION RESULTS
A comparison of the Rp values obtained in this investigation
with the Rp values obtained by dc polarization techniques for
the same alloys in 3.55% NaCI-0.1N HCI (ref. 2, Table 3) and
for 10 of the alloys in 3.55% NaCI-I.0N HCI {ref. 2, Table
9), indicates that there is no correlation between the actual
values of Rp. However, there is a good correlation between
the ordering of the alloys according to their resistance to
corrosion by both methods even though the ordering does not
match exactly. The fact that ac impedance techniques use only
very small signals which do not disturb the electrode
properties to be measured can be used to support the validity
of the Rp values obtained by this technique.
4.4 COMPARISON WITH BEACH CORROSION DATA
A comparison of the Rp values obtained from ac impedance
measurements with the beach corrosion data for all the alloys
in 3.55% NaCI-I.0N HCI {ref. 2, Figure 9} indicates that
there is, in general, a good correlation even though the
ranking of the metals does not match exactly. For example,
Hastelloy C-22 was the most resistant alloy when tested at
the beach corrosion site while it ranked seventh according to
the Rp value in this study. It should be pointed out that, as
a group, there is a good correlation between the alloys that
performed at the top (Zirconium 702, Ferralium 255, Inconel
625, Inco Alloy G-3, Hastelloy C-4, Hastelloy, C-276, and
36
Hastelloy C-22) in both investigations. A tentativeconclusion that can be drawn from this comparison is that the
ac impedance technique can be used to choose what materials
should be subjected to long-term corrosion testing at the
beach testing site. The lack of a close correlation between
the ac impedance data and the beach corrosion data may result
from the fact that the ac impedance measurements were
obtained for the alloys after one hour immersion in the
aerated electrolytes at room temperature. The conditions at
the beach testing site are obviously different (ref. I, p. 8]
and more similar to the conditions in the STS launch
environment. The results from the present investigation may
be more appropriate for testing the corrosion resistance of
alloys that are going to be in contact with liquid
electrolytes such as the ones used here.
37
i •
•
•
•
V. CONCLUSIONS
AC impedance techniques, when used for corrosion testing,
provide useful qualitative (Nyquist plot) and
quantitative information (Rp values) that can be used to
screen alloys to be subjected to long-term corrosion
testing.
The Rp values obtained for the 19 alloys under three
different electrolyte conditions can be used to rank the
alloys according to their resistance to corrosion since
Rp is inversely proportional to the rate of corrosion•
Zirconium 702 was found to be the most corrosion
resistant alloy under the conditions used in this
investigation.
There is a good general agreement between the results
obtained using dc and ac techniques even though the
actual Rp values were found to be different. It is
postulated that the Rp values obtained by the ac
technique are more accurate.
38
•
•
"•
•
•
.
VI. FUTURE WORK
AC impedance measurements involving longer immersion
times to investigate how the Rp value -and therefore the
rate of corrosion- changes with time.
Implementation of the use of software to perform the
analysis of the data in the Nyquist plot format in order
to calculate Rp values•.
Include testing of alloys after exposure to conditions as
similar to the STS launch environment as possible.
Study the effect of protective coatings on the rate of
corrosion of the 19 alloys.
Modify the electrolyte conditions to include other
chemicals normally found at the STS launch environment•
Study the effect that a change in temperature, similar to
the seasonal changes that occur at the STS launch
environment, would have on the rate of corrosion.
39
REFERENCES
•
•
MacDowell, L.G. and Ontiveros, C., Evaluation of
Candidate Alloys for the Construction of Metal Flex
Hoses in the STS Launch Environment, Test Report,
Document No. MTB-325-87A, National Aeronautics and Space
Administration, Kennedy Space Center, Materials Testing
Branch, August 23, 1988.
Ontiveros, C., Localized Corrosion of Candidate Alloys
for Construction of Flex Hoses, 1987 NASA/ASEE Summer
Faculty Fellowship Program Research Reports, Kennedy
Space Center, 1987.
• Application Note AC-1, Basics of AC Impedance
Measurements, EG&G PARC, Princeton, NJ., 1984.
, Mansfeld, F., Don't Be Afraid of Electrochemical
Techniques -But Use Them with Care!, Corrosion, Vol. 44,
pp. 856-868, 1988.
, Rothstein, M.L., Electrochemical Corrosion Measurements
for the Metal Finishing Industry, Application Note Corr-
5, EG&G PARC, Princeton, NJ., 1986.
, Mansfeld, F., Recording and Analysis of AC Impedance
Data for Corrosion Studies• I. Background and Methods of
Analysis, Corrosion, Vol. 37, pp. 301-307, 1981.
• Mansfeld, F., Kendig, M.W., and Tsai, S., Recording and
Analysis of AC Impedance Data for Corrosion Studies• II.
Experimental Approach and Results, Vol. 38, pp. 570-580,
1982.
• Lorenz, W.J. and Mansfeld, F., Determination of
Corrosion Rates by Electrochemical DC and AC Methods,
Corrosion Science, Vol. 21, pp. 647-672, 1981.
• Williams, D.E. and Naish, C.C., An Introduction to the
AC Impedance Technique, and its Application to Corrosion
Problems, U.K. Atomic Energy Authority, Harwell Report
AERE-M3461, pp. 1-10, 1985.
10. Moody, J.R., Quin, X.P., and Strutt, J.E., The
Application of a Compurerized impedance Monitoring
System to a Study of the Behavior of 347 ss in Nitric
Acid, presented at the 166th Meeting of the
Electrochemical Society, New Orleans, Louisiana, 1984.
11. Kendig, M.W., Meyer, E.M., Lindberg, G. and Mansfeld,
F., A Computer Analysis of Electrochemical Impedance
Data, Corrosion Science, Vol. 23, pp. 1007-1015, 1983.
12. Uhlig, H.H., Corrosion and Corrosion Control• An
40
13.
14.
Introduction to corrosion science and engineering,
Second Edition, John Wiley & Sons Inc., p. 368, 1971.
Scantlebury, J.D., Ho, K.N. and Eden, D.A., Impedance
Measurements on Organic Coatings on Mild Steel in Sodium
Chloride Solutions, Electrochemical Corrosion Testing,
ASTM STP 727, Mansfeld, F. and Bertocci, U., Eds.,
American Society for Testing and Haterials, pp. 187-197,198i.
Cahan, B.D. and Chien, C., The Nature of the Passive
Film of Iron. II. A-C Impedance Studies, J. Electrochem.
Soc., Vol. 129, pp. 474-480, 1982.
41
0---4
3mI)--.- w
*'_ (n=JC Z
e---4
0 en-J
-me: Z0
uJ U
..Jo
0 e--eZ I-
U Z
uJ.-J
.°
4-1)0
e
L
_ 0-_ .-e.-
4_U
U
f,.)
.Jr
t,..V,..)
OL0-
:HE
0..J,..8,.eC
tdrD
eoeeoeQ oo • • •OO0000_O_ O0 _ OO0
eeeo • oe 0 •00_0 0 0 O0 0 _0_
O00eoeoeo oeoeoooeo
0o0
°t.eoeeoo eeeo_m.ee_00000000 0_00 0000
• oe_ eo •
_mmo o oe.eo °
O_OOO_O00.teo.o.oe
O000_O00m.oe.ole.a
eeeeeo.ee oe6ooo.e_
.... __ N_
N
_NuG
o_
J0 m
0_ M
42
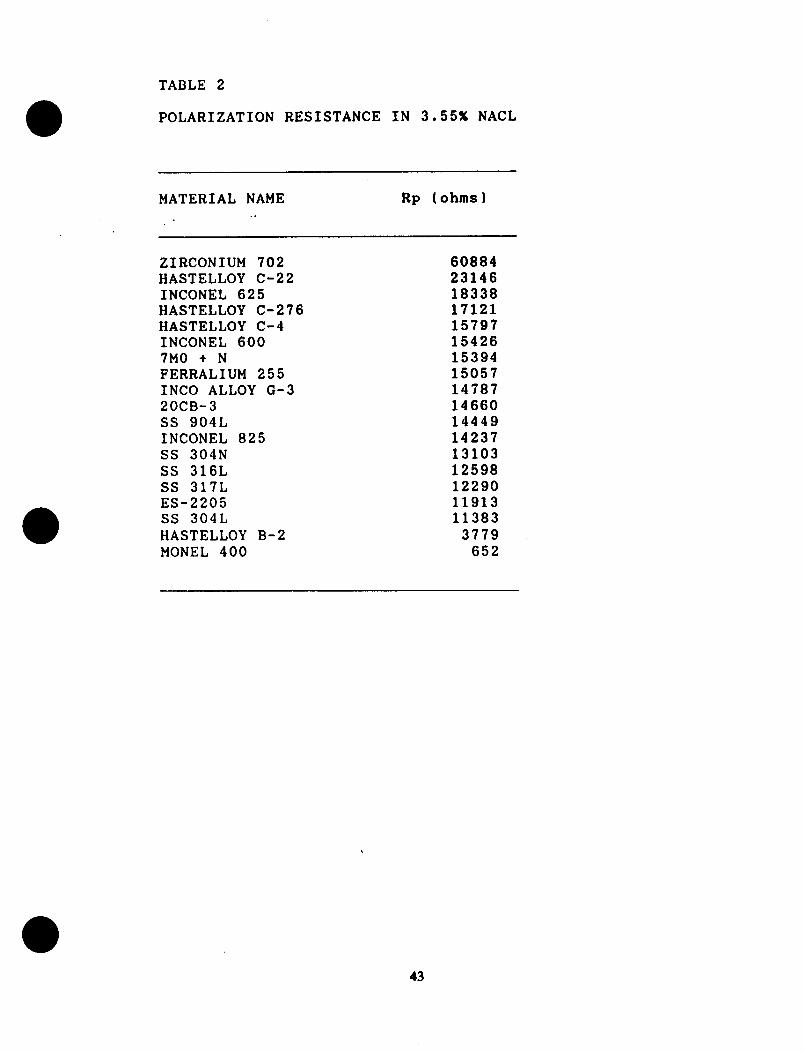
TABLE 2
POLARIZATION RESISTANCE IN 3.55_ NACL
MATERIAL NAME Rp {ohms}
.,
ZIRCONIUM 702 60884
HASTELLOY C-22 23146
INCONEL 625 18338
HASTELLOY C-276 17121HASTELLOY C-4 15797
INCONEL 600 154267M0 + N 15394
FERRALIUM 255 15057
INCO ALLOY G-3 14787
20CB-3 14660
SS 904L 14449
INCONEL 825 14237
SS 304N 13103
SS 316L 12598SS 317L 12290ES-2205 11913
SS 304L 11383
HASTELLOY B-2 3779
MONEL 400 652
43
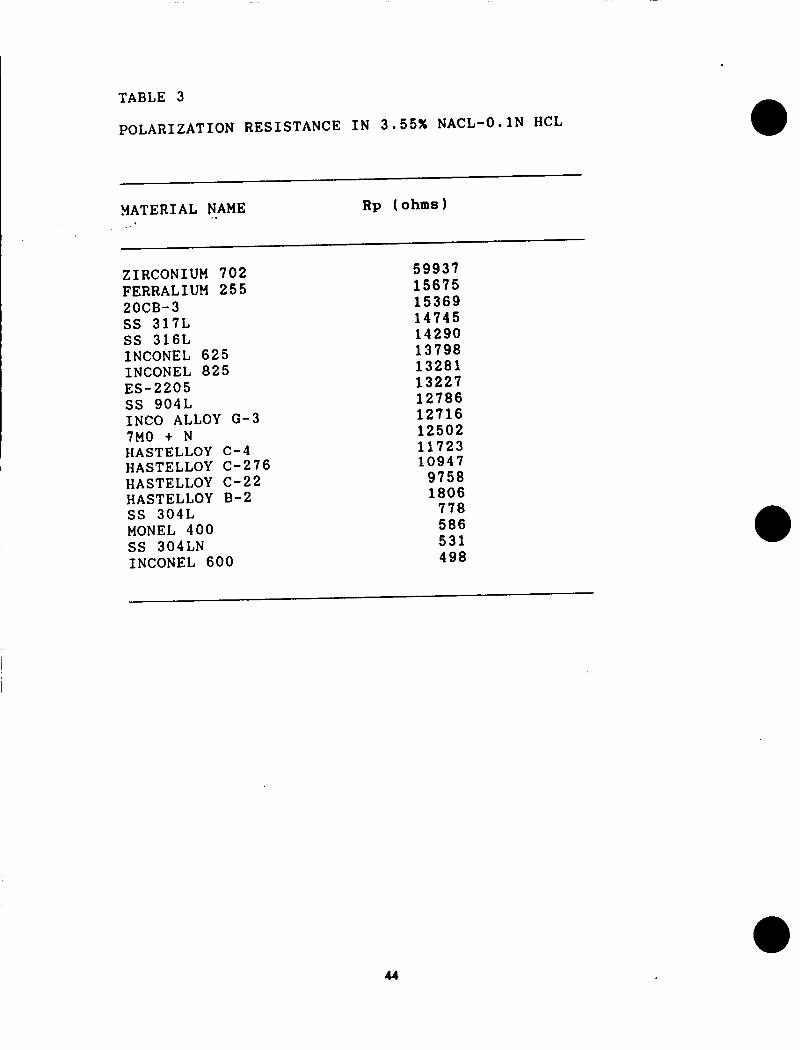
TABLE 3
POLARIZATION RESISTANCE IN 3.55_ NACL-O.1N HCL
MATERIAL NAME Rp {ohms}.,
ZIRCONIUM 702 59937FERRALIUM 255 15675
20CB-3 15369SS 317L 14745SS 316L 14290INCONEL 625 13798INCONEL 825 13281ES-2205 13227SS 904L 12786INCO ALLOY G-3 12716
7M0 + N 12502
HASTELLOY C-4 11723HASTELLOY C-276 10947
HASTELLOY C-22 9758HASTELLOY B-2 1806SS 304L 778
MONEL 400 586
SS 304LN 531INCONEL 600 498
44
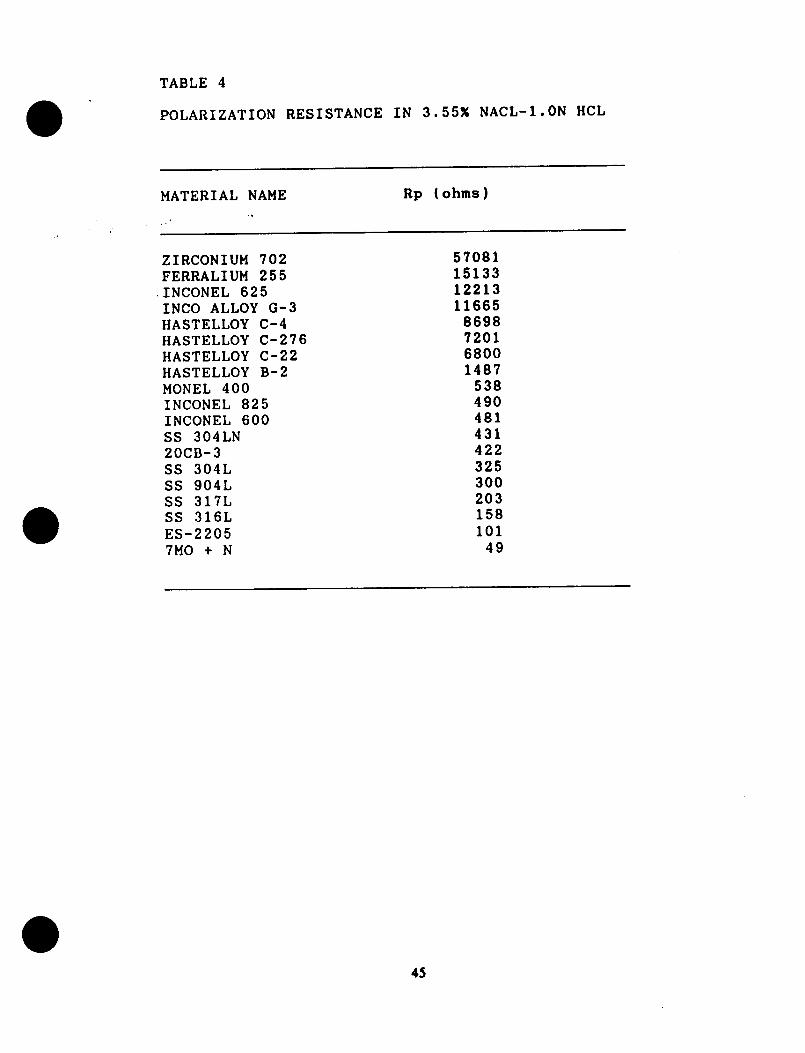
TABLE 4
POLARIZATION RESISTANCE IN 3.55_ NACL-I.ON HCL
MATERIAL NAME Rp {.ohms}
ZIRCONIUM 702 57081
FERRALIUM 255 15133
INCONEL 625 12213
INCO ALLOY G-3 11665
HASTELLOY C-4 8698HASTELLOY C-276 7201
HASTELLOY C-22 6800
HASTELLOY B-2 1487
MONEL 400 538
INCONEL 825 490
INCONEL 600 481SS 304LN 43120CB-3 422
SS 304L 325SS 904L 300SS 317L 203SS 316L 158ES-2205 101
7MO + N 49
45
Rp
Figure I. Equivalent circuit for a simple electrochemical cell.
-- decreosir_ frequency.---_
1
e_
Z'
R_ R_+Rp
Rp = 2 Izl tan _ max
NYQUIST PLOT
High Frequency: Z"_ O, Z'_ R
Low Frequency: Z n_ O, Z'----> R_+ Rp
i
Figure 2. Nyquist plot for equivalent circuit in Figure I.
46

log IZl e
IZl-"Cd.I.
log w
Figure 3. Bode plot for equivalent circuit in Figure I.
47
DoQO eli IoNil_ h41 |lo 8eU
48
:;,,,,..,:.,,_....,,.., ,.*,., -.-,Dote ire ¢oIImlllll
0 4/
• o IS I). Ill Illi_L • II. am Ilet IDlaleeDlot Pelee4Oell °ilOe lip
kte Oge ttellllmll
(_w: wqo) .Z- IZl 6or (Oop) 0
"t3M
nv
(v7!
C...n
>_0
r,.,-
lie-
0q,Je,,,,
t,,-4
c
u
!%1!
0
m-r
i,.o
o
_u-oo
cm
i/I.IN
CT>_
t_
eT--
49

I-|II I. ll! 101L IIllII
I_ pDIII||I _ -|21 a_
|i|! IIi |i|l|III
'O
I_IO I|0 IoIIVIInI
(--qo) .Z- IZl Sot (6ep) 8
I-I I. |If IIIL IgIIl!
II POlOIIIQI -lit o! IoI |_Ill IiitoI,lI Pit il||
Do_e 0ol 10LeIIN It PltloqIoe ,IO ov
Io4o Ill CsLm
r_v
u1cM_D
I'"
c0Ue-
l::
U
V
!
>_0
r,i
f,.I
4.z
m.T-
!,.o
o
o
cm
5_
kto Ilte toaim:lmiee
!
I_IIILLID9 II-II D.I)llll,,t h,..**** -a.m ='..eL II¢I.I I - lllUll
Dete ills le_
(Z_w:) _v_4o) ..Z- IZl (5ol (6op) 0
31
IOCO • ;D I. _D,I Dif.,L Ol_OOaD
O_ Potemteo| -Oo og100_o 8oe ¢*|0_
II_D-I •o 1101 114_ "I • 411 _ 1100141
M ffllllllll -II| IIlife lle IIIIMII
U
/
11'1
(_.: -_1o) ..Z- IZl 601, (6ep) 8
52
_lO.O I._B JSgL _lmiD
Ig POSoOllOi .isl 09
I_lo ImO CePO_ll I_0 • • OOe ll_'ll, il4iIOSD
10G PoqJem_Ool *010 oV
itolo Ooe CePOImum
(l:'-:) v,.-Io) ..Z- IZl 60t (Gop) 8
53

° °_4kO 9,011 IICL • lllD N-IOOLI D, HI ItIL ! N I_L ilili;Pa_le•Q0ol -000 • _ Pole_tOo| .14e _g
DItO lie CI_I_IdP _QO eoe _e_INIOII
(Z_w: wqo) .Z- IZI 6or (6op) 8
Dete eat Cee|lle0o
(_ea:) _0'40) .Z--IZl 6or (6or.) O
54
O I_ D O_ leal_ il N le_I_DOID- . - .
l-I|ll |.till 116¢£ IdlINlD N Petq_tlel -IHI} aA
N @otemtJQ| °_l oV hte 8_e 6DM
bte |DQ CoO0:Nm@
$5
IIOIL. i. ISll• .... Ill| Ila_lll_e- _ _ •' Ibll4 Ildlf, lk• II • Oql _ IlqlllqlDDole Inl 10OiH K Poql_llol -NI oql
IIQIo Om0 t01_
m0
V
m;
Figure 13. Nyquist and Bode plots for SS 316L (a,b).
57