n********************************************************* · · 2014-03-18children under age six...
TRANSCRIPT

ED 308 965
AUTHORTITLE
INSTITUTIONSPONS AGENCYPUB DATENOTEPUB TYPE
EDRS PRICEDESCRIPTORS
ABSTRACT
DOCUMENT RESUME
PS 018 152
Kotch, Jonathan; Shackelford, JoThe Nutritional Status of Low-Income PreschoolChildren in the United States: A Review of theLiterature.Food Research and Action Center, Washington, D.C.Ford Foundation, New York, N.Y.Jun 8975p.
Information Analyses (070)
MF01/PC03 Plus Postage.Behavior Problems; Diseases; *High Risk Persons;*Individual Development; Literature Reviews; *LowIncome Groups; *Nutrition; *Preschool Children;Program Effectiveness; Surveys
This review of the nutritional status of low-incomepreschool children in the United States discusses the topic inhistorical perspective and details current knowledge of thenutritional status of preschoolers. Discussion first focuses on theNational Health and Nutrition Examination Survey II of 1976-80, andthen turns to the National Food Consumption Survey of 1985 andstudies of special subpopulations and of hospitalized children.Consequences of adverse nutritional status are discussed in terms ofgrowth, health, malnutrition and infection, cognitive development,and obesity. Particular attention is given to iron deficiency.Subsequent discussion points out that nutritional status is clearlyrelated to income. Poor children were observed to have poorer dietaryintakes not in terms of the relative quality of their diets, but interms of quantity. Other observations from five surveys revealedinadequate calcium, zinc, and vitamin A and C intakes among poorpeople in general and blacks in particular, and inadequate ironintakes for all income groups, particularly among blacks. Althoughthe studies reviewed did not directly address program effects,articles that described improved nutrition status associated withparticipation in food programs were found. Approximately 150references are cited. (RH)
*************N*********************************************************Reproductions supplied by EDRS are the best that can be made
from the original document.***********************************************************************

U.S. DEPARTMENT OF EDUCATIONOffice of Educatonai Research ano ImprovementEDUCATIONAL RESOURCES INFORMATION
CENTER (ERIC)
Nrus document has been reproduced asecerveg from the person or organriatron
orrgrnahng rtC Maroc changes nave been made to rmprovc
reproduchon oualay
- Points of view Of oolmons stated In trusdocumerit do not neCeSsartly represent officoalOEM posit on or poky
THE NUTRITIONAL STATUS OF
LOW-INCOME PRESCHOOL CHILDREN
IN THE UNITED STATES:
A REVIEW OF THE LITERATURE
"PERMISSION TO REPRODUCE THISMATERIAL HAS BEEN GRANTED BY
V-004A Re S Q-Os.V61
CLY\a. RCV tOti C.,"\"
TO THE EDUCATIONAL RESOURCESINFORMATION CENTER (ERIC)."
Prepared by
Jonathan Kotch, M.D.Associate Professor of Maternal and Chad Health
Jo Shackelford,Research Assistant
University of North Carolina School of Public Health
For the
FOOD RESEARCH AND ACTION CENTER
BEST COPY AVAILABLE

THE NUTRITIONAL STATUS OF
LOW-INCOME PRESCHOOL CHILDREN
IN THE UNITED STATES:
A REVIEW OF THE LITERATURE
Prepared by
Jonathan Kotch, M.D.Associate Professor of Maternal and Child Health
Jo ShackelfordResearch Assistant
University of North Carolina School of Public Health
June 1989
FOOD RESEARCH AND ACTION CENTER1319 F Street, N.W., Suite #500
Washington, D.C. 20004(202) 393-5060
r,6

The Nutritional Status of Low-income Preschool Children:
A Review of the Lite:acure
TABLE OF CONTENTS
About FRAC iv
Acknowledgements
Introduction vi
Executive Summary and Conclusions viii
I. Historical Perspective 1
Owen's Preschool Nutritional Survey 1968-70 1
Ten-State Nutrition Survey 1968-70
Subporulation Preschool Nutrition Surveys ofthe late 1960's - early 1970's
North Central Region Infants and PreschoolNutritional Survey
The First National Health and Nutrition ExaminationSurvey: NHANES I, 1971-1974
3
4
5
5
II. Current Knowledge of the Nutritional Status ofPreschoolers 7
National Health and Nutrition Examination Survey II:NHANES II, 1976-1980
7
National Food Consumption Survey 1985 9
-
Table 1 -- Nutrient Intakes of Preschool Children byIncome and Age (% 1980 RDA) 9a
Table 2 -- Nutrient Intakes of Preschool Children byIncome and Race (% 1980 RDA) 9b
Studies of Special Sub-Populations9
Utah Nutrition Monitoring Project, 1985 9
Massachusetts Nutrition Survey, 1983 12Centers for Disease Control (CDC): Pediatric
4
Nutrition Surveillance System,Annv,al Summary, 1983 12
Pediatric Nutrition Surveillance Suystem, 1986 13
Memphis Survey, 1983 14
Minnesota Survey, 1983 15
Studies of Hospitalized Children -- United States 15
Consequences of Adverse Nutritional Status
A. Growth17
Growth Standards and References 17Definitions of Anthropometric Indices 18Long-term Implications: Ultimate Stature 20
B. Health Status22
C. Malnutrition and Infection 23
Figure 1 -- The Biological Mechanisms ThroughWhich Poverty Affects Nutritional Status 23a
D. Cognitive Development 25
Severe Malnutrition Outcomes 25
Undernutrition Outcomes 27
Cognitive Performance 27
Social Behavior 27
Iron Deficiency: A Special Case 29
Lead Levels and Behavior31
E. Obesity31
Immediate Health Consequences of Obesity 33
Psychosocial Consequences of Obesity 35
Long-term Consequences of Obesity 36
Discussion38
Program Effects40
References42
5

About FRAC
The Food Research and Action Center (FRAC) works at thenational and grassroots levels to alleviate hunger in the UnitedStates. Focusing primarily on improving the federal foodassistance programs, FRAC's main activities include: acting as aclearinghouse on domestic hunger for a nationwide network ofseveral thousand groups and individuals; monitoring federalpolicy developments on food assistance and hunger; providingtechnical assistance and training to legal services attorneys andanti-hunger activists; and educating the public and policymakerson the extent and causes of hunger and possible solutions to theproblem. FRAC is a nonprofit, nonpartisan organization whichrelies primarily on the support of foundations, religious groups,corporations, individuals and others to continue its work onbehalf of the disadvantaged.
iv
6

Acknowledgements
FRAC would like to thank the Ford Foundation for the generousgrant that .upported the publication of The Nutritional Status ofLow-Income Preschool Children in the United States: A Review ofthe Literature and for their support of FRAC's work on maternaland child health and nutrition issues.
FRAC would also like to thank Dr. Jonathan Kotch, AssociateProfessor of Maternal and Child Health and Jo Shackelford,Research Assistant, of the University of North Carolina School ofPublic Health for their painstaking review of the currentscientific literature on the nutritional status of low-incomepreschool children. Alan Sharpe, FRAC Senior Word ProcessingSecretary, assisted in the preparation of this document.
v

The Nutritional Status of Low-Income Preschool Children
In the United States: A Review of the Literature
Introduction
In 1987, five million or 22.8 percent of children under age sixwere living below the poverty level. Even higher percentages ofminority children lived in poverty -- 49 percent of all blackchildren under age six and 41.8 percent of all Hispanic childrenunder six. Moreover, the poor are getting poorer -- in 1987,39.2 percent of the poor had incomes below half the povertylevel, the highest percentage in more than a decade.
Living below poverty adversely affects the ability topurchase a nutritionally adequate diet. One can see theseadverse effects in the local hunger surveys conducted in the1980's which indicate a dramatic increase in the demand foremergency food and the use of emergency food facilities as asteady source of food over long periods of time. Food pantriesand soup kitchens report that more and more families with youngchildren are coming to them on a regular basis for food. FRAC'sown on-going research on childhood hunger -- the scientificallytested Community Childhood Hunger Identification Project -- hasdocumented a high prevalence of chronic hunger among low-incomechildren in New Haven, Connecticut (18 percent) and three areasof Washington State (21 percent to 42 percent).
FRAC is especially concerned about the impact of thissituation on preschool children. These children are usually notin school settings, so school breakfasts and lunches are notavailable to them. Aid to Families with Dependent Children, aprogram that benefits many of these children, generally has lowbenefit levels and recently has failed terribly in keeping pacewith inflation. Many eligible low-income households are notparticipating in the Food Stamp Program, and even those who dohave difficulty obtaining a nutritionally adequate diet withavailable resources. The Head Start Program and the Child CareFood Program, which provide nutritious meals and snacks tochildren in day care, reach a relatively small percentage ofeligible children. And the WIC program, which providesnutritious supplemental foods to low-income women, infants andchildren age one to five years, reaches only 38 percent of thechildren who are estimated to be eligible for the Program,according to the most recent U.S. Department of Agriculture data.
Because of concern about the nutritional status of thesechildren, FRAC asked Dr. Jonathan Kotch, Associate Professor ofMaternal and Child Health, and Jo Shackelford, ResearchAssistant, at the University of North Carolina School of Public
vi

Health, to review and analyze the scientific literature availableon the nutritional status of low-income preschool children in theUnited States. What follows is a summary of their literaturereview, a listing of final conclusions, the literature reviewitself, and the references consulted.
vii

The Nutritional Status of Low-Income Preschool Children
In the United States
Executive Summary
HISTORY
Concern regarding the nutritional status of preschoolchildren derives from both the immediate effects of inadequatediet and from its long lasting and possibly irreversible effectson healthy growth, and development. Most interest in thissubject has focused on the nutritional consequences of severemalnutrition in developing countries. While severe primarymalnutrition is rare in the United States, deficiencies remain aconcern in certain populations. Of equal or greater concern,however, is the possibility of more subtle long-term effects ofchronic undernutrition and of overnutrition, both of which arecommon problems in the United States and other develoredcountries.
Until the late 1960's little was known about the generalnutritional status of young children in the United States.However, in 1968 two federally funded national surveys -- thePreschool Nutrition Survey and the Ten-State Nutrition Survey --took a more comprehensive look at the problem. The PreschoolNutrition Survey found that the average dietary intake of poorchildren was lower than that of non-poor children, butnutritional quality of diets differed very little betweenchildren of different socioeconomic ranks. The authors concludedthat lack of sufficient quantity of food was the problem for poorchildren, rather than nutritional quality. In other words, thekinds of foods they were eating were nutritionally sound, butthey were not eating enough food. The authors also found thatchildren who were short for their age tended to be poor and thatlow hemoglobin (a sign of iron deficiency) was highest among poorchildren. The Ten-State Nutrition Survey surveyed 80,000 people,12,000 of whom were children less than six years of age. Thissurvey also found that insufficient food was a problem among low-income preschoolers. Lower stature, weight, skinfold thickness,head circumference; less advanced skeletal and dentaldevelopment; later maturation; and later attainment of maximumstature were all associated with lower per capita income.
In the late 1960's and early 1970's several studies weredone of smaller groups of preschoolers. These studies also foundthat lower income children did not grew as well and did not haveas favorable a nutritional status as higher income children.
viii
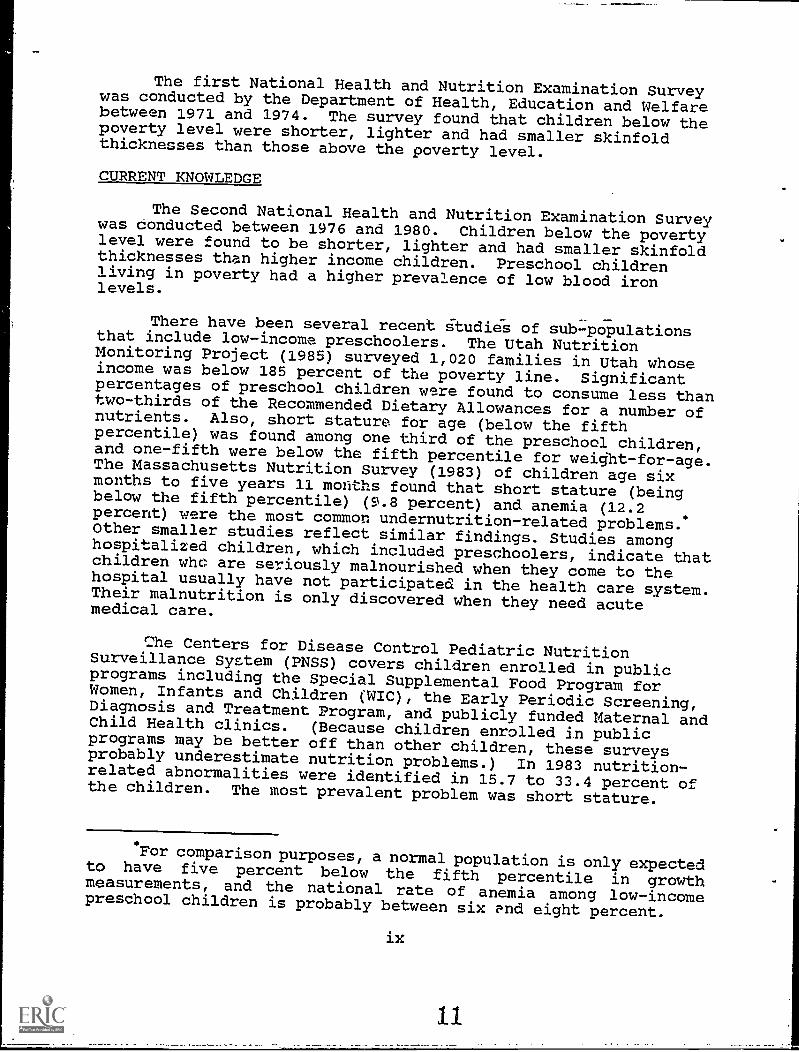
The first National Health and Nutrition Examination Surveywas conducted by the Department of Health, Education and Welfarebetween 1971 and 1974. The survey found that children below thepoverty level were shorter, lighter and had smaller skinfoldthicknesses than those above the poverty level.
CURRENT KNOWLEDGE
The Second National Health and Nutrition Examination Surveywas conducted between 1976 and 1980. Children below the povertylevel were found to be shorter, lighter and had smaller skinfoldthicknesses than higher income children. Preschool childrenliving in poverty had a higher prevalence of low blood ironlevels.
There have been several recent studies of sub- populationsthat include low-income preschoolers. The Utah NutritionMonitoring Project (1985) surveyed 1,020 families in Utah whoseincome was below 185 percent of the poverty line. Significantpercentages of preschool children were found to consume less thantwo-thirds of the Recommended Dietary Allowances for a number ofnutrients. Also, short stature for age (below the fifthpercentile) was found among one third of the preschool children,and one-fifth were below the fifth percentile for weight- for-age.The Massachusetts Nutrition Survey (1983) of children age sixmonths to five years 11 months found that short stature (beingbelow the fifth percentile) (S.8 percent) and anemia (12.2percent) were the most common undernutrition-related problems.Other smaller studies reflect similar findings. Studies amonghospitalized children, which included preschoolers, indicate thatchildren whc are seriously malnourished when they come to thehospital usually have not participates in the health care system.Their malnutrition is only discovered when they need acutemedical care.
Che Centers for Disease Control Pediatric NutritionSurveillance System (PNSS) covers children enrolled in publicprograms including the Special Supplemental Food Program forWomen, Infants and Children (WIC), the Early Periodic Screening,Diagnosis and Treatment Program, and publicly funded Maternal andChild Health clinics. (Because children enrolled in publicprograms may be better off than other children, these surveysprobably underestimate nutrition problems.) In 1983 nutrition-related abnormalities were identified in 15.7 to 33.4 percent ofthe children. The most prevalent problem was short stature.
For comparison purposes, a normal population is only expectedto have five percent below the fifth percentile in growthmeasurements, and the national rate of anemia among low-incomepreschool children is probably between six and eight percent.
ix

Data from the 1986 PNSS indicate a declining prevalence ofanemia among low-income children from 7.8 percent in 1975 to 2.9percent in 1985. However, the authors state the PNSS uses verystringent cut-off values in defining anemia, comoared to currentmedical practice, and thus may have underestimated theprevalence. They state that "the prevalence of anemia amongchildren ages one to five years from low-income families in themid-1980's probably is in the range of 6% to 8% based on lessstringent cut-off values commonly used in clinical settings."
CONSEQUENCES OF ADVERSE NUTRITIONAL STATUS
GROWTH
Growth is the most widelz used index in assessing nutritionin children. In healthy populations, individual variation ingrowth is primarily determined genetically. However, when growthlags behind genetic potential, environmental factors have a mdorinfluence. Among these are nutrition, socioeconomic status, andinfection or disease.
Evidence from the National Center for Health Statisticsdata and data from other U.S. surveys show that undernourishedchildren are often short in stature, and there is a clearrelationship between family income levels and reduced height.Studies from other countries show similar results for samples ofpreschool children of the same ethnic population but di'::ferentsocioeconomic groups.
HEALTH STATUS
There is strong evidence that height and other growthmeasurements reflect the nutritional status of children.Moreover, studies in developing nations have documented increasedmorbidity (illness) and mortality associated with poor growth.
MALNUTRITION AND INFECTION
Infectious diseases occur more frequently, are more severe,and have longer duration in malnourished individuals.Malnutrition impairs the body's defense mechanisms in a number ofways. Most studies of the effects on immune response haveinvolved cases of Jevere malnutrition. However, there is growingevidence that even mild to moderate nutritional deficits mayadversely alter the immune response in a small proportion ofundernourished children often before clinical signs ofmalnutrition appear.
x
12

COGNITIVE DEVELOPMENT
Most studies .on the effects of malnutrition on cognitivedevelopment and behavior have focuseC on the outcome of severemalnutrition, but recently studies have been shifting toinvestigations of mild-to-moderate deficiencies. The effects ofmild-to-moderate undernutrition on mental development may affectmore children than severe malnutrition in both underdeveloped anddeveloped countries. Evidence from intervention studies indeveloping countries that involve the provision of nutritioussupplemental foods to children provides support for a causalrelationship between nutrition and mental development.
SOCIAL BEHAVIOR
There 'haVe-been-fewer studies of the effect of malnutritionon social-emotional functioning than on cognitive development,but there has been a shift of emphasis recently. Researchers arereporting that even mild to moderate undernutrition producesincreased apathy and reduces children's activity levels andexploratory behavior, which may in turn reduce the mother'sresponsiveness and enthusiasm toward the child. The child whodoesn't elicit positive responses learns to withdraw from socialcontacts. This is of concern because development of socialskills appears to be dependent on learned interaction skills inthe earliest stages of childhood and on care-giver-childinteraction. Mild-to-moderate malnutrition is far moreprevalent, and would, therefore, put large numbers of children atrisk of social dysfunction.
IRON DEFICIENCY: A SPECIAL CASE
Iron deficiency, which is relatively prevalent and easilymeasured, has been extensively studied for its effects. Currentevidence strongly supports an association between irondeficiency, with or without anemia, and behavioral symptoms ofapathy, inattentiveness, irritability, memory difficulties, andlowered performance on cognitive tests in infants and preschoolchildren.
LEAD LEVELS AND BEHAVIOR
Comparisons of cognitive and behavioral functioning ofchildren with high and low lead levels reveal that high lead
*Iron deficiency is defined as the decrease or disappearanceof iron stores in the body. Iron deficiency anemia does notdevelop until all the storage iron has been used up an0 -hanges inthe red blood cells result.
xi
1.3

levels are associated with deficits in Intelligence Quotient(IQ), verbal IQ, auditory processing, and attentionalperformance. Children with high lead levels, even three yearsafter being treated, spend more time in distracted, off-taskbehavior in the classroom. Lead and other heavy metals areabsorbed by the body more readily when children are malnourishedor anemic, and low-income children experience a higher risk ofbeing both.
DISCUSSION
It -is clear that nutritional status is related to income,and that relationship is in the expected direction. Poorchildren have poorer dietary intakes, not in terms of therelative nutritional quality of their diets, but in terms of thequantity of food they consume. Lower energy intakes among poorerchildren were observed by the Ten State Nutrition Survey as earlyas 1968, and again in the National Food Consumption Survey of1985. Other observations among the national surveys includedinadequate calcium, zinc, vitamin A and vitamin C intakes amongthe poor and/or among blacks, and inadequate iron intakes amongall income groups, particularly among blacks.
In general, poor children tend to be shorter. In somecases the burden of short stature is excessive. In the UtahProject, for example, 33.3% of children below 185% of povertyfell below the fifth percentile for height-for-age, 28.3% morethan expected. Similarly, poor children are lighter and less fatthan non-poor children. There seemed to be no significantimprovement in the gap in overall growth parameters between poorand non-poor preschoolers from the 1971-74 National Health andNutrition Examination Survey (NrIANES I) to the one carried outbetween 1976 and 80 (NHANES II).
Poor presr:hool children have greater rates of impairedhemoglobin and hematocrit levels, and poor black preschoolershave the most impairment. Between NHANES I and NHANES II, therewas improvement rioted in iron or hematologic status, yetsignificant impairment persisted. Similarly, elevated leadlevels decreased from NHANES I to NHANES II, yet even by the timeof NHANES II the incidence of elevated lead levels was as high as18.5 percent among black, urban children.
In the case of iron status, most of the evidence suggeststhat impaired iron status, even in the absence of anemia, isassociated with poorer performance on standardized tests, andthat erformance can be improved with iron thera. Similarlyrelatively recent studies in developing countries have producedevidence of an association between nutrition supplementation ofmildly undernourished (as opposed to severely malnourished)preschoolers and improved social behavior. When mildlyundernourished children were supplemented, they had better
xii

attention spans, more persistence, less distractibility, moresocial interaction, less dependence and anxiety, better impulsecontrol and happier affect. The net effect of these improvementsresulted in better performance in novel environments, moreinvolvement in competitive games, greater number of strategiesattempted in response to a frustrating task, and fewer errors instructural impulse control games.
PROGRAM EFFECTS
The National Food Consumption Survey compared poor childrenon food stamps with those not on food stamps. Non-food stampparticipants had inadequate levels of four nutrients, and foodstamp participants had only two. However, one cannot concludethat food stamp participation caused the improvement because thesurvey wag-riBt set up to make that judgement.
In Memphis, researchers compared preschool nutrition statusin 1977 with that in 1983 and noticed improvement in vitamin Aand vitamin C intake, in hematologic status, and in obesity.These improvements were attributed to increased participation inpublicly supported food and nutrition programs. Other smallerstudies show similar nutrition and health impacts of foodprograms on preschool children.
There has been overall improvement in the iron status ofpreschool children between NHANES I and NHANES II. Tt is likelythat this improvement is attributable to iron forti Ication ofinfant formulas and cereal products. Researchers at the Centersfor Disease Control have noted important gains in iron status inseveral states participating in the Pediatric NutritionSurveillance System. Observing that children already enrolled inthe WIC program have better iron status than same-age children attheir first WIC visit, the authors conclude that participation inWIC is also associated with lower rates of anemia.
CONCLUSIONS:
1. Nutrition studies and surveys among preschool children haveconsistently shown that nutrition problems are associatedwith low income.
2. The diets of low-income preschoolers tend to be adequate innutritional quality, but insufficient in quantity,suggesting that if these children were able to consume morefood of equal nutritional content, they would be better-nourished.
3. There is evidence that preschool children can suffernegative social and behavioral effects when they are mildlyto moderately undernourished.

4. According to the local surveys reviewed, participation infood and nutrition programs is associated with improvementin nutritional status among preschoolers.
5. The only nutrition indicator that has significantlyimproved among low-income preschoolers between the 1971-74National Health and Nutrition Examination Survey (NHANES I)and the 1976-1980 NHANES II is iron status. Yet, even withthis improvement, a significant level of impairmentpersists, as does' the difference in iron status betweenpoor and non-poor children. While there appears to haveben a general improvement in the growth of poor childrenfrom NHANES I to NHANES II, the differences do not reachstatistical significance. Also, the gap between the growthindicators of low-income preschoolers and those of higher-income preschoolers did not change significantly betweenthese two time periods. Therefore, growth differencesassociated with poverty, while improving, have not beeneliminated.
xiv

The Nutritional Status of Low-Income Preschool Children:A Review of the Literature
I. Historical Perspective
Concern regarding the nutritional status of preschoolchildren derives from both the immediate effects of inadequatediet and frlin its long lasting and possibly irreversible effectson heath, growth, and development. Most interest in thissubject has focused on the nutritional consequences of severemalnutrition in developing countries. While severe primarymalnutrition is rare in the United States, deficiencies remain aconcern in certain populations. Of equal or greater concern,however, is the possibility of more subtle long-term effects ofchronic subclinical undernutrition and of overnutrition, both ofwhich are commor problems in the United States and other de-veloped countries (Listernick, Christoffel, Pace, et al., 1985;Gayle, Diblei Marks, et al., 1987; Merritt and Suskind, 1979).
Until the late 1960's little was known about the generalnutritional status of young children in the United States.Studies of various segments of the population had been reported,but they were often limited in scope and sample size (Kelsay,1969). In 1968 Hunger, U.S.A. was published by the Citizen'sBoard of Inquiry and widely publicized in the media. This reportconcluded that widespread hunger and malnutrition existed in manyparts of the United States. Although not itself based on ascientifically conducted survey, the report led to a morecomprehensive look at the problem through two national surveys,the Preschool Nutrition Survey and the Ten-State NutritionalSurvey.
Owen's Preschool Nutritional Survey 1968-70
The purpose of the Preschool Nutrition Survey (PNS) was notto determine the prevalence of malnutrition or of specific dis-orders but to provide an "overview of descriptive data onnutritional status of a cross-sectional sample of preschoolchildren in the United States" (Owen, Kram, Garry, et al.,1974). Aware that the Ten-State Nutritional Survey, which wasin planning, would focus on poverty populations, the PNS feltthat a cross-sectional approach was needed to compare subsets ofthe population. The samples included 3441 children from 74sample areas in 36 states and the District of Columbia.
1

Considerable information about socioeconomic status, eatinghabits, current dietary intake, and medical history, and fromphysical examinations, and biochemical evaluations, was gatheredon the participating children and their families. The surveyfound few specific nutritional deficiency disorders. In gen-eral, age and socioeconomic rank appeared to be the majordeterminants of health and nutritional status.
Dietary Intake: Average dietary intake of poor children waslower, but nutritional quality of diets differed very littlebetween children of different socioeconomic (SES) ranks. Theauthors concluded that lack of sufficient quantity of food wasthe problem rather than quality. Supplements contributedsubstantial amounts of vitamins to total intakes of preschoolchildren with greatest percentage increases for poor children.Protein consumption differed little by age, race, or SES.Calciu-1 intake of black children was less than white, and aprogressive decrease in use of dairy products was found withincreasing age. Ascorbic acid intakes were 50% greater in upperSES groups representing a greater use of supplements and citrusfruits. Mean intake was higher for white children thanblacks.
Anthropometry: Children short-for-age clustered in the low SESgroups. Black children were smaller at birth. They wereheavier and taller than white children at two years of age, butwere thinner with less subcutaneous fat. Excluding blacks,there was a progressive increase of height, weight, and headcircumference with increase in SES status.
Biochemloal Values: An excess of "low or unacceptable" bio-chemical values clustered among children of lower SES. Hemo-globin values were lowest in lowest SES groups and increasedprogressively in each rank and in each age group. Mean hemo-globin was higher in whites than blacks in each age group.Transferrin saturation values, reflecting iron stores, were alsohigher in whites and increased with age. Vitamin A or plasmaretinol levels were consistently higher in whites and generallyincreased with SES rank in association with greater use ofvitamin supplements. Vitamin C levels were also higher in upperSES ranks and in white children.
Dental Examination: Children in low SES Groups and particularlyblack children had the highest dental caries attack rate (Owen,et al., 1974; Owen .and Kram, 1968; Owen, Garry, Lubin, et al.,1971; Owen, Nelson, Kram, et al., 1969; Jones, Nesheim, andHabicht, 1985).
2

Ten-State Nutrition Survey 1968-70
In 1967 Congress directed the Department of Health, Edu-cation, and Welfare to undertake a survey to determine "theincidence, magnitude, and location of serious hunger and mal-nutrition in the U.S." (Garn and Clark, 1975; Shaefer, 1969).In response, the Ten-State Nutrition Survey (TSNS) was conductedwith the sample disproportionately selected from the lowestsocioeconomic sections of ten states. Data were obtained on80,000 individuals with approximately 12,000 children less thansix years of age participating. Information obtained includeddietary recall, general SES data, physical and dental examina-tions, biochemical and anthropometrical assessments. The TSNSfound that substantial numbers of children were undernourishedand that smaller size was associated with lower income.
Dietary Intake:* Diets varied with geographic locale, SES, race,and ethnicity, with energy intakes lowest for blacks andMexican-Americans living in southern states. However, thenutrient quality varied little in relation to race or incomeexcept for Vitamin A. This is consistent with the PNS findingthat the amount of available food is more a problem than qualityof food. The total food intake of children in low-incomefamilies was limited, and this was reflected in their growthparameters. In all age groups iron was uniformly below dietarystandards, and average daily intakes were similar regardless ofSES.
Anthropometry: Greater stature, weight, triceps skinfoldthickness, and head circumference; advanced skeletal and dentaldevelopment; earlier maturation; and earlier attainment ofmaximum stature were all associated with higher per capitaincome. These differences were in large part established by thefirst year of life and were consistent thereafter. Blackchildren, as in the PNS, tended to have advanced skeletal anddental development, earlier maturation, and a tendency towardgreater body size. Median thickness of subcutaneous fat in-creased directly with income and continued through adolescencein males. However, in females the relationship reversed inadolescence with lower income girls being fattest. At all ages,black males were leanest; and after adolescence, black femaleswere fattest with at least part related to low income. Obesityin children and adolescents, with its resistance to treatmentand with potentially serious behavioral and health consequences,was identified as a common nutrition-related health problem.
Biochemical values: hemoglobin levels were lowest in blackchildren. Essentially all anemia found was due to iron defi-ciency, and a high prevalence was demonstrated in all ages.Vitamin A levels were lower in low SES groups living in southernstates, with lowest levels in Mexican-Americans. Blacks andwhites were similar in low values of plasma ascorbic acid, and
3
19

2/3rds of low levels were found in southeastern states (Garn andClark, 1975; American Academy of Pediatrics, 1973; Schwerin,Stanton, Riley, et al., 1981; Jones, et al., 1985; Schaefer,1969) .
Subpopulation Preschool Nutrition Surveysof the late 1960's-early 1970's
Kerrey, Crispin, Fox, et al. (1968) conducted a survey of40 preschool children, ages 3 1/2 to 5 1/2 years of age inLincoln, Nebraska, half from high SES level and half from lowSES level. All mean anthropometric measurements except skinfoldthicknesses tended to be greater for the higher SES group. Themean calorie intake for both groups was slightly lower thanrecommended intake, and the most limited nutrients were iron,calcium, and ascorbic acid. In general, higher SES children hada more favorable nutritional status, partly attributable togreater use of vitamin supplements. Hemoglobin and hematocritlevels were comparable in the two groups.
Chase, Kumar, Dodds, et al. (1971) studied the nutritionaland health status of 300 Mexican-American preschool children ofmigrant workers in Colorado in 1969. Vitamin A deficiency was amajor problem in 55% of the children. Reduced calorie intakewas suggested by the finding that 35% of the children were belowthe 10th percentile for triceps skinfold measurement. Heightattainment was low in 54 of the 300 children. Vitamin C levelswere also low in these same 54 children.
Zee, Walters and Mitchell (1970) surveyed 300 black chil-dren from poverty-level families in Memphis. Half of the chil-dren were below the 25th percentile for height and weight, and28% of children less than three years of age were anemic (Hgbless than 10gm/100m1). The authors concluded that low amounts ofavailable food were the main cause of growth retardation andanemia.
Driskell and Price (1974) studied the nutritional status of40 preschool children (ages 2 to 5 years) from low-incomefamilies in Montgomery, Alabama, who received health care from acity-county clinic. Hemoglobin concentrations were below theacceptable level (11.0 gm) in 13% of the children and hema-tocrits were below acceptable level (34%) in 28% of the chil-dren. In genera-, individual nutrient mean intakes exceeded therecommended amounts except for calcium and iron. Mean heightsand weights fell between the 50th and 75th percentiles reportedby Owen's preschool nutritional survey (1968-70). Ten percent ofthe subjects fell below the 10th percentile for height andweight.
4
20
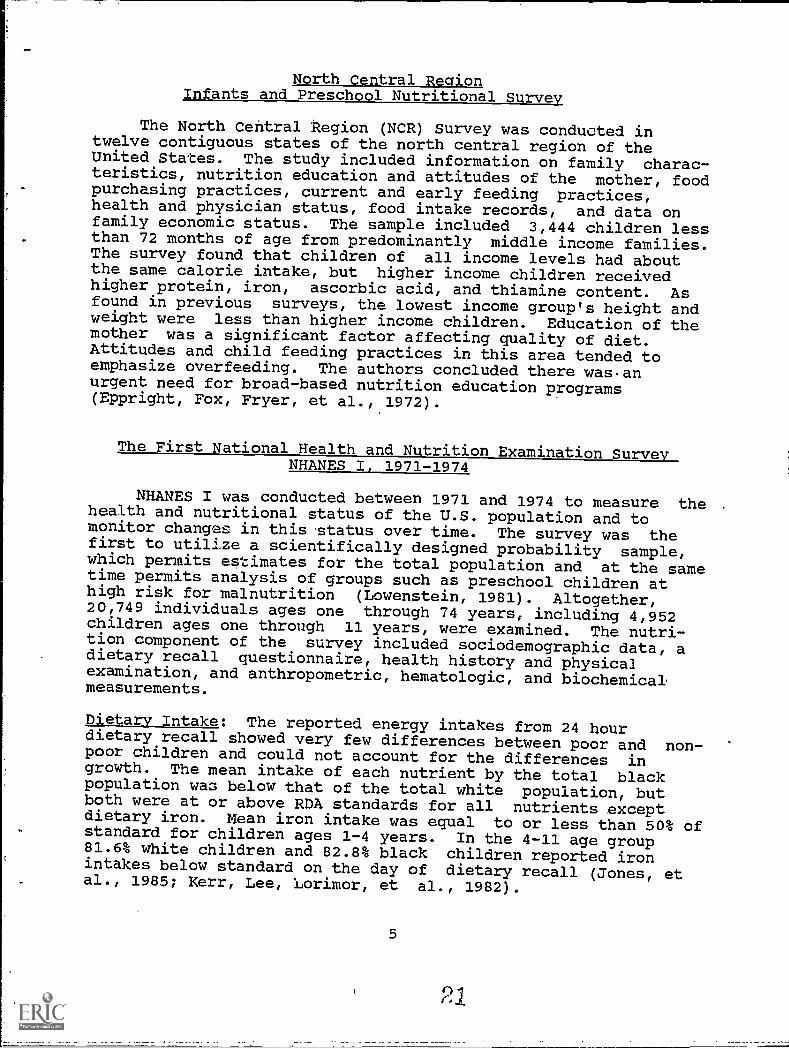
North Central RegionInfants and Preschool Nutritional Survey
The North Central Region (NCR) Survey was conducted intwelve contiguous states of the north central region of theUnited States. The study included information on family charac-teristics, nutrition education and attitudes of the mother, foodpurchasing practices, current and early feeding practices,health and physician status, food intake records, and data onfamily economic status. The sample included 3,444 children lessthan 72 months of age from predominantly middle income families.The survey found that children of all income levels had aboutthe same calorie intake, but higher income children receivedhigher protein, iron, ascorbic acid, and thiamine content. Asfound in previous surveys, the lowest income group's height andweight were less than higher income children. Education of themother was a significant factor affecting quality of diet.Attitudes and child feeding practices in this area tended toemphasize overfeeding. The authors concluded there wasanurgent need for broad-based nutrition education programs(Eppright, Fox, Fryer, et al., 1972).
The First National Health and Nutrition Examination SurveyNHANES I. 1971-1974
NHANES I was conducted between 1971 and 1974 to measure thehealth and nutritional status of the U.S. population and tomonitor changes in this 'status over time. The survey was thefirst to utilize a scientifically designed probability sample,which permits estimates for the total population and at the sametime permits analysis of groups such as preschool children athigh risk for malnutrition (Lowenstein, 1981). Altogether,20,749 individuals ages one through 74 years, including 4,952children ages one through 11 years, were examined. The nutri-tion component of the survey included sociodemographic data, adietary recall questionnaire, health history and physicalexamination, and anthropometric, hematologic, and biochemicalmeasurements.
Dietary Intake: The reported energy intakes from 24 hourdietary recall showed very few differences between poor and non-poor children and could not account for the differences ingrowth. The mean intake of each nutrient by the total blackpopulation was below that of the total white population, butboth were at or above RDA standards for all nutrients exceptdietary iron. Mean iron intake was equal to or less than 50% ofstandard for children ages 1-4 years. In the 4-11 age group81.6% white children and 82.8% black children reported ironintakes below standard on the day of dietary recall (Jones, etal., 1985; Kerr, Lee, Lorimor, et al., 1982).
5

Anthropometry: The survey found that children in income groupsat or above poverty level were consistently taller, heavier, andhad greater triceps skin-fold thickness measurements than thosebelow poverty level. Black children were taller than whitechildren. (Jones, et al., 1985; Kerr, Lee, Lorimor, et al.,1982).
Biochemical Values: NHANES I data identified few deficientbiochemical values, but a large number were considered low.Whether these represent abnormal states or the low end of thedistribution for a well-nvArished population was difficult todetermine (Kerr, Lee, Lam, et al., 1982).
Black subjects had lower mean hemoglobin, hematocrit, andtransferrin saturation values than whites in each age group._The youngest children, ages 1 to 3, had the highest percentageof low hemoglobin, serum iron, and transferrin saturation values(Jones, et al., 1985). In the 4-11 age group the percentage ofthe population below standard in the following values werehemoglobin: 5.5% white, 21.1% black; hematocrit: 18.3% white,29.4% black; transferrin saturation: 30.0% white, 33.7% black;serum iron: 8.2% white, 8.0 black (Kerr, Lee and Lam, et al,1982) .
6
22

II. Current Knowledge of the Nutritional Status of Preschoolers
National Health and Nutrition Examination Survey IINHANES II, 1976-1980
The NHANES II Survey was designed to provide health and nutri-tional information for the civilian, noninstitutionalizedpopulation of the U.S., ages six months to 74 years of age, andspecifically, to describe changes in status occurring sinceNHANES I. A stratified multistage probability sample identifiedapproximately 20,300 individuals for the survey including 7,011children ages six months to 17 years. Those groups considered tobe at risk for impaired nutritional status were overrepresentedto improve statistical reliability of the data for them. Theseincluded young children, those below poverty level, and theaged. The protocol included questionnaires on demographicvariables, medical history, diet, and use of medication anddietary supplements; medical examination; and specitl clinicalprocedures including anthropometry and biochemical azsessments.
Dietary Intake: Very few significant differences for energyintake, protein, fat, and carbohydrate were evident between poorand non-poor, and all fell within recommended ranges. Differ-ences in growth could not, therefore, be explained by measuresof dietary intake. This may reflect methodological problemsassociated with using a 24-hour dietary recall method, which maynot represent the habitual diet pattern of individuals (pones,et al., 1985).
Bowering and Clancy (1986) analyzed NHANES II data on thevitamin and mineral intakes of children. They found the meandietary intakes of these nutrients from food sources were abovethe Recommended Daily Allowances for all children under 12 yearsof age except iron intake for preschool children. Thirty-sevenpercent of 2 to 5 year old children were receiving vitamin andmineral supplements regularly. Greater use of supplements wasassociated with race (37% of whites versus 22% of blacks under12 years of age), higher education level of parents, higherincome (28% of the lowest income rank compared to 40% of thehighest rank), and whether or not the mother took supplements.
Mahaffey, Gartside, and Glueck (1986), in their analysis ofNHANES II data, found lower dietary calcium intakes in blackchildren and children of low income levels. Lower calciumintake was also associated with high blood lead levels. Somenutrients, including calcium, modify lead absorption in infants.
Anthropometry: In general, children above the poverty levelwere found to be taller, heavier, and fatter, which finding isconsistent with previous U.S. surveys. All race/sex groupsshowed higher mean heights for non-poor, but only 8 of 12 groups
7
23

were statistically significant. The differences between heightof poor and non-poor children, ages 1 to 5, did not show anyconsistent changes between NHANES I and II. The difference forthe 1 to 5 year age group was 1.3 centimeters in mean heightbetween poor and non-poor. As in previous surveys, blackchildren were taller than whites until adolescence.
Weight values also were higher in non-poor groups with theexception of the reversal in weights for adolescent females.Low-income females were heavier. Weight differences betweenpoor and non-poor decreased in older age groups between NHANES Iand II, but no significant changes occurred in the youngestchildren, ages 1 to 5 years. Poor children had 3 to 8% smallerskinfold measurements than non-poor, and the gap did not narrowsignificantly from the first to the second survey,
While there appears to have been a general improvement ingrowth of poor children from NHANES I and NHANES II, many of thedifferences do not reach statistical significance. The con-clusion is, therefore, that growth differences associated withpoverty, while improving, have not been eliminated.
Biochemical Values: Analysis of the data by an Expert Scien-tific Working Committee (1985) for the American Society forClinical Nutrition found 9.2 to 9.4% of children, ages 1 to 2years, and 6.1% of children, ages 3 to 10, with impaired iron;status. Black children showed a slightly higher prevalence,which was significant for 3 to 4 year old children. Povertylevel children had-a higher prevalence of low iron values, mostnotably in preschool children, ages 1 to 4 years.
Mean blood lead levels declined in NHANES II, but sig-nificantly higher levels were found in black children thanwhite, ages 1 to 11 years, and in children from lower incomelevels and more urban areas. As previously stated, a significantinverse association between dietary calcium intake and blood leadlevels was found (Mahaffey, et al., 1986).
In their analysis of vitamin and mineral use, Bowering andClancy (1986) found users of supplements had higher mean serumlevels of vitamins A and C and a lower incidence of low serumvalues for those nutrients than non-users. Fewer children tookiron supplements than vitamin supplements. There were no sig-nificant differences in values for iron status or percentage oflow values of iron status between iron supplement users andnon-users.
Dallman, Yip, and ,.Dhnson (1984), estimated the prevalenceof anemia from the results of NHANES II. The prevalence ofanemia for all races, as defined by hemoglobin values below the95% reference range for age and sex, was 5.7% in infants ages 1to 2 years and 3.5% in 3 to 5 year olds. The values for all
8

races were very similar; however, there was a lower medianhemoglobin concentration in blacks than in whites. Moderate orsevere anemia was rare. Iron deficiency was the predominantcause of anemia in infants. The high prevalence of anemia inyoung children, who have increased iron requirements for rapidgrowth, is consistent with previous findings (Dallman, Slimes,and Stekel, 1980).
National Food Consumption Survey 1985
The National Food Consumption Survey (NFCS) provides dataon the 24-hour dietary intakes of women, 19 to 50 years of age(n=1,503) and their children, 1 to 5 years of age (n=548).A comparable survey was done in 1977. In general, energy intakesin 1985 were reported to be higher, and intakes of all vitaminsand minerals studied were as high or higher than reported in1977. Exceptions were lower intakes of protein and fat.Children's intakes of food energy and nutrients were ,higher in1985 than 1977 except for iron and zinc, which did not meet 1980Recommended Daily Allowances (RDA) of the National Academy ofSciences' Food and Nutrition Board. For low-income families(below 130% poverty level), children were below RDA, regardlessof race or income, for mean intakes of food energy (97% of RDA),calcium (96% of RDA), iron (84% of RDA) and zinc (76% of RDA).Food stamp participant children were below RDA only for iron andzinc.
RDA's are set high enough toall healthy individuals. "Inta)*sarily inadequate, but risk ofextent that intake is less than ,
1985). Use of RDA standards wilyas "at risk" who may be consumingKerr, Let, et al., 1982).
requirements of nearly'sr.', than RDA are not neces-
3 vP0 increases to the_ .mended level." (NFCS;
-Iassify significant numbersadequate diets (NFCS, 1985;
The tables on pages 9A and 9B show mean nutrient intakes ofpreschcil age children as percentages of 1980 RDA and by incomelevel and by race. Income levels are defined as a percent ofthe 1985 poverty guideline, U.S. Department of Health and HumanServices.
Studies of Special Sub-Populations
Utah Nutrition Monitoring Project, 1985
The Utah Nutrition Monitoring Project (1986) surveyed 1,020families in Utah whose income was below 185% of the 1985 povertyguidelines. A questionnaire format was us.':Nd to obtain infor-mation In demographics, socioeconomic status, and use of exist-ing income and food assistance programs. Additionally, a dietaryhistory and anthropometric data were collected.
9
25

TABLE 1
ranum INTAXES OF PRESCHCOL 011tDREN BY INCOME NO ACE (X 1960 RDA)
Number Food Protein Vitamin A Ascorbic Thiamin Riboflovin Niocin Vitamin 86
Energy Acid
0-75X Poverty
1
Vitamin B12 Colcium Phosphorus Magnesium IrcA Vitomin E Folocin Zinc
,oge 1-3 356 106 239 181 177 172 215 163 143 236 102 127 125 75 160 208 784-5 244 91 188 181 183 146 178 150 112 188 98 126 94 117 136 113 80
(Report 85-2)
75-138X Poverty
266 95 207 169 156 143 183 130 116 174 86 108 106 59 112 159 66age 1-3
4-5 156 86 182 179 190 129 155 130 95 160 88 118 89 99 100 95 77(Report 65-2)
j31-300X Poverty
157 106 238 265 179 162 213 146 137 196 112 133 131 70 100 184 79age 1-3
4-5 79 87 183 186 189 130 174 130 99 206 105 130 98 109 103 114 90(Report 85-1)
to
2.7

TABLE 2
NUTRIENT INTAKES OF PRESCHOOL CHILDREN BY INCOME AND RACE (% OF 1980 RDA)
Number Food Protein Vitamin A Ascorbic Thiamin Riboflovin Niacin Vitamin 86 Vitamin 812 Calcium Phosphorus Magnesium Iron Vitamin E Folacin ZincEnergy Acid
Children
Ages 1 -5
Law Inca=1
White 839 100 215
Black 265 93 213
Other 162 94 211
All Income:2'
White 457 100 217
Black 53 105 243
Other 24 98 251
1
Equal to or less than 1307. of poverty.
kCIP
2Source: NITS. 85-1.
td
02u
178 175 152
187 154 155
168 209 144
214 182 150
203 219 173
233 200 160
Source: RMS. 85-2.
198 147 124 198
172 154 119 192
170 141 114 186
196 147 126 181
200 185 142 268
188 157 128 236
BEST COPY AVAILABLE
102 126 114
80 109 97
84 116 103
106 132 121
88 132 116
100 132 122
84
81
87
84
'10
85
29
121 154 75
149 161 76
121 148 76
99 152 78
193 195 95
96 181 156

Dietary Intake: The most frequently consumed foods were tabu-lated by age groups. In the preschool group breads were themost frequently consumed food followed by milk. In the fifteenmost frequently consumed foods, there were no vegetables andonly one fruit, bananas.
Nutrient intakes of children ages 1 to 5 years were listedby percent of Recommended Daily Allowances consumed. Table 3shows the percent of children who consumed less than two-thirdsof the RDA for that specific nutrient.
The levels of nutrient intakes of preschool children foundin this study agree generally with the results of the NFCS,especially the high percentages of low iron and zinc intakes andthe high levels of energy and protein intakes.
_ ...._
Anthropometry: In the preschool group, ages 1 to 5 years, 122children were included. The following shows the percentages ofthese children under the 5th percentile and over the 95thpercentile for different anthropometric measurements:
AGES 1 - 5<5th >95th
Height-for-age 33.3% 17.9%Weight-for-age 20.5% 12.8%Weight-for-height 10.3% 12.8%
10
30

TABLE 3
Percent of Children < 185% of Poverty Below
Two-Thirds of RDA (Utah)
Energy 7.38
Protein 1.64
Vitamin A 5.74
Vitamin D 58.20
Vitamin E 36.89
Vitamin C 18.85
Folic Acid 23.77
Niacin 8.20
Riboflavin 3.28
Thiamin 4.92
Vitamin B6 22.13
Vitamin B12 9.02
Calcium 11.48
Phosphorus 5.74
Iron 45.08
Magnesium 12.30
Zinc 42.62
11
31

The most prevalent growth problem was short stature for ageamong one-third of these preschool children. About one -fifth arebelow the 5th percentile for weight-for-age. These data suggestthere was more undernutrition than overnutrition in this popula-tion.
Massachusetts Nutrition Survey, 1983
Nutritional status was determined on a sample of 1,146low - income preschool children age 6 months to 5 years 11 monthswho used community pediatric health care facilities. Overweight,short stature, and anemia were the most common nutrition-relatedproblems observed. Findings identified 9.8% of the sample withlow height-for-age levels, which is higher than previous U.S.survey findings, and 3.0% with low weight-for-height measure-ments. Of those children who had hematocrits assessed withinsix months prior to the survey, 12.2% were anemic. The pre-valence of overweight was 8.1% of the population (Graham, 1985;Brown, Serdula, Cairns, et al., 1986).
Centers for Disease Control (CDC): Pediatric NutritionSurveillance System, Annual Summary, 1983.
Data on 539,322 children from birth to 9 years of age weresubmitted to the Pediatric Surveillance System in 1983 (CDC,1985). The children were enrolled in public programs includingthe Special Supplemental Food Program for Women, Infants andChildren (WIC), the Early and Periodic Screening, Diagnosis andTreatment Program (EPSDT), and publicly funded Maternal and ChildHealth clinics. Since many more children are eligible forpublic services than actually receive them, surveys based solelyon clients of these services may produce selection bias in thedirection of underestimating nutrition problems.
Nutrition-related abnormalities were identified in 15.7 to33.4% of the children, and multiple abnormal indices wereidentified in 1 to 5%.
Anthropometric Results:
Height-for-age: The most prevalent problem was shortstature (height-for-age below the 5th percentile). In children3 months to 5 years of age, the percentage (5.9 to 23.6%) belowthe 5th percentile was greater than the expected 5%. Inchildren less than 6 months the percentage was greatest amongblacks (5.3 to 16%). Over 6 months of age, the percentage wasgreatest for Asian children in each age group (13.4 to 23.6%).
Weight-for-height: Prevalence of low weight-for-height asa reflection of undernutrition was consistently below theexpected 5% and was not considered a major public healthproblem. However, prevalence of overweight children was more
12
32

than the expected 5% of the population after 2 months Lf age.From birth to 5 years of age, overweight was most prevalent amongNative Americans and Hispanics.
Hematology:
The prevalence of low hemoglobin was greatest among Asianchildren less than 2 years and blacks ages 2 to 5 years. Theprevalence of low hematocrit was greatest among Hispanics ages 6months through 5 years of age. Overall, there was a five yeartrend of a modest decrease in the prevalence of anemia asmeasured by hemoglobin for blacks, whites, Native Americans, andAsians. 'Trends in anemia as measured by hematocrit were morevariable. The 2 to 5 year old age group had the greatestprevalence of low hemoglobin except for Native Americans, and thegreatest prevalence of low hematocrit in all ethnic groups (CDC,1983) .
Pediatric Nutrition Surveillance System, 1984
Preliminary data were reported for 800,000 children under60 months of age. Of these children 49.6% were white; 34.1%,black; 13.3%, Hispanic; 1.5% American Indian/Alaskan Native; and1.0% Asian/Pacific Islander.
The prevalence of short stature was greater than the 5%expected. Asian children had the highest prevalence of shortstature, which may reflect nutritional deficits as well asgenetic factors (CDC, 1987). Prevalence of short stature waslowest among blacks except before one year of age when they hadthe highest prevalence, most likely reflecting a higher rate oflow birthweight in this group. Low prevalence in this groupafter age one may reflect genetic differences for growthpotential or improved nutritional status (CDC, 1987).
Overweight rates were also greater than the expected 5%.Rates were generally highest among Hispanic children. They werealso prevalent among American Indians and Alaskan natives,although not to the extent observed in PNSS 1982.
The prevalence of underweight was less than 5% expected andtended to decrease with age in all groups except Asian/PacificIslanders. Hispanics had the highest rates in the 0-11 month agegroup, and Asians, the highest rates in the older age groups(CDC, 1987).
More recent anemia prevalence rates reported by the Centersfor Disease Control, Pediatric Nutrition Surveillance System,indicate a declining prevalence of anemia among low-income
------- children in the U.S. from 7.8% in 1975 to 2.9% in 1985.Prevalence of anemia declined significantly for all age groupsand all races. The difference between black and white children
13

narrowed, and American Indian children had a lower rate thaneither black or white. The anemia rate for each socioeconomicgroup declined with the lowest socioeconomic group showing thegreatest decline over ten years. However, the authors statethat very stringent cut-off values used to define anemia mayhave underestimated the prevalence. They state that "theprevalence of anemia among children ages 1 to 5 years from lowincome families in the mid-1980's probably is in the range of 6%to 8% based on less stringent cut-off values commonly used inclinical settings" (Yip, Binkin, Fleshood, et al., 1987, CDC,1986a).
Yip, Walsh, Goldfarb, et al. (1987) noted a similar trendin middle-class children. The overall prevalence of anemiadecreased from 6.2% in 1969-1973 to 5.8% in 1974-1977, 3.8% in1978-1981, and 2.7% in 1982-1986. They concluded that irondeficiency is now mild and uncommon in these middle-classchildren.
Gayle, et al. (1987) examined the contribution of lowbirthweight (weight less than 2500 grams) to prevalence of lowlength-for-age by analyzing data from the PNSS on 374,544children under 24 months of age. Overall rates for lowbirthweight in this sample were 9.2% for whites, 13.4% forblacks, and 9.2% for Hispanics. The mean prevalence of lowlength-for-age during the first two years of life was reported as10.4% for whites, 12.0% for blacks, and 11.7% for Hispanics.The mean proportion of low length-for-age attributable to lowbirthweight was 28.9% for whites, 27.6% for blacks, and 21.3% forHispanics. The authors believe that this demonstrates the needto consider the prevalence of low birthweight when reportingpopulation estimates of malnutrition.
Memphis Survey, 1983
The nutritional status of preschool children from 1,219families was studied. These families were living in aneconomically depressed area of Memphis which was also surveyedby the authors in 1977 and 1969. A comparison of the results ofthe three surveys indicated continuous improvement of serumlevels of vitamins A and C, hemoglobin, hematocrit, and redblood cell volume. Improvements were attributed to increasedenrollment in the federal food stamp program, an ongoingcommodity supplementary foods program, and more childrenattending preschool programs (46% of 3 to 6 year old children)where meals or snacks were served. However, 9 to 18% of theinfants and children had low or deficient levels of vitamins A,C, Bl, B2, hemoglobin, serum iron, and transferrin saturation.Percentile distributions of heights and weights were similarbetween 1977 and 1983. Obesity or weight above the 95thpercentile occurred in 10% of the children in 1977 and in only
14
34
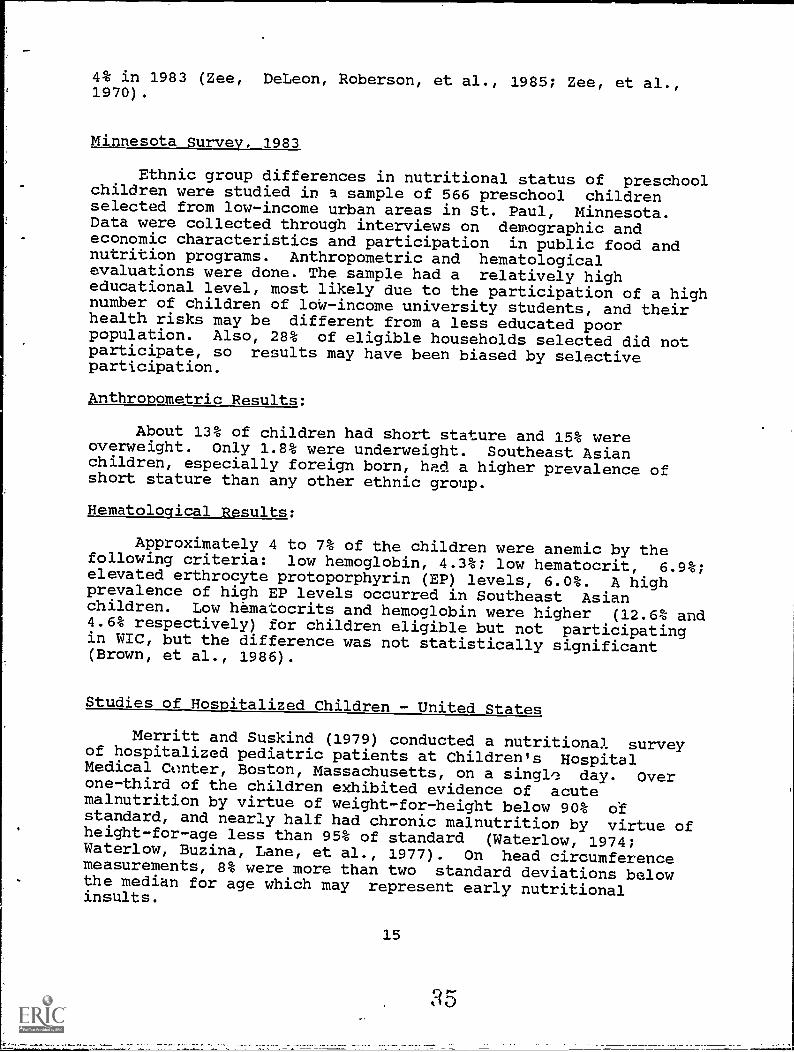
4% in 1983 (Zee, DeLeon, Roberson, et al., 1985; Zee, et al.,1970) .
Minnesota Survey, 1983
Ethnic group differences in nutritional status of preschoolchildren were studied in a sample of 566 preschool childrenselected from low-income urban areas in St. Paul, Minnesota.Data were collected through interviews on demographic andeconomic characteristics and participation in public food andnutrition programs. Anthropometric and hematologicalevaluations were done. The sample had a relatively higheducational level, most likely due to the participation of a highnumber of children of loW-income university students, and theirhealth risks may be different from a less educated poorpopulation. Also, 28% of eligible households selected did notparticipate, so results may have been biased by selectiveparticipation.
Anthropometric Results:
About 13% of children had short stature and 15% wereoverweight. Only 1.8% were underweight. Southeast Asianchildren, especially foreign born, had a higher prevalence ofshort stature than any other ethnic group.
Hematological Results:
Approximately 4 to 7% of the children were anemic by thefollowing criteria: low hemoglobin, 4.3%; low hematocrit, 6.9%;elevated erthrocyte protoporphyrin (EP) levels, 6.0%. A highprevalence of high EP levels occurred in Southeast Asianchildren. Low hematocrits and hemoglobin were higher (12.6% and4.6% respectively) for children eligible but not participatingin WIC, but the difference was not statistically significant(Brown, et al., 1986).
Studies of Hospitalized Children - United States
Merritt and Suskind (1979) conducted a nutritional surveyof hospitalized pediatric patients at Children's HospitalMedical Center, Boston, Massachusetts, on a singl' day. Overone-third of the children exhibited evidence of acutemalnutrition by virtue of weight-for-height below 90% ofstandard, and nearly half had chronic malnutrition by virtue ofheight-for-age less than 95% of standard (Waterlow, 1974;Waterlow, Buzina, Lane, et al., 1977). On head circumferencemeasurements, 8% were more than two standard deviations belowthe median for age which may represent early nutritionalinsults.
15
35
The authors concluded that the prevalence of malnutritionin hospitalized pediatric patients is far higher than generallyrecognized. While many of the children in this survey hadchronic diseases associated with poor growth, much of theirgrowth failure could have been a result of malnutrition.
Listernick, et al. (1985) retrospectively studied 16children, ages 18 months or less, previously admitted to North-western University Medical Center, Chicago, Illinois, fortreatment of nonorganic failure-to-thrive (NFTT) due to environ-mental deprivation as opposed to disease. The degree of theseverity of malnutrition had not been recognized in any of thechildren during their hospitalization. The authors state thatunder-recognition occurs in part from lack of awareness ofproper nutritional assess: art techniques. It also occursbecause children in the U.S. who are seriously malnourished haveusually not been involved in the health care services system.The usual nutritional surveillance systems do not identify them,and, therefore, they are only discovered when they nc.,ad acutemedical care. As a result, the authors recommend that estimationof the prevalence of severe malnutrition in the U.S. includehospital-based studies.
16
6

III. CONSEQUENCES OF ADVERSE NUTRITIONAL STATUS
A. Growth
Growth is the most widely used index in assessing nutritionin children. In healthy populations individual variation ingrowth is primarily determined genetically. However, whengrowth lags behind genetic potential, environmental factors havea major influence. Among these are nutrition, socioeconomicstatus, and infection or disease (Sutphen, 1985).
Growth Standards and References
The National Center for Health Statistics (NCHS) developedreference standards for percentiles of growth measurements basedin part on data from NHANES I. These are the most commonly usedstandards in population nutrition assessments. The selection ofreference standards and arbitrary cut-off levels to define lowvalues raised several issues. Do these children have abnormalconditions, is their growth impaired by undernutrition orneglect, are they growing normally but have unusually smallparents, or is their growth normal but with a slow rate ofmaturation. (Hamill, Drizd, Johnson, et al., 1979; Trowbridge,1984)
The TSNS and NHANES I data showed race-specific and ethnicdifferences. Black children are taller and leaner than whitechildren, and Hispanic children are smaller. These findings havesuggested that race-specific growth references might be moreappropriate. Kerr, Lee, Lorimer, et al. (1982), in theiranalysis of NHANES I data, concluded that parental stature,race, and SES must be considered when interpreting the growth ofchildren before concluding that nutritional factors are themajor determinants.
Trowbridge (1984) states that in "the developing countries,environmental factors are likely to outweigh genetic influences,but in industrialized countries, adverse environmental factorshave been substantially reduced, and genetic factors may berelatively more influential."
The appropriateness of using NCHS percentiles, which weredeveloped with well-nourished populations, for comparingchildren of less well-nourished developing countries withdifferent ethnic and geographic backgrounds has been questioned.Habicht, Martorell, Yarbrough, et al. (1974) reviewed patternsof growth of preschool children from various geographic, ethnic,and socioeconomic backgrounds to determine if differenceswarranted the establishment of regional reference standards.They found that children grow rather uniformly in length andweight during the first 3 to 6 months of life. After 6 months of
17

age, children from developing countries lag behind those fromdeveloped countries. Hwever, among well-nourished children indifferent countries, growth differences are relatively small.Comparisons of poor and non-poor children within the same ethnicpDpnlation usually show that the non-poor children approximatethe standards of developed countries. In 1981, Graitcher andGentry compared growth data on privileged children in Egypt,Togo, and Haiti and also found growth status comparable withthat of U.S. children. Olness, Yip, Indritz, et al., (1984)conclude that application of a single growth reference such asthe NCHS standards is reasonable while taking into account thediscrepancies of economically or nutritionally deprivedchildren. They feel the reference may be regarded as the growthpotential for these children.
Waterlow, et al. (1977) believe that the NCHS referencedata can be used for comparisons between populations withadjustments of cut-off levels if necessary. They recommend theuse of centiles in describing children from relativelywell-nourished populations. In relatively undernourishedpopulations standard deviation scores, instead of percentagedeviation from the median, should be used. Two standarddeviations from the median corresponds to approximately 80% ofmedian weight for height and 90% of median height for age,recommended as useful limits for identifying significantlymalnourished subgroups of children among populationscharacterized by undernutrition.
Definitions of Anthropometric Indices
Stature
The stature of children is assessed by measuring the supinelength in children less than three years of age and the standingstature of older children. Normal stature varies widely amongethnic groups, but within each group it has a fairly normaldistribution. Stature is primarily determined genetically andby rate of maturation. However, environmental factors includingnutrition affect stature. "Height stunting" is a slowlydeveloping phenomenon which reflects long-term chronicmalnutrition. The extent of height deficit in relation to agereflects the severity and chronicity of malnutrition (Rimin,Borochowitz, and Horton, 1986; Sutphen, 1985; Waterlow, 1972;Waterlow, et al., 1P/7).
Height-for-age below the 5th percentile (NCHS) indicatesneed for follow-up of an individual child. When height-for-ageis above the 10th percentile, but weight-for-height is below the5th percentile, illness or nutritional deficit may be suspected(Hamill, et al., 1979). In undernourished populations, however,Waterlow, et al. (1977) recommended using 90% of the median
18
Rye 8
(50th percentile of the reference population) height-for-age toidentify significant chronic malnutrition.
Growth velocity, or the rate of change in stature, is moresensitive to nutritional deprivation but requires serialmeasurements at one year intervals for most accurate comparison(Sutphen, 1985; Solomons, 1985; Tanner, 1976). A reduction inthe rate of linear growth could appropriately be calledretardation and reduction in final stature stunting (Waterlow,1972).
Weight
Weight is expressed as weight-for-age or weight-for-height. Weight is subject to greater variations and moreshort-term changes than other measurements and can bemisleading. Weight-for-height gives a more accurate estimate ofcurrent nutritional status which is independent of age andage-related external standards (Waterlow, 1972). Low valuesindicating "thinness" or "wasting" are considered to be areflection of acute nalnUtrition (Sutphen, 1985). Bothweight-for-age and weight-for-height less than the 5thpercentile should lead to suspicion of nutritional deficiency(Hamill, et al., 1979). When expressed as percentage of median(50% percentile), 80% median weight is considered a low value(Waterlow, 1977).
Weight-'for-height greater than the 95th percentile suggestsobesity but is not diagnostic because it does not account forbody composition. Children greater than the 95th percentile mayhave unusually good muscle development with little adiposetissue. Additional measures, such as skinfold measurements, areneeded for diagnosis Jf obesity (Hamill, at al., 1979).
Skinfold Thickness
Skinfold thickness is determined most commonly by the useof special calipers over the triceps area of the upper arm orsubscapular area of the upper back and then compared to NCHSreference charts. Although triceps skinfold thickness greaterthan the 85th percentile is used to diagnose obesity, there arequestions if this accurately reflects the entire ru,ss ofsubcutaneous fat and if this is an unvarying proportion of totalbody fat (Sutphen, 1985).
Upper Arm Circumference
Tipper c.rm circurlerence represents muscle plus fat andbone. IT. correlates strongly with weight and decreasessensitively in response to malnutrition (Sutphen, 1985).
19

Head Circumference
Head circumference is thought to be relatively unaffectedby malnutrition and, therefore, is not useful in screening formalnutrition. It is useful in screening for other medicalabnormalities (Hamill, et al., 1979).
Dental Age and Bone Growth
Dental age or the emergence of teeth is a rough indicatorof maturity between 30 months and six years of age, but isgenetically dependent and relatively resistant to nutritionalfactors.
Bone growth is a measure of maturation and an importantindex of growth. It is measured by x-ray study of the ossifica-tion of bones, usually in the hand and wrist, which provide alarge number of bones to examine. Rate of maturation varies andappears to be genetically determined. Girls have a fastermaturation rate than boys, and blacks have advanced bone agerelative to standards. Factors which delay skeletal growth(malnutrition, chronic infectious disease and chronic illness)also delay skeletal maturation (Rimoin, et al., 1986; Sutphen,1985).
Bone growth is also thought of as a measure of growthpotential. A child with delay of bone age and short stature isconsidered to have greater potential for catch-up growth than ashort child with normal or less delayed bone age (Sutphen,1985).
Long-term Implications: Ultimate Stature
Evidence from the NCHS data and data from other U.S.surveys show that undernourished children are often short instature, and there is a clear relationship between family incomelevels and reduced height (Kerr, Lee, Lorimer, et al., 1982;Trowbridge, 1984). Studies from other countries show similarresults for samples of preschool children of the same ethnicpopulation but different socioeconomic groups (Habicht, et al.,1974).
There is no genera agreement about whether growthretardation caused by , 'lnutrition in early childhood isreversible or irreversil,le.Some follow-up studies ofmalnourished children il-dicate permanent stunting as a result ofuncorrected chronic malnutrition. Other studies conclude thatgrowth is delayed but "catch-up" growth is possible. Presently,
20

there is insufficient evidence to determine critical periods ofgrowth or how extensive malnutrition must be to make catch-upgrowth impossible (Sutphen, 1985).
Alvear, Artaza, Vial, et al. (1986) compared 40 preschoolchildren in Chile who had been hospitalized in infancy formalnutrition with 38 control group children of the same age,sex, and socioeconomic level who had never been malnourished.The malnourished group had a significant delay in stature afterfour years even though they experienced a compensatoryacceleration of growth following rehabilitation. However, theshorter children had similar bone age to the control group whichled the authors to conclude that some permanent growthlimitation would occur.
Martorell, Yarbrough, Klein, et al., (1979) longitudinallyanalyzed the effects of a supplementation program on body sizeand skeletal maturation in preschool children in Guatemala.They found that chronic malnutrition affects stature to agreater extent than bone age or maturation. They concluded thatwhen chronic malnutrition occurs, particularly during periods ofrapid growth such as early childhood, it results in permanentgrowth stunting. Even when conditions improve, as in thesupplementation program, the child is unable to catch up on alllost growth because the biological time and opportunity to growhas passed. Catch-up is related to the extent to whichmaturation is delayed and more "time" exists for growing.
Kulin, Bwibo, Mutie, et al., (1982) report findings of astudy of pubertal growth and development of 600 adolescents inKenya, half from a high socioeconomic-urban group and half froman impoverished rural group. Significant differences inanthropometric measurements were found between the two groupsjust before the onset and during the early stages of puberty.Puberty also was delayed by three years in malnourished boys andby 2.1 years in malnourished girls. However, notable catch-upgrowth was seen throughout the later periods of adolescence.
Galler, Ramsey, and Solimano (1985), in a follow-up studyof 216 Barbadian children, found delayed sexual maturation andgrowth deficits in 9 to 15 year old girls who had experienced amoderate-to-severe episode of malnutrition in infancy. Incontrast, boys with a similar history were slightly reduced inheight from the comparison group and had similar patterns ofsexual maturation. However, growth velocity was similar for theindex groups and comparison group for boys and even higher forindex girls, implying that "catch-up" growth was possible.
Studies of low birthweight infants show significant growthdifferences which persist until 1.5 years for headcircumference, 2 years for weight, and 3.5 years for length.Some follow-up studies have shown adequate catch-up growth, but
21

most have found some degree of persistent subnormal growthespecially for smaller and sicker infants (Sutphen, 1985).
B. Health Status
There is strong evidence that height and other anthro-pometric measurements reflect nutritional status of children.However, Tanner (1976) states,
We have to remember that the whole concept of'nutrition' is an abstraction from a muchmore complex reality, which includesparasites, maternal behavior, the distri-bution of family income, the energy cost ofolder siblings, even the happiness andsecurity of the child. So we are reallydiscussing not nutrition, but micro-ecology,and not the monitoring of nutritional status,but of health itself.
Studies of the long-term consequences of malnutrition forhealth status have documented increased morbidity and mortalityassociated with poor growth. Chen, Chowdhury, and Huffman(1980) studied 2,019 children ages 13 to 23 months of age in arural area of Bangladesh. Varying degrees of nutritional statuswere represented in the sample, from normally nourished, throughmild and moderately -malnourished, to severely malnourished.Severely malnourished children had a 3 to 7 times highermortality risk, depending upon the classification system used.The mortality risk of mild and moderate malnutrition was notsignificantly different from that of normally nourished children.The classification systems investigated were weight-for-age,weight-for-height, height-for-age, arm circumference-for-age,arm circumference-for-height, weight quotient, and heightquotient.* All indices discriminated mortality risk. However,weight-for-age and arm circumference-for-age were strongest andweight-for-height was weakest. Discrimination was increasedwhen socioeconomic indicators and nutritional status of thechild's mother were added to the data. Child mortality wasconsistently higher among children with lighter or shortermothers and among children living in smaller housing units.
Sommer and Loewenstein (1975) followed 8,292 Bengalichildren between the ages of 1 .,nd 9 years for 18 months after anutritional assessment using arm circumference-for-height.Children at or below the 9th and between the 10th and 50thpercentiles for arm circumference-for-height were at 3.4 and 1.5*"Weight quotient and Height quotient are the ratios of theweight-age or height - age -of the child (the age at which theweight or height of the child is at the 50th percentile of theHarvard standard) divided by the child's chronological age"(Chen, et al., 1980).
22
42

times treater mortality risk, respectively, than those above the50th percentile. The most vulnerable group was 1 to 4 yearolds.
Kielmann and McCord (1978) reported similar mortality risksamong 3000 children of Northern India, ages 1 to 36 months, whowere classified by a weight-for-age index of risk. On average,mortality doubled with each 10% reduction of weight-forage below80% of the Harvard weight median.
A one year longitudinal study was conducted by James (1972)of 137 children, ages 1 to 36 months of age in Costa Rica, 54 ofwhom were well nourished and 83 malnourished (classified byweight). Environmental and socioeconomic conditions were thesame for both groups. The rate of _diarrheal infections inmalnourished children was twice that of normal weight childrenover one year of age, and the duration of the illness wassignificantly longer. The number of attacks of respiratoryinfections was the same in both groups, but the duration waslonger and complications significantly more frequent inmalnourished children. Twenty-four of the malnourished childrenversus two of normal weight required hospitalization during thecourse of the study, and 4 children died, all from themalnourished group.
C. Malnutrition and Infection
Infectious diseases occur more frequently, are more severe,and have longer duration in malnourished individuals. Wheninfection and malnutrition occur simultaneously in the samechild, as is frequently the case in developing countries,morbidity arid mortality rates among children !mcrease sbarply,e:::)ecially among impoverished children. Poverty limits thekinds and amount of food available and increases exposure toinfection through poor environmental conditions. Infectionaffects nutritional status through adverse effects on appetite,nutritional absorption and utilization, and depletes nutritionalstores. Poor nutritional Status adversely affects the immunesystem, and consequently, increases susceptibility to infection.1.11:.s interrelationship is diagrammed in 1.Lgure 1 on page 23A(Martorell, 1980).
In developing countries, common childhood illnesses,especially those involving diarrhea, have a profound effect onnutritional status. The coexistence of diarrhea and malnutritionleads to a self-perpetuating cycle. Diarrh2al illness occursmore frequently in malnourished children and the attack ratecorrelates with the degree of m lnutrition (Brunser, Figueroa,Araya, et al., 1984; Puri and Chandra, 1985).
23

INALEQUATEDIETARCINTAKE
FIGURE 1
FOVERIY
ANCREXIA <
a:FICTIVEEmma'
ABSCR.1719IN
INFECITCH
LEFECEEVE KatNUTRIENT EEFENSES
Irrnazamati PGAINSTnincrinti
EEEERKRAnsaiOF
NUMTEECNALsrAaus
OUICCKES
TWLIZECCIDAILMEEMIZUMCITEAWIILEME
NRETARIED MangAND EEVELOPMENTIN SURVISCRS
Nestrirell, R. (1980). InterreLatirips betwen diet, infectious disease, andnutritional status. In H.S. Greene aid F.E. Johnston (eds). Zwjal_arculisgagica41.0"1-Newtzli_er.; e!kla.L_ _k-z-LiteYccdc:Asioaiesio Press.

However, the problems are not restricted to developingcountries. Hospitalized children in North America frequentlyare malnourished, increasing their risk of opportunisticinfections,.complications during the course of their disease,increased hospital stay, and ultimately increased risk ofmortality (Rundles, 1984; Puri and Chandra, 1985; Chandra, 1982).
Malnutrition impairs the body's defense mechanisms in anumber of ways and may be regarded as the most common cause ofacquired immodeficiency in the world today (Martorell, 1980;Chandra, 1981; Keusch, 1982). The effects may vary according tothe age of the individual (infants and the elderly being morevulnerable), type and duration of malnutrition, specificnutrients which are deficient, nature of underlying disease, andconcurrent infection. Most studies of the effects on immuneresponse liave involved cases of severe malnutrition. However,there is growing evidence that even mild to moderate nutritionaldeficits may adversely alter the immune response in a smallproportion of undernourished children, Often before clinicalsigns of malnutrition appear. This is supported by observationsof reduced or delayed skin test hypersensitivity and other testsof immunological functioning (Ziegler and Ziegler, 1975).Immunocompetence is a highly sensitive indicator of nutritionalstatus and would be a functional and practical way to assess thenutrition status of individuals and communities, provideprognostic information on hospitalized patients, and monitorresponse to treatment. Depression of immune response inmalnutrition is generally reversible with appropriate treatment(Puri and Chandra, 1985).
Impairment may last longer if the nutritional deprivationoccurred during gestation. Maternal malnutrition or infectionduring pregnancy may seriously impair the infant'simmunocompetence. Children born prematurely may regain theimmune response by three months of age. However, children smallfor gestational age who have experienced intrauterine growthretardation may continue to have reduced immune response severalmonths or years after birth. This suggests that gestation maybe a critical period in which the immune system may beparticularly susceptible to nutritional deprivation (Miler,1982; Chandra, 1984).
Postnatally, infant immunity is enhanced by breastfeeding,especially with -.arly milk. Children in developing countriesmay do well during the first few months because ofbreastfeeding. Breast milk may later become limited inundernourished mothers, and supplements are often nutritionallyinadequate or unhygenically prepared, resulting in illness anddiarrhea (Martorell, 1980; Brunser, et al., 1984).
Studies of effect on individual nutrients have oftenresulted in conflicting data. Impaired host defenses can result
24
45

from excesses as well as deficits of single nutrients, and canoccur alone or in combination with generalized malnutrition.Single nutrient deficits can lead to immunodeficiencies inindividuals whose general nutritional status appears normal(Beisel, 1982; Chandra, 1981).
Iron deficiency effects are subject to debate but have beenassociated with increased incidence of infection even in sub-clinical deficiencies too small to lower hemoglobin.Deficiencies of zinc, magnesium, selected amino acids, vitamins Aand E, folate, and pyridoxine also have been associated withaltered immune responses. Excesses of vitamins A and E and ofiron can impair responses also. A high intake of fat and hyper-cholesteremia appear to increase vulnerability to infection(Beisel, 1982; Chandra, 1981; Beisel, Edelman, Nauss, et al.,1981).
Overnutrition, which is a common type of malnutrition indeveloped countries, has been associated with increased suscep-tibility to infection and with altered immune responses. Obesepersons may have single nutrient deficiencies, particularly zincand iron (Beisel, 1982; Chandra, 1981).
D. CognitiIta Development
The findings on effects of malnutrition on cognitivedevelopment and behavior have been inconclusive. Most studieshave focused on outcome of severe malnutrition, but recentlystudies have been shifting to investigations of mild-to-moderatedeficiencies. A major problem in reaching conclusions is thedifficulty separating effects due to nutritional status fromsocioeconomic factors. An adverse environment is commonlyassociated with both malnutrition and delayed cognitiveperformance. Other difficulties include definition andmeasurement of malnutrition and of cognitive abilities (Ordonez,1984; Grantham-McGregor, 1984). Controversy exists over whetherinitial effects of malnutrition are reversible. A majoritybelieve that at least part of the damage is permanent dependingupon the .timing, severity, and duration of malnutrition. In apoor environment there is limited possibility for improvement,especially if diet continues to be deficient throughout life(Ordonez, 1984).
Severe Malnutrition Outcomes
The results of studies of children with previous episodesof severe malnutrition generally show delays in mentaldevelopment.
25
46

In Chase and Martin's (1970) longitudinal study of Denverchildren, 19 malnourished in the first year of life compared to19 well-nourished, results showed that the index group fouryears later had lower height, weight, head circumference, anddevelopmental quotients. Those who were hospitalized after 4months of age had lower scores than those who were hospitalizedprior to 4 months of age and, therefore, malnourished for ashorter period of time. Language development was more severelyimpaired than other skills.
Hertzig, Birch, Richardson, et al., (1972) studiedintellectual functioning of Jamaican school boys who had beenhospitalized for severe clinical malnutrition during the firsttwo years of life compared to siblings and classmates who hadnever been severely malnourished. Intellectual functioningmeasured by the Wechler Intelligence Scale for Children (WISC)showed lower scores for the index subjects compared to theirsiblings and classmates. They also found no association betweenintellectual, level and age at which the children werehospitalized, which suggests that brain vulnerability is notlimited to the first year of life.
In a follow-up report of th_ above study, Richardson (1976)found that the IQ's of the boys were also associated with theirheight at the time of testing and with a measure of socialbackground and parent capabilities. Severe malnutrition ininfancy, short stature (indicating malnutrition of longduration), and disadvantaged social background were allassociated with low IQ score. Severe malnutrition occurring inthe context of overall good history of growth and favorablesocial background had negligible effects on IQ. It appears fromthese findings that children who have suffered an episode ofsevere malnutrition improve remarkably in an enrichedenvironment, but it is probable that some permanent impairmentwill result (Grantham-McGregor, 1984).
Hoorweg and Stanfield's (1976) comparison of Ugandanchildren who were hospitalized with malnutrition in the firsttwo years with well-nourished controls found that themalnourished children fell significantly below the comparisongroup in anthropometric measurements and tests of intellectualand motor abilities. These effects were not related to theseverity of malnutrition but were related to the duration asmeasured by height deficit.
Grantham-McGregor (1984) also found in a Jamaican studythat developmental levels of children recovering from severemalnutrition were related to degree of short stature onadmission to treatment but not to their degree of wasting orseverity. These finr'4.ngs suggest that chronicity ofmalnutrition is probaoly a more important correlate of mentalfunctioning than severity.
26

Gallery Ramsey, Solimano, et al. (1983) also reported lowerIQ performance in school-age children in Barbados with historiesof moderate-to-severe malnutrition in the first year of life,with girls having greater drs''.cits than boys. Socioeconomicdifferences in this study y not significantly associated withreduced IQ's, in contrast the previous studies. A follow-upstudy of these children f . years later (Galler and Ramsey,1987) again showed moderately impaired scores on WISC-R inassociation with early malnutrition and did not show anyevidence of "catch up". A follow-up at 9 to 15 years (1987)using scores on Piaget's conservation tasks as a measure ofintellectual functioning found that below age 14 there was aclear difference in performance between cases and controls,demonstrating a continuing developmental lag in previouslymalnourished children.
Undernutrition Outcomes
Cognitive Performance
The effects of mild-to-moderate undernutrition on mentaldevelopment may be even more important as it affects so manymore children in both underdeveloped and developed countries.
Evidence from intervention studies with nutritionalsupplementation provides some support for a causal relationshipbetween nutrition and mental development. Freeman, Klein,Townsend, et al (1980) found that a supplementation program inundernourished rural Guatemalen children significantly raisedcognitive test scores of supplemented over non-supplementedchildren.
Waber, Christiansen, Ortiz, et al. (1981). also studied theeffects of a nutritional supplemental program and/or a maternaleducation program on cognitive development of Bogota children.Both programs had significant but separate effects ondevelopment. Children who received nutrition supplements and,to a lesser extent, those who received the maternal educationprogram performed better than those who did not receive thetreatments. Nutritional supplements at any point during thefirst three years of life had a beneficial effect, whichsuggests that the first 6 months are not a critical period forsupplementation.
Social Behavior
There have been fewer studies of the effect of malnutritionon social-emotional functioning than on cognitive development,but there has been a shift of emphasis recently. One reason is
27
that cognitive test performance is highly dependent on behavioralfactors including attention, persistence, and selfconfidence.Secondly, literature on both animal and human studies associatedmalnutrition with behavioral symptoms of apathy, poor attention,reduced social responsiveness, and difficulty regulatingemotional state and behavior. Third, there is some evidencethat social-emotional competencies may be more vulnerable tonutritional deficits than cognitive skills (Barrett, 1984).
Galler, et al. (1983b), in a longitudinal study inBarbados, evaluated classroom behavior of children ages 5 to 11years who previously had moderate-to-severe malnutrition in thefirst year of life. They found a significant increase (60%) ofsymptoms of attention deficit disorder: impaired attention,increased distractibility, poor school performance, poor memory,reduced social skills, and emotional instability in previouslymalnourished children. Follow-up at 18 years of age continued toshow these symptoms which were associated with poor schoolperformance and high drop-out rates (Galler and Ramsey, 1987).Environmental factors and IQ contributed little statistically tothe behavioral deficits. Differences remained significant whenchildren with low IQ's were excluded, which may be interpretedthat social-emotional functioning is more vulnerable tonutritional insult than cognitive skills (Galler, 1987; Frank,1984) .
Barrett, Radke-Yarrow, and Klein (1982) studied the effectsof nutritional supplementation on the social and emotionalfunctioning of mild-to-moderate malnourished Guatemalanchildren. They found that high caloric supplementation frombirth to two years was associated with high levels of socialinvolvement with peers, both happy and angry affect, andmoderate activity level at school age. Low supplementation wasrelated to passivity, reduced involvement in group activities,dependency on adults, anxious behavior, low levels of happyaffect, and inconsistent activity levels. Cognitive processeswere weakly affected by nutritional history, which againsuggests that cognitive processes may be less vulnerable toeffects of chronic malnutrition than social-emotionalfunctioning.
Development of social skills r ;ears to be dependent onlearned interaction skills in the earliest stages of childhoodand on caregivtlr-child interaction. It has been observed thatundernutrition produces increased apathy and reduces children'sactivity levels and exploring, which may in turn reduce mother'sresponsiveness and enthusiasm toward the child. The child whodoes not elicit positive responses learns to withdraw fromsocial contacts (Grantham-McGregor, 1984; Barrett, 1984).
Barrett and Radke-Yarrow (1985) examined tine sameGuatemalan children for effects of undernutrition on specific
28
49

task performance which required attention, persistence, impulsecontrol, and the ability to perform under mild stress. Wellsupplemented children showed more exploration, greater adap-tability to frustration and stressful situations, moreinvolvement in a competitive game, and better impulse control.They concluded that supplementation effects increase the child'sability to seek out stimulation and respond to the environment.However, from analysis of soc- 1 background data, the specificbehavior patterns that emerge. are shaped by the social andcultural environment, role models, and behavioral norms andexpectations. The study found that boys and girls, who aresocialized differently, are affected differently by thesupplementation (Barrett, 1984; Barrett & Radke-Yarrow 1985).It is significant from this work that chronic undernutrition ofmild-to-moderate severity predicts impaired social-emotionalfunctioning. This level of malnutrition is far more prevalent,and would, therefore, put large numbers of children at risk ofsocial dysfunction (Frank, 1984).
Iron Deficiency: A Special Case
Micronutrient deficits alone or in combination withgeneralized malnutrition may be confounding the relationshipsbetween nutritional history and cognitive or behavioralfunctioning. Iron deficiency, which is relatively prevalent andeasily measured, has been extensively studied for its effects(Frank, 1984).
Results of NHANES II, 1976-1980, indicated that theprevalence of anemia was 5.7% among infants (all races), and3.5% among 3 to 5 year olds (all races). Black children, ages 3to 5, had a slightly lower mean hemoglobin concentration thanwhite (Dallman et al., 1984). More recent prevalence ratesreported by the CDC, Pediatric Nutrition Surveillance, are inthe range of 6 to 8%. (Yip, Binkin, Fleshood, et al., 1987).
Pollitt, Saco-Pollitt, Leibel, et al. (1986), in their ownstudies and reviews of the literature, find evidence thatstrongly supports an association between iron deficiency, withor without anemia, and behavioral symptoms of apathy,inattentiveness; irritability, and memory difficulties. Theyalso find lowered performance on cognitive tests in infants andpreschool children, although there is no evidence of thespecific mental skills that may be affected. With ironrepletion treatment over 7 to 10 days, they found improvement inBayley Mental Development Index in infants, with and withoutanemia. However, in populations where severe protein-energymalnutrition has high prevalence, poor cognitive testperformance in iron deficient children may fail to improvefollowing iron treatment. These children also tend to be
29

smaller and lighter than children without iron deficiency(Pollitt et al., 1986; Pollitt, 1985).
Oski and Honig (1978) and Oski, Honig, Heln, et al. (1983)also found an association between iron deficiency and impairedperformance of infants on the Bayley Scales of InfantDevelopment in two studies: one with children with anemia andone with children, iron deficient, but not anemic. Treatmentwith intramuscular injections of iron produced significantimprovement in test performance within one week ofadministration in both studies.
Walter, Kovalskys, and Stekel (1983) studied cognitivefunction in iron deficient infants, with and without anemia, inChile, as measured by the Bayley before and after 11 days oftreatment with orally administered iron. The group withdeficiency but not anemia, did not show statisticallysignificant improvement except among those diagnosed by two ormore deficient biochemical measures. The anemic childrenimproved their scores significantly. This was attributed toimprovements in attention span and cooperativeness during thetest. The authors conclude that mild iron deficiency has aneffect on behavior which is rapidly reversible with irontherapy.
Deinard, Gilbert, Dodds, and Egeland (1981) did not find arelationship between iron depletion and cognitive development orattentional behavior among iron deficient non-anemic childrenages 11 to 13 months in Minneapolis. A more recent study byDeinard, List, Lindgren, et al., (1986) evaluated 18 to 60 monthold children, iron deficient, with and without anemia, who weretreated with iron and their performance compared to normalcontrols. The experimental groups showed corrected iron levelsbut no significant changes in Bayley developmental scores at 3months and 6 months after treatment. Behavioral ratings ofresponsiveness and emotional tone, however, showed the normalcontrols to be more responsive than anemic children.
Lozoff, Brittenham, Viteri, et al. (1982) studiedGuatemalan infants, 6 to 24 months of age, with and .withoutanemia, who were tested before and after one week of oral irontreatment. The anemic groups showed significant developmentaldeficits both before and after treatment. Iron therapy did notimprove test scores as in previous studies, although hemoglobinlevels had increased to the expected level. Lozoff also inves-tigated the influence of age on the difference in performancebetween anemic children and controls. The group differenceswere primarily in the older infants, age 19 to 24 months, whichsuggests that certain test items may be more sensitive to theeffects of anemia. These are social and language items whichincrease with age on the Bayley Scales, while sensorimotor items
30
51

are presented to younger infants. The older infants were alsosomewhat smaller and may have been in poor health.
Finally, Palti, Meijer, and Adler (1985) reported resultsof a prospective study of learning achievement and classroombehavior of second grade Israeli children who had been anemicand corrected at 9 months of age as compared with never anemic,same age children. The mean score on learning achievement andon positive task orientation was significantly higher forchildren who were not anemic in infancy. The previously anemicchildren showed distractibility, lack of discipline, andrestlessness. The authors believe that their findings suggestan iron deficient state during critical periods of braindevelopment in infancy may have long-lasting effects on cognitivefunction and oehavior.
Lead Levels and Behavior
Needleman (1983) compared cognitive and behavioralfunctioning of children with high and low lead levels, classifiedby lead levels in teeth, believed to be an accurate measure ofpast lead exposure. The results showed that high lead levelswere associates with deficits in IQ, verbal IQ, auditoryprocessing, and attentional performance. Teacher ratings of highlevel subjects were negative twice as frequently. A sub-samplewas found to have changes in electroencephalogram examinationcompared to low level subjects. High lead subjects, three yearsafter the initial study, were observed to spend more time indistracted, off-task behavior in the classroom.
Lead and other heavy metals are absorbed more readily inmalnutrition and in iron deficiency anemia, and the lowsocioeconomic population experiences higher risk of both (Yip,Binkin, Fleshood, et al., 1987; Bithoney, 1986). According tostatistics from NHANES II, 4% of children, 6 months to 5 years,or 675,000 children, had elevated blood lead levels (Mahaffey,Annest, Roberts, et al., 1982). Of these, 2% of white children,12.2% of black children, and 18.6% of inner city, black childrenin families with incomes below $6,000 had elevated blood leadlevels (Mahaf,ey et al., 1982). Analysis of the trend in bloodlead levels from 1976-1980 indicate a decrease of average bloodlead levels of all age groups of approximately 37%. Thisparallels the decrease in the sale of leaded gasc the (Annest,Pirkle, Makuc, et al., 1983).
E. Obesity
Obesity is the "most prevalent and serious nutritionaldisease in the U.S." (Dietz, 1983). Reports indicate that theprevalence of obesity in children and adolescents may be from 5
31

to 2S% (Dietz, 1983). Recent analyses of data from fournational surveys (National Health Examination Survey 2 and 3,1963-1970; NHANES I and II, 1971-1980) indicate substantialincreases in the prevalence of obesity (54% increase amongchildren ages 6 to 11) and superobesity (98% increase amongchildren ages 6 to 11). Obese children are. defined as thosewith triceps skinfolds greater than or equal to the 85thpercentile, and superobese are those greater than or equal tothe 95th percentile of children of the same age and sex. Theestimated prevalence among children ages 6 to 11 in 1980 was27.1% for obesity and 11.7% for superobesity (Gortmaker, Deitz,Sobol, et al., 1987). By contrast, our own preliminary analysisof preschoolers indicates superobesity ranging from 2% for twoto three year old males at or below poverty to 9% for four andfive year old females at or above 185% of poverty.
The causes of obesity in children appear to be verycomplex. The relative roles of overeating and underactivityhave been the subjects of extensive study and debate. Inseveral studies, energy intake and proportion of calories fromfat and carbohydrates between obese and nonobese children wasnot found to differ significantly (Nuutinen and Knip, 1984;Dietz, 1983). The results suggest that overeating does not playan important role in the maintenance of childhood obesity which,once established, persists on a normal energy intake rather thanon increasing food oonsumption (Nuutinen and Knip, 1984).
The importance of underactivity in the development ofobesiT:, lias been supported by several studies. Lower levels andlower Intensity of physical activity have been observed in obesechildren, although energy expenditure may be comparable to thenonobese because more work is required to move increased bodymss (Walberg and Ward, 1983). Relationships have been foundbetween the numbers of hours of television viewing and obesityin children (Gortmaker, et al., 1987). Differences in activitylevels can be identified in infancy with obese babies beingquieter, more placid and consuming a moderate intake of food ascompared to thinner babies who are more active, tense, and withincreased amounts of crying and greater food intake (Richmond,Blyler, and Linscheid, 1983).
Prevalence of obesity is associated with severalenvironmental variables. Prevalence is greater in the NortheastU.S., followed by the Midwest, South, and West, and it isincreased in winter and spring. Obesity prevalence is greaterin densely populated urban areas than 41 rural areas (Dietz,1983; Gortmaker et al., 1987). Obesity is more prevalent amongwhites and rises with income with the exception of upper-incomewomen, who are leaner. Mothers' low education level isassociated with increased prevalence (Dietz, 1983, 1986; Garnand Clark, 1976).
32
Family variables appear to be very important determinantsof childhood obesity. Parental obesity, especially of bothparents, is highly correlated with child obesity. If one childin a family is obese, the chances of an obese sibling are 40 to80% (Garn and Clark, 1976). These data suggest geneticdeterminants. This is supported by an adoptive study byStunkard, Sorenson, Hanis, et al. (1986), who found a strongassociation between body mass of adopted children and theirbiologic parents and no relationship with body mass of theiradoptive parents. Other adoptee studies have shown the reverse(Garn, Bailey, and Higgins, 1976). Also, genetic causes do notexplain significant relationships of obesity between spouses andbetween pets and their owners (Dietz, 1986). Garn and Clark(1976) conclude that familial fatness is due primarily to familysimilarities in caloric intake and expenditure and attitudesregarding food and eating.
Obesity is inversely proportional to family size and ismost prevalent in single children. Younger children are atgreater risk of obesity. Mothers and fathers of obese childrenare older, and separation from mother and parental deaths may bemore frequent, as are divorce and parental separation (Dietz,1983, 1986).
'medial,: Health Consequences of Obesity
Hypertension
Strong associations between obesity and elevated bloodpressure were found in the surveys previously cited for bothyounger children and adolescents (Gortmaker, et al., 1987). TheBosllusa Heart Study, which examined 2230 children, including714 preschoolers, in 1973, 1976, and 1978, also showedsignificantly higher systolic blood pressures for obese and veryobese children and higher diastolic blood pressure for the veryobese children (Lauer, Anderson, Beaglehole, et al., 1984).
The available evidence suggest that both genetic andenvironmental factors contribute to elevated blood pressure inthe young. Children of hypertensive parents are more likely tohave elevated blood pressure in childhood. Obesity in childrenis associated with higher blood pressure levels, and adolescentweight gain is associated with development of hypertension.Blood pressure readings in childhood, which increase withphysical growth and physical maturity, and tend to plateau aftersexual maturation (Watkins and Strong, 1984; Lauer, et al.,1984; Szklo, 1986).
One factor that may contribute to hypertension insusceptible individuals is excessive salt intake. It has beensuggested that salt intake in U.S. children is high, given
33

excessive consumption of high sodium snacks and fast foods(Watkins and Strong, 1984).
The question whether obesity in children is a risk factorfor adult hypertension remains unanswered. Obesity andhypertension are strongly associated in adults, and hypertensionin adults is a major cause of cardiovascular disease. There isincreasing evidence that "the precursors of essentialhypertension, although usually not manifest until adolescence oradulthood, are present in the young. Children with bloodpressure above the 90th percentile for age are likely to becomeadults with elevated pressure" (Behrman and Vaughan, 1987).
Hvperlipidemia
Obesity in children is also associated with elevatedlow-density lipoproteins (LDL) and reduced high-densitylipoproteins (HDL), although the association is weak. LDLcarries cholesterol into cells and HDL helps rid the cells ofexcess cholesterol. An elevated LDL level is harmful and inadults is associated with cardiovascular disease. HDL levelsare inversely related to heart disease (Deitz, 1986; Roy andGaleano, 1985; Aristimuno, Foster, et al., 1984).
Pathologic changes that lead to atherosclerosis may beginin infancy, with the appearance of fatty streaks in the aorta,and progress during childhood. However, the importance of fattystreaks and their transition to more advanced atheroscleroticlesions remains controversial (Roy and Galeano, 1985; Newman,Freedman, Voors, et al., 1980, 1986).
Lowering of dietary cholesterol has been shown to reducethe incidence of heart disease in adult men in the LipidsResearch Clinics Program, 1984. The subject of dietary changesfor children is controversial, as the reduction of foodscontaining cholesterol could compromise the nutritional adequacyof the diet for growth and development. There is no informationnow that dietary reduction of cholesterol in childhood decreasesrisk of heart disease (Roy and Galeano, 1986; American Academyof Pediatrics, 1986; Mallick, 1983; Starfield and Budetti,1985).
Other complications of obesity in children related to thecardiovascular system include decreased stamina and exercisetolerance with poor heart rate recovery following moderateexercise, decreased heat tolerance, and decreased ventilatoryability (Richmond, et al., 1983; Williams, 198385).
34

HVDerinsul
Abnormalities in carbohydrate metabolism and impairedglucose tolerance are common in obese children and adolescents,are related to the severity of the obesity, and are reversed byweight reduction (Deitz, 1986).
Orthopedic Conditions
Obesity is related to some childhood orthopedic conditions.Slipped capital femoral epiphysis, a rare condition, is one inwhich many of the patients are obese. Obesity also contributesto Blount's disease, congenital hip dislocation, and severebilateral genu varum (Dietz, 1981).
.respiratory Infections'
A study of children under 2 years of age reported anincreased incidence of respiratory infections among those whoseweight was greater than the 90th percentile or whoseweight-for-height was greater than 120% of ideal weight (Tracey,De, and Harper, 1971).
Psychosocial Consequences of Desit
Psychosocial dysfunction has been described as an importantconsequence of childhood obesity in this culture which valuesslimness and communicates discriminatory and prejudicialmessages about obese p'rsons. Children may suffer more thananyone from peer teasing and bullying (Taitz, 1983). Childrenas young as preschool age consistently rank obese children amongthose they least want as friends (Dietz, 1981, 1986). The obesechild hesitates to participate in sports and the obeseadolescent hesitates to participate in social events (Richmond,et al., 1983).
Some psychological studies comparing obese and nonobesechildren have not shown differences in adjustment, happiness, orself-concept (Kaplan and Walden, 1986). When using measures ofsocialization, however, Dietz believes substantial differencesexist, especially in feeYngs of popularity or self-consciousness(Dietz, 1981).
It is also possible that obese children do less wellacademically. It has been found that there is a lower thanexpected proportion of obese individuals in U.S colleges. It isalso possible that colleges discriminate against obeseapplicants (Taitz, 1983).
35
56

Long-term Consequences of Obesity
Risk of Adult Obesity
Obese children and adolescents are at increased risk ofadult obesity with percentages depending upon age at diagnosisand degree of obesity. For infants and preschool children whoare simply obese the risk of adult obesity is a little less thantwice expectancy. For a superobese child the risk is 3 to 4times expectancy. The probability is that 25% of obese infantswill become an obese adult (risk ratio = 1.77), and 50% of obeseadolescents will become obese adults. The probability increasesas the number of obese family members increases (Garn andLaVelle, 1985).
In studies reviewed by Dietz (1981) the probabilities ofobesity persisting into adulthood are 24% for obese 3 montholds, 54% for obese 11 year olds, and approximately 80% forobese 16 year olds. Adults with onset of obesity in childhoodor adolescence are fatter than those with onset in adulthood(Dietz, 1981, 1986).
Epstein, Wing, and Valoski (1985) present similar figuresbased on their review of studies. The percentage of obesechildren becoming obese adults is 14% for obese month olds(r47k ratio=2.33), 41% for obese 7 year olds (risk ratio=3.73),and about 70% for obese 10 to 13 year olds (risk ratio=6.55).Once established, childhood obesity seems to be very resistantto treatment, making prevention very important.
Risk of Adult Obesity for Later Cardiovascular Disease
The major risk factors ./-1 adults for cardiovascular diseaseare hyperlipidemia, hypertension, and smoking. Other factors, ofperhaps lesser influence, are sedentary living habits, obesity,hyperglycemia, psychosocial tension, and a positive familyhistory of a premature (at less than 60 years of age)atherosclerotic event (Strong 1978).
The association between obesity and heart disease is lessthan that of other major risk factors. The existing risk isattributable to the association of obesity to hyperlipidemia,hypertension, and hyperglycemia rather than to obesity per se(Strong, 1978). The association between overweight and riskconsist of a series of thresholds over which sharp increases ofrisk occur. Weight must exceed ideal weight by 25% before itbecomes a significant risk. There is a very sharp increase inmortality when excess weight rises from 30 to 50% above idealweight, with men more affected than women (Taitz, 1983).
36

Other Health Risks In Obese Adults
Over 65% of obese adults have impaired glucose tolerance,and more than half of patients with adult-onset diabetes areobese (Dietz, 1981). The prevalence of diabetes is 4 to 7 timesmore common in obese adults than nonobese (Andreoli, Carpenter,Plum, st al., 1986). One of the main consequences of diabetesis a higher risk of premature atherosclerosis (Strong, 1978).
Several other debilitating conditions affect obese adults.Obstructive lung disease is more common. Gallbladder disease is3 times more common in obesity. Thrombophlebitis and pulmonaryemboli occur more frequently. Osteoarthritis commonly affectsweight bearing joints in obese persons who exceed 130% of idealweight. General anesthesia a-1 surgery carries much higher risk(Andreoli, et al., 1986). Obesity in pregnancy increases riskof toxemia, hypertensive disorders, and diabetes (Danforth andScott, 1986).
Generally, obese people are disadvantaged in all areas oflife. They experience discrimination in employment and personalrelationships which frequently results in Aepression, feelingsof rejection, and loss of self-esteem (Rubenstein and Federman,1987).
How dangerous is childhood obesity? There remain too manygaps in knowledge and controversy over long-term consequences toanswer that question. Taitz believes there is justification forconcern that three risk factors in obese children may persistinto adulthood: raised total cholesterol, lowered HDLcholesterol, and elevated blood pressure. Just how great therisk and its precise relationship to obesity remain unanswered.However, Taitz states that "every extra kilogram of weight takes60 to 80 days off an average life. Thus, a child destined tobecome an adult who is 50 kilograms over ideal weight is likelyto die ten years early" (Taitz, 1983).
37

IV. DISCUSSION
Recent concern with the nutritional status of Americans maybe said to have been ushered in by the landmark report, Hunger,U.S.A. Although itself an anecdotal account of evidence ofmalnutrition among America's poorest children, the authors'medical testimony in Congress, coupled with widespread mediaattention, led to increasingly more scientific studies of thenutritional status of preschoolers and others.
The Ten-State Nutrition Survey was one such follow-up.focusing specifically on states and areas of the country likelyto be home for poorer Americans. The Preschool NutritionSurvey, and the two National Health and Nutrition ExaminationSurveys, were sample surveys intended to be representative of across-section of all pre-school children in the first case, andof Americans of all income brackets in the latter two cases.Despite these differences, there are many conclusions which maybe drawn that seem to be supported by these four studies, andfrom the National Food Consumption Survey, whose purview islimited to dietary intake.
It is clear that nutritional status is related to income,and that that relationship is in the expected direction. Poorchildren were observed to have poorer dietary intakes, not interms of the relative quality of their diet:, but in terms ofquantity. Lower energy intakes among poorer children wereobserved by the Ten State Nutrition Survey as early as 1968, andagain in the National Food Consumption Survey of 1985. Otherobservations among the five surveys included inadequate calcium,zinc, vitamin A and vitamin C intakes among the poor and/oramong blacks, and inadequate iron intakes among all incomegroups, particularly among blacks.
Anthropometric findings are perhaps less straight-forward.In general, poor children tend to be shorter, but, beyond theage of two, black males, on average, tend to be taller. Withinthe population of black males, however, the same relationshipbetween poverty and short stature is revealed. In some casesthe burden of short stature is excessive. In the Utah Project,for example, 33.3% of children below 185% of poverty fell belowthe fifth percentile for height-for-age, 28.3% more than expected(Utah, 1986). Similarly, poor children are lighter a.ld less fatthan non-poor children, except for poor adolescent or blackadolescent females, who seem in some studies to be heavier:There was no significant improvement in the gap in overall growthparameters between poor and non-poor preschoolers from NHANES Iand NHANES II in the one study that examined them (Jones, et al.,1985).
Significant findings are consistently found amongbiochemical and hematologic measures. Poor preschool children
38

had greater rates of impaired hemoglobin and hematocrit levels,and poor black preschoolers had the most impairment. By theNHANES II era, there was improvement noted in iron orhematologic status, yet some impairment persisted. Similarly,elevated lead levels decreased from NHANES I to NHANES II, yeteven by the time of NHANES II the incidence of elevated leadlevels was over 18 percent among inner-city black children(Mahaffey, et al., /982) .
In this review we have chosen to examine some more,controversial consequences of poor nutrition, namely, obesityand socio-behavioral problems. Obesity seems to be a problemamong adolescent females, including poor adolescent females.Although a comparative study of older children has argued thatobesity increased from NHANES I to NHANES II, no similar studyof preschool children has been attempted. Our own preliminaryanalysis suggests that obesity may be a problem for females asyoung as age four or five, but these results must be interpretedas tentative at best. Although the youngar the age, the lesslikely that childhood obesity will lead to adult obesity, thefact that childhood obesity is increasing implies that the riskof adult obesity, with associated health problems such ashypertension, hyperlipidemia, and impaired glucose tolerance,may also be increasing. The fact that obesity appears to be aparticular problem for poor adolescent and for black adolescentfemales raises important policy issues about the quality of thediets of some of these girls and the role publicly supportednutrition programs could play in helping to solve this problem.
Even more difficult is the issue of the potential behavioralconsequences of mild-moderate undernutrition among preschoolers.In the case of iron status, most, bu'L; not all, of the evidencesuggests that impaired iron status, ev:an in the absence ofanemia, is associated with poorer performance on standardizedtests, and that performance can he improved with iron therapy.Similarly, relatively recent studies, none of which wereconducted in the United States, have produced good evidence of anassociation between nutrition supplementation of mild to moderateundernourished (as opposed to severely malnourished) preschoolersand improved social behavior. Supplemented children had betterattention spans, more persistence, less distractibility, moresocial interaction, less dependence and anxiety, better impulsecontrol and happier affect. The net effect of these improvementsrestlted in better performance in novel environments, moreinvolvement in competitive games, greater number of strategiesattempted in response to a frustrating task, and fewer errors instructural impulse control games. These results, were theyreproducible in a North American population, would haveimportant implications for the school performance ofmild-to-moderately undernourished preschoolers.
39
60

V. PROGRAM EFFECTS
With a few exceptions the studies reviewed do not directlyaddress program effects. This is more a consequence of thenature of the studies selected for review than a reflection ofthe efficacy of public food and nutrition programs. Althoughfailure in one study to find improved growth parameters forpreschoolers between NHANES I and NHANES II may be disappointing(Jones, et al., 1985), since program participation was notanalyzed it cannot be concluded that program participation hashad no effect.
Two of the studies that we did examine have more positiveimplications for program effects. The National Food ConsumptionSurvey compared poor children on food stamps with those not onfood stamps. Non-food stamp participants had four dietarymicronutrient deficiencies, and food stamp participants had onlytwo. However, one cannot conclude that food stamp participationcaused the improvement because of the nature of the survey. InMemphis, researchers compared preschool nutrition status in 1977and again in 1983 and noticed improvement in vitamin A andvitamin C intake, in hemotologic status, and in obesity. Theseimprovements were attributed to increased participation inpublicly supported food and nutrition programs.
In searching for surveys describing the nutritional statusof preschool children, we did find articles describing improvednutrition status associated with participation in food programs.In the course of conducting a nutrition survey among randomlyselected households with children under five years of age, Brownand Tieman (1986) found low income associated with low energy,iron, and vitamin C intakes, but WIC participation improved ironintake. Meals consumed by Maine children in Head Start improvedtheir nutrient and energy intake. Their hematologic status alsoimproved between the fall and the spring, but they still had notcaught up with middle and upper middle class children attendingnursery school (Cook, Davis, Radke, et al., 1976; Cook,Hurlburt, and Radke, 1976). In a comparison of former HeadStart participants and non-participants eligible for free schoollunch in public school, the Head Start graduates were taller,more physically fit and absent less from school (Gietzen andVermeersch, 1980). Both these studies;, however, are limited intheir generalizability by virtue of small sample size (Cook, etal. 1976) and retrospective design (Gietzen and Vermeersch,1980) .
There has been overall improvement in the iron status ofpreschool children between NHANES I and NHANES II. It is likelythat this improvement is attributable to iron fortification ofinfant formulas and cereal products (Yip, Walsh, Goldfarb, etal., 1987). Yip and colleagues also noted important gains iniron status in several states participating in the Pediatric
40
6.

Nutrition Surveillance System (Yip, Binkin, Fleshood, et al.,1987). Observing that children already enrolled in the WICprogram have better iron status than same-age children at theirfirst WIC visit, the authors conclude that participation in WICis associated with lower rates of anemia. Yet, elen thisgratifying result lacks the rigor of a scientifically designedprospective study. Further review of evaluation studies isbeyond the scope of this paper. Suffice it to say that WIC,arguably the most thoroughly evaluated social program availableto poor women and children, has survived periodic Congressionalscrutiny by virtue of the preponderance of evidence in favor ofits efficacy.
41

REFERENCES
Alvear. J., Artaza, C., Vial, M., Guerrero, S., and Muzzo, S. (1986).Physical growth and bone age of survivors of protein energymalnutrition. Archives of Disease in Childhood, 61, 257-262.
American Academy of Pediatrics, Committee on Nutrition. (1986).Prudent life-style for children: Dietary fat and cholesterol.
. Pediatrics, 78, 521-525.
American Academy of Pediatrics, Committee to review the Ten-StateNutrition Survey. (1973). The Ten-State Nutrition Survey: Apediatric perspective. Pediatrics, 51, 1095-1099.
Andreoli, T., Carpenter, C., Plum, F., and Smith, L. (Eds.). (1986).Cecil's Essential:.. of Medicine. Philadelphia: W. B. Saunders,418-420.
Annest, J., Pirkle, J., ?lakuc, D., Neese, J., Bayse, D., and Kovar, M.(1983). Chronological trend in blood lead levels between 1976and 1980. New Encland Journal of Medicine, 308, 1373-1377.
Aristimuno, G., Foster, T., Voors, A., Srinivasan, S., and Berenson,G. (1984). Influence of persistent obesity in children oncardiovascular risk factors: The Bogalusa Heart Study.Circulation, 69, 895-904.
Barrett, D. (1984). Malnutrition and child behavior:Conceptualization, assessment and an empirical study ofsocial-emotional functioning. In J. Brozek and B. Schurch(Eds.), Malnutrition and behavior: A critical assessment of keyissues (pp. 280-306). Lausanne, Switzerland: Nestle Foundationfor the Study of Nutrition Problems in the World.
Barrett, D., and Radke-Yarrow, M. (1985). Effects of nutritiona)supplementation on children's responses to novel, frustrating,and competitive situations. American Journal of ClinicalNutrition, 42, 102-120.
Barrett, D., Radke-Yarrow, M., and Klein, R. (1982). Chronicmalnutrition and child behavior: Effects of early caloricsupplementation on social and emotional functioning at schoolage. Developmental Psychology, 18, 541-556.
Behrman, R., and Vaughn, V. (Eds.) (1987). Nelson's Textbook ofPediatrics (13th Ed.). Philadelphia: W. B. Saunders, p. 1028.
42

Beisel, W., (1984). Nutrition, infection, specific immune respc,.1ses,and nonspecific host defenses: A complex interaction. In R.Watson (Ed.), Nutrition, disease resistance, and immune function(pp. 3-31). New York: Dekker.
Beisel, W. (1982). Single nutrients and immunity. American Journalof Clinical Nutrition, 35, Suppl., 417-459.
Beisel, W., Edelman, R., Nauss, K., and Suskind, R. (1981). Singlenutrient effects on immunologic functions: Report of a workshopsponsored by the Department of Food and Nutrition and itsnutrition advisory group to the American Medical Association.Journal of the American Medical Association, 245, 53-58.
Bithoney, W. (1986). Elevated lead levels in children with nonorganicfailure to thrive. Pediatrics, 78, 891-895.
Bowering, J. and Clancy, K. (1986). Nutritional status of childrenand teenagers in relation to vitamin and mineral use. Journal ofthe American Dietetic Association, 86, 1033-1038.
Brown, J., Serdula, M., Cairns, K., Godes, J., Jacobs, D., Elmer, P.,and Trowbridge, F. (1986). Ethnic group differences in nutri-tional status of young children from low-income areas of an urbancounty. American Journal of Clinical Nutrition, 44, 938-944.
Brown, J.E., and Tiernan, P. (1986). Effect of income and WIC on thedietary intake of preschoolers: Results of a preliminary study.Journal of the American Dietary Association, 86, 1189-1191.
Brunser, 0., Figueroa, G., Araya, M., and Espinoza, J. (1984).Infectious and Diarrheal disease. In P. White and N. Selvey(Eds.), Malnutrition: Determinants and Consequences (pp.259-270). New York: Alan R. Liss.
Centers for Disease Control (1986a). Declining anemia prevalenceamong children enrolled in public nutrition and health programs -Selected states, 1975-1985. Morbidity and Mortality WeeklyReport, 35, 36, 565-566.
Centers for Disease Control (1986b). Nutritional status of minoritychildren - United States, 1986. Morbidity and Mortality WeeklyReport, 36, 366-369.
Centers for Disease Control (1980). Nutritional status of SoutheastAsian refugee children. Morbidity and Mortality Weekly Report,477-479.
Centers for Disease Control (1985). Nutrition Surveillance, 198:.Washington, DC: U.S. Department of Health and Human Services,Public Health Service.
43
64

Centers for Disease Control (1987).
Chandra, R. (1984). Nutritional regulation of immune function at theextremes of life: In infants and in the elderly. In P. Whiteand N. Selvey (Eds.), Malnutrition: Determinants and consequences(pp. 245-251). New York: Alan R. Liss.
Chandra, R. (1981). Immunodeficiency in undernutrition andovernutrition. Nutrition Reviews, 39, 225-230.
Chandra, R. (1972). Immunocompetence in undernutrition. Journal ofPediatrics, 81, 1194-1200.
Chase, H., Kumar, V., Dodds, J., Sauberlich, H., Hunter, R., Burton,R., and Spaulding, V. (1971). Nutritional status of preschoolMexican-American migrant farm children. American Journal ofDiseases of Children, 122, 316-324.
Chase, H.; and Martin, H. (1970). Undernutriticn and childdevelopment. New England Journal of Medicine, 282, 933-938.
Chen, L., Chowdhury, A., and Huffman, S. (1980). Anthropometricassessment of energy-protein malnutrition and subsequent risk ofmortality among preschool aged children. American Journal ofClinical Nutrition, 33, 1836-1845.
Citizen's Board of Inquiry (1968). Hunger, U.S.A. Boston: PlenumPress.
Cook, R.A., Davis, S.B., Radke, F.H., and Thorbury, M.E. (1986).Nutritional Status of Head Start and Nursery School Children. I.Food Intake and Anthropometric Measurements. Journal of TheAmerican Dietary Association, 58, 120-126.
Cook, R.A., Hurlburt, R.A., and Radke, F.H. (1976). Nutritional Statusof Head Start and Nursery School Children. II. BiochemicalMeasurements. Journal of the American Dietary Association, 68,127-132.
Crispin, S., Kerrey, E., Fox, H., and Kies, C. (1968). Nutritionalstatus of preschool children: II. Anthropometric measurementsand interrelationships. American Journal of Clinical Nutrition,21, 1280-1284.
Dallman, P., Slimes, M., and Stekel, A. (1980). Iron deficiency ininfancy and childhood. American Journal of Clinical Nutrition,33, 86-118.
. Dallman, P., Yip, R., and Johnson, C. (1984). Prevalence and causesof anemia in the United States, 1976-1980. American Journal ofClinical Nutrition, 39, 437-445.
44
P5

Danforth, D., and Scott, J. (Eds.) (1986). Obstetrics and Gynecology(5th Ed.). Philadelphia: J. B. Lippincott, p. 84.
Deinai'd, A., Gilbert, A., Dodds, M., and Egeland, B. (1981). Irondeficiency and behavioral deficits. Pediatrics, 68, 828-833.
Deinard, A., List, A., Lindgren, B., Hunt, J., and Chang, P. (1986).Cognitive deficits in iron-deficient and j--)n- deficient anemicchildren. Journal of Pediatrics, 108, 681-689.
Dietz, W. (1981). Obesity in infants, children, and adolescents inthe United States: I. Identification, natural history, andaftereffects. Nutrition Research 1, 117-137.
Dietz, W. (1983). Childhood obesity: Susceptibility, cause, andmanagement. Journal of Pediatrics, 103, 676-685.
Dietz, W. (1986). Prevention of childhood obesity. Pediatric Clinicsof North America, 33, 823-833.
Driskell, J., and Price, C. (1974). Nutritional status ofpreschoolers from low-income Alabama families. Journal of theAmerican Dietetic Association, 65, 280-283.
Eppright, E., Fox, H., Fryer, B., Lamkin, G., Vivian, V., and Fuller,E. (1972). Nutrition of infants and preschool children in theNorth Central Region of the United States of America. WorldReview of Nutrition and Dietetics, 14, 269-332.
Epstein, L., Wing, R., and Valoski, A. (1985). Childhood obesity.Pediatric Clinics of North America, 32, 363-379.
Expert Scientific Working Group (1985). Summary of a report onassessmen of the iron nutritional status of the United Statespopulation. American Journal of Clinical Nutrition, 42,1318-1330.
Frank, D. (1984). Malnutrition and child behavior: A view from thebedside. In J. Brozek and B. Schurch (Eds.), Malnutrition andBehavior: A Critical Assessment of Key Issues (pp. 307-326).Lausanne, Switzerland: Nestle Foundation for the Stucy of theProblems of Nutrition in the World.
Freeman, H., Klein, R., Townsend, J., and Lechtig, A. (1980).Nutrition and cognitive development among rural Guatemalanchildren. American Journal of Public Health, 70, 1277-1285.Galler, J. (1984). Behavioral consequences of malnutrition in earlylife. In J. Galler (Ed.), Nutrition and Behavior (pp. 63-85).New York: Plenum Press.
45

Galler, J. (1987). Examining the long-term consequences ofundernutrition. Pediatric Basics, 47, 1-4.
Galler, J., and Ramsey, F. (1987). A follow-up study of theinfluences of early malnutrition on development: V. Delayeddevelopment of conservation (Piaget). Journal of the AmericanAcadem of Child and Adolescent Psychiatry, 26, 23-27.
. Galler, J., Ramsey, F., and Solimano, G. (.985a). A follow- up studyof effects of early malnutrition on subsequent development:I. Physical growth and sexual maturation during. adolescence.Pediatric Research, 19, 518-523.
Galler, J., Ramsey, F., and Solimano, G. (1985b). A follow-up studyof the effect of early malnutrition on subsequent development:II. Fine motor skills in adolescence. Pediatric Research, 19,524-527.
Galler, J., Ramsey, F., and Solimano, G. (1984). The influence ofearly malnutrition on subsequent behavioral development; III.Learning disabilities as a sequel to malnutrition. PediatricResearch, 18, 309-313.
Galler, J., Ramsey, F., Solimano, G., Lowell, W., and Mason, E.(1983a). The influence of early malnutrition on subsequentbehavioral development: I. Degree of impairment in intellectualperformance. Journal of the American Academy of ChildPsychiatry, 22, 8-15.
Galler, J., Ramsey, F., Solimano, G., and Lowell, W. (1983b). Theinfluence of early malnutrition on subsequent behavioraldevelopment: II. Classroom behavior. Journal of the AmericanAcademy of Child Psychiatry, 22, 16-22.
Garn, S. (1985). Continuities and changes in fatness from infancythrough adulthood. Current Problems in Pediatrics, 15, 41-43.
Garn, S., Bailey, S., and Higgins, I. (1976). Fatness similarities inadopted pairs. American Journal of Clinical Nutrition, 29, 1067.
Garn, S., and Clark, D. (1975). Nutrition, growth, development, andmaturation: Findings from the Ten-State Nutrition Survey of1968-1970. Pediatrics, 56, 306-318.
Garn, S., and Clark, D. (1976). Trends in fatness and origins ofobesity: Report of the ad hoc committee to review the Ten-StateNutrition Survey, American Academy cc Pediatrics. Pediatrics,57; 443-455.
46

Garr', S., and Lavelle, M. (1985). Two-decade follow-up of fatness inearly childhood. American Journal of Diseases of Children, 139,181-185.
Gayle, H., Dibley, M., Marks, J., and Trowbridge, F. (1987).Malnutrition in the first two years of life: The contribution oflow birth weight to population estimates in the United States.American Journal of Diseases of Children, 141, 531-534.
Gietzen, D., and Vermeersch, J.A. (1980). Health status and schoolachievement of children from Head Start and Free School LunchPrograms. Public Health Reports, 95, 362-368.
Glueck, C. (1980). Detection of risk factors for coronary arterydisease in children: Semmelweis revisited? Pediatrics, 66,834-836.
Glueck, C. (1986). Pediatric primary prevention of atherosclerosis.New England Journal of Medicine, 314, 175-177.
Gortmaker, S., Dietz, W., Sobol, A., and Wehler, C. (1987). Increasingpediatric obesity in the United States. American Journal ofDiseases of Children, 141, 535-540.
Graham, 'C. (1985). Poverty, hunger, malnutrition, prematurity, andinfant mortality in the United States. Pediatrics, 75, 117-125.
Graitcher, P., and Gentry, E. (1981). Measuring children: Onereference for all. Lancet, 2, 297-299.
Grantham-McGregor, S. (1984). Review article: Chronic undernutritionand cognitive abilities. Human Nutrition: Ci.nical Nutrition,38C, 83-94.
Habicht, J., Martorell, R., Yarbrough, C., Malina, R., and Klein, R.(1974). Height and weight standards for preschool children.Lancet, 1, 611-614.
Hamill, R., Drizd, T., Johnson, C., Reed, K., Roche, A., and Moore, W.(1979). Physical growth: National Center for Health Statisticspercentiles. American Journal of Clinical Nutrition, 32,607-629.
Hertzig, M., Birch, H., Richardson, S., and Tizard, J. (1972).Intellectual levels of schoci children severely malnourishedduring the first two years of life. Pediatrics, 49, 814-824.Hoorweg, J. and Stanfield, J. (1976). The effect of protein energymalnutrition in early childhood on intellectual and motorabilities in later childhood and adolescence. DevelopmentalMedicine and Child Neurology, 18, 336-350.
47
Ron

James, J. (1972). Longitudinal study of the morbidity of diarrhealand respiratory infections in malnourished children. AmericanJournal Clinical Nutrition, 25, 690-694.
Jones, D., Nesheim, M., and Habicht, J. (1985). Influences in childgrowth associated with poverty in the 1970's: An examination ofHANES I and HANES II, cross-sectional U.S. national surveys.American Journal of Clinical Nutrition, 42, 714-724.
Kaplan, K. and Wadden, T. (1986). Childhood obesity and self-esteem.Journal of Pediatrics, 109, 367-370.
Kelsay, J. (1969). A compendium of nutritional status studies anddietary evaluation studies conducted in the United States,1957-1967. Journal of Nutrition, 99, Suppl. 1, pt. 2, 119-166.
Kerr, G., Lee, E., Lam, M., Lorimor, R., Randall, P., Forthofer, R.,Davis, M., and Magnetti, S. (1982). Relationships between dietaryand biochemical measures of nutritional status in HANES I data.American Journal of Clinical Nutrition, 35, 294-308.
Kerr, G., Lee, E., Lorimor, R., Mueller, W., and Lam, M. (1982).Height distributions of U.S. children: Associations with race,poverty status, and parental size. Growth, 46, 135-149.
Kerrey, E., Crispin, S., Fox, H., and Kies, C. (1968). Nutritionalstatus et preschool children: I. Dietary and biochemicalfindings. American Journal of Clinical Nutrition, 21, 1274-1279.
Keusch, G. (1982). Immune function in the malnourished host.Pediatric Annals, 11, 1004-1013.
Kleiman, A., and McCord, C. (1978). Weight-for-age as an index ofrisk of death in children. Lancet, 1247-1250.
Klein, R. (1979). Malnutrition and human behavior: a backward glanceat an ongoing Longitudinal study. In D. Levitsky (Ed.),Malnutrition, environment, and behavior (pp. 219-237). Ithaca,NY: Cornell university Press.
Kulin, J.H., Bwibo, N., Mutie, D., and Santner, S. (1982). The effectof chronic childhood malnutrition on pubertal growth anddevelopment. American Journal of Clinical Nutrition, 36,527-536.
Lauer, R., Anderson, A., Beaglehole, R., and Burns, T. (1984). FactoTsrelated to tracking of blood pressure in children: U.S.. NationalCenter for Health Statistics, Health Examination Surveys CyclesII and III. Hvpertenr on, 6, 307-313.
48
R9
Leibel, R., Pollitt, E., Kim, I., and Viteri, F. (1982). Studiesregarding the impact of micronutrient status on behavior in man:Iron deficiency as a model. American Journal of Clinical Nutri-tion, 35, 1211-1221.
Listernick, R., Cristoffel, K., Pace, J., and Chiaramonte, J. (1985).Severe primary malnutrition in U.S. children. American Journalof Diseases of Children, 139, 1157-1160.
Lowenstein, F. (1981). Major nutritional findings from the FirstHealth and Nutrition Examination Survey in the United States ofAmerica, 1971-1974. Biblthca Nutr. Dieta, 30, 1-16.
Lozoff, B., Brittenham, G., Viteri, F., Wolf, A., and Urrutia, J.(1982). Developmental deficits in iron-deficient infants:Effects of age and severity of iron lack. Journal of Pediatrics,101, 948-951.
Lozoff, B., Brittanham, G., Viteri, F., Wolf, A., and Urrutia, J.(1982). The effects of short-term oral iron therapy 90 ondevelopmental deficits in iron-deficient anemic infants. Journalof Pediatrics, 100, 351-357.
Mahaffey, K., Annest, J., Roberts, J., and Murphy, R. (1982). Nationalestimates of blood lead levels: United States, 1976-1980. NewEngland Journal of Medicine, 307, 573-579.
Mahaffey, K., Gartside, P., and Glueck, C. (1986). Blood lead levelsand dietary calcium intake in 1-to-11 year-old children: TheSecond National Health and Nutrition Examination Survey,1976-1980. Pediatrics, 78, 257-262.
Mallick, M. (1983). Health hazards of obesity and weight control inchildren: A review of the literature. American Journal of PublicHealth, 73, 78-82.
Martorell, R. (1980). Interrelationships between diet, infectiousdisease, and nutritional status. In L. Greene and F. Johnston(Eds.), Social and Biological Predictors of NutritionalStatus,Phvsical Growth, and Neurological Development (pp.81-106). New York: Academic Press.
Martorell, R., Yarbrough, C., Klein, R., and Lechtig, A. (1979).Malnutrition, body size, and skeletal maturation:Interrelationships and implications for catch-up growth. HumanBiology, 51, 371-389.
Massachusetts Nutrition Survey (1983). Boston: MassachusettsDepartment of Public Health, Division of Family Health Services.
49
70

Merritt, R., and Suskind, R. (1979). Nutritional survey ofhospitalized pediatric patients. American Journal of ClinicalNutrition, 32, 1320-1325.
Miler, I. (1982). Nutrition in early life and the development ofresistance and immunity. Biblthca Nutr Dieta, 31, 55-60.
Nationwide Food Consumption Survey: Continuing Survey of Food Intakesby Individuals: Women 19-50 years and their children 1-5 years,1 day. Report No. 85-1. (1985a). Washington, DC: U.S. Departmentof Agriculture, Human Nutrition Information Service.
Nationwide Food Consumption Surv. : Continuin Surve of Food Intakesby Individuals: Low-Income Women 19-50 years and their children1-5 years, 1 day. Report No. 85-2. (1985b). Washington, DC:U.S. Department of Agriculture, Human Nutrition InformationService.
Needleman, H. (1983). Lead at low dose and the behavior of children.Neurotoxicoloqy, 4, 121-133.
Newman, W., Freedman, D., Voors, A., Grad, R., Srinivansan, S.,Cresanta, J., Williamson, G., Webber, L., and Berenson, G.(1986). Relation of serum lipoproteins and systolic bloodpressure to early atherosclerosis: The Bogalusa Heart Study.New England Journal of Medicine, 314, 138-144.
Nuutinen, 0. and Knip, M. (1984). Food consumption and nutrientintake in obese and normal weight children. In P. Lautala, M.Knip, and K. Kouvalainen (Eds.), Obesity in Children:'roceedings of the First Onnela Symposium. Janakkala, Finland:University of Oulu, Department of Pediatrics.
Olness, K., Yip, R., Indritz, A., and Torjesen, E. (1984). Height andweight status of Indochinese refugee children. American Journalof Diseases of Children, 138, 544-547.
Ordonez, L. (1984). Nutrition and behavior: A review. In P. Whiteand N. Selvey (Eds.), Malnutrition, Determinants andConsequences,(pp. 179-185). New York: Alan R. Liss.
Oski, F. (1979). Thu nonhematologic manifestations of irondeficiency. American Journal of Diseases of Children, 133,315-321.
Oski, F. (1985). Iron deficiency--Facts and fallacies. PediatricClinics of North America, 32, 493-497.
Oski, F., and Honig, A. (1978). The effects of therapy on the. developmental scores of iron-deficient infants. Journal of
Pediatrics, 92, 21-25.
50

Oski, F., Honig, A., Heln, B., and Howanitz, P. (1983). Effect of irontherapy on behavior performance in nonanemic iron-deficientinfants. Pediatrics, 71, 877-880.
Owen, B., Garry, P., Lubin, A., and Kram, K. (1971). Nutritionalstatus of preschool children: Plasma vitamin A. Journal ofPediatrics, 78, 1042-1044.
Owen, G., Kram, K. (1968). Nutritional status of preschool childrenin Mississippi. Journal of the American Dietetic Association,54, 490-494.
Owen, G., Kram, K., Garry, P., Lowe, J., and Lubin, A. (1974). Astudy of nutritional status of preschool 92 children in theUnited States, 1968-1970. Pediatrics, 53, 597-646.
Owen, G., Lubin, A., and Garry, P. (1971). Preschool children in theUnited States: Who has iron deficiency? Journal of Pediatrics,79, 563-568.
Owen, G., Lubin, A., argi Garry, P. (1973). Hemoglobin levelsaccording to age, race, and transferrin saturation in preschoolchildren of comparable socioeconomic status. Journal ofPediatrics, 82, 850-851.
Owen, G., Nelson, C., Kram, K., and Garry, P. (1969). Nutritionalstatus of preschool children in two counties in southern Ohio:Pilot study in August and September, 1968. Ohio State MedicalJournal, 65, 809-814.
Palti, H., Meijer, A., and Adler, B. (1985). Learning achievement andbehavior at school of anemic and non-anemic infants. Early HumanDevelopment, 10, 217-223.
PolLitt, E. (1985). Effects of iron deficiency with and withoutanemia on mental development among infants and preschoolchildren. Unpublished manuscript. University of Texas, Schoolof Public Health, Houston.
Pollitt, E., Saco-Pollitt, C., Leibel, R., and Viteri, F. (1986).Iron deficiency and behavioral development in infants andpreschool children. American Journal of Clinical Nutrition, 43,555-565.
Puri, S., and Chandra, R. (1985). Nutritional regulation of hostresistance and predictive value in immunologic tests inassessment of outcome. Pediatric Clinics of North America, 32,499-516.
51
72

Richardson, S. (1976). The relation of severe malnutrition in infancyto the intelligence of school children with differing lifehistories. Pediatric Research, 10, 57-61.
Richmond, D,, Blyler, E., and Linscheid, T. (1983). The obese child.American Family Physician, 28, 129-134.
Rimoin, D., Borochowitz, Z., and Horton, W. (1986). Short stature:Physiology and pathology. Western Journal of Medicine, 144,710-721.
Roy, C., and Galeano, N. (1985'. Childhood antecedents of adultdegenerative disease. Pediatric Clinics of North America, 32,517-533.
Rubenstein, E., and Federman, D. (Eds.) (1987). Obesity. ScientificAmerican Medicine, 9, Metabolism III.
Rundles, S. (1984). Nutritional factors in immune response. In P.White and N. Selvey (Eds.), Malnutrition: Determinants andConsequences (pp. 233-244). New York: Alan R. Liss.
Schaefer, A. (1969). The Naticnal Nutrition Survey. Journal of theAmerican Dietetic Association, 51, 371-375.
Schwerin, H., Stanton, J., Riley, A., Schaefer, A., Levielle, G.,Elliott, J., Warwick, K., and Butt, B. (1981). Food eatingpatterns and health: A reexamination of the Ten-State and HANESI surveys. American Journal of Clinical Nutrition, 34, 568-580.
Solomons, N. (1985). Assessment of nutritional status: Functionalindicators of pediatric nutriture. Pediatric Clinics of NorthAmerica, 32, 319-334.
Sommer, A., and Loewenstein, M. (1975). Nutritional status andmortality: A prospective validation of the QUAC stick. AmericanJournal of Clinical Nutrition, 28, 287-292.
Starfield, B., and Budetti, P. (1985). Child health status and riskfactors. Health Services Research, 19, 873-875.
Strong, W. (1978). Is atherosclerosis a pediatric problem: Anoverview. In W. Strong (Ed.), Atherosclerosis: Its PediatricAspects (pp. 1-13). New York: Greene and Stratton.
Stunkard, A., Sorensen, T., Hanis, C., Teasdale, T., Chakraborty, R.,Schull, W., and Schulsinger, R. (1986). An adoption study ofhuman obesity. New England Journal of Medicine, 314, 193-198.
Sutphen, J. (1985). Growth as a measure of nutritional status.Journal of Pediatric Gastroenterology, 4, 169-181.
52
73

Szklo, M. (1986). Determinants of blood pres' are in children.Clinical and Experimental Hypertension, 1 8, 479-493.
Taitz, L. (1983). The obese child. London: Blackwell ScientificPublications.
Tanner, J. (1976). Growth as a monitor of nutritional status. .Proceedings of the Nutrition Society, 35, 315-322.
Tracey, V., De, N., and Harper, J. (1971). Obesity and respiratory.infection in infants and young children. British Medical
Journal, 1, 16-18.
Trowbridge, F. (1983). Prevalence of growth stunting and obesity.Centers for Disease Control, Surveillance Summaries, 32, 455.
Trowbridge, F. (1984). Malnutrition in industrial North America:Determinants and consequences. In P. White and N. Selvey (Eds.),Malnutrition: Determinants and Consegpences. New York: Alan R.Liss.
Utah Nutrition Monitoring Protect (1986). Salt Lake City: Utah StateDepartment of Health, Division of Family Health Service.
Waber, D., Christiansen, L., Ortiz, N., Clement, J., Christiansen, N.,Mora, J., Reed, R., and Herra, M. (1981). Nutritionsupplementation, maternal education, and cognitive development ofinfants at risk of malnutrition. American Journal of ClinicalNutrition, 34, 807-813.
Walberg, J., and Ward, D. (1983-85). Role cf physical activity in theetiology and treatment of childhood obesity. Pediatrician, 12,82-88.
Walter, J. Kovalskys, J., and Stekel, A. (1983). Effect of mild irondeficiency on infant mental development scores. Journal ofPediatrics, 102, 519-522.
Waterlow, J. (1972). Classification and definition of proteincaloriemalnutrition. British Medical Journal, 3, 566-569.
Waterlow, J. (1974). Some aspects of childhood malnutrition as apublic health problem. British Medical Journal, 4, 88-90.
Waterlow, J., Buzina, R., Lane, J., Nichaman, M., and Tanner, J.(1977). The presentation and use of height and weight data forcomparing the nutritional status of groups of children under theages of 10 years. Bulletin of t te World Health Organization, 55,489-498.
Watkins, L., and Strong, W. (1984). the child: When to beginpreventive cardiology. Current Problems in Pediatrics, 14, 21.
53
74---

Williams, C. (1983-85). Nutrition intervention and health riskreduction in childhood: Creating healthy adults. Pediatrician,12, 97-101.
Yip, R., Binkin, N., Fleshood, L., and Trowbridge, F. (1987).Declining prevalence of anemia among low-income children in the4United States. Journal of the American Medical Association, 258,1619-1623.
14
Yip, R., Walsh, K., Goldfarb, M., and Binkin, N. (1987). Decliningprevalence of anemia in a middle-class setting: A pediatricsuccess story? Pediatrics, 80, 330-334.
Zee, P., DeLeon, M., Roberson, R., and Chen, C. (1985). Nutritional'improvement of poor urban preschool children. Journal of theAmerican Medical Association, 253, 3269-3272.
Zee, P., Walters, T., and Mitchell, C. (1970). Nutrition and povertyin preschool children: A nutritional survey of preschoolchildren from impoverished black families, Memphis. Journal ofthe American Medical Association, 213, 739-742.
Ziegler, H., and Ziegler, P. (1975). Depression of tuberculinreaction in mild and moderate protein-calorie malnourishedchildren following BCG vaccination. Johns Hopkins MedicalJournal, 137, 59-64
54
75