n u r c the young economists journal - universitatea din...
TRANSCRIPT
Revista Tinerilor Economiºti
The Young Economists Journal
SELECTION FROM CONTENTS
Year V No. 8, April 2007
Journal indexed, from 2006, in the C category by THE NATIONAL UNIVERSITY RESEARCH COUNCIL from ROMANIA, with the code 731.
7
11
40
48
64
83
133
153
Institutions, policies and efficiencyin economies
Corporate governance and financialglobalization
Performance measurement - the balancedscorecard perspective
Divergences and similarities in theevolution of the human resources function in the western part of theMediterranean Sea
Measurement and evaluation ofintellectual capital
Erp and e-business
Constituent dimensions of customersatisfaction: a study of nationalisedand private banks
An analysis of the brand loyalty basedconsumer typology

YEAR V – NO. 8, APRIL 2007
REVISTA TINERILOR ECONOMIŞTI ISSN 1583-9982
http://stat257.central.ucv.ro/rte
Editor in Chief Assoc. Prof. Ph.D. Costel Ionaşcu
University of Craiova, Faculty of Economy and Business Administration, Romania
Editorial Board Assoc. Prof. Ph.D Anca Băndoi University of Craiova, Faculty of Economy and Business Administration, Romania Assoc. Prof. Ph.D Cerasela Bolnăvescu University of Craiova, Faculty of Economy and Business Administration, Romania Prof. Ph.D Adriana Burlea-Şchiopoiu University of Craiova, Faculty of Economy and Business Administration, Romania Assist. Ph.D student Daniel Cîrciumaru University of Craiova, Faculty of Economy and Business Administration, Romania Assoc. Prof. Ph.D Mirela Cristea University of Craiova, Faculty of Economy and Business Administration, Romania Assoc. Prof. Ph.D Sorin Domnişoru University of Craiova, Faculty of Economy and Business Administration, Romania Lect. Ph.D Laurenţiu Dragomir University of Craiova, Faculty of Economy and Business Administration, Romania
Lect. Ph.D Raluca Drăcea University of Craiova, Faculty of Economy and Business Administration, Romania Lect. Ph.D Cristi Drăgan University of Craiova, Faculty of Economy and Business Administration, Romania Lect. Ph.D Laura Giurcă Vasilescu University of Craiova, Faculty of Economy and Business Administration, Romania Lect. Ph.D Ramona Gruescu University of Craiova, Faculty of Economy and Business Administration, Romania Assist. Ph.D student Radu Ogarcă University of Craiova, Faculty of Economy and Business Administration, Romania Assoc. Prof. Ph.D Carmen Radu University of Craiova, Faculty of Economy and Business Administration, Romania Assoc. Prof. Ph.D Cristi Spulbăr University of Craiova, Faculty of Economy and Business Administration, Romania
Academic Review Board: Ph.D Prof. Buşe Lucian University of Craiova, Faculty of Economy and Business Administration, Romania Ph.D Assist. Prof. Goran Petrevski SS Cyril and Methodius University, Faculty of Economics, Skopje, Macedonia Ph.D Assist. Prof. Daniel Stavárek Silesian University, School of Business Administration, Karviná, Czech Republic Ph.D Prof. Olivier BACHELARD Ecole Superieure de Commerce Saint Etienne Saint Etienne, France Ph.D Prof. IGALENS Jacques Responsable Département GRH Université 1 Toulouse Sciences Sociales, France Paddy Gray Director of Housing Management Programmes, University of Ulster, Northern Ireland
Ph.D Prof.Conway Lackman Duquesne University, Pittsburg, SUA Ph.D Prof. Pedro CRUZ Business Administration Department, Instituto Poliécnico de Viseu, Portugal Ph.D Assoc. Prof. Timothy A. Woods University of Kentucky, Lexington, SUA Ph.D Prof. Himayatullah Khan Agricultural University, Peshawar, Institute of Development Studies and COMSATS Institute of Information Technology, Abbottabad, Pakistan Ph.D Prof. Vasilescu Nicolae University of Craiova, Faculty of Economy and Business Administration, Romania Ph.D Prof. Burdescu Dumitru Dan University of Craiova, Faculty of Automatics, Computers and Electronics, Romania
The authors have the entire responsibility for the content of the articles and only they will support all legal consequences generated by violation of the copyright.

3
EDITORIAL
The image of the school today is the image of the country tomorrow!
“The future of a nation depends entirely on the way that nation prepares its youth”
Erasmus Romania has finally fulfilled its dream of joining the
European Union. This means the alignment of the Romanian educational system within European standards. Unfortunately, this step is very intricate as it requires the removal of obsolete mentalities and reorientation of the entire educational “organism” to new way of life.
From a certain point of view, many of our colleagues share the idea that the Romanian educational system is of high quality, pointing the remarkable results got by Romanian students and pupils at international scientific competitions and the great number of Romanian specialists working abroad and highly appreciated for their work. But, however, can we speak about a good educational system in a country facing such a deplorable social-economic situation and political crisis, especially after the president’s dismissal? It is an uneasy question that Romanians seem not to ask themselves and if some of them still do, their answers are far unsubstantial. Moreover, the crisis of the Romanian educational system has been discussed for 17 years by all the ministries in charge. But, like in a surrealist play, none of them has assumed their commitment and responsibility for the actual failure of the educational system in a country which is already a member of the European Union.
We often talk about the European Union, university diplomas and European recognition and wonder if we can use our diplomas issued by Romanian universities to work in any other country in the Union. The reason for this doubt is that the development of the European University and Research System is very often justified by profitableness.
Is the Romanian university system seen in terms of profitableness? Have our professional competence and qualifications developed once we joined the European Union? How will our vernacular educational system, stuck within old structures and customs, survive a massive transplant of

4
European conceptions, norms, methods and means? All this are rhetorical questions…
The international successes of our graduates working abroad are, indeed, reasons for our being proud and very hopeful. But these successes are not in the least thanks to the Romanian educational system. The merits are completely of the students’, of those who have succeeded in overcoming the unfavorable conditions of an adverse educational system and who have excelled. Can this argument plead for leaving the system at the actual level?
The image of the school today is the image of the country tomorrow…
PhD Lecturer Raluca Dracea

5
TABLE OF CONTENT
EDITORIAL 3 INSTITUTIONS, POLICIES AND EFFICIENCY IN ECONOMIES Assist. Prof. Pavel Stoynov Sofia University “St. Klimet Ohridski” Faculty of Economics and Business Administration
7
CORPORATE GOVERNANCE AND FINANCIAL GLOBALIZATION Lect. Ph.D Laura Giurcă Vasilescu University of Craiova Faculty of Economy and Business Administration, Craiova, Romania
11
BETWEEN THE CONTROL PERCENTAGE AND INTEREST PERCENTAGE IN ASSURING A FAIR IMAGE OF THE GROUP OF ENTITIES Assoc. Prof. Ph.D Sorinel Domnişoru Lect. Ph.D Valeriu Brabete Assist. Ph.D Student, Daniel Goagără University of Craiova, Faculty of Economics and Business Administration
21
WHAT MOTIVATES EMPLOYEES OF BANKING SYSTEM Prof. Ph.D Popescu Jenica University of Craiova Faculty of Economy and Business Administration Craiova, Romania
29
CONSTITUENT DIMENSIONS OF CUSTOMER SATISFACTION: A STUDY OF NATIONALISED AND PRIVATE BANKS Lect. Ph.D Jitendra Kumar Mishra, Prestige Institute of Management&Research, Indore, India
40
PERFORMANCE MEASUREMENT - THE BALANCED SCORECARD PERSPECTIVE Ph.D Student Gică Oana Adriana Assist. Ph.D Student Moisescu Ovidiu Ioan Babeş-Bolyai University Faculty of Economics and Business Administration,Cluj-Napoca, Romania
48
THE FORMING SYSTEM IN ROMANIAN PUBLIC ADMINISTRATION Lect. Ph.D Cristina Manole Assoc. Prof. Ph.D Colesca Sofia Elena Academy of Economic Studies Faculty of Management Bucharest, Romania
55
DIVERGENCES AND SIMILARITIES IN THE EVOLUTION OF THE HUMAN RESOURCES FUNCTION IN THE WESTERN PART OF THE MEDITERRANEAN SEA Ph.D Student Lucas Dufour AER à Euromed Marseille, France Assoc. Prof. Ph.D Soufyane Frimousse ATER à l’Université de Corse, France
64
ADVERTISING AND INTELLECTUAL PROPERTY RIGHTS – A KEY TO COMPANIES’ COMPETITIVENESS Assist. Ph.D Student Cătălina Radu Academy of Economic Studies Faculty of Management Bucharest, Romania Ph.D Student Alina Cătăneţ Media University Faculty of Management of Affairs Bucharest, Romania
75
AN ANALYSIS OF THE BRAND LOYALTY BASED CONSUMER TYPOLOGY Assist. Ph.D Student Moisescu Ovidiu Ioan Ph.D Student Gică Oana Adriana Babeş-Bolyai University Faculty of Economics and Business Administration, Cluj-Napoca, Romania
83
DEVELOPMENT DIRECTIONS OF SERVICES AND PRODUCTS IN INSURANCES Lect. Ph.D Mitu Narcis Eduard University of Craiova Faculty of Economy and Business Administration, Craiova, Romania
89

6
TOURISM, PART OF EUROPEAN POLICY Lect. Ph.D Gruescu Ramona Assoc. Prof. Ph.D Mitrache Marius Lect. Ph.D Nanu Roxana University of Craiova Faculty of Economics and Business Administration
93
LINKS BETWEEN MACROECONOMIC KEY VARIABLES AND EMPLOYMENT LEVELS IN ROMANIA Assist. Ph.D Student Bocean Claudiu Ph.D Student Mimi Petrişan University of Craiova Faculty of Economics and Business Administration, Craiova, Romania
99
PERSONAL VERSUS MASS COMMUNICATION Assoc. Prof. Ph.D Girboveanu Sorina University of Craiova Faculty of Economy and Business Administration, Craiova, Romania
105
THE PRESS RELEASE – THE MEDIA INSTRUMENT FOR INCREASING COMPETITIVENESS Ph.D Student Alina Cătăneţ Media University Faculty of Management of Affairs Bucharest, Romania Assist. Ph.D Student Cătălina Radu Academy of Economic Studies Faculty of Management Bucharest, Romania
111
STRATEGIC CONTROLLING IN ROMANIA-SUPPORT OF MANAGERIAL DECISIONS Lect. Ph.D Valentina Oargă Prof. Ph.D Emilia Novac Lect. Ph.D Student Denisa Pop - Abrudan West University of Timişoara Faculty of Economics Management Department
115
CHILD LABOUR IN PAKISTAN AND OTHER DEVELOPING COUNTRIES Prof. Ph.D Himayatullah Khan Institute of Development Studies (IDS) NWFP Agricultural University, Peshawar, Department of Development Studies, COMSATS Institute of Information Technology, Abbottabad, Pakistan
121
MEASUREMENT AND EVALUATION OF INTELLECTUAL CAPITAL Assist. Ph.D Student Stănescu Aurelia Academy of Economic Studies Faculty of Management Bucharest, Romania
133
THE ECOLOGIC BALANCE IN THE EQUATION OF THE DURABLE DEVELOPMENT Assoc. Prof. Ph.D Boncea Amelia Lect. Ph.D Rabontu Cecilia Irina University “ Constantin Brancusi” of Tg-Jiu, Faculty Of Sciences Economic
137
TV MEDIA IN THE REPUBLIC OF MACEDONIA – CURRENT SITUATION AND PERSPECTIVES Assist. Prof. Anita Ciunova-Suleska University “Ss. Cyril and Methodius” Faculty of Economics Skopje, Republic of Macedonia
143
ERP AND E-BUSINESS Assist. Prof. Ph.D Pulevska-Ivanovska Lidija, University “Ss. Cyril and Methodius” Faculty of Economics Skopje, Macedonia
153
CURRENT ACCOUNT DEFICIT ANALYSIS. THE PATTERN BASED ON ADJUSTING COST OF INVESTMENTS Assist. Ph.D Student Radu Criveanu Assoc. Prof. Ph.D Marian Siminica Assist. PhD. Candidate Daniel Circiumaru University of Craiova Faculty of Economics and Business Administration, Craiova
165
7
Finances - Accounting
INSTITUTIONS, POLICIES AND EFFICIENCY IN ECONOMIES
Assist. Prof. Pavel Stoynov Sofia University “St. Klimet Ohridski” Faculty of Economics and Business Administration
Abstract: There are cases where the governments may not always serve the public interest. The implication seems to be that governments can help out but only if properly constrained. The impact of these ideas on monetary policy led to creation of Central banks. As far as fiscal policymaking is concerned, the evolution has been slower. It would seem that we are now ready to move to the next step, replacing rules with adequate incentives backed by institutions - fiscal policy committees.
Keywords: policies, institutions, rules.
The methods of correcting balance-of-payments disequilibria are classified as automatic or policy. An automatic adjustment mechanism is one that is activated by the balance-of-payments disequilibrium itself, without any government action, and operates until the disequilibrium is eliminated (unless the government takes specific steps to avoid its operation if there are unwanted side effects). On the other hand, adjustment policies are specific measures adopted by the government with the primary aim of correcting a balance-of-payments disequilibrium. Whereas automatic adjustment mechanisms are triggered as soon as disequilibrium arises and continue to operate (if unhampered) until the disequilibrium is eliminated, adjustment policies involve a time lag. That is, it takes time for the existence of a balance-of-payments disequilibrium to be recognized, for the government to adopt the appropriate policies, and for these policies to take effect. However, automatic adjustment mechanisms can have serious negative side effects, which the government may attempt to avoid by using adjustment policies.
Automatic adjustment mechanisms are subdivided into those that operate on prices and those that operate on incomes. In addition, there are automatic monetary adjustments. The automatic price adjustment mechanism relies on price changes in the deficit and surplus nations to bring about adjustment. The mechanism operates differently under a flexible exchange rate system than under a fixed exchange rate system such as a gold standard. The automatic income adjustment mechanism relies on induced changes in the national income of the deficit and surplus nation to bring about adjustment.
The most important economic goals or objectives of nations are: internal balance, external balance, a reasonable rate of growth and an equitable distribution of income. Internal balance refers to full employment or rate of unemployment of no more than 2 or 3 percents per year (the so-called frictional unemployment arising in the process of changing jobs) and a rate of inflation no more than 2 or 3 percent per year. External balance refers to equilibrium in the balance of payments (or a desired temporary disequilibrium such as a surplus that a nation may want in order to replenish its depleted international reserves). To achieve these objectives, nations have the

8
Revista Tinerilor Economişti following policy instruments at their disposal: expenditure-changing, or demand, policies, expenditure-switching policies, and direct controls.
Expenditure-changing policies include both fiscal and monetary policies. Fiscal policy refers to change in government expenditures, taxes, or both. Fiscal
policy is expansionary if government expenditures are increased and (or) taxes reduced. These actions lead to an expansion of domestic production and income through a multiplier process and induce a rise in imports. Contractionary fiscal policy refers to a reduction in government expenditures and (or) an increase in taxes, both of which reduce domestic production and income and induce a fall in imports.
Monetary policy involves a change in the nation’s money supply and affects domestic interest rates. Monetary policy is easy if the money supply is increased and interest rate fall. This induces an increase in the level of investment and income in the nation and induces imports to rise. On the other hand, tight monetary policy refers to a reduction in the nation’s money supply and a rise in the interest rate. This discourages investment, income, and imports, and also leads to a short-term capital inflow or reduced outflow.
Expenditure switching policies refer to changes in the exchange rate. A devaluation switches expenditures from foreign to domestic commodities and can be used correct a deficit in the nation’s balance of payments. But it also increases domestic production, and this induces a rise in imports, which neutralizes a part of the original improvement in the trade balance. A revaluation switches expenditures from domestic to foreign products and can be used to correct a surplus in the nation’s balance of payments. This also reduces domestic production and, consequently, induces a decline in imports, which neutralizes part of the effect of the revaluation.
Direct controls consist of tariffs, quotas, and other restrictions on the flow of international trade and capital. These are also expenditures-switching policies, but they can be aimed at specific balance-of-payments items (as opposed to a devaluation or revaluation, which is a general policy and applies to all items at the same time).
Faith in the ability of macroeconomic policies effectively to erase business cycles has long been oscillating. From the enthusiastic hopes of the 1960s that we could erase business cycles (Tobin, 1972) to the view of the 1980s that policies are ineffectual, the tendency seems to be moving to an intermediate position that emphasizes incentives and institutions. This evolution can be traced back both to facts and academic research (Wyplosz, C. 2005).
Monetary policy can be used for two different purposes; in the long run it is required to deliver price stability, in the shorter run it is asked to help stabilize output over the business cycle. The challenge is to deliver on the short-run objective without giving up the long-run objective. In the 1970s and 1980s, many central banks failed to meet this challenge. As they struggled to meet various contractionary shocks – including the infamous oil shocks – they gave up on inflation. The initial response to this failure was to adopt monetary aggregate growth rules. Inflation receded but the rules were soon found to be too rigid, in particular in the face of sharp changes in financial markets that modified the behavior of monetary aggregates. The next step was to replace rules with new central banking institutions following incentives. The third step was to delegate monetary policy to an independent group of unelected experts, usually identified as the Monetary Policy Committee (MPC). This committee is given a clear mandate (price stability, generally, sometimes quantitative inflation targets) by the political authorities. The committee has full authority to carry out monetary policy,

9
Finances - Accounting nowadays it means setting a short term interest rate. Finally it is ex post accountable to a political body for its performance, and often regularly required to explain its actions and thinking to the broader public. MPCs are not known to have an inflation bias and they have been highly successful both in 2005 achieving their mandated objectives and in being transparent to the public and accountable to the political authorities.
Fiscal policy can be set in the same mould. The long-run objective is fiscal discipline, i.e. debt sustainability. In the short run, fiscal policy may also make a contribution to output stabilization over the business cycle – in the European monetary union it is the only stabilization tool available at the national level. Many countries have followed the logic of adopting rules that aim at constraining fiscal policy decisions: limits on public spending, budget deficit rules, debt rules. The next step is to establish a commitment to a debt level target (as a proportion of GDP) over the relevant horizon, and to remove political pressure from those who undertake this task. The latter requirement calls for the establishment of new institutions. The most radical institutional solution is to mimic fully the approach adopted in the case of monetary policy, to set up Fiscal Policy Committees (FPCs).
The FPC members could be unelected experts appointed for a fixed duration, long enough to make them fully independent and to exceed the horizon of the policy target. The FPC could be given by the relevant political authorities a debt target to be achieved over a given horizon that is commensurable with business cycles as well as the authority to decide on the budget balance on the basis of an explicit GDP growth forecast. The FPC could be accountable to parliament. Each of these characteristics needs detailed elaboration.
The events of 2003–2004 have amply demonstrated that annual budget deficit ceilings are bound to be counterproductive. So they should be replaced by debt commitments. The debt targets should be established country by country and enforcement should be carried out at the national level. On the other hand, the Maastricht Treaty has established the principle that national fiscal discipline is a matter of common concern, hence the Excessive Deficit Procedure. Thus, any national solution must be made compatible with the solutions in other members of EU. The natural solution is the mandatory establishment of national FPCs. Each country would be required to create an FPC that meets common requirements, pretty much as each national central bank has to satisfy a common set of features. Each country would propose its own budget target, which would be negotiated with the other union members with a view of achieving consensus. Such an arrangement would go a long way towards guaranteeing fiscal discipline by removing the deficit bias while preserving sovereignty. Currently, monitoring by the Commission and externally-imposed sanctions are both perceived as intrusive. National FPCs with a clear mandate and associated formal or informal authority would achieve the same aims while leaving the fiscal policy instrument as an effective tool of output stabilization now that monetary policy is not available at the national level. At a later stage, granting the national FPCs the authority to decide on annual budget balances would be accompanied by a less formal role for the Commission. In all cases, sanctions must be abandoned, formally or informally.
A FPC should be effective only if the specialists who works there are of best quality. This means that there must be a system of looking for and educating the best specialists in macroeconomics. This means to create a clear system of rules for compensation of their labor as well as a system for monitoring the Committees and

10
Revista Tinerilor Economişti analyzing their mistakes. This is an extremely difficult task having in mind the corruption among the clerks and politicians of higher level and the usual practice of pressing the experts. Let us do not forget the experience of the former socialist countries where planning, monetary and fiscal institutions was under the pressure of the semi-literate activists of the communist parties.
Competent and dedicated policymakers are better able than quantitative rules to exercise good judgment and deliver an adequate mix of restraint and flexibility. To do so, however, they must be shielded from the temptation and pressures that are part of political life. This is the approach that has been adopted for monetary policy by an increasing number of countries, so far successfully. Fiscal policy has not yet benefited from a similar treatment both because of traditions and the perception that fiscal policy belongs exclusively to the political sphere. The challenge for a new type of fiscal policy to emerge is to recognize that spending and taxation ought to remain in the political sphere, but that the deficit and the debt level ought to be delegated to independent experts. The natural implication is that the institutions adopted for monetary policy can and should be applied to fiscal policy as well. Independent Fiscal Policy Committees can play the same role as Monetary Policy Committees, deciding on deficits and the evolution of the debt. To deliver good results, they need to be given a clear mandate, debt sustainability, so that they are freed from the time inconsistency problem that leads to a deficit bias.
REFERENCES 1. Tobin, J. The New Economics One Decade Older, Princeton
University Press, Princeton N.J., 2005 2. Wyplosz, C. Fiscal policy: institutions versus rules, National Institute
Economic Review, 2005, pp. 191

11
Finances - Accounting
CORPORATE GOVERNANCE AND FINANCIAL GLOBALIZATION
Lect. Ph.D Laura Giurcă Vasilescu University of Craiova Faculty of Economy and Business Administration Craiova, Romania
Abstract: At the global level, governance has been viewed primarily as intergovernmental relationships, but it must now be understood as also involving non-governmental organizations, citizen’s movements, multinational corporations, and the global capital market. Therefore it should be analyzed how corporate governance might affect global strategy and global organization, which in turn will shape the patterns of globalization. Also, it should be done a theoretical analysis regarding how each corporate governance actor (employees, shareholders, the board of directors, top management, teams and governments) will behave towards global strategy.
Keywords: corporate governance, globalization, corporations, stakeholders.
Introduction With the globalization of the world's capital markets, corporate governance has
followed swiftly onto the world stage. Furthermore, global forces are shaping the continuing development of corporate governance, and institutional investors, with their expanding cross-market holdings, have become agents for change.
The importance of corporate governance is hardly limited to Anglo-American markets. In fact, the investors share strong views on the value of corporate governance regardless of their region. The adoption of a common European currency, the freer flow of capital, goods, services and people across EU borders, and increased merger activity among large European companies have all created tremendous interest among European issuers and investors, member states and the Commission in the shared aims, as well as the differences, in corporate governance practice across Europe (reflected in corporate governance codes) and also any related barriers to the development of a single EU financial market.
Globalizing forces exert a pull that shapes and accelerates the development of corporate governance in markets throughout the world. The introduction of corporate governance regulations and best practices in one country or region (such as the European Union) increasingly affects practices in markets far beyond those borders.
Momentum is also global. For the majority of investors the corporate governance is more important today than it was three years ago and will become even more important in the next three years.
At the global level, governance has been viewed primarily as intergovernmental relationships, but it must now be understood as also involving non-governmental organizations, citizen’s movements, multinational corporations, and the global capital market.
12
Revista Tinerilor Economişti What Exactly Is Corporate Governance?
Corporate governance is the set of processes, customs, policies, laws and institutions affecting the way a corporation is directed, administered or controlled. Narrowly defines, corporate governance concerns the relationships among the many players involved (the stakeholders) and the goals for which the corporation is governed. The principal players are the shareholders, management and the board of directors. Other stakeholders include employees, suppliers, customers, banks and other lenders, regulators, the environment and the community at large.
More broadly defined, corporate governance can encompass the combination of laws, regulations, listing rules and voluntary private sector practices that enable the corporation to:
• attract capital; • perform efficiently; • achieve the corporate objective; • meet both legal obligations and general societal expectations. The Commission on Global Governance (United Nations) defines Global
Governance as “the sum of the many ways individuals and institutions, public and private, manage their common affairs“. It is a continuing process through which conflicting or diverse interests may accommodate, and cooperative action may be taken. It includes formal institutions and regimes empowered to enforce compliance, as well as informal arrangements that people and institutions either have agreed to or perceive to be in their interest.
Corporate governance is a multi-faceted subject. An important theme of corporate governance deals with issues of accountability and fiduciary duty, essentially advocating the implementation of guidelines and mechanisms to ensure good behavior and protect shareholders. Another key focus is the economic efficiency view, through which the corporate governance system should aim to optimize economic results, with a strong emphasis on shareholders welfare. There are yet other sides to the corporate governance subject, such as the stakeholder view, which calls for more attention and accountability to players other than the shareholders.
In corporations, the shareholder delegates decision rights to the manager to act in the principal's best interests. This separation of ownership from control implies a loss of effective control by shareholders over managerial decisions. Partly as a result of this separation between the two parties, a system of corporate governance controls is implemented to assist in aligning the incentives of managers with those of shareholders.
A board of directors often plays a key role in corporate governance. It is their responsibility to endorse the organization’s strategy, develop directional policy, appoint, supervise and remunerate senior executives and to ensure accountability of the organization to its owners and authorities.
All parties to corporate governance have an interest, whether direct or indirect, in the effective performance of the organization. Directors, workers and management receive salaries, benefits and reputation, while shareholders receive capital return. Customers receive goods and services; suppliers receive compensation for their goods or services. In return these individuals provide value in the form of natural, human, social and other forms of capital.
Numerous corporate governance principles and codes have been developed in different countries and issued from stock exchanges, corporations, institutional investors, or associations (institutes) of directors and managers with the support of
13
Finances - Accounting governments and international organizations. Commonly accepted principles of corporate governance include:
• Rights and equitable treatment of shareholders: organizations should respect the rights of shareholders and help shareholders to exercise those rights. They can help shareholders exercise their rights by effectively communicating information that is understandable and accessible and encouraging shareholders to participate in general meetings.
• Interests of other stakeholders: organizations should recognize that they have legal and other obligations to all legitimate stakeholders.
• Role and responsibilities of the board: the board needs a range of skills and understanding to be able to deal with various business issues and have the ability to review and challenge management performance.
• Integrity and ethical behavior: organizations should develop a code of conduct for their directors and executives that promotes ethical and responsible decision making.
• Disclosure and transparency: organizations should clarify and make publicly known the roles and responsibilities of board and management to provide shareholders with a level of accountability. They should also implement procedures to independently verify and safeguard the integrity of the company's financial reporting.
Different governance systems articulate the corporate objective in different ways, depending on which of two primary concerns is taken as the main focus: societal expectation or ownership rights.
Some nations focus on the need to satisfy societal expectations and, in particular, the interests of employees and other stakeholders (variously defined to include suppliers, creditors, tax authorities and the communities in which corporations operate). This view predominates in continental Europe (particularly Germany, France and The Netherlands) and in certain countries in Asia.
Other countries emphasize the primacy of ownership and property rights, and focus the corporate objective on returning a profit to shareholders over the long term. Under this view, employees, suppliers and other creditors have contractual claims on the company. As owners with property rights, shareholders have a claim to whatever is left after all contractual claimants have been paid. Associated with the US, Canada, the UK and Australia, this view of the corporate governance objective is generally justified on the followings:
• accountability to shareholders provides a single measurable objective that avoids the risk of diffusing the accountability of managers and directors. If managers and directors are accountable to a whole range of stakeholders, almost any action can be justified as in the interest of some group of stakeholders, and this gives managers and directors unfettered discretion;
• focusing on long-term shareholder value encourages investment capital to be put to the most efficient economic used from a market perspective and this should benefit society broadly.
No matter what view of the corporate objective is taken, effective governance ensures that boards and managers are accountable for pursuing it. The role of corporate governance in making sure that board and management are accountable is of broad importance to society for a number of reasons. An effective corporate governance system:

14
Revista Tinerilor Economişti - promotes the efficient use of resources both within the company and the larger
economy. Debt and equity capital should flow to those corporations capable of investing it in the most efficient manner for the production of goods and services most in demand, and with the highest rate of return. In this regard, effective governance should help protect and grow scarce resources, therefore helping to ensure that societal needs are met. In addition, effective governance should make it more likely that managers who do not put scarce resources to efficient use, or who are incompetent or (at the extreme) corrupt, are replaced.
- assists companies (and economies) in attracting lower-cost investment capital by improving both domestic and international investor confidence that assets will be used as agreed (whether that investment is in the form of debt or equity). Although managers need to have latitude for discretionary action if they are to innovate and drive the corporation to compete successfully, rules and procedures are needed to protect capital providers, including: independent monitoring of management; transparency as to corporate performance, ownership and control; participation in certain fundamental decisions by shareholders.
- assists in making sure that the company is in compliance with the laws, regulations and expectations of society. Effective governance involves the board of directors ensuring legal compliance and making judgments about activities that, while technically lawful in the countries in which the company operates, may raise political, social or public relations concerns.
- provides managers with oversight of their use of corporate assets. Corporate governance may not guarantee improved corporate performance at the individual company level, as there are too many other factors that impact on performance. But it should make it more likely for the company to respond rapidly to changes in business environment, crisis and the inevitable periods of decline. It should help guard against managerial complacency and keep managers focused on improving firm performance, making sure that they are replaced when they fail to do so.
- is closely related to efforts to reduce corruption in business dealings. Although it may not prevent corruption, effective governance should make it more difficult for corrupt practices to develop and take root, and more likely that corrupt practices are discovered early and eliminated. Effective governance is a check on the power of the relatively few individuals within the corporation who control large amounts of other people’s money.
Roles of Corporate Governance's Actors in Globalization The corporate governance is conceptualized broadly as the set of interests and
practices undertaken by shareholders and stakeholders of the firm. The focus should be on how the main governance actors (employees, shareholders, the board of directors, top management teams, and government) behave towards the firm as representative of the different interests shaping firm strategy. These interests are not always aligned.
Existing frameworks for globalization usually have three constructs: industry globalization drivers, global strategy elements and global organization factors. Government drivers are frequently included under industry aspects, but focus on inter-country rules such as trade and foreign direct investment regimes. But these government drivers of globalization ignore intra-country rules in terms of governance.
Corporate governance is likely to affect all aspects of global integration which can be grouped in the following categories:
15
Finances - Accounting - the elements of global strategy: global market participation, global products
and services, global activity location, global marketing and global competitive moves; - the elements of global organization: global organization structure, global
management processes, global human resources and global culture. Therefore it is important to know how corporate governance might affect global
strategy and global organization, which in turn will shape the patterns of globalization and also, how particular aspects of corporate governance (as related to actors in corporate governance within an institutional context) affect globalization outcomes.
It should be done a theoretical analysis to explain the logic that could predict how each corporate governance actor will behave towards global strategy and global organization that in turn will lead to a particular pattern of globalization mode.
a) Employees The role of home country employees in corporate governance varies by
country, as determined by the existing institutional arrangements. Employees can have different mechanisms for influencing firm governance,
depending on the corporate governance regime in which they operate. Examples of employee voice are board representation, work councils, equity ownership, unions, consultation rights and rules on working conditions and job security. The capacity of employees’ to influence the firm will have important effects for the firm’s ability to undertake global strategy and organization.
Regarding the strategy dimensions of global integration, a strong corporate governance role for employees should be favorable to global market participation, as this latter applies to the global expansion of sales and therefore should favor home employment rather than threaten it.
Similarly, the strong involvement of labour in firm governance shapes the characteristics of global products and services. A successful global product strategy requires not just the right design but also the ability to manufacture to world-class standards. Companies based in countries that for whatever reason cannot produce to world-class standards will, therefore, find it hard to adopt a global product strategy. On the other hand, too much employee involvement can have deleterious effects on product or service quality.
Conversely, employees having a strong position within the firm’s corporate governance should:
- make it harder for a corporation to relocate activities globally outside the home country;
- have a small negative effect on the use of global marketing, at the margin, strong home country employees may prefer marketing that retains national identity;
- make it harder for a corporation to make global competitive moves, as these often require sacrifice of home country position, resources, revenues or profits, and hence domestic jobs or working conditions.
Regarding the effects on global organization, it would expect that employees having a strong corporate governance role will not favor any global strategy lever because they would contribute to either fewer home country jobs or to decrease the quality of home country jobs. For instance, the implementation of global human resource policies is likely to transplant jobs across different subsidiaries and to introduce efficiency policies that are likely to impoverish home country employment practices such as work organization or performance incentives.
16
Revista Tinerilor Economişti b) Shareholders Shareholders of large public multinational corporations play differing roles in
different countries. There can be differentiate the neutral shareholders and those with vested interests (partial). The neutral shareholders are the ones to concern to maximize profits and shareholder value. USA and the UK have mostly neutral shareholders, who are focused on maximization of shareholder value.
Interested shareholders also care about other objectives, sometimes ahead of shareholder value. Employee shareholders nearly always have the partial interest of some bias against maximizing shareholder value in favor of employment levels, pay or conditions. The shareholders such as banks or institutional investors are considered as partial interest shareholders, as they will have several interests at stake in addition to shareholder value maximization. In Japan, institutional shareholders hold maintenance of the overall network as a major objective. In Germany, institutional shareholders typically have close ties and loyalty to management. In all countries, state shareholders pursue additional objectives such as maintaining employment, national security, competitiveness and prestige.
For short, neutrality or partiality is a function of several shareholder attributes: the typical roles in a country of institutional shareholders and of governmental shareholders, the prevalence of first versus second or later generation family shareholders, the extent of shareholdings by managers and lastly the degree of concentration that will allow the exercise of shareholder influence. Hence is important to use neutrality versus partiality of shareholder interests as the key defining characteristic of shareholder behavior that affects globalization, although partial shareholders will need some degree of concentrated ownership in order to exercise influence.
It is expected that shareholders will manifest different positions regarding the five global strategy levers. First, most shareholders, whether neutral or partial, should be in favor of global market participation, as that usually helps rather than affect domestic interests such as higher firm revenues.
Second, whether shareholders are neutral or partial probably has little effect on the ability of corporations to produce globally competitive products and services. For example, Japan and Germany produce on average the highest quality global products and have similar types of shareholder interests (large institutions that favor incumbent management and the status quo). France and Italy have relatively large shareholdings by partial government shareholders but are not as successful in producing global products except in some niche areas. The USA and UK have similar corporate governance in terms of having mostly neutral shareholders. But the USA has many more companies with successful global products while Britain has almost no global products left, but a significant number of globally competitive services (especially in finance, airlines and creative industries).
Third, neutral shareholders should favor global relocation of activities if that is in the best interests of the company and ultimately shareholder value. Some types of partial shareholders may oppose global relocation; in particular, significant equity ownership by home country employees makes it difficult for companies to move jobs overseas. Many government shareholders also seek to protect domestic employment. Some family shareholders may also have sentimental or altruistic reasons for preserving domestic employment.
17
Finances - Accounting Fourth, partial shareholders should have a small negative effect on the use of
global marketing. At the margin, some home country shareholders, such as employees and governments, may prefer marketing that retains national identity. Second and later generation family shareholders may also seek to preserve a company heritage that has a national identity.
Finally, partial shareholders with home country interests, such as employees and governments, should make it harder for a company to make global competitive moves, as these often require sacrifice of home country position, resources, revenues or profits, and hence domestic jobs or working conditions.
The existing literature provides little guidance on the relationship between shareholder interests and global organization. First, even partial shareholders with domestic interests should favor global organization structures so long as the home country is dominant. An exception is that state owners may favor country-based organization structures, or a domestic-international split in order to preserve home country jobs, investment, or influence. A change from national family ownership to foreign or neutral ownership can trigger reorganization toward a global structure. Second, partial shareholders should favor global management processes so long as the home country processes dominate. Third, some types of partial shareholders, especially employees, should make it harder for a company to have global human resource policies, as they will favor the employment and advancement of home country nationals. Finally, firms controlled by family shareholders and domestic employee shareholders may find it hard to create a global culture.
c) Board of directors Boards of directors vary importantly in terms of their structure, composition
and activeness. German boards have a dual structure, with a supervisory board above a management board. The supervisory board has various statutory duties, particularly the appointment of the members of the management board and supervision of their actions. In the UK, most boards adhere to the Cadbury Report’s recommendation of having a non-executive chairman; in the other countries, the roles of chief executive (CEO) and chairman are often combined, especially in the USA. Another aspect of board structure is the role of committees, which varies depending on the strategic leadership of the board.
The composition of boards in major OECD countries varies by both custom and law. British boards have a high proportion, usually a majority, of corporate executives, with very few external directors. On the other hand, British chairmen are typically outsiders. In contrast, US boards mostly have a majority of outside directors, but the chairman is usually an insider, either a past or current chief executive. German supervisory boards are required to have employee representatives, their number and proportion depending on the size of the company. In the other countries, labour representation and participation in firm decision making is rare, except where they are significant shareholders. State owned firms also tend to have higher labour representation.
Countries also vary in the extent to which major shareholders have board representation. In the USA and UK, large institutional shareholders have only very recently sought representation on boards. In contrast, in Germany, and France, it is the norm to have major shareholders, such as banks or institutional investors, sitting on the board. Boards with a majority of directors who represent shareholders are more likely
18
Revista Tinerilor Economişti to globalize and they are less risk averse than boards dominated by nonshareholders because they will be less constrained by non-shareholder interests.
Hence, such firms are more likely to favor globalization strategies, particularly global market participation and global activity location, even if they adversely affect stakeholders. Similarly, such firms are more likely to use global management processes because they will seek value-maximizing behavior more than preservation of traditional, country centered methods.
The insider-outsider split probably has mixed effects on globalization. On the one hand, outsiders (unless they represent special interests) should be able to make the most neutral tradeoffs about the risks involved in globalization. Boards dominated by neutral outsiders should be less risk averse than boards dominated by insiders, because they do not have their shares or job security at stake. Outsider directors are more likely to favor globalization strategies, particularly global market participation and global activity location. On the other hand, insiders typically have motives of empire building and incentive pay to offset any inherent preference for the status quo. Hence, performance evaluation and reward are also critical.
Globalization should be affected by boards having partial members: representatives of employees, network partners, suppliers, customers, governments or non-governmental organizations (NGOs). Partial boards will bias decisions away from pure profit and shareholder value maximization, and hence the optimal globalization strategy, in favor of their particular constituencies. The employee, government and NGO board representatives pose might prevent fully-fledged globalization in order to promote their own interests. In contrast, representation of major shareholders, provided they have neutral interests, should favor globalization. Generally speaking, the other things being equal, neutral boards will be more likely to favor the right globalization strategies.
It seems that globalization strategies will be most facilitated by having boards that have neutral interests favoring shareholder value.
d) Top management teams Top management teams vary across countries in terms of their mobility and
their background. In general, we expect that top management teams comprising mobile, professional managers are more likely to globalize. The more important distinction is whether the top management team acts in a fiduciary as opposed to an autonomous basis.
Top managers with lifetime employment in the firm are more likely to act as fiduciaries for stakeholder interests and be more conservative about globalization. Similarly, those top managers who view themselves as professional managers rather than as specialists in a function are also more likely to make the balanced assessments needed for globalization. It is expected that companies with mobile, professional top management team will favor all elements of global strategy and organization, and adopt the most aggressive globalization strategies.
e) Governments Governments can intervene in a business in two main ways: - first, they set the general rules and regulatory regimes that apply to all
companies in a country or all companies within a given category. These rules and regimes also typically distinguish between domestic and foreign firms, and between domestic activities and foreign activities. For example, there may be general rules about the export of jobs and the import of foreign labour, or about the closing of operations;

19
Finances - Accounting - second, governments may intervene in individual cases, such as whether to
allow a particular company to be sold to a foreign buyer. Governments have many interests to motivate their behavior. In the case of
globalization, the two most important interests are probably the enhancement of national competitiveness and the preservation of employment. Both interests are likely to conflict with corporations’ free pursuit of globalization, especially in the short term. In general, corporations seek to ignore country considerations if at all possible in their globalization decisions, while national governments will inherently seek to intervene in favor of their country.
Countries differ in the degree to which their governments intervene in the affairs of corporations, for ideological, political and legal reasons.
The relationship between interventionist governments and global strategy is also important. Interventionist governments are more likely to encourage global market participation so long as jobs are not exported.
They will also prefer exports as the mode of market participation rather than the setting up of overseas subsidiaries. They should in theory favor the development of globally successful products and services. In practice, protection often, but corporations to locate activities globally outside the home country, usually to preserve employment.
Even liberal governments, such as that of the USA, can discourage some global relocation. Although they will probably be neutral as to whether domestic corporations use global as opposed to national marketing, such governments may have a slight preference for preserving aspects of national identity. Interventionist governments should make it harder for a corporation to make global competitive moves, as these often require sacrifice of home country position, resources, revenues or profits, and hence domestic jobs or working conditions.
As for the relationship between interventionist government and global organization, protectionist governments should:
- favor global organization structures so long as the home country is dominant; - favor global management processes so long as the home country processes
dominate; - make it harder for a corporation to have global human resources policies, as
they will favor the employment and advancement of home country nationals; - make it harder for a corporation to implement a global, rather than home
country, culture.
Conclusion The above analysis underlines that strong roles for each corporate governance's
actor predict particular globalization models. Besides, in order to understand corporate behavior such as globalization strategies, it is necessary to comprehend the dynamics of the different actors related to the firm: employees, shareholders, the board of directors, top management teams, and government.
When firms need to grow, managers have different diversification choices. If they choose to tap into other markets through geographical diversification, then they should be aware of the actor-centered institutional factors that will determine their globalization decisions. Understanding the institutional environment within which firms operate at the national level will allow managers to align the different actors’ interests and capabilities with their own firms’ globalization modes.
20
Revista Tinerilor Economişti To a large extent the corporation’s behavior was described as favoring
globalization – risk taking, willingness to change, long-term maximization of profits and shareholder value and neutrality toward domestic national interests – is also the same as that favoring the long-term health and competitiveness of a nation’s companies. Hence the national corporate governance systems that favor globalization also favor long-term corporate competitiveness.
REFERENCES 1. Aguilera, R.
Jackson, G. The Cross-National Diversity of Corporate Governance: Dimensions and Determinants, Academy of Management Review, 28(3), 2003
2. Daily, C. M. Dalton, D.
Bankruptcy and Corporate Structure: The Impact of Board Composition and Structure, Academy of Management Journal, 37(6), 1994
3. Federowicz, M. Aguilera, R.
Corporate Governance in a Changing and Political Environment: Trajectories of Institutional Change on the Europe Continent , Palgrave Macmillan, London, 2003
4. Gilpin, R. The Challenge of Global Capitalism (The World Economy in the 21st Century), Princeton University Press, New Jersey, 2002
5. Giurcă Vasilescu, L. Giurescu, D.
The Corporate Governance – a Development Challenge for the Romanian Firms, Conferinţa Internaţionala: La un pas de integrare: oportunităţi şi ameninţări, 2-3 iunie 2006, Drobeta Turnu Severin, vol I; pag. 578-585,
6. Hall, P. A. Soskice, D.
Varieties of Capitalism: The Institutional Foundations of Comparative Advantage, Oxford University Press, Oxford, 2001
7. Morgan, G., Kristensen, P. H. Whitley, R.
The Multinational Firm. Organizing Across Institutional and National Divides, Oxford University Press, Oxford, 2001
8. Rugman, A.M. The End of Globalization, Random House Business Books, London, 2000
9. Shleifer, A. Vishny, R.
A Survey of Corporate Governance, Journal of Finance, volume 52, 1997 pp.737-783
10. Westney, D. E. Zaheer, S.
The Multinational Enterprise as an Organization, The Oxford Handbook of International Business, Oxford University Press, Oxford, 2001
21
Finances - Accounting
BETWEEN THE CONTROL PERCENTAGE AND INTEREST PERCENTAGE IN ASSURING A FAIR
IMAGE OF THE GROUP OF ENTITIES
Assoc. Prof. Ph.D Sorinel Domnişoru Lect. Ph.D Valeriu Brabete Assist. Ph.D Student, Daniel Goagără University of Craiova, Faculty of Economics and Business Administration
Abstract: At present, in Romania, the organizational-functional-juridical entity – the group of entity – perceived as an economical reality with an importance that competes with one of the individual entity, in the sense that we orientate our attention over the general acceptation adopted according to it “group capitalism” represents only another way to express the same economical truth.
Keywords: consolidation, integration, group of entity.
The establishment of a economic group entity, from the beginning based on the advantage of the existence of favorable juridical conjunctures and of some proper financial procedures and techniques, less vulnerable and more performing, is oriented towards a generous goal objective, the control of an ensemble of independent entities from juridical point of view and the placement of those under only one unit decision. The goal of achievement of this desideratum is to create a homogeneity in the realized activity, as well as the exceeding of the eventual disadvantages generated by the appearance of some outsized structures almost inherent in case of a company in a continue expansion.
At present, in Romania, the organizational-functional-juridical entity – the group of entity – perceived as an economical reality with an importance that competes with one of the individual entity, in the sense that we orientate our attention over the general acceptation adopted according to it “group capitalism” represents only another way to express the same economical truth. The groups of entities express in this way a more and more present reality in the Romanian contemporary business environment, and the processes to establish groups have a considerable ampleness and reunite a varied scale of economical sectors where they act. The ascendant progressive trend is kept by the big industrial, commercial, banking groups (some times with an organizational and functional composite), quoted on exchange.
The existence of the decision unit at which the group notion responds involve a dependent upon relation between the coordination structure (group leader) and the other juridical entities of the group, dependence that has the following forms1:
Dependence upon financial nature, that results by holding a majority of voting rights in the general shareholders gathering, this being able to be directly obtained, by
1 V. Munteanu, A. Ţurcan - Grupurile de societăţi. Consolidarea contabilă, Ed. Economică, Bucureşti, 1998.

22
Revista Tinerilor Economişti holding more than 50% of voting rights, or indirectly, by interposing a juridical entity (or more) with an intermediary placement as right of control upon other entity.
Dependence upon managerial nature, that is assured by holding a majority in the administration council, managerial board, a.s.o., this dependence generating, for example, in the absence of manifested existence of an financial control, or the distribution of shares majority, or the agreement of a partner which does not want to assume administration responsibility.
Dependence upon contractual nature, which takes place by agreement with an associate entity (exclusiveness, succession or undertaking contract), or with some of its shareholders (agreement expressed by voting designation of administrators, a.s.o.)
Continuing on this line, we cannot omit the group entities building specific in case of Germany. This one is remarked by the existence and manifestation with success of the contractual dependence, very developed and with an extended application field (it can also be the result of the existence in the entity statute of some statutory clauses).
From the diversity of manifestation forms of between associate relations perspective, the group is, therefore, first of all an economical reality which primes upon the juridical one. This hypothesis finds its material expression in the facts that on legislative frame enacted in many European Union member countries, it does not recognize the juridical group personality.
The integration process of international concepts and norms of financial-accountant nature which vise the group of entity, especially the International Financial Report Standards (IFRS 3 particularly), presumes, at Romanian accountant referential level, an ensemble of mutations qualitative and quantitative nature with impact upon so-called integration.
Such mutations also vise the concepts of inclusion and exclusion from consolidation perimeter afferent to a group structure, fundamental concepts upon the methodology of determination and interpretation of the percentages of control and interest.
The determination of the exercised type of control creates the premises to establish the force reports that can be established between the group entities. To reflect the control nature it is necessary to recalculate the control percentage owned by the dominant entity, considering the dependence connection between this one and the other companies. The nature of dependence connections, direct or indirect, corresponds before all holding of voting rights which allow control exercise. In this sense, it is necessary the utilization of an instrument which allows power appreciation: control percentage.
This power appreciation must not be confused with financial dependence connection which results from holding a part of company capital, dependence which measures with help from another instrument called interest percentage.
To point out the role and the way in which those percentages find their utility in frame of consolidation process we will try a comparative approach of them, with underlining each of them specific.
Thus, while the control percentage represents the consolidating company capacity to control, directly or indirectly, a company susceptible to enter in consolidation perimeter, being calculate based on voting rights, without considering the
23
Finances - Accounting capital percentage (the quota of capital participation)2, the interest percentage corresponds to the share that the mother company holds, directly or indirectly, in the capital of companies from the group. This one is an essential element to achieve the consolidation, because it stays at base of personal capital distribution and of the result between the mother company and shareholders (the interests pertaining to a minority).
Among the share companies, the titles (shares), indifferently that they are liberated or not, have in principle a voting right, but there are also exceptions, namely: • Shares with prior dividends (preferential shares), without voting right • Shares with multiple voting rights • Shares with fractioned voting right
The total control percentage upon a company can be under 100%, of 100% (ordinary shares with simple voting right) or bigger than 100% (resulted by holding ordinary shares, with a single voting right, and nominative shares, with double voting right).
To determine the control percentage to totalize the control percentage hold, in a direct way, by the consolidating company and the control percentages hold by all companies which the consolidating company consolidates in an exclusive way. In exchange, the control percentages hold by the controlled companies in a subjunctive way or under a notable influence must not be retain“3.
The control percentage finds its utility in determination of the consolidation method which can be applied.
In the international vision, we can notice a pronounced lack of convergence on the line of definition and utilization of consolidation methods.
Thus, the international referential defines three fundamental methods: In the exclusive control case – the global integration method In the subjunctive control case – the proportional integration method, as base
processing (reference), or the put in equivalence method, as alternative processing (the other authorized processing)
In the notable influence case – putting into equivalence method. According to the American standards US GAAP, the only consolidation
method is global integration. The proportional integration is not admitted in accounts consolidation as, as a result, in case of participation associations (companies like “joint-venture”) on utilize the put in equivalence method. In a natural way, in case of associated companies, the put in equivalence method is not used as a consolidation method, but as an evaluation method.
Regarding the interest percentage, as a practical determination methodology, for each filiations, it multiplies the holding percentages (hold capital) of each company which constitutes the chain and it totalizes the percentages resulted from different multiplications, for each chain of the filiations.
In the same order of ideas, we consider that it is necessary to relate in detail the participation concept, surprised by hold rights in other companies’ capital point of view, materialized or not in titles which, by creating a durable connection with those, offers the possibility of decisional manifestation in issuing company.
2 This one can be calculate by raport between the voting rights holded in a company and the total number of voting rights of this one. 3 E. Ropert – Nouvelle practique de comptes consolides, Ed. Gualino, Paris, 2000, p.30.

24
Revista Tinerilor Economişti In practice, there are find direct, indirect, mutual and crossing participations,
those typology attracting entailing the necessity to present them in the explicative notes, together with a table of subsidiaries and participations. Thus, in the specialized literature4 got shape more aspects:
In case of direct participation, the control percentage is equal to the voting rights percentage of the mother company in one of its subsidiary.
Voting rights refer to the shareholders right with voting right. In this context, it must consider the shares without voting right which must be excluded from calculation, also the ones with double voting right which must be calculated.
The shares without voting right are specific to the companies that are foreseen with such situation in their statute and proceed from obligations conversion in usual shares, following the approval by shares holders. The number of shareholders without voting right cannot exceed 25% from social capital, according to the international practice.
Shares with double voting right are shares officially quoted held by stable company shareholders which have not give up their rights for at least 4-5 years.
The way we can calculate the shares with double voting right or without voting right can be exemplified like this5:
Case 1. A company M holds 40% of company A’s shares, the only ones that have double voting right. The control percentage (Pc) of M company will be:
40% + 40% Pc = 100% + 40% = 50,7%
Case 2. A company M holds 75% of company A’s shares, but a third of those
are private from the voting right. The control percentage (Pc) of M company will be:
75% - 25% Pc = 100% - 25% = 66,6%
In case of direct participation we can define two situations: The existence of an unique chain, situation in which the control percentage is
determined bearing after bearing, the chain being considered broken when a company is subjunctive controlled or is placed under a notable influence; the interest percentage presumes the multiplication of holding percentages (hold capital) of companies which form the chain.
For example, three entities, placed on a unique chain: In this case, the mother company M holds, in a direct way, a control percentage
of 70% in company A and indirectly in B a 65% percentage because it holds the exclusive control upon A and implicitly will also control B.
4 L. Malciu, N. Feleagă – Reglementare şi practici de consolidare a conturilor, Ed. CECCAR, Bucureşti, 2004, p.26. 5 C. Iacob, D. Goagără – Contabilitatea societăţilor de grup, Ed. Sitech, Craiova, 2005, p.89.
65% M A B
70%

25
Finances - Accounting If between the three entities presumed before we admit financial connections: In this situation it appears a break in the chain because M company does not
control in an exclusive way the A company. Therefore, the control percentage hold directly in A is of 20%, and indirectly in B is equal to zero.
Regarding the interest percentage, we presume that in the group companies, placed on a unique chain, there are the following connections:
To determine the interest percentage (Pi), it moderates in a successive way the
hold percentages, from where it results: • Pi held by M In A is equal to the hold capital quota, 51% • Pi held by M in B will be equal to 51%*60%=30.6% • Pi held by M in C will be equal to 51%*60%*40%=12.24% Consequently, the participation percentage in a notion different from the
control notion and represents the subordination connection or dependence between the mother company and group companies.
This way of calculation in specific only to direct subsidiaries, without chain breaking.
More chains existence, which presumes the control percentage determination by totaling the control percentages hold directly or indirectly for each of the companies which go before chain subsidiary, with pointing out the control break; interest percentage presumes that for each chain of the filiations it moderates the holding percentages (hold capital) of each company which constitutes the chain and to addition the results percentages for each filiations chain.
Let us presume a more complex connection between four companies, as follows:
In this case, company M exercises a direct control upon A of 80% proportion
and upon C of 15% proportion. In comparison with C it should have the possibility to exercise a direct control through A or trough C. As it can be observed, through C
M A B C 51% 60% 40%
A B M 20% 80%
C
A
B
15%
20%
M 80%
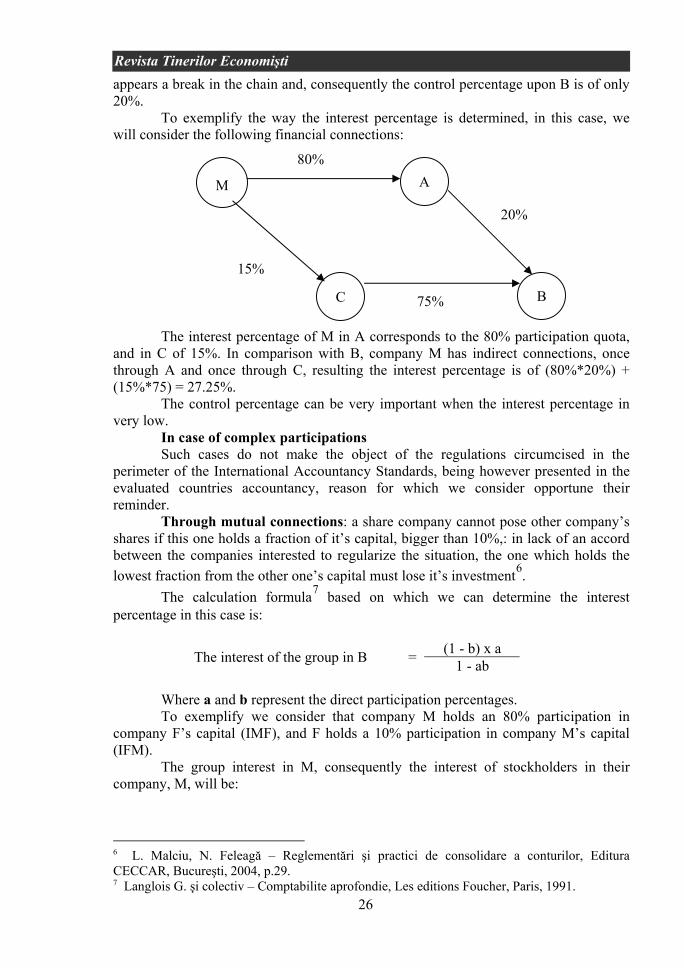
26
Revista Tinerilor Economişti appears a break in the chain and, consequently the control percentage upon B is of only 20%.
To exemplify the way the interest percentage is determined, in this case, we will consider the following financial connections:
The interest percentage of M in A corresponds to the 80% participation quota,
and in C of 15%. In comparison with B, company M has indirect connections, once through A and once through C, resulting the interest percentage is of (80%*20%) + (15%*75) = 27.25%.
The control percentage can be very important when the interest percentage in very low.
In case of complex participations Such cases do not make the object of the regulations circumcised in the
perimeter of the International Accountancy Standards, being however presented in the evaluated countries accountancy, reason for which we consider opportune their reminder.
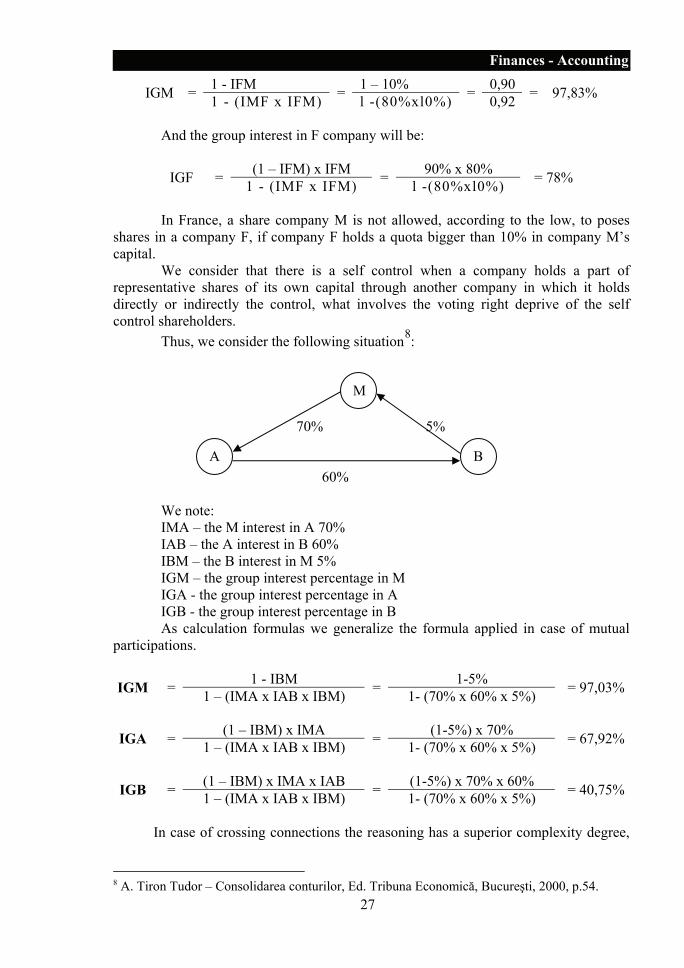
Through mutual connections: a share company cannot pose other company’s shares if this one holds a fraction of it’s capital, bigger than 10%,: in lack of an accord between the companies interested to regularize the situation, the one which holds the lowest fraction from the other one’s capital must lose it’s investment6.
The calculation formula7 based on which we can determine the interest percentage in this case is:
(1 - b) x a The interest of the group in B = 1 - ab
Where a and b represent the direct participation percentages. To exemplify we consider that company M holds an 80% participation in
company F’s capital (IMF), and F holds a 10% participation in company M’s capital (IFM).
The group interest in M, consequently the interest of stockholders in their company, M, will be:
6 L. Malciu, N. Feleagă – Reglementări şi practici de consolidare a conturilor, Editura CECCAR, Bucureşti, 2004, p.29. 7 Langlois G. şi colectiv – Comptabilite aprofondie, Les editions Foucher, Paris, 1991.
80%
A
B
C
15%
75%
20%
M
27
Finances - Accounting 1 - IFM 1 – 10% 0,90 IGM = 1 - (IMF x IFM) = l -(80%xl0%) = 0,92 = 97,83%
And the group interest in F company will be:
(1 – IFM) x IFM 90% x 80% IGF = 1 - (IMF x IFM) = l -(80%xl0%) = 78%
In France, a share company M is not allowed, according to the low, to poses
shares in a company F, if company F holds a quota bigger than 10% in company M’s capital.
We consider that there is a self control when a company holds a part of representative shares of its own capital through another company in which it holds directly or indirectly the control, what involves the voting right deprive of the self control shareholders.
Thus, we consider the following situation8: 70% 5% 60% We note: IMA – the M interest in A 70% IAB – the A interest in B 60% IBM – the B interest in M 5% IGM – the group interest percentage in M IGA - the group interest percentage in A IGB - the group interest percentage in B As calculation formulas we generalize the formula applied in case of mutual
participations.
1 - IBM 1-5% IGM = 1 – (IMA x IAB x IBM) = 1- (70% x 60% x 5%) = 97,03%
(1 – IBM) x IMA (1-5%) x 70% IGA = 1 – (IMA x IAB x IBM) = 1- (70% x 60% x 5%) = 67,92%
(1 – IBM) x IMA x IAB (1-5%) x 70% x 60% IGB = 1 – (IMA x IAB x IBM) = 1- (70% x 60% x 5%) = 40,75%
In case of crossing connections the reasoning has a superior complexity degree,
8 A. Tiron Tudor – Consolidarea conturilor, Ed. Tribuna Economică, Bucureşti, 2000, p.54.
M
A B
28
Revista Tinerilor Economişti fact for which it is necessary, regarding the interest and control percentages determination, to use the matrix calculation and graph theory.
REFERENCES 1. L. Malciu,
N. Feleagă Reglementare şi practici de consolidare a conturilor, Ed. CECCAR, Bucureşti, 2004
2. C. Iacob, D. Goagără
Contabilitatea societăţilor de grup, Ed. Sitech, Craiova, 2005
3. V. Munteanu, A. Ţurcan
Grupurile de societăţi. Consolidarea contabilă, Ed. Economică, Bucureşti, 1998
4. Săcărin, M Contabilitatea grupurilor multinaţionale, Ed. Economică, Bucureşti 2001
5. Săcărin, M. Grupurile de entităţi şi repere ale interpretării conturilor consolidate, Ed. Economică, Bucureşti, 2002

29
Finances - Accounting
WHAT MOTIVATES EMPLOYEES OF BANKING SYSTEM
Prof. Ph.D Popescu Jenica University of Craiova Faculty of Economy and Business Administration Craiova, Romania
Abstract: The relationship between people and their work has long attracted psychologists, behavioral scientists and, also, economic scientists. Early management theories suggested using financial compensation to impel motivation and job performance. The past two decades have seen tremendous growth in the use of goal setting and management by objectives programmers. More recently, cybernetic control, resource allocation, and social-cognitive theories have been used to examine more closely how particular attributes of a goal, a person and a situation influence goal striving and performance.
Keywords: motivation, behavior, job performance, management, needs, surveys, appreciation , productivity, expectancy.
Theoretical background The relationship between people and their work has long attracted psychologists,
behavioral scientists and, also, economic scientists. Researchers’ interests, dating back to the early years of the twentieth century, reflect the development of the financial psychology and vocational guidance disciplines. Their work dealt with measurement of aptitudes and abilities to improve the job-person fit. The study of motivation now forms an integral part of both financial and vocational psychology. However, in both fields, concepts like need, motive, goal, incentive and attitude are appearing with greater frequency than are the concepts of aptitude, ability and skill.
Three assumptions guide contemporary research on human motivation: 1. Motivation is inferred from a systematic analysis of how personal, task and
environmental characteristics influence behavior and job performance. 2. Motivation is not a fixed trait. It refers to a dynamic internal state resulting
from the influence of personal and situational factors. As such, motivation may change with changes in personal, social, economic or other factors.
3. Motivation affects behavior, rather than performance. Initiatives designed to enhance job performance by increasing employee motivation may not be successful if there is a weak link between job performance and an employee’s efforts.
Early management theories suggested using financial compensation to impel motivation and job performance. Personality and learning theories in psychology during the early 1900s led to the development of motivational programmers to enhance performance by creating organizational conditions that matched need satisfaction with on-task efforts. Research on the determinants of choice, from the 1940s through the

30
Revista Tinerilor Economişti 1960s, led to the development of predictive models of workplace behaviors, including turnover.
The rise of behaviorism, emphasized as a means of altering workplace behavior. Behavior modification techniques were then developed to enhance job performance. And job redesign was used to strengthen employee motivation by creating work environments that promoted a sense of achievement, the perception of competence, and autonomy. The past two decades have seen tremendous growth in the use of goal setting and management by objectives (MBO) programs. Thus, modern approaches to motivation may be organized into three related clusters: • personality-based views; • cognitive choice/decision approaches, and • goal/self-regulation perspectives.
Goal/self-regulation frameworks of work motivation emphasize the factors that influence goal striving which focuses on the relationship between goals and work behavior. The idea is that goal setting produces high performance. The basic premises of goal setting theory are that an employee’s conscious intentions (goals) are primary determinants of task-related motivation since goals direct their thoughts and actions. Results of goal/self-regulation research indicate two critical preconditions of a positive goal-performance relationship: acceptance of the goal assignment and provisions for performance feedback. More recently, cybernetic control, resource allocation, and social-cognitive theories have been used to examine more closely how particular attributes of a goal, a person and a situation influence goal striving and performance. These findings suggest that task demands, self-efficacy, goal commitment, and task orientation are important determinants of the effectiveness of goal setting methods.
Cognitive choice/decision approaches of work motivation emphasize two determinants of choice and action: expectations; and subjective valuations of the consequences associated with each alternative. These expectancy value (EV) theories are intended to predict an individual’s choices or decisions. More integrative frameworks have been developed. They incorporate the classic assumptions of EV theories in a broader framework of decision making that includes individual differences in personality and other motivational processes, including self-regulation.
Personality-based perspectives of work motivation provide the aim support of the research reported here. Personality-based views emphasize the influence of enduring personal characteristics as they affect goal choice and striving. One type of personality-based work motivation perspective concerns models based on broad theories of personality. Workplace behavior is posited to be determined by a person’s current need state in certain universal need categories. A second type of personality perspective considers the influence of a small set of psychological motives on behavior and performance. This perspective focuses on the role of individual differences in the strength of achievement motives. Individuals with a high need for achievement are more likely to want and/or select challenging tasks. Other motive theories did not stress individual differences, but rather emphasized the conditions that arouse the motive and its influence on behavior. For instance the arousal of the justice motive occurs when an employee perceives an imbalance in his/her inputs and outcomes relative to others’. Subsequently, the employee may engage in behaviors to reduce the perceived inequity. While these personality-based theories do not necessarily predict motivation or behavior, they can provide a basic understanding of what energizes (motivates) individuals. The main

31
Finances - Accounting strength is the identification of individual needs for the purpose of motivating behavior. By appealing to an employee’s unfulfilled needs, managers may influence performance.
Some theories attempt to modify this hierarchy by reducing the number of need categories. Alderfer found only three levels of need:
1. existence or survival (E); 2. relatedness (R), dealing with social interaction and the external facets of
esteem (recognition and status from others); and 3. growth (G), focusing on the desire to achieve and develop a person’s
potential and the internal facets of ego fulfillment (success and autonomy). Another theory proposes that people are influenced by a need for achievement,
power, or affiliation and that the strength of that particular need will vary according to the situation. Studies have found that employees with a high need for achievement will set higher goals than will those with lower achievement needs.
Another researcher suggested that motivation is composed of two largely unrelated dimensions:
1. job-related factors which can prevent dissatisfaction, but do not promote employees’ growth and development (hygiene); and
2. job-related factors that encourage growth (motivators). Needs for salary, recognition and responsibility, for example, have been shown
to operate both as motivators and as hygiene factors. In general, the theories mentioned here continue to provide the foundation for a
significant amount of organization and management development and training, including work redesign and career development. These work motivation theories are a part of the broad field of human motivation study and have direct implications for individual workplace behavior. Moreover, they may be applied to a variety of management practices aimed at motivating employees.
What motivates employees? At some point during their lives, virtually every person works. Working is so
commonplace that the question, “What motivates people to work?”, is seldom asked. We are much more likely to wonder why people climb mountains or commit suicide than to question the motivational basis of their work. This article attempts to address this matter by asking employees “What factors motivate you in your jobs?” Their responses are particularly applicable to the content motivation theories discussed in the previous section.
Exploring the attitudes that employees hold concerning factors that motivate them to work is important to creating an environment that fosters employee motivation. By the 1930s, employee attitude surveys were being used frequently in business to assess employee morale. In 1949, Bellows reported that employee attitude surveys constituted a useful means for comparing the effectiveness of supervision and as diagnostics for supervisory training. They still are a direct approach to finding out what employees perceive as job-related motivational factors. With the results of surveys presented here, an organization is likely to gain information that can be used by managers to improve employee motivation and employee performance.
Past studies focusing on this topic have noted what employees say motivates them to their best work. These studies date back to the 1940s and sought primarily answers to the question, “Why do workers work?” If a company knows what drives employees to work, it is in a better position to stimulate them to perform well.
32
Revista Tinerilor Economişti In most instances, employee performance is determined by three things: 1. ability; 2. the work environment; and 3. motivation. If an employee lacks ability, appropriate training can be employed. If there is an
environmental problem, altering the environment to promote higher performance is the key. However, if motivation is the problem, the solution is more complex and more challenging. For motivational problems, the best source of information is the employee. Employees must be asked on a regular basis what sparks and sustains their desire to work. Their responses may lead the employer to redesign jobs, increase pay, change the working environment, or give more credit for work done. The key is, however, that managers avoid the assumption that what motivates them, motivates their employees as well.
Over 40 years of surveys For many years researchers administered employee surveys in order to address
the challenge of employee motivation. One of the first surveys was conducted in 1946. It was done by the Labour Relations Institute of New York and reported in Foreman Facts. The subjects included banking system employees. Similar surveys were administered in 1980, in 1990, and in 2002 (reported here).
In 1946, industrial employees were asked to rank ten “job reward” factors in terms of personal preference. At the top of the list (see Table I) was (full) appreciation of work done. At the bottom of the list was (tactful) discipline. In 1980, 200 employees ranked the same ten items presented in the 1946 survey. At the top of the list for employees was interesting work; at the bottom of the list was tactful discipline. In 1990, Kovach (1997) conducted a similar study of 1,000 industrial employees. The list was headed again by interesting work and ended with sympathetic help with personal problems. The present study highlights the importance of good wages. It also confirms the lack of interest in sympathetic help with personal problems.
Table no. 1: The most and least important motivational factors Years Most important Least important 1946 Appreciation Discipline 1980 Interesting work Discipline 1990 Interesting work Personal problems 2002 Good wages Personal problems
In addition to comparing the employees’ factor rankings, the 1990 survey analyzed the employees’ responses by subgroups (e.g. age and income). The underlying assumption was that the motivational potency of the factors might vary according to gender, age, income level, job type and/or organizational level.
Comparisons of the 1946, 1980, 1990 and 2002 research surveys on what motivates employees
The workers surveyed in 1946 came from an environment different from that of workers today. By 1946, America had come out of a depression and had just gone through a relatively labour-intensive war. In the years after the Second World War, the information revolution transformed industries; and the computer industry took on the role that the automobile industry had in the 1920s.
33
Finances - Accounting The leaders in the computer industry were similar to those of earlier industries,
but with one striking difference. Most of them were not, as they had been in the past, entrepreneurs. Instead, they were managerial enterprises – hierarchies of lower, middle and top salaried managerial decision makers. Over these years the industries and economies changed, and so did the workers’ values. By 1980 and 1990, after almost 40 years of relative prosperity, workers had experienced a significant rise in their living standards. By the 1990s, after the acquisitions and mergers of the previous three decades in response to intensified competition, it is not surprising that the importance placed on various motivational factors had changed.
In 1946, the top motivator selected by employees revealed their need to be appreciated for work done, whereas in 1980 and 1990 the top concern was interesting work. By the 1980s, the focus was on changing the job to make it more interesting. A national random sample of 845 jobholders by the Bank of America confirms this. Its findings indicate an impressive shift in attitudes towards work, from work as a means of survival to work as a means of enhancing self-development and self-expression. The importance of interesting work is also supported by Herzberg’s Motivation-Hygiene Theory. His theory posits that employees are motivated by their own inherent need to succeed at a challenging task. The manager’s job, then, is to provide opportunities for people to be motivated to achieve. Herzberg’s survey of US banking employees clearly indicates that about 80 per cent of the factors in satisfying job opportunities come from the intrinsic elements of the job such as achievement, recognition, and the work itself.
The second most important item for employees in 1980 and 1990 was full appre-ciation for work done. Employees are motivated by feedback and recognition for the work they do. Herein lies the problem. Most employers think they know how to express appreciation for a job well done. Yet, research shows that employers seldom acknowledge appreciation for employees’ work; and, when they do, it is done poorly. More than 80 per cent of supervisors claim they frequently express appreciation to their subordinates, while less than 20 per cent of the employees report that their supervisors express appreciation more than occasionally. The three important principles to remember when expressing appreciation are to describe the desired behavior in specific terms, to explain why the behavior was helpful and actually to express thanks. A careful look at the overall employee rankings for 1980 and 1990 implies that organizations were doing an adequate job of satisfying the basic needs of their workers. However, they were not doing such a good job of satisfying their ego or self-fulfillment needs. Thus, the employees ranked factors such as interesting work and full appreciation for work done at the top of the list, and good wages and job security near the middle.
The current survey reflects the opposite. It mirrors the increasing stagnation that employees feel as industry battles to survive in a recession and in the midst of global competition. Clearly the 1990s will provide a significant advantage to those companies which are able to resolve the paradox between organizational size and speed in the marketplace. In addition, the labour cost-cutting strategies of the 1980s left workers very skeptical about satisfying their basic needs, such as wages and job security. They have not recovered from the prevailing activities of that period – hostile takeovers, global competition, organizational transformations and downsizing. That environment placed many workers in a position of insecurity and uncertainty. In such times, the basic needs may resurface as the most important factors. Therefore, good wages and job security head the list of motivational factors for employees in the 1990s.

34
Revista Tinerilor Economişti Sandwiched between good wages and job security is the employees’ concern
about being appreciated for work done. People need to have feedback concerning their work and they need to feel competent. According to the ranking of the motivation factors in this survey, employees may consider good wages to be solid feedback concerning their work as well as a reward for their ability or competence. Rewards, such as wages, that reflect ability may lead to greater intrinsic motivation. This indicates that it is not necessarily the reward itself that determines how people respond, but rather the type of feedback implied by the reward. Thus, extrinsic rewards such as good pay can increase intrinsic motivation if they are perceived as providing information about competence.
Regardless, the respondents to the 2002 survey were more concerned about the extrinsic rewards. Good wages was chosen as the top motivational factor for employees surveyed during those years. Developing more effective incentive programs may be part of the solution for those employees. However, recent survey reports indicate that banking employees would like to have more work incentives. In a survey of banking employees, from managers and professionals to cashiers and salespeople, 95 per cent of them rank a cash bonus as a meaningful incentive.
So far we have looked at the collective responses from the 2002 survey. It is important also to analyze the responses by subgroups (e.g. age, gender, organization level and earnings) to determine if there are variations in the larger respondent group. Not all demographic groups of people place the same importance on each of the ten factors. Individuals at different organization levels, with different earning power, may have different motivational values. Hence what motivates individuals at one level of the organization may not motivate those at another level. This necessitates differentiating by income level and other demographic factors when analyzing attitudes for motivational purposes.
The 2002 survey results according to subgroups Employment status When the responses are analyzed according to employment status, significant
differences are found. A non-parametric test of significance showed that the two groups (full-timers and part-timers) were significantly different in the motivational value placed on working conditions, personal loyalty to employees, and interesting work. Part-timers placed considerably more emphasis on interesting work and more value on good working conditions. The full-timers placed more value on personal loyalty to employees as a motivational factor.
Gender When the responses of men and women were analyzed, significant differences
were found in their motivational preferences. A non-parametric test of significance revealed that the means – and resulting rankings – of males and females were statistically different for working conditions, appreciation for work done, and interesting work. Women placed greater importance on appreciation for work done. They also placed more importance on good working conditions. The males, on the other hand, placed more emphasis on interesting work.
Age group Five age groups were analyzed (under 26; 26-34; 35-44; 45-54; and 55 and over).
The analysis of this subset showed that no two groups were significantly different. The rankings of the motivational factors were very similar among this subgroup. For

35
Finances - Accounting example, all ages, except the 55 and over age group, decided on good wages as their first choice. Since this difference is not significant, we can generally conclude that good pay is an important motivator regardless of age.
Income When the responses were analyzed by annual income, significant differences
were found in the motivational preferences of employees. The income groups were: • Group 1: <EUR 14,999; • Group 2: EUR 15,000-24,999; • Group 3: EUR 25,000-34,999; • Group 4: EUR 35,000-49,999; and • Group 5: EUR 50,000>. The means and resulting rankings among the different income levels were
statistically different for working conditions and sympathetic understanding of personal problems, respectively.
Two groups, the lower income group (group 1) and the middle-incomers (group 3), differed significantly in the values placed on good physical working conditions. The middle-incomers considered working conditions to be less important than did the lower income group.
The middle-incomers (group 3) also were significantly different in the motivational value placed on “sympathetic understanding of personal problems”. While the means for group 1, group 2 and group 3 resulted in similar rankings, analysis of the group means revealed significant differences. According to the means, those with lower incomes placed more value on understanding of personal problems than did those in the middle income group.
Occupation A comparison of the six occupational groups showed significant
Differences on three factors: the feeling of being in on things; interesting work; and a sympathetic understanding of personal problems. The occupational groups included salespersons, professionals, cashiers and managers.
Compared to the salespersons, the managers placed considerably more importance on the feeling of being in on things. Interesting work was another variable for which there were significant differences between the groups. First, the means of the managers and professionals were significantly different. The professionals valued interesting work much more highly than did the managers. Second, the means of cashiers and four others in the subgroup (professionals, managers and salespersons) were significantly different. The cashiers placed less value on interesting work than did the other four groups.
Sympathetic help with personal problems was the last variable, which resulted in significant differences among the occupational categories. The two pairs of groups with significantly different means were professionals and cashiers and managers and cashiers. The cashiers placed significantly more motivational value on help with personal problems than did the professionals and managers. According to the professionals’ and managers’ means and resulting rankings, this variable was the least important in getting them to do their best work.
Recommendations for management The most striking result of the current survey is the clear indication of money
and job security as motivators. Today, the economic circumstances of employees are

36
Revista Tinerilor Economişti very different from those of earlier years. More than ever before, the standard of living and the employment future of the worker are in jeopardy. Therefore, regardless of employment status, gender, age, income or occupational category, employees seem to be of one accord. They want what they feel is slipping away from them and what they seem to be getting less and less of from their companies: money and job security.
Because employees overall expressed the importance of pay as a motivator, an effective compensation program is critical. The primary motivating factor that an effective compensation program provides is the psychological effect on the individual. It is not the material value of the reward, but the boost in self-esteem that public recognition associated with monetary compensation affords. This also holds true with the matter of job security. Security encompasses more than the employees’ financial needs: it relates to their physical, emotional and familial wellbeing. Often, job security is associated with job loss. However, the population of insecure employees is larger than that of those who lose their jobs. Insecurity is an intrarole transition engendered by changes in a person’s assumptions about self, the organization and the environment. It is not an event having a clear temporal onset and ending. Job insecurity includes concerns over the loss of a job (employment insecurity) as well as concerns about changing job content.
In the early 1980s, organizational downsizing came into prominence. Between one-third to one-half of all medium-size to large firms in Western Europe downsized during the 1980s and 1990s. More than 70 per cent of senior managers in downsized companies said that morale, trust and productivity suffered after downsizing, and many other managers indicated that productivity deteriorated after downsizing. Ultimately, downsizing highlights the extent to which job security and productivity are intimately interwoven. Organizational downsizing has had a negative effect on job security and productivity. Job security which affects the employees’ economic and psychological wellbeing must be properly incorporated into the company’s compensation program. This can contribute positively to overall employee morale and productivity.
Clearly, employees need reassurances about job security, salary raises, promotions and the health and stability of their company. However, they place high value also on full appreciation for work done. Articles on “how to motivate” employees seem to substantiate this. Several articles indicate the importance of raising employees’ personal and professional self-esteem by recognizing their contributions. One survey revealed that a quarter of workers would quit their jobs to move to a company known for giving praise and recognition. Some authors popularized a technique for giving feedback and praise. The need to feel appreciated is deeply ingrained in all employees. Being appreciated through praise helps employees develop a positive self-concept and it meets their needs for esteem, self-actualization, growth and achievement. Therefore, employers should show appreciation and give employees credit for their work. Praise for a job well done is probably the most powerful, yet least costly and most underused, motivation tool.
In most organizations recognition is reserved on the positive side for only a very small minority of super-achievers and on the negative end, for the problem employees. But, the average workers are frequently overlooked. In fact, these workers’ efforts – on which the daily operation of the entire business truly depends – often go unrecognized. Managers must realize that recognition or appreciation for work done can have positive motivational effects for all employees and that all employees should be recognized for the work they do.

37
Finances - Accounting Appreciation for work done may be manifested in the company’s growth and
development opportunities. These opportunities can be supported by flexible scheduling, a promotion-from-within policy, and recognition and rewards for workers’ improvements and contributions. Flexible work scheduling allows workers the freedom to pursue more training or an advanced degree. A commitment to filling positions from inside the organization provides opportunities for cross-training or promotions. Moreover, recognition and rewards for workers’ contributions strengthen a company’s reputation for caring about its employees’ professional development.
Conclusions Motivation is the number one problem facing business today. Over the past 40
years there have been numerous surveys on what motivates employees to do their best work. In order to attain to high levels of performance, employers depend on their employees to perform at levels that positively affect the bottom line. Thus, they must understand what motivates them. Such an understanding is essential to improving productivity and, ultimately, to ensuring the success of the company. For this reason, employee surveys may be used to gain insight to employees’ job motivation preferences. Often the strongest potential motivators are the things employees’ value, but lack. If managers adequately and regularly administer such surveys, and appropriately consider their results, companies and employees would gain a great deal. Perhaps companies would gain a competitive advantage through motivated, productive employees and the employees would gain the work-related rewards they value.
The respondents to this survey ranked as the top five factors that motivate them in their jobs:
1. good wages; 2. full appreciation for work done; 3. job security; 4. promotion and growth in the organization; 5. interesting work. These factors reflect the current state of affairs in terms of employee needs and
imply that reward systems and job redesign strategies – to name a few – may be used to reinforce and to motivate employees to exhibit productive behaviors. While controversy persists, pay or good wages is generally valued by all employees, regardless of gender, occupation, age, income or employment status. Since the 1946 study, good wages continues to be ranked among the top five factors that motivate people in their jobs. Its value may best be understood in terms of the different needs employees have. With respect to the Hierarchy of Needs Theory, pay is an important reward because it may satisfy several of the needs in the hierarchy. It provides employees with the means to purchase items which satisfy their physiological needs, and it enables them to meet their esteem needs, since it is one measure of relative worth.
Recognition of a job well done or full appreciation for work done is often among the top motivators of employee performance, and involves feedback. Positive feedback follows the principles which states that behavior is contingent on reinforcement. Examples of positive reinforcement in this context may include workplace visits by top executives to high-performance employees, personal handwritten notes of thanks accompanying paychecks, and telephone calls by top executives to employees at home.
As a result of workforce reductions becoming commonplace in this country, job security is of increasing importance to employees. Employees’ reactions to the lack of

38
Revista Tinerilor Economişti job security vary. Individuals may experience severe psychological reactions to job loss and/or the threat of job loss. Low self-esteem, low self-confidence, social isolation, anxiety and powerlessness are examples of possible psychological reactions. These reactions extend beyond actual job losers to their partners and other family members. They also affect the organization. For example, not only is work commitment weakened by job insecurity, but, organizational effectiveness can deteriorate as well. Thus, outcomes of job insecurity are usually negative. To counteract such outcomes, companies often use reward strategies. Compensation strategies, career development schemes, and outplacement techniques may accompany workforce reduction efforts. These are intended to arouse positive psychological states that encourage and sustain productive, rather than destructive, behavior.
Promotion and growth in the organization and interesting work are longstanding factors that motivate people to do their best work. The most successful method of motivating is to build challenge and opportunity for achievement into the job itself. Moreover, other theories suggest that people with high achievement needs are motivated by challenging tasks with clearly attainable objectives, timely feedback and more responsibility for innovative assignments. Thus, both factors (promotion and growth in the organization and interesting work) often are addressed through job redesign. The aim of job redesign is to enrich a job so that the employee is more motivated to do the work. Job redesign tenets may be found in contemporary management strategies, including employee involvement and empowerment. Workers who are more involved in their jobs display more work commitment and experience lower turnover.
Workers who are more involved in job-related decisions and communications, receive reinforcement that they are competent in their jobs, and they respond by showing greater involvement and motivation. With regard to empowerment, several factors must be present before employees can feel empowered. They must believe that their work is being performed competently and that their work is having a positive impact on the company. Also, it is important for employees to feel that they control their own actions.
Finally, this article investigated employees’ attitudes concerning their preferences among ten “job reward” factors. The results here are supported by numerous other research studies indicating that monetary compensation, recognition, job security, upward mobility potential, individual growth and a sense of accomplishment are all important and enduring factors in a worker’s analysis of the motivational facets of a job. In addition, the employees’ responses to this present survey correspond to content theories. According to the content theories, managers must consider employees’ needs to provide the appropriate motivation strategies. Managers must understand the relationship between behaviors and their consequences in order to arrange contingencies that reinforce or discourage desirable or undesirable behaviors, respectively.
The results reveal also that the job-related factors that motivate employees change over time and may vary significantly across subgroups. Over more than 40 years since the first survey, employees’ responses to the same ten factors have changed. Moreover, the motivational value placed on each factor may vary according to employment status, gender, income and occupation.
Additional research should be done to gain a continuous view of what motivates people to do their best work. The ability to motivate subordinates is critical to every manager’s job. Demographic changes in the workplace, as well as technological
39
Finances - Accounting advances and globalization, only accentuate the need to continue to determine what motivates people to perform well. A motivated workforce can make powerful contributions to the profits of a bank. Thus, managers would do well to review this and other articles that examine employees’ job-related motivation preferences.
REFERENCES 1. Blanchard, K.
Johnson, S. The One-Minute Manager, Morrow, New York, 1992.
2. Chandler, A.D. Jr
Managerial enterprise and competitive capabilities, Business History, Vol. 34 No. 1, January 1992, pp. 11-41.
3. Cherrington, D.J.
Follow-through on award programmes, HR Magazine, Vol. 37 No. 4, April 1992, pp. 2-55
4. Herzberg, F. Workers’ needs: the same around the world, Industry Week, 21 September 1997, pp. 29-30, 32
5. Kovach, K.A. What motivates employees? Workers and supervisors give different answers, Business Horizons, Vol. 30 No. 5, September-October 1987, pp. 58-65
6. Leibman, M. Weinstein H.P.
Money isn’t everything, HR Magazine, Vol. 35 No. 11, November 2000, pp. 48-51.
7. Nicholson, N., Schuler, R., Van De Ven, A.H., Cooper, G. Argyris, C.
Encyclopedic Dictionary of Organizational Behavior, Blackwell Ltd, Oxford, 2003, pp. 330-9.
8. Sekaran, U. Paths to the job satisfaction of bank employees, Journal of Organizational Behavior, Vol. 10 No. 4, October 1999, pp. 347-359

40
Revista Tinerilor Economişti
CONSTITUENT DIMENSIONS OF CUSTOMER SATISFACTION: A STUDY OF NATIONALISED
AND PRIVATE BANKS
Lect. Ph.D Jitendra Kumar Mishra, Prestige Institute of Management&Research, Indore, India
Abstract: Satisfaction of the customers is invaluable asset for the modern organizations, providing unmatched competitive edge. It helps in building long-term relationship as well as brand equity. The best approach to customer retention is to deliver high level of customer satisfaction that result in, strong customer loyalty. Satisfaction being a judgment, that a product or service feature or the product or service itself, provides a pleasurable level of consumption related fulfillment, is dynamic in nature. It is the result of interplay of a number of factors, which vary from one product/service category to another. Present study is aimed at exploring the determinant factors and hence developing dimensions of customer satisfaction for nationalized and private banks. Two-stage factor analysis was computed to arrive at the dimensions of customer satisfaction. The study revealed ten factors and five dimensions of customer satisfaction for nationalized and private banks respectively.
Keywords: customer satisfaction, private amd public banks.
Introduction Banks play a very important role in the economic development of every
modern state. Banks operate at the heart of the modern economy. Traditionally, banking had been restricted from private participation in India and public sector banks had been enjoying complete protection. This scenario has changed since 1990. The decade of 90s witnessed a sea change in the working of banking in India. Technology made tremendous impact by introducing ‘anywhere banking’ and ‘anytime banking’. The financial sector now operates in a more competitive environment than before and involves relatively large volume of international financial flows. In the wake of greater financial deregulation and global financial integration, the biggest challenge before the public sector banks is to match the market requirement rather than being promoted by Government or regulator. Foreign banks and the new private banks have embraced technology right from the inception of their operations and therefore, they have adapted themselves to the changes in the technology easily. Deregulation, liberalization and globalization have produced intense competition in banking industry resulting into declining margins in traditional businesses, increased cost pressures and greater risks. Market positioning, cost of intermediation and service delivery are likely to be determinants of the efficiency of banks with respect to their competitiveness. In the changed environment creating new customers and retaining the existing ones have become difficult tasks for banks. To meet the competition, creating satisfaction of customers has become primary objective of each bank.

41
Finances - Accounting Customer satisfaction is the valued outcome of a good business practice.
According to Drucker (1954), the principle purpose of a business is to create satisfied customers. Increasing customer satisfaction lead to higher future profitability (Anderson et al., 1994), lower costs related to defective goods and services (Anderson et al., 1997). Higher satisfaction increases willingness of buyers to pay price premiums, provide referrals, and use more of the product (Reichheld, 1996; Anderson and Mittal, 2000), and finally results into higher levels of customer retention and loyalty (Fornell, 1992; Anderson and Sullivan, 1993; Bolton and Rath, 1998). Increasing loyalty further increases future revenue (Fornell, 1992) and reduces in the cost of future transactions (Reichheld, 1996; Srivastava et al., 1998). A firm’s future profitability depends on satisfying customers in the present and retained customers are viewed as revenue producing assets for the firm. Improved customer satisfaction need not entail higher costs, in fact, improved customer satisfaction may lower costs due to a reduction in defective goods, product re-work, etc. Customer satisfaction and retention that are bought through price promotions, rebates, switching barriers, and other such means are unlikely to have the same long-run impact on profitability as, when such attitudes and behaviors are won through superior products and services (Anderson and Mittal, 2000).
A review of the existing literature indicates a wide variance in the definitions of satisfaction. The lack of a consensus definition limits the contribution of consumer satisfaction research. Customers may explain their satisfaction with a product or service in terms of specific aspects such as the product attributes, price, customer service, or a combination of these different features. (Yi, 1990) identified multiple studies conceptualizing satisfaction as an outcome resulting from a consumption experience while others conceptualize it as an evaluation of a consumption process. When a consumer claims to be satisfied with the product or service, he means that he likes the way it has performed in use. Satisfaction attitudes are retrospective evaluations of the product, based on experience. Hunt (1977) argued that consumer satisfaction with a product refers to the favorableness of the individual’s subjective evaluation of the various outcomes and experiences associated with buying or using it.
The present study is an attempt to explore the determinant factors of customer satisfaction with special reference to nationalized and private banks. The study further attempts to provide dimensions of customer satisfaction for the two categories of banks. Perception of customers regarding the services used by them was taken as a measure of satisfaction in the study.
Method The Study: The study was exploratory in nature carried out to find out factors
determining customers’ satisfaction in nationalized and private banks. The Sample: A total of hundred respondents constituted the sample for the
study. Fifty were customers of nationalized banks and fifty were customers of private banks. The average age of respondents was 36 years with the lowest of 28 years and highest of 46 years.
Data Collection: For data collection, a scale comprising of thirty items on a five point Likert scale was developed after reviewing the relevant literature.
Data Analysis: Data analysis was carried out in following three stages: In first stage, item to total correlation was carried out on the responses of both
the categories of customers. On the basis of results of item to total correlation two items in the responses of customers of nationalized bank and three items in the responses of

42
Revista Tinerilor Economişti customers of private bank were found to be insignificant (at 5% level of significance) and hence, dropped. In stage two factor analyses was carried out on the remaining items. In stage three, second order factor analysis was carried out to identify the dimensions of customers’ satisfaction of the customers of two categories.
Results The factor analysis of the responses of customers’ of nationalized banks
resulted into ten factors, which are as under: Factor 1. Vigilance: It emerged as the factor with highest factor load 3.41 and
variance 22.2 percent. Items underlying this factor were Value Added Sservices (SMS alert and e-mail alert) (0.77), courteous behavior of the bank staff (0.76), professional interface with customers (0.67), appealing facilities (0.62) and easy approachability of executives (0.59).
Factor 2. Competence: It was found to be the factor with second highest factor load 3.36 and variance 9.8 percent. It comprises of the items, customer service as identity of bank (0.83), good reputation (0.61), additional benefits (0.59), proper attention to customers (0.47), less paper formalities (0.0.44), and customized services (0.41).
Factor 3. Advancement in Services: It had factor load 2.50 and variance 7.3 percent. It comprises of the items, state of art technology (0.82), processes consuming less time (0.58), frequent upgradation of services (0.56) and banks name as promise to reliability (0.55).
Factor 4. Flexibility in use of services: It had emerged as fourth factor with total factor load 2.02 and variance 8.8 percent. Its constituent variables were net banking (0.78), financial soundness (0.74) and availability of ATMs at different locations (0.50).
Factor 5. Reliability: It was the fifth factor with factor load 1.77 and variance 4.4 percent. Constituents of reliability were sincere care for the security of assets (080.), informing customers before rejection of cheques (0.52), less complexity in the working (0.45).
Factor 6. Vision: It had factor load 1.40 and variance 5.4 percent. It was comprised of long-term vision (0.81) and issuing of cheques as per requirement of the customers (0.58).
Factor 7. Responsiveness: It had factor load of 1.35 and variance 7.3 percent .It was constituted of promptness regarding customers’ quarries (0.81) and proper maintenance of ATMs (0.54).
Factor 8. Reach: It had factor load 1.37 and variance 4.2 percent. It was constituted of two factors, network of the bank in all the major cities (0.82) and accuracy of the banks’ system (0.55).
Factor 9. Cost effectiveness: It had total factor load of 1.26 and variance 4.9 percent. It included price leadership (0.0.75) and less charge on making Demand Drafts (0.52).
Factor 10. Efficient process: It was comprised of faster clearing of cheques/Demand Drafts and had factor load 0.87 and variance 3.9 percent.
The factors determining customer’s satisfaction from private banks are as under:
Factor 1. Service Quality: It had factor load 3.31 and variance 11.4 percent. It was comprised of professional interface with customers (0.78), customer service as

43
Finances - Accounting identity of bank (0.72), frequent upgradation of services (0.67), state of technology (0.62) and accuracy of bank system (0.53).
Factor 2. Reliability: It had factor load 2.97 and variance 8.4 percent .It was comprised of financial soundness (0.80), net banking and phone banking facilities (0.60), good reputation (0.55), sincere care for the security of assets (0.55) and appealing services (0.47).
Factor 3. Competence: It had factor load of 2.30 and variance 19.2 percent. It was comprised of additional benefits (0.82), price leadership (0.74) and less paper formalities (0.73).
Factor 4. Efficient Process: It had factor load 1.97 and variance 6.8 percent. It was comprised of lesser time consuming processes (0.77), courteous behavior of bank staff (0.69) and faster clearing of cheques/Demand Drafts (0.51).
Factor 5. Customization: It had factor load of 1.97 and variance 5.0 percent. It was comprised of customization of products/services (0.82), easy approachability of executives (0.63) and informing customers before rejection of cheques (0.51).
Factor 6. ATM Facility: It had factor load of 1.58 and variance 9.0 percent. It was comprised of proper maintenance of ATMs (0.81) and availability of ATMs at different locations (0.77).
Factor 7. Vision: It had factor load of 1.48 and variance 5.5 percent. It was comprised of long-term vision (0.74) and promptness regarding quarries (0.72).
Factor 8. Vigilance: It had factor load of 1.40 and variance 4.3 percent. It was comprised of Value Added Services (SMS alert and e-mail alert) (0.85) and proper attention to the customers (0.54).
Factor 9. Simplicity of System: It was comprised of the only item, less complexity in the working with factor load of 0.91 and variance 3.8 percent.
Factor 10. Brand Image: It included the only item, banks name as promise to reliability with factor load of 0.88 and variance 4.1percent.
Dimensions of Customer Satisfaction: The second order factor analysis resulted into five dimensions for both the nationalized and private banks. Dimensions of customer satisfaction from nationalized banks being; Service Orientation, Diligence, Adherence, Value for Money and Amiability.
Service Orientation: It comprises of three factors with total factor load 2.00 and variance 16.8 percent. Factors constituting Service Orientation were Flexibility in use of services (0.81), Vision (0.65) and Competence (0.54).
Diligence: It comprises of two factors with total factor load 1.58 and variance 14.2 percent. Factors constituting diligence were Vigilance (0.79) and Reliability (0.79).
Adherence: It comprises of two factors with total factor load 1.49 and variance 13.2 percent. Factors constituting Adherence were Reach (0.80) and Responsiveness (0.69).
Value for Money: It comprises of two factors with total factor load of 1.39 and variance 10.1 percent. Factors constituting Value for Money were Cost Effectiveness (0.84) and Efficient Process (0.55).
Amiability: It comprises of the only factor Advancement in Services with factor load 0.84 and variance11.6 percent.
Dimensions of Customer Satisfaction from Private Banks Dimensions of customer satisfaction in private banks are as under:

44
Revista Tinerilor Economişti Commitment: It comprises of three factors with total factor load of 1.89 and
variance 10.2 percent. Factors constituting Commitment were Customization (0.79), Brand Image (0.55), and Vision (0.55).
Service orientation: It comprises of two factors with total factor load of 1.55 and variance 18.2 percent. Factors constituting Service Orientation were Service Quality (0.84) and Efficient Process (0.71).
Value for Money: It comprises of two factors with total factor load of 1.48 and variance 13.9 percent. Factors constituting Value for Money were ATM Facility (0.87) and Competence (0.61).
Dependability: It comprises of two factors with total factor load of 1.44 and variance 11.4 percent. Factors constituting Dependability are Reliability (0.85) and Simplicity of System (0.59).
Diligence: It comprises of the only factor Vigilance with factor load 0.82 and variance10.2 percent.
Discussion The study revealed that the first dimension of customer satisfaction for
nationalized banks was Service Orientation but, for private banks Service orientation appeared as second dimension. It clearly indicates that customers of nationalized banks give more importance to Flexibility in Use of Services, Vision and Competency. It is because, the nationalized banks had a rigid system and redtapeism due to restriction on private participation in banking by government and absence of competition in market. Customers of nationalized banks had not been given much importance by the executives. As the nationalized banks were enjoying monopoly, it resulted in expectation of the customers for higher customer’s orientation. On the other hand customers of private banks had been offered these services right from the beginning therefore, they perceive it to be usual. It supports the theory that confirmation/disconfirmation of pre consumption expectations is the essential determinant of satisfaction (Oliver, 2000). Further, customers expect fundamentals, not fanciness; performance, not empty promises (Parashuraman et al., 1991). The customers of private banks expect Service orientation in terms of service quality and efficient processes.
Second dimension of customer satisfaction for nationalized banks was Diligence. For private banks diligence appeared as fourth dimension. It indicates that Customers at nationalized banks give relatively more importance to alertness and professional interface of banks with customers. It was also perceived as important by the customers of private bank but they ranked it below the customers of nationalized banks. The Nationalized banks are undergoing technological upgradation and adding new features to their services, which the customers find new and convenient resulting into higher level of satisfaction. The role of customers at nationalized banks is also changing with restructuring of the services and technological up gradation. The customer’s expectation is partly shaped by their belief that they are performing their role well in service delivery and hence feel satisfied (Seiders and Berry, 1998).
Third dimension of customer satisfaction for nationalized banks was Adherence. Thus, it shows that customers of nationalized banks expect services of the banks to be convenient in terms of timing and places. Being associated for long time with the nationalized banks customers consider the limitation of the system and causes for the inconvenience they face. Thus, their satisfaction remains higher even though
45
Finances - Accounting they receive poor services as compared to the services offered by their counter parts at private banks. The perceived causes of events influence perception of satisfaction of the customers( Folkes, 1988).
Fourth dimension of customer satisfaction for nationalized banks was value for money. For private banks it appeared as third dimension above dependability and diligence. It points out the difference in cost of the services offered by nationalized and private banks. Customers of nationalized banks were found to be satisfied in terms of price they pay for the services while the customers at private banks were satisfied with the services but perceived the cost to be high and hence, ranked value for money as an important dimension for the customer satisfaction. The customer satisfaction with a product or service is influenced by the consumer evaluation of product or service features (Oliver, 1997). Customer of services may trade-offs among different service features Price level Vs quality Vs friendliness of personal Vs level of customization) and this value for money is an important dimension of customer satisfaction form banking services (Ostron and Iacobucci, 1995).
Fifth dimension of customer satisfaction for nationalized banks was Amiability. Thus, it implies that technological advancement and upgradation of the services are resulting into better processes together with reliability of nationalized banks due to their longer existence and government undertaking. It was taken in positive sense and had been assigned responsible for creating satisfaction. Bolton (1998) has provided evidence that the duration of a relationship builds strength so that long-term customers ignore service mishaps. Customers behave rationally taking into account the future utility based on past and current experience, which may be modified by new information. Customers with long periods of experience with an organization weigh their cumulative satisfaction more heavily so that an instance of unsatisfactory experience can more easily be discounted as an exception (Bolton and Ruth, 1998).
Private banks had two dimensions, Commitment and Dependability, uncommon with that of the nationalized banks. As the private banks are newer in terms of their operation in India, and were positioned as superior to the nationalized banks, customers expect customized services, consistency and long-term vision from the private banks. Customers further expect reliability and simplicity in the system at private banks. Because of short association with private banks customers and higher commitment for services customers’ expectation remain high. New customers who experience bad service are more inclined to assume that their experience is typical and feel dissatisfied. There is little impact on the duration of the customer relationship from superior service and this difference leads to a mental accounting phenomenon in which negative experience has more influence on choice than the equivalent positive experience (Bolton and Ruth, 1998; Thaler and Richard, 1985).
Conclusion The study has revealed ten factors and five dimensions of customer satisfaction
for nationalized banks and private banks each. The constituent factors of customers’ satisfaction for nationalized banks were Vigilance, Competence, Advancement in Services, Reliability, Vision, Responsiveness, Reach, Cost Effectiveness and Efficient Process. The dimensions of customers’ satisfaction for nationalized banks were, Service Orientation, Diligence, Adherence, Value for Money and Amiability. The determinant factors of customers’ satisfaction for private banks were Service Quality, Reliability, Competence, Efficient Process, Customization, ATM Facility, Vision, Vigilance,

46
Revista Tinerilor Economişti Simplicity of System and Brand Image. The dimensions of customers’ satisfaction for private banks were Commitment, Service orientation, Value for Money, Dependability, and Diligence.
Implications The factors and dimensions that have emerged in the study provide an insight
of constituents of customer satisfaction for the banking services in general and for nationalized and private banks in particular. Based on the understanding developed by the study higher level of customer satisfaction can be created through designing appropriate communication, training of internal customers and offering the services in effective manner. The study should be replicated on larger sample across the category of services and respondents demographic variables such as gender, age, occupation, income, education and geographic area, for developing a comprehensive model of customer satisfaction.
REFERENCES 1. Anderson, Eugene W.
and Sullivan, Mary W.
The Antecedents and Consequences of Customer Satisfaction for Firms. Marketing Science, 16(2), 1993
2. Anderson, Eugene W. and Mittal, Vikas.
Strengthening the Satisfaction-Profit Chain. Journal of Service Research, 3(2), 2000
3. Anderson, Eugene W., Fornell, Claes. and Lehmann, Donald R.
Customer Satisfaction, Market Share, and Profitability: Findings from Sweden. Journal of Marketing, 58(3), 1994
4. Bolton, Ruth N. A Dynamic Model Of The Duration Of Customer's Relationship With A Continuous Service Provider: The Role of Satisfaction. Marketing Science, 17 (1), 1998
5. Bowen, David Leadership Aspects and Reward Systems of Customer Satisfaction. Speech given at CTM customer Satisfaction Conference, Los Angeles, March 17, 1989.
6. Drucker, Peter F., (1954)
The Practice of Management, New York: Harper & Row. Finn, Adam and Ujwal Kayandé. Reliability Assessment and Optimization of Marketing Measurement. Journal of Marketing Research, 34(2), 1997
7. Folkes, Valerie S. Recent Attribution Research in Consumer Behavior : A Review and New Directions, Journal of Consumers Research, 14, 1988
8. Fornell, Claes A National Customer Satisfaction Barometer: The Swedish Experience. Journal of Marketing, 56(1), 1992
9. Hunt, H. Keith. CS/D – Overview and Future Research Direction. In Conceptualisation and Measurement of Consumer Satisfaction and Dissatisfaction, Hunt, Keith, H. ed.

47
Finances - Accounting Cambridge, MA: Marketing Science Institute, 1997
10. Ostrom, Amy and Iacobucci, Dawn
Consumer Trade-Offs and the Evaluation of Services. Journal of Marketing, 59, 1995
11. Parasuraman, A., Berry, Leonard, L. and .Zeithaml, Valarie, A.
Understanding Customer Expectations of Service, Sloan. Management Review, 32(3), 1991
12. Anderson, Eugene, W., Fornell, Claes., and Rust, Roland T.
Customer Satisfaction, Productivity, and Profitability: Differences Between Goods and Services. Marketing Science, 16(2), 1997
13. Reichheld, Frederick The Loyalty Effect, Cambridge, MA: Harvard Business School Press, 1996
14. Rust, Roland T., Zahorik, Anthony J. and Keiningham, Timothy, L.
Service Marketing, HarperCollins, New York, 1996
15. Seiders, Kath Leen and Berry, Leonard L.
Service Fairness. What it is and Why it Matters. Academy of Management Executive, 12(2), 1998
16. Selnes, Fred An Examination of the Effect of Product Performance on Brand Reputation, Satisfaction and Loyalty. European Journal of Marketing, 27(9), 1993
17. Srivastava, Rajendra K., Shervani, Tasadduq A. and Fahey, Liam
Market-Based Assets and Shareholder Value: A Framework for Analysis. Journal of Marketing, 62(1), 1998
18. Thaler, Richard Mental Accounting and Consumer Choice. Marketing Science, 4, Summer, 1985
19. Yi, Youjae A critical Review of Customer Satisfaction. Review of Marketing, ed. V.A. Zeithaml, Chicago, American Marketing Association, 1990
48
Revista Tinerilor Economişti
PERFORMANCE MEASUREMENT - THE BALANCED SCORECARD PERSPECTIVE
Ph.D Student Gică Oana Adriana Assist. Ph.D Student Moisescu Ovidiu Ioan Babeş-Bolyai University Faculty of Economics and Business Administration Cluj-Napoca, Romania
Abstract: The transition from the industrial to the informational age sets new rules of competition. The competitive success is based more and more on the intangible assets like skills, systems and values. Companies are finding that performance measurement systems that worked in the past are not effective in this new context. There is a need for performance measurement systems linked to the strategy that combines financial indicators of the past performance with the drivers of future success. The Balanced Scorecard translates a firm’s strategy in a comprehensive set of performance measures in four perspectives: financial, customer, internal processes, learning and growth.
Keywords: performance measurement, Balanced Scorecard.
Introduction The old adage “You can’t improve what you can’t measure” is certainly true for
firms. A report by the Conference Board of Strategic Performance Management in 1998 found that companies using performance measurement were more likely to achieve leadership positions in their industry and were almost twice as likely to handle a major change successfully (B. L. Adams, 2003). Firms need to develop an entire system of meaningful performance measures to become and then remain competitive (Wisner et al., 2005, pg.433).
Peter Drucker (in Niven, 2002), suggests that few factors are as important to the performance of an organization as measurement, and measurement is among the weakest areas in management today. In today’s highly competitive environment and due o the rapid changes that occur, organizations need to devote significant time, energy, and human and financial resources to measuring their performance in achieving strategic goals.
Although measuring performance requires the substantial effort and high costs, a 2001 survey by the American Institute of Certified Public Accountants and Lawrence S. Maisel, found that only 35 percent of respondents rated their performance measurement systems as effective or very effective.
Increasingly, organizations are reaching the conclusion that while measurement is more crucial than ever, their systems for capturing, monitoring, and sharing performance information are critically flawed. While the methods of modern business have transformed dramatically over the past decades, the systems of measurement have remained firmly mired in the past.
49
Finances - Accounting Most performance measures used by firms today continue to be the traditional
cost-based and financial statistics reported to IRS and to shareholders in the form of annual report, balance sheet and income statement data. These systems were perfectly suited in the industrial era, but they are ill-equipped to capture the value creating mechanisms of today’s modern business organization. Intangible assets such as employee knowledge, customer and supplier relationships, and innovative cultures are the key to producing value in today’s economy. According to a survey implemented by the Institute of Management Accountants’ Cost Management Group, only 6 percent of its members were using customer satisfaction as an organizational performance measure (Wisner et al., 2005, pg.433).
The Characteristics of an Effective Performance Measurement System The role of strategy is more important today than it has ever been. The
necessity of effectively executing strategy is crucial in an era of globalization, customer knowledge, and rapid change. But the sobering fact is that about 9 out of 10 organizations fail to implement their strategies.
What is needed is a measurement system that balances the historical accuracy and integrity of financial numbers with today’s drivers of economic success, and in so doing allows the organization to beat the odds of executing strategy.
Performance measurement provides the link between strategies and action. Inappropriate measures lead to actions incongruent with strategies, however well formulated and communicated. Appropriate measures should provide and strengthen this link, and both lead to attainment of strategic goals and impact on the goals and strategies needed to achieve them (Dixon et al., 1990). Effective performance measurement systems link current operating characteristics to these long-term strategies and objectives (Wisner et al., 2005, pg.433).
As many of the world’s businesses respond to increased competitive pressures by attempting to develop and maintain a distinctive competitive advantage, the need to develop effective performance measurement systems linking firm strategy to operating decisions increases. Performance criteria that guide a firm’s decision making to achieve strategic objectives must be easy to implement, understand, and measure; they must be flexible and consistent with the firm’s objectives; and they must be implemented in areas that are viewed as critical to the success of the firm. Thus, an effective performance measurement system should consist of the traditional financial information for external reporting purposes along with tactical-level performance criteria used to assess the firm’s competitive capabilities while directing its efforts to attain other desired capabilities. Finally, a good performance measurement system should include measure of what is important to customers. These measures will vary by company and through time as strategic changes occur to the firm, its products.
Creating an effective performance measurement system involves the following steps ( Nicholas, J.,M.,1998; Wisner & Fawcett,1991):
- identify the firm’s strategic objectives; - develop an understanding of each functional area’s role an the required
capabilities for achieving the strategic objectives; - identify internal and external trends likely to affect the firm and its
performance over time; - for each functional area, develop performance measures that describe each
capabilities;

50
Revista Tinerilor Economişti - document current performance measures and identify changes that must be
implemented; - assure the compatibility and strategic focus of the performance measures to be
used; - implement the new performance system; - periodically reevaluate the firm’s performance system as competitive strategies
change. A feature of the leading organizations is that they successfully use performance
measurement not only to obtain information and to make judgments about the organization and the effectiveness and efficiency of its programs, processes, and people, but also they use performance measurement to drive improvements and successfully translate strategy into action (The Procurement Executives’ Association, 2006, pg.3).
Various groups including the National Partnership for Reinventing Government and the Center for Advanced Purchasing Studies suggest the following attributes of a successful performance measurement and management systems (The Procurement Executives’ Association, 2006, pg.6-8):
• A conceptual framework is needed for the performance measurement and management system. Every organization needs a clear and cohesive performance measurement framework that is understood by all levels of the organization and that supports objectives and the collection of results.
• Effective internal and external communications are the keys to successful performance measurement. Effective communication with employees, process owners, customers, and stakeholders is vital to the successful development and deployment of performance measurement and management systems.
• Accountability for results must be clearly assigned and well-understood. High-performance organizations clearly identify what it takes to determine success and make sure that all managers and employees understand what they are responsible for in achieving organizational goals.
• Performance measurement systems must provide intelligence for decision makers, not just compile data. Performance measures should be limited to those that relate to strategic organizational goals and objectives, and that provide timely, relevant, and concise information for use by decision makers—at all levels—to assess progress toward achieving predetermined goals. These measures should produce information on the efficiency with which
resources are transformed into goods and services, on how well results compare to a program’s intended purpose, and on the effectiveness of organizational activities and operations in terms of their specific contribution to program objectives.
1. Compensation, rewards, and recognition should be linked to performance measurements. Performance evaluations and rewards need to be tied to specific measures of success, by linking financial and nonfinancial incentives directly to performance. Such a linkage sends a clear and unambiguous message to the organization as to what’s important.
2. Performance measurement systems should be positive, not punitive. The most successful performance measurement systems are learning systems that help the organization identify what works—and what does not—so as to continue with and improve on what is working and repair or replace what is not working.

51
Finances - Accounting 3. Results and progress toward program commitments should be openly shared
with employees, customers, and stakeholders. Performance measurement system information should be openly and widely shared with an organization’s employees, customers, stakeholders, vendors, and suppliers.
Ix The Balanced Scorecard and the Measurement of Performance Developed by Robert Kaplan and David Norton, the Balanced Scorecard allows
an organization to translate its vision and strategies by providing a new framework, one that tells the story of the organization’s strategy through the objectives and measures chosen. Rather than focusing on financial control devices that provide little in the way of guidance for long-term employee decision making, the Scorecard uses measurement as a new language to describe the key elements in the achievement of the strategy. The use of measurement is critical to the achievement of strategy.
In his book, Making Strategy Work, Timothy Galpin notes “measurable goals and objectives” as one of the key success factors of making strategy work. While the Scorecard retains financial measures, it complements them with three other, distinct perspectives: Customer, Internal Processes, and Learning and Growth.
Organizations around the globe have rapidly embraced the Balanced Scorecard and reaped swift benefits from its commonsense principles: increased financial returns, greater employee alignment to overall goals, improved collaboration, and unrelenting focus on strategy, to name just a few. To reap those rewards, however, an organization must possess the tools necessary to craft an effective Balanced Scorecard.
The concept of balance is central to this system, specifically relating to three areas ( Niven, 2002, pg 22- 23):
1. Balance between financial and nonfinancial indicators of success. The Balanced Scorecard was conceived to overcome the deficiencies of a reliance on financial measures of performance by balancing them with the drivers of future performance.
2. Balance between internal and external constituents of the organization. Shareholders and customers represent the external constituents expressed in the Balanced Scorecard while employees and internal processes represent internal constituents. The Balanced Scorecard recognizes the importance of balancing the occasionally contradictory needs of all these groups in effectively implementing strategy.
3. Balance between lag and lead indicators of performance. Lag indicators generally represent past performance (customer satisfaction, revenue) that are objective and accessible but lack predictive power. Lead indicators are the performance drivers that lead to the achievement of the lag indicators. They often include the measurement of processes and activities. On-time delivery might represent a leading indicator for the lagging measure of customer satisfaction. A Scorecard should include a mix of lead and lag indicators. Lag indicators without leading measures do not communicate how targets will be achieved. Conversely, leading indicators without lag measures may demonstrate short-term improvements but don’t show whether these improvements have led to improved results for customers and ultimately shareholders. Kaplan and Norton (Kaplan and Norton,1996) describe the steps in the design
of a balanced performance management system:
52
Revista Tinerilor Economişti 1. Translate strategy into action – the top management team has to translate the
strategy into specific objectives. Financial objectives must be set and then customer, internal processes and core competences necessary to achieve those objectives have to be established. After a consensus on the long-run objectives is obtained, specific operational measures should be selected.
2. Select linked measures – every measure selected should be linked to a strategy. There should be a cause-and- effect relationship in the chain from learning and growth, to processes, to customers and to financial performance.
3. Link financial objectives to life cycle – the design of a scorecard must begin with the identification of the organization’s life cycle as the financial objectives differ depending on the stage of this life cycle.
4. Select a mix of customer measures – to be successful, companies must focus on customer needs, so they have to select a mix of generic and custom measures. The generic measures mostly used by companies are: market share, customer retention, customer acquisition, customer satisfaction, customer profitability. The custom measures should focus on product/service attributes, customer relationship, and image and reputation.
5. Focus internal processes on meeting expectations - the focus should be on customers and shareholders not on making incremental improvement to current operations.
6. Focus on investments for the future - to achieve long-term success on the financial, customer and internal processes of the BSC, firms must invest in people, systems and procedures. Regarding the employees, firms measure employee satisfaction, employee retention, employee productivity an employee skills. Firms must invest in systems to ensure that employees have all the information about customers. Procedures must ensure a positive organizational climate that motivates employees to act in the best interest of the firm.
Conclusion In an era of globalization, customer knowledge, and rapid change, the
successful implementation of strategy plays a crucial role. A performance measurement system is needed to link the strategy with the action and it must include a balanced set of measures linked to the organization’s strategy.
A sustainable competitive advantage, in the new economy, is based more on the intangible assets like skills, systems and values than on physical and financial capital. The Balanced Scorecard provides managers with the instrumentation they need to navigate to future competitive success. It translates the organization’s mission and strategy into a comprehensive set of performance measures. The BSC complements financial measures of past performance with the measures of drivers of future performance.
REFERENCES 1. Adams, B. L. Performance Measures and Profitability Factors of
Successful African-American Entrepreneurs: An Exploratory Study, Journal of American Academy of Business , no.2 ,2003
2. Dixon, J. R., Nanni, The New Performance Challenge: Measuring
53
Finances - Accounting A. J., Vollman, T. E.
Manufacturing for World Class Competition, Homewood, IL: Dow Jones-Irwin,1990
3. Galpin, Timothy J. Making Strategy Work, Jossey Bass Inc,1997 4. Kaplan, R.,
Norton, D. Translating Strategy into Action- The Balanced Scorecard, Harvard Business School Press, Boston, 1996
5. Nicholas, J., M. Competitive Manufacturing Management, Mc Graw-Hill, New York,1998
6. Niven, Paul R.
Balanced Scorecard Step-by-step – Maximizing performance and Maintaining results, John Wiley & Sons, Inc., 2002
7. Wisner, J., D., Fawcett, S.,E.
Linking Firm Strategy to Operating Decisions Through Performance Measurement, Production and Inventory Management Journal, no.3, 1991
8. Wisner, Joel D., Keong Leong, G., Tan, Keah-Choon
Principles of Supply Chain Management: a Balanced Approach, South-Western, Thomson Corporation, Mason, Ohio, 2005
9. The Procurement Executives’ Association
Guide to a Balanced Scorecard Performance Management Methodology, http://professionals.pr.doe.gov/ma5/MA-5Web.nsf/d152596b6fe7366485256a5d005a2259/7363e1ab1e5a429a85256ae80042cb6d/$FILE/BalancedScorecardPerfAndMeth.pdf

54
Revista Tinerilor Economişti

55
Management – Marketing - Tourism
THE FORMING SYSTEM IN ROMANIAN PUBLIC ADMINISTRATION
Lect. Ph.D Cristina Manole Assoc. Prof. Ph.D Colesca Sofia Elena Academy of Economic Studies Faculty of Management Bucharest, Romania
Abstract: In the context of the Romanian public administration reform, the continuous formation of human resources becomes a solid background. In order to implement all continuous forming programs and realizing the public administration reform objectives there is needed the establishment of the priority problems and the time horizon they must be approached in. All these aspects are mentioned, detailed in the following article.
Keywords: Forming system, public administration, human resource management.
The forming system represents the total activities and the corresponding structure regarding initial and continuous formation of public servants, meaning the conceptual, methodological and didactical support, in order to realize the forming strategies. This system’s construction offers an overall image of all mechanisms and forming methods, emphasizing their coherence and efficacy. Actually, the knowledge transfer, know-how and/or experiences essentially orient this system as follows:
- the knowledge transfer consists of the mobilization of general or specialized knowledge needed to be accumulated with priority;
- know-how means detailed knowledge of means and necessary methods needed to develop current activities;
- experiences appeal to active participation during the forming program, regarding the possibilities transfer in order to act. The architecture of the forming system appears to be extremely diverse and
specialized, consisting of the following aspects: 1. The compulsory forming levels; 2. Forming cycles including the program frames; 3. Forming centers (national and local forming network)
The compulsory forming levels The successive scanning of compulsory forming levels is materialized in
proficiency recognition, needed to access and promote in the public servant career. These levels are presented as follows:
Level 1: forming before conscription, generally realized in an organized environment, based on knowledge development, usually corresponding to the high school or specialized university studies. This forming level corresponds to the forming need of potential public servants.
Level 2: general initial forming corresponds to the realization of basic administrative education which gives to the public servant the possibility to master

56
Revista Tinerilor Economişti basic vocabulary knowledge as well as public institutions and authorities structures and a series of concepts connected to the reform process of public administration. The target group consists of potential public servants, as well as debutante public servants without an initial specialized formation.
The first two levels can be put together and can address to existing and future public servants, whose initial forming is different from the legal sciences or public administration.
In this case, initial forming in the mentioned fields becomes compulsory and must assure the indispensable professional re-conversion for public servants that held a leading position or high public servants. This project will be realized by the INA by specialized forming programs, lasting two years, conceived as post-university forming programs with professional disposition, dedicated to future public servants, and by accredited universities by post-university academically studies in the public administration field, lasting for two years, especially dedicated to the public servants holding leading positions and high public servants without initial specialized qualification.
Level 3: Post-conscription forming in order to adapt to the position, which means reading and learning the details mentioned in the job description, and underlying the attributions derived from it, upon legislation, methods and specialized practice as well as understanding the decisional and organizational processes specific for the public service. This forming level is especially conceived for debutante public servants, not matter their initial knowledge.
Level 4: The continuous forming regards trying to make the professional practice perfect, the periodical actualization of knowledge, methodology and law fundaments. Continuous formation is especially conceived for all public servants and is realized according to their career plan and the public service exigency.
The forming cycles The formation cycles (3 – 5 years) consist of frame programs, elaborated and
commonly approved by the trainers and the trainee. Such frame programs correspond, on short term, to a perfection program, and it regards, on annual sequence, the themes presented in table 1.
All forming cycles have a logic sequence according to the career plan of each public servant, putting together the forming route specific for the public service.
Table 1 Frame 1 Frame II Frame III Frame
IV – V Actualization of specialty knowledge 30–35% 25–30% 20–25% 15–20% Assimilating managerial aptitudes 10–15% 20–25% 30–35% 40–45% General problems of the public sector 20–25% 15–20% 15–20% 10–15% European integration 15–20% 20–25% 20–25% 20–25%
Other 15% 10% 5% 5%
The forming centers The structure of the forming system is given by the I.N.A. and by the eight regional centers for continuous forming in the local public administration. The main evolution
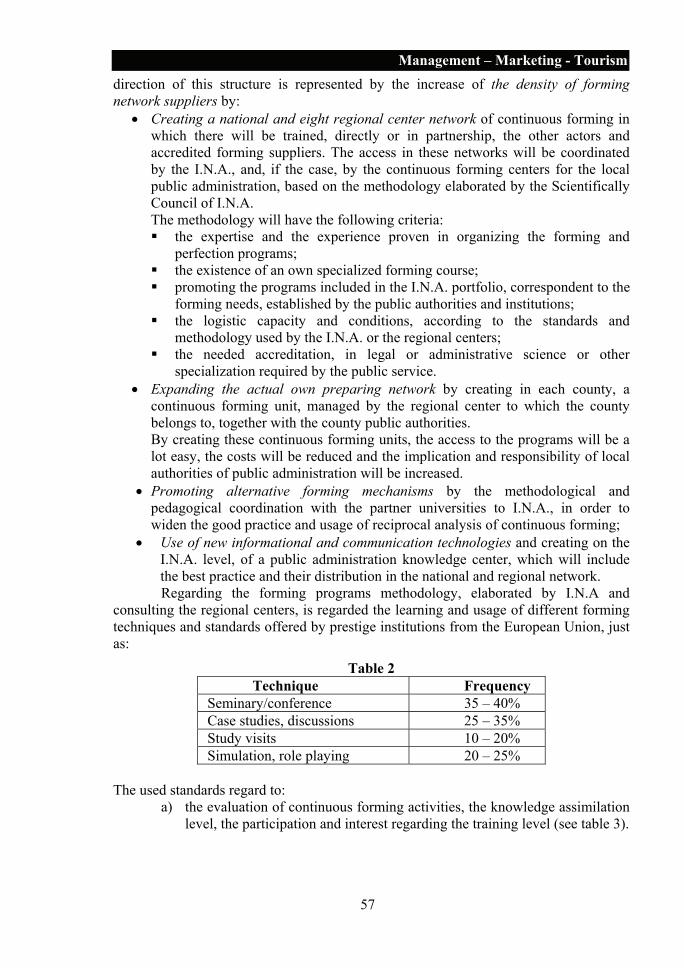
57
Management – Marketing - Tourism direction of this structure is represented by the increase of the density of forming network suppliers by:
• Creating a national and eight regional center network of continuous forming in which there will be trained, directly or in partnership, the other actors and accredited forming suppliers. The access in these networks will be coordinated by the I.N.A., and, if the case, by the continuous forming centers for the local public administration, based on the methodology elaborated by the Scientifically Council of I.N.A. The methodology will have the following criteria: the expertise and the experience proven in organizing the forming and
perfection programs; the existence of an own specialized forming course; promoting the programs included in the I.N.A. portfolio, correspondent to the
forming needs, established by the public authorities and institutions; the logistic capacity and conditions, according to the standards and
methodology used by the I.N.A. or the regional centers; the needed accreditation, in legal or administrative science or other
specialization required by the public service. • Expanding the actual own preparing network by creating in each county, a
continuous forming unit, managed by the regional center to which the county belongs to, together with the county public authorities. By creating these continuous forming units, the access to the programs will be a lot easy, the costs will be reduced and the implication and responsibility of local authorities of public administration will be increased.
• Promoting alternative forming mechanisms by the methodological and pedagogical coordination with the partner universities to I.N.A., in order to widen the good practice and usage of reciprocal analysis of continuous forming;
• Use of new informational and communication technologies and creating on the I.N.A. level, of a public administration knowledge center, which will include the best practice and their distribution in the national and regional network. Regarding the forming programs methodology, elaborated by I.N.A and
consulting the regional centers, is regarded the learning and usage of different forming techniques and standards offered by prestige institutions from the European Union, just as:
Table 2 Technique Frequency
Seminary/conference 35 – 40% Case studies, discussions 25 – 35% Study visits 10 – 20% Simulation, role playing 20 – 25%
The used standards regard to:
a) the evaluation of continuous forming activities, the knowledge assimilation level, the participation and interest regarding the training level (see table 3).

58
Revista Tinerilor Economişti Table 3
General criteria Specific criteria Percentage in final
evaluation Active participation and the interest in learning
Attendance to forming activities; Consistency and frequency of all interventions.
30 – 35%
Team work and the position inside the team
Relations with other participants; Assuming the leading position. 20 – 25%
The level of accumulation for the new knowledge and abilities
Testing results; proof of accumulated abilities. 40 – 45%
b) the participants’ evaluation of forming activities, forming methodology, as
well as means of communication (see table 4). c) the evaluation of INA performances, of regional centers and of other
forming suppliers. This type of evaluation regards reaching the established forming levels, coverage of all themes and necessary capacity required by the authorities and public institutions, together with obtaining the quality standards for the preparing process of public servants;
Table 4 General criteria
Specific criteria Percentage in final
evaluation Adequate forming methods
Usage degree for the new technologies; Methodological diversity. 30 – 35%
Exposure clarity Approaching the announced themes; Time sufficiency. 30 – 35%
Reaching formative objectives
Understanding the forming content; Clarifying the new concepts and approaches. 30 – 35%
Behavior The type of public and collaboration relationships 10 – 20%
d) the evaluation of beneficiaries’ satisfaction regarding formation (public
servants), reported to the mission of public authorities they are part of, as well as the individual career plans.
By the forming methodology is also taken to consideration the insurance of a unitary formation system support by creating a quality standard system for didactic materials, under the I.N.A. expertise. Considering each type of continuous forming program, the content of the didactic materials must have the pattern of a minimal curriculum, representing 75% of the total forming activities. In order to establish this minimal curriculum, I.N.A., together with the other formation actors will take into consideration the European field activity as well as the knowledge level, managerial and specialty aptitudes, required by the public service.
59
Management – Marketing - Tourism An essential aspect in ensuring the efficiency in the forming system consists in
the trainers’ formation. On the I.N.A. level, but also on the regional centers there will be constituted a
trainer’s body, upon professional criteria, that will put together the individual, theoretical and methodological expertise with the experience specific to public administration professionals.
In conclusion, inside the public servants corpse can enter specialists and practitioners from the central and local administration, teachers, and experts in the superior teaching institutes or from continuous formation centers inside the country or from abroad, together with trainers prepared in international projects or by the I.N.A., or regional or department centers.
The corpse will have expertise degree hierarchy, similar to the practice used by some institutions of the European Union, and will be structured on forming levels covering the immediate and future needs, regarding the supplying of continuous forming programs.
Regarding the building of a corps of professionals in the formation field, there is necessary to be followed the next stages:
• widening the selection and formation base of trainers used in the INA promoted programs and/or regional centers;
• elaborating selection criteria and strengthening the own testing and trainers evaluation system, such a manner that it will ensure the complete coverage of forming needs;
• establishing the best report between the theoretical content and the practical content of the formation, putting more accent upon the most relevant practical aspects and promoting good practice techniques in public servants’ activity;
• conceiving and promoting a stimulation system regarding the payment of the trainers’ activity.
The annual initial and continuous forming capacity for the public servants can only be touched by the implication in the forming system of other fore mentioned actors, who will ensure equivalent forming programs, offered by the same trainer or by different trainers, in the following conditions:
• the trainers have a well-known expertise for the field they activate in; The well-known expertise is based on the professional evolution and on the personal career accomplishments of all trainers, depending the environment they come from: university, central and local administration, institutions specialized in training programs, etc. During the build-up of the trainers’ corpse, on the INA level or usually on the regional levels, the expertise will be recognized as belonging to this corpse.
• the forming supplier is temporary authorized or accredited, according to the Romanian law and holds the necessary logistic conditions for the program to be performed. The temporary authorization and accreditation are concepts used in the Romanian superior teaching institutes and will be taken to consideration, especially in the long-term programs. There can also be taken to consideration the authorizations and accreditation obtained by international

60
Revista Tinerilor Economişti cooperation or by especially constituted by INA and ANFP (The National Institute for Administration and the National Agency of Public Servants).
• the forming and evaluation methods are compatible and they ensure the flowing process of the program at the same exigency level; The forming programs addressed to the public servants have something specific, needing the usage of new information and communication technologies, as well as complex evaluation systems, capable to emphasize the formative aspects and the resulted managerial skills, as a result of the attendance to the program.
• the duration of the programs is the same; Reported to the type of the offered program, the same duration supposes the same number of hours dedicated to didactical and application activities, meaning the same number of teaching hours, applications or other direct activities, like the individually assisted study.
• the content of the programs is similar and answers the forming needs for a certain public service, ensuring the best report between theoretical and practical applications; This condition imposes the existence, in the total content of the program, of some modules ensuring the minimal curriculum passage, finalized by obtaining the same level of theoretical and formative knowledge.
In the general economy of some equivalent programs, the minimal curriculum should cover 70 – 75% of their content.
The other activity existent in the program will be connected to the specialization, having the possibility to be optional, this way ensuring a wider vision upon the problems existing in the public administration.
For the executive public servants, there are created equivalent programs, according to the mentioned period and expertise conditions, and the professional training programs for the specialty of the position they hold.
Also, in the same mentioned conditions, equivalent programs can be considered the programs realized during international projects dedicated to institutional building of public administration structures, etc.
In table 5, there can be observed the equivalent program types, the target groups to which they are addressed, the forming suppliers, and also the means of attesting the knowledge:
Table 5 Programs Target group Forming
suppliers Equivalent programs
Confirmation of the
preparation The specialized forming program for public administration lasting 2 years.
Licensed youths in universities, not older than 30 years; public servants with license in other fields (reconversion)
INA; Universities; European forming institutions.
Post-university Academic studies, lasting 2 years; Post-university studies on long term, developed in European institutions for
INA Diploma; Postuniversity study diploma granted by MECT; Diplomas from European institutions for public

61
Management – Marketing - Tourism
Programs Target group Forming suppliers
Equivalent programs
Confirmation of the
preparation public administration forming.
administration forming.
The specialized forming program for public administration lasting for one year.
Actual and future leading position public servants.
INA; University; European forming institutions.
Master programs in public administration organized by the profile universities.
INA diploma – master; Master diploma given by the MECT
Post-university specializing programs lasting minimum 180 hours.
Public servants for operational leadership (office manager, service manager).
INA; Regional centers cooperating with profile universities.
Post-university specializing programs organized by the profile universities.
INA diploma; Post-university specialization diploma given by MECT.
Mastering programs in public administration, lasting between 3 days and 3 months
- All public servants and contractual servants from central and local public administration, no matter the position they hold (executive or managerial).
INA for high public servants and medium leadership servants; CRFCAPL for leading public servants in operational leadership.
Post-university programs organized by profile universities; Master programs for specific public administration fields organized by schools and forming centers of ministries and central institutions;
INA certificate Post-university certificate given by the MECT; Master certificates given by the ministry schools.
Seminaries and conferences, lasting from one to 3 days.
All public servants or contractual servants.
INA; CRFCAPL; NGO’s.
Seminaries and conferences on different themes from the public administration field.
Participation proofs.
In order to implement all continuous forming programs, and to finish all public
administration reforms, there is the need of establishing the problems by their priority and the time horizon for their approach, as follows: A) on short term :
62
Revista Tinerilor Economişti
• the elaboration and promotion of forming programs corresponding to the forming levels one and two, and also to those corresponding to the professional re-conversion;
• identifying the forming needs revealed by the Country Report 2003, and ensuring the formative support for the public servants part of the privatization process, agricultural reform, administrative and legal reform, local development and project management;
• building the trainers corpse and establishing the calendar regarding its proficiency;
• building, together with the ANFP, the back-up corpse for the young public servants and the initiation of some prior forming activities need for them;
• identifying the financial and operational mechanisms for the logistic and conceptual support of the continuous forming strategy for the public servants;
• elaborating standards and unitary evaluation criteria regarding forming in the public administration field, according to the European practice;
• conceiving and defining the forming routes for each type of public service. B) on medium term:
• the consolidation of the continuous forming system for public servants and making all its segments operational;
• creating the necessary capacity in order to form according to the Public Servants Status;
• conceiving and implementing forming programs for the European integration of the public servants reported to their part and position in the process of adherence to the European Union;
• starting forming programs in the European Administration especially created for youths, meant to prepare specialists who will ensure the interface between the central and local administration and the European institutions;
• projecting and developing the forming activities regarding the support in the prefecture corpse’s proficiency;
• integrating in specific proficiency programs of high public servants; • creating a new infrastructure and logistic base for INA and the regional
centers that are compatible with their mission in the process of reform of public administration.
C) on long term:
• harmonizing and updating the methods and forming practices with those from the administrations of the countries members of the European Union;
• consolidating the professional dialogue with the partners and other forming suppliers inside the country and abroad;
• affirmation of INA and of the regional centers as an authority with a recognized expertise in forming public servants, inside the country and abroad;
In conclusion, one might say that in the context of Romanian public administration reform, the continuous forming of human resources becomes its solid support, being constituted in a determined process of its acceleration.
63
Management – Marketing - Tourism
REFERENCES
1. Caramete Cristina
Formarea si perfectionarea resureselor umane in administratie, in Revista de Administratie si Management Public, ASE Publishing House, Bucharest, no. 1/2003;
2. Caramete Cristina
Formarea pentru integrare europeana a functionarilor publici, in Revista de Administratie si Management Public, ASE Publishing House, Bucharest, no. 2/2003
3. *** Revista de Economie si Administratie Locala, Tribuna Economica Publishing House, Bucharest, No. 1, No. 6/2003
4. *** Strategia de reforma administratiei publice in Romania, Public Adminstration Ministry, www.mpagov.ro
5. *** Strategia de accelerare a reformei administratiei publice in Romania, www.mapgov.ro

64
Revista Tinerilor Economişti
DIVERGENCES AND SIMILARITIES IN THE EVOLUTION OF THE HUMAN RESOURCES
FUNCTION IN THE WESTERN PART OF THE MEDITERRANEAN SEA99
Ph.D Student Lucas Dufour AER à Euromed Marseille, France Assoc. Prof. Ph.D Soufyane Frimousse ATER à l’Université de Corse, France
Abstract: This paper shows the main characteristics of human resources function evolution, highlighting the divergences and similarities of it in the Western part of the Mediterranean Sea. The movement from the pure administrative staff management approach to a strategic HRM, the adaptation to the latest management innovations, the differences between multinationals and the small and medium companies are also highlighted.
Keywords: human resources function, divergences ands similarities, management innovations.
Introduction The levels of development of the Human Resources function differ from one
country to another. However, a certain convergence seems to be in progress within the Mediterranean space thanks to the influence of states, national groups and multinational corporations in particular. Yet, HR practices are never transposed from one country to another without any adaptation. A “contextualization” process is engaged, which facilitates the emergence of hybrid practices. The history of the countries of the Western part of the Mediterranean Sea with their political, social, cultural and economical specificities appears particularly helpful in understanding the evolution of their management policies. Despite the contextual diversity within the Mediterranean space, some general tendencies that are common to all the countries studied can be identified.
The Mediterranean space is a zone of connection. It is the intersection between nomadism and sedentarism, tradition and modernity, universalism and individualism and global and local. The Mediterranean Sea is at the junction between two opposite forces: a sometimes devalued but omnipresent tradition and a will of modernity which is not clearly defined and which is not trusted. The social link is essential in the commercial exchanges between Mediterranean countries. The work in a Mediterranean vision is not only a matter of maximizing personal profits. Human Resources must rely on these shared Mediterranean values and attitudes in order to facilitate the emergence 9 This article has been done thanks to the documents and the informations gathered in the European project Agora RH which is a nnetwork uniting HR professionals. There are 11 associations in 8 Euromediterranean countries: Euromed (France), AGRH (France), ANDCP (France), IAS (France) , AGEF (Morocco), ALGRH (Algeria), ARFORGHE (Tunisia) , AEDIPE (Spain), AIDP (Italy) , APG (Portugal) et ZDKDS (Slovenia).

65
Management – Marketing - Tourism of a Human Resource management (HRM) based on reasonable practices and policies which will permit to fight against the drifts of economical effectiveness.
A Human resources function influenced by contextual specificities The Human Resource function has different levels depending on which country in
the Western part of the Mediterranean Sea. Three groups can be identified. The first one is composed of Italy and France. These countries were the first ones to set up services specialized in human resources fields and they still develop innovative practices. Portugal, Spain and Slovenia are part of a second group. The Human Resource function is facing a very quick professionalization which is facilitated by political changes and by the opening of the economy to private investors. The Maghreb countries (Morocco, Algeria and Tunisia) complete the classification. In those countries, the Human Resource function is still administrative and not completely structured. Joining neo-institutionalist approaches, this typology underlines that the institutions and the social structure model the company’s specificities. The diffusion and the use of some practices depend at the same time on policies and on regulation conditions that constrain the economic environment of the companies (Granovetter, 1990).
The diversity of natures and levels of the human resource function The pioneers of the HR function (France and Italy) During the Fifties, the main goal of the HR function in France and Italy was to
ensure the discipline and the compliance of contractual rules. At that time, employees were considered as passive subjects and managed in a paternalistic way. Besides, the personnel staff jobs were often occupied by retired soldiers or lawyers . The Human Resource function used American theoretical models, inspired by Taylorism and Fayol’s theories which were influenced by army organization. This period of economic growth was little concerned about the real validity of these models of planning, and favored the application of effective tools in the field of recruitment (Dufour, 2005).
With the emergence of social conflicts, the models of the Human Relations School of thinking developed and showed scientifically that employee satisfaction has an impact on organizational effectiveness. Large companies in France and Italy such as Olivetti were inspired by this research (Marchesi, Strazzeri, 2005). The Human Resource function tried to match company’s needs and human expectations, with the objective of improving performance. The concept of “high potentials” emerges. The staff manager was now called Human Resources Manager. The use of data-processing tools helped the Human Resource function. In spite of these evolutions, the management mode still remained in most cases paternalist. The beginning of the Eighties marked the initiation professionalization of the Human Resource function. Tools focused on strategic HR planning were created and Observatories that study the evolution of the company jobs were launched. The companies’ objective at that time was to maintain the qualification level of its employees by up-dating them through training, but also to preserve the best ones by proposing attractive remuneration, training and working conditions. The Nineties were marked by intense international competition which provoked in companies an increased search for competitiveness in particular via greater workforce flexibility and a research for an increased quality. Inspired by the success of Japanese companies, “Total Quality Management” was established in many large European companies. In big groups, the Human Resource
66
Revista Tinerilor Economişti function then became a strategic partner. New tools and indicators allowed action planning and an anticipation of the changes.
The follower countries (Spain, Portugal and Slovenia) In Portugal, the arrival of foreign investments in the Sixties initiated the
industrialization process. The same movement was observed in Spain. Multinational corporations which implemented at that time brought new management techniques and staff management. These new methods create the need for “managers”. It is in this context that in 1963 the ESADE in Barcelona and in 1965 the ICADE in Madrid were created. The staff manager then acquired a greater importance within the company and improved its position in the flow chart of the company. The staff function remained administrative at that time in most of the companies and dealt mainly with the respect of authority and legislation. At that time, staff management was characterized by job security and career evolution linked to oldness. The productivity incentives were still non-existent at the time and only multinationals and big Spanish and Portuguese groups had a real Human Resources function. (Marques, 2005).
In the middle of the Seventies, the political transitions in Spain and in Portugal marked the evolution of the HR function. In 1974, the “eyelets Revolution” in Portugal provoked the nationalization of the main sectors of the economy and trade unions became essential interlocutors in Portuguese organizations. In Spain, after Franco’s death in 1975, many trade unions appeared. These political and socio-economic changes favored negotiation and the resolution of collective conflicts. During this period, multinationals accelerated the diffusion of wage policies related to the worker performance. They also generalized the selection processes by using scientific evaluation techniques. The management personnel department was still mainly managed by production experts, principally engineers or economists. In Slovenia, the new 1974 constitution and the new 1976 labor legislation provoked many changes. The right to work was not guaranteed by the constitution anymore, wages and social benefits were no longer imposed by the State and firms could now go bankrupt. The end of the right to work was an opportunity for firms to reduce the cost of a very expensive and too numerous workforce, which helped firms to increase their competitivity.
Spain and Portugal joined the European Union in the middle of the Eighties. The opening of the economy and the privatization of the companies accelerated. The management model evolved towards a management by objectives and HRM then favored meritocracy. During the Nineties, employees were no longer considered as a cost but as a resource. The Human Resources departments were then in charge of the development of potentials available within the company and also had to develop the workforce motivation and flexibility. During this period, the Spanish and Portuguese Human Resources Directors started to be included in the decision-making by participating in the Board of directors and by taking part in the strategy of the company (Cagigas and al, 2005). Slovenian independence provoked a huge loss of ex-Yugoslavian markets for Slovenian firms which forced them to restructure in order to find new outlets. After a difficult period of reorganization and cost reduction, firms started to invest in their employee’s competencies by the professionalization of selection, training and career development. The privatization of the Slovenian economy was made little by little. Indeed, the State was still present in many key sectors and most of privatized Slovenian firms are owned by employees or by local investors and
67
Management – Marketing - Tourism its main foreign investors come from neighboring countries (Germany, Austria and Italy) (Kohont, 2006)
Delayed countries in a professionalization process During the colonial period, the North African countries (Morocco, Algeria and
Tunisia), faced a discrimination in terms of labor legislation. Indeed, North African employees were hired under a special law the “overseas labor law” (Mana, 2005), so employers could hire and fire without a manageable and numerous workforce for daily activities without compunction. The French trade unions put a strong pressure on colonial authorities for the recognition of a certain number of rights to Moroccan and Algerian workers. Despite this pressure, French employers seldom applied all the legal rights (Baayoub, Zouanat 2005). After the independence of the North African countries (Tunisia and Morocco 1956 and Algeria 1962), efforts were primarily devoted to the rebuilding of the state and of its basic institutions. During this first post-colonial period, the objective in the Maghreb countries was to ensure the vital public services (electricity, railways, water, etc.) to stimulate the national economic growth (creation of job, distribution of the wages…)and to preserve as well as possible the colonial administrative structure endangered by the massive departure of French civil servants. In Algeria, the March 1963 law declared the self-management of the factories : “the factory to the workers”. High unemployment led to people leaving to go to the former colonizer who, during the period of economic growth called the “30 glorious years”, lacked workforce (Meziane, 2005).
After independence, private companies in North African countries generally benefited from situations of quasi monopoly or from other favorable conditions that prevented them from market evolutions and competition. The Human Resources policy in these companies was generally much codified and largely inspired by the HR policy in the public sector. The way of managing the workforce is very similar to the one that prevailed during the colonial period: high turn over, maintenance of the workforce in a situation of precarity, etc. In Algeria, the Seventies are marked by the state’s desire to build the economy, focused on the development of heavy industry. This period is characterized by massive investments and the creation of large powerful national companies. During this period, the HR function, driven by the state, was in charge of professional aspects (recruitment, pay, promotion, participation) but also social aspects (housing, transport, medicine, holidays, etc…).
At the end of the Eighties, the HR function had a certain number of management tools and methods in order to modernize HR and to increase the qualitative level of management (Meziane, 2005). Algeria went through an economic crisis with the fall of the oil income, the development of unemployment and the slowing down of investments. This caused the social explosion of October 1988 which led to the questioning of the political system (Dali, 1996). The Algerian State then decided to give a larger autonomy and freedom to companies and the law of “General Status of the Worker” inspired by communist ideology was then abolished. According to new social laws voted in 1990, the state will no longer intervened directly in the economical decision process and simply determined the limits the firms had to respect. In Tunisia, Zghal (2003), underlined that the industrial sector was essentially made up of small and medium companies whose priority is primarily financial. HRM was of little importance and was very rarely strategic as revealed on the survey carried out by the multi-field team of research in management (ERGE) of Sfax University in 1994/1995. The survey
68
Revista Tinerilor Economişti also underlined the existence of paradoxes between a consciousness of the importance of HRM and a very administrative management in everyday life (Ben Ferjani and alii 2001). In fact, corrective management, which corresponded to a permanent search of opportunity without true strategy, dominated. According to Zghal (2000), Tunisian companies evolved in a “blur” culture characterized by the absence of precise rules, the absence of their application and the request of a paternalist model based on relations of equality and dignity.
Baayoub and Zouanat (2005) distinguish five types of Mediterranean firms according to their link to international economy companies: multinationals or big local groups, firms opening, firms between the status quo and modernization, firms which were closed in approach and public firms and administration. In the firms which were closed, the leaders refused to take up the challenge of international opening and change. The employees were kept in a situation of strong dependence. Trade-union representation was not accepted. In multinationals and big groups, the formalization of the practices was done gradually. It was accompanied by the instrumentation of the HR function. In the majority of these companies, evolution oscillated between development and status quo. The leaders trying to control the evolution of the function by maintaining the economical and social balance. As regards public firms and administration, the authorities exerted economical and legal pressures on the public companies in terms of HRM. The competition which was less exacerbated in these sectors attenuates the importance of HRM within these companies and can explain the importance of the trade unions in those firms.
Igalens (1999) distinguishes four phases in the evolution of the HR function. The first phase corresponds to the basic of the HR premises. The principal concern related to the control of production and the individual is a variable of adjustment. The second step related to the extension of the HR function. The third phase is a stabilization phase. It is characterized by a diffusion of tools. The last phase represents the emergence of HRM. All the countries of the Western basin of the Mediterranean Sea have experienced or experiencing comparable evolutions. France, Italy, Slovenia, Spain and Portugal are positioned in the last phase of the grid proposed by Igalens. The North African countries are currently in a phase of stabilization and instrumentation of the HR function.
An engaged convergence The intervention of the state in the improvement of the HR function, the
internationalization of the companies and the development of training in the field of human resources constitute in various proportions according to different countries, the three major vectors of evolution of the HR function in the Western basin of the Mediterranean Sea. In Morocco, from 1993 to 2004, 65 companies were privatized and 24 belong henceforth to foreign capital. In Tunisia, companies that face international competition have had an accelerated process of change on HR practices (Chebbi, 2005). In Spain and Portugal, the privatization of many companies and the EU adhesion has considerably accelerated the flow of exchanges. These two joint movements have thus constrained the HR function in the space of twenty years to modernize considerably. In Algeria, the privatization of the economy has been done gradually and the modernization of the HR function was initiated first of all by the state and the national groups. For Tunisia, the process of evolution of the HR function occurred under the impulse of the state. Prolonging the law of 1972, the implementation of a program of
69
Management – Marketing - Tourism leveling encouraged companies to improve their management process and their quality process for products and services. Mahjoub (2005) and Ennaceur (2004) underline the essential role of human resources in the global development program of the Tunisian companies. The Tunisian State adopted a strategy based on four pillars: the prevention of conflicts by the institutionalization of tripartite periodic negotiations between workers and employers' trade unions, employment flexibility, development of human resources within companies and institution of the participation of employees in the decision-making process within the company.
In Morocco, the authorities engaged a process of “social recasting” via a new industrial legislation to encourage companies to reconsider their HR practices and also encourage trade unions to adopt a more participative and less conflictual attitude. Moreover, from the middle of the eighties, a device was implemented by the state to encourage companies to provide training for their personnel with possibilities of financing these costs in order push the Moroccan companies to reconsider their HR practices (Baayoub, Zouanat, 2005). According to the majority of the research done during the nineties, HRM in North Africa, still appeared basic and unsuited to the requirements of competition which requires an efficient workforce. Generally, it comes close to the conception of Taylor (1957) about scientific management with a clear separation between conception decided and conceived by top managers and what is done by employees, an authoritative management style and weak internal communication. However, the firms most risk from the international competition started to benchmark their competitors, especially European firms, to identify and adapt their best practices in order to stay competitive. Within the constraints of the environment these firms adapt their HR policies to develop HR strategic policies. Moreover the countries of the Western basin of the Mediterranean Sea facing a renewal of the managers’ graduated from universities or business schools, sometimes foreign universities and business schools, who have all learned management principles. These two phenomena create a convergence of HR practices between European companies and their North African counterparts (Frimousse, 2006).
Indeed, despite the different pace of evolution of the HR function, three phases common to all the countries of the western part of the Mediterranean Sea can be identified: - a normative and disciplinary conception of staff management linked to a paternalist management style ( Step 1) - a better understanding of the human factor with a transition from staff management to HR function (Step 2) - a professionalization of the HR function with the implementation of the latest management innovations (Step 3) The second step of the professionalization process began in France and Italy at the beginning of the Seventies and was launched in Spain, Portugal and Slovenia at the end of the Seventies. On the other hand, the professionalization of the HR function was done during the Eighties in all the countries of the North side of the Mediterranean Sea at the same time. The North African countries, passed without transition at the beginning of the nineties from a normative and disciplinary staff function (step 1) to a modern HR function (step 3).

70
Revista Tinerilor Economişti The HR function in the Mediterranean: stakes and challenges
In all of the countries of the Western basin of the Mediterranean Sea, employers want the HR function to concentrate on driving change and not on administrative questions. HR policies are becoming more and more individualized and also gaining in transparency. 360 degree evaluation is developing even if this tool is mainly used in multinational groups. So the evaluation system is becoming more objective and less biased, and the policy of linking remuneration to performance evaluation is becoming individualized thanks to the contribution of communication and information technologies. The HR function is henceforth understood as a tool with the objective of value creation. Training, selection and many administrative tasks, (especially payroll system) are being externalized in order to focus on more high-value HR activities but also in order to reduce the cost of the HR activities. Diversity management henceforth constitutes one of the major challenges of current organizations. Professionals observe, in European countries, a relaxing of the bond between the employees and their company. Employees are less implicated in their work and give more and more importance to ethics in their workplace but also to the balance between their private life and their professional life (Dufour, 2005). The employee always seeks a compromise and the employer must take into account his needs in order to encourage loyalty (Cagigas and al, 2005). HR professionals must also reinforce the quality of internal communication in order to add value to the contributions of the HR function which remains little or badly perceived.
Towards a cultural pluriversalism Human Resources Management should not be satisfied with the instrumental dimension and must provide meaning; in other words provide the human element when there is none (Yanat, 2005). Mediterranean thought and cultures can permit to identify possibilities for humanizing management. Indeed, the Mediterranean is a culture of transition able to ensure the passage from closed cultural identities to diversity and from interculturality to intercreativity. This must make it possible to overcome and get through the great oppositions and the persistence of the polarization between two imaginaries. In the Mediterranean space, and various religions, cultures, but the various demographical, economical and political situations reinforce the interest of diversity management within the companies. The Mediterranean can be considered as a natural line which separates two sides and two different worlds (from an economical, demographical and religious point of view in particular) and at the same time unifies each one of them (from a cultural point of view). Indeed geographers like Reclus, Sion and Siegfried and historians like Braudel and Pirenne present the Mediterranean Sea as a coherent space whose neighboring people share a common heritage around an internal sea. In this context, diversity management can be used through hybridization in order to reconcile convergence and contingency and to give sense to two distinct universes. Shayegan (2001) encourages us to confront the different cultures in order to benefit from the mixture and the crossing. Hybridization corresponds to a mixing of the differences. This way of thinking “between the two” makes it possible to avoid brutal reactions caused by the explosion of modernity. Plurality makes it possible to legitimate all the cultures by giving sense to another culture starting from its own culture. It authorizes a dialogue between the cultures without the negation of the other.

71
Management – Marketing - Tourism The Mediterranean Sea: a hidden source of inspiration for HRM?
The management practices in the Mediterranean Sea are characterized by a traditional management founded on intuition (and not on strategic planning) on a basic organization based on an oral culture in which the formalization of methods and tools is missing. This description is an antithesis of the management reference model. However, Mediterranean companies can constitute a “hidden source” inspiring a model of management placing the human being at the centre of the organization processes of production systems and exchanges (Orsoni and Pérez, 2006). The management of an organization can be defined as the articulation between the economic model to which it refers and the mode of governorship to which it is referring to. According to Pérez (2006), an economic model corresponds to the ways and means by which an organization gets its material, financial and human resources and uses them to carry on its activities. The mode of governorship returns to the methods and processes by which the organization defines its direction system and its control mode. Management is the result of two forces that can be materialized under two positions : “the engineer” and “the social actor”. The first position applies to firms with a rational and sequential approach such as “forecasts/achievements/controls”. In the second posture, the approach is more relational. It includes linking the actors within the company and their external context.
Mediterranean companies try to reconciliate those two forces by not only focusing on the transaction from an economic point of view. Indeed, especially in North African firms economic and social relations are interlinked and they are often accompanied by a form of fatalism. Marchesnay and alii (2006) link this behavior to a theosophical vision of the life which is conformed to the holy texts. These countries share Arabo-Muslim elements with high tolerance for ambiguity and uncertainty which is linked to a strong belief in destiny (“Maktoub” ; it is written). The social link is omnipresent in North African firms. Informal networks based often on regional affinities dominate the company. Employees have a strong emotional link with their superiors. Traditional economy characterized, according to the expression borrowed from Braudel (1980), by relationships based on “eye in the eye and hand in the hand”, is preferred. Relationships are more human and less mechanical and work aims initially at satisfying the elementary needs of a group and not providing riches for a few. A Mediterranean way of managing people cares, first of all, in a direct or indirect way, about maintaining cohesion between social and societal stakes. Companies do not necessarily adopt HR practices the best appropriate to economical requirements, but those which seem best accepted socially. Mediterranean management styles are therefore more emotional and less objectified.
General conclusion Since the Nineties, a certain convergence of HR practices in various
Mediterranean countries has been in progress. Certain homogeneity in the tools used on the two sides of the Mediterranean Sea is observable. All the Mediterranean countries seem to adapt with more or less speed to the latest management innovations. However, whichever country is concerned, there is a very important difference between the multinationals and the small and medium companies concerning HRM. In Morocco, the HR function in multinationals is like in big firms in Europe or in America. On the other hand, the gap is very important between the small Moroccan firm and the Moroccan multinationals. A similar thing is noticed in all the other countries. Only half of French
72
Revista Tinerilor Economişti small and medium firms have a HR department and in Italy, only companies with more than 300 employees have a real HR function.
A movement of professionalization of the function is also in progress in all the Mediterranean countries with increasingly specialized HR professionals. The Mediterranean HR Director has increasing power in all the countries and increasingly managers sit on the Management committees. All the Mediterranean countries have evolved or evolve from a purely administrative staff management approach to a strategic HRM. With globalization, the HR function must take into account various dimensions: shareholders, stakeholders, information and communication technologies, employees’ diversity and social responsibility without forgetting the objective of economical profitability. The same expectations and the same constraints are present in all the Mediterranean countries accelerating the convergence of the visions, the practices and the tools. Management practices of Mediterranean are faced with many factors of contingency which makes contextualization quasi-inevitable. In certain configurations, a process of hybridization engages and facilitates the emergence of new practices which are innovative and appropriate to cultural, historical, geographical and demographical Mediterranean identities (Frimousse, 2006). The Mediterranean Sea is not only a sea which laps at the shores of Alexandria, Tangiers, Barcelona and Marseilles. It is also a way of thinking the world that could help Mediterranean occidental countries to recover their essence by finding the East (Frimousse and Peretti, 2006).
REFERENCES
1. Baayoub M. et H. Zouanat.
La GRH au Maroc : histoire et perspectives de reconfiguration , Journée Agora RH. Euromed Marseille, 2005
2. Baayoud M. La redéfinition des modes d’articulation entre l’économique et le social dans le contexte d’ouverture du Maroc à l’économie internationale , Actes de la 7ième Université de Printemps. Marrakech,2005.
3. Ben Ferjani M. et F. Ezzerelli
Les pratiques de GRH dans les entreprises tunisiennes performantes , Acte du 1ier symposium international, Gestion des Ressources Humaines : Stratégies et pratiques, Damas, 2001
4. Braudel F. Civilisation matérielle, économie et capitalisme, les jeux de l’échange, Armand Colin, 1980.
5. Cagigas Vilalba J., Casals Jimenes J., Castano Collado M.G., Prieto Zamora J.M.
Evolucion de la funcion Recursos Humanos en Espana .AEDIPE, 2005.
6. Chebbi R. Evolution de la fonction RH en Tunisie : entre contraintes et défis , ARFORGHE, 2005.
7. Dali A. La GRH en Algérie : analyse critique , Revue de l’ALGRH, 1996

73
Management – Marketing - Tourism 8. DIORH Enquête sur la Fonction Ressources Humaines au Maroc ,
DIORH, Casablanca, 2004. 9. Dufour L et J.
Igalens Comparaison des pratiques en Euroméditerranée, évolution de la fonction RH , Revue Personnel, n° 462, 2005.
10. Dufour L. L’évolution de la fonction Ressources Humaines en France Journée Agora RH. Euromed Marseille, 2005.
11. Ennaceur M. Comment se mettent en place les audits sociaux dans les pays du Sud ? , Actes de la 22ième Université d’été des Auditeurs Sociaux, IAS Luxembourg, 2004.
12. Frimousse S. Internationalisation des entreprises et hybridation des pratiques de gestion des ressources humaines : le cas du Maghreb, Thèse en Sciences de Gestion, IAE de Corse, 2006.
13. Frimousse S. et J.M. Peretti
La gestion des ressources humaines dans le contexte maghrébin : entre convergence et contingence , Perspectives sur la GRH au Maghreb, sous la direction de Zahir YANAT et Aline SCOUARNEC. Vuibert, 2005.
14. Frimousse S. et J.M. Peretti
L’émergence d’une gestion des ressources humaines hybride au Maghreb , Revue Française de Gestion, Vol.32. 166, 2006.
15. Granovetter M. The Old and the New Economic Sociology: a history and an agenda , in: Friedland R., Robertson A.F., Beyond the Market: Rethinking Economy and Society, New York, 1990.
16. Hofstede G. Relativité culturelle des pratiques et théories de l’organisation , Revue française de gestion, septembre-octobre, n° 64, 1987.
17. Igalens J. Cent ans de gestion du travail , Revue française de gestion, novembre-décembre, 1999.
18. Mac Carthy D. La fonction personnel, Editions d’Organisation, 1963. 19. Mahjoub Z. La gestion des ressources humaines en Tunisie , in : Z.
Yanat et A. Scouarnec, Perspectives sur la GRH au Maghreb, Vuibert, 2005.
20. Mana A. L’Introduction du Droit du Travail en Algérie, ALGRH, 2005
21. Marchesi D. et L. Strazzeri
L'évolution de la Fonction Ressources Humaines en Italie Journée Agora RH. Euromed Marseille, 2005.
22. Marchesnay M., Kammoun S.C. et H.E. Karray
Y-a-t-il un entrepreneuriat méditerranéen ? Revue française de gestion, Vol. 32. n° 166, 2006.
23. Meziane M. L’évolution de la fonction Ressources Humaines en Algérie , Journée Agora RH. Euromed Marseille, 2005.
24. Orsoni J. et R. Pérez.
Le management méditerranéen : forme dépassée ou formule d’avenir ? , Revue française de gestion, Volume 32, n° 166, 2006.

74
Revista Tinerilor Economişti 25. Pérez R. Un régime méditerranéen de gouvernance d’entreprise ? ,
in : Peretti Jean Marie (coordonné par), Richesses de la diversité, Vuibert, 2006.
26. Shayegan D. La lumière vient de l’Occident. L’Aube, 2001. 27. Taylor F.W. La direction scientifique des entreprises, Paris, Dunod, 1957. 28. Yanat Z. Responsabilité sociale et invariants en gestion des ressources
humaines au Maghreb , in : Z. Yanat et A. Scouarnec, Perspectives sur la GRH au Maghreb, Vuibert, 2005.
29. Zghal R. Gestion des Ressources Humaines : les bases de la gestion prévisionnelle et de la gestion stratégique, Centre de Publication Universitaire, Tunis, 2000.
30. Zghal R. Culture et gestion : gestion de l’harmonie ou gestion des paradoxes ? Gestion, Revue Internationale de Gestion, volume 28 n°2, HEC-Montréal, 2003

75
Management – Marketing - Tourism
ADVERTISING AND INTELLECTUAL PROPERTY RIGHTS – A KEY TO COMPANIES’ COMPETITIVENESS
Assist. Ph.D Student Cătălina Radu Academy of Economic Studies Faculty of Management Bucharest, Romania Ph.D Student Alina Cătăneţ Media University Faculty of Management of Affairs Bucharest, Romania
Abstract: In order to be competitive marketing has a tremendous role, companies’ interface with consumers is essential, companies have to make use of advertising and intellectual property rights, and these are not at all easy things to be done. Being competitive means not only ensuring for yourself the necessary intellectual property rights, in order to move forward, but also to respect others’ rights, in order not to lose what you previously won. Our paper aims to present the main ways of competiting through these elements and to analyze the present ways of winning in a competitive environment.
Keywords: competitiveness, intellectual property, advertising, marketing, unfair competition.
Companies are competitive only if consumers can recognize that. Of course this is something that takes time, and needs companies’ efforts to really understand consumers’ behavior and permanently adapt to fit their requirements. Sometimes people think marketers are the only interested party in consumers’ behavior, as they want to influence and change it. Intuitively, it is wrong that any organization should try to manipulate people’s behavior. The truth is marketing can promote all the products, with the condition that targeted people consider those products relevant for their needs, if they never tried them before. They will try for the second time the product only if their first trial was positive.
Building the company’s image is not easy, but if it is really built, this leads to real benefits and also it is not easy to destroy it. Many times quality of products is what leads to a favorable image. However, this is not enough. The desired market share is obtained through efforts to make your products known, to make people distinguish your products from similar ones offered by others and to permanently develop them, including with respect to technology.
Many times companies’ prestige and advertising activities are related to intellectual property rights, that first have to be obtained (substantial money efforts are needed for this) and then have to be used in order to generate cash that can cover your previous investments and also mean remaining with additional incomes, needed by future efforts.
Intuitively we all know what intellectual property is. We know that the inventor of a machine, the author of a book or a melody „own” in a way or their work. The

76
Revista Tinerilor Economişti consequences come from this and we cannot just copy or buy a copy of another’s work without taking into consideration his/her rights. Every time we buy such protected articles, a part of what we pay should go to the „owner” as a reward for his/her time, money, efforts and mind that led to that result.
What is Intellectual Property? The best beginning in defining intellectual property is a proper understanding of the word „property”. The main characteristics of most property types refer to the fact that the owner is free to make use of it as much as he/she wants to (in the limits of law, of course) and has the right to exclude others from making use of it. The term „intellectual property” refers to those property types that are the result of human mind, of creativity. There are two important things regarding intellectual property:
(1) the one who generates it can gain rights as a result of his/her work; (2) these rights can be licensed to others.
Why intellectual property rights exist? The first reason is that it is fair that a person who gave time and effort in an intellectual creation to have a benefit as a result of his/her work. The second reason is that by offering protection to intellectual property such efforts are encouraged and the industries based on this kind of work can develop, because people see this work brings them financial gains. The most important aspects that define intellectual property rights refer to:
- copyright - related rights - trademarks - geographical indications - industrial design - patents - protection of new varieties of plants.
Additionally there is the legislation regarding unfair competition, as the market fair-play cannot be ensured simply by protecting intellectual property rights. We consider unfair competition is unfortunately quite often seen by us just by looking at companies’ advertising.
Copyright As copyright concerns only a small part of the total companies, we will not
insist too much on it. In essence there are three types of rights a copyright holder might have: (1) The right of reproduction – It is the right of the owner to prevent others
from making copies of his/her works. They need an authorization of the author or other owner rights. It covers any kind of reproduction, for example printed books, printed copies, photocopies, recorded tapes, programs on CD-s, DVD-s, or other forms of stocking information, etc. There are some exceptions to the general rule, known as „limitations” on rights. For instance, many national laws allow individuals to make single copies of works for private, personal and non-commercial purposes. This could become a big problem, as the unauthorized copies of works may be indistinguishable from the source, because of the technology.
(2) Rights of public performance, broadcasting and communication to the public – The right of public performance means that the owner of copyright may authorize live performances of a work (the presentation of a play in a theatre, for
77
Management – Marketing - Tourism instance). In addition we call „public performance” performance by means of recordings. The right of broadcasting covers the emission by wireless means, by radio, television, or satellite. When a work is communicated to the public, the signal diffused by wire or cable can be received only by persons that have access to equipment connected to the wire or cable system.
(3) The right of translation and adaptation – You have it if you translate a work (for example a book) from one language to another or if you change by adapting that work (for example when you transform a book into a movie or into a play). In order to reproduce and publish a translation or adaptation we have to obtain the authorization from both the owner of copyright in the original work and the owner of copyright in the translation or adaptation.
Of course all these mean some economic rights. There are also the moral rights that should be also taken into account.
There are five categories of enforcement provisions: conservatory or provisional measures; civil remedies; criminal sanctions; measures to be taken at the border; and measures, remedies and sanctions against abuses in respect of technical devices. We will explain the last three of them with an example for each:
Criminal sanctions: Someone sells CD-ROMS with software. Criminal sanctions punish the ones who willfully commit acts of piracy of copyright and related rights on a commercial scale, by imposing substantial fines and by sentences of imprisonment and deter further infringement by orders for the seizure, forfeiture and destruction of infringing goods and of what was used to commit this offense.
Measures to be taken at the border: Maybe that seller of CD-ROMS tries to make the alleged infringing goods to disappear into circulation following customs clearance. The owner of rights applies to customs authorities. Thus he has a reasonable time to commence judicial proceedings against the suspected infringer. Anyway, the owner of rights has to satisfy the customs authorities that it is a prima facie evidence of infringement, has to provide a detailed description of those CD-s for recognizing them and has to provide a security to indemnify the importer, the owner of the CD-s and the customs in case those CD-s turn out to be non-infringing.
Measures, remedies and sanctions against abuses in respect of technical devices: In Romania HBO (television channel with movies) is a very good example. There are technical devices that are used to prevent the reception of encrypted program except with use of decoders. Actually there are infringements of copyright by manufacturing and distributing illegally decoders, but these decoders don’t make the image to appear on the screen very good.
Related Rights There are three groups of beneficiaries of related rights, namely performers,
producers of recordings and broadcasters. Performers (for instance, singers, dancers, actors, musicians, etc.) – They give
life to works and have a justifiable interest in legal protection of their individual interpretations. Performers are provided the rights to prevent recording, broadcasting and communication to the public of their live performances without their consent and the right to prevent reproduction of fixations of their performances. Of course, it is about equitable remuneration. It is prevented just without it.
Producers of recordings (for instance, record companies) – We all know that their creative, financial and organizational resources are necessary to make recorded
78
Revista Tinerilor Economişti sound available to the public in the form of commercial phonograms. They have a legitimate interest in having the legal resources necessary to take action against unauthorized users (making and distribution of unauthorized copies – piracy, unauthorized broadcasting or communication to the public of their phonograms). They have the rights to authorize or prohibit direct and indirect reproduction, importation and distribution of their phonograms and copies, and the right to equitable remuneration for broadcasting and communication to the public of phonograms.
Broadcasting Organizations – They have an important role in making works available to the public and have a justified interest in controlling the transmission and retransmission of their broadcasts. Many times they have exclusivity – for instance for a football match. They have the rights to authorize or prohibit rebroadcast, fixation and reproduction of their broadcasts.
Trademarks A trademark is a sign (a word, a logo, a letter, a number, a slogan, a sound, a
color, even a smell) that an individual trader or company uses to distinguish its own goods or services from the goods or services of competitors. This is of course a simplified definition, but it explains the essentials of a trademark.
It is indeed advantageous to protect a trademark: For companies: Of course, companies spend a lot of money for their
trademarks and they have to rely on trademark laws for preventing other people from using them.
For clients: A trademark usually ensures a consistent level of quality and helps clients to return to a desirable product or to avoid an undesirable one.
The most common way of protecting a trademark is to have it registered in the Trademark Register. (In some countries an unregistered trademark is protected after it has acquired sufficient distinctiveness and a reputation in the marketplace). The first possibility (registration) is better because the trademark in the second case is very vulnerable, many firms can lose a lot waiting – reputation means considerable time after the initial launch.
There are two main requirements of a trademark in order to register it under the terms of Madrid Agreement:
(1) Trademark should be distinctive – It must be able by its nature to distinguish goods and services. If we talk about a natural juice of oranges and lemons, we can’t have the trademark “Orange & Lemon”, because the competitors have to be able to use these words to describe their own goods, but we can have the trademark “Orlem”, a combination of the first letters of these words, and we can have the trademark “Orange & Lemon” for something else, for instance for textiles, because this way we would have a very distinctive trademark, as oranges and lemons have nothing to do with textiles.
(2) Trademark should not be deceptive – Trademark cannot say that the goods for which it is used have certain qualities when they do not. For instance, we cannot have the trademark “Real Leather” for products that are not made from leather. A deceptive trademark would be also a trademark that claims a certain geographical origin for the goods from other regions, for instance, the name Bordeaux for wine that is not really from the Bordeaux region.

79
Management – Marketing - Tourism Trademarks are very important factors in increasing companies’
competitiveness. Without them, the companies cannot build the so-called “brand loyalty”.
Geographical Indications A geographical indication shows that certain products have a certain regional
origin. Many times we hear of another term, “appellation of origin”. However it is not quite the same thing and we should know this. Appellations of origin are specific types of geographical indication (the geographical indication is the broader term). A geographical indication shows that certain products have a certain regional origin: “Made in Romania” is a geographical indication. An appellation of origin specifies that a certain product has certain qualities, which are due essentially or exclusively to its place of origin: Dorna Mineral Water – it is said/assumed that has some qualities referring to local mineral substances because it comes from there.
Industrial Design An industrial design is that aspect of a useful article, which is ornamental or
aesthetic. It refers to the appearance of an object. It may consist of three-dimensional features such as the shape or surface of the article, or two-dimensional features such as patterns, lines or color.
We apply industrial designs at many different products of industry or handicraft: watches, jewellery, fashion and other luxury items, industrial and medical implements, house ware, furniture and electrical appliances, vehicles, architectural structures, practical goods, textile designs, leisure items, etc., almost everything.
In most countries an industrial design has to be registered for being protected under industrial design laws and the general conditions needed for registration of an industrial design are novelty and originality. Novelty and originality are different from country to country. Anyway, registration of an industrial design is not the only means of protection. Sometimes and under certain conditions, it is possible to protect industrial designs under copyright law or the law against unfair competition.
Industrial design protection means benefits for the owner, for the consumer and for the economy as a whole. The owner of the design benefits through the industrial development of his products and the protection helps to ensure a fair return on investment. The consumer benefits because this protection leads to fair competition and honest trade practices, to more aesthetically, attractive and diversified products. Economy benefits, because this protection contributes to the expansion of commercial activities and enhances the export potential of national products.
Patents Patents provide protection for technological advances. The aim is to encourage
economic development by rewarding intellectual creativity. Through patents, progress in changing technologies finds incentive to improve. Patent protection provides a reward not only for the creation of an invention, but also for the development of an invention to the point at which it is technologically feasible and marketable.
The benefits of a patent refer to the fact that the owner of a patent can exclude all others in the territory covered by the patent from making, using, selling or importing the invention. Of course the owner of the patent can’t use the invention if it is something illegal, but he can prevent others from marketing and benefiting from the

80
Revista Tinerilor Economişti invention for a period of years (typically 20 years from the date on which the application is filed).
The patent holder is responsible for taking the initiative to enforce a patent. Detection of potential or actual infringements has to be done by the patent holder. In most cases, it is sent a polite letter giving notice of the existence of the patent. Usually it leads to a successful licensing agreement, which means, of course, a benefit for the owner of the patent.
Characteristics that an invention must have in order to be patent protected are: (1) It must be new or novel; (2) It must involve an inventive step (an advancement enough for being
considered “non-obvious” by a person having ordinary skill in the art); (3) It must be capable of industrial application (the invention must be able to be
used on a certain scale in practice). A patent protects new and useful inventions. Of course, there are some
exceptions, things that are not patentable. For instance, somebody discovers a new star. Of course, it is something new and useful, but it is also something that already existed in nature. Another example could be a perpetual motion machine, because it defies the laws of nature.
Not only patents protect an invention. Actually there are two ways of protecting an invention: trade secret protection and patent protection.
Trade secret protection means to keep the technology secret, to keep the information concerning the invention confidential. This is an advantage, but there is also a disadvantage – maybe someone will learn to make your product and then you will not have protection anymore. However Coca Cola is an example of “keeping the secret”. They benefited a lot from trade secret protection, they could not have benefited such a long time from a patent protection.
Patent protection has the disadvantage of the full disclosure of the technology to the public, but it also has a big advantage: for the period of the patent it doesn’t matter whether someone else knows how to make your product, you have protection.
It is not possible to get a ‘worldwide patent‘, because there are many difficulties, the costs are high. For instance there are the cost of all the examinations of the same invention that have to be conducted in different countries under present arrangements, the cost of translation and the cost of maintaining a patent (there is a substantial annual fee).
There is an international agreement administered by WIPO, the Patent Cooperation Treaty (PCT), for the filing, searching, publication and examination of international applications.
Protection of New Varieties of Plants Giving plant breeders protection for their work is an incentive to the
development of improved plant varieties for agriculture, horticulture and forestry. The breeders make substantial investments in these fields and the protection means recovering costs and accumulating the funds necessary for further investment, so we can see an improvement of the quality and performance of plants of all types.
The holder of the breeder’s rights has the right to prevent the following actions without his/her authorization: production or reproduction (multiplication), conditioning for the purpose of propagation, offering for sale, selling or other marketing, exporting,

81
Management – Marketing - Tourism importing, stocking for any of the above purposes. The minimum duration for protection is 25 years for trees and vines and 20 years for other plants.
The characteristics of a new plant variety that would enable it to be protected are:
Novelty – ensuring that the variety has not already been exploited commercially;
Distinctiveness – it has to de distinguishable from any other variety well known at the time of filing application;
Uniformity – the plants of a variety should be the same or very similar; Stability – the variety should remain the same over a period of repeated
propagation; Satisfactory denomination – it has to be its generic designation.
Unfair Competition The market fair-play cannot be ensured just by protecting intellectual property
rights. Unfortunately too many times we can see problems of unfair competition just by looking at companies’ advertising.
It is true that by defining unfair competition as all acts of competition “contrary to honest practices in industrial or commercial matters” ” (art.10 bis (2) of the Paris Convention) or something similar to this, we cannot understand exactly what it is about. “Honesty” in competition is just the reflection of social, economic, moral and ethical concepts of a society, therefore it is different from country to country (and sometimes even in the same country). Moreover, it changes in time and there is always a new form of unfair competition, since there is no limit in creativity of competition. Any attempt to cover all types of unfair competition at present and in future in a definition – that in the same time defines the prohibited behaviors and is flexible enough to adapt to new market actions – has failed up to now.
The most notable of these acts of unfair competition are the causing of confusion, discrediting and the use of misleading indications. So the unfair competition means the attempt of somebody to succeed in competition without relying on his own achievements in terms of quality and price of his products and services, but rather by taking undue advantage of the work of another or by influencing consumer demand with false or misleading statements.
There is a need for laws in this field, because self-regulation has not proved to be a sufficient safeguard against unfair competition. In order to prevent unfair competition effectively, self-regulation must, at least in certain areas, be supplemented by a system of legal enforcement.
There are 6 major categories of unfair competition: Causing confusion – for instance an organization calls its fast food “My
Donald”; the consumers may believe it has something to do with McDonalds; an other example could be the shape of bottles very close to the shape of bottles of Coca-Cola Company (related to industrial designs);
Misleading – creating a false impression of a competitor’s own products or services; for example saying about his own product that doesn’t contain a substance, when in fact the similar products of the competitors do not contain that substance, too;
Discrediting competitors – any false allegation concerning a competitor that is likely to harm his commercial goodwill; for example saying that X Company doesn’t produce the goods at the international quality standards, when in fact it does;

82
Revista Tinerilor Economişti Disclosure of secret information - important information is given to a
competitor without the permission of the owner of the information – for instance, the recipe of a medicine;
Taking undue advantage of another’s achievements (free riding) – we can observe a lack of research, investment, creativeness and expense on the part of an imitator, who copied the achievement of another in spite of the fact that other ways of competing were available; for example, using a similar brand for dissimilar goods or services;
Comparative advertising – a positive reference to another’s product (the one’s own product is as good as the other) or a negative reference (the one’s own product is better than the other); for example, saying about one new, unknown soft drink that is as good as Coca-Cola; or saying about a detergent that is better than others.
Conclusions Companies’ competitiveness has to be reached by working on many plans
simultaneously. Companies have to make use of all types of intellectual property rights, in order to move forward, to respect the others’ rights, in order not to move backward, and to work on all economical, technological, managerial and marketing issues.
REFERENCES 1. Kotler, P. Managementul marketingului, Ed. Teora, editia a IV-a,
2005 2. WIPO
Academy The on-line course Introduction to Intellectual Property, March-April 2003
3. Manole, V. ; Stoian, M.; Dorobanţu, H.
Marketing, Ed. ASE, Bucureşti, 2002
4. Poltorak, A.; Lerner, P.
Essentials of Intellectual Property, John Wiley and Sons, 2002
.

83
Management – Marketing - Tourism
AN ANALYSIS OF THE BRAND LOYALTY BASED CONSUMER TYPOLOGY
Assist. Ph.D Student Moisescu Ovidiu Ioan Ph.D Student Gică Oana Adriana Babeş-Bolyai University Faculty of Economics and Business Administration Cluj-Napoca, Romania
Abstract: Even though the number of brands has strongly increased in recent years, only a few managed to endow themselves with significant brand loyalty. Besides the actual proprietary brand assets, such as patents and trademarks, other major elements like brand loyalty, perceived quality, brand associations, and others, underlie brand equity. A successful brand strategy must be based on creating brand loyalty. For achieving this goal consumers must be classified on a loyalty basis, while marketing strategies and mixes must be shaped accordingly.
Keywords: brand equity, brand loyalty, loyalty degree, brand strategy.
The American Marketing Association defines brand loyalty as “the situation in which a consumer generally buys the same manufacturer-originated product or service repeatedly over time rather than buying from multiple suppliers within the category” or “the degree to which a consumer consistently purchases the same brand within a product class”. Trying to define the term, David A. Aaker considers that brand loyalty “reflects how likely a customer will be to switch to another brand, especially when that brand makes a change in price, product features, its communication or distribution programs” (Aaker, 1992). Brand loyalty represents the core of a brand’s equity. Daryl Travis considers that “creating customer loyalty is neither strategic nor tactic”, but rather “the ultimate objective and meaning of brand equity”, adding that “brand loyalty is brand equity” (Travis, 2000).
A successful brand strategy must be based on creating brand loyalty. For achieving this goal, consumers must be classified on a loyalty basis and then the marketing mix must be shaped according to this classification.
A first approach of classifying consumers considering their degree of loyalty is that of George H. Brown (Kotler, 2002), according to whom buyers can be divided into four groups: hard-core loyals (always buy the same brand), split loyals (loyal to two or three brands), shifting loyals (loyal to one brand for a period of time, but easily shifting from one brand to another, due to certain advantages offered by the new brand), and switchers (show no loyalty to any brand, switching the brand with almost any buying situation). Each market consists of a different number of these four types of buyers. For example, a brand-loyal market has a high percentage of hard-core loyals. In such markets, entering or increasing market share are very difficult tasks. Still, brand loyalty must be carefully interpreted as it may actually reflect habit, indifference, a low price, a high switching cost, or the non-availability of other brands.
A second approach is that of David A. Aaker (Aaker, 1991) who sees five levels of brand loyalty and groups customers accordingly into a loyalty pyramid (fig.1):

84
Revista Tinerilor Economişti a) The first level represents non loyal buyers who are completely indifferent to
brands, each brand being perceived to be adequate if the price is accepted. b) The second level includes satisfied or at least not dissatisfied buyers with no
dimension of dissatisfaction sufficient enough to stimulate a change, especially if that change involves effort. These customers can be vulnerable to competitors that can create a perceived benefit in the case of switching.
c) The third level consists of satisfied customers with switching costs (loss of time, money, or acquired loyalty advantages, performance risks associated with switching etc.). In this case, competitors must create an inducement or incentive to switch by offering a benefit large enough to compensate the switching costs.
d) The fourth level contains customers who truly like the brand and have an emotional attachment to the brand, based upon associations such as a symbol, a set of use experiences, or a high perceived quality. The emotional attachment’s reason is not clearly identifiable as sometimes just the fact that there has been a long term relationship can create a powerful affect.
e) The fifth level represents committed customers, proud to have discovered and used the brand, and to whom the brand is very important both functionally a as an expression of their personality. The value of this category of customers stays in the impact they have upon others through their recommendations.
Figure no 1: The loyalty pyramid
Considering the level of involvement and that of perceived differences between
brands, Henry Assael (Kotler, 2002) identifies four types of consumers (fig.2): a) Complex loyals firstly do research, then develop beliefs and attitudes about
the brand, and finally make a thoughtful choice. Marketers should educate these consumers about the brand’s attributes, differentiate and describe the brand’s features, and motivate sales people to influence the brand choice.
b) Dissonance loyals shop around and buy fairly quickly, as they may consider most brands in a given price range to be the same, even though expensive and self-expressive. After buying, they experience dissonance noticing certain disquieting features or hearing favorable things about other brands, but seek information that
Likes the brand
Satisfied - with switching costs
Habitual - with no reason to change
Switcher - price sensitive – indifferent - with no brand loyalty
Committed to the brand
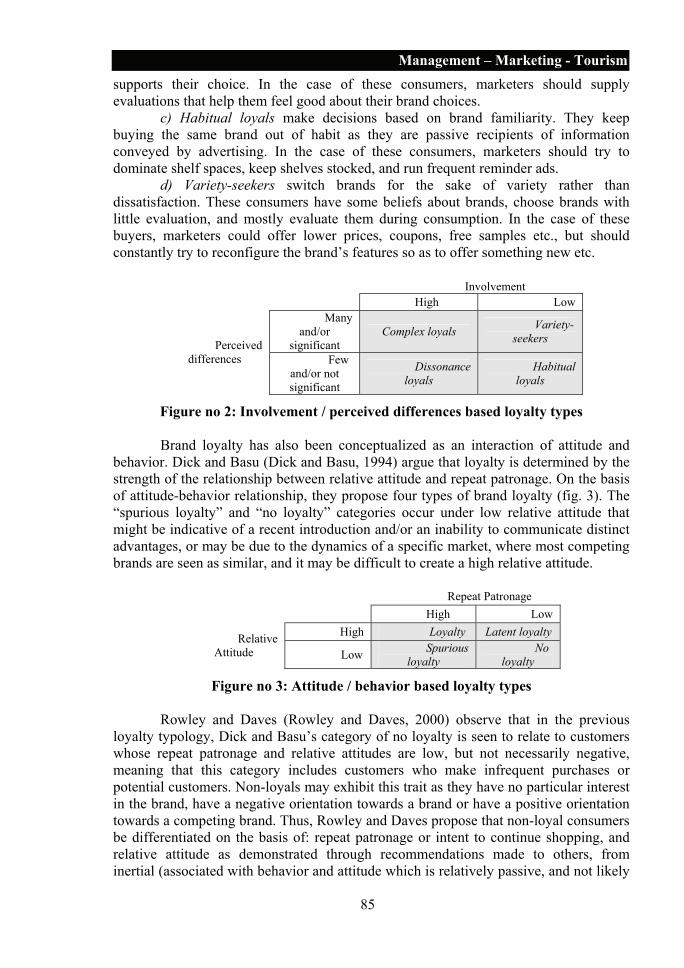
85
Management – Marketing - Tourism supports their choice. In the case of these consumers, marketers should supply evaluations that help them feel good about their brand choices.
c) Habitual loyals make decisions based on brand familiarity. They keep buying the same brand out of habit as they are passive recipients of information conveyed by advertising. In the case of these consumers, marketers should try to dominate shelf spaces, keep shelves stocked, and run frequent reminder ads.
d) Variety-seekers switch brands for the sake of variety rather than dissatisfaction. These consumers have some beliefs about brands, choose brands with little evaluation, and mostly evaluate them during consumption. In the case of these buyers, marketers could offer lower prices, coupons, free samples etc., but should constantly try to reconfigure the brand’s features so as to offer something new etc.
Involvement High Low
Many and/or
significant Complex loyals Variety-
seekers Perceived differences Few
and/or not significant
Dissonance loyals
Habitual loyals
Figure no 2: Involvement / perceived differences based loyalty types Brand loyalty has also been conceptualized as an interaction of attitude and
behavior. Dick and Basu (Dick and Basu, 1994) argue that loyalty is determined by the strength of the relationship between relative attitude and repeat patronage. On the basis of attitude-behavior relationship, they propose four types of brand loyalty (fig. 3). The “spurious loyalty” and “no loyalty” categories occur under low relative attitude that might be indicative of a recent introduction and/or an inability to communicate distinct advantages, or may be due to the dynamics of a specific market, where most competing brands are seen as similar, and it may be difficult to create a high relative attitude.
Repeat Patronage High Low
High Loyalty Latent loyalty Relative Attitude Low Spurious
loyalty No
loyalty
Figure no 3: Attitude / behavior based loyalty types Rowley and Daves (Rowley and Daves, 2000) observe that in the previous
loyalty typology, Dick and Basu’s category of no loyalty is seen to relate to customers whose repeat patronage and relative attitudes are low, but not necessarily negative, meaning that this category includes customers who make infrequent purchases or potential customers. Non-loyals may exhibit this trait as they have no particular interest in the brand, have a negative orientation towards a brand or have a positive orientation towards a competing brand. Thus, Rowley and Daves propose that non-loyal consumers be differentiated on the basis of: repeat patronage or intent to continue shopping, and relative attitude as demonstrated through recommendations made to others, from inertial (associated with behavior and attitude which is relatively passive, and not likely

86
Revista Tinerilor Economişti to influence others and which may or may not lead to purchase) to negative (concerned with strong negative attitudes, or behaviors which seek to undermine a brand) (fig. 4):
a) Disengaged loyals are neutral and uninterested. They have never been customers because they have no awareness, the product is not relevant to them or the product is not within their perception of affordability. Yet, these circumstances may change and they may have potential for being customers in the future.
Disengaged loyals need to be re-engaged with the brand. Marketing communications that are likely to be successful focus on promotion. Customer awareness may need to be enhanced by offering free samples, and other promotions which encourage these customers to sample the product again may be important.
b) Disturbed loyals are existing and continuing customers, who are suffering a temporary perturbation in their loyalty status, and are in the state of questioning previously assumptions about a brand, because they had a negative experience with the brand, or have an unfavorable comparison with other brands, or were exposed to promotion of competitive brands, which tempt them to try alternatives. These customers could be encouraged or enticed to consider re-commitment to the brand, provided they are assisted to see past their negative experience.
Disturbed loyals need to be re-captured. They are susceptible to promotional endeavors such as attractive packages and new products of competitors. Organizations should respond by benchmarking with competitors’ products. Recovery procedures such as complaints procedures, suggestion boxes, customer service and reimbursements may be appropriate.
c) Disenchanted loyals are customers who used to be loyal, but who have become less so. Their behavior is such that they do not at present purchase the brand and are unlikely to do so in the future. Their attitude has ceased to be positive towards the brand but often remains neutral, rather than negative, due to previous positive experiences with the brand. Disenchantment arises because of a negative experience with the brand, a positive experience with a competitor, or changes in the match between customer requirements and the product range associated with the brand.
Disenchanted customers are susceptible to strategies similar to those used for disturbed loyals, with the difference that the opportunity for addressing specific incidents has passed.
d) Disruptive loyals are previous customers, who have strong negative attitudes and behaviors in respect of the brand. They maintain negative views on the brand and are likely to communicate these to others, possibly vociferously.
Disruptive customers are not likely to be converted into loyal customers again. The focus must be on negating the effect of any negative aspect on brand image that these customers can achieve, either in the media, and through pressure groups, or by word of mouth. In order to be successful in this endeavor, a business needs to understand where any earlier major weaknesses or flaws in product performance and customer service lie, to eliminate these, and to demonstrate that any major problems have been eliminated.
Behavior Inertial Negative
Inertial Disengaged Disenchanted Attitude
Negative Disturbed Disruptive
Figure no 4: Types of non-loyalty driven behavior
87
Management – Marketing - Tourism Finally, it is useful from a marketing perspective to see how brand loyalty
evolved along the time. Thus, Bennett and Rundle-Thiele (Bennett and Rundle-Thiele, 2005) identify five distinct brand loyalty eras:
1) The birth of brand loyalty (1870–1914), when products quality varied widely and brands made products clearly identifiable. Brands were initially introduced as a means of assisting consumers to distinguish between available products.
2) The golden era of brand loyalty (1915-1929), when customers perceived improved quality of brands while retailers were enthusiastic about the increased sales resulting from brands. Brand recall was high and many consumers were loyal to a single brand of product. As consumers were able to access the brands more widely, familiarity and loyalty with the brands increased. Towards the end of this era, however, consumers became cynical towards advertising, which they perceived to be tasteless, manipulative and deceptive, while its costs were said to inflate prices.
3) The latent brand loyalty era (1930-1945) was characterized by a scarcity of branded products. Brand scarcity meant that many consumers were either rationed or required to do without previously purchased brands. Despite the lack of availability, brand preference actually increased during this period. Consumers had high levels of brand preference, but were not able to actually buy the brand.
4) The multi-brand loyalty era (1946-1970), when brands became more available, and consumers returned to their old habits and continued to purchase their favorite brands. During this period there was an explosion in new products and discount retailers emerged changing distribution with a focus on price competition for brands, with many introducing private brands. This created great concern for the manufacturer brands and, combined with increasing choice and high product quality, encouraged variety-seeking behavior. A common feature in many markets during this era was that customers were polygamous, buying several brands. Multi-brand loyalty emerged in the middle of the 20th century. Marketers realized that brand loyalty was not a personal disposition, but rather it was specific to certain product categories.
5) The declining loyalty era (1971 – today), when the level of differentiation is declining, and hence competing brands are becoming more substitutable, as product quality increased and brands became more consistent, while consumers are increasingly price-sensitive. This similarity between competing brands, the increasing array of competing brands, combined with the increased cynicism towards advertising, has resulted in consumers being both more price-sensitive and rarely loyal to a single brand. In markets with little differentiation, customers can be ambivalent towards brands and, as a result, they buy different brands. Today most customers include several brands in their preferred brand set. There are, however, some brands towards which consumers demonstrate intense sole-loyalty, and these brands often have brand communities. Brand communities are groups of consumers whose common theme is their usage of a particular brand, and the more integrated the consumer is into the brand community, the more loyal they are in consuming the brand.
To conclude, we might say that any brand strategy must use several loyalty based consumer typologies in order to identify the appropriate marketing mix best shaped to each segment. Furthermore, certain rules generally apply when managing brand loyalty, along with specific tactics and strategies established after a detailed analysis of the particular situation a brand or its actual and potential clients has. Managing brand loyalty implies a periodical assessment of the results obtained through
88
Revista Tinerilor Economişti specific strategies and of the levels of brand loyalty among customers, considering both functional and emotional perceived aspects related to the brand.
REFERENCES 1. Aaker, D. A. Managing Brand Equity: Capitalizing on the Value of
a Brand Name, The Free Press, New York, 1991 2. Bennett, R.,
Rundle-Thiele, S. The Brand Loyalty Life Cycle: Implications For Marketers, Journal Of Brand Management, Vol.12, No.4, 2005
3. Dick, A., Basu, K Customer Loyalty: Toward an Integrated Conceptual Framework, Journal of Marketing Science, Vol.22, No.2, 1994
4. Kotler, P. Marketing Management, Millenium Edition, Prentice Hall Inc., Upper Saddle River, New Jersey, 2002
5. Rowley, J., Daves, J.
Disloyalty – A Closer Look at Non-Loyals, Journal of Consumer Marketing, Volume 17, No.6, 2000
6. Travis, D. Emotional Branding: How Successful Brands Gain the Irrational Edge, Crown Publishing Group, 2000
89
Management – Marketing - Tourism
DEVELOPMENT DIRECTIONS OF SERVICES AND PRODUCTS IN INSURANCES
Lect. Ph.D Mitu Narcis Eduard University of Craiova Faculty of Economy and Business Administration Craiova, Romania
Abstract: In the new context of globalization, it is apparent the growth of insurances industry. The insurance world is continuously changing. New insurance types come into sight, while the old ones are constantly revised. Most of the developed countries turned the insurance industry into a motor generator of powerful social-economic progress. Therefore, for the economic and social national environment, it appears to be more and more necessary to surpass the actual state of research and to develop a long-lasting environment in which insurance specialists could have credibility and a powerfully positive influence. Thence, in our paper, we treated some problems which are adverted to integrate financial services, new technically of finance risks, and tendencies in the products of assurance evolution.
Keywords: insurance, financial services, risk management, evolution, insurers.
Direct Today, we can all agree that the insurance sector is a strong engine of economic and social progress. Henry Ford, once said that USA wouldn’t have got that far without insurances, sky-scrappers wouldn’t have been built without investors insuring their buildings, and workers wouldn’t have done their job at such heights thinking that, without life insurance, their children would have become homeless. But in order to keep this beautiful and true attribute (engine of progress), the insurance sector must keep up to the “crazy age” that we live in, defined by a continual transformation and globalization. The globalization represents a generalization of internationalization phenomenon. The last and a half decade, from this point of view, can be characterized through the existence of the globalization phenomenon which manifests in social, political, cultural and especially economical evolutions. From this point of view the globalization means “global financial markets’ development, transnational corporations’ growth and their growing domination upon national economies”. As a fact, the international insurance market has an important dimension, noticed especially by the concentration of the actors of this market from which take part the insurance companies, reinsurance companies, insurance brokers and companies that offer services in insurance activity, and not only. The traditional models, where businesses were very clearly differentiated (the banks were giving credits, were founding deposits and were easing the capital transfer and insurance companies were offering risks and security cover) have become “footnotes” for financial literature. At present time, the insurance companies explore the banking environment and vice versa. The banks and the dealers fight against each other, trying to take a market

90
Revista Tinerilor Economişti which becomes more and more crowded. Hereby, in our conception, the best word which can be associated to the financial markets in this moment is “convergence”. In this perspective, it is estimated that in the future the global industry of insurance will suffer major changes, starting to create sets of new products, services and business processes, all in order to create more value and to offer a solid basis of long term growth and development.
1. Integrated financial services
Integrated financial services can be the answer for future development of insurance companies. Already existing one on the global market, but also on the national one enough companies which offer a large range of financial services (insurance products and services, banking, leasing and investing products) to individuals and companies customers, using the distribution channels chosen by them, under a common name.
Table no. 1 Transpassing process from classical financial services to integrated financial services
Such an approach offers to insurance companies some advantages, among
which we can enumerate: - operating on a market and at a larger scale - the growth of concentration tendencies upon essential activities (“core
business”) - the development and administration of the access of the customers to more
distribution channels and for a growth of the channels’ number - better acquaintance of the customers
2. New techniques to finance the risk In the complex process of risk management, the insurance companies hit the
classical measures’ limits used with this purpose many times. Neither insurances nor reinsurances take over and cannot take over all the risks
of a company. Many times, can’t be insured especially the risks that provoke some of the biggest worries, like a part of the operational risks (system unfunctionality, security breach, some meteorological risks, some accidental pollution risks, special types of civil responsibility etc.)
Moreover, the insurance, generally speaking, lack continuity in activity, such as: amends endowment takes place after a period of time when the ensured event took place, necessary to inspect and solve the loss by the insurer; as a result there are discontinuities in companies’ activity or delays in restarting the activity.
That is why appears more and more the need to take into consideration the risk inside the management process and certain alternatives to classical insurance products. Hereby, we can take into consideration two techniques to finance a risk, alternatives to
• To a company of information • To a global economy • To “self-aid” • To multiple choices
• From a service company • From a national economy • From asistance/consultance • From limited offers
91
Management – Marketing - Tourism existing insurance on the market. These techniques are useful when the risk can’t be placed using usual insurance contracts
First technique called “Finite structure” is an agreement through which the insurant finances using annual rates up to 80% from the agreed indemnity limits (the rest of 20% being a normal insurance).
For the acquitted annual rates, the insured is given an interest that eases he’s financial effort.
If the “risky” event doesn’t occur in a settled period of time (maximum 5 years) or the loss is smaller than the money gained, the insured is paid back 50-80% from the bounties and interests.
With “Finite structure” is assured a balance between self-finance and risk transfer; the loss cost is echeloned on a 5 year period; the arrangement has the form of an insurance, offering its fiscal advantages; it is offered a substantial bounty return in case of low loss.
The second technique called “Contingent Capital Facility” is an agreement where the insurer must pay the loss and the insured must refund the amount to the insurer.
The insured pays annually a very small engagement bounty until the loss occurs. After the event occurs, which has been completely compensated by the insurer, the insured pays echeloned, annual premiums in order to refund the loss and the interest. This “hybrid” product has the form of insurance, offers flexibility and diversifies the capital sources, offers finance for unplanned spending, associated to random risks.
The objective of these techniques is to flatten the financial effort curve of the companies with considerable losses caused by the materialization of uninsured risks in casual bank bills, through loss cost leak edge on a 5 year period of time, in certain conditions.
For both techniques, the insurers must have a high financial standard, and the insured must have a strong financial situation. The negotiation of such arrangements take 4-6 months, and the minimum limit insured must be 30-50 million $.
As an example, for an arrangement type “Finite structure” on a 5 year period of time, with 80% from duty limits funded by the insurer, the insured pays 24 million $. That means an annual rate with over 4 million $, taking into consideration interest accumulation. Of course, because of imposed conditions by the insurers and the big amounts, only financially strong companies can have access to these techniques.
3. Tendency in insurance products evolution
The innovations in insurance industry must come on to problems about demographic changing data of the customers, about new technologies, changes occurred in regulations etc. Very interesting is the latest study made by the IBM Institute for Business Value, called “Insurance 2020: Innovating beyond old models” The study offers a new perspective upon the challenges the insurance companies must deal with in 2020 and upon the strategies that can lead to a successful innovation.
In the next decade it will be an important growth in insurance products’ flexibility, and the extending use of the technologies to calculate will lead to a transpose in practice of these estimations.
92
Revista Tinerilor Economişti The “Pay-as-You-Live” insurance which is based on the fact that the events in customers’ lives are managed while they happen will reduce the problems and high costs of refunding management claims focusing on preventing and new business processes that will decrease the costs and will make the products more appealing, take place of the old models of insurance. The industry standards, the same for a long period of time, are to provoke an income deduction and won’t be able to offer the insurance companies the long term profit margin. The calculation of a specific risk cost, it is anticipated in the named study, will base on using some sensors connected to the next internet generation. The data offered by this type of sensors, who are met to serve the life and goods insurance, will allow the calculation of the risks in real time and will balance the evolution of bounty costs on the real risk basis. A similar technology will support another large range of products that will be emitted based on the duration of the policies. An example can be given by the “Just-in-time-insurance” product where every step of the journey (from the car to the station, from the train to town, from the sub station to the office etc.) will represent a different risk. A scenario type “pay-as-you-live” can lead to a partial abdication to privacy (must be known the place where the insured is, the time spent in a certain period of time etc.), which can be compensated by a smaller bill for insurance policies. In the active managerial spirit of the risk, the same web of sensors could also give useful information that can lead for example to a jammed route avoidance – the information transmitted using the most appropriate equipment, like the audio system in a car, the phone or the computer.
Conclusion In conclusion, it can be noticed the change of the attention concentration from a
product to a customer. Hereby, in insurance industry the supremacy of transactional marketing will be given in favor of relational marketing. The insured persons will have a higher access to products and a higher possibility to make decisions by themselves. The most successful insurance products will be the dynamic ones, leading to important performances for the other types of business.
REFERENCES 1. Cristea, M. Asigurări internaţionale, Editura Reprograf, Craiova, 2003 2. Mitu, N.E. Asigurări şi reasigurări, Editura Universitaria, Craiova,
2006 3. Politis, A. Managementul agenţiei de asigurări, Editura All Beck,
Bucureşti, 2001 4. Soros, G. Despre globalizare, Editura Polirom, Iaşi, 2002 5. *** Insurance 2020: Innovating beyond old models, IBM
Institute for Business Value, 2006 - http://www-935.ibm.com/services/us/bcs/pdf/g510-6291-00.pdf
93
Management – Marketing - Tourism
TOURISM, PART OF EUROPEAN POLICY
Lect. Ph.D Gruescu Ramona Assoc. Prof. Ph.D Mitrache Marius Lect. Ph.D Nanu Roxana University of Craiova Faculty of Economics and Business Administration
Abstract: Developing tourism has a direct impact on economic, social and environmental conditions; consequently, it can and must be an important means of enhancing European citizens' quality of life and must be used as such. However, in order to ensure that this potential is effectively harnessed in the longer term, tourism must meet sustainability requirements which all the players involved – public and private bodies, businesses and users – must in turn observe.
Keywords: employment, businesses, social cohesion, stability, the environment.
Tourism is widely recognized around the world – and especially by the European Union and its institutions – as an area of economic activity of strategic importance in achieving a range of objectives which lie at the very heart of the EU's existence, its policies, and its desire to create a better Europe for present and future generations.
It is important to point out that the only reference to tourism in the EC Treaty, as consolidated at Nice, and following the revision and expansion of certain protocols, is in Part One: Principles, Article 3(u), which reads as follows: "For the purposes set out in Article 2, the activities of the Community shall include, as provided in this Treaty and in accordance with the timetable set out therein:(…) measures in the sphere of energy, civil protection and tourism."
Several Commission and Council documents have attached importance to tourism as an instrument for generating employment, but it may readily be agreed that tourism nevertheless has a very low profile among European policies as a whole, and that it should perhaps be strengthened and expanded in line with the universally accepted strategic importance of tourism at present and, most probably, in the future. A higher profile for tourism in the activities of the EU and of its various institutions and, more clearly, the coordination of all Community policies affecting tourism have been both called for and predicted. For this to happen, more and better data on all aspects of tourism and the way it ties in with other sectors must be available in the future, so that tourism's contribution to the quality of life and social cohesion can be accurately evaluated in both economic and social terms.
Careful attention should also focus on determining the future role of tourism in shaping the Europe which will emerge from the European Convention. There must be initiatives to ensure that tourism and tourism policy are given full recognition in terms of their economic importance and capacity to create employment, their potential contribution to culture and mutual understanding among the peoples of the world, and as a tool for creating a Citizens' Europe.

94
Revista Tinerilor Economişti New forms of tourism which are sustainable in economic, social and
environmental terms, and which all parties seek, will be determined by this set of conditions. The special contribution made by sustainable tourism to achieving the strategic objective of the Lisbon summit – "to become the most competitive and dynamic knowledge-based economy in the world, capable of sustainable economic growth with more and better jobs and greater social cohesion" – is generally recognized and must be emphasized.
Against a new, less dynamic economic backdrop in which fewer jobs are being created, the Brussels Council of 20 and 21 March 2003 sought to turn words into actions and ensure that the Union and the Member States live up to their undertakings – "we reaffirm our strong personal commitment to the timely and effective delivery of reforms across the three pillars of the Lisbon strategy – economic, social and environmental".
The Brussels Council established new priorities which, in practical terms, mean giving fresh impetus to entrepreneurship and innovation and strengthening the internal market as a means of enhancing competitiveness and placing it centre stage both within the economy in general and tourism in particular.
Tourism is widely agreed to be of great importance not only economically, but also socially and environmentally, in the European Union and worldwide. Where tourism is already well developed, people count on it to continue being what it has been in the past, a source of wealth creation, high employment and a high quality of life, while people in less-developed areas look to tourism as a potentially crucial means of escaping from poverty, securing economic progress and social development and meeting convergence objectives.
The tourism industry in the European Union comprises some two million businesses, mostly SMEs, which account for about 5% of both GDP and employment. This figure varies from 3% to 8% depending on the Member State. Tourism also generates a considerable amount of activity in other sectors, such as the retail trade and specialized equipment, to a level of around one and a half times that of tourism itself. In terms of turnover, over 80% of the tourism undertaken by Europeans concern to individuals or families. The remainder is business tourism, in the broad sense. It varies, depending on the country, from barely 15% to over 30% of the total volume, the highest proportion relating to Nordic Countries. EU households earmark around one eighth of their personal expenditure for tourism-related consumption, a figure which varies relatively little from country to country.
Community tourism is largely domestic. 87% of tourism activity recorded is attributed to its own citizens with only 13% to visitors from non-member countries. As for the tourism of EU citizens, three-quarters remain within the EU, the remaining quarter going to other parts of Europe and the world.
Tourism is one of the sectors of the European economy with the best outlook. Forecasts indicate a steady growth of tourism in Europe, stronger than the average economic growth. This is due to factors such as the increase in time for leisure activities and its social importance, together with global economic growth.
Over the past few years 100,000 jobs a year have been created in Europe in the hotel and restaurant sectors alone. Europe, with the greatest diversity and density of tourist attractions, is the most visited tourist region in the world. Despite having a lower growth rate than the world average and than certain up-and-coming overseas destinations in particular, the volume of European tourism is expected to double over
95
Management – Marketing - Tourism the next 20 to 25 years, with a net increase, in terms of expenditure and yield, of around 3% per year. Employment will rise by about 15% over the next ten years."
Although tourism is not directly part of common EU policy, a number of European institutions are engaged in measures and actions which affect tourism because of their horizontal nature, or which rely on tourism in order to achieve a range of major EU objectives, including sustainable development, employment, economic and social cohesion, etc.: in other words, a better quality of life for European citizens.
Tourism is a highly complex phenomenon on account of the wide variety of factors which determine its shape, organization and development. Some of the numerous factors interacting with tourism merit close attention: tourists, employment, businesses, social cohesion, stability, culture and heritage, accessibility to persons with disabilities, the environment, peace and solidarity, and the roles of the various players.
Tourism and tourists Clearly all economic and social activity needs to focus on the individual.
Tourism, like any economic activity involving personal, individual and collective relations between peoples, must above all meet the needs of people, as citizens of a nation, European citizens and, ultimately, citizens of the world.
The tourist, as consumer, must be both the beneficiary of services and the source of demand under conditions favorable to the sustainability of tourism and its availability to all. Various initiatives can be adopted with a view to designing a form of tourism for the future which will meet these requirements.
Tourism and employment Various large-scale studies have repeatedly highlighted the enormous current
impact and the extraordinary potential of tourism as a source of jobs. But in order to turn this into reality, in socially and economically sustainable terms, various conditions have to be met. The fact that tourism is an economic activity fundamentally based on personal services means that any new tourist activity generates new jobs, but tourism can only be high-quality and sustainable if it generates high-quality jobs.
Various initiatives could be adopted with a view to ensuring that in the future tourism is able to generate more and better jobs in tourist enterprises and areas.
Tourism and businesses: entrepreneurial competitiveness and social responsibility of businesses
Tourism is fundamentally a complex economic activity, a group of economic services and sectors governed by market rules and based on companies seeking competitiveness, wealth creation, and which ultimately create employment and quality of life for ordinary people, both as users and as workers in the sector. If this economic activity is to be sustainable, now and in the future, a number of conditions have to be met which can be underpinned by various initiatives.
Tourism and social cohesion: impact and social balance of tourist activity Tourism is a powerful means of promoting contacts between different peoples,
while at the same time generating economic and social well-being in tourist areas. Often, however, social relations in the local population have been affected by a

96
Revista Tinerilor Economişti perceived loss of the traditional balance, in the face of an influx of visitors exceeding several times over the number of local residents, and a consequent trend to standardization in products, including tourism products, and in social relations. Developing the potential of tourism in a positive way and reducing the risk of social or cultural disruption is the basis of socially sustainable tourism.
Maintaining socially sustainable tourism, from the point of view of the social cohesion of local areas and people, requires that a number of conditions be met by means of various initiatives.
Tourism and stability: reducing seasonal bias The seasonality of tourism has been described as the sector's major outstanding
issue, in that it is the cause of serious imbalances because it does not continue throughout all the potentially effective periods, with serious consequences for businesses, people employed in tourism, tourist areas, and ultimately tourism's proven capacity to generate wealth and prosperity. Seasonality first and foremost means under-utilization of physical capital (equipment, buildings, infrastructure etc.) as well as human capital, which is idle for much of the year. The result is clear: if there is no tourism, sector workers do not get paid and have to seek other activities or else join the ranks of the unemployed during the off-season.
In some cases this period of inactivity is long, in others short; in some cases it is during the winter and in others during the summer, but in almost all cases it will have damaging consequences throughout the year. In all cases the stability of employment, which is a precondition for the quality of employment, is under threat, and in other cases companies' profitability and competitiveness will be compromised by seasonality and consequent loss of revenue, which is a grave threat to the sustainability of employment and to the whole of tourist activity.
Tourism, culture and heritage The rich cultural heritage of towns and rural areas throughout Europe is
undoubtedly a major attraction for tourists and travelers. The diversity of customs and traditions of Europe's rural areas is also a source of intangible, but very real wealth, which tourism can help preserve and exploit. Some of these intangible cultural values such as craftsmanship, music, oral traditions, customs, languages, dances, rituals, festivals, traditional medicine and remedies, cuisine etc. can form an integral part of some new forms of socially sustainable tourism. Similarly, sporting events are ideally suited to tourism and to the exchange of different values between peoples. There are two possible approaches to the relationship between tourism on the one hand and culture and heritage on the other: 1) exploiting the various aspects of this culture and heritage, with tourism as a means of maintaining, preserving and improving them, or 2) destroying these assets through irresponsible consumption. The first option is sustainable, and the second is socially unsustainable.
Tourism and accessibility for people with disabilities Tourism has become an extremely important social phenomenon involving
millions of people throughout the world, especially in Europe; not only is it an unprecedented force for wealth creation and economic progress, but also a crucial factor in improving knowledge, communication, human relations and mutual respect between different peoples. Tourism is of major benefit to society and should be within

97
Management – Marketing - Tourism everyone's reach, with no sector of the community being excluded whatever their personal, social, economic or other circumstances. People with disabilities – 10% of the total EU population – are becoming more integrated socially and economically and hence participating more and more in tourist activities despite all the impediments and difficulties which continue to prevent them from accessing tourist facilities and services on a regular and normal basis.
Removing and lessening these barriers is not only a must on grounds of equal rights and opportunities and non-discrimination, as championed by the EU and its Member States, but is also an effective way of including new groups of people in tourism-related activities, thus contributing to the growth of an economic sector which, especially in the southern European countries, has a direct impact on the creation of wealth and jobs in the interests of society as a whole.
Tourism and the environment In the recent past tourism and the environment have been seen as mutually
antagonistic: the wealth generated by tourism was at the expense of the environment, exploitation of the best sites, preferably by the coast or in the mountains, without consideration for such factors as biodiversity, the resources already there, scale or the capacity to absorb development. Faced with a difficult choice between two factors which were – wrongly – presented as mutually exclusive, the general response can be clearly seen from the situation we find ourselves in today: we opted for growth, wealth-creation, even if it meant damaging the environment. And this, paradoxically, in an activity which is based on preserving the attractiveness of nature. This undoubtedly stems from two different ways of looking at things: the short-term vision of immediate real estate profits and the long-term vision of a sustainable and competitive industry. Once again we face the need to establish conditions and initiatives conducive to new forms of environmentally sustainable tourism.
Tourism, peace and solidarity Tourism is just the opposite of war. War means the invasion of one country by
another, aggression, the destruction of nature and heritage, the humiliation and even death of human beings. Tourism on the other hand means a welcome, interaction, getting to know a place, conserving the environment, wealth – in short, peace and friendship between people. If we only love what we know, tourism, as a means of bringing people closer together, is a force for harmony and peace between nations, cultures, religions and individuals. Democracy and political and socio-economic stability must certainly contribute to this objective, in the countries tourists come from and those they visit.
Understanding between peoples and the promotion of ethical values are at the root of sustainable and responsible tourism; solidarity between peoples can grow from acquaintance as tourists.
Tourism and the players in the sector The vast range of stakeholders involved in tourism makes it advisable to
differentiate the role each plays in this complex task of defining new forms of sustainable tourism. It is the responsibility of political and institutional policymakers to define the appropriate framework in which new forms of sustainable tourism are possible and can be promoted by means of the full range of instruments at the disposal

98
Revista Tinerilor Economişti of the public authorities. The political priorities of this strategy of accessible and sustainable tourism must be geared towards ensuring that tourism is taken into account in all horizontal policies and in all relevant common policy areas.
REFERENCES 1. *** Commission Green Paper on the Role of the Union in the field of
tourism (COM(95) 97 final) 2. *** Commission Communication to the Council, the European
Parliament, the Economic and Social Committee and the Committee of the Regions - Working together for the future of European tourism
3. *** Opinion of the European Economic and Social Committee on the Integration of disabled people in society (2002/C241/17)
4. *** Agenda 21. Sustainability in the European tourism sector. Reference document. European Tourism Forum 2002, 10 December 2002
99
Management – Marketing - Tourism
LINKS BETWEEN MACROECONOMIC KEY VARIABLES AND EMPLOYMENT LEVELS IN
ROMANIA
Assist. Ph.D Student Bocean Claudiu Ph.D Student Mimi Petrişan University of Craiova Faculty of Economics and Business Administration Craiova, Romania
Abstract: This paper investigates the presence of a causal relationship between employment levels and key macroeconomic variables in Romania during the period 1990–2005. It shows how macroeconomic policies may be useful in achieving high employment levels, as well as how it might generate adverse outcomes. Starting from a macroeconomic model of labour market I present the effects of the macroeconomic policy measures to the labour market. I think that a low unemployment rate and rapid productivity growth are the hallmarks of a successful economy and thus top priorities of economic policy.
Keywords: macroeconomic policies, employment, economic growth.
1. Introduction Macroeconomic policy making over the past two decades has been
overwhelmingly guided by the objective of attaining and maintaining macroeconomic stability, defined largely by strict adherence to rather conservative levels of inflation, budget and current account deficits. The imposition of stabilization programs coincided with further policy compulsions toward greater trade liberalization, market deregulation and privatization, and a roll-back of the role of the state.
Bhaduri (2005) posits the need for an “alternative set of macroeconomic policies”, in which an appropriately designed and executed employment strategy would constitute the core consideration. He argues that such a policy regime would be guided by two broad principles: first, relatively higher emphasis needs to be given on internal/domestic market; and second, considerations of labour market flexibility and growth of labour productivity need to be weighed alongside considerations of the level of employment. Higher employment would allow maintaining a relatively higher domestic demand, and reducing the need for government interventions in extending subsidies, income transfers and unemployment benefits. Within the above considerations, the paper provides the basic ingredients of an employment-friendly macroeconomic policy framework.
Blanchard and Wolfers (2000) concentrate on the combined role played by institutions and macroeconomic conditions. They identify a set of macroeconomic variables that could have played a role in the explanation of European unemployment. These are the decline in total factor productivity growth, the real interest rate and the adverse shifts in labour demand.

100
Revista Tinerilor Economişti In this paper I use macro data from the “Romanian Labour Force Survey” and
“Employment in Europe 2005 - Recent Trends and Prospects” to analyze the effect of macroeconomic policies on the Romanian labour market.
The paper is set up as follows. Section 2 provides stylized facts about the labour market evolution in Romania. Section 3 reports the effects of the macroeconomic policy measures to the labour market. Section 4 gives final remarks.
2. The evolution of labour market in Romania Apart from difficulties and delays during the 16 years of transition, Romania
has, to a large extent, undertaken reform in all spheres: economically, politically, and socially. While the first 10 years were characterized by the restructuring of the economy (accelerated in 1997-1999), which suffered several crisis periods, a re-launching process was started in 2000. Macro-economic equilibrium, budget deficit, and the level of inflation have all been improved, along with a better coordination of budgetary and monetary policies. Restructuring has been gradually broadened to affect sensitive sectors and the privatization process accelerated considerably and is now more advanced.
Since 2000, the Gross Domestic Product (GDP) has registered a steady growth: 2.1% in 2000, 5.7% in 2001, 5% in 2002, 4.9% in 2003, 8.3% in 2004, 4.4% in 2005 and for 2006 the value envisaged is 4.5%. After being at an excessively high level, average inflation has been on a constant downward trend: from 45.7% in 2000 to 8.2% in 2005 and for 2006 the value envisaged is 6.5%. Although real wage growth has lately become more aligned with productivity gains, the authorities are still struggling to control the wage bill of public enterprises. Wage developments and formation do not sufficiently reflect productivity differentials by skills, occupations and regions and therefore do not provide appropriate signals for skills acquisition or for regional and occupational mobility.
The existence of a dual labour market with a rural labour market concentrating more than 30 percent of the labour force and characterized by high participation, including in the younger and older age groups and very low unemployment (twice as low as in urban areas). Agriculture concentrates nearly half of private employment and 85% of all self-employed.
The restructuring of the economy has lead to a strong decline in industrial employment. Agriculture played a buffer role in absorbing the employment losses while due to the low growth and irregular development of the service sector, job growth has been negative and the reallocation of employment towards this sector has been marginal.
However, in last for years the development of the private sector has concentrated in industry and services. The new private sector has reached a size enabling a sustainable growth of employment and compensating for the job losses in the public sector. There is an average development of small enterprises, which are the main source of job growth - in particular in services - which points to certain confidence in the business environment. The implementation of Law 76/2002 on Unemployment Insurance and Employment Stimulation contributed to an improvement of employment and business environment.
The skill level and structure of the labour force is a concern in an immediate and medium-term perspective. While the average educational level remains relatively low it increases since the mid 1990s; the qualifications held by many workers will not

101
Management – Marketing - Tourism meet the requirements of the new jobs; the participation rate of young people in the education system is low at tertiary level, a certain group does not continue beyond compulsory education. All these features represent a major challenge given the important restructuring ahead and the need to support economic transformation by a stronger development of new sectors.
Employment policy here is seen as widely defined – encompassing human resources policies, wages policy, the system of taxes and benefits, and the public employment service and its active labour market programs (ALMPs).
Although the economic growth was preserved for five consecutive years, it did not ensure a satisfying level of employment and new jobs creation. In fact, employment rates have been on a constant downward trend among people aged 15-64 years, from 65.4% in 1997 to 57.7% in 2005 (table no. 1). The decrease in this period affected the male population to a greater extent, rural and urban populations being affected in approximately equal proportions. In 2005 in Romania the level of the employment rate stands below the EU-15 average of 64.7% or the EU-25 average of 63.3% and above the new member states average of 56%.
Table no. 1 Employment rate, labour force participation rate and unemployment rate
2000 2001 2002 2003 2004 2005
Employment rate 63 62.4 57.6 57.6 57.9 57.7
Labour force participation rate 70.9 68.6 64.1 62.3 62.1 61.3
Unemployment rate 11.2 9 10.2 7.6 6.8 5.8
Real wage rate 21.3 5.4 0.0 4.8 6.1 3.8
Real GDP rate 2.1 5.7 5 4.9 8.3 4.4
Price deflator GDP 44.2 37.4 23.4 19.2 15.8 11.8
Source: European Commission for Employment and Social Affairs ”Employment in Europe 2005 - Recent Trends and Prospects” and www.anofm.ro
According to the National Accounts data, employment in agriculture, forestry
and fisheries still represents the bulk of total employment, with 31.2% in 2005, albeit falling from its all-transition period peak of 41.4% in 2000. The population employed in the tertiary sector (services, trade, banks, insurance, tourism, telecommunications, etc.) has been increasing and now accounts for 36.7% of total employment.
Industrial employment has witnessed its sharpest fall since 2000. In 2005, employment in industry and construction represented 32.1% of the total.
Large areas of subsistence economy still remain and to a certain extent prevail throughout the country. High shares of both subsistence agricultural employment and dwindling industrial employment point to the fact that further efforts are necessary to improve the investment climate, to put in place growth enhancing framework conditions, as well as upgrading of skills to match the needs of the labour demand and revision of the Labour Code. Thus generating more attractive jobs and driving the working age population out of subsistence employment and inactivity (estimates are of
102
Revista Tinerilor Economişti 1 million people employed by the informal economy, plus 4 million in subsistence farming).
The high rates of idleness in the economically active age category, the great number of people working in subsistence farming (estimated at 4 million people) and migration of labour (estimated at 2 million people) are occurrences that could account for the decrease in the number of people earning wages, without any corresponding growth in unemployment rates. A factor partly mitigating the effect of lay-offs from state-owned businesses was the development of private sector employment.
In accordance to the National Accounts data, unemployment rate decreased to 5.8% in 2005, compared with 6.8% the previous year. As a result, while the official unemployment rate will continue to remain low for a while, attention has to be paid to increasing the labour force participation rate for the working age population.
Unemployment has affected first and foremost workers, due to the industrial decline, where a large number of people were made redundant following the restructuring process, accounting for 73.8% in 2005 of the total number of registered unemployed persons.
Long-term unemployment (one year and over) saw an increase from 3.2% in 2001 to 4.2% in 2005. While overall unemployment is falling, long-term unemployment is constantly rising, thus forming a hard core mass of long-term unemployed towards which the ALMPs have to be focused during the coming years.
The labour force participation rate decreased from 64.8% in 1996 to 57.7% in 2005. The constant decrease in the relative size of the economically active population reflected structural pressure of the economy suffering radical transformations. Strategy errors sometimes have been added and played the role of easing this enormous pressure, as in the case of the early retirement wave. Despite some indications that early retirement may slow down (in 2005 the phenomenon was at 51.4% from its 2001 level) at least in certain sectors, the prospects are not clear, and a close monitoring is needed, in order to better assess the impact of early retirement on the activity rate and the sustainability of the pensions system placed under control only in the last years.
The ageing of population and increasing inactivity rate generate an increase in the economic old age dependency rate. While in 1990 there were 3.4 employees for 1 pensioner, in 2005 the ratio was 0.7 employees for 1 pensioner.
The main causes of these evolutions were: the general economic decline with the reduction of total output, the failure of macro stabilization policies and the delay of privatization, the reduction of investment and the restructuration of nonrentable economic agents, the low mobility of labour force in territory, the constraints associated with the international environment.
The evolution of labour resources in Romania were influenced, in the last decade, also by demographic and social phenomena such as: the decrease in the fertility and a high level of mortality, the growing number of emigrants, the reduction of quality of medical services. These lead to increases of the population aging more than 60 and to high level of rural dependency, especially in the rural areas.
3. The impact of key macroeconomic variables on employment level In an open economy I consider that key macroeconomic variables may affect
employment through at least five channels. To catalogue these effects consider a simple labour market model with a downward-sloped and an upward-sloped labour demand, while labour supply is constant (figure no. 1).

103
Management – Marketing - Tourism
Employment
Real wage
1 = higher productivity rate; 2 = output demand shock; 3 = output supply shock; 4 = import price shocks or tax increases; 5 = better vacancy/ jobseeker matching.
Labor supply Labor demand
1,2,5
3,4
Figure no. 1 The labour demand effects
First, a rise in productivity trend entails a fall off in employment on short-term.
But it is not possible to detect an effect of productivity growth on aggregate employment in long-term data. Old jobs lost in declining industries (because of productivity growth) are compensated with new jobs which are created in the expanding sectors of the economy. In their study Barnes, Johnson, Kulys and Hook show that productivity growth does not appear to be associated with a fall in employment at the aggregate level, and can contribute to employment growth. Productivity growth can mean doing more with fewer people in some industries, but growth in output and incomes made possible by productivity improvements creates jobs throughout the economy.
Second, an “output demand shock”, associated with a rise in money stock, will shift output demand curve outwards and thus raise both inflation and employment.
Third, by contrast, an “output supply shock”, associated with a rise in unemployment, will also raise inflation but will reduce employment.
Fourth, when external shocks like import price shocks or tax increases reduce the feasible growth of real consumption wages; this generates more wage pressure, which requires more unemployment to offset it.
Fifth, a more efficient matching between job vacancies and unemployed workers (labour market institutions effects) generates a rise in employment. The resulting smaller ratio between vacancies and unemployment reduces wage pressure, which, because vacancies are costly to employers, provides an outward shift in labour demand. (Estevão, 2003).
4. Conclusion Romania is characterized by the existence of a dual labour market with
agriculture and migration playing a buffer role for the employment losses in the restructuring process of the industry. During 2000-2005, Romanian labour market had a contradictory evolution. Occupied population (labour market demand) and labour force (labour market supply) have been decreasing in recent years indicating that economic
104
Revista Tinerilor Economişti growth did not yet have positive effects on employment. However the unemployment rate decreased to 5.8% in 2005 thanks to a positive equilibrium between labour market demand and supply. Temporary and permanent migration is another element to take into account. Labour productivity exceeded real wage trend generating a plus of labour demand. ALMPs exerted a positive effect to labour market demand concurring to unemployment fall.
This paper emphasizes the effects of key macroeconomic variables on employment levels and unemployment dynamics, unifying framework and seeks to understand which policies drive to a general welfare state. Domestic demand-led expansion is the cornerstone of the employment strategy. This means placing due emphasis on the domestic market, instead of being too preoccupied with competitiveness in the external market. A crucial component of this approach is not to separate the objectives of growth in productivity, and in employment. This separation typically happens, because productivity growth is considered only as an instrument for enhancing competitiveness, while it is forgotten that higher productivity together with higher employment makes more goods and services available for the domestic market.
Increasing the labour productivity can be achieved by the following measures: acting against the black labour market, initiation of some actions that will lead to a reduction of new jobs creation; trying to equalize the offer and the demand on the labour market by stimulating the in-training formation, taking into account the effects of the information society, stimulating the companies to apply the new technologies and new forms of management.
Neglecting the links between employment, productivity and output growth within the Romanian economy can lead to fail to deal effectively with unemployment, low productivity and income inequality, and so will preserve the poverty for a large part of population.
REFERENCES 1. Barnes, P.
Johnson, R Kulys, A. Hook, S.
Productivity and the Structure of Employment, Productivity Commission Staff Research Paper, AusInfo, Canberra, 1999
2. Bhaduri, A. Macroeconomic policies for higher employment, in the era of globalization, Employment Strategy Papers, 11, Employment Strategy Department, World Bank, 2005
3. Blanchard, O. Wolfers, J.
The Role of Shocks and Institutions in the Rise of European Unemployment: the Aggregate Evidence, The Economic Journal, 462, 2000
4. Estevão, M. Do Active Labour Market Policies Increase Employment?, IMF Working Paper, 03/234, 2003
5. Landmann, O Employment, productivity and output growth, Employment Strategy Papers, 17, Washington DC, The World Bank, 2004

105
Management – Marketing - Tourism
PERSONAL VERSUS MASS COMMUNICATION
Assoc. Prof. Ph.D Girboveanu Sorina University of Craiova Faculty of Economy and Business Administration Craiova, Romania
Abstract: From the comparison of the various aspects of advertising and personal selling, it can be seen that personal selling is a more effective and powerful communication tool than advertising, but advertising is more time and cost efficient than personal selling. Thus advertising and personal selling are tools at the disposal of a marketer and subjects to a firm’s overall objectives.
Keywords: advertising, personal selling, communication, tool.
Why it is so much money spent on advertising? Is advertising necessary? The answer is that no purchase can take place without some form of communication between the seller and the potential buyer. The exchange of money for some product or service takes place when all the participants in such a trading activity have been informed of and have accepted the terms and conditions of the exchange. In a free market society, consumers buy goods and services because they hope to obtain satisfaction through their usage and consumption. In the same way, people give financial support to charitable organizations because they obtain some reward, if only psychologically, by doing so.
Advertising as a Socio-Economic Communication In order to build a communication link between mass production and mass markets,
a mass communication tool was needed, and the device was advertising. Most definitions of advertising stress three basic elements – that advertising is communication aimed at a mass audience and that it has a socio-economic function. For instance, the definition given by the American Marketing association is as follows: Advertising is any paid form of non-personal presentation and promotion of ideas, goods or services by an identified sponsor.
The first element in the definition is that advertising is a set of communications originating from a sponsor. The flow of information is unidirectional and is directed at the advertiser’s customers and prospects. The second element is that advertising is mass communication, because it is directed at an entire market. It is different from such business communications as internal communication within a single firm or from marketing communication that a firm has with clients involving personal contact, such as personal selling through a sales force. Third, advertising has a socio-economic function, resulting from its long-run objective of convincing customers and potential buyers to buy a firm’s advertised products or services or to adopt the advertised idea or behavior.
1. The Economics of Advertising Communications. It is important to emphasize that commercial advertising has a precise economic objective. This objective is, in the
106
Revista Tinerilor Economişti long-run, to contribute to the firm's sales and profits. To meet this objective, advertising is assigned short-run objectives that contribute to a firm's wide objectives.
To be justified from an economic point of view, advertising, along with the other elements of the marketing program, must help generate a firm's gross profits (long-run, and discounted at their present value, but excluding the direct costs of advertising). A marketer's task is to ensure that a firm's gross profits are greater than costs of advertising, which include the costs of media, the costs of creating and producing the advertisement, and the research costs, so that the firm retains a flow of net profits.
2. The Social Objectives of Advertising. Increasingly, advertising is being used by non-profit organizations. For instance, an advertising campaign to raise funds for a cancer research institute, the Red Cross, or some other charitable organization, does not result in sales and profits. An advertisement campaign to induce people to adopt better health habits, or to use safety belts in their cars, or advertising messages sponsored by a political party to gain citizens' votes for the next election do not result in dollar-measurable effects. Whenever advertising is used, however, certain social benefits are anticipated by the sponsors. Whether the social gains warrant the advertising expenditures is a far more difficult question to answer because the effects are not quantifiable as for business advertising. Nevertheless, no advertising campaign is likely to be run unless the sponsors feel that the social and/or economic gains warrant the advertising expenditures.
Personal versus Mass Communication Personal communications through sales representatives and advertising
communications have a common objective: both are directed at potential customers to increase a firm’s sales and profits. However, the two types of communication differ in their nature and effectiveness because of two essentially different characteristics they possess: the type of medium they use and their cost structure.
1. The Medium of Personal Communications. Advertising communications are transmitted through the mass-media newspaper, magazines, television, and radio. In contrast, sales force communications take place between a salesperson and a customer, a prospect, or at most a small group of potential customers.
Figure no. 1 and Figure no. 2 show the difference between the personal selling communications and advertising communications. A firm communicates with its sales force through training or retraining programs, which are formal communications systems. Sales meetings and directives that a sales manager periodically sends to sales personnel are examples of the more usual and recurrent formal communications. During sales calls a sales representative communicates information to customers and prospects. Unlike advertising, however, these communications occurs more than once and are multidirectional: the information flows back and forth between the sales representatives and customers and prospects. For instance, a sales representative inquires about a customer’s need. To do so a representative gives information about the products and services for sale and answers the questions and objections of prospective buyers.
This information goes back and forth between the sales representative and the customer in a continuous and two-directional communication flow. This continues until the customer ends the process by signing an order or by changing attitude.
These attitudinal or behavioral changes constitute the feedback on the effect of personal selling communications. Another important difference between personal communications and advertising is that during a sales call a sales representative can
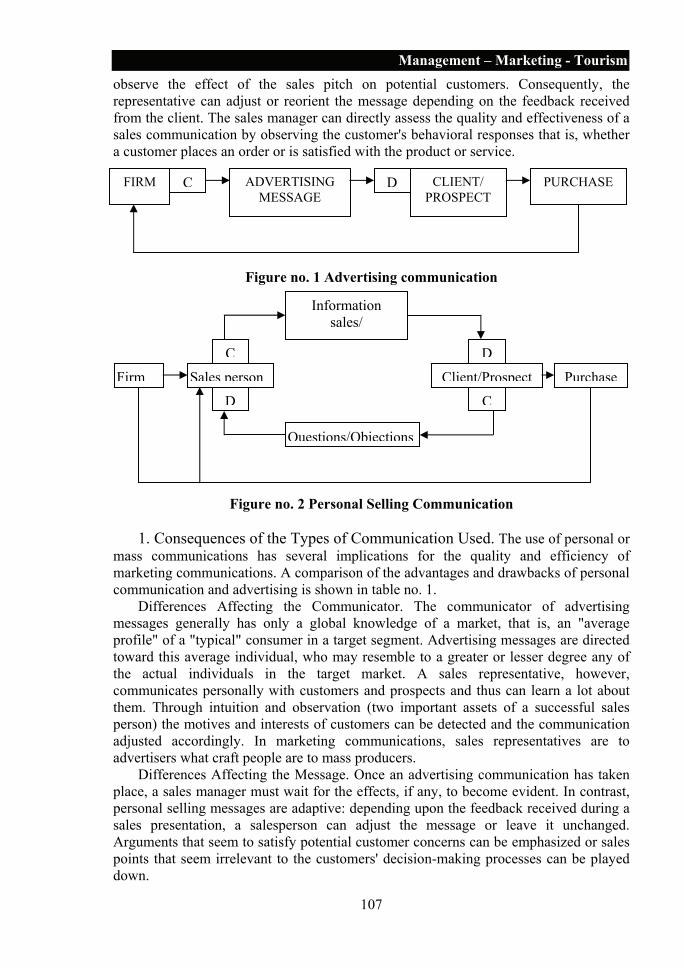
107
Management – Marketing - Tourism observe the effect of the sales pitch on potential customers. Consequently, the representative can adjust or reorient the message depending on the feedback received from the client. The sales manager can directly assess the quality and effectiveness of a sales communication by observing the customer's behavioral responses that is, whether a customer places an order or is satisfied with the product or service.
Figure no. 1 Advertising communication
Figure no. 2 Personal Selling Communication 1. Consequences of the Types of Communication Used. The use of personal or
mass communications has several implications for the quality and efficiency of marketing communications. A comparison of the advantages and drawbacks of personal communication and advertising is shown in table no. 1.
Differences Affecting the Communicator. The communicator of advertising messages generally has only a global knowledge of a market, that is, an "average profile" of a "typical" consumer in a target segment. Advertising messages are directed toward this average individual, who may resemble to a greater or lesser degree any of the actual individuals in the target market. A sales representative, however, communicates personally with customers and prospects and thus can learn a lot about them. Through intuition and observation (two important assets of a successful sales person) the motives and interests of customers can be detected and the communication adjusted accordingly. In marketing communications, sales representatives are to advertisers what craft people are to mass producers.
Differences Affecting the Message. Once an advertising communication has taken place, a sales manager must wait for the effects, if any, to become evident. In contrast, personal selling messages are adaptive: depending upon the feedback received during a sales presentation, a salesperson can adjust the message or leave it unchanged. Arguments that seem to satisfy potential customer concerns can be emphasized or sales points that seem irrelevant to the customers' decision-making processes can be played down.
FIRM C ADVERTISING MESSAGE
D CLIENT/ PROSPECT
PURCHASE
Firm Sales personC
D
Information sales/
DClient/Prospect
C
Questions/Objections
Purchase

108
Revista Tinerilor Economişti Tables no. 1 Comparison of the advantages and drawbacks of advertising and
personal selling as communication tools personal
selling advertising
source - Communicator's knowledge of the audience + - - Flexibility and adaptability of messages + -
message - Number of arguments that can be effectively used
+ -
- Control by the firm of the content and format of the message
- +
medium - Personal contact + - - Possibility of communicating with many
consumers in a short period of time -
+
- Effects of coding errors + - audience - Ability to attract and hold consumer's
attention + -
- Time of which communication takes place + - effects - Time lag between communication and
purchase + -
In the media, an advertiser can emphasize at most one or two reasons of buying a
product. This is not the case for the salespeople, who can stress many persuasive selling points during a single sales call.
An advertiser can, however, have some control over the sales messages content and presentation. Advertisers carefully select the theme, copy, and layout of their advertisements. They make sure that the message can be properly understood by prospective buyers and can influence their target audience.
Sales managers can also test sales arguments and train the sales force to make effective presentations. However, a firm has no direct control over the exact content and wording of the message each salesperson actually delivered by a sales manager can do little to prevent salespeople from delivering poor presentations or being rude to customers.
Differences Affecting the Media. Personal and advertising communications have both advantages and drawbacks with regard to the effectiveness of the media through which a message is delivered. A sales representative has the advantage of establishing personal and often lively communication with a customer or prospect, while advertising, and especially print advertising, can be perceived by consumers as an impersonal way to communicate. However, advertising has an important advantage over personal selling: through the mass media, it can reach a large number of people in a short period of time, whereas a sales representative can make only a limited number of calls in a day.
Differences Affecting the Audience. This latter advantage of advertising over personal selling has a negative counterpart in its effects on the audience of the communication. Any blunder that a sales representative makes during a sales call affects only that customer or prospect. At worst, an inadequate salesperson affects sales negative during the time he or she is part of the sales force and only in a limited territory. But an advertisement in poor taste has more damaging effects because it reaches an entire market simultaneously.

109
Management – Marketing - Tourism A salesperson also gets some attention from a client once the sales pitch has started.
In contrast, the attention gives to the mass media and to the advertising messages they convey cannot be controlled. Commercials often reach consumers during their leisure time, when they are watching television or reading newspapers or magazines. In contrast, a salesperson usually calls on customers during working hours; meeting sales representatives is often a part of the duties of the individuals on whom a sales representative calls. Thus, the audience is more favorably disposed toward listening to a sales pitch.
Differences Affecting the Effects. As far as communication effects are concerned, personal selling has a distinct advantage over advertising because it produces immediate responses. After a salesperson has succeeded in proving to a customer that the offer is superior to that of competitors, the selling process can be completed by persuading the customer to sign an order. In contrast, even when a commercial has been convincing enough to trigger the act of purchasing, this behavioral response cannot be immediate. There is always a time lag between the moment a commercial is seen or heard by a consumer and the moment the purchase is completed. This lag is the time necessary for the consumer to drive to a neighborhood store or, more realistically, to wait for the next purchase occasion. Of course, during this time, the consumer may be subjected to other commercials from competitive products or may decide not to buy the product.
A Cost-Benefit Comparison of Both Types of Communications From the comparison of the various aspects of advertising and personal selling, it
can be seen that personal selling is a more effective and powerful communication tool than advertising. This does not mean that only personal selling should be used as a marketing tool and that advertising should have only a marginal role in a firm's marketing program. Contacting an individual through a sales representative cost is about a hundred times more than an advertisement. Consequently, unless the personal element of a selling communication is essential to a firm, marketing managers will find that advertising is more time and cost efficient.
Advertising can be defined as a mass communication tool with an economic purpose. There are several implications of the definition, and any study of advertising should include an analysis of communication theory and the role of advertising in a firm's communication system. Advertisers also need to understand the role advertising and personal selling play in the marketing program.
From these analyses can be drawn some important conclusions. First, because advertising is a mass communication, it tends to lose contact with its audience and is efficient only if it is based on research. Second, advertising is not an isolated phenomenon in a firm's activities and must be an integrated part of a firm's communication network. Third, advertising is only one tool at the disposal of a marketer and therefore is subject to a firm's overall objectives. Therefore, it must be integrated with the other marketing elements into a coherent marketing program.
REFERENCES 1. Darmon, R.,
Laroche, M. Advertising in Canada – a Managerial Approach, McGraw-Hill Ryerson Limited, Toronto, 2000
2. Westphalen, M. Communicator – le guide de la communication

110
Revista Tinerilor Economişti d’entreprise, Dunod, Paris, 2004
3. Lendrevie J., Lévy J., Lindon D.
Mercator – théorie et pratique du marketing, Dunod, Paris, 2006
4. Kotler, Ph., Turner, R.
Marketing Management – Analysis, Planning, Implementation and Control, Prentice Hall Canada Inc. Scarborough, Ontario, 1998
5. Arens, W., Bovée, C.
Contemporary Advertising, Irwin, Illionois, 1994
111
Management – Marketing - Tourism
THE PRESS RELEASE – THE MEDIA INSTRUMENT FOR INCREASING COMPETITIVENESS
Ph.D Student Alina Cătăneţ Media University Faculty of Management of Affairs Bucharest, Romania Assist. Ph.D Student Cătălina Radu Academy of Economic Studies Faculty of Management Bucharest, Romania
Abstract: More and more companies use press releases to promote a new product or service or to announce a big project which can increase their competitiveness. Through this cheap instrument the actual organizations maintain themselves continuously active in the eyes of target groups. Writing good quality press releases requires experience and skill and knowing and respecting of some important rules.
Keywords: competitiveness, marketing media, press release, advertising, communication, public relations.
Bill Rivers, ex-professor at Stanford University describes the multiple varieties of the public categories: „ The number of the public categories it is equal with the number of groups with different political orientations, different religions, and different incomes per families. What is motivating and convincing a group category it’s possible for other category to be without importance.” An organization can not raise the curiosity of all public categories; it must capture the attention of its target groups. In the modern market, with a strong competition, the organization must choose the best instruments for attract its target groups and must penetrate only the channels connected to its target. Radio it’s not a proper channel for informing people about complex subjects, like the funds for endowment with equipments for a university, but newspapers and magazines are. When an organization wants tot inform all its public categories it must address to the publications and to other media channels like TV. The television it’s an expensive way of advertising, not all the information about an organizations deserve this kind of advertising. For example the inauguration of a new branch of one multinational financial institution can be announced both in TV and press because it’s an important event concerning the life of the organization and the allocated budget afford this kind of advertising, but an event like the opening of a new shoes store it won’t attract anybody for appearing in the news at TV and in press.
The reason organizations want to appear in media is double: first, the presence in an important publication or at TV gives the presented information a lot of credibility. The second, if a news release appears in a newspaper with an online agency, people can find that information in multiple places without other costs. The repetition is favorable. This article presents the advantages of using press release in front of TV because the budget is cheaper, and organizations have the certainty of appearing in the minds of people more than a date. It can be used by all kinds of organizations.

112
Revista Tinerilor Economişti Press release is an official statement issued by companies to print media. It can
be purely factual and address a specific issue or it may be promotional. Some press releases are made in house, by their own specialists, while others are generated by public relations agencies. Nowadays, the access of the press at some important events can be restricted, so the press relies on these documents which are the only source for forming the factual basis for its articles. Press release has a triple quality:
1. it has the capacity of maintaining the notoriety and the credibility of the organization
2. newsworthiness-there is a promise for the importance of the information and for the value of the article
3. it offers power and responsibility to the author A wrong written press release may affect the relations with the press and the image of the organization, which can reduce the trust of the consumers and may increase the power of the competition.
The news The renowned consultant in public relations, Philip Lesly said that the
communication channel decides, in most of the cases, what are the news that deserved to be published or not. There is not a unique opinion about news. The specialists in public relations know especially the practical aspects: news is what media is publishing. If an organization wants to appear on the first page of the newspapers, the information in their message must be very strong and influent. If the article has not value as news, the readers won’t buy the newspaper. The value of the news stays the base criterion when it’s establishing what is to be used or not. The reporter is looking for an interesting story for its readers and satisfying for the chief publisher. He is not necessarily interested in the products or services of the organization. He just wants to obtain the information for his article. In the case the story of the organization has a selling view there is a big probability for the article to be not published. The organization must outrun the impulse of selling its products or services through the press release; the solution is to tell the story in an objective way, at the third person style.
The press release can be sent alone, through email or fax or like an important part of a press kit. The journalists decide if the press release will be published in this form or it will be modified. The press release must be appropriate to the journalist’s domain. For example, you can’t send a lifestyle material to a chemistry and physics magazine, it’s useless and it will not be published. Also, you can’t send a lifestyle article to a lifestyle magazine later than the deadline for publishing. The press release must arrive in utile time.
Beyond these logical and simple rules, which can be known by all the people there are some important rules concerning the format of the press release. Without these rules the document has big chances to stay unpublished.
The structure of the press release The first paragraph is a summary of all the material and is calling the lead. The
subject of the story must be presented from the beginning for increasing the curiosity of the readers. In a press release, the subject of the article is rarely the name of the

113
Management – Marketing - Tourism organization. For example, it’s better to say “40% of the Romanians had watched at ProTV last Friday the show Dancing for you” than saying “ProTV had recorded last Friday a huge audience because 40% of the population had watched the show Dancing for you…”
A good press release can not be written well without a good lead and for that the writer must identify what is the most important thing concerning the organization. For example Citibank had opened in the summer of 2005 a new division which is addressing to the local successful enterprises, with turnover of 2 – 50 millions USD, leaded by powerful and skillful entrepreneurs.
The press release of the Citybank was informing the targeted people on the launch of Commercial Bank Division and its products and services and was building its positive brand image, as powerful and trustful counselor and partner.
The most important thing is the fact the new division is beginning its activity. The action is the news. In the lead the readers must find the answers of the questions: Who? What? When? Where? Why? How?
The next paragraphs must describe: the advantages- what is different, what is new; the applicability and the utilization way; informations about context, other specifications. Next paragraph is about the organization and its called paragraph corporate. Through these paragraphs can be introduces quotations of the representatives persons from the organization.
The final rows are dedicated to the name of the writer, the date and other informations about the public relations agency or organization and represent a declaration of identity.
Check list for the press release: 1. The introduction is direct and strictly connected with the subject? Does it
contain the most important elements of the subject? 2. There were answers in the first paragraph at the questions: Who? What?
When? Where? Why? How? 3. Are the phrases short and concise? 4. The quotations are naturals, originals? 5. The orthography and the punctuation are correct? 6. The affirmations were checked? 7. The press release is dated? There are noted the names of the authors and the
contact details? If all this points are checked the writers can send the press release to the press
for publishing. The advantages of the check list are: it assures a good control of information succession, it assures the writer/writers there is not a lack of information (the journalists don’t have to call and ask for supplementary details), and it offers a structure with seven paragraphs.
The types of press release The seven types of press release are described below: 1. The press communicate in seven steps is dedicated to launching new
products and services. It’s better to be written on a single page. 2. The press release with background information. Its goal is to maintain the
journalists well informed and to maintain a good relation with them. 3. The technical press release with summary. The technical product and
services require sometimes communicates of two or maybe three pages.

114
Revista Tinerilor Economişti The journalist can be helped conceiving an article which may contain some technical aspects.
4. The explicative press release. The annual reports of the organizations, some documents and speeches must be presented together with a short communicate which presents the most attractive information for calling the readers. There is the risk that receiving the report, the journalist won’t read the report without a press release.
5. The developed photo explanation is a hybrid between the press release and photo explanation. Choosing the right photo is more important than writing some paragraphs in some cases. The photo tells the hole story and the writer must add only a few words to complete the article.
6. The short news. For a sample promotion of a manager or for a changing address of an organization is using a single paragraph.
7. The retort press release. Sometimes, the news can appear from others sources than public relations or organizations. For example a group of consumers can write a critical report about a service from a company. In this situation the journalist can ask to that company a retort in which must be presented the position of the company.
The type of writing There are some writing rules for the press release and its fulfillment can drive it
direct to publishing area. The characteristics of the modern journalism are shorter phrases and paragraphs, the avoidance of the superlatives and the factual information. It’s recommending a single page for classical press release and avoiding wood language. The presence of the numbers (numbers from 1 to 9 in words and numbers bigger than 9 in ciphers) and statistics can increase the degree of responsibility of the organization. If there is an event which can interest different kinds of publications, like: business, media, central press, it’s better for the organization to write more press releases with different angles of view. The goal of the organization is to increase its competitive advantage on the market and to gain more and more clients. Showing respect to the journalists and to the readers of the newspapers, the organization increases the chances of a good communication with them. The health of a good communication has the key in good using of the press releases.
REFERENCES 1. Lesly, Phillip Relation with Publicity Media, Prentice Hall, 1971 2. Newsom,
Doug Carrel, Bob
Public relation writing, Polirom, 2004
3. Green, Peter Reputation is everything, Burr, 1993
115
Management – Marketing - Tourism
STRATEGIC CONTROLLING IN ROMANIA-SUPPORT OF MANAGERIAL DECISIONS
Lect. Ph.D Valentina Oargă Prof. Ph.D Emilia Novac Lect. Ph.D Student Denisa Pop - Abrudan West University of Timişoara Faculty of Economics Management Department
Abstract: This paper introduces theoretical matters concerning the strategic controlling procedure as well as economical practice elements up to corporate group branch. Especially by its concurrence to strategically scheduling and its add to strategically feed forward and feedback process, the strategically controlling supports the composition of managerial decisions on strategic level.
Keywords: controlling, decision, management.
1.Introduction In Romania, in perspective of adherence to European Union, the economic
success depends directly to the quality of managerial decisions. The professionalism, the seriously, the conscientiously, the order and the discipline are elements with the most value, who managers allow for, if the success is wanted.
Therefore the management is constrainedly to swarm different situations, to notice and fructify the opportuneness and avoid threats, having permanently under observation the inside and the outside environment of the company. Among the five managerial functions: planning, organization, decision, train and control, witch defines the manager, in our opinion, is decision.
The decision belongs exclusively to the manager, he responds for the consequences of his chooses, those consequences influence firmly the evolution of the company events.
For those reasons, comes out as a very natural thing, the manager to get help. The help comes through controlling, front-rank managerial instrument, witch his contribution to managerial decisions, and helps attain company objectives.
The purpose of our paper is to present theoretic and practical aspects witch concern the controlling up to strategic level in Romania, proving that, the controlling, through what his doing, is the support of managerial decisions.
The accost perspective is as well theoretic as practical, on example the branches of concern from our country.
The research method has as support the interview taken personally by controllers from branches of concern from Romania, interview with a questionnaire as a support.
116
Revista Tinerilor Economişti 2. Controlling-Bases Consult
Controlling first appeared in S.U.A of the beginning of the XX century and then appears in Europe: in France, England, the tongue German space, Hungary then after 1990 in Romania too.
Comprehended like central function of management in S.U.A. and in the tongue German space, as a managerial instrument, in opinion of practicians Deyhle, Preissler, Mann and Mayer [Eschenbach, 1996], controlling is practiced today in all international concerns.
Suggestive seem to us the definition elaborated by Mann and Mayer, witch considers that, controlling is a circular system of rules, witch helps attain company objectives, avoiding surprises, signalizing in time dangers that requires corrective actions.
In our point of view, the controlling practiced in Romania is the instrument that helps the manager exert his functions, especially taking the right decision so, the company can control in permanence the future.
The ones who realize the activity of controlling is the controller, not only he doesn’t work alone but in collaboration with the manager, so controlling comes off in the team build by the two partners in there way to success.
One of the possibilities witch controlling appeared in Romania is because, some international concerns had opened branches in our country too. So the implementation of controlling in Romania’s branches appears as a necessity.
The objectives of controlling are both direct and indirect. Like direct objectives of controlling we recapture:
The insurance of capacity of anticipation and accommodation of the organization to the environment events;
The insurance of capacity of coordination; the controlling coordinates the managerial system, while the managerial system coordinates the operational system;
The insurance of capacity of reaction. The indirect objective of controlling is to support management in insurance the
balance between the company’s environment, his employs and owners of the capital. Considering the pursuance functions by controlling, they appear as
complementation of management’s functions, namely: coordination, invocation and the information.
As regard of controlling’s tasks, those retrieve at three levels: normative, strategic and operative. The assignment of information is figure out not only as a function but also as an assignment and is retrieve at all three levels controlling.
3. Strategic controlling-theoretic elements The strategic controlling represents in our opinion, that dimension of
controlling witch completes strategic management through our contribution witch he has not only to strategic planning but also in the feed forward and feedback strategic process.
A central necessity for any organization is presented by elaborating resistive and creative strategies that can help realizing the competitive advantages.
Strategic controlling means on one hand a way of thinking (thinking and strategic action) and in another way the creation of groundwork (instruments, formality process) to support strategic planning and the implementation process of strategy through the service of information and coordination.

117
Management – Marketing - Tourism The contribution of controlling to the strategic organization is resuming at:
• Supporting the strategic planning process; • Supporting the strategic implementation process; • Identify the problems and the deviations from the objective before he
can reflect in the operative figure. Strategic controlling and operative controlling interconnects in a circular
system of rules. This way we can show the strategic decisions effects and insure the transposition of the strategy in operative planning and carry off actions. Strategic controlling, as organizationally connect between strategic planning and strategic control, can recognize in time the deviations or delays in transposing in practice the strategy and can make possible taking the necessary actions of controlling.
The turbulent environment of organization makes more and more needful in practice strategic feed forward and feedback. The strategic process of feed forward and feedback contains conceiving scripts which makes possible taking the actions in present for avoiding deviations which hasn’t appear or for there diminution. There are three types of strategic feed forward and feedback:
• Strategic controlling of executions; • Strategic controlling of premises; • Strategic stakeout.
Because of the actual dynamics of the organization’s environment the
management’s assignment to adapt the organization to the changes of environment is more and more difficult to assign. The management has to be conscious that the future events are not predictable and that is very necessary a series of methods and instruments for recognizing in time the deviations.
The conclusion is that management needs to make so that, despite the environment’s turbulence, the organizations needs to achieve there goals, resisting to the changes of environment. For helping management to attain his assignments, is needed inside of de strategic feed forward and feedback processes by the active help of the controller.
4. Strategic controlling in Romania-aspects of the economics practice In Romania comparative with other countries (Germany, Austria, Hungary ),
controlling applies at approximate 10% of companies, in commercial societies belonging to easily industry or textile industry and textile products, cellulose industry, paper and cardboard (S.C. DunaPack Rambox S.R.L.), garment textile industry, coats and skin(S.C. Eybl Textile- Automotive-Texttrade S.R.L.), chemical industry (manufacture industry of rubber and plastics ) - Continental Automotive Products S.R.L. from Timişoara, etc. other organizations who practice controlling are Price WaterHouse Coopers, Solectron, Electrolux, Siemens, Richard Halm, Novar, Mondial, Delphi Packard, Zoppas Industries, Dräxlmaier. All this are concern branches.
In this part of our paper we will axes on the presentation of the contribution of controlling to strategic planning, to strategic feed forward and feedback process. Through all those activities which he carry out, controlling assure in fact the support of the managerial decisions. The strategic planning is preceded by decisions, strategic feed forward and feedback processes, witch represents in fact comparisons, and are the support of controlling reports, are preceded still by decisions. This support is insurance through the information given by controlling.
118
Revista Tinerilor Economişti We will explain our exhibition on the case of two concern branches namely:
DunaPack Rambox S.R.L from Saint Gheorghe, in Covasna and Eybl Textile Automotive Texttrade S.R.L from Deta, Timiş.
S.C. DunaPack Rambox S.R.L it’s one of the most modern bagging factory of corrugate board and micro corrugate board from Romania.
Controlling department from S.C. DunaPack Rambox S.R.L. is composite by five persons. The activity of this department is centered on the following assignments: planning, the elaboration of controlling reports, calculation of the costs, determination of the price, preparation the materials for the managerial sessions, occasional coordination of the gather papers and the distribution of the statistic dates, occasional preparation of the economics analyses.
The planning method used inside of this branch is the mixed planning enterprising from the concern. This way the general objectives are fixed to the center of DunaPack S.A. from Hungary and the branches elaborates there own plans taking in consideration the parameters imposed by the concern. After that the concern resumes the branches plans and will correct the eventual deviations.
Up to concern level planning starts in September of the current year for the next year and up to branch level managers determine on there time other periods for realizing plans in the branch we refer to.
The controlling department from Ramboxb S.R.L. elaborates the following plans: annual economic plan of the branch, strategic plan, the plan on costs center. The dates from this plan will be the base for the controlling reports witch is made monthly. Those dates from the controlling reports will be compared monthly with the dates from the plans. Are eleven controlling reports and are evaluated monthly by the branches manager and the manager from DunaPack S.A from Hungary. The information needed to form the controlling reports is supplied by accounting, but also by every department inside of the branch.
S.C. Eybl Textile – Automotive – Texttrade S.R.L. from Deta, in Timis is an Austria concern branch Eybl International AG, witch has the location in Krems, Austria and is own by the principal supplier of upholstery for cars from Europe. Controlling activity comes to one single person, the controller, subordinated to the controlling of concern and economic direction inside of the branch. But inside of the branch the controller receive instructions directly from the general director, witch he presents also the controlling reports.
The controller’s assignments refer to: planning, lay down controlling reports, costs calculation, preparing materials for sessions, preparing information for some economic analyses.
The controller’s daily schedule outbalance 8 hours, and 4 of them are dedicated to the reports to concern, and the other part of the time is allocated to accounts and intern contracts, following the keeping terms and the contractual obligations. One day a week the controller follows up the rotation speed of founds and two days a week are allocated fallowing weekly the cash-flows. The adjustment of data to concern are made in the second workday of the month, adjustments witch add in the situation of costs and establishments from antecedent month and justifying the advance money cashed in he circulating medium by the branch. The branch’s controller collaborates with the concern’s controller by: e-mail, fax, telephone, conference calls, and personal discussions.

119
Management – Marketing - Tourism The branches inside of the Eybl International AG concern collaborates regard
planning like wise in elaborating some new indicators specifics to the controlling activity.
Up to concern level planning evolves inside of a session of Administration Council of Eybl International AG concern. Up to concern level is blueprint the strategic plan and at Delta branch is realized the operative plan.
Planning starts after the concern decides that. Before starting the planning, the branch presents to concern the result of the current year and the antecedent year, the results that will be evaluated. The concern determines the objectives for branches, the responsible ones and the terms and the branches will present prognosis for current investments and business plan. The branch elaborates the annual plan in particular for the next year, and then on that base branch elaborates the financial plans. After the concern accepts those plans, they are readdressed to branches because they need to be brought to accomplish. Those plans will serve as compare base for controlling reports. Controlling reports inside the Delta branch are nine, elaborated monthly, trimestrial and annual and for there elaborating the controller gets information from all branches departments, they updating and then transmit the reports not only to the concern but also to the general manager of the branch.
What I’ve presented here it represents just a part of strategic controlling a certain part that catches on the collaboration between concerns and their branches from Romania. Regarding the kind of radar instruments and the strategic games and so the strategic communications, they come off exclusively to the center, inside the concerns and it does not involves the branches.
5. Conclusions The management’s assignment is to realize and maintain the competitive
advantages and transform them in values of the organization or the owners. Strategic decisions need to find the direction firstly to costumers advantageous, and then need to be satisfied the employees financial request, suppliers, etc. The controlling, through all he makes, helps the management in taking the right decision.
Our conclusions regarding the so called controller’s activity are the following: • Is preoccupies to exist a strategic conscience inside the organization; • It documenting in permanence, creating in the same time the exploration system in
time of the weak signals from the environment; • Is reshaping those signals and transmits them to the management by compact
information regarding the opportunities and the environment threats; • Helps the organization’s and the environment’s strategic analyses, by putting at
command those information like wise by collaborating to build and strapping informational systems and analyses instruments;
• Sets up, restyles and coordinates the elaboration and the strapping of the strategy, having care that all this realize in opportune time;
• Supports the elaborate and apply process of the strategy by know-how for process and know-how for methods;
• It realize compares Plan- Achievement and informs currently management about strategic application result;
• Brings in measures for objective deviations and follows their application;

120
Revista Tinerilor Economişti
• When the situation enforces (modifications in politic environment, juridical, regarding clients behavior, competitors, etc.) is initiating an reviewing process of the strategy, following the organization’s strategy adapts to the modified conditions of the environment;
• Its assurance the strategy’s transposing in operative planning. We notice that in this context the contribution of controller is essential.
Strategic controller supports strategic management in the strategic planning process, taking care so that the strategies choose is good; to be transcribed in operative planning, to be adapted to the environment’s modifications and to give well anticipated results. The organization’s turbulent environment makes more and more necessary in practice the strategic feed forward and feedback. Through all this up to strategic level the controlling helps directly the management to take the correct decision, giving all the necessary information, making suggestions, but living the decision to the manager.
We appreciate that in Romania, in the future controlling, like managerial instrument, will impose more and more, wining field because of the certain advantages that it offers.
REFERENCES 1. Horváth, P. Controlling, Edition KJK, Budapest, 1993; 2. Mann, R.,
Mayer, E Controlling. Profitable managing of the enterprise, Edition All, Bucharest, 1997
3. Oargă, V. Practice controlling in Romania , the VII th International Symposium of Management: “The management of perform organizations in the beginning of the third millennium”, Timişoara, 12 – 13.12. 2003;
4. Oargă, V. Controlling, Edition Mirton, Timişoara, 2003; 5. Oargă, V.,
Molnár, R. Inauguration in controlling, Edition Brumar, Timişoara, 2000

121
Economic Theories – International Economic Relations
CHILD LABOUR IN PAKISTAN AND OTHER DEVELOPING COUNTRIES
Prof. Ph.D Himayatullah Khan Institute of Development Studies (IDS) NWFP Agricultural University, Peshawar, Department of Development Studies, COMSATS Institute of Information Technology, Abbottabad, Pakistan
Abstract: Child labor has been acknowledged as a serious and challenging issue in the civilized societies around the globe. Its continued existence remains a source of concern for all segments of human society. In spite of the threats of trade barriers, in spite of the call of moral understanding of the issue and active participation of government employers, workers and NGO’s, the prevalence of child labor in the developing nations is one proof that practical dependence on working children still has an alarming sound around the world.
Keywords: labour, child, Pakistan.
I. INTRODUCTION Child labor10 has been acknowledged as a serious and challenging issue in the
civilized societies around the globe. Its continued existence remains a source of concern for all segments of human society. Different socio-economic factors can be held responsible for the prevailing poverty, illiteracy, unemployment, lack of family planning, dissatisfaction about education system, absence of social security mechanism and many others. Now it is the responsibility of the government to provide children with their rights and to protect them from all sorts of exploitation, because the future of mankind and civilization lies in children. Their protection from physical and social hazards is a pre-requisite for proper development of children to ensure future progress and prosperity of mankind (Shah, 1997). Unfortunately a large number of children all over the world especially in developing countries are deprived of education and other facilities of life. The socio-economic pressure compels these children to work and as a result they face harsh realities of subordinate work simply for tiny monetary gains. The developing countries have been facing the crisis of child labor, due to poor economic and social conditions. Children in these countries work for longer hours in hazardous and life threatening conditions (Grant, 1983). A healthy child is an asset for a nation. It should be ensured that today’s children are physically, emotionally and educationally equipped for the future. Our responsibility is to meet their needs for health care, protection, economic support and education. This vision today is gaining popularity amongst the nations of the world and for quite sometime the intelligential has been trying to convince the world that protection of the most vulnerable and particularly growing minds and bodies of young children is both a moral imperative and a practical 10 "Child labor" is, generally speaking, work for a child that harms them or exploits them in
some way: physically, mentally, morally, or by blocking access to education.

122
Revista Tinerilor Economişti pre-condition for sustained economic growth and social progress (Ashraf, 1994).
The aim of this study to investigate: What are the worst forms of child labour? Who are child laborers and how many are there? Why children work? Where do child laborers live and what do child laborers do? What is the evidence regarding child labour in case of Pakistan? What are some of the myths or misunderstandings about child labor?
2. WHY CHILDREN WORK? Children are often prompted to work by their parents. According to one study,
parents represent 62 percent of the source of induction into employment. Children make their own decisions to work only 8 percent of the time (Syed et al. 1991). In fact, a possible reason parents in developing countries have children is because they can be profitable. Children seem to be much less of an economic burden in developing versus developed countries. Children in developing countries also contribute more time to a household than they deplete as compared to their counterparts in developed countries (Lindert 1976). Therefore, parents in developing countries make use of children's ability to work.
2.1. The Supply Side: what pushes children into work?
Poverty The main reason why children start work instead of attending school, or leave
school before completing their primary education is that their families are poor and cannot pay the basic costs of food and housing without their child earning something as well. Around the world, the details vary but the story is the same. There is not enough money for families to survive without some or all of their children working.
Family breakdown Families break down for many reasons, leaving the household short of income.
Sometimes divorce leaves one parent looking after more children than she or he can afford to feed. Divorce is sometimes brought about by domestic violence, which also directly drives children to leave home when they are still young. The death of either parent precipitates economic disaster for many households. In parts of Africa, this has now become all too common as a result of the HIV/AIDS pandemic.
HIV/AIDS By 2001, the UN estimated that 13 million children around the world under the
age of 15 had lost either one or both parents to HIV/AIDS. About half become orphans before they are 10. The result of the premature death of one or both parents is that children take on the responsibility of seeking an income to support themselves and their younger brothers and sisters. A survey in 2002 of girls working as domestic servants in the Ethiopian capital, Addis Ababa, found that more than three-quarters were orphans. More than a third of those questioned were not attending school11.
Attitudes to girls In most parts of the world, gender is also a crucial factor: girls are discouraged
from staying at school beyond puberty (and are sometimes withdrawn much earlier) and are propelled into adulthood much younger than boys, either into work or an early marriage. In some countries, school is a threatening place for teenage girls, where they
11 Quote from UNICEF DHAKA, 28-6-2002, UNICEF (online magazine).

123
Economic Theories – International Economic Relations are at risk of sexual harassment from male classmates and teachers, and sidelined by prejudice and poor curricula.
2.2. The demand: why employers want children?
Alongside factors which push children into earning money are others which pull children into the world of work.
Cheap and obedient The relatively low wages paid to children are often a reason why employers
prefer them to adult workers. Some children work unpaid, particularly as domestic workers, in conditions that would be denounced as “slavery” if they involved adults. Employers find children more obedient and easier to control. Unlike older workers, they are unlikely to initiate protests or form trade unions.
Inadequate laws More than 130 countries have signed an international convention saying that
children may not work full-time before 14 or 15 years of age. However, in some of the countries concerned, laws on this are confusing or vague and not enforced.
Poor infrastructure Another factor is the practical difficulty of establishing a child’s actual age in
countries where the infrastructure may not be in place for e.g. systematic birth registration. This can disadvantage children in many ways – law enforcers are hampered because they do not have the means to absolutely establish the ages of e.g. teenagers, and, without appropriate documentation, young people may also be denied access to state services such as schools.
The role of education Children who receive little or no school education miss out on the knowledge
that can create options for them later in life. Without it, they make less contribution as adults and are more exposed to exploitation and abuse. Not attending school is consequently both a cause and effect of child labour.
3. CHILD LABOUR IN PAKISTAN Pakistan's high population growth rate of 2.77 percent poses multiple
challenges, problems and threatens to constrain the limited resources and economic and social development of the country. Thirty percent of the country's population lives below the poverty line. Pakistan's per capita GNP is around US$490 per annum, but income is not equally distributed. The overall literacy rate is estimated at 40 percent: 51 percent for men and 28 percent for women. Given the high rate of population growth, a large workforce seeking employment is regularly being inducted into the labour market of the country. A large young labour force has emerged and competes with the adult workers for the limited employment opportunities.
Child Labour is a humanitarian issue with roots in poverty, high rate of population growth and unequal distribution of wealth in the society. The data given in Table 1 indicates the disparities in the distribution of income in the country. The inequalities in the distribution of wealth forces the families to resort to desperate measures including the use of children to earn extra income for the family. The data in Table 2 provides a comparison of the income distribution pattern in Pakistan with those in the neighboring countries. The Lorenz Curve of household income distribution depicts the inequalities in the household incomes.

124
Revista Tinerilor Economişti According to the National Survey of Child Labour conducted in 1996 by the
Federal Bureau of Statistics with the collaboration of ILO, the total number of children in Pakistan in the age groups of 5-14 was 40 million. The total number of economically active children was found to be 3.3 million (or 8.3% of the total children) in the country. Majority of the child workers (73%) were found to be boys, while 27% were girls. Majority of the child workers (58.6% or 1.94 million) were found in Punjab. The distribution of the child labour according to the economic sector is given in the Figure given on the following page.
The survey also found that children's involvement in work in the rural areas is about 8 times greater than in the urban areas. One third of the working children are literate, boys being more educated than girls and urban children more than the rural children. Employment status by broad categories indicates that about 70% of the working children are unpaid family helpers. Significant urban-rural differentials are observed in their employment status. In rural areas, three fourth of the working children are working as unpaid family members, while in the urban areas it is one third. About 46% of the working children work more than 35 hours per week and a good proportion work 56 hours or more. According to most of the parents surveyed, children work in order to assist in the household enterprises.
3.1. Provincial Comparison of Child Labour
Although majority of the child workers were found in Punjab, but as shown by the provincial comparison of the ratios of child labour, the highest ratio was found in the NWFP (Table 1).
Table no 1: Province-wise Comparison of Child Labour Province Total No. of
Children in age group of 5-14 years (millions)
Total No. of Economically Active
Children in Age Group of 5-14 years (millions)
Ratio of Child Labour
Punjab 22.63 1.94 8.6% Sindh 8.62 0.30 3.5% NWFP 6.71 1.06 15.8% Baluchistan 2.07 0.01 0.5% Pakistan 40.03 3.31 8.3%
Source: http://www.dolpunjab.gov.pk/r1.htm#a1
3.2. Participation of the Economically Active Children in the Labour Force in Pakistan As the figure below shows the majority (67%) of child labour works in
agricultural sector. Manufacturing sector accounts for 11%. The total number of economically active children in labour force in Pakistan is 3.3 million.
3.3. A Case Study in Pakistan
This study was conducted in the city of Bannu in NWFP. Bannu is a centre of trade and commerce lying on Peshawar – D.I.Khan Road. A large number of activities with child labor are prevalent in the city. These include activities like carpet making, mechanical workshops, hotels, shoemaking, tailoring, trunk making, snuff-making, shoe shining, electronic workshops, and other shops, etc. An informal survey was conducted in the first week of August 2001 and activities involving child labour were

125
Economic Theories – International Economic Relations listed and the number and names of children working in these activities were noted. In the second stage, 20% of the children were selected for data collection. The sample population and sample respondents are given in Table 2.
Table no 2 Sample Population and Sample Size S. No.
Nature of Activity Total No. of Children Working
No. of Children interviewed
1. Auto repairing workshops 50 10 2. Wood and Furniture 38 8 3. Cycle Repairing 25 5 4. Restaurants/Hotels 23 5 5. Retail Trade 60 12 6. Whole Sale Trade 48 9 7. Carpet Industry 12 2 8. Tailoring 50 10 9. Other (Shoe shine boys and garbage
collection) 23 5
All 329 66 Source: Survey The sample size consisted of 66 children. Sample respondents in each
activity were interviewed in accordance with their proportion in the universe. Data were collected with the help of a pre-tested interview schedule which was pre-tested before data collection.
3.3.1. Child Laborers and Socio-Economic Characteristics of their Households
A large member (48%) of the households had no land and was categorized as landless. Among all, 41% of the sample households operated farm area up to 10 kanals. Only a small proportion (11%) of the households operated land of 10 and above kanals. This implies that majority of households were poor because income and landholdings are positively related. This claim is supported by our findings as 71% of working children were from households with either no land or with land of up to 10 kanals. A vast majority (82%) of the working children belonged to households with monthly income of up to Rs.3,500. Only a small proportion (6%) of households had monthly income of Rs.4,500 and above. This was followed by 12% which had monthly income in the range of Rs.3,500-4,500. The data show an inverse relationship between household incomes and prevalence of child labour. Majority (73%) of the working children had illiterate fathers. Only 27% of the working children had literate fathers.
Analysis of child labour was also performed simultaneously by parent’s income and their literacy status (Table 3). The data show that in all income groups illiterate fathers had more working children which means that more and working children had illiterate fathers. Looking from another angle it is evident that as income of households increases the number of working children decreases. The data point out two phenomena simultaneously (i) child labour was more prevalent in households where fathers were illiterate, and (ii) household income had an inverse relationship with the number of working children. These are important findings and pose threats to policy makers and planners.
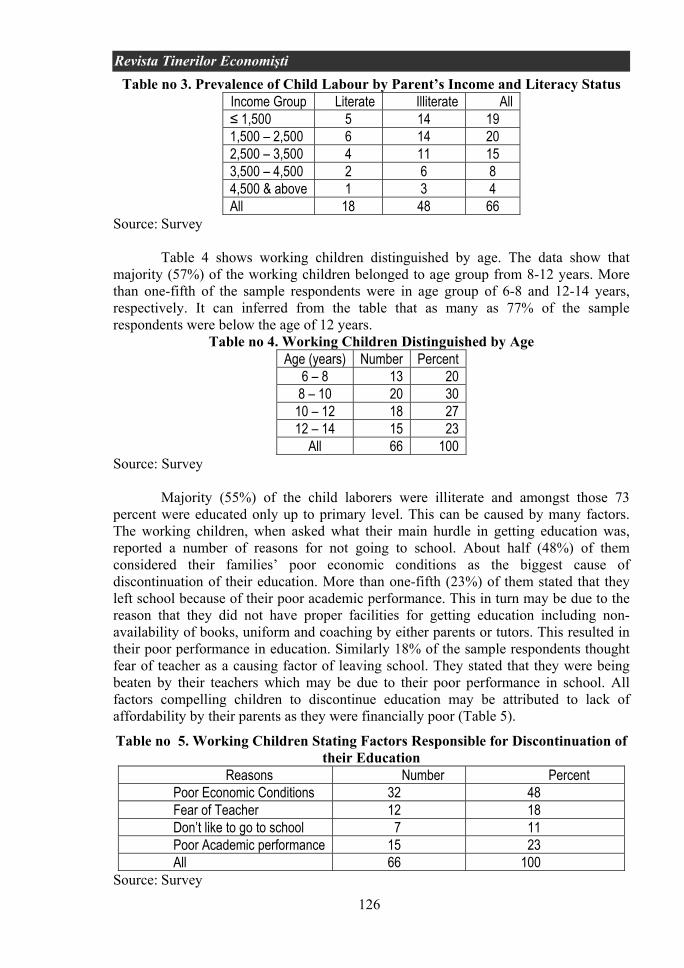
126
Revista Tinerilor Economişti Table no 3. Prevalence of Child Labour by Parent’s Income and Literacy Status
Income Group Literate Illiterate All ≤ 1,500 5 14 19 1,500 – 2,500 6 14 20 2,500 – 3,500 4 11 15 3,500 – 4,500 2 6 8 4,500 & above 1 3 4 All 18 48 66
Source: Survey
Table 4 shows working children distinguished by age. The data show that majority (57%) of the working children belonged to age group from 8-12 years. More than one-fifth of the sample respondents were in age group of 6-8 and 12-14 years, respectively. It can inferred from the table that as many as 77% of the sample respondents were below the age of 12 years.
Table no 4. Working Children Distinguished by Age Age (years) Number Percent
6 – 8 13 20 8 – 10 20 30
10 – 12 18 27 12 – 14 15 23
All 66 100 Source: Survey
Majority (55%) of the child laborers were illiterate and amongst those 73 percent were educated only up to primary level. This can be caused by many factors. The working children, when asked what their main hurdle in getting education was, reported a number of reasons for not going to school. About half (48%) of them considered their families’ poor economic conditions as the biggest cause of discontinuation of their education. More than one-fifth (23%) of them stated that they left school because of their poor academic performance. This in turn may be due to the reason that they did not have proper facilities for getting education including non-availability of books, uniform and coaching by either parents or tutors. This resulted in their poor performance in education. Similarly 18% of the sample respondents thought fear of teacher as a causing factor of leaving school. They stated that they were being beaten by their teachers which may be due to their poor performance in school. All factors compelling children to discontinue education may be attributed to lack of affordability by their parents as they were financially poor (Table 5).
Table no 5. Working Children Stating Factors Responsible for Discontinuation of their Education
Reasons Number Percent Poor Economic Conditions 32 48 Fear of Teacher 12 18 Don’t like to go to school 7 11 Poor Academic performance 15 23 All 66 100
Source: Survey

127
Economic Theories – International Economic Relations Poor economic conditions may not only cause leaving school or discontinuation
of education by children. They may also force them to work below their legal age of work. More than seventy (72%) of the working children reported that their daily working hours ranged from 8 to 10 hours. A small proportion (6%) reported that they worked up to 5 hours as daily basis.
The maximum weekly earnings amounted to above Rs.70. But this was reported by only 10% of the working children. The lowest weekly earnings were up to Rs.30 as reported by 17% of the respondents. Majority of them 73% were earning in the range of Rs.30-70 on weekly basis. In the wake of high inflation the weekly earnings by working children constituted only meager and low. This poses serious questions and threats to policy challenges.
When asked how much of their earning did the working children get as pocket money, it was reported that they almost got nothing. One-third (30%) of the working children did not get any pocket money, 18% got Rs.1-3 per week and only 8% got above Rs.10 as their pocket money. About half (44%) of them had pocket money of Rs.4-10 in week.
Working relation between employees and the employer assumes an important role. Bad working relations between labour and employers results in unrest and disputes. Child labour is no exception in this regard. This was also observed and confirmed by our data (Table 6). A small proportion (11%) and 21% ranked their employer’s behavior and dealing with them as good and very good, respectively. Maximum number (30%) reported that they were being worst treated/dealt with by their employers. Similarly 38% of the working children rated their employer’s behavior as bad and very bad. The negative and harsh dealing of the employers may have negative impact upon children’s mind and future career.
Table no 6. Sample Respondents Describing Employer’s Behavior Behavior Number Percent
Very Good 14 21 Good 7 11 Bad 10 15 Very Bad 15 23 Worst 20 30 All 66 100
Source: Survey Majority (62%) of the working children were not satisfied from their job. Only
38% reported that they were satisfied with their job and their employers. The working children, when asked for causes of their dissatisfaction with their job, reported the employer’s harsh behavior as the main reason. This was reported by 60% of those who were not satisfied with their job. More than one-fifth (23%) termed long working hours as their major difficulty. The other difficulties faced by working children during their job were their bad health conditions, no leisure time and difficult work (Table 7). Based on their responses and observations, it was concluded that the child labour was ill-treated and the employer’s behavior was harsh with working children. This may cause disappointment, discouragement, mental pressure and torture for working children.
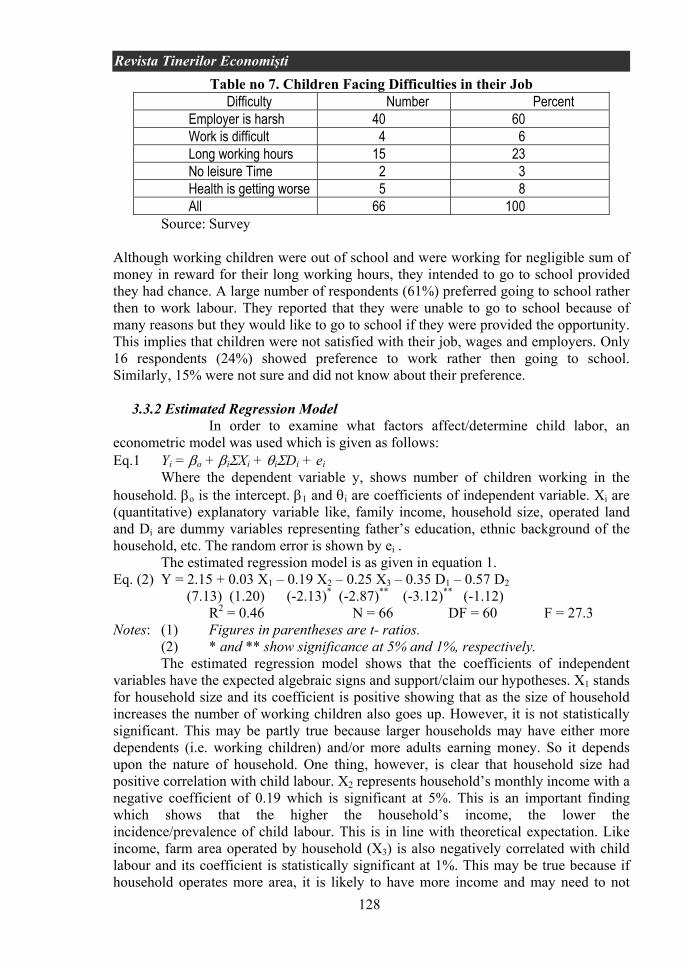
128
Revista Tinerilor Economişti Table no 7. Children Facing Difficulties in their Job
Difficulty Number Percent Employer is harsh 40 60 Work is difficult 4 6 Long working hours 15 23 No leisure Time 2 3 Health is getting worse 5 8 All 66 100
Source: Survey
Although working children were out of school and were working for negligible sum of money in reward for their long working hours, they intended to go to school provided they had chance. A large number of respondents (61%) preferred going to school rather then to work labour. They reported that they were unable to go to school because of many reasons but they would like to go to school if they were provided the opportunity. This implies that children were not satisfied with their job, wages and employers. Only 16 respondents (24%) showed preference to work rather then going to school. Similarly, 15% were not sure and did not know about their preference. 3.3.2 Estimated Regression Model
In order to examine what factors affect/determine child labor, an econometric model was used which is given as follows: Eq.1 Yi = βo + βiΣXi + θiΣDi + ei Where the dependent variable y, shows number of children working in the household. βo is the intercept. β1 and θi are coefficients of independent variable. Xi are (quantitative) explanatory variable like, family income, household size, operated land and Di are dummy variables representing father’s education, ethnic background of the household, etc. The random error is shown by ei . The estimated regression model is as given in equation 1. Eq. (2) Y = 2.15 + 0.03 X1 – 0.19 X2 – 0.25 X3 – 0.35 D1 – 0.57 D2
(7.13) (1.20) (-2.13)* (-2.87)** (-3.12)** (-1.12) R2 = 0.46 N = 66 DF = 60 F = 27.3 Notes: (1) Figures in parentheses are t- ratios. (2) * and ** show significance at 5% and 1%, respectively. The estimated regression model shows that the coefficients of independent variables have the expected algebraic signs and support/claim our hypotheses. X1 stands for household size and its coefficient is positive showing that as the size of household increases the number of working children also goes up. However, it is not statistically significant. This may be partly true because larger households may have either more dependents (i.e. working children) and/or more adults earning money. So it depends upon the nature of household. One thing, however, is clear that household size had positive correlation with child labour. X2 represents household’s monthly income with a negative coefficient of 0.19 which is significant at 5%. This is an important finding which shows that the higher the household’s income, the lower the incidence/prevalence of child labour. This is in line with theoretical expectation. Like income, farm area operated by household (X3) is also negatively correlated with child labour and its coefficient is statistically significant at 1%. This may be true because if household operates more area, it is likely to have more income and may need to not
129
Economic Theories – International Economic Relations force children to work. Literacy status (D1) was also found a significant determinant of child labour. The negative coefficient of D1 shows that if the father is literate the intercept decreases by 0.35 and it is significant at 1%. In addition to dummy variable for literacy, another dummy (D2) was also used as an explanatory variable which captured ethnic background of the household. D2 = 1 if the family belongs to high cast (Pathan or Pakhtoon) and D2 = 0 if it belongs to lower castes (including carpenter, blacksmith, barbour, shoemaker etc). It was hypothesized that usually Pathan family would tend not to send or send lesser number of children to work as compared to other lower castes. The estimated coefficient (-0.57) confirmed this hypothesis but was not statistically significant. The above estimated model shows that three coefficients are highly significant. The whole regression model is also significant as based on the value of F-statistic. The explanatory power of model is not bad also because the R2 = 0.465 indicating that about half of the total variation in dependent variable is explained by the explanatory variables. If we analyze the estimated coefficients of the model it poses serious policy challenges. Firstly, the positive correlation between child labour and household size implies that the larger the population the lower the head income and land area per family. This would in turn result in child labour. So population growth rates need to be reduced. Secondly, the negative correlation between family income and child labour also necessitates that efforts be done to increase income per capita. This could be done through introducing and implementing income generating activities. Thirdly, the negative relation between households’ land holding and child labour implies that as population increases, the available land would be subdivided and fragmented in small pieces. This would lead to food insecurity and lower incomes and resultantly more and more child labour. Fourthly, the negative coefficient of literacy status dummy shows that if literacy rate is low more and more children world be sent to work, the opportunity cost of which may be very high and would be socially costly.
4. WHAT ARE SOME "MYTHS" OR MISUNDERSTANDINGS ABOUT CHILD LABOR? The UNICEF has listed four "myths" which are as follows (UNICEF, 1997): (1) It is a myth that child labor is only a problem in developing countries. "But
in fact, children routinely work in all industrialized countries, and hazardous forms of child labour can be found in many countries. In the US, for example, children are employed in agriculture, a high proportion of them from immigrant or ethnic-minority families. A 1990 survey of Mexican-American children working in the farms of New York State showed that almost half had worked in fields still wet with pesticides and over a third had themselves been sprayed."
(2) It is a myth that child labor will only disappear when poverty disappears. Hazardous labor can, and should be eliminated by even the poorest countries.
(3) It is a myth that most child laborers work in sweatshops making goods for export. "Soccer balls made by children in Pakistan for use by children in industrialized countries may provide a compelling symbol, but in fact, only a very small proportion of all child workers are employed in export industries - probably less than 5 per cent. Most of the world’s child laborers actually are to be found in the informal sector - selling on the street, at work in agriculture or hidden away in houses – far from the reach of official labour inspectors and from media scrutiny."

130
Revista Tinerilor Economişti (4) It is a myth that "the only way to make headway against child labour is for
consumers and governments to apply pressure through sanctions and boycotts. While international commitment and pressure are important, boycotts and other sweeping measures can only affect export sectors, which are relatively small exploiters of child labour. Such measures are also blunt instruments with long-term consequences that can actually harm rather than help the children involved."
5. WHAT ARE SOME SOLUTIONS TO CHILD LABOR? HOW WAS CHILD LABOR REDUCED IN TODAY’S DEVELOPED COUNTRIES?
Four main changes took place to reduce child labour in today’s developed countries:
1. Economic development that raised family incomes and living standards, 2. Widespread, affordable, required and relevant education, 3. Enforcement of anti-child labor laws (along with compulsory education
laws), 4. Changes in public attitudes toward children that elevated the importance of
education. Factors, that can play a significant role is curtailing child labour, may
include: - Increased family incomes,
- Education — that helps children learn skills that will help them earn a living - Social services — that help children and families survive crises, such as disease, or loss of home and shelter, - Family control of fertility — so that families are not burdened by children.
6. RECOMMENDATIONS The analysis above leads to certain implications for the international
community: a) Collect/study child labor data and devise interventions that allow for the
possibility of children being in school and working; b) Improve the quality of schooling by investing in education so as to increase
its value to children and parents; c) Provide subsidies to poor families prone to having working children so they
can afford their children's schooling (income subsidies, nutritional supplements); and d) Establish partnerships of international organizations dedicated to improving
children's lives. Some recent efforts to protect jobs in developed countries are misguided.
Competition from developing countries is probably not the cause of unemployment in developed countries. Under the guise of protecting workers' rights, some developed countries propose that minimum global labor standards be adopted by the GATT successor, the World Trade Organization. Among the issues proposed is the prohibition of child labor.
Developing countries argue that such measures would rob them of their comparative advantage: lower labor costs. Many see the issue as just that: rich nations attempting to wipe away developing countries' comparative advantage by arguing for human rights. Genuine human rights concerns are important, but protectionism is not the answer. High levels of unemployment have many causes other than trade, so labor standards in one country may not affect levels of employment in another.

131
Economic Theories – International Economic Relations Threatening trade restrictions based on labor standards is not justified. The
problem with such a stance is that (i) not all forms of child labor are exploitive or cruel; (ii) the age deemed "child" labor is not clear; (iii) poor countries cannot necessarily afford such measures; (iv) levels poverty would increase; and (v) school attendance would decline. Furthermore, free trade is probably part of the solution to eradicating child labor. This is because a free trade regime promotes development worldwide. And as countries develop the incidence of child labor decreases substantially.
REFERENCES 1. Barker, G.
Knaul, F. Exploited Entrepreneurs: Street and Working Children in Developing Countries. Working Paper Number 1, Childhope-USA, Inc. New York, 1991
2. Bequele, A. Boyden, J..
Working Children: Current Trends and Policy Responses. International Labor Review, 1988, 127,2: 153-171.
3. Boyden, J. Working Children in Lima, Peru. In W.E. Myers, ed., Protecting Working Children. London: Zed Books Ltd in association with UNICEF (United Nations Children's Fund), 1991
4. Chernichovsky, D.
Socioeconomic and Demographic Aspects of School Enrollment and Attendance in Rural Botswana. Economic Development and Cultural Change, 1985, 32: 319-332
5. Collins, J.L. Fertility Determinants in a High Andes Community. Population and Development Review,1983, 9,1: 61-75.
6. Hirway, I. Acquisition and Push Kar Pundyal Towards Eradication of Child Labor. A International Review Gandhi Labor Institute. Ahmadabad, India, 1991, p. 9, 19.
7. Ilon, L. Moock, P
School Attributes, Household Characteristics and Demand for Schooling: A Case Study of Rural Peru, International Review of Education, 1991, 37,4: 429-452.
8. Lindert, P. Child Costs and Economic Development. In R.A. Easterlin, ed., Population and Economic Change in Developing Countries. Chicago: The University of Chicago Press, 1976
9. Nawaz. A. Child Labor: A Case Study of Haripur City (Unpublished Thesis of M.A Sociology) Uni. of Peshawar, 1993
10. Patrinos, H.A. Psacharopoulos, G.
Educational Performance and Child Labor in Paraguay. International Journal of Educational Development, 1995, 15,1: 47-60.
11. Richards, M. Opportunity Costs of Education to Rural Households. (USAID, Guatemala Primary Education Efficiency Sub-Sector Assessment), 1988
12. Shah, K. Socio Economic Dimension of Child Labor in Mechanical Workshops: A Case Study of Bat Khela Bazar (Unpublished Thesis of M.A Sociology Uni. of Peshawar, 1997
13. Seetharamu, A.S.
Education in Rural Areas: Constraints and Prospects. New Delhi: Ashish Publishing House, 1985
132
Revista Tinerilor Economişti Devi, U.
14. Sinclair, V. Trah, G.
Child Labour: National Legislation on the Minimum Age for Admission to Employment or Work. In Conditions of Work Digest. (International Labour Office, Geneva), 1991, 10,1: 19-146.
15. Singh, R. Schuh, G.E.
The Economic Contribution of Farm Children and the Household Fertility Decisions: Evidence from a Developing Country, Brazil. Indian Journal of Agricultural Economy,1986, 41,1: 29-40.
16. Syed, K.A., Mirza, A. Sultana, R. Rana, I..
Child Labour: Socioeconomic Consequences. Pakistan and Gulf Economist, 1991, 10: 36-39.
17. Tienda, M. Economic Activity of Children in Peru: Labor Force Behavior in Rural and Urban Contexts. Rural Sociology, 1979, 44: 370-391.
18. Weiner, M. The Child and the State in India. Princeton, New Jersey: Princeton University Press, 1991
19. *** ILO (International Labour Office). 1992. World Labour Report 1992. Geneva.
20. *** ILO (International Labour Office). Bulletin of Labour Statistics 1993-3. Geneva, 1993.
21. *** ILO (International Labour Office) „Child Labour: What is to be done?, Document for discussion at the Informal Tripartite Meeting at the Ministerial Level, Geneva, 12 June 1996. International Labour Office, Geneva, 1996
22. *** New Internationalist Magazine (NIM, 1997). No. 292, July 1997 Issue on Child Labor
23. *** The Daily News (Jan. 17, 1997). Child Labor in Pakistan Two Side of the Coin.
24. *** The International Programme on the Elimination of Child Labor (IPEC) and International Labor Organization (ILO). Child Labor, Children Rights and Education 1998. P.4, 27-31.
25. *** UNESCO (United Nations Educational, Statistical and Cultural Organization), 1993. Statistical Yearbook. Paris.
26. *** UNICEF (United Nations Children's Fund). 1992. Children of the Americas: Child Survival, Protection and Integrated Development in the 1990's. Santa Fe de Bogota, Colombia.
27. *** UNICEF (United Nations Children's Fund). 1997.Unicef State of the World’s Children’s Report, 1997, Four Myths about Child Labor, http://www.unicef.org/sowc97/

133
Economic Theories – International Economic Relations
MEASUREMENT AND EVALUATION OF INTELLECTUAL CAPITAL
Assist. Ph.D Student Stănescu Aurelia Academy of Economic Studies Faculty of Management Bucharest, Romania
Abstract: The purpose of the paper is to provide the succinct description of the current status of theory and practice in the valuation of intellectual (intangible) capital, including the professional valuation of intellectual property and intangible assets.
Keywords: Knowledge-based-economy, intellectual capital, intangible assets, market value.
1.More and more we hear people say that we have entered a new economy: information economy, post-industrial society, knowledge based economy. Whatever their names and differences, there is a major similarity between these kind of economies: the competitive advantage within these new economies has shifted from material and financial assets to intangible assets, to intellectual capital.
Intellectual capital has always existed but an explicit recognition of its importance is relatively new phenomenon. This is because the past decades our production process has changed. Traditional factors of production (natural resources, labor, capital) have lost its significance. At the same time the importance of intangible inputs, like information and knowledge increased. In today’s economy indicators like revenues, profits and assets only tell a minor part of organization’s situation. The real wealth of organizations has to be sought in the people, their knowledge and skills, internal processes and the organization’s reputation. It’s well known the fact that main sources of competitive advantage have become intangible. What we need is a more reliable guide that provides better insight into the value of these intangible assets and their contribution to economic development and growth.
We could define intellectual capital as all intangible resources that are available to an organization, that give a relative advantage, and which in combination are able to produce future benefits. The concept of “intellectual capital” is used essentially by managers in the administration of personnel and intangible assets, in creating a favorable image of a company with the aim of attracting investment, and in valuing a knowledge based business with a view to sale or purchase.
In order to measure and manage intellectual capital it is important to be more precise about the different components: human capital, structural capital and relational capital. Human capital – anything related to people: knowledge, education, competencies of individuals in realizing organizational tasks and goals. Education is “the basic building block of human capital”.
Structural capital – represents “non-human storehouse of knowledge, which are embedded in its technological, information and communications systems as represented by its hardware, software, databases, laboratories and organizational structures”(Bontis, 2004, p.8).
134
Revista Tinerilor Economişti Relational capital – the intraoganizational relationships and linkages and the
extent to which organizations are able to capitalize on cooperative and coordinating capabilities.
Although the intellectual capital is unique we can improve comparability by using the same conceptual models.
In 2002, the European Council held a special meeting to agree a new strategic goal for the European Union in order to strengthen its knowledge-based economy. The goal was set to “become the most competitive and dynamic knowledge-based economy in the world, capable of sustainable economic growth with more and better jobs and greater social cohesion.” ( Lisbon European Council, 2000)
2. Valuation of intellectual capital. Originally, the difference between the value of assets and value of the company was described as goodwill. Subsequently this has expanded to take account of, for example, undervalued tangible assets or purchased intangibles such as brands. There were also methods used to help estimate the greater earning power following a merger or acquisition. As intellectual capital came to the fore, measures were developed to monitor three underlying assets:
• human capital – the documented skills and experience of the staff • structural capital – patents owned or pending, the infrastructure, “ everything
that remains in the company after the office is closed” • customer capital – the history of customer relationships in place, the value of
the customer base in relationship marketing terms. The methods employed can be divided between those with an accounting basis,
such as Tobins’ Q or EVA, and those with an indicator basis, such as the balanced score card, and various tools such as navigators or monitors. These approaches have tended to focus on the visible or content components of assets, ice those aspects that can be counted or valued. This is essentially a static and historical view of intellectual capital. It is not very useful if the assets are very vulnerable – for example if the expertise of a group of employees can quickly be lost.
2.1. Valuation of intellectual capital at the time of the sale of a business. In theory the market value of a knowledge-based business should not be different from the market value of any other business generating the same financial results. “The value of a company depends only on the size of the cash flow generated by its activities and does not depend on its asset structure”. (Edvinsson & Malone, 1997)
The market value of a company is a magnitude used in calculation. The actual price may be substantially higher or lower, depending on a specific circumstances in which the transaction is accomplished.
Intangible assets valuation is the most delicate part of a valuation of a business. It is essentially in the context that the valuation of a business normally precedes the evaluation of intangible assets. The market value of the business as a whole is determined using the income approach and/or comparable sales analysis. Then the market value of tangible assets is assessed. The valuation of intangible assets as a whole is obtained as a difference between the market value of the company or business and the value of its tangible net assets (assets after deduction of liabilities) This approach to the evaluation of intangible assets or intellectual capital is usually called “the return-on- assets” methods. Subsequently the value of intellectual capital and the value of the business are refined in the light of these refinements.
In addition, the return-on-assets valuation procedure tallies with the principles of bookkeeping and with the fact that usually by no means all intangible assets at the

135
Economic Theories – International Economic Relations time of the sale of a company are reflected in its balance sheet. The difference between the price of the sale-purchase of a company and the value of its net assets was reflected in the balance sheet as goodwill. This took automatically into account the value of all intangible assets not recorded on balance sheet. However, as the knowledge-based economy expanded, this practice ceased to tally with the facts.
2.3. Intellectual capital and intangible assets. The relationship between the concept of intellectual capital and intangible assets is equally complex, if intangible assets is understood in the precise accounting sense. Intangible assets are defined as any long-term assets which are not linked directly with any tangible object. For a long time intangible assets were considered to include any assets for which no place had been found among other “normal” assets. Consequently the composition of intangible assets is highly heterogeneous. The best known of them- goodwill- is obtained as the difference between the price of buying a company and the value of its net assets – i.e. it is essentially a bookkeeping fiction which is not connected with any specific object part from the company as a whole. Moreover, intangible assets include a multitude of identified assets, i.e. assets linked with a specific non-material object (an invention, a trademark, etc.), improvement of leased property, a contract. The basis for accounting of any such asset on a balance sheet is usually the existence of outgoings on acquiring or creating it. In other words, the balance sheet reflects not assets as such, but bookkeeping operations linked to their acquisition.
Intellectual property rights constitute only a part of identified intangible assets. A significant part of the intellectual property rights belonging to a company are
not reflected on the balance sheet, as they did not arise in connection with any bookkeeping operations. Most often copyright is not reflected on the balance sheet because it arises by virtue of the creation of the work, while the corresponding costs can be recognized as expenditure.
2.4. Intellectual capital accounts. Intellectual capital accounts are viewed as an instrument for measuring intellectual capital, managing it and displaying the company’s attraction to investors. Such accounts are of two types. The more detailed account is prepared for internal requirements, first and foremost for management and to display to the staff of the company for the purpose of consolidating common efforts. The abbreviated report (which omits information that is not intended for public distribution) can be prepared for publication with the aim of attracting investment or for distribution to potential investors.
But intellectual capital accounts cannot stand alone. They become important only when seen in a context which is a vision of the management system and the competition form. In this context intellectual capital accounts give a more adequate idea of the new reality than the traditional intangible assets.
Practice shows that potential investors readily acquaint themselves with intellectual capital accounts. For them it is not so important that the intellectual capital valuation should be expressed in monetary terms, but the clear presentation of data is very significant.
3. Valuation of intangible assets according to international standards. The international valuation standards adopted in 2001 consist of standards proper and guidance for their application. Specifically, guidance note No. 4 is devoted to the valuation of intangible assets.
In November 2000 the European Group of Valuers’ Associations (TEGoVA) published new valuation standards (European Valuation Standards, 2000) which are
136
Revista Tinerilor Economişti supplemented by methodological guidance. According to the note No.8 all intangible assets subject to valuation, including intangible assets which are not taken into account in the balance sheet, are divided into three categories: goodwill of a business, personal goodwill and identifiable intangible business assets. Business goodwill is inseparable from the company and may be taken into account on the balance sheet after its sale. Personal goodwill, as a rule, is linked to the person of the head of the company, is not transferred when it is sold and consequently is not taken into account when its value is calculated, except in cases where, after a change of company ownership, the same person continues to head it. Identifiable intangible business assets can be individually valued if a finite economic life can be attached to them and if over that period they produce benefits for the business. Usually this category includes intellectual property rights and other similar assets, including know-how, information resources, list of customers.
The problem of designing measurements and evaluation of intellectual capital has not been fully resolved. But the models of measurements and evaluation of knowledge and intellectual capital can serve different specific purposes of different organizations. Some of them can use these models as diagnosis-analyze to evaluate the accomplished progress.
REFERENCES 1. Bontis, N Managing Organizational Knowledge by Diagnosing
Intellectual Capital, Oxford University Press, New York, 2002
2. Edvinsson, L., Malone,M.S.,
Intellectual Capital: Realizing Your Company’s True Value by Finding Its Hidden Brainpower, Harper Business, New York, 1997
3. European Valuation Standards
The European Group of Valuer’s Associations, The Estate Magazine, 2000
4. European Parliament
Lisbon european Council, 23-24 March 2000, Precidency Conclusions, http:// europarl.eu.int/summits/lis1_en.htm
5. Roos, G et al Intellectual Capital: Navigating in the New Business Landscape, New York University Press, NewYork, 1997
6. Stewart T.A Intellectual Capital:The New Wealth of Organizations, Bantam Doubleday/ Currency, New York, 1999
7. Sveiby K.E The New Organizational Wealth. Managing and Measuring Knowledge based Assets, Barret-Koehler Publishers Inc., San Francisco, 1997
137
Economic Theories – International Economic Relations
THE ECOLOGIC BALANCE IN THE EQUATION OF THE DURABLE DEVELOPMENT
Assoc. Prof. Ph.D Boncea Amelia Lect. Ph.D Rabontu Cecilia Irina University “ Constantin Brancusi” of Tg-Jiu Faculty Of Sciences Economic
Abstract: In the pure ethnic and economic logic of the development, like it was in general create till not long ago, the environment medium and the natural resources have been considered simple instruments which served to the economic increase. The negligence of the cost of the degrade and the damage brought to the medium and to the human health generated costs which had to and still have to be supported by the whole society, which is threatened by the worsening of the ecologic perils.
Keywords: development equation, protection of the medium, economic, human, environmental and technological, durable development, pollutant, antipollutante industry.
The consciousness of the fact that the intensification of human activities increase the pressure to the medium, bother through the uncheck consumption of resources and space, on thorough the production of the offal’s, which the nature can’t engross them without sufferings, determed the international community to initiative and uphold some concrete actions to forestall, to counteract and to eliminate the repercussions of the perturbing factors of the ecologic balance.
If the main cause to the degrade of the ecosphere is about the forms of production and consumption of industrial society, an unanimously acknowledged conclusion, then the solution must be searched by economic positions too, without diminish the importance of the others agents of social, moral and cultural order.
The necessity of rethinking the organization and the modalities of unfolding the economic activities is obvious and so - the transition to a behavior and a still of life, which are checked and acceptable in an ecologic and human point of view. The conduct of the evolution of development in the next century depend of the way that the international community and every country and collectivity partly will succeed to solve this problem, all the more as any generation has the testament obligation not to let unsolvable debts to the future generations.
So, the development equation includes another type of resources too, which are situated to the progress base and of the aggressively life of the economic mechanism, created by people and constant by nature, impose, his connection and his transformation in the direction of flexible joining the economic criterions with ecologic criterions. So, the content and the modalities of the economic increase will amend in the direction of fit the ecologic balance in economic balance and in the direction of auto uphold the nature increase.
With this meaning, it raise, on one hand, the problem of the economic option of pollution, and the other hand, the problem of measure, in monetary terms, the physical tides of medium –economic resources and reverse.
138
Revista Tinerilor Economişti The draft of economic optimal of pollution establishes a flexible and dynamic
connection between the economic criterions of this process about the environing medium. His essence consist in finding then mechanism which brings in the ecologic balance between the criterions of development, and so give it a new size in concordance to the demands of the modern world.
As to every production correspond a level of pollution to medium, because of the activity of the production and of the consumption, so the level of expenditures for the protection of the environing medium – those of fore warn and those of fighting the pollution – is unique determinate of the economic optimal pollution and the level of the expenditures for the medium protection .
In this way, the problem which raise is not to increase to the infinite the volume of the expenditures, the problem is to be in concordance to the level of pollution, accepted by the technologic stage reached to a certain moment.
From a theoretical point of view, it is necessarily to establish the objective level of pollution and the intermediate levels, with their implications to economy. This involves the two components of the expenditures for the medium protection: Expenditures about fighting the medium pollution and those are the investments in increasing the medium’s capacity of assimilation, the enlargement of the quality level of medium; Expenditures about the forewarn al the medium pollution, and those are the investments to the pollution sources, to frame in the imposed limits of the standards.
The size of those expenditures must be equivalent to a reduction of a raw emission and clear emission must be smaller than the increase. It raises the problem how the financial costs bear for the achievement of level optimal of pollution and for its maintain.
We considered that, in the first stage, the state’s role has priority in the direction promotion to free initiative in the area of protection the medium through financial support and through know-how of those which are dispose to engage in this new sector of economy. He have to support the costs where is not possible to give way to the private initiative. The tendency must restrict the state’s role in this area to simple stimulants of fiscal nature and must transfer the decision to the local administration organ.
The achievements of bringing-in the medium depend, in a large size, of the suitable statistic informational system. In this way it is necessarily to check the expenditures for the medium protection of in the following structure: necessary expenditure, achieve on the branches and on the territorial unities. For the distinguish of the tides which appear in the new economic mechanism through the beings of the new economic general balance is necessary an aggregate indicator of the medium’s quality and a table input-output is necessary for the connections and the medium interfactors.
The include of the environment medium in the economic mechanism as a pure veyor of production factors and services, and the public goods too, suppose, in the first stage, the measure of its quality level, because of the existent connection between his quality and its capacity to give the necessity of the human existence. In this optics, we must have a distinction between the two medium’s activities of base: - offertant of natural matters – quality which straight us to the resources protection; - offertant of an a similar service of productions through the capacity of assimilation, dependent on time and the polluted quantity emitted in the medium’s factors
The indicator of the medium’s quality is calculated to the level of every pollutant substance followed an total medium factors and as aggregate indicator of the

139
Economic Theories – International Economic Relations national economy. This indicator have the advantage of total measure of the medium’s quality and so allowed the connect implication in actions of economic politics.
The indicator’s main disadvantage consists of the possibility reduced of establish politics of protection to the natural resources. The mitigation to this short coming can be achieved by the creation of a table medium-economy.
The economic mechanism, which contains the environment medium too, as an essential factor of production and as an economic subject require the approach of the problem about the tides from economy of their monetary evaluation and of the cognition of the technical-economic relations between the economy and the medium.
The main economic agents connect directly with the environment medium, receive from this tides of different intensify and length resources and the services about the reception pollutants, which are results of the production and consumption process of the.
The monetary tides towards the environment medium contains, at first, the expenditures about the fighting the pollution of the medium.
This is achieved under two states:- by eliminate the effects of the accumulation the pollutants in the medium, because of the emission in the accepted limits;- by fighting the effects of the pollutants, resulted over the accepted standards.
Their size depends on the used technologies costs for remake the medium. To this, there is add a allowance, which is dependent of the report known reserves – exploitable reserves and the level demand-offer on the same product’s pseudo market.
The allowances role is to restrict the demand for those resources, considering limited to a level which assure their production and their using very long time.
By establishing the resources and the services price of the environment medium an important role comes to their classification in public or private goods, because their characteristic determined different ways of forming the price. In this way, the firms and the population’s behaviors may be influenced by means of economic nature, which stimulated the human inventively, and so, the technological progress in direct report with the maintain of the medium’s quality.
To know and to analyze the tides between the medium and the economy – those tides desirable and those tides undesirable – a table input-output is needed for the connections and the interfactors of medium.
In the medium’s total, the capacity of assimilation and the medium’s quality are considered capital goods, which require investment, if necessary. This is because the environment medium has the capacity of assimilating a lot of pollutants, for what received a price; in the same time, the cumulated effects in time and the supraemission produce reduction in capacity of assimilation and concordant to the economic theory necessity investment of replacement.
The connect distinguishment of the interbranches tides needs a big homogeneity of the unity of observation. From this point of view, the division in institutional sectors and on branches is the most advisable, in report with the wanted propose. From this reason, in the input-output table are used pure branches, which means abstract, homogeny branches, formed on the criterion of one product or one group of homogeny products, from technological or prime matters used point of view. If for the classic economic branches, the solution has been found, for the pollutants the problem isn’t easy to solve, because those pollutants can result from the processes with different technologies and inputs, with another words, we will never create poor branches for pollutants, without stressed those for the classic economic branches.

140
Revista Tinerilor Economişti On the other hard, it is interesting the structure of pollution the factor of
medium on sources of emission, and so not only the pollutants, but the polluters too. So, we consider that is correct to record pollutants by the criterion of forming the branches, in the table input-output, concordant the classic methodological.
It is necessarily that the establishment of the medium factors branches, which supply the two essential elements for the achievement of the processes of production: - mineral liquid and solid resources, the space and the productive capacity from the air, the earth, etc.; - the capacity of the medium’s assimilation, which give a similar service to an antipollutante industry, with the condition that the pollutants can be assimilated.
Ideal would be that the two ecological inputs the economic to be treated separately at the entrance, but the universality’s conditions of the matters compels us to transcribe in a only branch the medium’s factors.
So, we consider that the branches in which the medium’s factors must be divided are water, forest, earth and air.
If we consider them as a product of the transmitting branch, paid with a certain price of antipollutante industry, they appear on the same live with the current inputs, designated to the industry from these branches, and if the antipollutante industry from the branches , act like a branch of services, than appear with the inputs from the antipollutante industry to the other branches.
For the included installations in the enterprise it can be calculated the indexes, which estimates how much from the pollutant emission are eliminated and evaluated to the comparable prices with the independent ones.
In practice, it can be applicate one of these two forms, in concordance with the grade of nocivity of the pollutant and with the impact to the economic.
The real knowledge of the tides medium-economic could explicate most of the questions and uncertainty for the achievement of one efficient politics for the protection of the objectives of economic increase but, first of all, would spare the society from new errors, expansive paid in a dasely future. In a general consensus it, is impossible to achieve the progress, without a suitable protection of the medium.
The damages caused by nature and the health undermine the foundations of productivity in the future and reserve, without on economic increase are hard to secure the resources which are necessarily to the protection of the medium.
An important condition of achievement the objectives of the durable development is the simultaneity of the progress in all the four areas: economic, human, environmental and technological. For these, the economic politics, the medium’s politics, the investment’s politics, the researches-development politics, the human resources politics, the education politics, the health politics etc are appointed to correlate the objectives and the actions in concordance to certain priorities.
In the same time, from a certain threshold of the medium’s tolerability, the survive problem is the same for all the planet, which determined the necessity of agreeing the actions of a durable development.
REFERENCES
1. Diaconu, Gheorghita.
Performantele de mediu - de la principii la preocupari curente -. In: Tribuna economica, v. 15, nr. 33, 2004
2. Peterson, Jeffrey Incentive-compatible pollution control policies under

141
Economic Theories – International Economic Relations M.; Boisvert, Richard N.
asymmetric information on both risk preferences and technology. In: American journal of agricultural economics, v. 86, nr. 2, 2004
3. Poleuca, Corina. Politica de mediu - o provocare pentru Romania. In: Tribuna economica, v. 16, nr. 20, 2005
4. **** Strategia de dezvoltare durabila a Romaniei : orizont 2025. In: Economistul, v. 14, nr. 1744, 2004,
5. Stanciu, Violeta Claudia.
Dezvoltarea rurala durabila. Bucuresti: ASE, 2004

142
Revista Tinerilor Economişti
143
Business Statistic – Economic Informatics
TV MEDIA IN THE REPUBLIC OF MACEDONIA – CURRENT SITUATION AND PERSPECTIVES
Assist. Prof. Anita Ciunova-Suleska University “Ss. Cyril and Methodius” Faculty of Economics Skopje, Republic of Macedonia
Abstract: The aim of this paper is to present the situation in the Republic of Macedonia by analyzing the number of TV media, their geographical distribution, current legislative and perspectives in TV media development. There is a general agreement among media experts that the number of registered TV media in the RM (56, out of which 6 operate as national TV media) is quite big, having in mind that in RM live about 2 million inhabitants. Recently a new Law on Broadcasting Activity has come into force in order to ensure better regulation of the requirements and the manner of pursuing broadcasting activity in accordance with the international treaties that RM has ratified or acceded to.
Keywords: national TV media, local TV media, geographic distribution.
1. Media and their role in the society The term media comprises numerous institutions and individuals who differ in
cultural context and have different objectives, scopes and methods. In fact, the term media refers to the group of corporate entities, journalists, publishers and other participants who constitute the communications industry and profession.
Mass media exert great influence on the society but they are under the influence of the society as well. TV in the living room, daily newspapers on the doorstep, radio in the cars, PCs on the working desks, fliers in the mailboxes are just a small part of the available media channels through which lot of news, announcements, ads, opinion, music and other forms of mass communication have been delivered.
Mass media are specific as they are media for one-side communications; the audience has great possibility to choose; they can reach big audience; the objective of the message sent through mass media is attracting as bigger audience as possible.
Anyway, only one thing is for sure, without media, most of the people will be acquainted with events that are happening in their nearest neighborhood. Despite of this situation nowadays, people can simply turn on TV or connect and search the Internet and get the information requested immediately.
2. The situation in TV media industry in the Republic of Macedonia Media activities in the Republic of Macedonia were previously regulated by the
Law on Broadcasting Activity dated back from 1974, 1995 and 199712. In November 2005 a new Law on Broadcasting Activity13 came into force regulating the conditions for and manner of pursuing broadcasting activity and matters of public interest in the 12 Official Gazette of SRM No.20/74 and 2/95, Official Gazette of the RM No,20/97 13 Official Gazette of the Republic of Macedonia No.100, 21 November 2005

144
Revista Tinerilor Economişti field of broadcasting. The Broadcasting activity is the transmission of radio and/or television program services, regardless of the transmission technology used, in coded or un-coded form, intended for public reception14. Printed media issues are not regulated by particular law, except the issues pertaining the restrictions of media property that are regulated by articles that refer to broadcasting and printed media as well, which can be found in the Law on Broadcasting Activity.
According to the previous Broadcasting Law, broadcasting media operations are based on concession given to the media companies on the basis of the Broadcasting Law and Law on Telecommunications (Official Gazette of the Republic of Macedonia No.22/98), while according to the new Broadcasting Law the term concession no longer exists and instead of the concession, broadcasting companies work on the basis of the licenses given.
It is important to point out that in the media industry there are widely accepted universal standards (article 10 from the Human rights convention guarantees freedom in expression of thoughts and informing – as one of the basic right for each individual taking into account the principle of media independence). In the Republic of Macedonia article 2 of the Law on Broadcasting Activity clearly states that the main aim of the mentioned law is to provide freedom of expression in the broadcasting activity, in accordance with the Constitution of the Republic of Macedonia and international treaties ratified and acceded to by the Republic of Macedonia.
According to the new Broadcasting Law there are several different broadcasting activities: broadcasting activity on national level (broadcasters that provide coverage in terms of listeners or viewers, of at least 80% of the total population of the Republic of Macedonia), broadcasting activity on regional level (broadcasters that provide coverage in terms of listeners and viewers, for a territory of several municipalities that form a natural geographic or democratic entity with a population from 150,000 to 400,000 citizens) and broadcasting activity on local level (broadcasters that provide coverage in terms of listeners or viewers for the area of a single settlement and its immediate surroundings with population that shall not exceed 150,000 citizens)15.
Regarding the broadcasters (broadcasting companies or enterprises) there are also several different types of broadcasters: public communications network operator (public broadcasting enterprise) established for the whole territory of the Republic of Macedonia performing a function of a public broadcasting service; commercial broadcasting company; and non-profit broadcasting institution.16
Above mentioned are the main differences between the new (current) and the old Law on Broadcasting Activity. Namely, the old Law on Broadcasting Activity stated that there were only two types of broadcasters (public broadcasting enterprises and commercial broadcasting enterprises) contrary to the new Law on Broadcasting Activity stating that there are three types of broadcasters (public broadcasting enterprises, commercial broadcasting companies and non-profit broadcasting institutions that can be established by educational, cultural and other institutions and
14 Official Gazette of the Republic of Macedonia No.100, 2005, article 3 15 Law on Broadcasting Activity, Official Gazette of the Republic of Macedonia, No.100, 2005, article 4 16 Law on Broadcasting Activity, Official Gazette of the Republic of Macedonia No.100, 21 November 2005, article 7
145
Business Statistic – Economic Informatics citizens’ associations with the aim to provide for the needs and interests of specific target groups.17
What is specific for the Republic of Macedonia is that after a relatively long period of 27 years18 during which the main characteristic was the domination (monopoly) of the state owed public broadcasting enterprise Macedonian radio and television (MTV) (established in 1964 as public broadcasting organization – public service established by the Government of the Republic of Macedonia) and state owned newsletter-publishing house New Macedonia, a new period of existence of numerous private electronic media (radio and television broadcasting companies as well as publishing companies) in the domestic market has begun. In 1995 the number of private companies registered for broadcasting activities substantially increased and till 1997 (when the Law on Broadcasting Activity came into force)19, the total number of radio and television broadcasting companies in private property in the Republic of Macedonia reached the number of 250.20 In the next period the number of private broadcasting companies started to decrease and in December 2003 there were totaled 126 commercial broadcasting companies out of which 5 with a concession to broadcast nationally (two TV broadcasting companies and three radio broadcasting companies) and 121 broadcasting companies with a concession to broadcast locally (67 for radio broadcasting and 54 for television broadcasting)21. Namely, after a period of existing solely of one national radio and television station in the whole country, new changes in current legislative covering the media sphere has happened i.e. a period of media pluralism and liberalization of the Macedonian media market has started meaning that the Republic of Macedonia decided to abandon the broadcasting model with only one television and radio broadcasting company and decided to develop a dual broadcasting model that gave a possibility of parallel existence of private and public sector in media business.
With the recent changes in the Law on Broadcasting Activity, the Republic of Macedonia has started developing triplex broadcasting model (parallel existence of public broadcasting enterprises, commercial broadcasting companies and non-profit broadcasting institutions). It has to be stress out that the private sector operates through concession to pursue broadcasting activity (instead of concession a new Law determines the issuance of licenses which is significant difference between the old and new Law on Broadcasting Activity) issued by the Government of the Republic of Macedonia upon the proposal from the Broadcasting Council. This provision in 1999 was emphasized by the legal experts of the European Council22 as a matter of serious concern for giving the right for making final decisions on the broadcasting licensees’ allocation in the field of the government’s competence. However as a result of the
17 Law on Broadcasting Activity, Official Gazette of the Republic of Macedonia No.20,1997, articles 7 and 10 18 the first private media in the Republic of Macedonia started to work in 1991 19 Law on Broadcasting Activity, Official Gazette of the Republic of Macedonia No.20, 30.04.1977 20 Macedonian Media Institute, “Media property and its influence on media independence and pluralism”, Skopje 2004, page.43 21 Macedonian Media Institute, “Media property and its influence on media independence and pluralism”, Skopje 2004, page.44 22 Expertise on the Draft-Law on the Broadcasting Activity, Skopje, December, 1995, European Council.
146
Revista Tinerilor Economişti recommendation given by the European Institute for the Media in Düsseldorf that more executive power be granted to the Broadcasting Council, specifically in the area of licensing23, change has been made and according to the new Law the Broadcasting Council decide with majority of votes of the total number of its members (9 members) to grant licenses to pursue broadcasting activity24. License to pursue broadcasting activity for the transmission of a given television program service in the whole territory of the Republic of Macedonia (giving a status of national television i.e. television on national level) can be granted to a commercial broadcasting company only if the company can obtain coverage in terms of viewers of at least 80% of the total population of the Republic of Macedonia25. The previous Law stated that licenses to pursue broadcasting activity could be given to the company that could obtain coverage of 70% of the total population of the Republic of Macedonia26 which is another essential and note-worthy difference between the previous and Law on Broadcasting Activity that is currently in force.
Having in mind that it is impossible the situation in the Republic of Macedonia regarding all types of media to be presented in this paper, the paper pays attention only to television as a media. So, currently in the Republic of Macedonia there are numerous private television broadcasting companies (commercial TV companies) and one public television enterprise Macedonian television (MTV) with 3 program channels that are broadcasted on national level. It is public national television service with right to broadcast program throughout the whole territory of the Republic of Macedonia. At the same time out of the numerous private television broadcasting companies (the number of commercial TV broadcasting companies on national and local level according to the latest official data in the Republic of Macedonia totaled 55) only 5 have gained the license to pursue broadcasting (television) activity on national level. Thereby it can be said that 6 TV companies (including MTV) work in the Republic of Macedonia on national level out of which one is a public and the rest are commercial broadcasting companies. (See Table 2). Out of the 5 commercial broadcasting companies with a right to broadcast nationally, one company (Alsat-M) that should broadcast program in Albanian language haven’t started its operation yet27.
Namely, after a period of slightly decrease in the number of registered electronic media in the Republic of Macedonia, it can be noticed that in December 2004 the number of registered broadcasting companies slightly increased and there were 132 commercial broadcasting companies out of which 4 were national TV broadcasting companies, 3 national radio broadcasting companies and 125 local broadcasting companies (73 radio and 52 TV broadcasting companies). Also there were one public
23 European Institute for the Media (1999), Monitoring of the media coverage of the October-November, 1998 parliamentary elections in F.Y.R. Macedonia, Final Report, January, 1999: 51. 24 Law on Broadcasting Activity, Official Gazette of the Republic of Macedonia No.100, 21 November 2005, article 52 25 Law on Broadcasting Activity, Official Gazette of the Republic of Macedonia No.100, 21 November 2005, article 4 26 Law on Broadcasting Activity, Official Gazette of the Republic of Macedonia No.20, 30.04.1977, article18 27 Trpeska Snezana, “Ekonomiski uticaj na nezavisnost medija u Makedonij: Pritisak ili samocenzura?”, (“Economic influence on the media independence in the Republic of Macedonia: Pressure or autocensorship?”) 2005, http://www.anem.org.yu (access made on 01.12.2005)

147
Business Statistic – Economic Informatics broadcasting company (MTV) and 29 public radio broadcasting companies (out of which 12 operated as TV broadcasting companies as well) or in other words there were 57 TV broadcasting companies plus 12 radio broadcasting companies that also broadcast TV program) and 153 radio companies or in total 179 electronic media companies28.The previously mentioned 12 radio broadcasting companies that broadcast TV program have been operating without any concession for TV broadcasting activities given by the Broadcasting Council (they possess only concession for radio broadcasting activities) and according to the Broadcasting Council they are practically illegal but however their TV broadcasting activities have been tolerated so far.
Currently 5 companies are registered as commercial broadcasting companies with a right to broadcast on national level, one is public national TV broadcasting enterprise (MTV) with 3 program channels and the rest 50 are registered as commercial broadcasting companies on local level. Out of the 50 commercial broadcasting companies on local level, most probably 8 will get a license to pursue broadcasting activity on regional level as they all are located in Skopje29.
However, the new Law on Broadcasting Activity will be completely implemented in the practice pertaining the licenses for broadcasting activities on national, regional and local level (Concession agreements concluded pursuant to the previous Broadcasting Laws (Official Gazette of the RM No.20/97 and 70/2003) between the Government of the Republic of Macedonia and the commercial broadcasting companies shall be harmonized to the provisions of the new broadcasting Law) within 18 months from the day of entering into force of the new Law30.One of the main reasons of existence of such a big number of TV media in the Republic of Macedonia is the regulation according to which the license to pursue broadcasting activity can not be transferred to another person, nor to be sold31.The afore-mentioned can be noticed from the following Table 1 presenting the geographical distribution of all commercial television broadcasting companies located in several big cities in the Republic of Macedonia.
Table 1. Local TV broadcasting companies registered as commercial companies in several big Macedonian cities
City Number of local commercial TV
broadcasting companies
Commercial TV broadcasting companies
in private property
Population32
Bitola 3 TV company Tera TV company Medi TV company Orbis
86.408
Valandovo 1 TV company VTV 11.890
28 http://www.srd.org.mk (access made on 07.12.2005) 29 Cities with a population from 150.000 to 400.000 citizens are considered as separate region. The City of Skopje and its surroundings is considered as separate region. (Law on Broadcasting Activity, Official Gazette of the Republic of Macedonia No.100, 21.11.2005, article 4) 30 Law on Broadcasting Activity, Official Gazette of the Republic of Macedonia No.100, 21 November 2005, article 172 31 Law on Broadcasting Activity, Official Gazette of the Republic of Macedonia No.100, 21 November 2005, article 58 32 Statistical Yearbook of the Republic of Macedonia, 2004
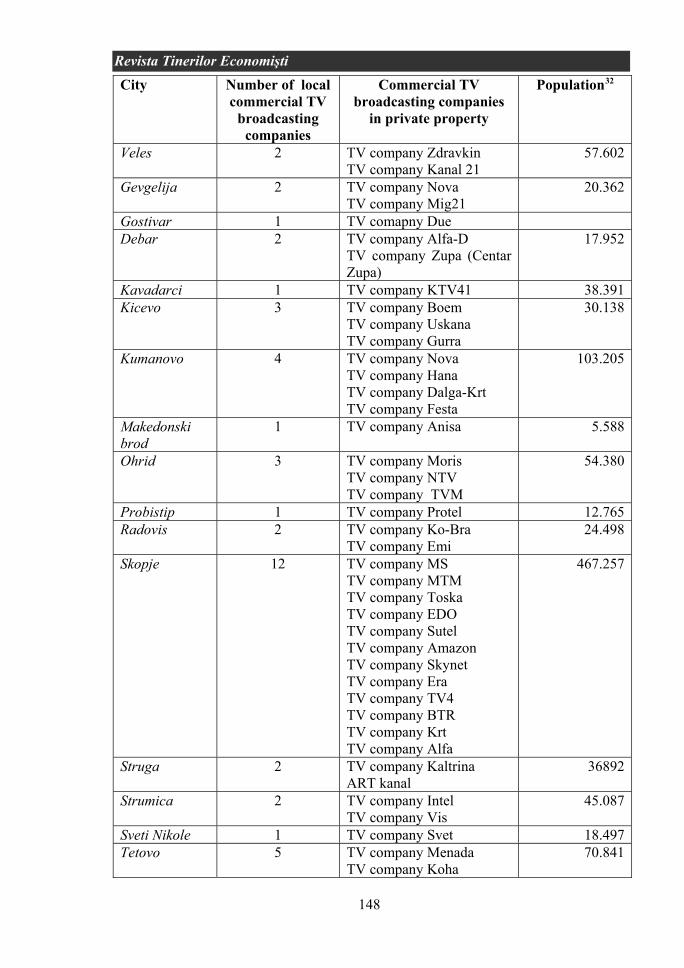
148
Revista Tinerilor Economişti City Number of local
commercial TV broadcasting
companies
Commercial TV broadcasting companies
in private property
Population32
Veles 2 TV company Zdravkin TV company Kanal 21
57.602
Gevgelija 2 TV company Nova TV company Mig21
20.362
Gostivar 1 TV comapny Due Debar 2 TV company Alfa-D
TV company Zupa (Centar Zupa)
17.952
Kavadarci 1 TV company KTV41 38.391 Kicevo 3 TV company Boem
TV company Uskana TV company Gurra
30.138
Kumanovo 4 TV company Nova TV company Hana TV company Dalga-Krt TV company Festa
103.205
Makedonski brod
1 TV company Anisa 5.588
Ohrid 3 TV company Moris TV company NTV TV company TVM
54.380
Probistip 1 TV company Protel 12.765 Radovis 2 TV company Ko-Bra
TV company Emi 24.498
Skopje 12 TV company MS TV company MTM TV company Toska TV company EDO TV company Sutel TV company Amazon TV company Skynet TV company Era TV company TV4 TV company BTR TV company Krt TV company Alfa
467.257
Struga 2 TV company Kaltrina ART kanal
36892
Strumica 2 TV company Intel TV company Vis
45.087
Sveti Nikole 1 TV company Svet 18.497 Tetovo 5 TV company Menada
TV company Koha 70.841

149
Business Statistic – Economic Informatics City Number of local
commercial TV broadcasting
companies
Commercial TV broadcasting companies
in private property
Population32
TV company Super Sky TV company Art TV company Kiss
Stip 2 TV company Iris TV company Star
47.796
Total: 50 1.149.549
Table 2. TV broadcasting companies on national level (public enterprises and commercial companies)
National TV broadcasting companies Number of TV program channels
1. MTV (two program channels in Macedonian language, one in Albanian language)
3
2. Alsat – M (program in Albanian language)
1
3. A1 (program in Macedonian language)
1
4. Sitel (program in Macedonian language)
1
5. Kanal 5 (program in Macedonian language)
1
6. Telma (program in Macedonian language)
1
In accordance with the data dated 2000, in USA (population:290.342.554-July
2003 and size: 9.626.091 km2) there were 1,489 newsletters (with 60 million subscribers), 11,928 radio stations, 1,684 TV stations, 51 million cable subscribers, 1,763 magazines intended for consumers33.In contrast to the situation in the USA regarding the media market where there are numerous media, in the Republic of Macedonia the number of media is far smaller expressed in absolute numbers, which is mainly result of the small size of the territory of the Republic of Macedonia (25,713 km2), small size of the population (2,022,547 according to the Census in 2002)34, insufficient development of the media technology and modern communications means as well. The functioning of over 50 TV broadcasting companies in a territory of approximately 2,000,000 citizens means that there is a large number of TV broadcasting companies existing in a relatively small market, having in mind that one TV broadcasting company serves about 37,000 people in average. In USA the average data shows about 173,000 citizens per one TV media35.
33 www.uiowa.edu/∼c019095 34 Statistical Yearbook of the Republic of Macedonia, 2004 35 www.uiowa.edu/∼c019095

150
Revista Tinerilor Economişti But, in spite of the numerous TV broadcasting companies that compete among
each other in the Republic of Macedonia, the income achieved is relatively big, meaning that all TV broadcasting companies work successful in the market where the competition is quite strong. According to the closing calculations for the year 2004, MTV company (Macedonian National Television) made an income of cca 5,000,000 EUR; cable TV companies 7,000,000 EUR, and private TV broadcasting companies (commercial companies) cca 4,750,000 EUR36.
3. Perspectives in TV media development in the Republic of Macedonia In view of the market evolution theory (Kotler, 2003)37, based on which every
market evolves through the phases of introduction, growth, maturity and decline, it is obvious that TV market in the Republic of Macedonia is experiencing the maturity phase. Namely, till 1991 in the Republic of Macedonia only Macedonian radio and television existed, but since 1991 the number of TV media has started to increase with slight variations, so today it can be said that the condition is stable and the media market starts to show characteristics typically for the maturity phase. In the maturity phase two different processes can run: market fragmentation and market consolidation. The TV media market in the Republic of Macedonia is in maturity phase or more specifically in the sub-phase of market fragmentation. What is expected in the future is market consolidation, for what the current legislative which regulates the issue of prohibited media concentration has to be taken into account (Law on Broadcasting Activity). Beside that, the changes in broadcasting activity probably will go in the direction of stimulation of their own programs i.e. stimulation of the domestic creations and cultural identity as well. With regards to the above mentioned, new changes in the Law on Broadcasting Activity have been accepted regulating that broadcasters that hold license to pursue broadcasting activity for television program services should dedicate at least 30% of their daily broadcast time to programs originally created in the Macedonian language or in the languages used by the non-majority communities living in the Republic of Macedonia38. In order the program quality of the national television stations to be improved, a new obligation regarding the broadcasting of the European audiovisual works has been imposed and the regulation obliges the broadcasters that hold licenses to pursue broadcasting activity for television program services on national level to provide representation of European audiovisual works to amount of at least 51% of the total annual broadcast programs having in mind that the air-time dedicated to broadcasts for news, sport events, game shows, advertising, teletext and teleshopping services should not be counted toward the mentioned total annual broadcast programs39.
4. Conclusion Since the TV media property in the Republic of Macedonia is quite fragmented
(there are many small TV broadcasting companies), the future TV media industry
36 Public Revenue Office in Republic of Macedonia (Official data for year 2004) 37 Kotler Philip, Marketing Management, Prentice Hall,USA, 2003, p.340-342 38 Law on Broadcasting Activity, Official Gazette of the Republic of Macedonia No.100, 21 November 2005, article 74 39 Law on Broadcasting Activity, Official Gazette of the Republic of Macedonia No.100, 21 November 2005, article 73

151
Business Statistic – Economic Informatics development will be directed towards creation of economic strong but at the same time professional broadcasting companies that will bring new and better quality program i.e. this will mean liberalization of the TV media concentration and freedom in capital circulation in the broadcasting activity. The good regulative regarding the broadcasting activity unquestionably will induce the better quality program as well as better quality of the advertising, teleshoping and other paid advertisements (announcements) distributed through TV broadcasting companies.
Also, TV broadcasting companies with solid foundation and with good program quality will have an influence over other enterprises that use TV media for their promotional aims having in mind that the TV broadcasting companies are part of the so called value chain of each enterprise and therefore doubtlessly the total profit i.e. success of the enterprises in Republic of Macedonia that work in various different businesses depends on the quality of the broadcasting services and on cooperation with existing TV broadcasting companies. The better the quality of the broadcasting services and the cooperation with broadcasting companies, the better results (financial and non-financial) that the company can achieve.
The situation with MTV has been extremely alarming for a long period of time since this broadcaster has huge old debts, problems with overemployment, low salaries, strikes (dissatisfied employees), many of the professionals employed in MTV leave MTV and find more challenging posts in private broadcasters although MTV has invested lot of money and has made it possible for them to receive advanced training and education and although MTV is still considered as the best institution where beginners can gathered valuable experience necessary for their carrier advancement.
So the future will show whether the combination of decisions typical for our unique, multicultural society with modern, sophisticated, “European” regulations will have effects on broadcasting activities in our country.
Nevertheless, passing the Law on Broadcasting Activity in the Republic of Macedonia is a powerful flash in the tunnel of confusion and political influence in broadcasting sector which were the main characteristics in the field of broadcasting during the previous period.
Finally, for the first time in the Republic of Macedonia there is a satisfaction regarding the new broadcasting regulations expressed by the private and public broadcasting sector, influential political groups as well as by public itself. There is nothing left but to wait time to show whether there will be success in the intention European standards to be introduced in the Macedonian broadcasting services together with the intention financial consolidation of the whole public broadcasting area to be carried out.
REFERENCES:
1. Kotler, Ph. Marketing Management, Prentice Hall,USA, 2003 2. Ninevski, B. Pecatenite i elektronskite mediumi vo Makedonija (The Print and
the Electronic Media in the Republic of Macedonia), Tribina makedonska, Skopje, 2000
3. Trpeska, S. Ekonomiski uticaj na nezavisnost medija u Makedoniji: Pritisak ili samocenzura?, (Economic influence on the media independence in the Republic of Macedonia: Pressure or
152
Revista Tinerilor Economişti autocensorship?) 2005 , http://www.anem.org,yu
4. * * * Statistical Yearbook of the Republic of Macedonia, 2004 5. * * * Law on Broadcasting Activity, Official Gazette of the Republic
of Macedonia No.20, 30.04.1977 6. * * * Law on Broadcasting Activity, Official Gazette of the Republic
of Macedonia No.100, 21.11.2005 7. * * * Media property and its influence on media independence and
pluralism, Macedonian Media Institute, Skopje 2004 8. * * * www.uiowa.edu/∼c019095 9. * * * Data from the Public Revenue Office of the Republic of
Macedonia 10. * * * http://www.srd.org.mk 11. * * * Expertise on the Draft-Law on the Broadcasting Activity, Skopje,
December, 1995, European Council.

153
Business Statistic – Economic Informatics
ERP AND E-BUSINESS
Assist. Prof. Ph.D Pulevska-Ivanovska Lidija, University “Ss. Cyril and Methodius” Faculty of Economics Skopje, Macedonia
Abstract: The Internet has revolutionized twenty-first century business. Organizations today can communicate with customers, suppliers, and sellers at e-speed with the click of a mouse. Yet, with all of the excitement about the external possibilities of the Internet, companies still need efficient internal processes to make and move products, manage finances, recruit and motivate employees, and excel. The companies best positioned to succeed in the near future are those that can balance existing enterprise resource planning (ERP)-based infrastructures and capabilities with exciting new e-business innovations. This paper elaborates the issues of ERP and e-business.
Keywords: ERP, E-Business, network, enterprise, management.
Introduction Enterprise Resource Planning systems (ERPs) integrate (or attempt to integrate)
all data and processes of an organization into a unified system. A typical ERP system will use multiple components of computer software and hardware to achieve the integration. A key ingredient of most ERP systems is the use of a unified database to store data for the various system modules. The term ERP originally implied systems designed to plan the utilization of enterprise-wide resources. Although the acronym ERP originated in the manufacturing environment, today's use of the term ERP systems has much broader scope. ERP systems typically attempt to cover all basic functions of an organization, regardless of the organization's business or charter. Business, non-profit organizations, non governmental organizations, governments, and other large entities utilize ERP systems.
Additionally, it may be noted that to be considered an ERP system, a software package generally would only need to provide functionality in a single package that would normally be covered by two or more systems. Technically, a software package that provides both Payroll and Accounting functions (such as QuickBooks) would be considered an ERP software package.
However, the term is typically reserved for larger, more broadly based applications. The introduction of an ERP system to replace two or more independent applications eliminates the need for external interfaces previously required between systems, and provides additional benefits that range from standardization and lower maintenance (one system instead of two or more) to easier and/or greater reporting capabilities (as all data is typically kept in one database).
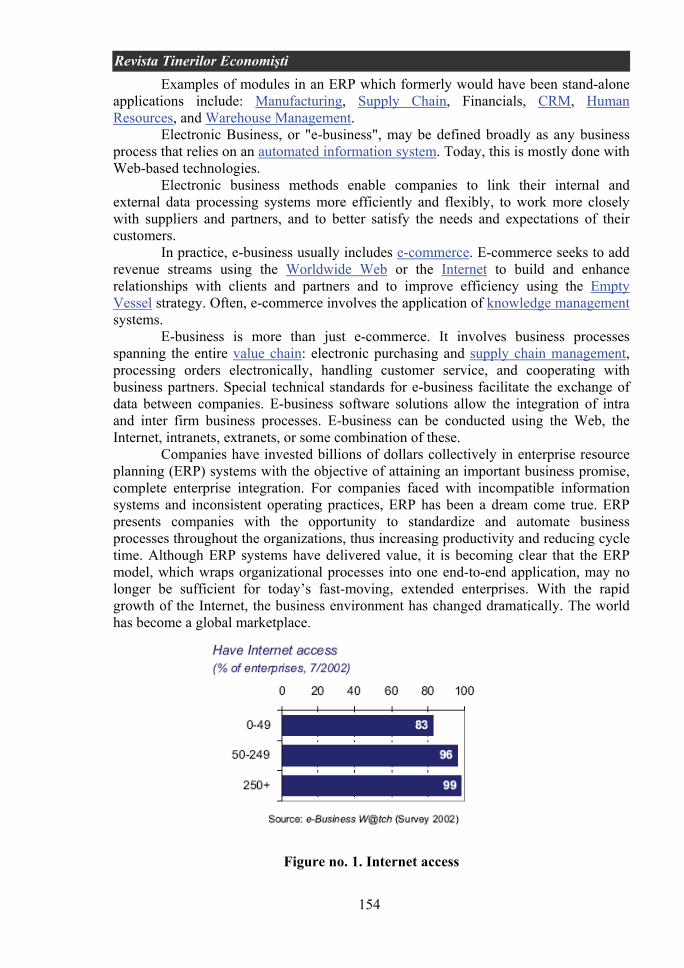
154
Revista Tinerilor Economişti Examples of modules in an ERP which formerly would have been stand-alone
applications include: Manufacturing, Supply Chain, Financials, CRM, Human Resources, and Warehouse Management.
Electronic Business, or "e-business", may be defined broadly as any business process that relies on an automated information system. Today, this is mostly done with Web-based technologies.
Electronic business methods enable companies to link their internal and external data processing systems more efficiently and flexibly, to work more closely with suppliers and partners, and to better satisfy the needs and expectations of their customers.
In practice, e-business usually includes e-commerce. E-commerce seeks to add revenue streams using the Worldwide Web or the Internet to build and enhance relationships with clients and partners and to improve efficiency using the Empty Vessel strategy. Often, e-commerce involves the application of knowledge management systems.
E-business is more than just e-commerce. It involves business processes spanning the entire value chain: electronic purchasing and supply chain management, processing orders electronically, handling customer service, and cooperating with business partners. Special technical standards for e-business facilitate the exchange of data between companies. E-business software solutions allow the integration of intra and inter firm business processes. E-business can be conducted using the Web, the Internet, intranets, extranets, or some combination of these.
Companies have invested billions of dollars collectively in enterprise resource planning (ERP) systems with the objective of attaining an important business promise, complete enterprise integration. For companies faced with incompatible information systems and inconsistent operating practices, ERP has been a dream come true. ERP presents companies with the opportunity to standardize and automate business processes throughout the organizations, thus increasing productivity and reducing cycle time. Although ERP systems have delivered value, it is becoming clear that the ERP model, which wraps organizational processes into one end-to-end application, may no longer be sufficient for today’s fast-moving, extended enterprises. With the rapid growth of the Internet, the business environment has changed dramatically. The world has become a global marketplace.
Figure no. 1. Internet access

155
Business Statistic – Economic Informatics E-business has changed the definition of enterprise systems. Beyond the core
business functions that ERP has traditionally focused on, e-business pushes the ERP from the inside core of the companies to the network edge. Companies are realizing that the most challenging part of e-business initiatives is not in developing a Web storefront but in extending ERP to accomplish business-to-business (B2B) and business-to-consumer (B2C) solutions. A new extended enterprise system emerges by integrating ERP with e-business, which creates business that is more agile, more focused and more competitive than traditionally structured business and tight B2B connections. With the help of the componentization concept, a seamless, end-to-end flow of information and process across the value chain of companies becomes realistic.
Figure no. 2. Online purchases
ERP and E-Business ERP is a structured approach to optimizing a company’s internal value chain.
The software, if implemented fully across an entire enterprise, connects the various components of the enterprise through a logical transmission and sharing of data. When customers and suppliers request information that have been fully integrated throughout the value chain or when executives require integrated strategies and tactics in areas such as manufacturing, inventory, procurement and accounting, ERP systems collect the data for analysis and transform the data into useful information that companies can use to support business decision-making. ERP systems, if implemented successfully, enhance and redesign business processes to eliminate non-value-added activities and allow companies to focus on core and truly value-added activities.
The following are two examples where ERP systems have dramatically increased the efficiency and productivity of companies: IBM has used ERP to reduce the processing time for updating pricing data from 80 days to five minutes and Chevron has used ERP to decrease its annual purchasing cost by 15%. E-business stands for “electronic business,” which involves communications and doing business electronically through the Internet. E-business is defined as “the use of electronically enabled communication networks that allow business enterprises to transmit and receive information”. It can significantly improve business performance by strengthening the linkages in the value chain between businesses (B2B) and consumers (B2C). Besides increasing efficiency in selling, marketing and purchasing, e-business

156
Revista Tinerilor Economişti achieves effectiveness through improved customer service, reduced costs and streamlined business processes. Furthermore, e-business creates a strategic, customer-focused business environment for shared business improvements, mutual benefits and joint rewards.
Figure no. 3 Impact of E-Business Companies use the Internet to implement customer-relation-management
(CRM) and supply-chain-management (SCM) capabilities, which enable them to link their operations seamlessly with customers and suppliers. For example: Nantucket Nectars, a juice manufacturer with 40% growth and $70 million in annual sales revenue, sells its organic juices through 150 distributors nationwide as well as general stores and juice bars in Nantucket. By using Oracle’s ERP system and e-business platform, the salespersons can track sales and promotions through the Internet, and are provided assistance and suggestions to enhance their performance. The salespersons and distributors have access to commission reports, and they can track and adjust sales orders. Through consolidating its financial, compensation, sales and depletion data into a single report, Nantucket prevents out-of-stock and partial shipments. The forecasted need for 50% more labor force to handle customer service issues in the past was eradicated by integrating ERP system with e-business. By definitions and by their respective functions, traditional ERP systems take care of internal value chain (i.e., within a company) whereas e-business establish the value chain across the market and the industries. More and more companies construct their systems’ architectures by integrating ERP systems with e-business. They use Web-based interface (corporate portals) with outside entities plus add-on modules such as CRM, SCM, etc. in the integration.
E-Business pushes ERP to the network edge In a traditional business process, after a customer order is received, the order
information flows from department to department through order entry, manufacturing, warehousing, distribution and finance until the product is delivered to the customer and

157
Business Statistic – Economic Informatics the payment is received. The key elements of the value chain have been controlled by separate and disparate information systems that could not communicate with one another. Not only did the companies not take an integrated view of their own business processes, but they also had an equally vague understanding of how their systems relate to the systems of their suppliers, competitors, business partners, distributors and customers. Hence, these transactions are typically carried out with minimal or no shared business processes. In recent years, there has been a revolution in systems planning and design. Management takes an integrated company-wide view of its IT investments and choices, and implements an ERP system that integrates the core business processes of an entire company into single software and hardware system.
Customers, suppliers and business partners are consciously included in the business process, systems operation and systems development. An ERP system is analogous to the internal technological hub of a company. When fully implemented as an integrated suite, it can be thought of as a company’s central repository. The five major processes in a typical ERP system are: finance, logistics, manufacturing, human resources and sales/marketing. The focus of ERP systems is on the efficiency and effectiveness of the internal process. It offers a way to streamline and align business processes, increase operational efficiencies and bring order out of chaos. E-business is focused on efficiency and effectiveness of external, cross enterprise processes. While ERP technology supports business strategy, e business opens the door to new strategic opportunities, which forces ERP to take one step further — to move from the single ERP system model to the extended ERP system model. The Web technology provides the bridge between companies and their business partners to make e-business possible, while e-business makes the ERP system more transparent and outward.
Instead of thinking about ERP within a company, we may view the ERP system along the value chain of companies in the same industry, or across industries. Companies are now turning their attention outward to engage in business with customers, suppliers and business partners through the use of the Internet and Web-based technologies. ERP functionality has to move on to the Web because that is where most of the core business processes are being carried out. The earlier example on the flow of a customer order and the steps in the process flow across the boundaries of the companies would now be handled by a number of different companies behaving as if they are one. If a corporation decentralizes autonomous business units, they need to be able to access and share data between departments, managers and employees. With ERP systems, a transaction only needs to be entered once. The system can process the transaction across different software modules, resulting in highly comprehensive and integrated information that can be used for decision-making. While an ERP system can be viewed as a repository for data, information and knowledge, and it extends beyond functional boundaries by redefining enterprise wide processes, a Web-enabled ERP system forces companies to look at processes that span multiple enterprises.
When e-business is integrated with ERP, the whole extended system provides a vision of business processes that span multiple businesses and enterprises. In the most ideal case, companies should be able to connect disparate platforms, applications and data formats across the value chain, including not only suppliers, but also customers as well. Furthermore, companies should retain the flexibility to change and add functions to applications as business needs evolve. Companies need to be able to adapt their ERP systems to the emerging world of e-business.
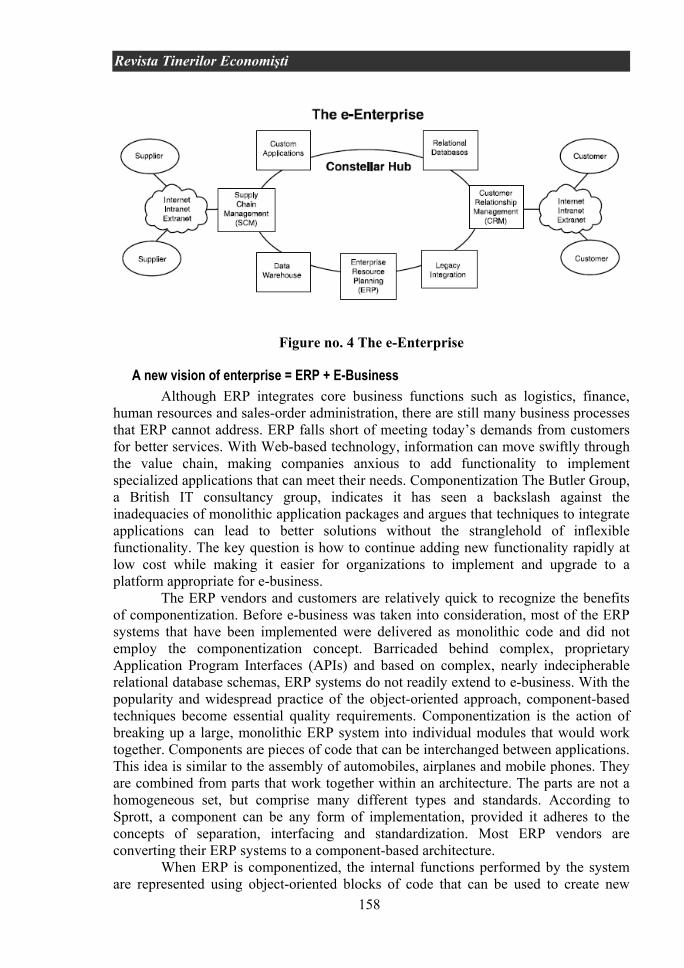
158
Revista Tinerilor Economişti
Figure no. 4 The e-Enterprise
A new vision of enterprise = ERP + E-Business Although ERP integrates core business functions such as logistics, finance,
human resources and sales-order administration, there are still many business processes that ERP cannot address. ERP falls short of meeting today’s demands from customers for better services. With Web-based technology, information can move swiftly through the value chain, making companies anxious to add functionality to implement specialized applications that can meet their needs. Componentization The Butler Group, a British IT consultancy group, indicates it has seen a backslash against the inadequacies of monolithic application packages and argues that techniques to integrate applications can lead to better solutions without the stranglehold of inflexible functionality. The key question is how to continue adding new functionality rapidly at low cost while making it easier for organizations to implement and upgrade to a platform appropriate for e-business.
The ERP vendors and customers are relatively quick to recognize the benefits of componentization. Before e-business was taken into consideration, most of the ERP systems that have been implemented were delivered as monolithic code and did not employ the componentization concept. Barricaded behind complex, proprietary Application Program Interfaces (APIs) and based on complex, nearly indecipherable relational database schemas, ERP systems do not readily extend to e-business. With the popularity and widespread practice of the object-oriented approach, component-based techniques become essential quality requirements. Componentization is the action of breaking up a large, monolithic ERP system into individual modules that would work together. Components are pieces of code that can be interchanged between applications. This idea is similar to the assembly of automobiles, airplanes and mobile phones. They are combined from parts that work together within an architecture. The parts are not a homogeneous set, but comprise many different types and standards. According to Sprott, a component can be any form of implementation, provided it adheres to the concepts of separation, interfacing and standardization. Most ERP vendors are converting their ERP systems to a component-based architecture.
When ERP is componentized, the internal functions performed by the system are represented using object-oriented blocks of code that can be used to create new

159
Business Statistic – Economic Informatics applications. The componentization of functionalities in ERP will make the internal and external systems more adaptable and reliable. Therefore, it will smooth the information flow along the value chain. Based on the object-oriented concept, each functionality of ERP can be viewed as a separate encapsulated entity and treated as a component. By virtue of the independence of components, it is easier to manage, upgrade and modify a component-based ERP system. Granularity, scope boundaries and internal cohesion are important attributes of a component. A fine-grained component will be simple to upgrade because it involves fewer relationships but requires more management since there is likely to be many more parts needed to meet the requirement. In contrast, a larger component may be easier to manage but would require more effort to modify and implement because the scope of the functionality is much broader and the impact of changes is much greater. Since the components encapsulate individual business processes that other components can freely access, companies can more precisely control individual business processes.
This divide-and-conquer approach allows the companies to do rapid concurrent development. Componentization breaks large-scale business processes into self-contained units of manageable size and makes it easier to deploy ERP systems in an e-business environment. ERP and e-business applications can be assembled from Web-based components such as Online Analytical Processing (OLAP) components, batch components, application components and database components. A company implementing an ERP system would be able to select different modules or components from multiple vendors instead of picking a single vendor. Since an ERP system can be broken down into components by functionalities, the vendors would be able to quickly fix or add functionality to ERP systems. An individual component of ERP can be enhanced without affecting any other functional components. IBM research shows that only 20% of companies use a single ERP vendor. Almost 80% of companies use multiple vendors.
Using the Internet-enabled ERP as a foundation, componentization delivers one or more services. The service is the function that the component provides to the user (another server or client). A service might therefore be something very simple such as a look up synonyms service provided by a Thesaurus component, or as comprehensive as update new customer information service provided by a Customer Relationship Management (CRM) application. A series of services provided by multiple disparate components might be integrated into a common workflow that performs a unified business purpose. It is very important that the interface and service provided are independent of the underlying implementation. For example, an implementation of ERP may be provided by a legacy database. With componentization, the legacy database can be replaced by an object-oriented database with no effect on the user of the service, provided the interface remains unchanged. Flexible Customization ERP vendors will come under considerably increasing pressure as they are forced to open up their products and to market components separately before the ERP market becomes saturated.
It is becoming increasingly popular for components to be assembled by customers since companies need flexible ERP systems where new applications can be added fairly quickly and business intelligence can be extracted to fit into B2B and B2C solutions. The successful ERP vendors are beginning to provide customers with flexible and economical operational infrastructure that easily integrate with open market components. These vendors allow customers to exercise considerable choice in

160
Revista Tinerilor Economişti procurement to create customized solutions from readily and widely available building blocks. A major advantage of component-based ERP is the incremental release and upgrade process. This is a benefit in the initial implementation as well as ongoing enhancement. Many ERP vendors and existing customers underwent considerable upgrade pain before they could achieve this result. The realities of upgrading are also not as simple as one might think. A complete integration test should be undertaken because of the high levels of interdependence between the components. The ultimate goal is to develop ERP components that are compatible with one another and that can be easily integrated with e business and other applications.
Current issues
With the rise of e-business, integration becomes a challenging but mission-critical task in the corporate use of information technology. Some companies are reluctant to implement ERP/e-business due to the greater complexity involved in integration. The integration of ERP with other Web enabled applications (CRM, SCM) is a complicated and timing-consuming process. The cost of software, implementation, training and maintenance will increase. The key e-business issue in application integration is to link e-businesses to other applications (that may be based on different technologies, business models and data models) without breaking the value chain. Enterprise Application Integration (EAI) software helps to integrate applications by packaging together the commonly used functionalities—combining popular enterprise packages and legacy applications in a predefined way.
Therefore, EAI will make ERP/e-business integration and componentization simpler and more practical. In addition to the above issues, other issues remain in implementing ERP, integrating the systems and outsourcing ERP/e-business. ERP implementations provide the backbone necessary for e-business. Without successful implementations of ERP, the capabilities provided by Web-based functions are limited. The growing number of horror stories about failure or out-of-control projects should certainly be brought to the companies’ attention: FoxMeyer Drug argued that its ERP system drove it to bankruptcy before connecting its system to the Net. Mobile Europe spent hundreds of million of dollars on ERP only to abandon it when its merger partner objected. Dell Computer found that its system would not fit its new and decentralized management model. Despite the promise and the high investment needed in implementing ERP systems and in linking ERP systems to the e-business infrastructure, statistics show that more than 70% of ERP implementations, whether self-created or designed by established ERP software vendors, fail to achieve corporate goals.
The main reasons for ERP implementation failures are due to business and management problems. Companies fail to reconcile the technological imperatives of the ERP with the business requirements of the enterprise itself. If a company rushes to install an ERP without first having a clear understanding of the business implications within an Internet economy, the dream of integration can quickly turn into a nightmare. The logic of the ERP may conflict with the logic of the e-business. Many companies implemented ERP due to its ability to bring order and efficiency through internal standardized business processes. However, every company has its unique business requirements and needs. Standardized processes that fit every organization are very difficult to develop. By implementing ERP, some companies have replaced proprietary processes that were better suited for their needs with standardized ERP processes. Since

161
Business Statistic – Economic Informatics ERP business processes are often rigid and the components of the ERP from different vendors are usually not compatible, companies have found adapting ERP to new market demands to be difficult. In SAP R/3, most of the customers inevitably find that at least 20% of their needed functionality is missing from the package. Componentization of ERP functions is in dire need.
Companies need to understand that e-business requires something close to building a second backbone system on top of ERP. They should also realize that it would be neither quick nor easy. IBM estimated that 70% of all codes written today consist of interfaces, protocols and other procedures to establish linkages among various systems. A software analyst at BancBoston, Robertson Stephens, said he spent 50% of his time on enterprise application integrations. The integration requires companies to provide more IT and end-user training. There is a longer learning period requirement for the daily operation. The sheer size, scope and complexity of these projects usually exceed expectations. The result is that companies often wait for years before they begin to see benefits. Lack of functionalities in ERP is forcing business processes to fit the software, and bolting on customized programs, while adding to the time and cost of implementation. Moreover, some alternatives, such as using work-around and customizing the software, increase the difficulty of upgrading to new releases of the ERP package. More often than not, projects wind up late or over budget. In the meantime, business time horizons have grown ever shorter. By the time companies have installed their ERP systems, their business has moved on and their original requirements have changed. Outsourcing implies the use of external agents to perform an organizational activity.
Companies consider outsourcing when: 1) cost saving is expected; 2) management wants to focus on its core business; and/or 3) the internal information systems function is perceived to be inefficient, ineffective or technically incompetent.
Based on case studies, outsourcing decisions may be a result of rational consideration and/or it may be a product of organizational politics, conflicts and compromises. Many companies are outsourcing their ERP/e-business implementation and integration to the best-of-breed vendors to simplify the daily operation and to better control the budget. This enables organizations to focus on their core businesses. Besides, many outsourcers price their services on a monthly basis with a fixed fee. This allows companies to better manage the cash flow and eliminate the large outlays typically associated with software rollouts and upgrades. However, there are challenges in outsourcing ERP/e-business, most of which are strategic and technological issues:
• Renting remotely hosted ERP with e-business functionalities will have impact on the way independent software vendors conduct business. Therefore, it is essential that the vendors provide enough bandwidth and a high level of reliability to ensure that the applications perform at a necessary level for consistent and acceptable service and 24-7 availability.
• Success in ERP calls for extensive customization for power users. (In reality, ERP in midsize and small companies normally does not need much customization.)
• Companies should consider the possible leak of their business logic when outsourcing ERP. Manufacturers that outsource their ERP processes to a third party are launching themselves on a slippery slope to oblivion. For instance, when General Motors outsourced its ERP, it took them years to rebuild that infrastructure. A study of
162
Revista Tinerilor Economişti 40 US and European companies concluded that outsourcing led to problems and disappointments.
• Outsourcing ERP/e-business may actually result in higher cost. According to InformationWeek, 19% of respondents said they didn’t outsource ERP because they didn’t believe it would be a cost-effective solution.
• ERP/e-business outsourcing solution is only dominant in midsize and small companies. According to Mega Group, 60% of small and midsize companies are interested in outsourcing ERP. The large corporations are less likely to outsource their backbone systems.
Future trends The rapid growth of the Internet will lead to a large increase in the number of
ERP users. Companies are eliminating disintegrated legacy systems by replacing them with Web-enabled, integrated ERP systems. These integrated systems become part of the overall business strategy that connects an enterprise with its suppliers and customers, and transforms the entire value chain. Companies that intend to move into a net economy are beginning to emerge and focus on multi-enterprise systems integration and growth. They are forming strategic partnerships with major e-business infrastructure providers (Sun, IBM and Microsoft) to continuously integrate their ERP systems for reaching the internal and external performance target. Major ERP vendors (Oracle, SAP, BAAN, JD Edwards and i2) are constantly updating and releasing integrated ERP/e-business suites to support an open, collaborative and competitive business environment:
• The major ERP vendors will continue to build compatible and adaptable ERP components and develop extended ERP solutions designed to address the latest market demands. For example, Oracle’s Release 11i is a business application suite that consists of Supply Chain Management, Order Management and new self-service software modules. It is tied to a Customer Relationship Management (CRM Release 11I and Oracle Exchange) application. The whole software suite works seamlessly with one another to handle everything from customer service on one end to relationship with suppliers on the other. It is all refigured to run on the Web. Based on the company’s vision, anyone from giant corporations to tiny dot-coms can buy a single package from Oracle to run their e-business, rather than buying software from a host of competitors and trying to stitch it all together. If it works, it will move computing from desktop PCs to huge Internet servers that run anything from Web sites to complex corporate networks. Oracle’s skills and technologies are taking the center stage. JD Edwards offers its One World Software as a host service over networks. This application service is designed to be easier to deploy and adapt. It will overcome the inflexibility of the ERP system on its implementation time.
• With the convergence of the Internet and wireless technology, users can access Web-enabled ERP systems anytime and anywhere through the use of newer and easier-to-use devices, such as personal digital assistants, smart phones, in-devices and biometric tools. For example, an accounting manager who is out of town will leverage his company’s ERP with a personal digital assistant to review financial reports and give directions to his subordinates. He/she can log on to the system using his/her fingerprint or voice.
• The use of XML in B2B communications will enable a host of new relationships between companies, vendors, suppliers and customers. Exporting data
163
Business Statistic – Economic Informatics from application suites and developer tools using XML will become a standardized feature. For example, IBM translates generic XML information into device-specific formats that can be used on wireless devices.
• Outsourcers, ERP vendors and e-business infrastructure provider’s alliance together to provide more robust, scalable and compatible e-business platforms for the companies. PriceWaterhouseCoopers has built a strategic relationship with the Sun-Netscape Alliance (an alliance of Sun and AOL) to provide technology and services that enable companies to build business-critical e-business solutions that leverage investments in SAP R/3. Netscape Application Server for R/3 has provided a reliable infrastructure for Web solution (iPlanet) that allows customers to access PriceWaterhouseCoopers’ SAP system in a secure manner.
• The future trend of ERP outsourcing is to explore into the applications service market. By the year 2003, offering ERP service over the Web will be a $2 billion business, as more than a dozen Application Service Providers (ASPs) are moving into the market. ASP’s take ERP and non-ERP applications from multiple vendors and put them together into a service. Rather than selling their creations in house to corporate customers, they make their products available over the Web on a lease or rental basis. In addition, some mid-market companies are seeking to outsource their non-core business processes, such as payroll and employee benefit administration. According to a recent survey, 75 to 80% of a company’s financial cost is tied up in labor or labor support. Any realistic attempt to reduce or manage costs in the finance and administration area has to focus not only on improved technology, but also on labor issues, the high costs of labor and the shortage of skilled labor.
Conclusion Given today’s information age, e-business is the solution to dictate a successful
information economy. However, companies can do little to move into this stage without the underlying (ERP) infrastructure in place as a foundation. Today, extended ERP systems with front-end e-business connect an organization’s “front office” (customer facing) and “back office” (business processes) operations to meet its global emerging market. Extending ERP means unleashing critical information and making it accessible to employees, customers and business partners, so that the various entities along the entire value chain can make better decisions. Indeed, best practices consist of real-time, cross-enterprise, Internet based flow of information, documents and processes, that is routed and driven in the most efficient and effective way. From a technical point of view, development and deployment of e-business models never stop. Companies should constantly reinvent to leverage changes in e-business technology and its ERP integration, or other business applications. New e-business models are emerging as companies in all industries are transforming themselves to compete in the Internet economy. Successful transformation requires new e-business strategies and processes, as well as robust and scalable application and technology platforms. With the right strategy and solid execution, an enterprise can transform itself to compete and grow in today’s rapidly changing business environment.

164
Revista Tinerilor Economişti
REFERENCES 1. Norris, G.,
Hurley, J. R., Hartley, K. M., Dunleavy, J. R., and Balls, J. D..
E-Business and ERP: Transforming the Enterprise, PriceWatehouseCoopers, 2000
2. Hamm, S. Why it’s cool again? Business Week, May 8, 114- 126, 2000
3. Wang B., Hoon F.
ERP + E-Business = A New Vision of Enterprise System
4. Fellenstein, C., and Wood, R.
Exploring E-Commerce, Global EBusiness, and E-Societies. Prentice Hall, 2000

165
Business Statistic – Economic Informatics
CURRENT ACCOUNT DEFICIT ANALYSIS. THE PATTERN BASED ON ADJUSTING COST OF
INVESTMENTS
Assist. Ph.D Student Radu Criveanu Assoc. Prof. Ph.D Marian Siminica Assist. PhD. Candidate Daniel Circiumaru University of Craiova Faculty of Economics and Business Administration Craiova, Romania
Abstract: The present paper deals with the issue of current account deficit, trying to offer a series of answers to the debates regarding its recent evolution in Romania. In the former part it is presented the level of current account deficit and the evolution of its main components within the period 2001-2005. The latter part tries to quantify the main factors that may influence and affects the level of current account deficit, using a pattern based on adjusting investments cost.
Keywords: current account deficit, commercial balance, income balance, models, investment adjustment cost.
1. Introduction There has been noticed lately, more and more often, a wide series of debates of
specialists regarding the interpretation of macroeconomic figures. There is a certain consensus concerning the forecasting of inflation, economic growth, exchange rate and interest, but there are major problems while interpreting their figures, respectively sustainability of economic growth, current account deficit and disinflation process. Moreover, the specialists` opinions do not only differ regarding the further economy evolution, but also regarding the actual condition of the Romanian economy.
Thus, we can say that the debates are between two distinct groups: the optimistic and the pessimistic persons. For instance, conform to the report of The Ministry of Public Finances regarding the macroeconomic situation; the current account deficit will be steady within 2007-2010. The above-mentioned report specifies, “the sustainability of current account deficit will be ensured mainly by direct investments, capital transfers and portfolio investments (almost 80%) ”40. At the same time, the same report specifies that the impact of commercial deficit on current account will be partially compensated by the surplus of net current transfers. The current account deficit for 2006 is estimated at 8.6% of GDP, and for 2008 and 2009 it is estimated to be steady, at 8.7% of GDP, whereas in 2010 it is estimated to reach the level of 8.6 of GDP again. On the other hand, a series of analysts pay attention to the unforeseeable aspects of some expensive corrections at the level of economic growth and current account deficit.
40 www.mfinante.ro
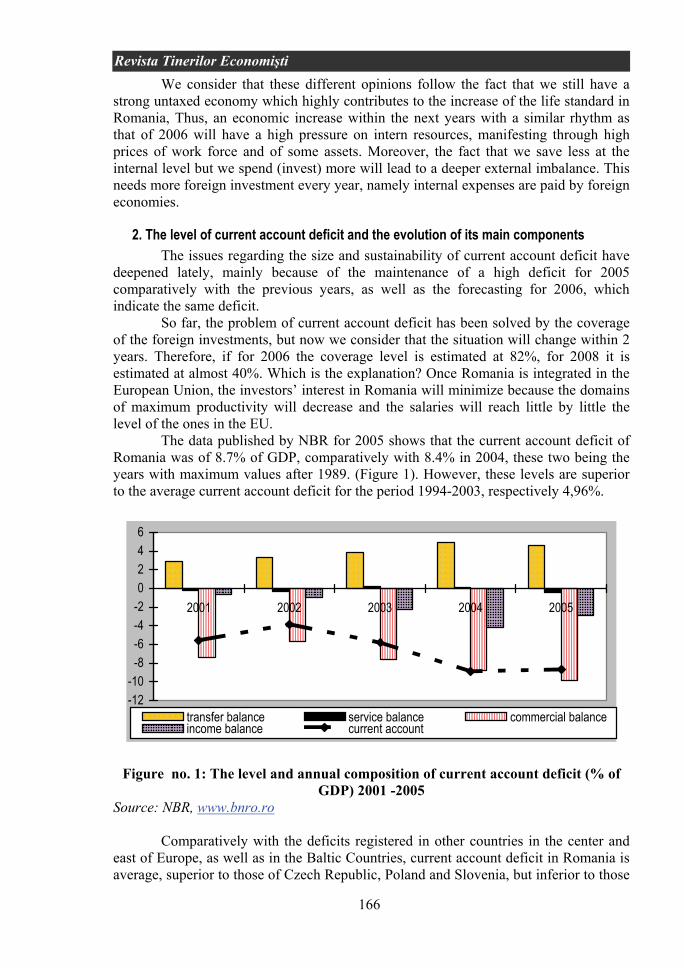
166
Revista Tinerilor Economişti We consider that these different opinions follow the fact that we still have a
strong untaxed economy which highly contributes to the increase of the life standard in Romania, Thus, an economic increase within the next years with a similar rhythm as that of 2006 will have a high pressure on intern resources, manifesting through high prices of work force and of some assets. Moreover, the fact that we save less at the internal level but we spend (invest) more will lead to a deeper external imbalance. This needs more foreign investment every year, namely internal expenses are paid by foreign economies.
2. The level of current account deficit and the evolution of its main components The issues regarding the size and sustainability of current account deficit have
deepened lately, mainly because of the maintenance of a high deficit for 2005 comparatively with the previous years, as well as the forecasting for 2006, which indicate the same deficit.
So far, the problem of current account deficit has been solved by the coverage of the foreign investments, but now we consider that the situation will change within 2 years. Therefore, if for 2006 the coverage level is estimated at 82%, for 2008 it is estimated at almost 40%. Which is the explanation? Once Romania is integrated in the European Union, the investors’ interest in Romania will minimize because the domains of maximum productivity will decrease and the salaries will reach little by little the level of the ones in the EU.
The data published by NBR for 2005 shows that the current account deficit of Romania was of 8.7% of GDP, comparatively with 8.4% in 2004, these two being the years with maximum values after 1989. (Figure 1). However, these levels are superior to the average current account deficit for the period 1994-2003, respectively 4,96%.
-12-10
-8-6-4-20246
2001 2002 2003 2004 2005
transfer balance service balance commercial balanceincome balance current account
Figure no. 1: The level and annual composition of current account deficit (% of GDP) 2001 -2005
Source: NBR, www.bnro.ro
Comparatively with the deficits registered in other countries in the center and east of Europe, as well as in the Baltic Countries, current account deficit in Romania is average, superior to those of Czech Republic, Poland and Slovenia, but inferior to those

167
Business Statistic – Economic Informatics of Leetonia, Estonia or Bulgaria. Moreover, comparing the actual deficit of Romania with that registered in the 10 countries which adhered to EU in 2004m for the last 2 years before integration its image is mixed as well. Respectively, if some countries (Estonia and Hungary) registered the maximum deficit level within 1995-2003, others (Malta and Slovenia) registered the minimum level within the same period. (Table 1)
Table no 1. The level of current account deficit (% of GDP) in the countries – new members of EU
2002 2003 Czech Republic -5.78 -6.39 Estonia -10.18 -12.14 Hungary -7.23 -9.10 Latvia -6.75 -8.30 Lithuania -5.07 -6.87 Poland -2.62 -2.19 Slovakia -8.07 -0.87 Slovenia 1.50 -0.30 Malta 0.29 -5.77 Cyprus -4.39 -3.36
Source: Bloomberg
The growth of current account deficit of Romania beginning with 2004 is explained by the structural internal changes of economy and by the catching up process. In addition, the real appreciation of national currency contributes too. Despite all this, the exports maintain their robust growth rate, the appreciation effect being limited also following the high exchange degree between different product groups.
To the evolution of the current account balance have contributed, to different extents, all the four above mentioned components: commercial balance, services balance, incomes balance and current transfers balance.
As we can notice from figure 1, the contribution of services balance deficit was almost insignificant, and commercial balance deficit was the main cause of the deepening current account deficit.
We think that the real appreciation of the national currency in the last years (following the appreciation in nominal terms of the currency), under the conditions of reducing consumer price index rate, has not had a significant impact on the exports level, whose curve is still ascendant. The negative impact of appreciation of the national currency was partially annihilated by performing both import and export operations (by the same economic agents), as well as by the distribution of exports and respectively imports into different groups.
The negative balance, with a tendency of increasing of incomes balance is mainly reflected by the evolution of the incomes balance from foreign investments. Respectively, the statistic research regarding direct investments of non-residents in Romania has completed this indicator conform to IMF Methodology, including the re-invested profit within the flow of incomes from direct foreign investments. It has implicitly determined a rise of current account deficit, and at the same time an increase of the surplus of capital and financial account, thus the net position being unchanged.
We have to notice that the increase of the reinvested profit represents an acknowledge of Romania’s investing attractivity, its positive effects being perpetuated.
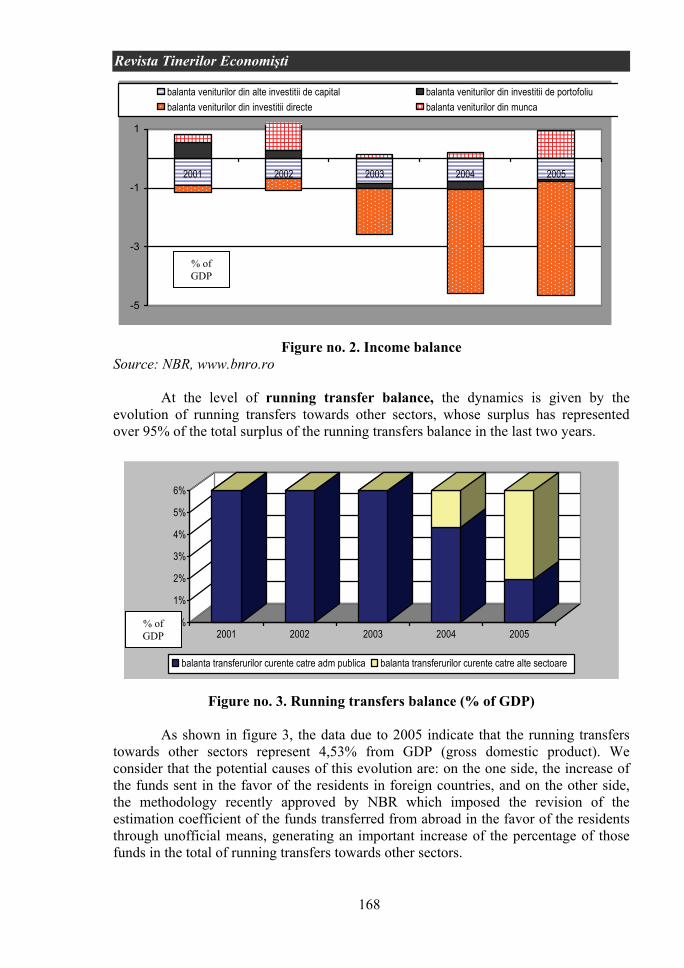
168
Revista Tinerilor Economişti
-5
-3
-1
1
2001 2002 2003 2004 2005
balanta veniturilor din alte investitii de capital balanta veniturilor din investitii de portofoliubalanta veniturilor din investitii directe balanta veniturilor din munca
Figure no. 2. Income balance
Source: NBR, www.bnro.ro At the level of running transfer balance, the dynamics is given by the
evolution of running transfers towards other sectors, whose surplus has represented over 95% of the total surplus of the running transfers balance in the last two years.
0%
1%
2%
3%
4%
5%
6%
2001 2002 2003 2004 2005
balanta transferurilor curente catre adm publica balanta transferurilor curente catre alte sectoare
Figure no. 3. Running transfers balance (% of GDP)
As shown in figure 3, the data due to 2005 indicate that the running transfers towards other sectors represent 4,53% from GDP (gross domestic product). We consider that the potential causes of this evolution are: on the one side, the increase of the funds sent in the favor of the residents in foreign countries, and on the other side, the methodology recently approved by NBR which imposed the revision of the estimation coefficient of the funds transferred from abroad in the favor of the residents through unofficial means, generating an important increase of the percentage of those funds in the total of running transfers towards other sectors.
% of GDP
% of GDP
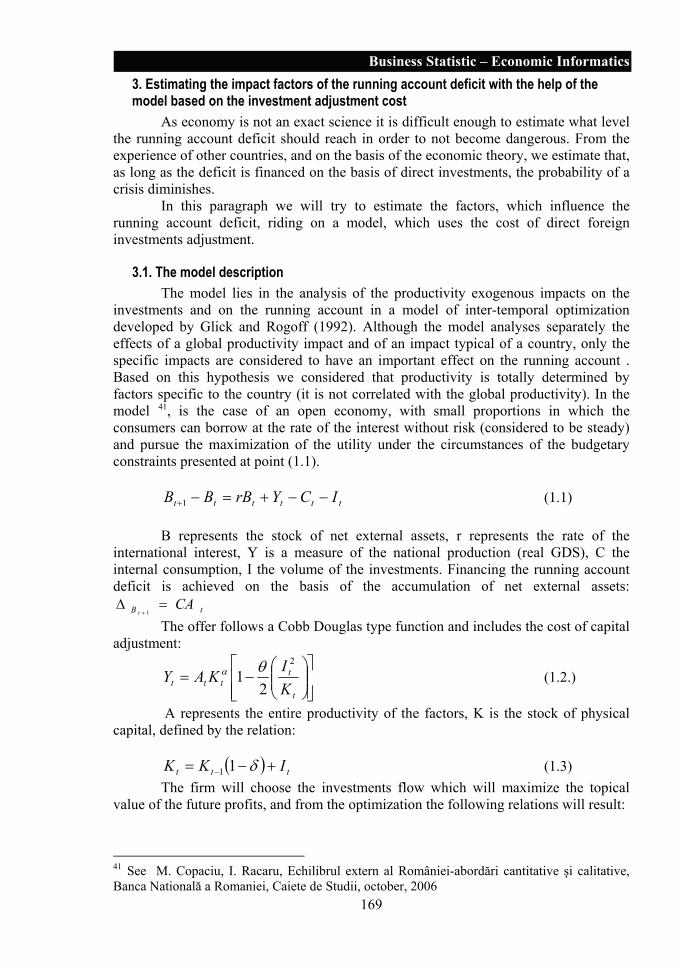
169
Business Statistic – Economic Informatics 3. Estimating the impact factors of the running account deficit with the help of the model based on the investment adjustment cost
As economy is not an exact science it is difficult enough to estimate what level the running account deficit should reach in order to not become dangerous. From the experience of other countries, and on the basis of the economic theory, we estimate that, as long as the deficit is financed on the basis of direct investments, the probability of a crisis diminishes.
In this paragraph we will try to estimate the factors, which influence the running account deficit, riding on a model, which uses the cost of direct foreign investments adjustment.
3.1. The model description The model lies in the analysis of the productivity exogenous impacts on the
investments and on the running account in a model of inter-temporal optimization developed by Glick and Rogoff (1992). Although the model analyses separately the effects of a global productivity impact and of an impact typical of a country, only the specific impacts are considered to have an important effect on the running account . Based on this hypothesis we considered that productivity is totally determined by factors specific to the country (it is not correlated with the global productivity). In the model 41, is the case of an open economy, with small proportions in which the consumers can borrow at the rate of the interest without risk (considered to be steady) and pursue the maximization of the utility under the circumstances of the budgetary constraints presented at point (1.1).
tttttt ICYrBBB −−+=−+1 (1.1)
B represents the stock of net external assets, r represents the rate of the
international interest, Y is a measure of the national production (real GDS), C the internal consumption, I the volume of the investments. Financing the running account deficit is achieved on the basis of the accumulation of net external assets:
tB CAt
=Δ+ 1
The offer follows a Cobb Douglas type function and includes the cost of capital
adjustment:
⎥⎥⎦
⎤
⎢⎢⎣
⎡⎟⎟⎠
⎞⎜⎜⎝
⎛−=
t
tttt K
IKAY
2
21 θα (1.2.)
A represents the entire productivity of the factors, K is the stock of physical capital, defined by the relation:
( ) ttt IKK +−= − δ11 (1.3)
The firm will choose the investments flow which will maximize the topical value of the future profits, and from the optimization the following relations will result:
41 See M. Copaciu, I. Racaru, Echilibrul extern al României-abordări cantitative şi calitative, Banca Natională a Romaniei, Caiete de Studii, october, 2006
170
Revista Tinerilor Economişti
( )∑∞
=−+− +≅
11
511
sstttt AEII ληβ (1.4.)
Where 0,10 1 ><< ηβ şi 10 << λ and
tAtKtIt AKIY ααα ++= (1.5.) Where 01 ⟨α because of the cost of capital stock adjustment. Productivity will follow a self-aggressive type process:
ttt AA ερ += −1 , with 10 ≤≤ ρ (1.6) Under the circumstances of a permanent productivity impact, using relation
1.4., the investments become : ( ) ttt AII Δ+−=Δ − 211 1 ββ (1.7)
Where 011 <−β şi ( )[ ] 01/2 >−= λληβ ; The coefficients marks result from the hypotheses regarding the investment
flow. By deriving the equations of consumption and of the unit product in accordance with the factors productivity and replacing in relation 1.1. we obtain the relation for the running account deficit:
1211 −− +Δ+=Δ tttt rCAAICA γγ (1.8) Where
( )( ) 01111 >+−−≅ KI ααβγ and( )( )[ ] ( ) 01/11 1122 <−+−−−≅ βαβαβγ rKI
3.2. Results By the model definition it is expected that a permanent impact of the
productivity specific to a country to have greater effect on the running account deficit than on the investments as a result of time difference necessary to the adjustment of capital, as well as of the modification of expectations regarding the increase of the permanent income relative to the current level (the savings decrease, the consumption increases).
Nevertheless this model confirms the sustenance of the present running account deficit, but the performance level of the model is rather low.
4. Conclusions The elements of the running account balance have different influences on the
balance: if at the level of current transfers balance the impact is favorable in medium term (in view of the increasing profitable influence of the Romanian workers’ transfers abroad), the income balance has a relative neutral impact.
The negative effect induced mainly by the adaptation of the methodology to the international standards and the inclusion of the re-invested profit, is compensated by the positive effects that the reinvestment of those profits have on the national economy. The negative impact comes from the commercial balance, its structure has elements with mainly negative influence, but the currency risk and the exchange rate are diminished by the big proportion of the commercial exchanges of groups of products.
Seen as a difference between the gross unit savings and investments, the running account is positively influenced by the private investments, which are

171
Business Statistic – Economic Informatics necessary within the context of reorganizing the real sector and the convergence process. This conclusion is valid if the ex ante decisions of making those investments are optimum ex post, fact which seems to be sustained by important indicators at the level of the financial system.
REFERENCES 1. Copaciu, M
Racaru, I Echilibrul extern al Romaniei, abordari calitative si cantitative, BNR, Caiete de studii, nr.18, octombrie, 2006
2. Glick, R Rogoff, K.
Global versus country specific productivity shocks and the current account, NBER Working Paper nr. 4140, 1992
3. Gosh, A.R. Ostry, J.D
The Current Account in the Developing Countries: A Perspective from the Consumption Smoothing Approach, The World Bank Economic Review, Vol. 9, 1995
4. Halpern, L. Wyplosz, C.
Economic Transformation and Real Exchange Rates in the 2000s: The Balassa-Samuelson Connection, UNECE 2001/1 Chapter 6
5. Milesi-Ferrretti M., Razin
Sustainability of Persistent Current Account Deficits, NBER Working Paper, nr. 5467, 1996
6. Wooldridge, J.M
Econometric Analysis of Cross Section and Panel Data, MIT Press, 2001
7. Zanghieri, P Current Account Dynamics in new EU members: Sustainability and Policy Issues, CEPII Working Paper, 2004

172
Revista Tinerilor Economişti Instructions for the authors
The authors which intend to publish their papers in the magazine should respect the following requests:
The language of the article and abstract
For the articles: English For abstract: English
File format Word document (Microsoft Word XP or better) Page format B5, (see the below template)
Important! Use the styles included in the bellow template for each elements of the article. Title RTE Title Authors RTE Authors Abstract RTE Abstract Keywords RTE Keywords Text, Subtitles, Figures and Tables
RTE Text , RTE Subtitle, RTE Figures and Tables
Article Structure and formating
References RTE References Number of pages minimum 4, maximum 12, even number
Article template For download the template, see the journal’s website, Instructions for the authors section.
Sending the article The sending of article for acceptance and publishing will be made to the web address: [email protected]
Deadlines Ussualy for the April issue the deadline for sending the full articles is February, 25th and for the November issue the deadline for sending the full articles is September, 25th.
For other informations or for accessing the contents of each issue of the journal go to the following website:
http://stat257.central.ucv.ro/rte

ISSN 1583-9982