~n sc~iool feeding programs - defense … selective plate waste was the method chosen because it...
TRANSCRIPT

J
NATICK/TR·f.li/011 -PlATE WASTE
~N SC~iOOL FEEDING PROGRAMS:
AN INTERAGENCY PROJECT I
. -fOR I .
OFFICE OF POLICY, PLANNING AND EVAlUATION •
FOOD AND NUTRITION SERVICE ' U.S. DEPARTMENT OF AGRICULTURE (USDA) · I J
Elizabeth M. Comstock •
Lawrence E. Symington . '
HHary E. Chmi21inski •
Judith S. McGuire I
December 1979
I Food Sciences taborz;tnrv
R 1 4~ '1 {) () l {·:t~,

•'
Approved for public release; distribution tmlimited.
Citation uf trade n~eo 1n this report does not constitute an official indorsement or approval of the use of such items.
Destroy thia report when no longer needed. Do not return it tc the originator •
• •
' .

UNCLASSIFIEDSECURITY CLASSIFICATION OF THIS PAGE (r"an Data Entered)
REPORT DOCUMENTATION PAGE READ INSTRUCTIONSBEFORE CO!PLETING FORM
1. REPORT NUMBER 12. GOVT ACCESSION NO 3. RECIPIENT'S CATALOG NUMBERI ' NAITICK/TR.,,81/011 2 _I- q'
- TITLE (CKd / 8b/Qthy "5. TYPE OF REPORT & PERIOD COVERED
NDIVI AL AND-AGGREGATTE MEASURES,
S~ e-"PABRFORMtNO Otte. RPOWT NUMBER
7. AUTHOR(s) 8 . CONTRACT OR GRANT NUMBER(e)
Elizabeth M.jComstock Lawrence E. ymington,-Hilary E.1ChmielinskilftJudith S./tcGuire
S. PERFORMIN., ORGANIZATION NAME AND ADDRESS IO. PROGRAM ELEMENT. PROJECT. TASKAREA & WORK UNIT NUMBERS
Food Sciences Laboratory 6.2 USDA ReimbursableUS Army Natick Research & Development Command AgreementNatick, MA 01760 #FNS 58-3198-9-30
IT, CONTROLLING OFFICE NAME AND ADDRESS " 12 REPORT DATE
US Army Natick Research & Development Command Dec01ilA#79 /ATTN: DRDNA-YBH '- 9 NUMEROP RA4ES
Natick, MA 01760 101 /14. MONITORING AGENCY NAME & ADDRESS(If different from Controlling Office) 15. SECURITY CLASS. (of this repon4 ..
UnclassifiedIS.. DECLASSIFICATION/DOWK 5RADING
SCHEDULE
16. DISTRIBUTION STATEMENT (of thie Report)
Approved fur public release; distribution unlimited.
1?. DISTRIBUTION STATEMENT (of the abetrct enlered In Block 20, I dilfferent from Report)
I4. SUPPLEMENTARY NOTES
19 KEY WORDS (Continue on reorea side it neceessay and Identify by block number)
AGGREGATE SELECTIVE FOOD WASTE SCHOOL BREAKFAST PROGRAPLATE WASTE INDIVIDUAL PLATE WASTE SCHOOL FEEDING
FOOD NATIONAL SCHOOL LUNCH WASTEFOOD CONSUMPTION PROGRAM WASTE MEASUREMENTFOOD HABITS PLATE WASTE METHODS
2*YRACT r(C.e.we am reverse r N nneweav and #dsely by block nuumber)
Methods of measuring plate waste were reviewed and evaluated in order to select, pretest,and develop the method best suited to an economic analysis of waste in school feeding programs.Aggregate selective plate waste was the method chosen because it appeared to be fast, accurate,ind easy to learn. Six other methods considered all had serious drawbacks. Aggregate selectiver'I,'e waste measurement involves collecting trays from all, or a sample, of the students ini lunchroom and separately scraping the waste from each food item. Waste is accumulatedacross students before being weighed at the end of the meal. During development and pretesting.- -'
DO An 1473 Eooo' 9mOV*fIS0OLETE UNCLASSIFIED J.1 . . %.
SECUIVTY CLASNIFICATION OF TNIS PAGE (Wanlelmte 4Ired)

UNCLASSIFIEDSECURITY CLASSIFICATION OF THIS PAGEZWhmn Date Entered)
20. Abstract (cont'd)
ft was determined that aggregate selective plate waste can be collected from approximately300 students during typical lunchroom operation. In lunchrooms serving more than 300students, a sample of 300 students was found to provide acceptably accurate measures of wastefor most food items. Recommendations were developed for staff, equipment, samplingprocedures, and scraping procedures.
UNCLASSIFIEuSECURITY CLASSIFICATION OF THIS PAGE(When Date Enterod)

EXECUTIVE SUMMARY
The objectives of the research presented in this report were to review and evaluate methodsof measuring food waste in institutional feeding systems, to select the method best suited toa national economic study of waste in the National School Lunch Program and the SchoolBreakfast Program, and to pretest and modify the method to make it as accurate and efficientas possible.
The method was chosen to be appropriate for data collected on an institutional level,and flexible enough for use with different serving systems, menu items, school sizes, and agegroups. In addition, the method should be reliable and valid, and should minimize cost andtime requirements. Of the seven methods reviewed in Chapter 2, four were found to be clearlyunsuitable. Aggregate nonselective plate waste does not provide enough information aboutspecific food items wasted. Garbage analysis involves allowing tray waste to become mixedin the garbage containers, necessitating the time-consuming procedure of separating the foodsagain. Food preference questionnaires were found to be of questionable reliability and validityas measures of waste. Self-estimation is subject to large student error and bias.
Three methods - individual plate waste, aggregate selective plate waste, and visualestimation - were all considered applicable within the range of serving systems, kinds of menus,waste disposal systems, and school sizes described in Chapter 3. Aggregate selective plate wastewas the method chosen, because it appeared to provide the necessary information on amountof waste, and was fast, accurate, and easy to learn. The other methods had serious drawbacks.Individual plate waste, while it would provide more detailed information, was judged to betoo time-consuming. Comparisons of time, included in Chapters 4 and 5, show individualplate waste to require between two and three times longer than aggregate selective plate waste.Visual estimation was judged to be inadequately tested as a method, to be of questionableaccuracy, to require more time for training researchers, and to require no less time at eachschool than the other methods.
Aggregate selective plate waste measurement involves collecting trays from all, or a sample,of the students in a lunchroom and separately scraping the waste from each food item. Wasteis accumulated across students before being weighed at the end of the meal. Developmentand pretestinj of this method centered on three methodological issues: First, how many traysneed to be scraped to obtain an acceptably accurate estimate of total waste for each fooditem? Second, how much time is required for aggregate selective plate waste measurement?Third, what procedures are the most efficient?
Although the best measure of aggregate selective plate waste will be obtained by scrapingall trays in a lunchroom, this procedure is not always practical, particularly in large schoolsand when time is limited. When not all trays can be scraped, the number of trays requiredin the sample depends on two major factors: the first factor is the degree of accuracy desired;larger samples yield more accurate estimates. For purposes of this, the accuracy criterion wasa relative standard error of the mean (or total) equal to 0.10 or less. The second influenceon required sample size is the variability of the waste of a food item from tray to tray. Thegreater the variability, the more trays must be sampled to reach the accuracy criterion. Since
*1#

no measures of the variability of plate waste were found in the literature, variability wasmeasured for a total of 432 food items in two summer feeding programs (see Chapter 4) andtwo regular school lunch programs (see Chapter 5). The type of lunch service ranged fromno-choice, prepackaged lunches to self-serve lunches with numerous menu choices. In general,variability of waste was very high, and,therefore, desirable ample sizes were large for mostfood ivems.
Based on the variability data, it is recommended that, in lunchrooms with fewer than300 meals served, all trays be scraped for aggregate selective plate waste. In lunchrooms withmore than 300 meals served, it is recommended that trays be sampled to obtain a total ofapproximately 300 trays. A sample size of 300 allows the accuracy criterion to be met inmost situations for most food items. For example, if a population size of 500 is assumed,sampling 300 trays allows the accuracy criterion to be met for 38 of 62 food items. Ofthe remaining food items, relative standard errors never exceeded 0.28 and were more typicallycloser to the desired 0.10. Errors in estimating waste will tend to be largest for foods wastedthe least, and thus, will contribute least to the cost of the waste.
Measurements of the time required for aggregate selective plate waste indicate that 300trays can be scraped in a reasonable amount of time. A team of two to four researcherscan scrape about 50 trays per person per hour. Weighing at the end of the meal requiresanother ten to fifteen minutes. Therefore, aggregate selective plate waste can easily be collectedfrom 300 students during the one and a half to two hours of typical lunchroom operation.Another 30 to 45 minutes for setup and cleanup activities brings the total time in a lunchroomto between two and three hours. By comparison, collection of individual plate waste requiresbetween two and three times longer.
The basic procedures recommended for collecting aggregate selective plate waste aredescribed in Chapter 6. Suggested staff, equipment, sampling procedures, and scrapingprocedures are all straightforward and fairly simple to employ. The following additionalrecommendations are made. Since the biggest problem logistically is the buildup of incomingtrays, it is recommended that ample table or rack space be available, and that one researcherdevote full attention to receiving and sampling incoming trays. Counting of trays scrapedshould not be done until these trays are returned to the dishroom after scraping is complete.Waste from milk and juice are consistently difficult to estimate accurately; therefore, researchersshould consider collecting all liquid waste, even when only a sample of waste from other foodsis collected. Finally, since every lunchroom operates differently, it is recommended thatresearchers visit the lunchroom to observe prior to the day on which data are to be collected.
2
PREFACE
The Behavioral Sciences Division (BSD) of the Food Sciences Laboratory (FSL), UnitedStates Army Natick Research and Development Command (NARADCOM) was requested toevaluate methods for measuring food consumption and waste in institutional feeding systemsby the Office of Policy. Planning, and Evaluation (OPPE), Food and Nutrition Service (FNS),United States Department of Agriculture (USDA). Funding for this effort was provided underAgreement Number FNS 58-3198-9-30.
The authors would like to acknowledge the contributions made toward this effort byindividuals bo'h ,utside and within BSD. The two individuals from OPPE, FNS, USDA whomonitored this effort, Dr. Sandra Huffman and Dr. Steven Gale, were extremely helpful tous. Our initial observations of schools were greatly facilitated by Mr. John Stalker andMiss Louise Watts of the Bureau of Nutrition Education and School Food Services,Massachusetts Department of Education, and by Dr. Lloyd Littlefield, Food and NutritionService, State of New Hampshire. There was a high level of cooperation extended by foodservice personnel in virtually every school visited. Particular appreciation is extended to thefollowing individuals: Kathryn Brophy, Kenneth Gebo, Maura Hennigan, Mary McGlaughlin,Elizabeth Murray, and Herbert Wallace.
Within BSD, several individuals contributed to the overall effort. Dr. Harry Jacobs, Chiefof the Division, was instrumental in the initial contact with USDA and provided the primaryshaping of the project scope. Gina Cosimini, Nancy Curran, and Joseph Hunn were integralmembers of the waste data collection team. Dr. Herbert Meiselman also assisted in datacollection, and he and Dr. William Wilkinson provided numerous thoughtful comments in theirreviews of the manuscript. Lorenz Digman provided statistical expertise for the analysis ofprobable sampling error. We also express our appreciation to Charlene Slamin and VeronicaO'Brien for their patience and expertise in producing the various drafts and final manuscript.
For
, 'ed 0r ::ti czlioln
D, tri ,:t to ...
3

TABLE OF CONTENTS
Page
EXECUTIVE SUMMARY 1
PREFACE 3
LIST OF FIGURES 7
LIST OF TABLES 8
CHAPTER 1 INTRODUCTION 11
CHAPTER 2 REVIEW OF LITERATURE ON PLATE WASTE 13MEASUREMENT
Direct Measures of Waste 13Indirect Measures of Waste 19Conclusion 27
CHAPTER 3 PRELIMINARY OBSERVATIONS OF SCHOOL LUNCH 29PROGRAMS
Description of Schools Visited 29Waste Measurement Problems 33
CHAPTER 4 PROPOSED METHOD - AGGREGATE SELECTIVE 41PLATE WASTE
Rationale 41Assessment of Individual Plate Waste Variability 41
Method 42Resu Its 44
Conclusion 59
CHAPTER 5 PRETESTS OF THE AGGREGATE SELECTIVE PLATE 63WASTE METHOD
School Lunch Programs and Pretesting Methods 63Aggregate Selective Plate Waste Results 69Individual Plate Waste Variability 73Conclusion 75
CHAPTER 6 RECOMMENDED PROCEDURES FOR MEASURING 77AGGREGATE SELECTIVEPLATE WASTE
Staff 77Equipment 78Sampling Procedures 79Scraping and Weighing Procedures 82Additional Implementation Recommendations 85
5
Ft~A 4h bK.O~Fi~h

TABLE OF CONTENTS (cont'd)
Page
REFERENCES 87
BIBLIOGRAPHY 91
APPENDIX AMOUNTS OF WASTE IN FIVE SCHOOLS 97
6

LIST OF FIGURES
Page
Figure 1. Standard Error of Mean Waste for Two Foods for Four 57Population Sizes (N) and Six Sample Sizes
Figure 2. Sample Form for Recording Aggregate Selective Plate Waste 80Data
7

LIST OF TABLES
Page
Table 1. Characteristics of SchouI Lunch Programs Sampled 30
Table 2. Number of Schools with Each Number of Locations for Serving, 29Eating, and Waste
Table 3. Number of Trays Sampled for Weighing on Each Day at Each 44Site
Table 4. Description of Food Items for which Individual Waste 46Measurements Were Made
Table 5. Means and Variances of Individual Plate Waste and Sample Sizes 48Required for Standard Errors to be Within 10% of the Mean
Table 6. Approximate Percent Waste of Food Items at Site A and 51Sample Sizes Required for the Standard Errors to be Within10% of the Mean in a Population of 500
Table 7. Standard Errors of the Mean Expressed in Grams for Three 53Population Sizes (N) and Two Sample Sizes
Table 8. Standard Errors of the Mean Expressed as Proportions of the 55Mean for Three Population Sizes (N) and Two Sample Sizes
Table 9. Number of Foods and Relative Standard Errors for Three 58Population Sizes and Two Sample Sizes
Table 10. Estimated Cost in Dollars of Total Waste and Standard Error 60of the Total for Three Population Sizes and Two Sample Sizes
Table 11. Times Required to Collect Aggregate Selective Plate Waste 62
Table 12. Characteristics of School Lunch Programs Used in Pretesting 64
Table 13. Time Requirements of Aggregate Selective Plate Waste 70Collection During Pretesting
Table 14. Comparison of Two Samples of Aggregate Selective Plate Waste 72at School 4
8

LIST OF TABLES (cont'd)
Page
Table 15. Means and Variances of Individual Plate Waste, Required 74Sample Sizes, and Standard Errors for Food Items at School 1and School 3
Table 16. Characteristics of Food Waste in Lunchroom Populations 76of 500
Table 17. Recommended Sampling Ratios for Different Lunchroom Sizes 81
9

PLATE WASTE IN SCHOOL FEEDING PROGRAMS:
INDIVIDUAL AND AGGREGATE MEASURES
CHAPTER 1
INTRODUCTION
The Behavioral Sciences Division (BSD) of the Food Sciences Laboratory (FSL), UnitedStates Army Natick Research and Development Command (NARADCOM) was requested bythe Office of Policy, Planning, and Evaluation (OPPE), Food and Nutrition Service (FNS),United States Department of Agriculture (USDA) to evaluate methods for measuring foodconsumption and waste in institutional feeding systems. Specifically, the objectives of thiseffort were to evaluate currently available direct and indirect methods of measuring food wasteapplicable to food items in institutional feeding systems; to select the best available food wastemeasurement method(s) applicable to a large scale food program evaluation; and to pretestand modify the method(s) to apply to a large scale economic study of the national schoollunch and breakfast programs. Two additional objectives of this work effirt - the generationof a literature review concerning food consumption measures, and the design of a protocolfor a methodological study to evaluate and modify methods for further use in evaluating thenutritional impact of school lunch and breakfast programs on the consumer - are beingaddressed outside of this report.
The report is organized in a rough approximation to the time sequence actually followedin the research effort. The initial task was an extensive review of the literature dealing withplate waste measurement; that review is presented in the next section of the report. Aconcurrent undertaking involved preliminary observations of various school lunch programs inorder to obtain a better understanding of such operations, particularly with respect to potentialwaste measurement problems. These observations are detailed in Chapter 3.
The next section of the report addresses the rationale for the proposed method, aggregateselective plate waste. This rationale is followed by discussion of the pretests of the aggregateselective plate waste method. The report concludes with recommended procedures for useof the proposed method.
'Ii

CHAPTER 2
REVIEW OF LITERATURE ON PLATE WASTE MEASUREMENT
As the initial task of the effort to select the best available measure of food waste applicableto a large scale economic study of the National School Lunch Program and the School BreakfastProgram, an extensive review of the literature was undertaken. The reference list and thebibliography contain a complete list of sources reviewed in the areas of food waste and foodconsumption in children, with particular application to the school lunch program. The discussionpresented here focuses on the methodological considerations involved in selecting amongmeasures of plate waste. Food consumption measures will be reviewed elsewhere. For dataon specific factors which influence amounts of waste in the school lunch program, see Altschul's(1976)' review.
Plate waste measures can be divided into two broad categories - direct measures andindirect measures. Direct measures include weighing the waste of separate food items forindividual students or groups of students, weighing total unseparated waste, and separating andweighing waste from garbage containers. Indirect measures include measuring food preferenceor acceptability, visually estimating amounts of each menu item wasted, and asking studentsto report the amounts they wasted. In the review which follows, each of these measureswill be described and evaluated. The description will include procedures commonly employed,situations in which the measures are commonly applied, and some representative results.
Evaluation of plate waste measures will consider reliability and validity, range ofapplicability, and cost. Shortcomings of studies employing these methods will also be discussed;these include methods of sampling and other design problems. It is important to note thatmost studies of Plate waste are designed to characterize relative amounts of waste that occurfor different menu items or to test hypotheses about factors which influence amounts of platewaste. They were not designed to evaluate the measures. Therefore, data on which to basean evaluation are often incomplete.
DIRECT MEASURES OF WASTE
Individual plate waste
Individual plate waste is measured by weighing the leftovers from the separate food itemson the trays of individual students. Initial serving size is also measured when waste is tobe expressed as a proportion of food served or when amount of food consumed is of interest.Often only a sample of trays is weighed and used to estimate average waste per student.
Individual plate waste is the criterion against which other estimates and indirect measuresof waste have traditionally been compared. It might be noted here that many investigatorshave also attempted to use individual plate waste to calculate individual consumption (e.g.,
IAltschul, A.M. Studies in school lunch waste - A literature review and evaluation. USDA/FNSContract 557-FNS--76, 1976.
13

Harper & Jansen, 1973;2 Jansen & Harper, 1978:3 Head & Weeks, 1977(b) 4 ). This procedure
is not necessarily accurate, especially where there is much trading and spillage among students,
and where there are large variations in serving si;e.
A common design for individual plate waste studies involves indicating the student's food
choices on a card as he goes through the cashier's station, leaving the lower portion of the
card on the tray, and recording the weight of the leftovers on the back of the card as the
waste is being disposed of (e.g., Jansen & Harper, 1978;s Meredith, et al., 1951;6 Head &
Weeks, 1975"). If the mean serving size of each food is desired, it is usually estimated from
the mean of four or five servings.
Numerous factors have been found to influence the amount of individual plate waste in
school lunches. For example, younger students were reported to waste more than older ones
(Augustine, et al; 1950;8 Hunt, et al; 1958;9 Mirone & Harvey, 1954;1 0 Patton, et al; 1958' ' )
'Harper, J.M. and G.R. Jansen. Phase II Report; Comparison of Type A and NSM menus
in the National School Lunch Program. USDA/FNS Contract 12-35-600-85, 1973.
'Jansen, G.R. and J.M. Harper. Consumption and plate waste of menu items served in the
National School Lunch Program. Journal of the American Dietetic Association, 1978, 73,395-400.
4 Head, M.K. and R.J. Weeks. Conventional vs. formulated foods in school lunches. II. Costof food served, eaten and wasted. Journal of the American Dietetic Association, 1977b, 71,629-632.
'See footnote 3.
6 Meredith, A., A. Matthews, M. Zickefoose, E. Weagley, M. Wayave and E.G. Brown. Howwell do school children recall what they have eaten? Journal of the American DieteticAssociation, 1951, 27, 749--751.
"Head, M.K. and R.J. Weeks. Major nutrients in the Type A lunch. II. Amounts consumedby students. Journal of the American Dietetic Association, 1975, 67, 356-360.
'Augustine, G., M.McKinley, S.L. Laughlin, E.L. James and E. Eppright. Nutritional adequacy,
cost and acceptability of lunches in an Iowa school lunch program. Journal of the AmericanDietetic Association, 1950, 26, 654--662.9 Hunt, F.E., M.B. Patton and A.F. Carver. Plate waste in a school lunch Ill. Vegetable
acceptance study. Journal of the American Dietetic Association, 1958, 34, 810-813.
'Mirone, L. and L.G. Harvey. A new menu pattern is tested. Journal of the American
Dietetic Association, 1954, 30, 757-761.
' 'Patton, M.B., A.F. Carver and F.E. Hunt. Plate waste in a school lunch. II. Sources ofwaste. Journal of the American Dietetic Association, 1958, 34, 733-737.
14
and girls to waste more than boys (USDA/FNS, 1978(a);' 2 USDA/FNS, 1978(b)1 3). Familystyle service in schools was reported to produce less waste than cafeteria style (Brine, 1956),'4but bulk serving apparently generated less waste than preportioned lunches (USDA/FNS,1976).' 5 A la carte choice produced as much waste as the Type A lunch in one study (Sandoand Patton, 1956),' " but free choice generated less wuste than "offered vs. served" or preplatedlunches in another (USDA/FNS, 1978(b)).'
Vegetable acceptance is another area in which individual plate waste has been measured(Ireton & Guthrie, 1972;"8 Hunt, et al; 1958; 1 9 Patton, et al; 1958;20 Sando & Patton,195 12'). These studies have focused specifically on ways to decrease waste from vegetableswhich generally is the food group most wasted in school lunch programs.
S2 USDA/FNS. Food consumption in the National School Lunch Program. 1978a.
'3 USDA/FNS. Pilot study to compare Type A lunches with alternative subsidized lunchesamong high school students. Contract No. 12-35-600-351, 1978b.
4 Brine, C.L. and E.B. Tate. Effect of food losses on nutritive content of diets in fourinstitutions. Journal of the American Dietetic Association, 1956, 32, 19-23.
' USDA/FNS. Pilot study to assess, audit, and evaluate food delivery systems used in schoolfood service. Contract No. 12-35-600-183, 1976.
'6 Sando, L.G. and M.B. Patton. Lunch programs in Ohio Public Schools. Journal of the
American Dietetic Association, 1951, 27, 285-288.
7 See footnote 13.
Ireton, C.L. and H.A. Guthrie. Modification of vegetable-eating behavior in preschoolchildren. Journal of Nutrition Education, 1972, 4, 100-103.
"See footnote 9.
2"See footnote 11.
2 See footnote 16.
15
Individual plate waste has not been specifically tested for validity, probably because thereappears to be no more accurate method. Since food separation and individual weighings aretime-consuming, a sample of trays is often used to estimate both initial serving size and theamount of waste. More trays are typically sampled to estimate waste than to estimate servingsize, but no data on the variability of either waste or serving size were found in the literature.Therefore, it is not possible to know the degree of accuracy obtained with the sample sizesused in individual plate waste studies. Preliminary weighings done by the NARADCOM researchteam showed very large variability in both serving size and waste, suggesting that estimatesbased on small sample sizes should be treated with caution.
Sampling procedures should also ensure that the trays weighed are representative of thepopulations to which inferences are to be drawn. In particular, the findings on factors whichinfluence plate waste suggest that sampling within schools should be representative of age andsex ratios and menus of differing popularity. Among schools, sampling must take into accountvarious serving and preparation methods.
A second difficulty with the individual plate waste measure is that it requires a fairlymajor intervention in cafeteria procedures. Students given tray cards are usually aware thattheir plate waste will be measured, and so may alter their eating behavior.
Finally, the individual plate waste measure is time-consuming (and, therefore, costly)relative to other methods. For this reason, individual plate waste has been eliminated by USDAfrom the methodological options for the future studies toward which this review is directed.
Aggregate selective plate waste
Waste separated by food item and accumulated from several people before weighing iscalled "aggregate selective plate waste". Aggregate waste is easier and quicker to weigh thanthe leftovers from individual plates, but it cannot provide data on variability in waste orconsumptior within or between individuals. Usually a fixed proportion of the students' traysis sampled ind assumed to provide an unbiased estimate of group plate waste. Mean aggregateplate waste will equal mean individual plate waste, as long as the samples are representative.
Aggregate selective plate waste methods have most frequently been applied when studentshave no choice among the menu items being measured. For example, Robinson (1978)2 '
collected multiple samples of milk cartons (20 per sample) returned during lunch periods ofschools with and without the special milk program and found that the program did notcontribute to milk waste at lunch. However, in schools where more children were eligiblefor free milk, higher milk waste was rioted.
2 - Robinson, J.S. Special milk program evaluation and National School Lunch Program survey.
USDA/FNS: 1978, 52-57.
16

Bell and Lamb (19/3)- 'measured milk aiid vegetable waste to test the effect of nutritioieducation on consumption of those items. The plate waste of the nutrition education classwas weighed as a whole, both before and after a specific education program. Milk consumptiondid not change relative to pre-nutiition education levels, but vegetable consumption increased.There are at least two methodological problems with this study. First, milk waste may nothave increased because it was already a highly consumed food item. Second, since studentsweighed their own waste, they may have been biased in their eating when measurements weretaken.
Head and Weeks (1977(b)) 2 4 used aggregate selective plate waste to determine the effectof formulated foods on consumption of elementary school students. Some menus usedformulated foods in which nutrient-dense components were substituted for, or added to,traditional foods. Aggregating waste of 70 students in each age group (grades 1 - 3 and4 - 6) in five schools over two test periods of 20 menus each, Head and Weeks found thatserving formulated foods increased consumption as a proportion of serving size. They alsofound that rural children (two schools) consistently consumed more than urban children (twoschools).
Martin (1971) 2 used aggregate waste to test whether elementary and junior high schoolstudents preferred hot lunches to cold lunches of equal preference ratings. The proportionof the serving that was wasted (not the absolute amount of waste) was higher in the coldlunch than the hot lunch. Elementary school students consistently wasted more than juniorhigh school students. The preference-matching methodology is of questionable value incomparing plate waste since other factors enter into consumption (e.g., method of preparation,environmental temperature, amount of inedible waste).
When not all students receive the same foods, sampling procedures take on a particularlyimportant role. More trays must be weighed to obtain a given degree of accuracy in themean plate waste for each food item. One study (Head and Weeks, 1975)26 handled a situationwith many food choices by distributing food acceptability cards as the children selected theirlunches, asking them to evaluate those items consumed and to return the form with the trayat the time of waste disposal. Assuming that the students did not evaluate foods they didnot eat (perhaps a naive assumption and not validated at any rate), the investigators used thenumber of times a food item was evaluated as the number of servings from which aggregatewaste had been collected. The results were e',pressed in terms of waste of specific food itemsper individual served.
-' 'Bell, C.G. and M.W. Lamb. Nutrition education and dietary behavior of fifth graders. Journalof Nutrition Education, 1973, 5, 196--199.
2 4 See footnote 4.
" Martin, K.M. Nutritional adequacy, preference, acceptability, and food production aspects
of hot and cold school lunches. Ph.D. Thesis, Pennsylvania State University, 1971.
2 "See footnote 1.
17

The validity of aggregate selective plate waste measurement depends on the same factorsof size and representativeness of samples which were discussed for individual plate waste. Anadditional caution occurs with aggregated waste, however. When individual plate waste dataare collected, variability in amount of individual waste for each food item can be calculated;from these data an estimate of the accuracy of the mean can also be calculated. When platewaste is aggregated, no data on individual variability are obtained, and therefore the accuracyof the estimated mean waste is not known.
Aggregate selective plate waste measurement should take less time than individual platewaste measurement; however, the amount of time saved is not known, since no data werefound on the relative requirements of the two methods. Also, aggregate selective plate wastemeasurement should require little disruption of normal cafeteria routines, especially when itis not necessary to know what each student was served.
Aggregate nonselective plate waste
Aggregate nonselective plate waste is overall edible waste left over on the plate, notseparated by food item or individual. In some applications, milk is collected separately fromother food items. Nonselective waste measurement provides a gross estimate of food lossesbut does not yield quantitative information on specific food items consumed or wasted.
Nonselective plate waste was used successfully by Carver and Patton (1958)2 7 to monitorgeneral food acceptance in school lunches. The results agreed with findings mentioned abovethat younger students wasted more than older students. Similarly, Hageman (1945 (a) and())2M ,2 used the method with hospital patients to determine whether menu choice affectedgross waste of food. She found that clinic patients without any choice ate less than privatepatients (always with choice) who, in turn, ate less than clinic patients who were given a choiceof menus.
It is possible to measure the nutrient composition of nonselective plate waste byhomogenizing and chemically analyzing the food waste. For example, Guthrie (1977)30 usednutrient analysis of gross waste (with milk waste separated) to study the effect of the chocolatemilk option on food waste and consumption. Food waste increased and milk waste decreased
2 Carver, A.F. and M.B. Patton. Plate waste in a school lunch, I. Overall waste. Journalof the American Dietetic Association, 1958, 34, 615-618.
2" Haqeman, M.I. A study of plate waste as a directive measure in food conservation: Part I.
Journal of the American Dietetic Association, 1945, (a) 21, 608-610.
2' Hageman, M.I. A study of plate waste as a directive measure in food conservation: Part I1.Journal of the American Dietetic Association, 1945, (b) 21, 685-689.
"'Guthrie, H.A. Effect of a flavored milk option in a school lunch program. Journal ofthe American Dietetic Association, 1977, 71, 25-30.
18
when chocolate milk was offered to the students. On the basis of food preparation costs,
she concluded that since milk waste cost less than food waste, chocolate milk was not a desirable
option for the lunch program.
Aggregate nonselective plate waste is not useful for the purposes of an economic study
of waste. The biggest difficulty is that it does not give the essential information on actual
foods which were wasted. Even with nutrient analysis, a time-consuming and expensive
procedure, there is no tested method for inferring foods from which those nutrients came
or the cost of the waste.
Garbage Analysis
Another direct estimate of food waste is garbage separation and analysis. Rathle
and Harrison (Rathje and Harrison, 1978; 3 1 Harrison, et al., 197532) were the pioneers in
the field and have produced the principal studies to date. They took garbage containers from
the street, manually separated food from trash, and estimated food inputs from labels on
packages. Consumption was calculated as food input minus observed waste.
The major advantage of this method is that it is unobtrusive - none of the subjects knewhis garbage was being analyzed. It is time-consuming, however, and inaccurate. Researchersmust depend on correction factors for food that is used without its evidence reaching thegarbage can (unlabelled, unweighed, and unpriced food; vegetable garden harvests; anddisappearance through garbage disposals, pets, and compost heaps). Validity has not beenmeasured.
In the school lunch program, total garbage analysis seems unnecessary given that the wastecan be collected and separated before it becomes mixed in the garbage can. The small intrusionin the cafeteria environment can save many hours of trash separation that may entail largeerrors.
INDIRECT MEASURES OF WASTE
Food preference
For the purposes of this review, "food preference" is defined as an individual's opinionof a food in general, independent of such factors as alternative choices, quality of preparation,etc. "Food choice" is a measure uf what an individual actually selects to be put on his orher plate. "Food acceptability" is considered to be the specific reaction to a food as prepared,
' Rathje, W.L. and G.G. Harrison. Monitoring trends in food utilization: application of an
archeological method. Federation Proceedings, 1978, 37(1), 50-54.
32 Harrison, G.G., W.L. Rathje and W.W. Hughes. Food waste behavior in an urban population.
Journal of Nutrition Education, 1975, 7(1), 13-16.
19
served, and eaten. "Food consumption" is a measure of the amount actually ingested. Thesefour concepts are generally related, but not necessarily highly correlated in all instances. Forexample, a food could have a high preference rating (be generally well liked) and not be chosenfor d givoo meal because of an attractive alternative. It could also be chosen, then giveiia low acceptability rating because it was poorly prepared. Given all this, the actual amountconsumed could also vary widely as a function of how hungry the individuel is, when morefood will be available, etc.
Preference can be measured by verbal ratings, nonverbal ratings, estimates of the frequencyof desired consumption, and semantic differentials (Ellis, 1968). ' In studies of children inthe school lunch program, verbal hedonic scales such as the following have been most frequentlyused:
- "It's ok, I like it; It's a favorite; Never tasted it; Don't know what it is" on 4thto 6th and 9th grade children (Martin, 1971).1 4
- "Like very much" to "Dislike very much" (9-point scale) on 5th and 6th graders(O'Connor, 1975). 3 5
- "Very pleasant; Pleasant; Neutral; Unpleasant; Very unpleasant" on nursery schoolchildren (Lamb and Ling, 1946).36
- "Terrible; Bad; OK; Good; Great" on grades 5 and 10 (Harper and Jansen, 1973;37
Jansen, et al., 197538 ); 4th to 6th and 10th to 12th graders (Head, et al., 1977); 39
and 5th graders (USDA/FNS, 1975(a);4 ° USDA/FNS, 1975(c) 4 I).
3 Ellis, B.H. Preference testing methodology. Food Technology, 1968, 32 (May), 49-56.
14 See footnote 25.
11O'Connor, M.A. Preference maximized school lunch menu planning. M.S. Thesis, Un-versity of Massachusetts, 1975.
S"' Lamb, M.W. and B. Ling. An analysis of food consumption and preferences of nurseryschool children. Child Development, 1946, 17, 187-217.
-'See footnote 2.
-"Jansen, G.R., J.M. Harper, A.L. Frey, R.H. Crews, C.T. Shigetomi and J.B. Lough.Comparison of Type A and nutrient standard menus for school lunch. I1l. Nutritive contentof menus and acceptability. Journal of the American Dietetic Association, 1975, 66, 254-261.
"Head, M.K., F.G. Giesbrecht and G.N. Johnson. Food acceptability research: comparativeutility of three types of data from school children. Journal of Food Science, 1977, 42,246-251.
4" USDA/F NS. Comparison of Type A and Computer assisted nutrient standard menus. Date
County Public Schools. Contract No. 12-35-600-116, 1975(a).
' USDA/FNS. Comparison of Type A and Nutrier.t Standard Menus. Memphis City Schools.Contract No. 12-35-600-115, 1975 (c).
20

-"Like very much; Don't like; Have never tasted" on 4th graders (Hunt, et al.,1958).42
"Like; Accept; Refuse" on preschoolers (as determined by their mothers) (Bryanand Lowenberg, 1958). 4
- "Really good; Good; So-so; Bad; Really Bad" on 1st to 6th graders("Determining ...", 1976).14
- "Will not eat; Will not choose; Will eat occasionally; Will eat frequently; Other"on young college women (Young and LaFortune, 1957). 4
1
- "Like most; Like least of all; Have never tasted" on teenagers (Schorr, et al.,1972) .46
Nonverbal hedonic scales for the measurement of preferences have included rating foodson a 1 to 10 scale ("Food ...", 1978)4 and choosing which of a series of faces ranging fromhappy to sad best describes a food ("Determining ...", 1976;4 ' LaChance, 1976(a) 4 9 ).
4 2 See footnote 9.
4 "'Bryan, M.S. and M.E. Lowenberg. The father's influence on young children's foodpreferences. Journal of the American Dietetic Association, 1958, 34, 30-35.
44 Determining what's going down or out. School Foodservice Journal, 1976, 30 (Sept), 65-70.
41 Young, C.M. and T.D. LaFortune. Effect of food preferences on nutrient intake. Journalof the American Dietetic Association, 1957, 33, 98-103.
4 6 Schorr, B.C., D. Sanjur and E.C. Erickson. Teen-age food habits. Journal of the AmericanDietetic Association, 1972, 61(4), 415-420.
4 Food preference surveys help cut plate waste. School Foodservice Journal, 1978, 32(Sept). 21.
4 See footnote 44.
4 LaChance, r.A. Simple research techniques for school foodservice. Part I: Acceptancetesting. School Foodservice Journal, 1976 (a), 30 (Sept), 54-61.
21

To determine preferences, a hedonic scale questionnaire is typically administered to childrenin their classrooms. In studies linking preferences to school lunch waste or consumption, theform is filled out just prior to the lunch when waste is to be measured. Usually a teacheradministers the form and describes the foods listed. Food waste is collected after lunch andindividual plate waste is weighed. A regression equation is computed between the preferencerating and waste or consumption per 100 g. served (4 or 5 servings are used to compute mean
serving size).
There are several problems with using preference ratings to measure plate waste. Thefirst concerns reliability, that is, the capability of producing the same result twice from thesame test on the same population. Although hedonic scales have been found to be reliablein determining preferences of adult men (Peryam and Pilgrim, 1957;5 ° Jones, et al., 1955;"Waterman et al., 1974;52 Meiselman, et al., 1972;13 Smutz, et al., 19 7 4 S4), preference ratingsgiven by children have not been tested for reliability.
Children might be expected to produce unreliable preference ratings because theircomprehension of food names has been shown to be poor ("Food ... , 1978; 5 5 Meredith,
et al., 1951 "). Many children do not have a food vocabulary as wide as their actual experience.If a teacher explains what a food consists of or looks like, the children are quite likely tobe biased by the description. One investigator (Martin, 1971) s 7 tested elementary school
5 0 Peryam, D.R. and F. J. Pilgrim. Hedonic scale method of measuring food preferences. FoodTechnology, 1957, 11, 9-14 (following page 472).
'Jones, L.V., D.R. Peryam and L.L. Thurstone. Development of a scale for measuring soldiers'food preferences. Food Research, 1955, 20, 512-520.
"Waterman, D., H. Meiselman, T. Reed, L. Symington and L. Branch. Food Preferences of Air
Force enlisted personnel. NARAL)COM Technical Report 75-51-FSL, Natick, 1974.
"3 Meiselman, H.L., W. Van Home, B. Hazenzahl and T. Wehrly. The 1971 Fort Lewis FoodPreference Survey. NARADCOM Technical Report, TR-72-43-PR, 1971.
" 4 Smutz, E.R., H.L. Jacobs, D. Waterman rnd M. Caldwell. Small sample studies of food
habits: I. The relationship between food preference and food choice in naval enlisted personnelat the Naval Construction Battalion Center, Davisville, RI, NARADCOM, Natick, MA, 1974,Technical Report 75-52-FSL.
5 5 See footnote 47.
56See footnote 6.
5 7 See footnote 25.
2
22

children's familiarity with 33 food names by administering a pictorial and verbal matchingtest. Ninety-one percent of the foods were correctly identified by more than half of thestudents tested; more than 80% of the students identified 70% of the foods correctly. Inthe Junior High School, 12 food names were correctly identified by more than 85% of thestudents.
Evidence also shows that children may indicate ignorance about a food (vegetables inthis case) that they are known to have eaten. When school lunch menus are filled with foodnames such as "vegetable chow", "tri-taters", "corn dogs", "pronto pup", French dip sandwich"and "succotash", it is not difficult to see why children often think they are not familiar withthe foods listed.
A second problem with preference ratings is that if they are to be used as indirect measuresof plate waste, then they must be validated. In this instance, the important aspect of validationis accuracy. There are reasons in addition to unreliability to doubt the accuracy of preferenceratings as measures of plate waste.
When correlation coefficients have been computed between preference ratings andconsumption or waste measures in school children, results have been equivocal. Some studieshave failed to find a correlation (Hunt, et al., 1958).18 Other studies have reported goodcorrelations (Head, et al., 1977; 9 Jansen, et al., 1975;60 Harper and Jansen, 1973;6 ' Acredoloand Pick, 1975;62 USDA/FNS, 1975 (a) 63 and (c)" 4 ), but did not present sufficient evidenceto allow the reader to determine the error inherent in estimating consumption or waste fromfood preference data. Also, further research would be required to determine the variationin the relationship between preference ratings and waste over the different racial, socio-economic,geographic, and environmental conditions under which the method would most likely be used.
" 8See footnote 9.
'See footnote 39.
"0See footnote 38.
6 See footnote 2,
6"Acredolo, L.P. and H.L. Pick. Evaluation of a school lunch program. Psychological Reports,1975, 37, 331-332.
63See footnote 40.
1 4 See footnote 41.
23
,-

An extension of food preference measures is to include a time dimension by asking studentsto give their preferred frequencies of eating specific foods (Ellis, 1968).61 Sullins, et al., 197766and Meiselman, et al., 19716" used this method to determine food preferences in adult men.Schuh and colleagues (1967)"8 attempted to measure the accuracy of adult hospital patients'preferred frequencies by measuring plate waste when foods were served at desired frequenciesand more frequently, but failed to find a change in plate waste (estimated visually, but notvalidated).
O'Connor (1975)69 and colleagues at the University of Massachusetts have attempted todetermine a "preference-time function" - the abstinence period between occasions of eatinga food, according to its degree of preference. They attempted to determine this functionfor 5th and 6th graders on 60 menu items. A 7-point happy face scale was used to determinepreferences, and descriptions were used to simulate the time frame: "Pretend these foodsare in front of you; how would you rate them? Pretend these foods are in front of youbut you haven't eaten them since Christmas? How many times every 10 school days wouldyou enjoy eating these foods?" The preference-time function, unfortunately, was not relatedto plate waste in the school lunch program but certainly offers an innovative method of tailoringschool lunches to children's preferences.
In conclusion, studies of food preferences offer little support for using preference ratingsas measures of waste. In addition to problems of unreliability and inaccuracy, it is clear fromthe literature (Ellis, 1968;7o Pilgrim, 1961;'' Peryam and Pilgrim, 195772) that the terminology
SSee footnote 33.
"Sullins, W.R., L.E. Symington, J.R. Siebold and J.G. Rogers. Food preference, acceptance,and consumption in a simulated, isolated-duty station. Natick, MA, NARADCOM, 1977.Technical Report Natick/TR-78/027.
"7 See footnote 53.
6 8 Schuh, D.D., A.N. Moore and B.H. Tuthill. Measuring food acceptability by frequency ratings.Journal of the American Dietetic Association, 1967, 51, 340-343.
69 See footnote 35.
7"See footnote 33.
'Pilgrim, F.J. What foods do people accept or reject? Journal of the American DieteticAssociation, 1961, 38, 439-443.
2 See footnote 50.
24

used in the scales and the number of gradations require substantial pre-testing before beingput into use. Although time and personnel requirements for administering and scoring preferencequestionnaires have not been reported, these would not seem to be significantly less than withother methods. A high degree of intervention is required, since students must individuallycomplete the preference questionnaires.
Visual estimation
Visual estimation of plate waste is an appealing alternative to direct plate waste measuresbecause it is cleaner, may be less time consuming, and may require fewer personnel. It entailsevaluating the quantity of leftovers on a plate by sight, using a predesignated scale. In allstudies reviewed here, the visual estimation scales were based on portion of the original servingwhich remained as waste. For example:
- 0, nothing eaten; 1, one bite eaten; 2, more than one bite eaten; 3, whole portioneaten (Acredolo and Pick, 1975)1 3
- 0, none; 1, some; 2, all of the food eaten (What's ..... 1971) 7 4
- All; 3/4; 1/2; 1/4; none of the food remaining on the plate (LaChance, 1976(b))7
- 0; 1/2; 2/3; all food remaining on the plate (Chmielinski and White, 1978)6
The limited evidence available suggests that reliability of visual estimation measures canbe good. Interobserver reliability was measured in two studies; it was found to be 88 to93% by Acredolo and Pick (1975)17 and 90% by Chmielinski and White (1978).8 Test-retestscores were found by Chmielinski and White to vary from 8 to 26% for five specific foods.
"'See footnote 62.
"4 What's wrong with school lunch. School Lunch Journal, 1971, May 1971, 42-51.
I LaChance, P.A. Simple research techniques for school food service. Part II: Measuringplate waste. School Foodservice Journal, 1976b, 30 (Oct), 66-76.
7 "Chmielinski, H.E. and M.A. White. Plate Waste Index: An observational measure/schoolfood waste. Teachers College, Columbia University, 1978.
"7 See footnote 62.
7"See footnote 76.
25
The biggest problem with visual estimation as a measure of plate waste is that its validityhas not been established. Chmielinski and White conducted the only study to date whichmeasured validity. The authors used a nonparametric method to compare visual estimates withthe actual weights of the food waste. Agreement was 80%. One problem with the comparisonis that only one tray was used to obtain the standard serving weights for each food item.
Since serving sizes vary widely, it would be advisable to use a larger sample of trays to estimate
serving sizes. Alternatively, visual estimates of plate waste could be based on an absolutescale such as volume so that estimates of waste do not depend on initial serving size.
A second problem with visual estimation is sampling. Unlike the other indirect methods,which might be able to collect data from all students, visual estimation would be done ononly a sample of trays. As such, its validity is subject to the same factors of size andrepresentativeness of samples which were discussed for individual plate waste.
Visual estimation appears to hold promise as a measure of plate waste, but it has notbeen tested extensively enough to permit its recommendation for use in a national study ofschool lunch waste.
Self-estimation of plate waste
A final indirect measure of plate waste involves asking students to give estimates of theamounts they consumed, for example, "all, most, about half, just tried it, none" (Head, etal; 1977).' " Self-estimation as a measure of plate waste depends on the assumption that studentswill give accurate estimates of what they ate. Many studies suggest that this assumption isseldom true.
Head, et at; 1977 administered questionnaires to students in eight elementary schools andone high school asking the students to rate in adjacent columns how much they liked thefood and how much they ate. Randomly selected plates were sampled for plate waste weighing.At low consumption levels, students claimed to have consumed more than they did.
Young, et al; (1953)" tested the food estimating capability of twenty-five 8th and 9thgraders on three consecutive days during which the serving size and waste were measured, andstudents were asked to recall what they had just eaten for lunch. The agreement betweenrecall and weighed values was "amazing" according to the authors, but close supervision byteachers could have made the students quite conscientious. In another study .6 children aged12 to 14 years were unobtrusively observed during one lunch. Consumption was estimatedby home economics teachers and the children were asked afterwards to recall what they had
-'See footnote 39.
" Young, C.M., F.W' Chalmers, H.N. Church, M.M. Clayton, G.C. Murphy and R.E. Tucker.Subjects estimation of food intake and calculated nutritive value of the diet. Journal of theAmerican Dietetic Association, 1953, 29, 1216-1220.
26

eaten. A tendency for all children, but especially boys, to overestimate consumption was noted.Meat portions were found to be especially difficult to estimate. The investigators evaluatedthe accuracy of estimation and recall in several age groups and concluded that when the subjectsknew they were being observed, their recall and estimation were better.
Meredith, et al. (1951), " in a similar study, asked 94 children nine to 18 years oldto recall what they had eaten for lunch 1/2 to 2 hours after the lunch period. They wereassisted by a nutritionist who knew nothing about the lunches that had been served. It wasfound that about 5% of the children remembered the number and kinds of items and theiramounts correctly. One-third of the subjects remembered the number and kinds of foods,but almost one-half of the children forgot one to four items. The tendency to underestimatethe volume of juice and applesauce consumed, for example, and to misidentify foods weresome problems noted.
Another problem with procedures as obtrusive as self-estimation is that even if children'smemory and estimation abilities are good, they may be biased in what they are willing toreport. Marshall (1956)82 and Litman, et al,(1964)83 assessed children's food beliefs usingthe Lewin test. This is a questionnaire in which the child is asked which foods are bad andwhich are good, who punishes or praises his food behavior, and what are great and awfulmeals he might have at a friend's house. The results revealed that children know approximatelywhat they should be eating, and that they tailor their alleged consumption to the adult theyassume is reading their dietary reports.
Since self-estimation is subject to such large errors, it is not recommended as a measureof plate waste.
CONCLUSION
The seven methods reviewed above were evaluated as measures of plate waste suitableto be used in an economic analysis of the National School Lunch Program and School BreakfastProgram. It is assumed that data will be collected on an institutional level, not necessarilyseparated by individual student. It is also assumed that specific food items will be kept separate.The method should be reliable and valid, and should be flexible enough for use with differentserving systems, menu items, age groups, and geographic locations. Within these constraints,the method which best minimizes personnel, cost, and time requirements should be selected.
" See footnote 6.
2 Marshall, M.M. An inquiry into the food attitudes characteristics of the children in the
Menands school. M.S. Thesis, University of Massachusetts, 1956.
HMLitman, T.J., J.P. Cooney, Jr. and R. Stief. The views of Minnesota school children onfood. Journal of the American Dietetic Association, 1964, 45, 433-440.
27

Four methods were found to be clearly unsuitable. Aggregate non-selective plate wastedoes not provide enough information about specific food items wasted. Garbage analysis involvesallowing tray waste to become mixed in the garbage containers, necessitating the time-consumingprocedure of separating the foods again. Food preference questionnaires were found to beof questionable reliability and validity as measures of waste. Self-estimation is subject to largestudet error and bias.
The three remaining methods are individual plate waste, aggregate selective plate waste,and visual estimation. Individual plate waste provides the most detailed information, but alsorequires the most time and expense. Aggregate selective plate waste seems more suitable becauseit can provide the same total waste measures without requiring individual weighings. Herethe major unresolved methodological problem is how to obtain a sample of trays large enoughand representative enough to give accurate estimates of the amount of waste in the wholecafeteria. Visual estimation shares this problem and also needs to be further tested for itsaccuracy.
Another valuable conclusion to be drawn from the literature reviewed here is thatinvestigators need to be alert to factors consistently affecting plate waste. These are particularlyrelevant to the sampling among institutions and within institutions which must be done inmeasuring plate waste. Sex, age, serving style, choice, menu preferences, environmentaltemperature, season, and socio-economic status have all been mentioned as important variablesfor sample selection.
28
" ]~- I

CHAPTER 3
PRELIMINARY OBSERVATIONS OF SCHOOL LUNCH PROGRAMS
DESCRIPTION OF SCHOOLS VISITED
A first step toward constructing an instrument to measure plate waste in schools is toexamine the school feeding settings themselves. A total of 39 schools in Massachusetts andNew Hampshire were visited. This sample was selected to reflect a variety of urban and ruralconditions, school sizes, types of kitchen and food delivery systems, types of waste disposalsystems, and student ages. The characteristics of the sample on thirteen relevant dimensionsare shown in Table 1. These schools ranged from 130 students in a rural community schoolwith family style feeding to 1900 students in an urban school with five separate cafeteriasin the same building with on-site bulk feeding. The range of settings is just a suggestion ofthe considerable variability which must be considered in an analysis of NSLP plate waste.
The schools visited included 20 elementary schools, seven middle schools, and 12 highschools. Of the elementary schools, two served family style on-site; one served on-site,pre-packaged food; three served food prepared off-site in bulk; three served food prepared off-siteand pre-packaged; and 11 served food prepared in bulk on-site. All 19 middle and high schoolsserved food prepared on-site in bulk. Sixteen of the school- visited offered a breakfast totheir students. The numbers of schools having each number of serving, eating and waste disposallocations are presented in Table 2.
Table 2. Number of Schools with Each Number of Locationsfor Serving, Eating, and Waste
Number of Locations 1 2 3 4 or more
for serving 12 12 3 12for eating 32 4 1 2for waste 17 11 1 10
The number of students eating the full lunch in a single school ranged from 53 to 1900.The number of lunch shifts ranged from one to six, with three and four shifts being mostcommon; and shift lengths ranged from 20 to 45 minutes, with 20 minutes being most common.Schools differed in the types of trays and/or plates used. The trays or plates were disposablein 10 schools, and nondisposable in 29 schools; in 31 of the schools, they were alsocompartmentalized. Finally, the methods of waste disposal differed according to itemseparation. Milk, food, and non-food were all mixed together in 15 schools. In the remaining24 schools, at least one of these items was separated. The number of individual food itemchoices in a single school was also variable. The entrees available ranged from one to eleven.The number of vegetables served ranged from one to six, and the fruits offered ranged fromnone to four. Also, dessert choices ranged from none to four. The amount of variationin the factors which related to school feeding is tremendous, as indicated by the data above.
29

z~~~~~ zzz ZZZZZ Tz zF
CLUU. UU
I-x
.2 0ow.0
Cc
'D c
Eo m
w U0 3:
E1 E -im
U 0 - 0
.2 4
eCf 0 m
00
0 U> EU
-~- Z E> 0) 0 00)
E .0 ZZ Z ZZ Z Z >-Z>- > > =- >z
.0 -. U. -. I-Y --F
0 0~
NE -04o~~~ N o
U (U . 0
S F) Fn 0 0 0 n o n U) i
* U4 N-Cc'nf ~N N- K CN v mF000
0 ~o. -C 0
C- Iq m c)L C N N T N m C.) v 0 _'
C) OCCOOC LQ O
(A 0f LLu G 0
m>-------------- N soC)C~ 8 CO CD UDr- L 0 L
7 L Ln Nl~ C OCCWCC -OOOf N m 4, 0
*0 0> F
F L4
300

U 0 ~ ~~~ V)&O O fl O U-
0030
< n 0
4) ~ ~ L 'ccW0
Cl0
_ ~zz(A)
w' nC 4V I,-
C8
0 .0 aC-A l * - ( C C1 Itm 91 E c
Ad 0
.2 1.
E -E a a C
00
0
*z* 0 0
.- 4
>~ ~. ,U 0 0 0 0 0
0 4) D (D4- w w z w
00
A! C0 E-
- 0; -0u .
4) 0
* . (J 11 If
.0~~ CI0 00 C-0 ( 0C0 In 0 In0(N'fI U)InC1 ."I m C'JCN ('v% CmC Nc v vVe NMC
IIN X
- a CAI.
CLC
cm 4n) c ?00 O
00 .2 0 0 r- Cd C Lf UC,0 E 0
- -w -
0 I0
c n In C D - I I I I I I 01.
.~~ 04
0 4
m v or, ICAI~~~~* 4 4C4 C- "
31

The selection of schools in Massachusetts and New Hampshire at the end of the schoolyear raises some critical issues for the interpretation of the data. It is important to recognizethat sampling done in this region, at this particular time, may have yielded data which arenot strictly representative of the national constituency of the NSLP. For example, the menussampled in some cases reflect changes in menu planning strategies from the normal procedure.This point was made by some of the cafeteria- managers who stated that they were preparingfor the end of the school year by incorporating perishable stored foods into the menus forthat period. Other effects of time of the year, such as field trips, early dismissals, and specialuses for cafeterias (e.g., play rehearsals) are not likely to have biased the observations.Nonetheless, it must be recognized that limitations exist in the generality of this sample.
Another focus of our observations was to anticipate any problems that might arise formeasuring plate waste in these school settings. This task was incorporated as a standardcomponent of the field observations. The possible measurement difficulties and sources oferror were broken down into: (1) variable quantities of foods served to students; (2) variablequantities of food wasted; and (3) other extraneous sources of consumption and wastevariability not directly related to menu, delivery system, or waste disposal system. An outlineof these problems is presented in Part 2 of this section.
It is clear from the outline that the goal of large scale, objective measurement of platewaste in settings and with populations exhibiting such enormous variability is a most difficulttask. The method to be used must be inexpensive in personnel, time, and general overheadcosts, as well as valid. This means that the measurement procedure must be flexible enoughto accommodate the highly variable physical environments and serving systems, and that itmust yield data from each setting which are reliable, valid, and still comparable for use inthe overall economic analysis. Thus it appears that a single, invariant procedure may not befeasible. What is needed instead is a standard protocol for data recording, and a set of procedureswhich will control for any observed variability in the system, and which can be used in allsettings concerned.
32

WASTE MEASUREMENT PROBLEMS
How Much Each Student Was Served May Be Difficult to Assess because
A. Food service workers serve portions of varying size.
1. Random variability
a. Size of naturally-portioned items
* Fresh fruit (apples, bananas, oranges) and sometimes canned fruit (pears)are served whole (or halved). Fruits are naturally variable in size.
* Meat is also sometimes naturally portioned (chicken pieces, fish pieces),though more often served in a more uniformly-portioned way (fishcakes,hamburger patties).
b. Method of preparation
Toppings (frosting, whipped topping, sauces, condiments) may be thickeron some portions than on others.
Cutting is a great source of variability, particularly for sheet cakes, largepizzas (at least for edge pieces), vegetable sticks (carrots, celery), saladingredients (tomatoes), etc.
Bread was usually commercially sliced into very uniform pieces. Theexception is school-baked rolls (and cookies), which could be moderatelyvariable in size.
c. Method of serving
- Serving utensils vary in their accuracy from
- measured ladles (e.g., 4 oz or 6 oz, used by most schools for atleast some items, such as spaghetti, soup, stew)
- ice cream scoops (sometimes used for other items such as mashedpotatoes or cole slaw)
- slotted spoons (used by most schuols for serving vegetables)
- regular servings spoons (used occasionally for items such as turkeya la king, vegetables, cole slaw)
33 r

- rubber spatulas (ulten used, sometimes by students, to spreadcondiments like mustard)
- metal spatulas (often used to serve pizza, lasagna, cakes)
sc0olS (sometimes uised for french fries, sjlad)
- tongs (used rarely, for items such as fish sticks, salads, French fries)
hands (extremely variable when used to serve French fries, potatochips)
- paint brush (sometimes used by food service workers to put butter(melted) on bread)
-squirt bottle (occasionally used for condiments)
Food service workers cannot perfectly size the portions they serve.
Preportioned items are probably less variable in serving size than itemsportioned as served.
2. Systematic variability
a. Age of student
- Older stiudents were frequently given larger servings or seconds.
b. Size of student
Bigger students were frequently given larger servings or seconds.
c. Students' requests for more or less
Some schools freely adjusted portion size in accordance with studentrequests, some even to the point of omitting an item entirely if a studentrequested.
Even prepack lunches were occasionally given as seconds if there wereextras.
d. Food service workers seemed to adjust serving sizes as a meal progressed,either to conserve items in short supply or to use up items in ample supply.
e. Food service workers occasionally portioned items visually (e.g., 2/3 of adish full). If more than one size of dish or compartment was used, portionsize would also vary.
34

B. Students may select portions of varying size.
1. Amount of self-selection within a preportioned menu item.
Schools often allow students to select their own items (pick up own vegetablesticks, cakes or other desserts, fruit, sandwiches, rolls, etc.). Students canthus choose smaller or larger portions (and often appear to carefully pondertheir choices).
2. Self-serve items.
Portion size is obviously enormously variable when students spoon (orotherwise dish up) their own food.
o Self-serve happens most frequently with condiments and salad dressings.Occasionlly schools allow self-serve on most menu items (either in the regularline or on a salad bar).
3. Family-style service allows great variability in individual portion size, since allitems are self-served from serving dishes at the dining tables.
C. Students may select menus of varying composition.
1. Offer vs. serve
High schools sometimes (and middle schools, occasionally) allow students topurchase a Type A lunch with only three or four of the five food itemsincluded.
2. Amount of choice available
- Some schools (particularly, but not exclusively, high schools) offer choiceswithin menu categories.
- Milk: always white, sometimes chocolate, infrequently skim
- Entrees: probably the item with the fewest choices, unless fast foodor cold sandwiches
- Vegetables: sometimes leftovers from previous days. Greatest choicesprobably occur in salad bars
- Fruits: frequently choices of several different canned or frozen fruits
- Potato: seldom more than one variety served
35

- Bread: usually only white, but rarely whole wheat or other dark bread
also
-- Other desserts: sometimes a choice of type of cookie or cake
3. Extra portions and a la carte items
Schools had widely different procedures for serving extra portions. Theyranged from:
-- Extra portions only if a second full meal is purchased (as the studentgoes through the line or later)
-A La Carte items purchased separately (milk, potato chips, etc.)
- Extra entrees distributed to students who want them free of charge
Sometimes vending machines or carts sold extra items during the lunch period(ice cream bars, soft drinks)
D. Food may be traded.
1. Items from the Type A lunch
Student trading was more common in some schools than others.
Occasionally, lunch monitors encouraged trading by looking for students toeat other students' leftover food items.
2. Other food IStudents may occasionally trade food from the Type A lunch for food frombrown bag lunches.
I1. How Much Students Ate (Wasted) May Be Difficult to Assess because
A. Food goes other places than waste containers.
1. Outside the lunchroom
Students often take food to playgrounds and elsewhere (bathrooms,classrooms), even though most schools prohibit it.
Food service workers reported particular problems with fresh fruit in theplumbing and peanuts and raisins being thrown.
36

2. Onto tables and floors, etc.
This problem was usually fairly small, with a few notable exceptions
3. Sometimes some groups eat Type A lunch someplace other than the lunchroom.
Special ed students, preschoolers, kindergarten, were observed to eat separatelyin their classrooms.
At some schools, students eat outside.
B. Other waste is included in the same containers.
1. Brown bag lunches
Occasionally students who brought lunches from home sat in a separate areaof the lunch room.
2. A la carte
3. Teachers, food service workers
4. Non-food waste
* Prepack trays (hot & cold packs).
Napkins, milk cartons, & other disposables.
Plates, trays, silverware are occasionally discarded by mistake.
C. Waste separation is never complete.
Even when students are supposed to separate items, they often make mistakesor don't complete the separation.
Hard to separate chicken meat from bones, apples from core, etc.
Liquid foods and sauces which mix will be difficult to separate.
Some solid foods (e.g., breads) may absorb liquid and result in contaminationof both.
D. Pricing policies may encourage the purchase of extra meals to obtain one item
e.g., students may want to purchase a second whole Type A lunch just toget a second serving of French fries, which cannot be bought a la carte.
37
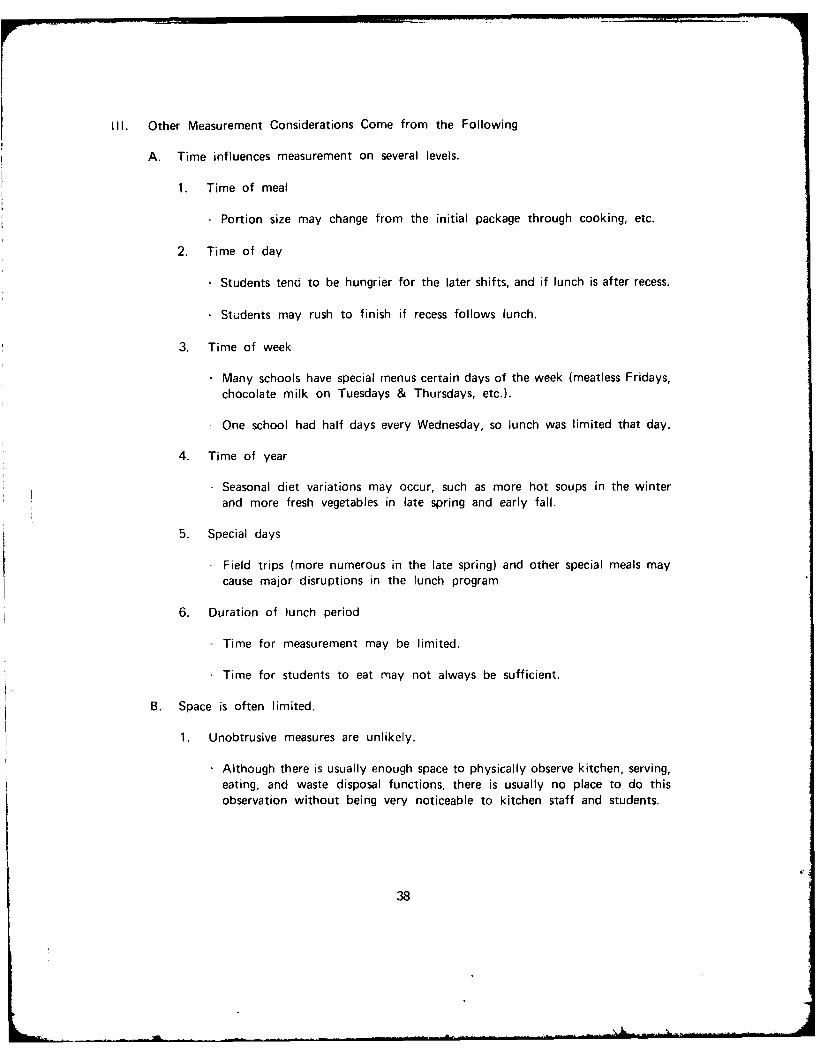
IlI. Other Measurement Considerations Come from the Following
A. Time influences measurement on several levels.
1. Time of meal
- Portion size may change from the initial package through cooking, etc.
2. Time of day
Students tend to be hungrier for the later shifts, and if lunch is after recess.
Students may rush to finish if recess follows lunch.
3. Time of week
Many schools have special menus certain days of the week (meatless Fridays,
chocolate milk on Tuesdays & Thursdays, etc.).
One school had half days every Wednesday, so lunch was limited that day.
4. Time of year
- Seasonal diet variations may occur, such as more hot soups in the winterand more fresh vegetables in late spring and early fall.
5. Special days
Field trips (more numerous in the late spring) and other special meals maycause major disruptions in the lunch program
6. Duration of lunch period
Time for measurement may be limited.
Time for students to eat may not always be sufficient.
B. Space is often limited.
1. Unobtrusive measures are unlikely.
Although there is usually enough space to physically observe kitchen, serving,
eating, and waste disposal functions, there is usually no place to do thisobservation without being very noticeable to kitchen staff and students.
38

2. Lunch rooms often have other uses.
* Cafetoriums, study halls, gyms, classrooms were all frequently observed. Theseother uses could possibly be disrupted by observers, especially when they occursimultaneously with lunch, as did one study hall and one singing class.
C. Menus vary widely in populaity and familiarity
Food service workers reported that the. most popular menu items were pizza,hamburgers, French fries, spaghetti, etc.; least popular were vegetables.
D. Tray reserves might not be available for use between shifts.
39

CHAPTER 4
PROPOSED METHOD - AGGREGATE SELECTIVE PLATE WASTE
RATIONALE
The review of the literature on methods of measuring plate waste narrowed the optionsappropriate ior a national economic study to three: individual plate waste, aggregate selectiveplate waste, and visual estimation. Preliminary observations in the schools did not specificallyprohibit the use of any of these methods. All three appear to be applicable to each typeof food preparation, serving, and waste disposal system, kind of menu, school size, etc., withonly minor variations. None of the methods would drastically modify school lunchroomroutines, and the required equipment is simple and readily available.
Aggregate selective plate waste is the method recommended by the NARADCOM researchteam. The rationale is as follows. Time and cost are important criteria in the choice ofa method. Individual plate waste, while it provides the most detailed information about waste,is the most time-consuming method. In some preliminary comparisons of the time requiredto scrape and weigh plate waste, individual plate waste indeed required more time than didaggregate selective plate waste. Since information on amounts of food wasted by individualsis not essential for an economic analysis of feeding programs at the school level, the extratime and associated costs involved make individual plate waste a less appropriate measure.
Aggregate selective plate waste was also judged better than visual estimation for purposesof an economic analysis. There are four basic reasons for this judgment. The first is thatvisual estimation has not been adequately tested for accuracy. An economic analysis wouldseem to require accurate measurements of the absolute waste. Although the studies of visualestimation reviewed in Chapter 2 showed high inter-observer agreement, the accuracy of visuallyestimating the weight of waste has not been adequately tested. Second, since visual estimationhas been based on proportion of the initial serving that was waste., 1t would be expectedto be particularly inaccurate in lunch programs which serve portions of v.rying sizes. Sinceinitial serving sizes are typically highly variable, relatively lower accuracy of the estimates wouldbe expected. A different visual estimation procedure based on volume of waste rather thanproportion might reduce this problem, but it would be a time-consuming and costly methodto develop. The third and fourth disadvantages of visual estimation are based on judgmentsby the NARADCOM research team that visual estimation would require much more staff trainingand would take no less time at each school.
ASSESSMENT OF INDIVIDUAL PLATE WASTE VARIABILITY
It is expected that the application of aggregate selective plate waste measures to theeconomic analysis of the school lunch program will involve selectively scraping only a sampleof the trays from a meal. Although at small schools it may be possible to scrape waste fromall trays, time and personnel constraints will make sampling a necessity at larger schools. Twomajor questions are raised when sampling is employed. First, how many trays can a teamof researchers be expected to scrape in a given amount of time? The literature reviewed gavelittle indication of the time and personnel requirements of aggregate selective plate wastemeasurement.
41

A second unanswered question concerns the accuracy in estimating total waste when onlya sample of trays is aggregated. Obviously, if waste from all trays is aggregated, then totalplate waste for each food item is known with as much accuracy as the scraping and weighingprocedures allow. When sampling is employed, total waste must be estimated from the totalwaste in the sample. Assuming that an unbiased sample is obtained, the accuracy of the estimateh(1(!enIs O, Ion iree ..-tors:
1. The number of trays in the sample (n),
2. the number of trays in the lunchroom population (N), and
3. the variability of the waste of each food item across trays.
Estimates of total waste of a food item will be worse the smaller the sample size, the largerthe population size, and the larger the variability in food 'tem waste. Ideally, a large enoughsample size should be chosen so the estimates of total waste in most food items will metsome established criterion of accuracy. This cannot be done unless variability in individualplate waste is known. No data on plate waste variability were found in the literature.
The data described below were gathered to measure variability in individual plate wastefor a variety of menu items. Aggregate selective plate waste was also measured for samplesof trays in order to begin to assess time requirements and develop the recommended samplingand scraping procedures.
METHOD
Sites
Since the analysis of individual plate waste variability was made durina July and Auaust.no regular school lunches were being served. Two summer programs with feeding systemssimilar to schools participating in the NSLP were selected. Both programs served lunches thatmet the specifications for type A lunches, both served students of similar numbers and ages,and both had lunchroom procedures similar to those observed during the school year. Programsupervisors were very cooperative in allowing data to be gathered in the lunchrooms.
Program A was a summer recreation and community school program located at an urbanelementary school. Approximately 165 children between the ages of 6 and 12 were fed cold,prepackaged lunches which had been prepared by a private, off-site vendor. There were nochoices available in menu items. All trays and utensils were disposable. The children atein groups of eight or fewer at round tables and usually disposed of their garbage in wastecontainers scattered around the lunchroom.
Program B was a pre-college enrichment program for approximately 361 gifted high schoolstudents, ages 13 to 15. Lunches were prepared on site and served in bulk from the cafeteria
42

line of a state college dining facility. Two hot entree choices were available each day, andthere was a very popular self-serve salad bar. Trays and utensils were not disposable. Studentsate at round tables for six. They separated ulensils ,irid paper from their trays before placingthem on a conveyor belt leading to the dishroom.
Plate sampling and scraping procedures
Each site was visited on two days (Al, A2, B1, B1); the second visits were five daysafter the first visits to each site. The research team of three or four people arrived beforelunch was served, set up equipment, and recorded the menu items to be served that day. Atsite A, five lunches were randomly selected and the initial serving sizes of all menu itemswere weighed. It was not possible to weigh initial servings at site B.
When students had completed their meals, a sample of trays was gathered for weighing.Even though lunchroom routines necessitated a slightly different procedure at each site, thesampling procedures were designed to be unbiased. At site A, students were instructed bythe lunchroom monitor to leave all their waste on the tables. When the students left thelunchroom at the end of the meal, the research team gathered all the trays, putting everysecond tray from each table into a group for aggregate scraping. The other half of the trayswere selectively scraped and the scrapings were individually weighed.
At site B, trays were picked from the conveyor belt. On day one, every fourth tray
was sampled, and on day two, every third tray was sampled. The first tray sampled wasrandomly chosen from among the first three or four trays. As at site A, every second sampledtray was put into a group for aggregate scraping and the remainder were individually scrapedand weighed.
Sampled trays were selectively scraped as follows. The basic procedure was to separatefor wcghing all the edible portion of each food item which remained on student trays. Nonfoodwaste and inedible food waste were discarded. For example, banana was weighed withoutthe peels and chicken without the bones. Individual food components were separated fromeach other as much as possible without excessive labor. For example, hamburger and cheesewere separated from buns and as much condiment as possible was separated from the meat
and buns; gravy was separated from green beans, turkey, and bread. In these difficultseparations, there was some small and unavoidable contamination of one food item from another.Some food items were intentionally left as composites, for example, macaroni and cheese (B1),
soup (B2), lettuce with dressing (81), and mixed tossed salad with dressing (82).
Equipment and procedures for weighing
All weights were measured to the nearest 0.1 grams usinq a Mettler P-1000 toD-loadinascale, which could weigh up to 1000 grams. The scale was balanced at each site prior todata collection.
Food waste to be included in aggregate weighings was scraped with rubber spatulas intoseparate containers, one for each food item. The containers were of three types - number 10
43

can with plastic lids, gallon-size Ziploc plastic bags, and 250 ml polystyrene disposable dishes(Moore-Park weigh boats). The empty weight of each number 10 can was determined andrecorded prior to the collection of any food waste. After all trays had been selectively scraped,the aggregates were weighed and container weights were subtracted. An empty plastic bag
or weigh boat was placed on the scale and the scale set to zero prior to weighing aggregates
in those container types.
For the measurement of individual plate waste, the scale was set to zero with an emptyweigh boat in place. Food items from individual trays were then selectively scraped into separateweigh boats and weighed. Weights from one tray were recorded before moving on to itemsfrom another tray. When a tray showed no evidence of a food item, either because the foodhad been completely consumed or because the food had never been on the tray, the weightwas recorded as zero.
The times required to weigh individual plate waste and aggregate selective plate wastewere informally measured with a stop watch during portions of the first three days of datacollection. On the final day, procedures were kept as close as possible to those expectedto be employed in the final method. One researcher sampled and delivered trays to a secondresearcher, who selectively scraped for aggregate selective plate waste. The time from astopwatch was recorded after each ten trays.
RESULTS
Table 3 shows the number of trays at each site on each day that were sampled for aggregateselective plate waste and for individual plate waste. Also shown are the total numbers oftrays served at each site. At site B, the total number of meals served was estimated bymultiplying the number sampled by the inverse of the proportion ot trays sampled.
Table 3. Number of Trays Sampled for Weighing On Each Day At Each Site
SITE A SITE B
Day 1 Day 2 Day 1 Day 2
Aggregate selective plate waste 40 40 37 55
Individual plate waste 42 40 37 52
Total trays served 130 80 296 321
Plate waste data were gathered for a total of 36 food items, 12 at site A and 24 atsite B. Waste was weighed for all food items served at site A. At site B, a few foods offeredwere ignored in the waste collection. On day 1, no data were collected on beverages; wastefrom the fruit drink served at site B was measured on day 2. Also, on day 1, no wasteoccurred in three items which were to have been measured - pickles, macaroni salad, andcucumbers - which were all available on the salad bar. On day 2, at site B, three food itemsthat were very seldom wasted - milk potato chips, and ketchup - were ignored, as werepeas, which were introduced to the cafeteria line late in the meal. Cottage cheese waste wasto have been measured, but none occurred.
44

The 36 food items for which waste measurements were made are listed and described
in Table 4. Also listed are initial serving weights for all items served at site A and for seven
ittmis served ;it site B. At site A, the weights listed are the means of five initial servings.
The weights listed for site B were obtained when portions returned as waste could be determined
to be a full serving.
Individual plate waste
Table F lists several characteristics of the wasted food items from the individual plate
waste measurements at each site. The mean waste weight in grams is the mean amount of
each food item returned per tray. Since the sample of trays was obtained in an unbiasedway (every xth tray was sampled), multiplying the mean waste by the number of studentsin the lunchroom will provide an estimate of the total waste produced in the lunchroom fora given food (see Cochran, 1953).4 For example, the mean corned beef waste was 31.6;multiplying by 130, the number of trays served at site A on day 1 (see Table 3), yields an
estimated total waste for corned beef of 4108 grams. Estimating total waste from the meanwill be unbiased in that it will not predictably overestimate or underestimate the lunchroomtotal. It will also be a consistent estimator, meaning that the estimate will be better thelarger the sample size.
Table 5 also lists the variance of each food item, calculated from the individual platewaste samples. Food items differed tremendously in variance, ranging from 0.6 grams squaredfor bacon to 6826.6 grams squared for milk. Variability can be indexed in three other ways
particularly relevant to assessing the accuracy of sampling food waste from a large finitepopulation. There are:
1. the number of trays needed for the sample to meet a specified criterion ofaccuracy,
2. the standard error of the mean (or total)waste in grams, and
3. the standard error of the total waste in dollars.
Each of these measures is treated below.
First, it might be asked how many trays would need to be sampled for the estimated
total waste to meet a given criterion of accuracy. The criterion chosen here was a standarderror of the mean no larger than 10% of the mean. Since the total number of trays servedis known, the standard error of the total waste will also be no larger than 10% of the total
waste. When this criterion is met, the true lunchroom total waste for a given food item wouldbe expected to fall within plus or minus 10% of the estimated total for approximately two-thirds
M4Cochran, W.G. Sampling Techniques. New York: Wiley, 1953.
45

Table 4. Description of Food Items for Which individualWaste Measurements Were Made
Mean Serving WeightFood Item Description of Item in Grams8
Site A, Day 1:
Corned Beef Thin-sliced heap for bun lilling 56.2
Bun Hamburger roll for Corned Beef 49.1
Cole Slaw Chopped cabbage with dressing 83.1
Banana Small, ,resh 67.4
Milk White, in carton 238.2Mustard Prepackaged 3.9
Site A, Day 2:
Chicken 3-5 fried, cold, 2nd wing joints 58.8 b
Roll Small unbuttered dinner roll 25.1Banana Small, fresh 75.7Milk White, in carton 240.9Orange Juice Natural, in carton 121.9 c
Ketchup Prepackaged 6.1
Site B, Day 1:
Bacon StripsMacaroni & Cheese Large serving, approx. 11/2 cupsBread Sliced, white 22.1Potato Chips On salad bar, rut:ledGreen Beans CutGreen Pepper On salad bar, choppedTomato On salad bar, sliced/choppedOnion On salad bar, slicedLettuce with On salad bar, shredded, 3 dressings
dressingJello Red and green cubesCookies Chocolate chip, oatmeal, sugar 15.2
46

Table 4. Description of Food Items for Which IndividualWaste Measurements Were Made (cont'd)
Mean Serving Weight
Food Item Description of Item in Gramsa
Site B, Day 2:
Hamburger Patty served on bun 47.2 d
Turkey One rolled piece, hot 51.8 d
Cheese Sliced American, on salad bar, forhamburger
Bun For hamburger 53 .5 d
Bread Sliced, white, for turkeyGravy Ladled onto hot turkeySoup Vegetable beef in cupGreen Beans CutCold Slaw On salad bar, chopped cabbage with dressingMixed Tossed Salad On salad bar, lettuce, tomato, radish & onionMixed Fruit Canned peaches, pineapple, fruit cocktailFruit Drink Red, orange, green, purple 197.2d
Cookies Six different kinds 14.2
aWeights of Site A items based on initial servings. Weight of Site B item obtained only when
complete portions were returned as waste.
bChicken bones were not weighed in waste measurements.
CWeighed including carton.
dBased on only one observation.
4
47

Table 5. Means and Variances of Individual Plate Waste, and Sample SizesRequired for Standard Errors to be Within 10% of the Mean
Sample Size Required forPopulation Size =
Mean WasteFood Item In Grams Variance* 100 500 1000 2000
Site A Day 1:
Corned Beef 31.6 561.8 37 51 54 55
Bun 29.1 497.9 38 53 56 58
Cole Slaw 68.2 1024.5 18 22 22 22
Banana 11.9 525.9 79 214 272 315
Milk 36.6 6461.5 83 246 326 389
Mustard 2.2 4.2 47 74 80 83
Site A Day 2:
Chicken 16.6 286.4 51 86 94 99
Roll 9.8 202.3 68 148 174 190
Banana 17.5 796.2 73 172 207 231
Milk 36.2 6826,6 84 256 343 414
Orange Juice 6.2 459.4 93 351 541 714
Ketchup 5.8 4.9 13 14 15 15
*Variance X(x - x) 2 /(n - l)
48

Table 5. Means and Variances of Individual Plate Waste, and Sample SizesRequired for Standard Errors to be Within 10% of the Mean (Cont'd)
Sample Size Required forPopulation Size =
Mean WasteFood Item In Grams Variance* 100 500 1000 2000
Site A Day 1:
Bacon 0.3 0.6 90 320 471 615
Macaroni & Cheese 28.8 3801.3 83 240 315 374
Bread 6.2 120.2 76 193 238 270
Potato Chips 0.6 5.8 94 375 600 856
Green Beans 14.9 756.9 78 204 255 293
Green Pepper 0.4 1.4 92 342 518 699
Tomato 2.8 68.5 90 316 461 599
Onion 0.5 1.6 86 269 368 450
Lettuce w/dressing 11.6 554.5 81 225 291 340
Jello 15.9 1186.4 83 243 321 382
Cookies 7.3 246.3 83 242 319 379
Site B Day 2:
Hamburger 6.9 179.5 79 214 272 315
Turkey 1.1 51.5 98 447 807 1353
Cheese 0.6 4.3 94 370 587 830
Bun 8.7 221.9 75 186 228 258
Bread 2.3 90.1 95 383 620 899
Gravy 2.2 37.1 89 302 432 551
Soup 2.1 202.8 98 451 820 1390
Green Beans 32.5 421.2 29 37 39 40
Cole Slaw 1.8 170.7 99 457 839 1446
Mixed Tossed Salad 8.3 454.8 87 284 396 494
Mixed Fruit 6.7 351.9 89 305 439 563
Fruit Drink 7.0 817.1 95 386 627 913
Cook ies 1.9 37.6 91 335 503 671
*Variance = (x -_ ) 2/(n - 1) 49

of the samples drawn. Table 5 lists the number of trays required for the sample when thetotal number of trays served is 100, 500, 1000, and 2000. The formulas used to calculate
,,,iple sii/es were dS lullows (Kish, 1965); F irst, the element reldtive variance, Cy", WdS
calculated as sy 2 / 2, where sy 2 is the variance and 72 is the squared mean. The relativevariance of the mean, or the coefficient of variation, cv 2 , was set at 0.12 = 0.01. The samplesize needed for cv 2 to be 0.01 in an infinite population was calculated as x = cy 2 /cv 2 .Correcting for finite populations of known size N, requiring sample sizes were then computedby the formula n = x/(l+x/N).
Notice that as population size increases, the sample size required to meet the accuracycriterion also increases, but not nearly as rapidly. This means that the proportion of traysrequired to meet the accuracy criterion decreases as population size increases. For example,at population size 100, 30 of the 36 food items would require sampling more than half ofthe trays, while at population sizes 500, 1000, and 2000 only 17, 10, and 3 of the 36 fooditems would require sampling more than half of the trays.
In general, the food items requiring the largest sample sizes are the food items of whichthe smallest percent was wasted. This relationship between percent wasted and sample sizerequired was remarkably strong. Table 6 shows the food items measured at site A, rank orderedby approximate percent of the serving size which was wasted. Also shown are the samplesizes required in a population of 500 for the standard error of the total to be within 10%of the mean. Of the 12 items, there are only two (chicken and roll) which are out of orderby one location. The Pearson product-moment correlation coefficient is --0.88.
The inverse relationship between percent wasted and sample size required has practicalsiqnificance. It indicates that the food items for which the waste will be easiest to estimate(i.e., a satisfactory estimate can be obtained with the fewest trays sampled) are the food itemswhich are in some senses the most important to estimate accurately, those for which the mostwaste occurred.
Another characteristic of waste measurement is apparent from the data on sample sizesrequired to meet the criterion of a standard error of the total within 10% of the total. Ingeneral, smaller sample sizes are required at site A than at site B. For example, in a populationof 500 at site A, only one food (orange juice) of the 12 measured would require a samplesize of more than 300 students. At site B, 13 of the 24 foods measured would require asample size of more than 300 students. The explanation of this difference is that at site Bthere was a wide range of menu choices available. No attempt was made to keep track ofwhich menu items were served to which students. The absence of waste from a given fooditem was always recorded as zero, whether no food had been taken or whether the food wasall consumed. Using this procedure, when a food is one of several choices, the distributionsof individual plate waste tend to include many zeros, to be biomodal or positively skewed,and to have low means and high relative variances. Such distributions require larger samplesizes for estimates of total waste to meet criterion.
" Kish, L. Survey Sampling. New York: Wiley, 1965.
50

Table 6. Approximate Percent Waste of Food Items at Site Aand Sample Sizes Required for the Standard Errors
to Be 10% of the Mean In a Population of 500
Approximate Sample Size Required
Food Item Day % Wasted When n = 500
Ketchup 2 95 14
Cole Slaw 1 82 22
Bun 1 59 53
Corned Beef 1 56 51
Mustard 1 45 74
Roll 2 39 148
Chicken 2 28 86
Banana 2 23 172
Banana 1 18 214
Milk 1 15 246
Milk 2 15 256
Juice 2 5 351
51

A second and closely related way to consider the accuracy of sampling is to estimate
standard errors of the mean waste in grams for specific sample and population sizes. The
two sample sizes chosen were 150 and 300 trays, and population sizes were 500, 1000, and
2000. Tables 1 and 8 show the standard eriors of the mean, expressed in grams and also
as prol)ortions of the mean waste, which would be expected at each sample and population
size. Figure 1 graphically illustrates the decrease in standard errors expected for increasing
sample sizes in population of 100, 200, 500, and 1000.) The two foods illustrated are milk
(Al), with a high gram standard error and hamburger (B2) with a lower gram standard error.
Standard errors expressed as proportions of the mean were approximately equal for the two
foods.
Notice that, for constant sample and population sizes, food items vary widely in the
accuracy of estimates which would be obtained. Standard errors expressed in grams are not
necessarily correlated with standard errors expressed as proportions of the mean. For example,suppose 300 trays were sampled in a lunchroom of 500 students. For milk at site A, the
standard error of the mean waste would be expected to be about 3 grams (or 1500 grams
for the total waste), or about 8% of the mean (or total). The standard error of the mean
for cookies (BI) was approximately the same proportion (0.08) as for milk, but it was only0.57 grams. Soup (B2) had a standard error of the mean of 0.52 grams, similar to cookies,
but this standard error was 25% of the mean soup waste.
Tables 7 and 8 also show that for a given sample size, doubling the population size (e.g.,
from 500 to 1000 or from 1000 to 2000) results in only slight increases in standard errors.On the other hand, for a given population size, doubling the sample size from 150 to 300decreases standard errors by nearly one half. Therefore, a sample of 300 trays would be expectedto provide much better estimates of total waste than would a sample of 150 trays. Table 9is a summary of data from Table 8. It shows the number of foods at each site which wouldbe expected to have relative standard errors of 0.1 or less, 0.1 to 0.2, and over 0.2. Figuresare from a total of 12 foods at site A and a total of 24 foods at site B. Sample size 150provides very poor estimates of total waste, especially at site B, where the relative standarderror for only one food would be less than 0.1. Relative standard errors are greatly reducedwith sample size 300. Even at sample size 300, however, there are three food items fromsite B with relative standard errors over 0.2 dt population sizes 500 and 1000. The foods
are turkey, soup, and cole slaw, all of which were selected and wasted by very few students
on the day of testinq
The third way in which the accuracy of sampling was investigated involved the cost ofthe Wast' Cost estimates were available for alI 12 food items at site A and for 13 fooditenms at site B These costs were used to obtain the estimated total waste cost for each
T he formula used to estimate the standard error of the mean was ./ (1-n/N) sy 2 in. Thisstindard error wds divided by the mean to give the relative standard error.
52

Table 7. Standard Errors of the Mean Expressed in Gramsfor Three Population Sizes (N) and Two Sample Sizes
Site A Sample Size - 300 Sample Size = 150
Day 1: N = 500 N = 1000 N = 2000 N = 500 N = 1000 N = 2000
Corned Beef 0.87 1.14 1.26 1.62 1.78 1.86
Bun 0.81 1.08 1.19 1.52 1.68 1.75
Cole Slaw 1.17 1.55 1,70 2.19 2.41 2.51
Banana 0.84 1,11 1.22 1.57 1.73 1.80
Milk 2.94 3.88 4.28 5.49 6.05 6.31
Mustard 0.07 0.10 0.11 0.14 0.15 0.16
Day 2:
Chicken 0.62 0.82 0.90 1.16 1.27 1.33
Roll 0.52 0.69 0,76 0.97 1.07 1.12
Banana 1.03 1.36 1.50 1.93 2.12 2.22
Milk 3.02 3.99 4.40 5.64 6.22 6.49
Orange Juice 0.78 1.04 1.14 1.46 1.61 1.68
Ketchup 0.08 0.11 0.12 0.15 0.17 0.17
53

Table 7. Standard Errors of the Mean Expressed in Gramsfor Three Population Sizes (N) and Two Sample Sizes (Cont'd)
Site B Sample Size = 300 Sample Size = 150
Day 1: N = 500 N = 1000 N = 2000 N = 500 N = 1000 N =2000
Bacon 0.03 0.04 0.04 0.05 0.06 0.06
Macaroni &Cheese 2.25 2.98 3.28 4.21 4.64 4.84
Bread 0.40 0.53 0.58 0.75 0.83 0.86
Potato Chips 0.09 0.12 0,13 0.16 0.18 0.19
Green Beans 1.00 1.33 1.46 1.88 2.07 2.16
Green Pepper 0.04 0.06 0.06 0.08 0.09 0.09Tomato 0.30 0.40 0.44 0.57 0.62 0.65
Onion 0.05 0.06 0.07 0.09 0.10 0.10
Lettuce withdressing 0.86 1.14 1.25 1.61 1.77 1.85
Jello 1.26 1.66 1.83 2.35 2.59 2.70
Cookies 0.57 0.76 0.84 1.07 1.18 1.23
Day 2:
Hamburger 0.49 0.65 0.71 0.92 1.01 1.05
Turkey 0.26 0.35 0.38 0.49 0.54 0.56
Cheese 0.08 0.10 0.11 0.14 0.14 0.16
Bun 0.54 0.72 0.79 1.02 1.12 1.17
Bread 0.35 0.46 0.51 0.65 0.71 0.75
Gravy 0.22 0.29 0.32 0.42 0.46 0.48
Soup 0.52 0.69 0.76 0.97 1.07 1.12
Green Beans 0.75 0.99 1.09 1.40 1.54 1.61
Cole Slaw 0.48 0.63 0.70 0.89 0.98 11.03
Tossed Salad 0.78 1.03 1.14 1.46 1.61 1.67
Mixed Fruit 0.68 0.91 1.00 1.28 1.41 1.47
Fruit Drink 1.04 1.38 1.52 1.95 2.15 2.24
Cook ies 0.22 0.30 0.33 0.42 0.46 0.48
54
L 1I
°" :

Table 8. Standard Errors of the Moan Expressed as Proportions of theMean for Three Population Sizes (N) and Two Sample Sizes
Site A Sample Size =300 Sample Size = 150
Day 1: N =500 N =1000 N =2000 N =500 N =1000 N =2000
Corned Beef 0.027 0.036 0.040 0.051 0.057 0.059
Bun 0.028 0.037 0.04 1 0.052 0.058 0.060
Cole Slaw 0.017 0.023 0.025 0.032 0.035 0.037
Banana 0.071 0.093 0.103 0.132 0.145 0.152
MilIk 0.080 0.106 0.117 0.150 0.165 0.172
Mustard 0.034 0.045 0.050 0.064 0.070 0.073
Day 2:
Chicken 0.037 0.049 0.054 0.070 0.077 0.080
Roll 0.053 0.070 0.077 0.099 0.109 0.114
Banana 0.059 0.078 0.086 0.110 0.122 0.127
Milk 0.083 0.110 0.122 0.156 0.172 0.179
Orange Juice 0.125 0.166 0.183 0.234 0.258 0.269
Ketchup 0.014 0.018 0.020 0.026 0.029 0.030
55
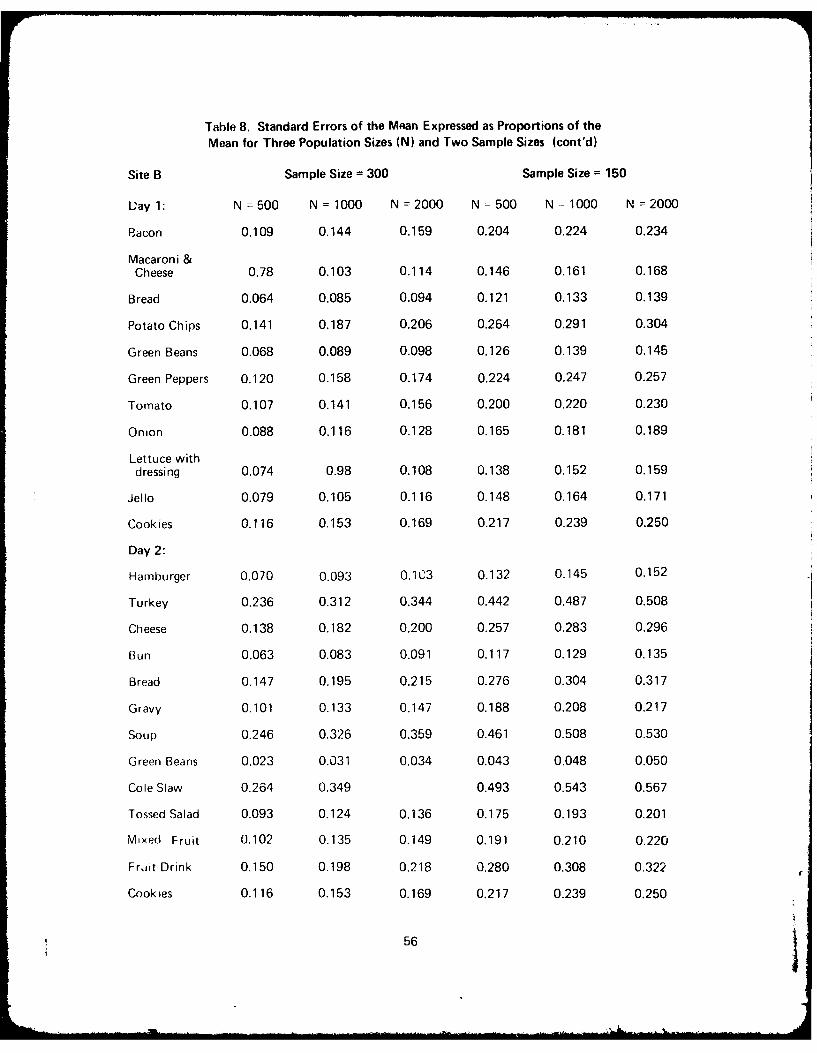
Table 8. Standard Errors of the Mean Expressed as Proportions of theMean for Three Population Sizes (N) and Two Sample Sizes (cont'd)
Site B Sample Size = 300 Sample Size = 150
Lay 1: N = 500 N = 1000 N = 2000 N = 500 N = 1000 N =2000
Bacon 0.109 0.144 0.159 0.204 0.224 0.234
Macaroni &Cheese 0.78 0.103 0.114 0.146 0.161 0.168
Bread 0.064 0.085 0.094 0.121 0.133 0.139
Potato Chips 0.141 0.187 0.206 0.264 0.291 0.304
Green Beans 0.068 0.089 0.098 0.126 0.139 0.145
Green Peppers 0.120 0.158 0.174 0.224 0.247 0.257
Tomato 0.107 0.141 0.156 0.200 0.220 0.230
Onion 0.088 0.116 0.128 0.165 0.181 0.189
Lettuce withdressing 0.074 0.98 0.108 0.138 0.152 0.159
Jello 0.079 0.105 0.116 0.148 0.164 0.171
Cook ies 0.116 0153 0.169 0.217 0.239 0.250
Day 2:
Hamburger 0.070 0.093 0.103 0.132 0.145 0.152
Turkey 0.236 0.312 0.344 0.442 0.487 0.508
Cheese 0.138 0.182 0.200 0.257 0.283 0.296
Bun 0.063 0.083 0.091 0.117 0.129 0.135
Bread 0.147 0.195 0.215 0.276 0.304 0.317
Gravy 0.101 0.133 0.147 0.188 0.208 0.217
Soup 0.246 0.326 0.359 0.461 0.508 0.530
Green Beans 0.023 0.031 0.034 0.043 0.048 0.050
Cole Slaw 0.264 0.349 0.493 0.543 0.567
Tossed Salad 0.093 0.124 0.136 0.175 0.193 0.201
Mixed Fruit 0.102 0.135 0.149 0.191 0.210 0.220
Froit Drink 0.150 0.198 0.218 0.280 0.308 0.322
Cookies 0.116 0.153 0.169 0.217 0.239 0.250
56
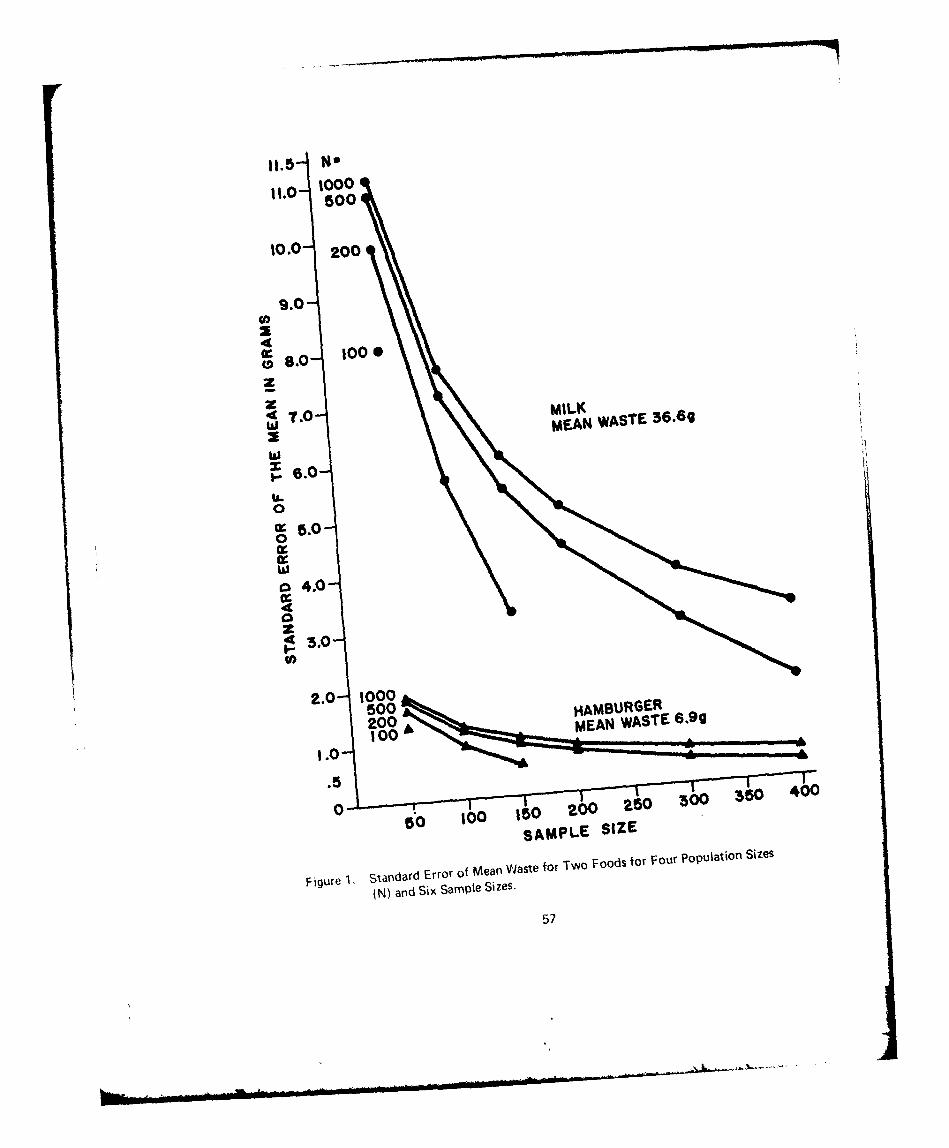
11.0 H050
10.0 Po0
9.0
000
x08.0
w .0 M~t AT 6~
0
0
~4.0
23.0
2.0 1000500 HAMBURGER200WSE690o
MEANWAT.9
.0
00 1 o 50 200 250 360 5 0
SAMPLE SIZE
Figure . Standard Error of Mean waste for Two Foods for Four POPUIatiOfl Sizes
(N) and Six Sampte Sizes.57

Tahle 9. Number of Foods lll'd Relitivo Stindard Errors forThree Population Sizes (N) and Two Sample Sizes
RelativeStandard Sample Size = 300 Sample Size = 150Error N = 500 N = 1000 N = 2000 N = 500 N = 1000 N 2000
Site A:
0.1 or less 11 9 8 7 6 6
0.1 to 0.2 1 3 4 4 5 5
over 0.2 0 0 0 1 1 1
Site B:
0.1 or less 10 6 4 1 1 1
0.1 to0.2 11 15 13 11 9 8
over 0.2 3 3 7 12 14 15
58

food item and the standard errors of those totals in dollars. The estimated total costs and
standard errors are shown in Table 10 for sample sizes 150 and 300 and for population sizes
500, 1000, and 2000.
Direct comparisons between site A and site B should not be made, since the costs obtained
were not cdomparable. At site A, the cost iii ormalion 1)vdilahle was the (: (st of vach servin(l,
including preparation. At site B, the cost information available was for food items as initially
purchased. In either case, it is apparent that the waste is generally not of negligible cost.
For example, at site A, if 300 trays were sampled from a population of 1000 students, total
corned beef waste would be estimated at $191.51, plus or minus a standard error of $6.92.
Aggregate selective plate waste
There were two major reasons for collecting aggregate selective plate waste. One wasto begin to develop the sampling and scraping procedures. The recommendations of theNARADCOM research team for efficient procedures will be presented in Chapter 6.
The second purpose in collecting aggregate selective plate waste was to measure the amountof time required. Table 11 shows times for scraping five successive sets of ten trays on thesecond day at site B, when procedures were kept as close as possible to those expected tobe employed in the final method. One researcher sampled trays and delivered them to a secondresearcher, who collected aggregate selective plate waste for thirteen separate food items.
The mean time for ten trays was 6 minutes and 37 seconds, which translates intoapproximately 40 seconds per tray or 91 trays per hour. This rate would be expected tobe faster for menus with fewer food items or food items easier to separate. As a generalguideline, a team of two reasearchers with experience would be expected to be able to selectivelyscrape close to 100 trays an hour. A team of three researchers might increase that rate to150 or 200 trays an hour. Rates of aggregate selective plate waste collection were measuredagain during the final pretesting of the method.
CONCLUSION
The data collected in the summer feeding programs has led to the following generalconclusions: First, plate waste in these programs was not of negligible cost, This findingis in agreement with studies of plate waste in school lunches and underscores the importanceof analyzing the economic advantages of reducing plate waste.
Second, individual plate waste can be extremely variable, particularly when variability ismeasured relative to the mean or total waste. The higher the variability, the greater the numberof trays that need to be sampled to reach a given criterion of accuracy in estimating totalwaste. In general, the foods which required the largest sample sizes were the foods of whichthe smallest percent was wasted and foods chosen least often.
59

Cc O. D N..- (N - (N MD ( ( C
IC) (N4 N. (N C- 0 . (N ( -oC C
(N
iz u00 -4 cy) a) (D 0 C) .- (4 CV) CD)
_ C '" CV) 6 c'i 6 6 4 C- t' 6 e'J 6
0 0.
(07 (N( D Y D CD) M' (0 to C") (N40 -ll 0Q - q- 0 ORD- 0 . -
ol c" ) (66 c-) Lo( o O Lf 6 'rt a) C'0 00 (D CY) (Nl C" C%) C') C') C') (N4
4-C") (N -
C:)
I-t
0 0 -
r_ C') 0 i-t( - C - Cm CD w ' - - 0C'
0L N
E~ rn 0 D o c-) co o Lo ON0* a 0 Lm O 0 00 00 C14 CD C) m' Cn ) 0 m
(n) c -
CO0,
C' 00. 4r-: Li r-0
C- CD CD 0. (D ( ( C 0 I') C CD
-CD
O M CN LO 00- CI -l m. 04 I. Ci (N mD LOU.11 C) mD CD (N) r1 N.) 0o 00 Cl? LON
CL0
U)0 n. tN CD 't CD 0N C') (N w. w' D CD
z ~ ~~ ~ ~ C' 'l IlC r n C14 0
0, 6~ 6 N L6 o6 0, (N 06 0- 0- 0l 0
CO CL
N. (N 0 : N. N. -C N. C C (N
C) -n N. b r m0'
60,

CN (0 0 mD 0 N4 Lc) Cl) - CO
U0 0 0) CV) 6 6 q IR CN 0C c)
CN
(NC1 CY) CO r, 0O .- 000 ~ 0Co 0 CV .o ( - (3 (3 'I LC)
4- -
0 U COoL 0.
CL (n 0 - o CO N CD a) CD co U-) (D)
4-0 -l C') CV) - D r N r- C '
o0U0 0C CO ItC(n C c N C) 0 r- 00 0 -C C C C V) CD) c') -1 -l o D
C O 't() C CO cl (N C') 0D r- CO0 m tBcn~ 0 6D 6T -N 0 0 0- 00 - 0M 0o -
0CL~
00'-Co*, LDqC ) CN ~ D C ri C (P O CP) C) C
0- LO--o C (D* L4 0D 0 (M CO) r) 0 o C N
0U Co0
CD -r(- O0 C) - r D C0 m
2~CD
C m 0 MU - t - 0 It T 0) C C') N -n 0)M'~ 0: LO CD0 r- (0 C1 -- (NC N
00 CLcc -0o. 0 Co
aEa CD
U' C D O r- - 0 N cD C') 0) 0 C C') CN4 CD I.2 -0 C0C' 0 (N 0 C.) c) 00 (N '-T V C.2 Cmw o 6 6 6o -o 6 66 C
CL
.0 0
U') CD CO ( C') 0) CD Iq (N IC - C') -
0 ' CD 0 -. 0 (N - ) ) D C CN
E a)4) a) 0(a
0 0>aCo c 'D -c N .0 U)c
-~ ,> 0 mU ( 0 > E ~ C ~ -4) a, - 0. a, 0
04( t U~ 0 L. 0 c :I CU. ~ CO co a- IJr 6c:
61

Table 11. Times Required To Collect Aggregate Selective Plate Waste
Set of Ten Trays Time in Minutes and Seconds
1 8:25
2 5:40
3 6:00
4 7:21
5 5:45
Mean 6:37
Obviously, the more trays sampled in a lunchroom, the more accurate the estimates oftotal waste for each food item will be. In lunchroom populations of 300 students or less,it is recommended that all trays be scraped using aggregate selective plate waste procedures.In lunchroom populations of more than 300 students, it is recommended that trays be sampledto obtain a total of approximately 300 trays. These recommendations are based on the judgmentthat a team of three or four researchers can fairly easily scrape 300 trays during the oneand a half or two hours of typical lunchroom operation. The pretests described in Chapter 5further tested the time required for aggregate selective plate scraping. The second reason forrecommending a sample size of 300 is that it appears to be a large enough sample to bringestimates of total waste of most food items to reasonable levels of accuracy. Errors in estimatingwaste will be expected for some food items, but these errors will tend to be largest for foodswasted the least and, thus, contributing least to the cost of the waste.
62

CHAPTER 5
PRETESTS OF THE AGGREGATE SELECTIVE PLATE WASTE METHOD
Methods for collecting aggregate selective plate waste were pretested in five schools between12 September and 3 October 1979. The schools chosen for the pretests represented a broadcross section of types of kitchen and serving systems, school sizes, and ages of students.Table 12 lists several characteristics of the schools, which are also described in more detailbelow.
The pretests were designed to assure that the method would be usable in a broad rangeof school lunch settings, to improve its efficiency if necessary, and to test its validity. Validitywas assessed by two means. First, two samples of aggregate selective plate waste were gatheredin one school on a single day and compared. Second, individual plate waste was measuredin two schools to assure that the measurements of variability, and thus the required samplesizes, in the summer programs (described in Chapter 4) were typical of school feeding situationsin general.
Over the course of pretesting, the aggregate selective plate waste procedures were modifiedslightly to improve their overall efficiency. The final recommended procedures are describedin Chapter 6, and the specific procedures used and data collected at each school are describedbelow.
SCHOOL LUNCH PROGRAMS AND PRETESTING METHODS
Pretesting Methods
Procedures for collecting aggregate selective plate waste were kept as uniform as possiblerom school to school. Two or three members of the research team visited each school during
a lunch period prior to the day of data collection in order to secure the cooperation oflunchroom personnel and to determine how to best implement the procedures with minimaldisruption of normal lunchroom routines. Arrangements were made for the schools to providetables near the tray return area to be used for holding trays and waste-collection equipment.
On the day of pretesting, the research team arrived approximately one hour prior to thebeginning of the first lunch period. Menu items to be served that day were recorded andequipment was set up. To ensure that no plate waste was discarded by students before itcould be sampled, trash containers normally distributed around the lunchroom were all gatheredbehind the tables where the research team worked. Empty weights were measured for allcontainers into which aggregate selective plate waste was to be scraped.
The research team always consisted of three or four people. One person was responsiblefor taking trays as they were brought to the waste disposal area, and for sampling trays whennot every tray was to be scraped. Two people scraped for aggregate selective plate waste.One of the scrapers also counted stacks of trays which had been scraped before discardingthem or turning them in to the dishroom to be washed. When a fourth person was on the
63

Table 12. Characteristics of School Lunch Programs Used in Pretesting
School School School School School School1 1 2 3 4 5
Day 1 Day 2
Data Collection Date 9-12 9-26 9-14 9-19 9-21 10-3
Number of Student-
Approx. Total 435 435 570 228 560 1100*
Eating School Lunch 244 237 310 187 539 401*
Aggregate Sample 244 0 310 149 539 263
Individual Sample 0 100 0 38 0 0
Number of FoodsSeparated 21 20 19 7 6 22
Grade Range Served 1-6 1-6 7-9 1-5 1-5 9-12
Kitchen Type off- off- on- off- on- on-site, site, site, site, site, site,bulk bulk bulk pre-pack bulk bulk
Dishes Disposable? no no no yes no no
Dishes Compartmentalized? yes yes no yes no yes
'School 5 had two cafeterias, but only one was tested. Of approximately 1100 students, 878were served school lunches. Of these, 401 were served lunches in the cafeteria tested.
64

resei,;h team, he or she helped the first researcher in handling the incoming trays, and removed
paper and liquid waste before giving the trays to the scrapers.
The equipment and the procedures used for scraping and weighing aggregate selective platewaste are described in Chapter 6. Except for a few cases noted in the descriptions of schools
below, containers used for collecting waste were number 10 cans and gallon-sized Ziploc bags.Milk, juice, and a few other food items were scraped directly into the number 10 cans. Allother food items were scraped into Ziploc bags which had been inserted as liners into number10 cans. When the Ziploc bags became fairly full they were removed from the number 10cans, sealed, and set aside for weighing at the end of the meal. When the meal ended, theremaining Ziploc bags were closed, removed from the number 10 cans, and weighed alongwith those set aside earlier.
Individual plate waste was measured at two schools (School 1 on day 2 and School 3).The procedures and equipment were the same as those described in Chapter 4, except foroccasional time-saving modifications described below for each school.
School 1
School 1 was a suburban elementary school which served lunch to approximately 240students in grades one to six. Food was prepared in the kitchen of a neighboring junior highschool (School 2) and delivered in bulk. Trays were nondisposable and compartmentalized.Students always had a choice of five entrees - the hot lunch or one of four sandwiches(submarine sandwich, peanut butter and jelly sandwich, peanut butter and marshmallow fluffsandwich, and a sandwich of the week, such as turkey). Milk was whole or skim, and juicewas available in paper cups. Students sat at rectangular tables with attached stools. Whenthey were finished eating, students typically returned their trays to one of two waste disposalareas, where they emptied milk and juice into a bucket and put trash and food waste intoa large garbage container. There were three 30-minute shifts, and students were allowed togo outside to the playground after 15 minutes if they had finished eating.
On the first day at School 1, three researchers collected aggregate selective plate wastefrom all 244 students eating school-prepared lunches that day. An attempt was made to useprocedures as close to the final recommended method as possible. The time required to scrapetrays was measured from the time the first tray arrived at the waste disposal area to the timethe last tray was scraped. The time required to weigh the aggregate selective waste was alsomeasured.
Problems encountered at School 1 were as follows. First, an attempt was made to separatemilk bought a la carte to drink with home lunches from milk bought with the school-preparedlunches. It was found to be too tin econsuming and confusing to ask each student whetherthey had brought lunch from home. Since kitchens keep good counts of milks and lunchessold, it was decided that separating a la carte milk cartons was not necessary.
A second problem was that there was much more milk waste than the research teamanticipated. We ran out of convenient containers to hold the waste. Weighing the milk wastewas also a problem. The scale weighed a maximum of 1000 grams, and it could not be zeroed
65

with 11 ibljtt ds hedVy as a nu mber ten can (about 285 grams) in pl)ace. Therefore, the
rseri:h tedm was torced to weigh milk in portions smaller than 715 grams. Weighing would
have been greatly speeded if a scale with a greater maximum weight had been available.
At School 1, the most troublesome menu item to separate was the submarine sandwich,
which was separated into roll, lettuce, tomato, bologna, salami, and cheese. Separation could
be done fairly accurately, but was time consuming. Future researchers might want to consider
leaving lettuce and tomato together, and all cold cuts together.
On the second day at School 1, three researchers collected individual plate waste only.
Approximately every second tray was selected, for a total of 100 trays. One modification
was made in the basic individual plate waste procedures. The 250 ml weigh boats used for
indiVidudl Plate waste measurements just barely held the contents of one milk carton; spills
were frequent. Therefore, to save pouring and cleanup time, waste milk was weighed in the
carton. Seven empty skimn milk cartons and fifteen empty whole milk cartons were weighed
and found to be very uniform. Skim milk cartons weighted 16 grams and whole milk cartons
13 grams. Carton weights were later subtracted as part of the data analysis.
School 2
School 2 was a Junior high school in the same suburban community. Approximately
310 students in grades seven to nine were served lunch in three 45-minute shifts. Food was
prepared in bulk on site and served on nondisposable, noncoripartmentalized plates and trays.
The menu choices were the same as at School 1. Students ate at rectangular tables for eight.
When they were finished eating, they usually emptied milk and juice into a pail, put paperwaste into a large container, and returned trays and plates to a single dishroorn where foodwaste was removed.
Four researchers collected aggregate selective plate waste from all 310 students who brought
school lunches. A la-carte milk waste from an idditional 203 students was also collected. Time
was measured fronri the arrival of the first tr ,y to the scrap)iig of the last tray. The portion
of this time actually spent scraping was obtained by subtracting out the two periods of time
at the ends of shifts one and two when researchers were idle waiting for the first trays from
the next shifts to arrive. Time spent weighing the aggregates was also measured.
The biggest problem encountered at School 2 was a shortage of space for stacking trays
)ri ir to scraping. A majority of students tended to return their trays during a short periodof time. The trays, with separate plates and dishes, were not easily stacked and required
more handling in the process of collecting waste. A rack into which students or researchers
could slide trays would have helped alleviate these probeins.
The time consuming food to separate at School 2 (as at School 1) was the submarine
sandwich. Also, the tartar sauce was hard to scrape from the small paper cups in which it
was served, because rubber spatulas did not fit inside the cups and some sauce tended to remainin the folds of the paper cup.
66

School 2 had a large volume of milk waste, but procedures were somewhat more efficientthan at School 1. Milk cartons were set aside and not emptied until there was a lull in incomingtrays. Enough containers were available, and weighings were done on a scale available in theschool kitchen which could weigh up to 25 pounds.
School 3
School 3 was an urban elementary school. During three 40-minute shifts, 187 studentsin grades one to five were served prepackaged lunches in disposable containers. The hot packcontained the hot food, and the cold pack contained both the cold food in compartmentsof a small tray and the nonfood items such as napkin, straw, and utensils. The only menuchoice was for milk (chocolate or whole), which was served in cartons. Students sat atrectangular tables with attached stools. Normally, as each student finished, waste was collectedand discarded by lunchroom monitors. When all students from one classroom were finishedeating, they returned to their classroom.
At School 3, three researchers collected individual plate waste from 38 trays and aggregateselective plate waste from the remaining 149 trays. The sample of trays for individual platewaste was obtained by putting every fifth tray on a separate table. Individual plate wasteweighings were done when lulls occurred in the scraping for aggregate selective plate waste.Two people from the school system's food service program assisted researchers by collectingtrays from students who had finished eating, and delivering these trays to the researcher whowas sorting incoming trays. Since the individual plate waste measures and the extra helpersare not part of the recommended procedures, nL time measurements were made at School 3.
One waste separation problem encountered was that the cheese in the cheeseburger wasimpossible to accurately separate from the bun. It was decided to weigh these items in oneaggregate. Also, a second kind of juice was unexpectedly served in some of the lunches; bothkinds of juice were collected in one aggregate. Since the procedure of not separating somefood items might make it hard to determine costs of the waste, future researchers might wantto attempt to separate these items, even though it may not be as accurate as other separations.
School 4
School 4 was another urban elementary school for students in grades one to five. Luncheswere prepared in bulk on site and served on nondisposable trays and plates. Students couldchoose whole or chocolate milk, but choices were normally not offered on other major menuitems. Approximately 539 students ate school lunches in three 40-minute shifts. Studentssat at rectangular tables for eight. As students finished eating, trays were gathered by sixlunchroom monitors, each responsible for four tables. Normally, the monitors dumped wastemilk into a bucket and separately scraped food and nonfood waste from the plates beforereturning them to the dishroom. Students did homework at their tables until the lunch periodended.
At School 4, serving weights were obtained for all six food items on the menu. Sixservings of pear halves and nine servings of spice cake were weighed prior to the meal. Serving
67

weights of pizza and mixed vegetables were obtained by having a researcher enter the servingline at a random point, collect a tray intended for a student, and weigh the served portions.Two trays were collected in this way during each of the three lunch shifts. Serving weightsof milk were obtained by weighing the contents of five unopened whole milk cartons andeleven unopened chocolate milk cartons which had been returned as waste.
The purpose ol collecting aggregate selective plate waste at School 4 was to partiallyvalidate the method. Two separate samples of aggregate selective plate waste were collected.Nine people (the six lunchroom monitors, two people from the school system's nutritioneducation program, and one researcher) collected trays from students who had finished eating,put all food waste onto the plate, and returned trays to the dishroom. Plates were deliveredto a second researcher, who sorted plates into the two samples by alternately placing themon a table to the left or a table to the right. The third and fourth researchers selectivelyscraped separate samples, and counted and returned to the dishroom the plates they hadcompleted. Milk cartons were not identified with the meals with which they had been served,but they were otherwise sorted into two samples by means of the same procedure used forplates. Weighings of the samples from the two scrapers were kept separate.
School 5
School 5 was a regional high school for students in grades nine to 12 in a mid-sizedcollege town Lunches were prepared in bulk in an on-site kitchen and were served onnondisposable, compartmentalized trays. The kitchen served three 22-minute shifts in eachof two separate cafeterias, one for 477 freshman and sophomorec and one for 401 juniorsand seniors. Each cafeteria had one serving line for the hot entree, a second serving linefor fast foods including hamburgers, cheeseburgers, hot (ogs, and submarine sandwiches, anda self-serve salad bar which included at least eight sepvraz.e items plus dressings and condiments.Whole, chocolate, and coffee-flavored milk were available Students ate at square tables forfour. When finished eating, the students normadly dumped paper waste into trash cans andreturned their trays and utensils to the dishroom where food waste was scraped by kitchenworkers.
Because the two cafeterias at School 5 were in different locations, it was not feasibleto sample trays from both at the same time with the avail; ble research staff of four people.Therefore, aggregate selective plate waste was collected in only the junior-senior cafeteria.Kitchen workers indicated that approximately 450 to 500 students were expected to purchaselunch in the junior senior cafeteria. In an attempt to sample about 300 trays, two out ofevery three trays were sampled, using the recommended sampling procedures described inChapter 6. Actually, only 401 students were served, and only 263 trays were sampled. Totaltire required for scraping was measured from the time the first tray was brought to the waster1,sposal area until the time the last tray was scraped.
In two cases at School 5, exceptions were made in the general guidelines for wasteseparation. First, most salad bar components were not individually separated. Scraped togetherwere lettuce, cucumber, tomato, onion, bacon bits, cottage cheese, and salad dressings. Second,cores, seeds, and peels were not separated from the fresh apples and oranges. These exceptionswere made to save time, but depending on what price information is available, future researchersmay want to separate these items.
68
tI

AGGREGATE SELECTIVE PLATE WASTE RESULTS
Time Requirements
Time to scrape plates for aggregate selective plate waste was measured in three schools;
time to weigh the aggregates was measured in two schools. As Table 13 shows, the times
were fast and relatively uniform. Three or four researchers required under an hour and a
half to scrape between 244 and 310 plates. On the average, this was 46 to 55 plates perhour per person. At each school, the research team was finished scraping for aggregate selectiveplate waste within 10 minutes of the end cf the last lunch period.
Weighings required an average of just over half a minute each. The number of weighingsrequired depended mostly on the number of food items separated, with occasional multipleweighings required for heavy food items which were wasted in large amounts. Thus, in a
typical measurement situation, about 35 or fewer weighings would be expected, for a totaltime of 20 minutes or less. The high number of weighings (92) at School 1 occurred becauseof the high milk waste and the low maximum weight capacity of the scale.
In all the pretests, no major disruptions were caused in normal lunchroom routines, andno major delays were caused in normal dishroom or kitchen personnel schedules. Schoolcustodians usually waited 10 or 15 minutes to clean floors and empty trash containers whilethe last few weighings were being done.
In summary, a team of three or four researchers can expect to scrape approximately 300plates for aggregate selective plate waste during the hour and a half or two hours of operationof a typical school lunchroom, plus 20 minutes oi less for weighings and 30 minutes forpreparation and clean-up activities.
In contrast with aggregate selective plate waste, individual plate waste requires substantiallymore time to collect. No precise measurements of time to collect individual plate waste weremade as part of the pretests. However, the following observations were made. At School 1
on dfay 2, individual plate waste was measured for 100 trays. The research team of threepeople stopped at this number because of general fatigue after at least twoe hours and fifteenminutes, and because custodians had already been waiting at least a half hour to finish cleaningthe floors.
In a related study by a member of the NARADCOM research team, two researcherscollected individual plate waste using as rapid a procedure as possible. All food waste wasweighed in individual serving containers, which had constant weights to be subtracted later.Even this rapid procedure required approximately two hours for between 100 and 125 trays.Any further speeding of the procedure would seem to require more scales and more researchers.
Also, the rapid procedure is not applicable in the majority of lunchrooms, which do nct servefood items in separate containers, and it also requires a much longer data transformation stageto subtract all the separate container weights.
Based on these observations, it can be concluded that aggregate selective plate wastemeasures allow data to be collected from at least two or three times as many trays as is possiblewith individual plate waste measures.
69

Table 13. Time Requirements of Aggregate Selective Plate WasteCollection During Pretestinga
School
1 2 5
Number of Researchers 3 4 b 4
Number of Trays Scraped 244 310 263
Total Minutes for Scraping 88 8 4 c 86
Seconds per Tray 22 16 20
Trays per Hour per Person 55 55 46
Number of Weighings 92 31 -
Total Minutes for Weighing 49 16 --
Seconds per Weighing 32 31 -
Total Minutes Scrapingand Weighing 137 100
aln addition to the times listed, approximately 30 minutes were spent in
preparation and clean-up activities.
bOnly three people were involved in weighing.
cTotal busy time was 84 minutes, but an additional 27 minutes was spent waiting
for trays to begin coming in from the two later shifts.
/0

rIAmount of Waste
One product of the pretests was a set of data on amount of waste in the five schoolsvisited. Since these data are not directly related to the usability and validity of the method,they are not discussed here, but are presented in the Appendix.
Comparison of Two Samples
As was described above, at School 4, two researchers each collected separate samples ofaggregate selective plate waste. The samples were labeled left and right. To ensure that wastedfood items from students at each table in each lunch shift were approximately equallyrepresented in each sample, the sampling procedure was to sort every second plate and milkcarton t o each sample. The procedure resulted in a fairly accurate division, with only fivemore plates in the left sample than in the right sample. From the total of 539 plates and542 cartons of milk served, left and right samples received 272 and 267 plates, and 271 and271 cartons of milk, respectively.
Table 14 shows several characteristics of the waste collected for each of the six food
items in the two samples and overall. The approximate percent waste for each food item,shown in the rightmost column, was calculated as follows. Numbers of servings of each foodwere determined by counting empty serving containers after the waste had been collected.There were 539 plates on which pizza, vegetables, and cake had been served, 57 whole and485 chocolate milk cartons, and 404 paper cups in which pears had been served. The totalwaste in grams was divided by the number of servings. Then, dividing by the mean measuredserving weight gave the approximate percent waste.
Also shown in Table 14 are the grams of waste collected for each food item in eachsample. The figures for total grams waste are the sums of the grams of waste in the twosamples. Notice that mixed vegetables was the food item most wasted, both in terms of gramswaste (15873) and percent waste (80%). Approximately 17% of the whole white milk waswasted, but less than 10% of the other four food items was wasted.
The main reason for collecting two separate samples of aggregate selective plate waste
was to check on the accuracy of estimating total waste from a sample. Projected total wastefigures (in Table 14) were calculated from each sample for each food item. The method usedwas the one recommended in the aggregate selective plate waste method for estimating totalwaste when only the data from one sample are available; weight of waste in the sample wasmultiplied by the reciprocol of the proportion of plates or milk cartons in the sample. Theaccuracy of these projected totals was assessed by computing the percent error when comparedwith the obtained total waste.
In general, sample data provided good estimates of total waste. The three food itemsfor which the estimated total waste differed by the smallest percentages from actual total wastewere spice cake (1%), mixed vegetables (1.2%), and cheese pizza (8.4%). Somewhat worsepercent errors were obtained for the remaining three food items, canned pear halves (14.5%),whole milk (15.8%), and chocolate milk (17.7%). Worse estimates were not unexpected for
71

E
o co co r- 0)
C.C
14:N U 9 CQ r
, 0) W-o 0
0
4-4
Cu
0_ 0 0) c~- o wc
EL CD L) - M
10. Om . CoN)C 0E
00 0
0 0
-) -l co) ( CN C
0
o E _ D L c 4C- cc o (D wc c - E
LO - .CO 40.
0 a0
CC
N 0 ccr0cEu c- u )4
o2 o 3:
8- cc - cLL L) 2 G
72 )C

these three food items, because all three had low overall percent waste and high variabilityof individual plate waste. Milk waste was known to be difficult to estimate (see sectionson individual plate waste variability in Chapter 4 and the following section). Informalobservations while data were being collected at School 4 showed that waste of canned pearhalves was also highly variable. Not all students received pears, and a great deal of tradingof pear servings was observed.
In sum, the comparison of two separate samples supports the validity of the aggregateselective plate waste procedure. In a lunchroom serving 539 students, reasonably accurateestimates of total waste were obtained from samples of approximately half of the trays. Asexpected, food items for which estimates were worst all had high variability of individual platewaste and low overall waste. It should also be noted that in order to collect two samplesof approximately equal size, fewer than 300 trays were sampled in each. Were the recommended300 trays to be collected in a single sample, estimates of total waste would be expected tobe even more accurate.
INDIVIDUAL PLATE WASTE VARIABILITY
Data on the variability of individual plate waste were collected at School 1 for 100 studentsand at School 3 for 38 students. The main reason for this comparison was to verify thatplate waste variability obtained from the summer programs described in Chapter 4 is alsorepresentative of plate waste variability in actual school lunch programs. Menus differed widelybetween the summer programs and the school programs tested; therefore it is not appropriateto compare specific food items. Instead, general characteristics of amount and variability ofplate waste will be compared.
Table 15 shows the mean waste in grams and the variance for each of the 26 food itemsmeasured at School I and at School 3. Comparable figures for the summer programs werepresented in Table 5. Mea- waste in the school programs ranged from 0.1 to 82.1 grams,as compared with a range of 0.3 to 68.2 grams in the summer programs. Variances in theschool programs ranged from 1.1 to 8662.0 grams squared, as compared with a range of 0.6to 6826.6 grams squared in the summer programs.
Of more relevance is the translation of these means and variances into required samplesizes, standard errors, and relative standard errors Table 15 shows the sample sizes requiredin a population of 500 for the standard error of the mean to be within 10% of the mean.Comparable figures for the summer programs were presented in Table 5. Required samplesize was less than 300 for 16 of the 26 food items tested. The food items for which a largersample size would be required were always food items with a very low amount of waste -apple sauce and components of sandwiches, which were chosen by very few students, potatochips, and liquids such as skim milk, fruit punch, and apple juice.
Table 15 also shows expected standard errors of the mean, expressed both in grams andas a proportion of the mean, if 300 trays were sampled from a population of 500. Comparablefigures for the summer programs were presented in Table 7 and Table 8. The most important
finding to notice here concerns the ten foods listed above which would require a sample size
73

Table 15. Means and Variances of Individual Plate Waste, RequiredSample Sizes, and Standard Errors for Food Items at
School 1 and School 3
Standard ErrorsMean Sample Size of the Mean whenWaste Required for N=500 and n=300
Food Item in Grams Variance N=500 Gramsb Proportion
School 1:Spaghetti 24.1 1479.5 169 '.40 0.058Carrots 11.3 179.8 111 0.49 0.043Roll & Butter 5.3 94.3 202 0.35 0.067Sandwich 1, Bread 0.9 21.7 423 0.17 0.191
Ham 0.2 1.1 435 0.04 0.211Cheese 0.3 4.4 451 0.08 0.248
Peanut Butter &Jelly Sandwich 1.2 65.3 452 0.30 0.250
Peanut Butter &Fluff Sandwich 1.1 26.9 413 0.19 0.177
Sub Sandwich, Roll 6.9 244.7 253 0.57 0.083Chopped Salad 3.6 55.7 229 0.27 0.075Cheese 2.2 30.8 278 0.20 0.091Ham 3.3 54.1 253 0.27 0.083Bologna 2.8 42.3 262 0.24 0.086
Cake 6.4 179.7 232 0.49 0.076Apple Sauce 0.1 1.2 461 0.04 0.280Pickles 1.6 15.0 264 0.14 0.086Potato Chips 1.0 11.5 347 0.12 0.123Milk, Whole 82.1 8662.0 103 3.40 0.041Milk, Skim 22.4 4050.1 310 2.32 0.104Fruit Punch 3.6 195.8 374 0.51 0.140
School 3:Hamburger 9.6 312.7 204 0.65 0.068Bun & Cheese 15.1 478.7 149 0.80 0.053Peaches 31.2 1289.9 105 1.31 0.042Apple Juice 4.1 205.9 355 0.52 0.128Milk, Wholea 70.0 6172.0 101 2.87 0.041Milk, Chocolate a 41.8 5099.7 211 2.61 0.063
aChocolate and whole milk calculations were based only on the numbers of cartons of each flavor
of milk served.
bStandard errors of the total waste can be obtained by multiplying standard errors of the mean in
grams by 300.
74

of over 300. When only 300 trays are sampled, standard errors exceed 10% of the mean.For six of the ten foods, the standard errors are less than 20% of the mean, and in no casedoes the standard error exceed 28% of the mean. Since these ten foods all had very lowmean waste in grams, the higher proportion standard error corresponds to a very low standarderror in grams.
To summarize, data on individual plate waste variability in school lunches necessitate nochanges in the conclusions drawn on the basis of data from the summer programs. In Table 16,the two sets of data are combined and summarized on several characteristics, assuming apopulation size of 500 trays. Site A and School 3 had menus with no choice, servedprepackaged. Of the 18 food items served, 16 required sample sizes of less than 300 forthe standard errors to be within 10% of the mean. More variability of waste was observedat Site B and School 1, which offered a choice among more food items, served in bulk. Ofthe 44 food items measured, 22 required sample sizes of less than 300. Table 16 also showsthat the ranges of sample sizes required and standard errors are similar for summer programsand school programs. Required sample sizes and standard errors expressed as proportions tendto have higher upper values in programs which offered menu choices, served in bulk.
CONCLUSION
In .neneral, pretests of the aggregate selective plate waste method showed it to be usablein a broad range of school lunch settings, including prepackaged aid bulk service, small andlarge lunchroom populations, and students in grades 1 through 12. Over the course ofpretesting, procedures were modified slightly to improve their efficiency. The recommendedprocedures for measuring aggregate selective plate waste are presented in Chapter 6.
Aggregate selective plate waste measurement was found to be much faster than individualplate waste measurement. A team of three or four researchers can expect to collect wastefrom 300 plates during the hour and a half or two hours of typical lunchroom operation.An additional 30 to 50 minutes may be required for preparation, weighing, and clean-upactivities.
In lunchrooms serving more than 300 students, it is recommended that approximately300 plates be sampled. Measures of individual plate waste and the comparison of two separatesamples of aggregate selective plate waste showed that 300 plates will provide an acceptablelevel of accuracy in estimating waste in larger lunchroom populations.
75

0 LO Oo 0 0
o 00 01 01 0D 6
C CNr C
0
LA
T
V A - L LO -1 -
0
0 - (N n -o Cl r-. CD
00CLC
00
0
E- 0 0
L.A C LA LA r- .-T.- E 0~ I 11c
En 0
o E)
c6 a)
E) -0
0
c - c a
0l m Cl
~E0 0 -
76

CHAPTER 6
RECOMMENDED PROCEDURES FOR MEASURINGAGGREGATE SELECTIVE PLATE WASTE
The procedures described here are to be used in studies of plate waste in school lunchrooms.They have oeen designed to provide information as accurate as practicable on the absoluteweight or cost of the waste of specific food items. Aggregate selective plate waste is appropriateto use in answering questions such as the following.
* How much of a specific food item is wasted?
How much does student plate waste cost?
What percent of food is wasted? (In this case, in addition to weighing plate waste,food must be weighed before serving.)
* When large numbers of schools are compared, what factors influence the amount ofplate waste (e.g., type of serving system, age range of students, number of menuchoices, etc.)?
For some questions involving amount of waste, individual plate waste measures are moreappropriate than aggregate plate waste measures. For example, individual plate waste shouldbe used if a school wishes to compare waste for two methods of food preparation, for differentage groups within the school, or before and after a nutrition education pioject. Guidelinesfor measuring individual plate waste have been published by USDA (1975(b)). 6 The guidelinesfor measuring aggregate selective plate waste presented here follow the same general outline,with necessary modifications in the details of the procedures.
STAFF
The procedures for aggregate selective plate waste measurement require at least two people.Three or four people greatly speed the process and may be essential in schools where thevolume of trays being returned at one time is high. In occasional schools with more thanone tray return area, even more people may be required. Typical divisions of duties duringthe actual collection and scraping of trays are as follows.
Two People: Person A samples and delivers trays to be scraped, counting and returningcompleted trays to the dishroom as time permits.Person B scrapes and separates plate waste.
86USDA/F NS. General guidelines for determining food acceptability, 1975(b).
77

Three People: Person A samples and delivers trays to be scraped.Person B scrapes and separates plate waste.Person C helps scrape plates, and counts and returns completed trays to
the dishroom.
Four People: Person A samples trays to be scraped.Person B delivers trays to be scraped and removes paper and liquid waste.Person C scrapes and separates plate waste.Person D helps scrape plates, and counts and returns completed trays to
the dishroom.
Notice that it is recommended that trays not be counted until after they have been scraped.
This procedure reduces the burden on Person A, who needs to devote full attention to receivingincoming trays.
EQUIPMENT
The following equipment is recommended, It should be assembled and set up well beforethe start of the meal for which waste is to be measured.
1. Tables and racks near the tray return area
Tables must be large enough to hold all the containers for food item waste inpositions convenient for scraping.
Tables must also be large enough to hold many trays waiting to be scraped and
trays waiting to be returned to the dishroom.
* If space for tables is limited, racks to hold trays waiting to be scraped are alsouseful.
2. Containers into which to scrape waste
Number ten cans with Ziploc bags (gallon size) as liners work well.
* At least one container is required for each food item to be separated, but manyitems will require more than one container. Bring plenty of - ... .
* The empty weight of each container should be measured f rt - -1 rrior tothe meal.
3. Scales for weighing the aggregate selective plate waste
' Ideal scales measure to the nearest gram with a capacity of 5000 grams,
4. Rubber spatulas
Bring at least one for each person who will be scraping.
78

5. Aprons or lab coats for all people involved in collecting data
6. Forms (see Figure 2), pencils, and clipboard for data recording
7. Paper towels and sponges for clean-up
SAMPLING PROCEDURES
In order to obtain an accurate weight of food waste, it is recommended that the wastefrom approximately 300 trays be weighed. In schools with 300 or fewer students eating theschool -prepared meal, all trays should be collected for weighing. In schools with more than300 students, a large enough proportion of the trays should be collected to ensure that a sampleof at least 300 trays is collected for weighing.
It is important to use a procedure for collecting trays which gives every tray an equalchance of being in the sample. Sampling procedures should be determined by the followingthree steps.
1. Determine the number of students expected to be served.
The food service director or the lunchroom cashier can usually provide thisinformation,
2. Determine the sampling ratio.
a. If the number of s-LICcntS is 300 or fewer, the sampling ratio is 1. All traysshould be collected for weighIrigt .
b. If the number of stidents is over 300, the sampling ratio should be determinedby onc of the iollowing two methous.
Method I Consult Table 17
in the fhist COLu-'Mn, locae ne r rang; which includes the number of studentsyou ex;ect to he sL 'red. Read across to the recommended sampling ratio inthe second column. For exaimpie, ii 850 students were to be served, 3/8 oftre trays should hi I:olected tot weighing.
Method 2 - Compute directly
Divide 300 by the number of students expected to be served. Round up tothe nearest simple traction which ensures a sample size of 300. For example,300 divided by 850 expected students is 0.353. This can be rounded up to3/8 (0.375).
79

School: Town: DateNumber of trays sampled ____ Sampling procedure:Number of trays served
Description of Container Weight WasteFood Item Preparation Cost Full Empty Weight
2. _ _ _ __ _ _ _ _ _
4.__ _ _ _ _ _ _ _ _ _ _ _ _ _
9.
80.
11.
12. _ _ _ _ _ _ _ _ _ _ _ _ _ _
13.
14.
15.
16.
17.
18.
19.
20.
21.
22.
23.__ _ _ _ __ _ _ __ _ _ _ __ _ _ _ _
Figure 2
Sample Form for RecordingAggregate Selective Plate Waste Data
80
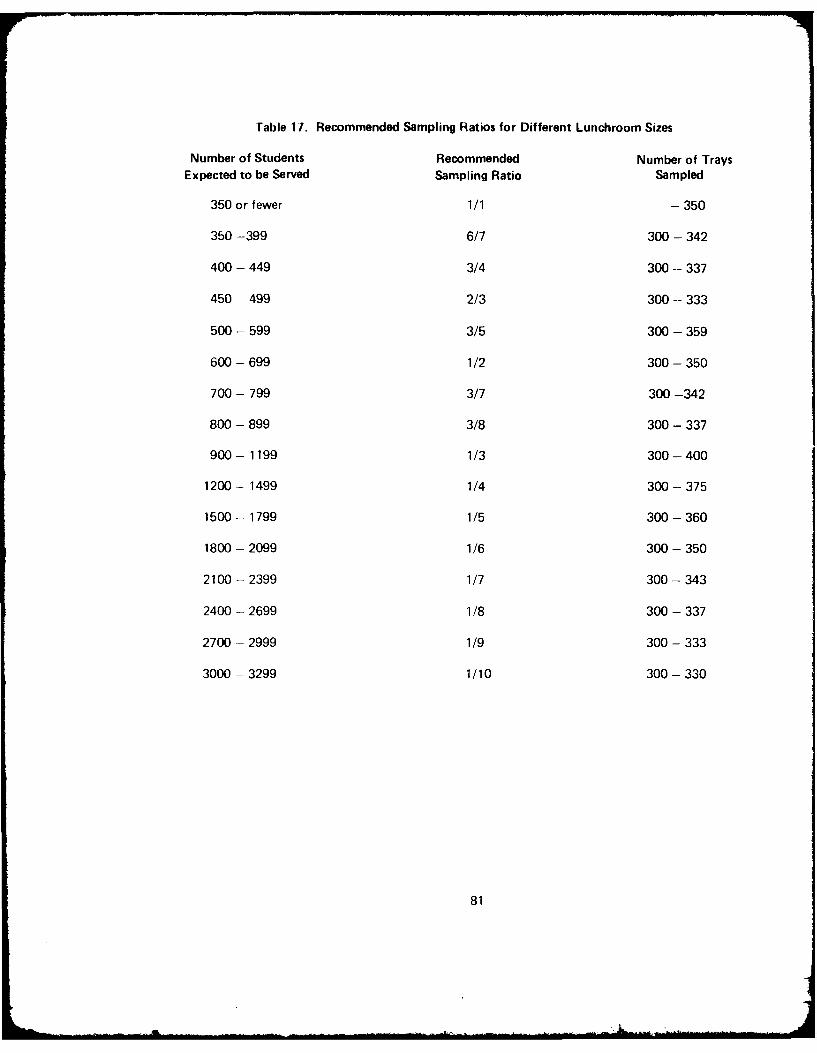
Table 17. Recommended Sampling Ratios for Different Lunchroom Sizes
Number of Students Recommended Number of TraysExpected to be Served Sampling Ratio Sampled
350 or fewer 1/1 -350
350 -399 6/7 300 - 342
400 - 449 3/4 300 - 337
450-- 499 2/3 300 -- 333
500 - 599 3/5 300 - 359
600 -699 1/2 300-350
700- 799 3/7 300-342
800-899 3/8 300-337
900- 1199 1/3 300-400
1200- 1499 1/4 300-375
1500-- 1799 1/5 300-360
1800-2099 1/6 300-350
2100-2399 1/7 300-343
2400-2699 1/8 300-337
2700-2999 1/9 300-333
3000-3299 1/10 300-330
81

c. The sampling ratio determines a sampling cycle, which should be used as follows
to select trays for weighing. The numerator indicates the number of trays tobe sampled in a row, and the denominator indicates the total number of traysin the cycle to count before sampling again. For example, if the sampling ratiois 3/8, 3 trays should be sampled from every 8, or 3 sampled, 5 not sampled,3 sampled, 5 not sampled, etc. This sampling cycle may be schematicallyillustrated SSSNNNNN.
3. Determine the starting position in the sampling cycle.
Use a table of random numbers to select a number between 1 and the denominatorof the sampling ratio. This random number indicates the starting position in thesampling cycle. When the first tray is returned to the dishroom by a student, thesampling cycle should be initiated at the starting position. For example, if thesampling ratio is 3/8, a random number should be found between 1 and 8. Supposethe random number is 5. Then the starting position is the 5th position in the samplingcycle, shown underlined in this schematic illustration: SSSNNNNN. The first trayreturned to the dishroom would be the 5th tray in the cycle and should not besampled. The next 3 trays should also not be sampled, then the cycle should restartwith 3 trays sampled. Once the sampling procedure has been determined, it shouldbe recorded on a form such as the one shown in Figure 2.
SCRAPING AND WEIGHING PROCEDURES
Before the start of the meal, researchers must determine which foods will be collectedand weighed separately. A detailed menu should be obtained from the kitchen supervisor.Items such as condiments, different components of composite foods, and milk choices shouldall be listed separately on a form such as the one illustrated on Figure 2. Since differentcomponents of a menu item may cost different amounts, it is important to separate as manycomponents as can be done accurately without excessive labor. The follcwing are examplesof recommended separation procedures.
1. DO separate
Hot dogs from buns
Sandwich fillings from bread (when not too much filling soaks into the bread)
Green beans from mashed potatoes, where these were served as separate menuitems
2. PARTIALLY separate
Submarine sandwiches into major components, such as roll plus butter, chopped
mixed salad items, cheese, cold cuts
82

3. DO NOT separate components of
Spaghetti and sauce
Casseroles
Pizza
Sandwiches in which the filling is very hard to separate accurately from the bread,such as peanut butter and jelly, grilled cheese
Foods with sauces or condiments mixed or soaked in, such as buttered bread,dressing on salad, meat and gravy
Soups
Frosting and cake
Mixed vegetables, where they are served as one menu item
Vegetables and fruits with their juices
* Tossed salad components
Once the separation procedures have been determined, the number of containers requiredto collect the waste should be placed on the waste-collection tables. As student trays in thesample are returned to the dishroom, all edible food waste should be scraped from the traysand dishes.
Discard nonfood items such as straws, napkins, and utensils.
Use a ribber sprtula tc scrape plates thoroughly.
Empty all individually packiged foids, such as milk, condiments, and potato chips-
Ideally, only the portion of any food item that is normally considered edible shoud beweighed. Inedible food waste should not be included in the weight of the waste.
1. Items to be weighed
The following components are' usually considered edible, even though some students
may not them. They should be weighed with the accompanying food item.
Fruit pt:, from apples, grapes, peaches, and pears
Fruit cores from apples and pears
83

Granishes such as pickles, bacon bits, pimento
Skins from chicken and turkey
Meat fat
Gravies, sauces, cooking liquids
Bread crusts
2. Items NOT to be weighed
The following items are not usually considered edible. Whenever possible, they shouldbe separated and discarded before the accompanying food item is weighed.
Bones
Fruit peels and skins from bananas, oranges, and grapefruit
Pits, seeds, and stems
3. Items to be estimated and subtracted from total weight
Some inedible food portions may require too much time to accurately separate fromthe edible portions. Items for which this is likely include chicken bones and somefruit pits, peels, and seeds. If the researchers judge that this is the case, the weightof the inedible portion may be estimated as follows.
a. Obtain a count of the number of portions of the food item served. For example,suppose 200 students were served chicken.
b, Separate and weigh the inedible parts of a sample of these servings. For example,randomly collect 10 or more trays throughout the lunch period and carefullycut the chicken off the bones.
c. Estimate the total weight of the inedible portions by calculating the mean weightof the inedible portions and multiplying by the total number of servings. Forexample, if 10 servings of chicken had bone weights totalling 300 grams, meanbone weight would be 30 grams. Estimated total bone weight for 200 studentswould be 6000 grams.
d. Chicken waste from the lunchroom should then be weighed with bones andthe estimated bone weight subtracted.
84

When the meal is completed and all the sampled trays have been selectively scraped, theaggregate selective plate waste should be weighed in the containers and recorded on a formsuch as the one shown in Figure 2. Container weights should then be subtracted to calculatenet weight of plate waste for each food itern.
ADDITIONAL IMPLEMENTATION RECOMMENDATIONS
The general procedures for measuring aggregate selective plate waste have been describedabove. In addition, there are three specific recommendations which will help ensure thatmeasures of plate waste are as accurate as possible.
First, researchers should consider collecting milk and juice waste from all trays, even whenonly a sample of trays is used for other food items. The reason for this recommendationis that waste from milk and other liquids such as juice has consistently shown high variability,and therefore requires large sample sizes to estimate accurately. Since milk and juice are servedin separate containers, it should be relatively easy to remove them from trays, regardless ofwhether other food items are to be sampled or not.
Second, 300 trays should not be considered a ceiling; re3earchers should scrape as manytrays as possible. If a team of researchers can scrape more rapidly than the estimates presentedin this report suggest, then more trays should be scraped.
Third, the set of schools in which aggregate selective plate . ste is measured shouldprobably be chosen to include a somewhat disproportionately large number of large schoolswith many menu choices. The rationale for this recommendation is as follows. The overallgoal is to measure plate waste in national school lunch and school breakfast programs in differenttypes of schools across the country. To obtain measures of plate waste as accurate as possiblefor each type of school, more schools need to be sampled the more variable the measuresare expected to be. Measures of plate waste will tend to be more variable in larger schoolswith more menu choices, and therefore more such schools should be included in the nationalsample.
This document reports research undertaken at
the US Army Natick Research and Develop-ment Command and has been assigned No.NATICK/TR- _ zi/,L in the series of re-ports approved for publication.
85

REFERENCES
Acredolo, L.P. and H.L. Pick. Evaluation of a school lunch program. Psychological Reports,1975, 37, 331-332.
Altschul, A.M. Studies in school lunch waste - A literature review and evaluation. USDA/FNSContract 557-FNS-76, 1976.
Augustine, G., M. McKinley, S.L. Laughlin, E.L. James and E. Eppright. Nutritional adequacy,cost and acceptability of lunches in an Iowa school lunch program. Journal of the AmericanDietetic Association, 1950, 26, 654-662.
Bell, C.G. and M.W. Lamb. Nutrition education and dietary behavior of fifth graders. Journalof Nutrition Education, 1973, 5, 196-199.
Brine, C.L. and E.B. Tate. Effect of food losses on nutritive content of diets in four institutions.Journal of the American Dietetic Association, 1956, 32, 19-23.
Bryan, M.S. and M.E. Lowenberg. The father's influence on young children's food preferences.Journal of the American Dietetic Association, 1958, 34, 30-35.
Carver, A.F. and M.B. Patton. Plate waste in a school lunch, I. Overall waste. Journal ofthe American Dietetic Association, 1958, 34, 615-618.
Chmielinski, H.E. and M.A. White. Plate Waste Index: An observational measure of schoolfood waste. Teachers College, Columbia University, 1978.
Cochran, W.G. Sampling Techniques. New York: Wiley, 1953.
Determining what's going down or out. School Foodservice Journal, 1976, 30 (Sept), 65--70.
Ellis, B.H. Preference testing methodology. Food Technology, 1968, 32 (May), 49-56.
Food preference surveys help cut plate waste. School Foodservice Journal, 1978, 32 (Sept.),21.
Guthrie, H.A. Effect of a flavored milk option in a school lunch program. Journal of theAmerican Dietetic Association, 1977, 71, 25-30.
Hageman, M.I. A study of plate waste as a directive measure in food conservation: Part I.Journal of the American Dietetic Association. 1945, 21, 608-610.
Hageman, M.I. A study of plate waste as a directive measure in food conservation: Part I1.Journal of the American Dietetic Association, 1945, 21, 685-689.
Harper, J.M. and G.R. Jansen. Phase II Report; Comparison of Type A and NSM menus inthe National School Lunch Program. USDA/FNS Contract 12-35-600-85, 1973.
87

Harrison, G.G., W.L. Rathje and W.W. Hughes. Food waste behavior in an urban population.Journal of Nutrition Education, 1975, 7(1), 13-16.
Head, M.K., F.G. Giesbrecht and G.N. Johnson. Food acceptability research: Comparativeutility of three types of data from school children. Journal of Food Science, 1977, 42,246-251.
Head, M.K. and R.J. Weeks. Conventional vs. formulated foods in school lunches. II. Costof food served, eaten and wasted. Journal of the American Dietetic Association, 1977b,71, 629-632.
Head, M.K. and R.J. Weeks. Major nutrients in the Type A lunch. II. Amounts consumedby students. Journal of the American Dietetic Association, 1975, 67, 356-360.
Hunt, F.E., M.B. Patton and A.F. Carver. Plate waste in a school lunch Ill. Vegetable acceptancestudy. Journal of the American Dietetic Association, 1958, 34, 810-813.
Ireton, C.L. and H.A. Guthrie. Modification of vegetable-eating behavior in preschool children.Journal of Nutrition Education, 1972, 4, 100-103.
Jansen, G.R. and J.M. Harper. Consumption and plate waste of menu items served in theNational School Lunch Program. Journal of the American Dietetic Association, 1978, 73,395-400.
Jansen, G.R., J.M. Harper, A.L. Frey, R.H. Crews, C.T. Shigetomi and J.B. Lough. Comparisonof Type A and nutrient standard menus for school lunch. Ill. Nutritive content of menusand acceptability. Journal of the American Dietetic Association, 1975, 66, 254--261.
Jones, L.V., D.R. Peryam and L.L. Thurstone. Development of a scale for measuring soldiers'food preferences. Food Research, 1955, 20, 512-520.
Kish, L. Survey Sampling. New York: Wiley, 1965.
LaChance, P.A. Simple research techniques for school foodservice. Part I: Acceptance testing.School Foodservice Journal, 1976, 30 (Sept), 54-61.
LaChance, P.A. Simple research techniques for school foodservice. Part II: Measuring platewaste. School Foodservice Journal, 1976, 30 (Oct), 67-76.
Lamb, M.W. and B. Ling. An analysis of food consumption and preferences of nursery schoolchildren. Child Development, 1946, 17, 187-217.
Litman, T.J., J.P. Cooney, Jr. and R. Stief. The views for Minnesota school children on food.Journal of the American Dietetic A sociation, 1964, 45, 433-440.
88

Marshall, M.M. An inquiry into the food attitudes characteristics of the children in the Menandsschool. M.S. Thesis, University of Massachusetts, 1956.
Meiselman, H.L., W. Van Horne, B. Hazenzahl and T. Wehrly. The 1971 Fort Lewis FoodPreference Survey. NARADCOM Technical Report, TR-72-43-PR, 1971.
Meredith, A., A. Matthews, M. Zickefoose, E. Weagley, M. Wayave and E.G. Brown. Howwell do school children recall what they have eaten? Journal of the American DieteticAssociation, 1951, 27, 749-751.
Mirone, L. and L.G. Harvey. A new menu pattern is tested. Journal of the American DieteticAssociation, 1954, 30, 757-761.
O'Connor, M.A. Preference maximized school lunch menu planning. M.S. Thesis, Universityof Massachusetts, 1975.
Patton, M.B., A.F. Carver and F.E. Hunt. Plate waste in a school lunch. II. Sources of waste.Journal of the American Dietetic Association, 1958, 34, 733-737.
Peryam, D.R. and F.J. Pilgrim. Hedonic scale method of measuring food preferences. FoodTechnology, 1957, 11, 9-14 (following page 472).
Pilgrim, F.J. What foods do people accept or reject? Journal of the American DieteticAssociation, 1961, 38, 439-443.
Rathje, W.L. and G.G. Harrison. Monitoring trends in food utilization: application of anarcheological method. Federation Proceedings, 1978, 37(1), 50-54.
Robinson, J.S. Special milk program evaluation and National School Lunch Program survey.USDA/FNS: 1978, 52-57.
Sando, L.G. and M.B. Patton. Lunch programs in Ohio Public Schools. Journal of the AmericanDietetic Association, 1951, 27, 285-288.
Schorr, B.C., D. Sanjur and E.C. Erickson. Teen-age food habits. Journal of the AmericanDietetic Association, 1972, 61(4), 415-420.
Schuh, D.D., A.N. Moore and B.H. Tuthill. Measuring food acceptability by frequency ratings.Journal of the American Dietetic Association, 1967, 51, 340-343.
Smutz, E.R., H.L. Jacobs, D. Waterman and M. Caldwell. Small sample studies of food habits:I. The relationship between food preference and food choice in naval enlisted personnelat the Naval Construction Battalion Center, Davisville, RI, Natick, MA: NARADCOM, 1974,Technical Report 75-52-FSL.
89

Sullins, W.R., L.E. Symington, J.R. Siebold and J.G. Rogers. Food preference, acceptance,and consumption in a simulated, isolated-duty station. Natick, MA, NARADCOM, 1977.Technical Report Natick/TR-78/027.
USDA/FNS. Comparison of Type A and Computer assisted nutrient standard menus. DateCounty Public Schools. Contract No. 12-35-600-116, 1975.
USDA/FNS. General guidelines for determining food acceptability. 1975.
USDA/FNS. Comparison of Type A and Nutrient Standard Menus. Memphis City Schools.Contract No. 12-35-600-115, 1975.
USDA/FNS. Pilot study to assess, audit, and evaluate food delivery systems used in schoolfood service. Contract No. 12-35-600-183, 1976,
USDA/FNS. Food consumption in the National School Lunch Program. 1978a.
USDA/FNS. Pilot study to compare Type A lunches with alternative subsidized lunches amonghigh school students. Contract No. 12-35-600-351, 1978b.
Waterman, D., H. Meiselman, T. Reed, L. Symington and L. Branch. Food Preferences ofAir Force enlisted personnel. NARADCOM Technical Report 75-51-FSL, Natick, 1974.
What's wrong with school lunch. School Lunch Journal, 1971, May 1971, 42-51.
Young, C.M., F.W. Chalmers, H.N. Church, M.M. Clayton, G.C. Murphy and R.E. Tucker.Subjects estimation of food intake and calculated nutritive value of the diet. Journal ofthe American Dietetic Association, 1953, 29, 1216-1220.
Young, C.M. and T.D. LaFortune. Effect of food preferences on nutrient intake. Journalof the American Dietetic Association, 1957, 33, 98-103.
90
11

BIBLIOGRAPHY
Abramson, J.A., C. Slome and C. Kosovsky. Food frequency interview as an epidemologicalfood. American Journal of Public Health, 1963, 7, 1093-1101.
Acheson, K.J., I.T. Campbell, O.G. Edholm, D.S. Miller and M.J. Stock. The measurementof food and energy intake in man - an evaluation of some techniques. American Journalof Clinical Nutrition, 1979, (In press).
Beal, V.A. Nutritional intake of children, I. Calories, carbohydrate, fat and protein. Journalof Nutrition, 1953, 50, 223-234.
Bender, A.E., P. Magee and A.H. Nash. Survey of school meals. British Medical Journal,1972, 2, 383-385.
Beyer, N.R. The food habits and nutrient intake of elementary school children: a longitudinalapproach. M.S. Thesis, Michigan State University, 1972.
Beyer, N.R. and P.M. Morris. Food attitudes and snacking patterns of young children. Journalof Nutrition Education, 1976, 6, 131-133.
Bosley, B. A practical approach to nutrition education for children. Journal of the AmericanDietetic Association, 1947, 23, 304-309.
Boysen, S.C. and R.A. Ahrens. Nutrition instruction and lunch surveys with second graders.Journal of Nutrition Education, 1972, 4, 172-175.
Breckenridge, M.E. Food attitudes of five-to-twelve-year-old children. Journal of the AmericanDietetic Association, 1959, 35, 704-709.
Burk, M.C. and E.M. Pao. Methodology for large-scale surveys of household and individualdiets. Home Economics Report Number 40, DC:USGPO, 1976.
Burke, B.S. The dietary history as a tool in research. Journal of the American DieteticAssociation, 1947, 23, 1041-1046.
Chalmers, F.W., M.M. Clayton, L.W. Gates, R.E. Tucker, A.W. Wertz, C.M. Young and W.D.Foster. The dietary record - how many and which days. Journal of the American DieteticAssociation, 1952, 28, 711-717.
Christakis, G., A. Miridjanian, L. Nath, H.S. Khurana, C. Cowell, M. Archer, 0. Frank, H.Ziffer, H. Beher and G. James. A nutritional epidemiological investigation of 642 New YorkCity Children. American Journal of Clinical Nutrition, 1968, 21, 107-126.
D'Arezzo, P.M. Person-to-person. Food and Nutrition, 1975, 5, 10-13.
91

Emmons, L. and M. Hayes. Accuracy of 24 hour recalls of young children. Journal of theAmerican Dietetic Association, 1973, 62, 409-414.
Emmons, L., M. Hayes and D.L. Call. The Lunch Bunch study. School Foodservice Journal,1972, 26 (Sept.), 25--29.
Emmons, L., IVI. Hayes and D.L. Call. Summary and conclusions from the final report ofa study to determine the nutritional and economic need for free lunches and to measurethe effect of receiving school breakfasts and/or lunches on the nutritional status of children.The Lunch Bunch study. Photocopy, 1972.
Eppright, E.S., M.B. Patton, A.L. Marlatt and M.L. Hathaway. Dietary study methods, V.Some problems in collecting dietary information about groups of children. Journal of theAmerican Dietetic Association, 1952, 28, 43-48.
Eppright, E.S. and P.P. Swansen. Distribution of nutrients among meals and snacks of Iowaschool children. Journal of the American Dietetic Association, 1955, 31, 256-260.
Eppright, E.S. et al. Nutrition of 9-, 10-, and 11-year-old public school children in Iowa,KanF is and Ohio. I. Dietary Findings. Iowa Agricultural Experimental Station ResearchBulletin 434, North Central Regional Publication No. 59, 1955, 613-631.
Gersovitz, M., J.P. Madden and H.S. Wright. Validity of the 24-hour dietary recall and seven-dayrecord for group comparisons. Journal of the American Dietetic Association, 1978, 73,48-55.
Harper, J.M. and G.R. Jansen. Two off-line computer assisted nutrient standard menu planningtechniques. USDA/FNA Contract 12-35-600-85, 1972.
Head, M.K. and R.J. Weeks. Conventional vs. formulated foods in school lunches. I. Comparisonof student's food and nutrient intakes. Journal of the American Dietetic Association, 1977a,71, 116--123.
Head, M.K., R.J. Weeks and E. Gibbs. Major nutrients in the Type A lunch. I. Analysedand calculated values of meals served. Journal of the American Dietetic Association, 1973,63, 620-625.
Hoagland, G.W. The impact of federal child nutrition programs on the nutrition status ofchildren. Paper presented before the Southern Economic Association Meeting, Washington,DC, November 1978.
Houser, H.B. and H.T. Bebb. Individual variations in Intake of Nutrients by day, month andseason and relation to meal patterns: implications for dietary survey methodology.Presentation before Workshop on Evaluation of Methods of obtaining food consumption data,Washington, DC, 8-19 November 1978.
92

Huenemann, R.L. and D. Turner. Methods of dietary investigation. Journal of the AmericanDietetic Association, 1942, 18, 562-568.
Hunt, I.F., L.S. Luke, N.J. Murphy, V.A. Clark and A.H. Coulson. Nutrient estimates fromcomputerized questionnaires vs. 24-hour recall interviews. Journal of the American DieteticAssociation, 1979, 74, 656-659.
1Ig, F.L. The child's idea of what and how to eat. Journal of the American Dietetic Association,1948, 24, 658-660.
Jenkins, D.D. Plate waste - views on a complex issue. Food and Nutrition, 1976, 6(5),10-11.
Lowenberg, M.E. Food preferences of young children. Journal of the American DieteticAssociation, 1948, 24, 430-434.
Lund, L.A. and M.C. Burk. A Multidisciplinary Analysis of Children's Food ConsumptionBehavior. Agricultural Experimental Station, University of Minnesota Technical Bulletin 265,1969.
Marr, J.W. Individual dietary surveys. Purposes and Methods. World Review of Nutritionand Dietetics, 1971, 13, 105-164.
Odland, L.M., L. Page and L.P. Gould. Nutrient intakes and food habits of Montana students.Journal of the American Dietetic Association, 1955, 31, 1134-1142.
Owens, L. and G. Sando. Observations of food acceptance during mental illness. Journalof the American Dietetic Association, 1954, 30, 1110-1114.
Plate waste: Part I. School Foodservice Journal, 1976, 30 (Sept), 50-51.
Project Waste. School Foodservice Journal, 1976, 30 (Oct.), 80-81.
Rich, L. How MUNCH changed lunch at Oakham. American Education, 1978, 14(8), 24-29.
Richardson, D.P. and M. Lawson. Nutritional value of midday meals of senior school children.British Medical Journal, 1972, 4, 697-699.
Ruppenthal, B. and W. Hogue. Playground and plate waste. School Foodservice Journal, 1977,31 (Apr.), 66.
Ruppenthal, B. Playgrounds and plate waste. School Foodservice Journal, 1978, 32 (July/Aug),145-147.
Samuelson, G. An epidemiological study of child health and nutrition in a Northern SwedenCounty. I! Methodological study of the recall technique. Nutrition and Metabolism, 1970,12(6), 321-340.
93

Schnakenberg, D.D. The Impact of Novel Military Feeding System on Dining Hall Attendance,Plate Waste, Food Selection and Nutrient Intake. Presentation at Food Acceptance Panel,National Conference, School Lunch Program Directors Meeting, El Paso, TX, 7 December1976.
Skeel, A.B. Factors in food acceptance. School Lunch Journal, 1960, 14, 32-33.
Steele, B.F., R.E. Fran.iin, V.L. Smudski and C.M. Young. Use of checked seven-day recordsin a dietary survey. Journal of the American Dietetic Association, 1951, 27, 957-959.
Steele, B.F., V.L. Smudski, R.E. Franklin and C.M. Young. Comparison between three methodsof assessing nutrient intake of children. Massachusetts Agricultural Experimental StationBulletin 469, 1952, 59-62.
Thomas, R.V., M.M. Rutledge, E.F. Beach, E.Z. Moyer, M.C. Drummond, S. Miller, A.R.Robinson, O.N. Miller, M.N. Coryell and I.G. Macy. Nutritional status of children. XIII.Accuracy of calculated intakes of food components with respect to analytical values. Journalof the American Dietetic Association, 1950, 26, 889-896.
Trulson, M.F. Assessment of dietary study methods. I. Comparison of methods for obtainingdata for clinical work. Journal of the American Dietetic Association, 1954, 30, 991-995.
Trulson, MF. Assessment of dietary study methods. II. Variability of eating practices anddetermination of sample size and duration of dietary surveys. Journal of the AmericanDietetic Association, 1955, 31, 797-802.
Trulson, M., D.M. Hegsted and F.J. Stare. New York State Nutrition Survey. I. A nutritionsurvey of public school children. Journal of the American Dietetic Association, 1949, 25,595 -605.
USDA/FNS. Project SMILE/Suggested Methods for Improving Lunchroom Experience.Washington, DC. USDA, 1974.
USDA/FNS. The USDA study on high school participation in child nutrition programs.Washington, DC, USDA, no date.
Vance, T.F. Food selections of nursery school children. Child Development, 1932, 3, 169-175.
Wair, B. and L.J. Roberts. Studies in the food requirements of adolescent girls. I1. Dailyvariations in the energy intake of the individual. Journal of the American Dietetic Association.1932, 8, 323-331.
Warnick, K.P., S.V. Bring and E. Woods. Nutritional status of adolescent Idaho children. Journalof the American Dietetic Association, 1955, 31, 486-490.
Watts, M. Fighting and winning the plate waste battle. School Foodservice Journal, 1976,30, 71-76.
94
OWN

Widdowson, E.M. A study ot individual children's diets. Medical Research Council SpecialReport Service #257, H.M. Stationery Office, London, 1947.
Young, C.M., F.W. Chalmers, H.N. Church, M.M. Clayton, R.E. Tucker, A.W. Werts and W.D.Foster. A comparison of dietary study methods. I. Dietary history vs. seven-day recall.Journal of the American Dietetic Association, 1952, 28, 124-127.
Young, C.M., R.E. Franklin, W.D. Foster and B.F. Steele. Weekly variation in nutrient intakeof young adults. Journal of the American Dietetic Association, 1953, 29, 459-464.
Young, C.M., G.C. Hagan, R.E. Tucker and W.D. Foster. A comparison of dietary studymethods. I1. Dietary history vs. seven-day record vs. 24-hr. recall. Journal of the AmericanDietetic Association, 1952, 28, 218-221.
Young, C.M. and H.L. Pilcher. Nutritional status survey, Groton Township, NY. II. Nutrient
usage of families and individuals. Journal of the American Dietetic Association, 1950, 26,776-781.
Young, C.M., V.L. Smudski, B.F. Steele. Fall and Spring diets of school children in NY State.
Journal of the American Dietetic Association, 1951, 27, 289-292.
Young, C.M. and M.F. Trulson. Methodology for dietary studies in epidemiological surveys.I1. Strengths and weaknesses of existing methods. American Journal of Public Health, 1960,50(6), 803-814.
95

APPENDIX
Table A-1. Aggregate Selective Plate Waste for 244 Students at School 1
Food Item Total Grams Waste
Spaghetti and Meat Sauce 5614French Bread with Margarine 1176Tossed Salad with Dressing 3044Sandwich 1, White Bread 241
Sliced Turkey 62Peanut Butter and Marshmallow Fluff Sandwich 289Peanut Butter and Jelly Sandwich 222
Submarine Sandwich, Roll 898Bologna 301Salami 435Cheese 287
Lettuce from Sandwich 1 or Sub Sandwich 199Tomato from Sandwich 1 or Sub Sandwich 269Pickle 241Potato Chips 155
Pudding, Chocolate 990Whipped Topping 161Fresh Apple 2740Fresh Banana 580Fruit Punch 515Milk, Whole and Skim combined 29162
97
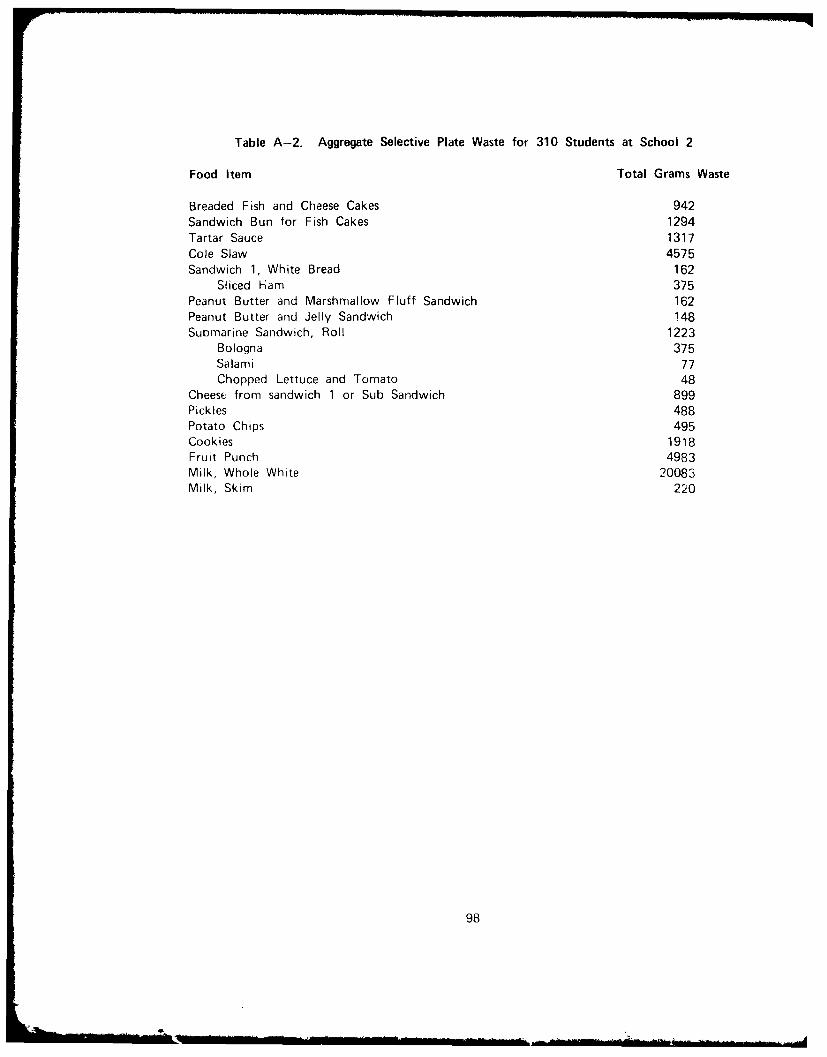
Table A-2. Aggregate Selective Plate Waste for 310 Students at School 2
Food Item Total Grams Waste
Breaded Fish and Cheese Cakes 942Sandwich Bun for Fish Cakes 1294Tartar Sauce 1317Cole Slaw 4575Sandwich 1, White Bread 162
Sliced Ham 375Peanut Butter and Marshmallow Fluff Sandwich 162Peanut Butter and Jelly Sandwich 148Submarine Sandwich, Roll 1223
Bologna 375Salami 77Chopped Lettuce and Tomato 48
Cheese from sandwich 1 or Sub Sandwich 899Pickles 488Potato Chips 495Cookies 1918Fruit Punch 4983Milk, Whole White 20083Milk, Skim 220
98

Table A-3. Aggregate Selective Plate Waste for 149 Students at School 3
Food Item Total Grams Waste
Hamburger Patty 1398Sesame Seed Bun 1859Canned, Sliced Peaches 5895Apple Juice 1391Milk, Whole White 810Milk, Chocolate 6002
.99

Table A-4. Aggregate Selective Plate Waste for 539 Students at School 4
Food Item Total Grams Waste
Cheese Pizza 2884Mixed Frozen Vegetables 15873Canned Pear Halves 1419Spice Cake with Orange Frosting 1797Milk, Whole White 2180Milk, Chocolate 10538
100
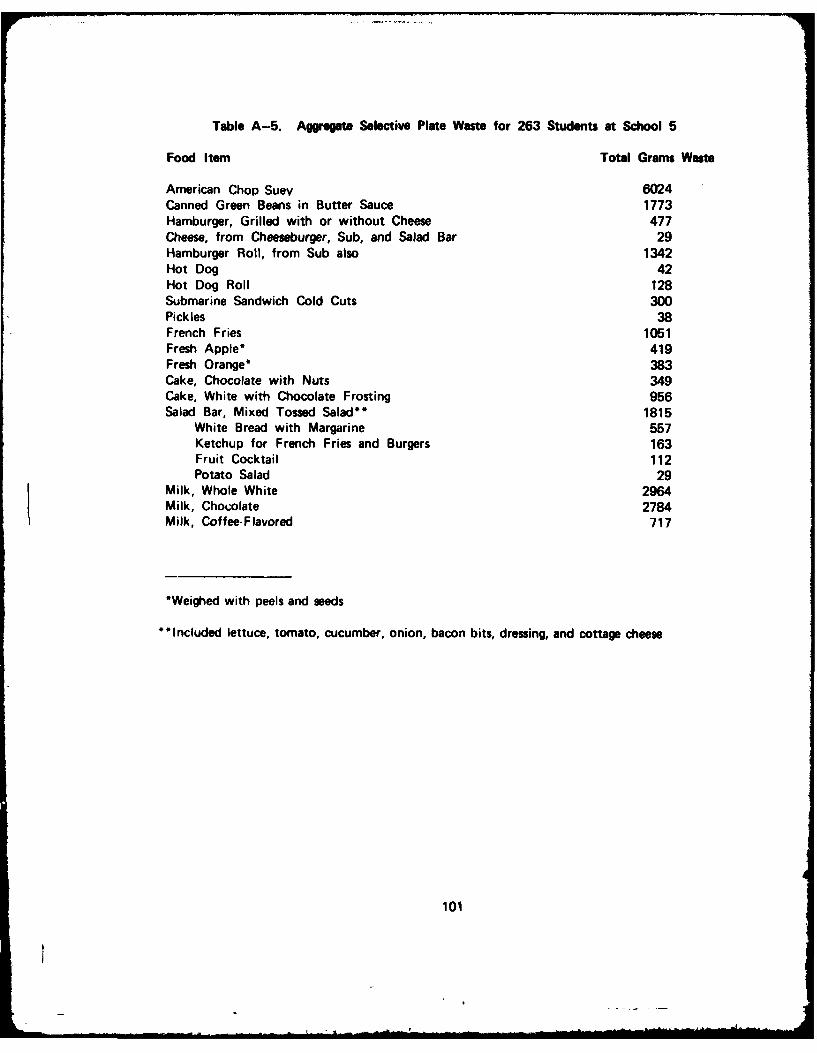
Table A-5. Aggregate Selective Plate Waste for 263 Students at School 5
Food Item Total Grams Waste
American Chop Suev 6024Canned Green Beans in Butter Sauce 1773Hamburger, Grilled with or without Cheese 477Cheese, from Cheeseburger, Sub, and Salad Bar 29Hamburger Roll, from Sub also 1342Hot Dog 42Hot Dog Roll 128Submarine Sandwich Cold Cuts 300Pickles 38French Fries 1051Fresh Apple* 419Fresh Orange* 383Cake, Chocolate with Nuts 349Cake, White with Chocolate Frosting 956Salad Bar, Mixed Tossed Salad" 1815
White Bread with Margarine 557Ketchup for French Fries and Burgers 163Fruit Cocktail 112Potato Salad 29
Milk, Whole White 2964Milk, Chocolate 2784Milk, Coffee-Flavored 717
*Weighed with peels and seeds
"Included lettuce, tomato, cucumber, onion, bacon bits, dressing, and cottage cheese
101