myths and reality
TRANSCRIPT
Self Help Group Participation and Employment of the Women: Myths and the Reality
Chandralekha Ghosh1 - Tanmoyee Banerjee ( Chaterjee)2
AbstractThe self help groups were formed to provide micro credit facilities to rural poor women to engage them in economic activities. Present paper investigates the factors influencing the employment status of a selected group of self help group members. The same set of self help group members has been surveyed twice, once during 2005 and again during 2009 to collect information. During 2005 survey all the members were employed but during 2009 it were observed that about 55 percent of the self help group members have turned into housewives. The present study will try to examine the influence of socio economic, demographic and political factors on the employment status of the members based on primary survey conducted in some villages of North 24 Parganas, West Bengal, India. The paper has also tried to investigate the loan use pattern of this set of self help group members. Along with the past occupation of the member the local politics at village level have been found to influence the employment status as well as loan use pattern of the members.
Keywords: Self Help Group, Employment Status, Loan use patternJEL Classifications: G21, O12.
1 Department of Economics , West Bengal State University, Barasat, North 24, Parganas.
2 Department of Economics, Jadavpur University, Kolkata 700032, India.
Proceedings of FIKUSZ ’10 Symposium for Young Researchers, 2010, 55-78 © The Author(s). Conference Proceedings compilation © Obuda University Keleti Faculty of Business and Management 2010. Published by Óbuda University Keleti Károly Faculty of Business and Management, Tavaszmezı u. 15-17. H-1084 Budapest, Hungary. http://kgk.uni-obuda.hu/fikusz
56
Self Help Group Participation and Employment of the Women: Myths and the Reality
The Self help Group linked micro credit programmmes aim at extending income generat-ing self employment activities among poor women in rural areas through financial inclu-sion3. The present study will try to find out the incidence of continuity of employment among female members of SHGs created under the micro credit programme , SGSY which was initiated in India from 1st April 1999.4 A large number of self help groups have been created across India under SGSY to link the rural poor mostly the rural women to the formal micro finance institutions via Self-help groups where groups will receive joint liability loans from formal credit institutions. The programme also covers all aspects of self employments such as training, credit, technology, infrastructure and marketing and enabling the rural poor to take decisions on all issues concerning poverty eradication. Present study will try to find out the efficacy of this programme in providing employment to rural women.
The unique feature of this study is that the same set of group members have been in-terviewed twice with a gap of four years. Firstly a group of 290 female SGSY SHG members were surveyed during 2005-2006 and again the same set of members was resur-veyed during 2009-2010. Based on this unique survey present paper will try to identify the socio economic political and demographic factors that are affecting the continuity of employment status of the group members. Nature of this survey will help us to remove the impacts of fixed unobservables on the decisions of the group members. As we are
3 Financialinclusiondenotesdeliveryoffinancialservicestothevastsectionsofthedisadvantagedand people of low-income groups at affordable costs.
4 Swarnjaynti Gram Swarojgar Yojana (SGSY) which is a self-employment programme of Ministry of Rural Development that aims at providing assistance to the below poverty level (BPL) rural poor for establishing micro-enterprises through bank credit and government subsidy to acquire an income-generating asset. The Swarnjayanti Gram Swarozgar Yojana, a credit-based scheme sponsored by the Government of India for poverty alleviation, is perhaps the largest of its kind in the world. It was firstannouncedin1997tocommemoratefiftyyearsofIndia’sindependenceandfirstallocationsforitundertheMinistryofRuraldevelopment(MORD)wereincludedintheGOIbudgetof1999/2000.TheMORDwastofixthesharesofeachdistrictinthecountryroughlyonthebasisofrelativenum-bers of poor residing there. 75% of the funds would come from the Union Government and each state government would match it for the remaining 25%. Both parts of the funds are to go directly to theDRDA;ineachdistrict,theDRDAisinchargeofexecutingthescheme.Forthis,itistodrawonthe help of local governments, line agencies of superior governments and local branches of com-mercial banks. In case of SGSY programme it was directed by the Government of India that the groups will be formed by taking members from Below Poverty level (BPL) List. If above poverty level membersareincludedinthegroupthenthatpersoncannotbeanofficebearerofthegroup.UnderSGSY,theindividualbeneficiariesandmembersofSHGsarecalledswarozgaris.GenerallyaselfHelpGroup(SHG)consistof10-20personsareformedbutindifficultareaslikedeserts,hillsandareas with scattered and sparse population and disabled persons, this number may be 5-20. Focus isgivenontheonvulnerablegroups-SC/STsshouldbeatleast50%ofswarozgaris;women-40%anddisabled-3%ofswarozgaris.ListofBPLhouseholds identified throughBPLcensusanddulyapprovedbyGramSabhaformsthebasisfor identificationof familiesfromwhichthemembersofSelfHelpGroups(SHGs)aredrawn.DRDAsinitiateandsustaintheprocessofsocialmobilizationforformation,developmentandstrengtheningofSHGsthroughfacilitatorsviz.NGOs,CBOs,Banks,CommunityCoordinators,AnimatorsandSHPIs.Source:http://rural.nic.in/FAQ_SGSY.pdf
57
examining the same set of members over a period of time, the concept of selection bias does not arise.
The existing studies on self help groups have shown that group participation has helped to remove poverty; improved consumption level of the families of group members; im-proved rate of asset creation of the families; finally it improves the women empowerment levels. Different impact evaluation studies by Kandekar(2003)5, Kandekar(2005) , Swain and Floro (2007)6, Tedeschi(2008), Banerjee(2009)7 ,Imai et al(2010) 8 have shown differ-ent positive impact of group joining on the families of the group member. Based on data from a primary survey from six states in India (NCAER 2008) Parida and Sinha (2010) have showed that all females groups have performed most efficiently compared to male SHGs.
Issues related to SHG participation and women empowerment have been dealt in pa-pers by Swain and Wallentin(2009)9, Garikipati(2008). The study by Garikipati(2008)
5 Study by Kandekar(2003) carriedoutanexercisebyestimatingtheeffectsofmicro-financeon consumption, poverty and non-land assets for participants, non-participants, and an average vil-lager, assuming that micro-financeprogramshavespillover(externality)effects.Theresultsareresounding:micro-financemattersalotfortheverypoorborrowersandalsoforthelocal economy
6 SwainandFloro(2007)havedevelopedatheoreticalmodeltoexaminethemechanismsthroughthepecuniaryandnonpecuniaryeffectsoftheSHGprogramonthebeneficiaries’earningsandem-powerment,influencetheirhouseholds’abilitytomanagerisk.Goingbeyondthetraditionalpovertyestimates,theyhaveusedvulnerability imeasurewhichquantifiesthewelfarelossassociatedwithpoverty as well as different types of risks like aggregate and idiosyncratic risks. Applying this meas-ure toan Indianpanelsurveydata for2000and2003, theyhave found thatSHGmembershavelowervulnerabilityascomparedtoagroupofnon-SHG(control)members.Furthermore,theyhaveobserved that the poverty contributes to about 80 percent of the vulnerability faced by the household followedbyaggregaterisk.ThispaperinvestigateswhetherornotSHGparticipationresultsinreduc-ing poverty and vulnerability.
7 Banerjee(2009)hasshown that income regenerations throughgroupactivitieshas improvedthe average income of group members but the inequality of distribution of income is high among the groupmembersthanthatofthenon-groupmembers.Secondly,therehasbeenasignificantdeclineinthemedicalexpenditureandschooldropoutrateinthefamiliesofgroupmembersthanthatofnon-group members.
8 Imaietal(2010)examinedwhetherhouseholdaccess tomicrofinancereducespoverty.Usingnational household data from India, treatment effects model is employed to estimate the poverty-re-ducing effects of Micro Finance Institutions (MFIs) loans for productive purposes, such as investment in agriculture or non-farm businesses on household poverty levels. These models take into account the endogenous binary treatment effects and sample selection bias associated with access to MFIs. Despite some limitations, such as those arising from potential unobservable important determinants of access toMFIs, significant positiveeffect ofMFI productive loansonmultidimensionalwelfareindicatorhasbeenconfirmed.Thesignificanceof“treatmenteffects”coefficientshasbeenverifiedbyboth Tobit and Propensity Score Matching (PSM) models. In addition, they have found that loans for productive purposes were more important for poverty reduction in rural than in urban areas.
9 ThestudybySwainandWallentin(2009)usinghouseholdsurveydataonSHGfromIndiaadopteda general structural model where the latent women empowerment and its latent components (eco-nomicfactorsandfinancialconfidence,managerialcontrol,behaviouralchanges,educationandnet-working, communication and political participation and awareness) are measured using observed indicators.TheyshowthatforSHGmembers,economicfactors,managerialcontrolandbehaviouralchangesarethemostsignificantfactorsinempoweringwomen.
58
shows an interesting and paradoxical result where credit availability of the rural woman through self help group formation benefits the households by reducing risk vulnerability and asset creation but it does not really empower woman. They have found out that loans procured by women are often diverted into enhancing household’s assets and incomes. This combined with woman’s lack of co-ownership of family’s productive assets, results in her disempowerment
Study by Swain and Adel Varghese(2009) have shown that in case of Indian SHG mem-bers with longer participation in SHGs, members move away from pure agriculture as an income source towards other sources such as livestock income. Training by NGOs posi-tively affects asset creation but the type of SHG linkage per se has no effect.
McKernan (2002) has shown the role of micro credit programs in determining the re-stricted self-employment profits of rural households. Using data from a special survey carried out in 87 rural Bangladeshi villages during 1991-1992, this study then estimates the impact of participation in three micro-credit programs (BRAC, BRDB’s RD-12 pro-gram, and Grameen Bank) on self-employment profits. Making use of the fact that credit from micro credit programs is used to purchase capital, this paper also provides a measure of the noncredit effect of the programs by estimating the effect of program participation while controlling for the level of productive capital. The study found large positive effects of participation and the noncredit aspects of participation on self-employment profits.
However none of the papers mentioned above has dealt with the employment status of the SHG member which is the central focus of the present study. Our main objective is to find out the effect of group participation on the continuity of employment status of the group member. We have tried to identify the factors that influence the woman to remain employed.
The study is based on two rounds of primary surveys; one carried out during 2005-2006 and another during 2009-2010 on same set of SHG members from North 24 parganas, West Bengal, India. The SHGs were formed under the SGSY programme. During the first round of survey all the group members were employed. However during the second round of survey we found that even if groups are in existence, a large number of group members have become unemployed. Srinivasan (2009) has also observed that groups created under SGSY do not seem to have a long existence. He has observed that 3.13 million groups were created under SGSY programme up to October 2008 across different states of India. However only 21% of the total number of groups created took up economic activities. We are also trying to examine the influence of local politics on the individual’s decision of employment and also on the loan use pattern.
The present study will try to find out empirically the factors determining the incidence of continuity of employment among the group members. Among various factors, the effect of politics at village on the employment status of the woman has also been analysed. In line with this, the study will also focus on the factors determining the loan use pattern of the members for the loans taken from the group corpus. Apart from these the study will also try to find out the determinants of loan size.
Rest of the paper is divided as follows: Section II descries the survey design and section III will present the result of empirical analysis and Section IV will conclude the paper.
59
Section II: The Survey
The survey was conducted in two phases in the district of North 24 Parganas, West Bengal. The first round of survey was carried out during October 2005 to March 2006 and again the same set of members was resurveyed during September 2009 to March 2010. For the first round of survey data has been collected by simple random sampling in three stages. The district of North 24 parganas is divided in five subdivisions namely Bongaon, Barasat, Barackpur, Basirhat and Bidhannagar where Bidhannagar is urban area and was not covered in our survey. From the rest of the four subdivisions we randomly selected six blocks10 namely Bongaon, Barasat I, Barackpur I, Basirhat I, Hasnabad and Hingalgang. Each block consists of some Gram Panchayat (GP) areas. So from each block one Gram panchayat area has been randomly selected . The selected gram Panchayats are Palla(Bongaon), Kashimpur(Barasat I), Panpur-Keutia (Barackpur I), Nimdaria-Kodalia (Basirhat I), Makalgacha(Hasnabad) and Dulduli(Hingalgange).
From each gram panchayat area four groups were selected randomly from the list of exist-ing SGSY groups as provided by District Rural Development Cell (DRDC) of North 24 Parganas (only seven groups were selected from Hingalgang as the size of three of the selected groups were less than 8). In this way we had 27 selected groups with 300 mem-bers. However during survey we found that one group in Hasnabad block was male group so that group was not included in the empirical analysis. So from first round of survey we had data on 290 female group members covering all four subdivisions of North 24 parganas. Then in the second round of survey during 2009 we were able to trace out 272 female group members who were initially selected. Of these 272 female group members four were single woman and not included in the present analysis.11 Hence the subsequent analysis will be carried out on 268 female married group members based on data col-lected during two surveys. Since we are resurveying the same set of group members the impact of fixed unobservables does not occur here in this case.
In the surveys we have collected socio-economic information about the SHG members That includes information about their religion, age, sex, education, social category (SC/ST), number of family members, number of dependents, occupation category, husband’s occupation category their average family income, savings, SHG member’s income, sav-ings, family wealth level , level of agricultural land holding, family consumption expen-diture, food expenditure, medical expenditure, number of school drop out. The second survey further collected information about the size of borrowing of the member from the group corpus; the training received by the member; the loan use pattern and other loan related information.
10 One block from each of the subdivisions is selected randomly and rest of the two is selected from the rest of all blocks by simple random sampling method.
11 Thesinglewomenareexcludedfromtheempiricalanalysisbecausetheemploymentdecisionand loan use pattern of the single women will be different from that of married family women.
60
It has been observed that functioning of SHGs formed under SGSY in West Bengal de-pends on its co-ordination with the elected member of the village panchayat12 and two gram panchayat employed resource persons( GPRP) who in turn co-ordinate with the panchayat Prodhan13. Different information are communicated to SHG members through village panchayat member that includes information related to works distributed through gram panchayats like cooking of midday meals at schools, 100 days work projects, distri-bution of government grants, training of SHG member at the district or state level, differ-ent technical help related to self employment projects, information related to distribution of inputs like seed, pesticides, poultry and sale and marketing of SHG products. Under this context due to electoral clientilism political identification of group members become significant in receiving benefits from gram panchayats. Bardhan et al (2007) have also observed that in West Bengal the electoral support for incumbent parties was related to short term benefits derived from gram panchayats. In this context we must mention that the state of West Bengal had a Panchayat Election in May 2008 that is the period after our first survey. For this reason during second time survey in 2009 we have collected data about the political affiliation of village panchayat member and corresponding gram panchayat in the survey area pre and post panchayat election of 2008 to study the impact of political change at village level on the activities of the group members.
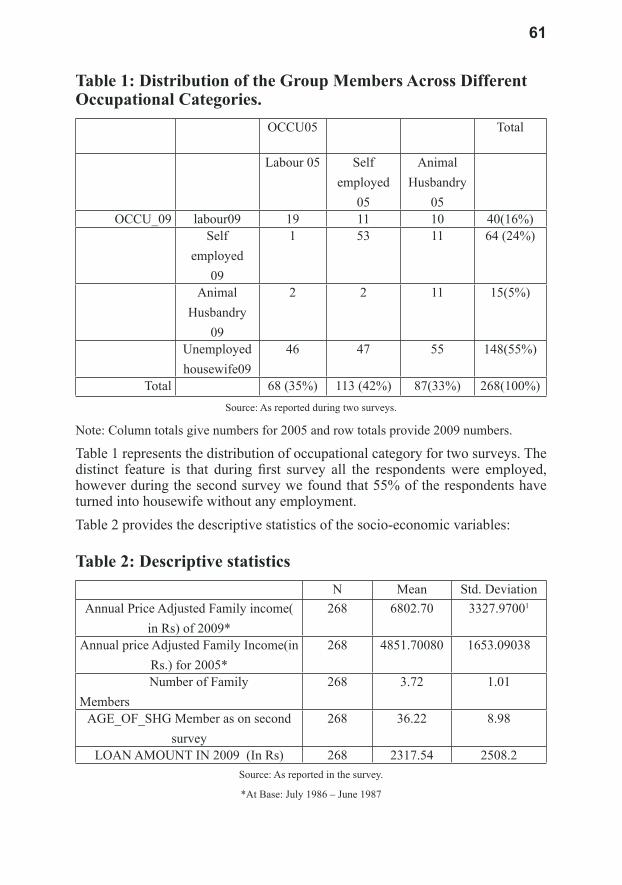
Using information on occupation of female group member we have divided the sample into three occupational groups: self-employed (women with occupations like basket mak-ing, bidi binding, sewing, handicraft work, vegetable grower small sellers of fish, flow-ers, etc) that is respondents who work for themselves, wage labourer, (people working in agricultural and non agricultural activity against wage payment) and animal husbandry (like poultry farming, cattle breeding etc.) Table 1 gives the occupational pattern of the respondents for 2005 and 2009.
12 In West Bengal a three tier Pamchayat system of local self Government is in operation. In the state level, Panchayats & Rural Development Department of the Government of West Bengal is the nodal agency for implementation, supervision & monitoring of the major poverty alleviation pro-grammesintheruralareasandatthedistrictlevel,“ZillaParishad”istheimplementingagencyforthesame.Underathree-tiersystemofdemocraticdecentralization,“ZillaParishad”istheapexbodyatthedistrictlevel;followedby“PanchayatSamitis”attheblocklevelasthesecondtier;and“grampan-chayats(GP),”thethirdtierandmembersofwhichwillbeelectedbythevoterswhoelectmembersto the State Legislative Assembly for four years. The number of members in a GP varies between 7 and 25. Basically a Gram Panchayat is formed of a whole Mouja or a part of it or more than one mouja together. Three to four villages build up one gram panchayat.
13 For SGSY groups at district level DRDC acts as the nodal authority at the District level. At the Blocklevel,theBlockDevelopmentOfficer,alongwithSHGsupervisorandblockresourcepersonsmaintain the link between the DRDC and the gram panchayats who directly co ordinates with group members at the village level through elected village panchayat member and gram panchayat re-source persons. Sometimes at the village level along with the gram panchayat member, NGOs also take important role in nurturing of the groups. From 2006 onwards at the state level in West Bengal theministryofSelfHelpGroupandSelfEmploymentactsasthecentralcoordinatorofSHGsoperat-ing across different districts.
61
Table 1: Distribution of the Group Members Across Different Occupational Categories.
OCCU05 Total
Labour 05 Self employed
05
Animal Husbandry
05OCCU_09 labour09 19 11 10 40(16%)
Self employed
09
1 53 11 64 (24%)
Animal Husbandry
09
2 2 11 15(5%)
Unemployed housewife09
46 47 55 148(55%)
Total 68 (35%) 113 (42%) 87(33%) 268(100%)Source: As reported during two surveys.
Note: Column totals give numbers for 2005 and row totals provide 2009 numbers.
Table 1 represents the distribution of occupational category for two surveys. The distinct feature is that during first survey all the respondents were employed, however during the second survey we found that 55% of the respondents have turned into housewife without any employment.Table 2 provides the descriptive statistics of the socio-economic variables:
Table 2: Descriptive statisticsN Mean Std. Deviation
Annual Price Adjusted Family income( in Rs) of 2009*
268 6802.70 3327.97001
Annual price Adjusted Family Income(in Rs.) for 2005*
268 4851.70080 1653.09038
Number of Family Members
268 3.72 1.01
AGE_OF_SHG Member as on second survey
268 36.22 8.98
LOAN AMOUNT IN 2009 (In Rs) 268 2317.54 2508.2Source: As reported in the survey.
*At Base: July 1986 – June 1987
62
Thus from table 1 and table 2 it has been observed that even if the mean family income level of the group members has significantly increased, a large number of group member has become unemployed. From the survey it has been observed that of 268 group mem-ber income has increased for 195 group members. But among them 50% members are currently unemployed. Among 73 families where income has actually decreased from 2005 to 2009, almost 70% are unemployed. Thus lower income families have more un-employed women. 14
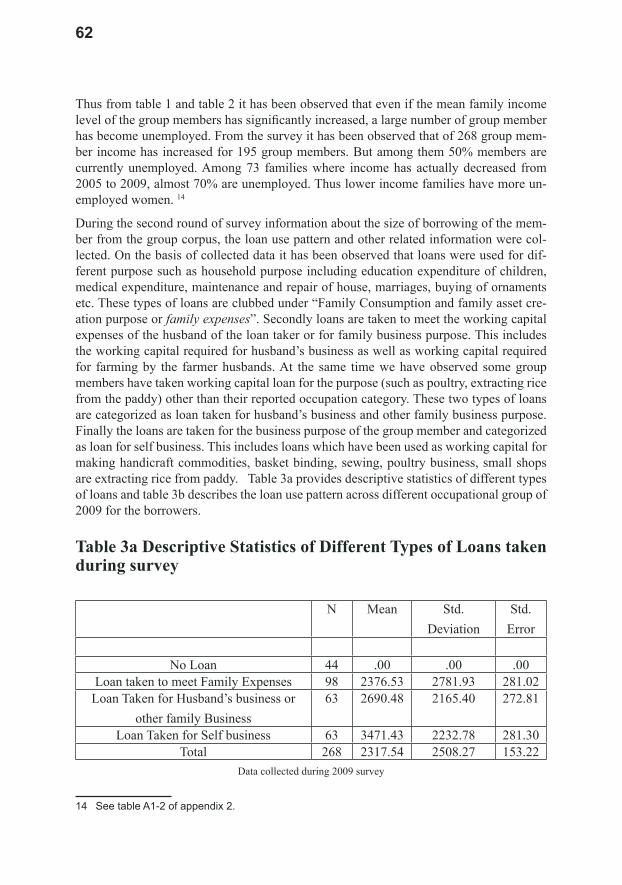
During the second round of survey information about the size of borrowing of the mem-ber from the group corpus, the loan use pattern and other related information were col-lected. On the basis of collected data it has been observed that loans were used for dif-ferent purpose such as household purpose including education expenditure of children, medical expenditure, maintenance and repair of house, marriages, buying of ornaments etc. These types of loans are clubbed under “Family Consumption and family asset cre-ation purpose or family expenses”. Secondly loans are taken to meet the working capital expenses of the husband of the loan taker or for family business purpose. This includes the working capital required for husband’s business as well as working capital required for farming by the farmer husbands. At the same time we have observed some group members have taken working capital loan for the purpose (such as poultry, extracting rice from the paddy) other than their reported occupation category. These two types of loans are categorized as loan taken for husband’s business and other family business purpose. Finally the loans are taken for the business purpose of the group member and categorized as loan for self business. This includes loans which have been used as working capital for making handicraft commodities, basket binding, sewing, poultry business, small shops are extracting rice from paddy. Table 3a provides descriptive statistics of different types of loans and table 3b describes the loan use pattern across different occupational group of 2009 for the borrowers.
Table 3a Descriptive Statistics of Different Types of Loans taken during survey
N Mean Std. Deviation
Std. Error
No Loan 44 .00 .00 .00Loan taken to meet Family Expenses 98 2376.53 2781.93 281.02
Loan Taken for Husband’s business or other family Business
63 2690.48 2165.40 272.81
Loan Taken for Self business 63 3471.43 2232.78 281.30Total 268 2317.54 2508.27 153.22
Data collected during 2009 survey
14 SeetableA1-2ofappendix2.
63
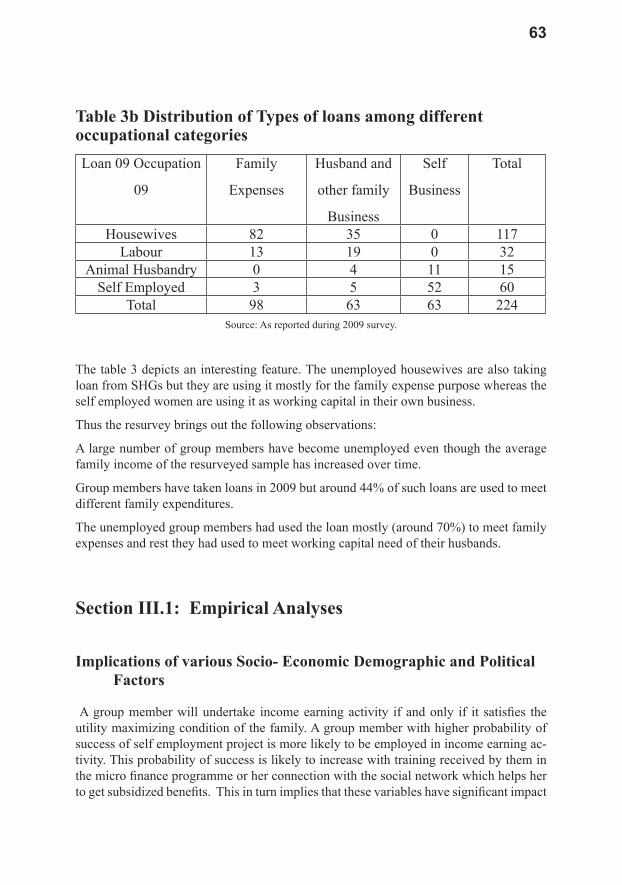
Table 3b Distribution of Types of loans among different occupational categoriesLoan 09 Occupation
09
Family
Expenses
Husband and
other family
Business
Self
Business
Total
Housewives 82 35 0 117Labour 13 19 0 32
Animal Husbandry 0 4 11 15Self Employed 3 5 52 60
Total 98 63 63 224Source: As reported during 2009 survey.
The table 3 depicts an interesting feature. The unemployed housewives are also taking loan from SHGs but they are using it mostly for the family expense purpose whereas the self employed women are using it as working capital in their own business.
Thus the resurvey brings out the following observations:
A large number of group members have become unemployed even though the average family income of the resurveyed sample has increased over time.
Group members have taken loans in 2009 but around 44% of such loans are used to meet different family expenditures.
The unemployed group members had used the loan mostly (around 70%) to meet family expenses and rest they had used to meet working capital need of their husbands.
Section III.1: Empirical Analyses
Implications of various Socio- Economic Demographic and Political Factors
A group member will undertake income earning activity if and only if it satisfies the utility maximizing condition of the family. A group member with higher probability of success of self employment project is more likely to be employed in income earning ac-tivity. This probability of success is likely to increase with training received by them in the micro finance programme or her connection with the social network which helps her to get subsidized benefits. This in turn implies that these variables have significant impact
64
on the continuity of employment status of the group member along with socioeconomic and demographic characteristics of the family and group related variables. An objective of the subsequent empirical analysis is to identify the set of variables that have significant impact on the continuity of employment status of the group member. Secondly there is always a possibility that loan received by the group member may be used for family consumption purpose or for business purpose of the male member of the family or for family business purpose and this allocation decision of loan obtained from the group will depend on member’s household utility function which in turn depends on socioeconomic and demographic characteristics of the family of the member, training of the member and group related variables and also on local politics of the region. In the subsequent empiri-cal analysis we will try to isolate the significant set of variables that affects the allocation of group loan for different purposes and size of such loans.
The socio economic demographic variables that we will include in the empirical analysis are age of the group member, her education level, religion, family size, her past occupa-tion, land holding status of the family. Age of the group member, her education level will affect the parameters corresponding to her perception regarding disutility of labour required for different purposes. An educated female member is more likely to be more inclined to work for income generating activity rather than staying at home. Alternatively an aged female member may prefer to stay at home due to low productivity. Family size can affect the employment status of the female family member. A large family size implies more work at home and female worker has to devote more time for smooth func-tioning of family affairs than work for income earning purpose. Religion of the family also affects the employment status of women and the loan use pattern due to access to social network which in turn can affect the ability to find work, access to informal child care and business network (Gatripati (2009)). Variables related to economic status of the family such as land holding mostly affect the loan use pattern. If the husband of the group member is a farmer, then it is more likely that loan will be taken to meet the agricultural working capital purpose. Gatripati (2009) points out that land holding may act as a proxy for returns on self-employment loan which in turn influences the individual’s time use.
In the present model we have assumed that female group member’s connection to local government authorities via social network may help her to increase productivity. This assumption is based in the existence of political clientelism in developing economies. The study by Bardhan et al (2007) based on a survey of 85 villages in 15 districts of West Bengal has shown that the electoral support for incumbent parties was related to reported benefits derived from gram Panchayats or local self governments. Given this observation we have tried to find out the impact of political change at the village level on the continu-ity of employment status and loan use pattern of the group member. This aspect has not been covered in the existing literature.
Finally the impact of group related variables will be analysed on the employment status of the group member and on the loan use pattern. Apart from the socio economic and demographic features of the group member, variables related to group may also affect the employment status and loan use pattern. A larger group may posses a large group corpus, but the number of loan takers may be high in each period resulting in small the loan size of the each member. This can affect the productivity of group member and her employ-ment status.
65
In the analysis that follows we estimate the empirical relations of the employment sta-tus, loan use pattern and loan size of the group members on the socio economic political variables.
Section III.2: Empirical Analysis
Given the empirical observation ns of the survey we would estimate the factors determin-ing the employment status of the group member, size of their loan and loan use pattern of such loans.
Section III.2-A: Estimation of the determinants of employment status of the group members:
Empirical model and Estimation Procedure
This subsection presents the empirical analysis on the determinants of the employment status of group members. In the survey we have observed that many self employed wom-en who are pursuing their activities from home, did not give clear answer on exact alloca-tion of time between the household activities and income earning activities. This made the estimation of time allocation model of the SHG members impossible. Hence we have tried to isolate the factors determining the employment status of the group member using a logistic regression model where it is assumed that a group member with zero income is unemployed and allocating her time between household activities and leisure. The de-pendent variable, employment status takes the value one if the member is employed dur-ing 2009 survey or otherwise zero. The dummy variables15 are as follows: The socio economic demographic variables includes religion, number of family member, dummy related to education level of the group member, age of the SHG member, and her employ-ment category in 2005. As already mentioned in 2005 we have found that all group mem-bers were employed and they were under three broad occupational classes: labour, animal husbandry and self employed. In the regression analysis the first class has been used as reference category. We have included two more economic variables in the model: income change dummy and agricultural land holding dummy. Income change dummy assumes a value equal to one if the family income of the group member in 2009 has increased at constant prices compared to that of 2005 level. Inclusion of this variable will capture the impact of the economic status of the family on the continuity of employment status of the group member. Finally we have included one subjective variable namely status of the group member in the family. This variable assumes value equal to zero if the group member answered that her status in the family is lower than her husband, it assumes value equal to one if the group member has equal status in the family and it is two if she has higher status than her husband. The size of SHG is also included in the regression analysis to take account of the group related impact on the employment status. Finally
15 Appendix,A2givesthedescriptionofdummyvariables.
66
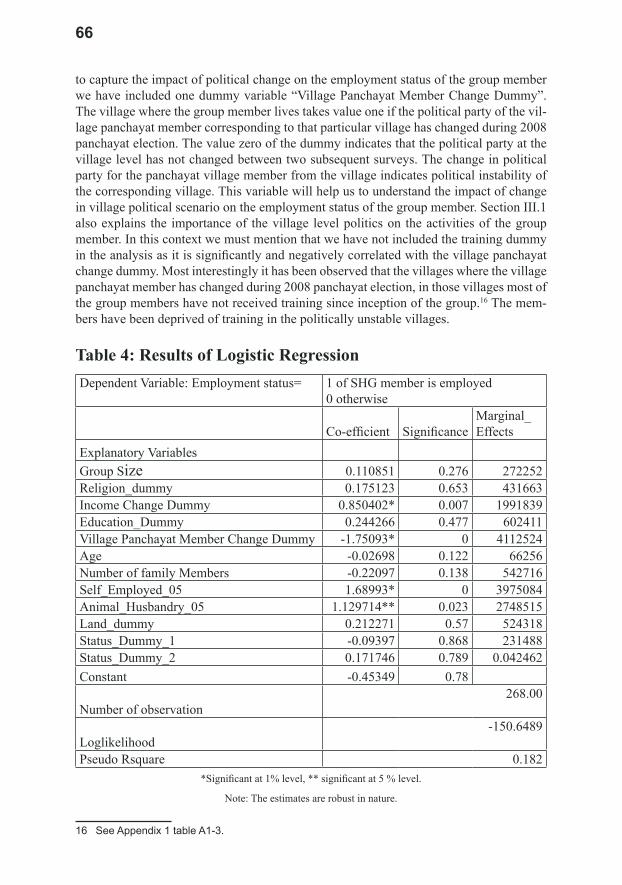
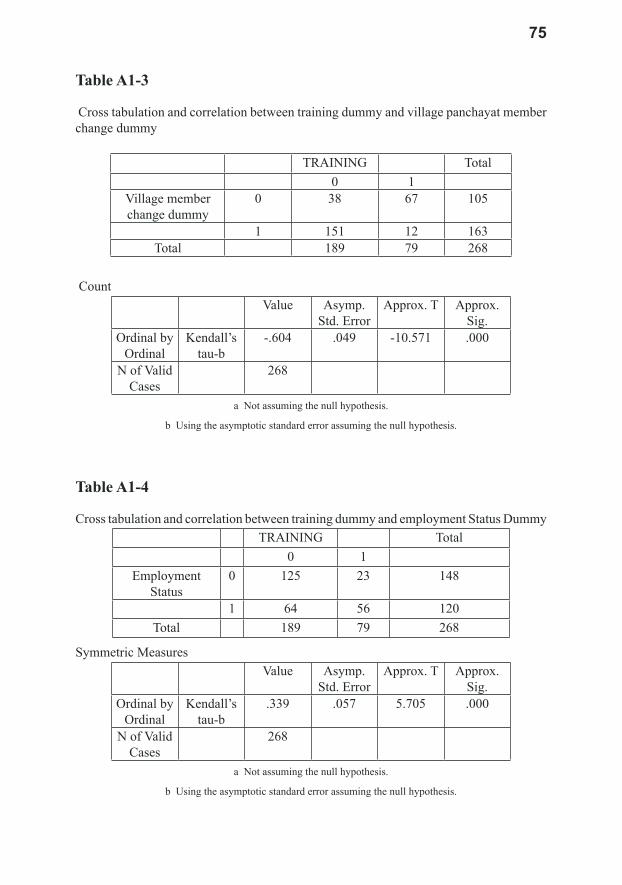
to capture the impact of political change on the employment status of the group member we have included one dummy variable “Village Panchayat Member Change Dummy”. The village where the group member lives takes value one if the political party of the vil-lage panchayat member corresponding to that particular village has changed during 2008 panchayat election. The value zero of the dummy indicates that the political party at the village level has not changed between two subsequent surveys. The change in political party for the panchayat village member from the village indicates political instability of the corresponding village. This variable will help us to understand the impact of change in village political scenario on the employment status of the group member. Section III.1 also explains the importance of the village level politics on the activities of the group member. In this context we must mention that we have not included the training dummy in the analysis as it is significantly and negatively correlated with the village panchayat change dummy. Most interestingly it has been observed that the villages where the village panchayat member has changed during 2008 panchayat election, in those villages most of the group members have not received training since inception of the group.16 The mem-bers have been deprived of training in the politically unstable villages.
Table 4: Results of Logistic RegressionDependent Variable: Employment status= 1 of SHG member is employed
0 otherwise
Co-efficient SignificanceMarginal_Effects
Explanatory Variables Group Size 0.110851 0.276 272252Religion_dummy 0.175123 0.653 431663Income Change Dummy 0.850402* 0.007 1991839Education_Dummy 0.244266 0.477 602411Village Panchayat Member Change Dummy -1.75093* 0 4112524Age -0.02698 0.122 66256Number of family Members -0.22097 0.138 542716Self_Employed_05 1.68993* 0 3975084Animal_Husbandry_05 1.129714** 0.023 2748515Land_dummy 0.212271 0.57 524318Status_Dummy_1 -0.09397 0.868 231488Status_Dummy_2 0.171746 0.789 0.042462Constant -0.45349 0.78
Number of observation268.00
Loglikelihood -150.6489
Pseudo Rsquare 0.182
*Significant at 1% level, ** significant at 5 % level.
Note: The estimates are robust in nature.
16 SeeAppendix1tableA1-3.
67
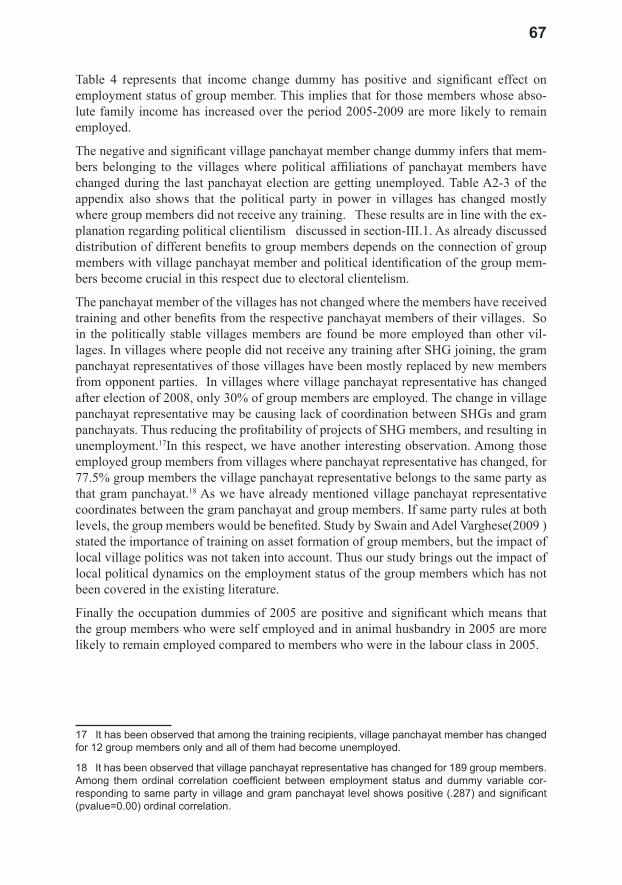
Table 4 represents that income change dummy has positive and significant effect on employment status of group member. This implies that for those members whose abso-lute family income has increased over the period 2005-2009 are more likely to remain employed.
The negative and significant village panchayat member change dummy infers that mem-bers belonging to the villages where political affiliations of panchayat members have changed during the last panchayat election are getting unemployed. Table A2-3 of the appendix also shows that the political party in power in villages has changed mostly where group members did not receive any training. These results are in line with the ex-planation regarding political clientilism discussed in section-III.1. As already discussed distribution of different benefits to group members depends on the connection of group members with village panchayat member and political identification of the group mem-bers become crucial in this respect due to electoral clientelism.
The panchayat member of the villages has not changed where the members have received training and other benefits from the respective panchayat members of their villages. So in the politically stable villages members are found be more employed than other vil-lages. In villages where people did not receive any training after SHG joining, the gram panchayat representatives of those villages have been mostly replaced by new members from opponent parties. In villages where village panchayat representative has changed after election of 2008, only 30% of group members are employed. The change in village panchayat representative may be causing lack of coordination between SHGs and gram panchayats. Thus reducing the profitability of projects of SHG members, and resulting in unemployment.17In this respect, we have another interesting observation. Among those employed group members from villages where panchayat representative has changed, for 77.5% group members the village panchayat representative belongs to the same party as that gram panchayat.18 As we have already mentioned village panchayat representative coordinates between the gram panchayat and group members. If same party rules at both levels, the group members would be benefited. Study by Swain and Adel Varghese(2009 ) stated the importance of training on asset formation of group members, but the impact of local village politics was not taken into account. Thus our study brings out the impact of local political dynamics on the employment status of the group members which has not been covered in the existing literature.
Finally the occupation dummies of 2005 are positive and significant which means that the group members who were self employed and in animal husbandry in 2005 are more likely to remain employed compared to members who were in the labour class in 2005.
17 It has been observed that among the training recipients, village panchayat member has changed for 12 group members only and all of them had become unemployed.
18 Ithasbeenobservedthatvillagepanchayatrepresentativehaschangedfor189groupmembers.Among themordinal correlation coefficient between employment status and dummy variable cor-respondingtosamepartyinvillageandgrampanchayatlevelshowspositive(.287)andsignificant(pvalue=0.00) ordinal correlation.
68
Section III.2-B: Estimation of the determinants of loan size of the group members:
Empirical model and Estimation Procedure
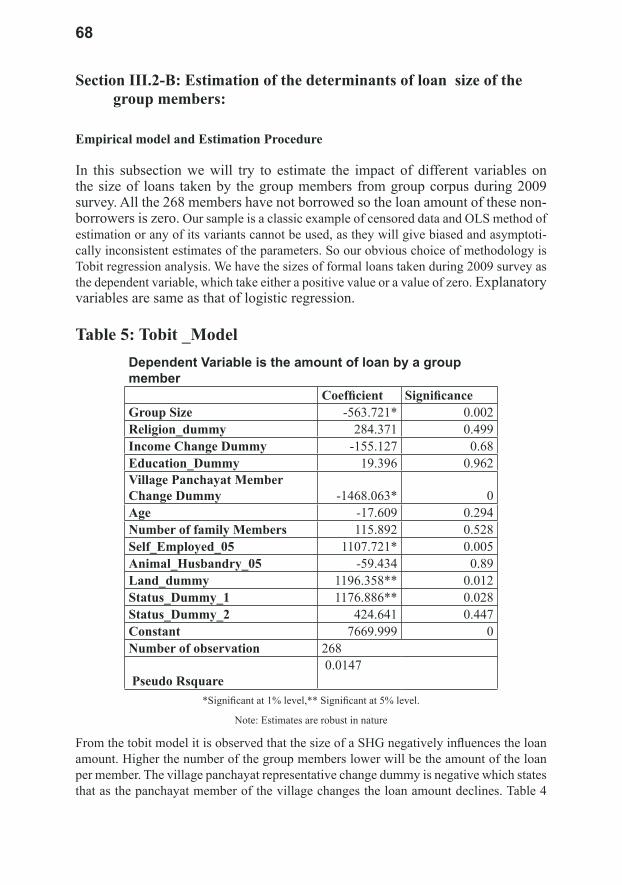
In this subsection we will try to estimate the impact of different variables on the size of loans taken by the group members from group corpus during 2009 survey. All the 268 members have not borrowed so the loan amount of these non-borrowers is zero. Our sample is a classic example of censored data and OLS method of estimation or any of its variants cannot be used, as they will give biased and asymptoti-cally inconsistent estimates of the parameters. So our obvious choice of methodology is Tobit regression analysis. We have the sizes of formal loans taken during 2009 survey as the dependent variable, which take either a positive value or a value of zero. Explanatory variables are same as that of logistic regression.
Table 5: Tobit _ModelDependent Variable is the amount of loan by a group member Coefficient SignificanceGroup Size -563.721* 0.002Religion_dummy 284.371 0.499Income Change Dummy -155.127 0.68Education_Dummy 19.396 0.962Village Panchayat Member Change Dummy -1468.063* 0Age -17.609 0.294Number of family Members 115.892 0.528Self_Employed_05 1107.721* 0.005Animal_Husbandry_05 -59.434 0.89Land_dummy 1196.358** 0.012Status_Dummy_1 1176.886** 0.028Status_Dummy_2 424.641 0.447Constant 7669.999 0Number of observation 268
Pseudo Rsquare 0.0147
*Significant at 1% level,** Significant at 5% level.
Note: Estimates are robust in nature
From the tobit model it is observed that the size of a SHG negatively influences the loan amount. Higher the number of the group members lower will be the amount of the loan per member. The village panchayat representative change dummy is negative which states that as the panchayat member of the village changes the loan amount declines. Table 4
69
brings out the fact that change in the political regime in the villages after panchayat elec-tion of 2008, has increased incidence of unemployment among group members. Thus Tobit result is emphasizing the fact that these unemployed group members are taking lower amount of loans also19. This is in direct confirmation with the results obtained by Bardhan et al (2007). They have stated that politics at grass root level promotes clien-telism by provision of small repetitive benefits. So when the panchayat member from a particular village changes the probability of getting subsidized benefits like loan from self help groups declines for the existing self help group members as the groups had been formed and nourished previously by the opponent political party. So at present with the change in the political reign of one party the existing members are in disadvantageous position as they have enjoyed the benefits previously from the other political party. This is increasing the incidence of unemployment and unemployed members are taking small sized loans because the loans will now have to be repaid with the income of the other earning members of the family.
Further the occupation dummy, self employed in 2005 is positive and significant. This infers that the people who were in self employment are taking higher amount of loan than the people who were labourers. Table 1 shows that around 68% of people who were labourers in 2005 have become unemployed housewives whereas 59% of people who were self employed in 2005 are in employment in 2009 also. Thus again this result signi-fies the fact that unemployed housewives are taking lower amount of loans from SHGs than the employed group members.
Moreover the land ownership increases amount of loan taken from the SHGs. It has been observed many group members from land owing families are taking loan to meet their husband’s working capital need in agriculture. Secondly family land holding may be act-ing as pseudo collateral to get higher amount of loan.
The status dummy _1 is significant which implies if the status of the woman member is same as that of her husband within the family then the loan amount increases compared to the group of members whose status in the family is lower than that of her husband.
The correlation between actual loan amount and predicted loan amount obtained from the above tobit model is 0.5. So we can conclude the above model has moderately fitted the existing data.
Next section will try to find out the determinants of loan use pattern by the group members.
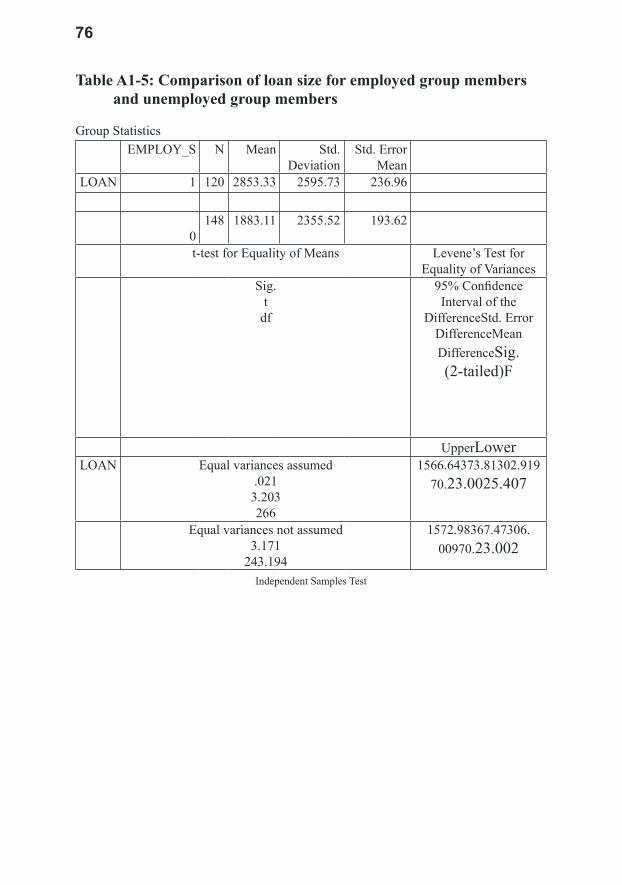
19 TableA1-5intheappendix1showsthataverageloansizeforemployedmembersissignificantlyhigher than that of unemployed group members.
70
Section III.2-C: Estimation of the determinants of loan use pattern of the group members:
Empirical model and Estimation Procedure
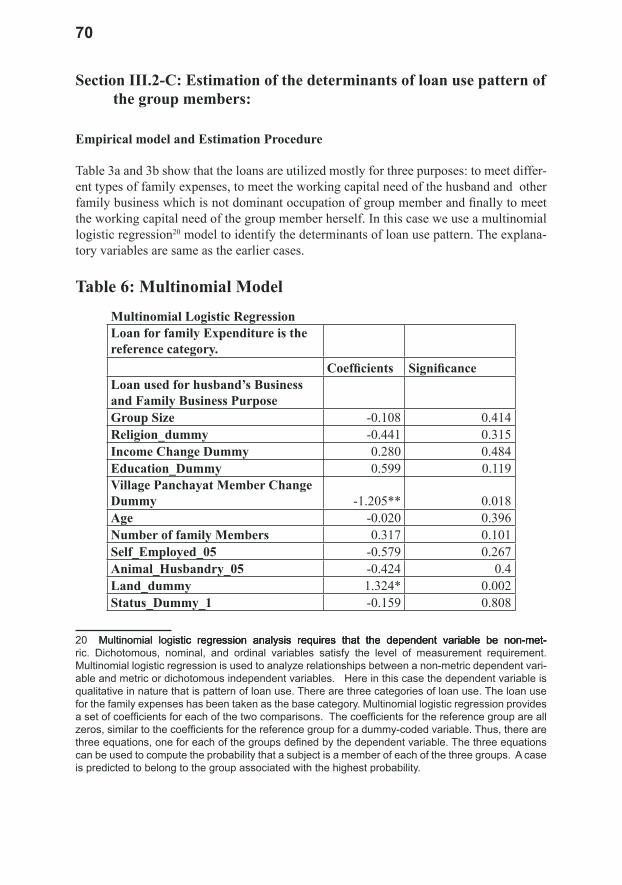
Table 3a and 3b show that the loans are utilized mostly for three purposes: to meet differ-ent types of family expenses, to meet the working capital need of the husband and other family business which is not dominant occupation of group member and finally to meet the working capital need of the group member herself. In this case we use a multinomial logistic regression20 model to identify the determinants of loan use pattern. The explana-tory variables are same as the earlier cases.
Table 6: Multinomial Model
Multinomial Logistic RegressionLoan for family Expenditure is the reference category.
Coefficients SignificanceLoan used for husband’s Business and Family Business Purpose Group Size -0.108 0.414Religion_dummy -0.441 0.315Income Change Dummy 0.280 0.484Education_Dummy 0.599 0.119Village Panchayat Member Change Dummy -1.205** 0.018Age -0.020 0.396Number of family Members 0.317 0.101Self_Employed_05 -0.579 0.267Animal_Husbandry_05 -0.424 0.4Land_dummy 1.324* 0.002Status_Dummy_1 -0.159 0.808
20 Multinomial logistic regression analysis requires that the dependent variable be non-met- Multinomial logistic regression analysis requires that the dependent variable be non-met-stic regression analysis requires that the dependent variable be non-met-ric. Dichotomous, nominal, and ordinal variables satisfy the level of measurement requirement. Multinomial logistic regression is used to analyze relationships between a non-metric dependent vari-ableandmetricordichotomousindependentvariables.Hereinthiscasethedependentvariableisqualitative in nature that is pattern of loan use. There are three categories of loan use. The loan use forthefamilyexpenseshasbeentakenasthebasecategory.Multinomiallogisticregressionprovidesasetofcoefficientsforeachofthetwocomparisons.Thecoefficientsforthereferencegroupareallzeros,similartothecoefficientsforthereferencegroupforadummy-codedvariable.Thus,therearethreeequations,oneforeachofthegroupsdefinedbythedependentvariable.Thethreeequationscan be used to compute the probability that a subject is a member of each of the three groups. A case is predicted to belong to the group associated with the highest probability.
71
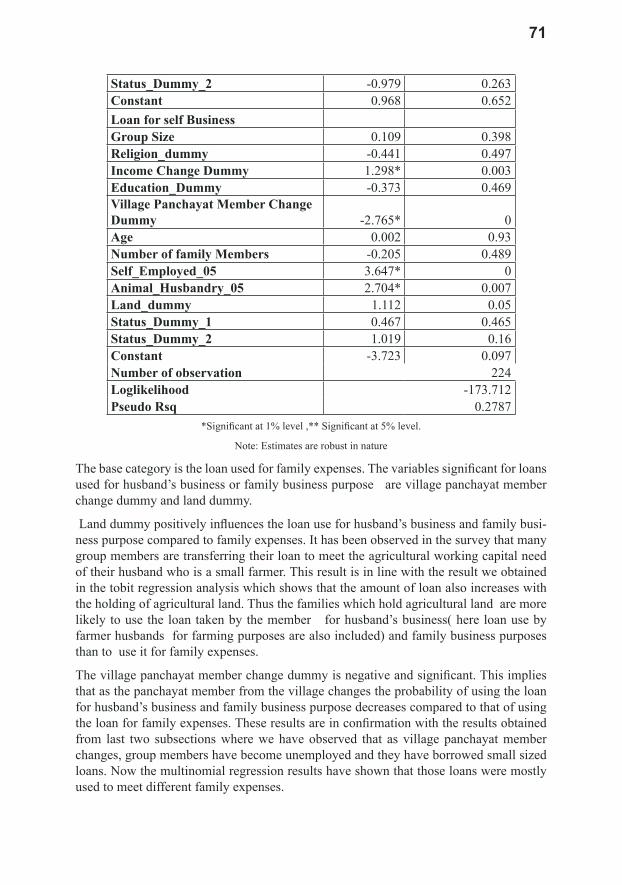
Status_Dummy_2 -0.979 0.263Constant 0.968 0.652Loan for self BusinessGroup Size 0.109 0.398Religion_dummy -0.441 0.497Income Change Dummy 1.298* 0.003Education_Dummy -0.373 0.469Village Panchayat Member Change Dummy -2.765* 0Age 0.002 0.93Number of family Members -0.205 0.489Self_Employed_05 3.647* 0Animal_Husbandry_05 2.704* 0.007Land_dummy 1.112 0.05Status_Dummy_1 0.467 0.465Status_Dummy_2 1.019 0.16Constant -3.723 0.097Number of observation 224Loglikelihood -173.712Pseudo Rsq 0.2787
*Significant at 1% level ,** Significant at 5% level.
Note: Estimates are robust in nature
The base category is the loan used for family expenses. The variables significant for loans used for husband’s business or family business purpose are village panchayat member change dummy and land dummy.
Land dummy positively influences the loan use for husband’s business and family busi-ness purpose compared to family expenses. It has been observed in the survey that many group members are transferring their loan to meet the agricultural working capital need of their husband who is a small farmer. This result is in line with the result we obtained in the tobit regression analysis which shows that the amount of loan also increases with the holding of agricultural land. Thus the families which hold agricultural land are more likely to use the loan taken by the member for husband’s business( here loan use by farmer husbands for farming purposes are also included) and family business purposes than to use it for family expenses.
The village panchayat member change dummy is negative and significant. This implies that as the panchayat member from the village changes the probability of using the loan for husband’s business and family business purpose decreases compared to that of using the loan for family expenses. These results are in confirmation with the results obtained from last two subsections where we have observed that as village panchayat member changes, group members have become unemployed and they have borrowed small sized loans. Now the multinomial regression results have shown that those loans were mostly used to meet different family expenses.
72
The variables significant for self business loans are village panchayat member change dummy, income change dummy, occupation dummies and the land holding dummy.
The village panchayat member change dummy is negative and significant. This is in con-firmation with previous results. This states that if the panchayat member from the village changes the existing self help group members stand to loose. The literature on politi-cal dimension and the public service delivery has shown that the party members always shower benefits on the followers of the parties. At the village level the panchayat member representing a village has the power to provide benefits to the villagers. The self help group members may get benefits from the panchayat member from the village. But as the party changes the existing group members may not get benefits any more as they have already received benefits from the opponent party. So the social benefits get diminished and so the probability of using the loan for self business declines compared to that of family expenses.
The income change dummy is positive and significant. This infers that the positive change of family income over a period of time has positive influence on use of loan for self busi-ness purpose.
The land holding also positively influences the probability of loan use for self business. Basically employed group members who are taking loan for self business purpose have significantly higher average amount of loan than the unemployed group members.21 In this case family land holding may be acting as pseudo collateral to get large amount of loan hence positively influencing the probability of taking a self business loan against family expense loan.
The probability of the loan use for the self business purpose increases relative to that of the family expenses if the members are self-employed or in animal husbandry during 2005. As already mentioned this type of loan is taken by the group members who are pres-ently in self-employment or in animal husbandry. Table 1 shows that people who were in these two occupational categories are mostly employed in 2009. Most of the people who were in self-employment had remained so and some people from the animal husbandry category had shifted to self employment in 2009 also. Hence follows the results.
Section IV: Conclusion
This paper has tried to identify the factors responsible for continuity of employment sta-tus of the woman members of the self help groups. The decision of the woman to work depends on probability of success of the woman employment. The probability of suc-cess depends on various socio economic demographic factors of the household as well as on local politics. The most striking result that has been obtained here is that the local politics plays a very crucial role in determining the employment status of the members. The political stability of the village ensures employment of the members whereas, as
21 Analysisshowsthataveragesizeofloantakenforselfbusinesspurposeissignificantlyhigherthan that of other types of loans.
73
the village representative changes from a particular village the employment of the self help group members gets affected. Moreover local politics also affects use of loan. The political stability in terms of no change of village representative from a particular village during panchayat election 2008 positively affects the size of the loan amount as well as positively influences the probability of loan use for self business or for husband’s busi-ness or for family business compared to that of the loan use for family expenses.
The other factor that influences the employment status of the member is the past occu-pation. Those women who were working as labourers during 2005 survey have mostly become unemployed compared to other categories of profession.
The self help groups which were formed with the objective of providing financial as-sistance to the poor woman to engage them into economic activities have failed in many cases.
In order to fulfill this objective the operation and functioning of the self help groups have to be devoid of any local politics.
Appendix 1
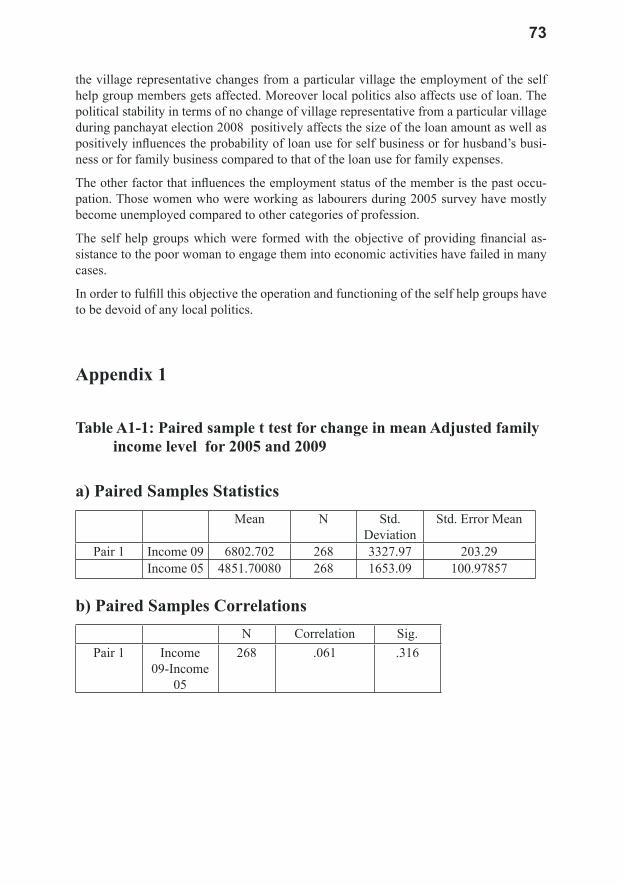
Table A1-1: Paired sample t test for change in mean Adjusted family income level for 2005 and 2009
a) Paired Samples StatisticsMean N Std.
DeviationStd. Error Mean
Pair 1 Income 09 6802.702 268 3327.97 203.29Income 05 4851.70080 268 1653.09 100.97857
b) Paired Samples CorrelationsN Correlation Sig.
Pair 1 Income 09-Income
05
268 .061 .316
74
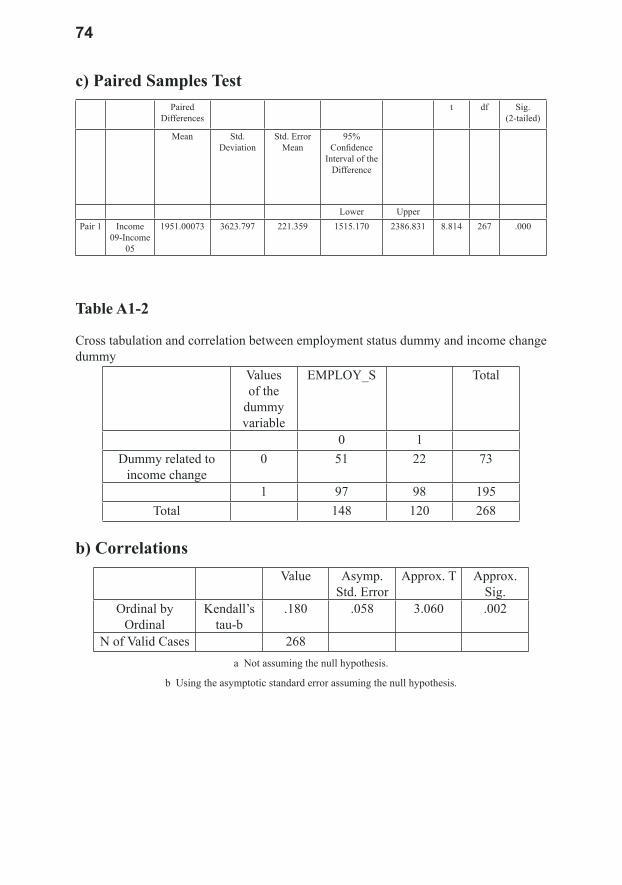
c) Paired Samples TestPaired
Differencest df Sig.
(2-tailed)
Mean Std. Deviation
Std. Error Mean
95% Confidence
Interval of the Difference
Lower UpperPair 1 Income
09-Income 05
1951.00073 3623.797 221.359 1515.170 2386.831 8.814 267 .000
Table A1-2
Cross tabulation and correlation between employment status dummy and income change dummy
Values of the
dummy variable
EMPLOY_S Total
0 1Dummy related to
income change0 51 22 73
1 97 98 195Total 148 120 268
b) CorrelationsValue Asymp.
Std. ErrorApprox. T Approx.
Sig.Ordinal by
OrdinalKendall’s
tau-b.180 .058 3.060 .002
N of Valid Cases 268a Not assuming the null hypothesis.
b Using the asymptotic standard error assuming the null hypothesis.
75
Table A1-3
Cross tabulation and correlation between training dummy and village panchayat member change dummy
TRAINING Total 0 1
Village member change dummy
0 38 67 105
1 151 12 163Total 189 79 268
Count Value Asymp.
Std. ErrorApprox. T Approx.
Sig.Ordinal by
OrdinalKendall’s
tau-b-.604 .049 -10.571 .000
N of Valid Cases
268
a Not assuming the null hypothesis.
b Using the asymptotic standard error assuming the null hypothesis.
Table A1-4
Cross tabulation and correlation between training dummy and employment Status DummyTRAINING Total
0 1Employment
Status0 125 23 148
1 64 56 120Total 189 79 268
Symmetric MeasuresValue Asymp.
Std. ErrorApprox. T Approx.
Sig.Ordinal by
OrdinalKendall’s
tau-b.339 .057 5.705 .000
N of Valid Cases
268
a Not assuming the null hypothesis.
b Using the asymptotic standard error assuming the null hypothesis.
76
Table A1-5: Comparison of loan size for employed group members and unemployed group members
Group Statistics EMPLOY_S N Mean Std.
DeviationStd. Error
MeanLOAN 1 120 2853.33 2595.73 236.96
0
148 1883.11 2355.52 193.62
t-test for Equality of Means Levene’s Test for Equality of Variances
Sig.t
df
95% Confidence Interval of the
DifferenceStd. Error DifferenceMean DifferenceSig. (2-tailed)F
UpperLowerLOAN Equal variances assumed
.0213.203266
1566.64373.81302.91970.23.0025.407
Equal variances not assumed3.171
243.194
1572.98367.47306. 00970.23.002
Independent Samples Test
77
Appendix 2
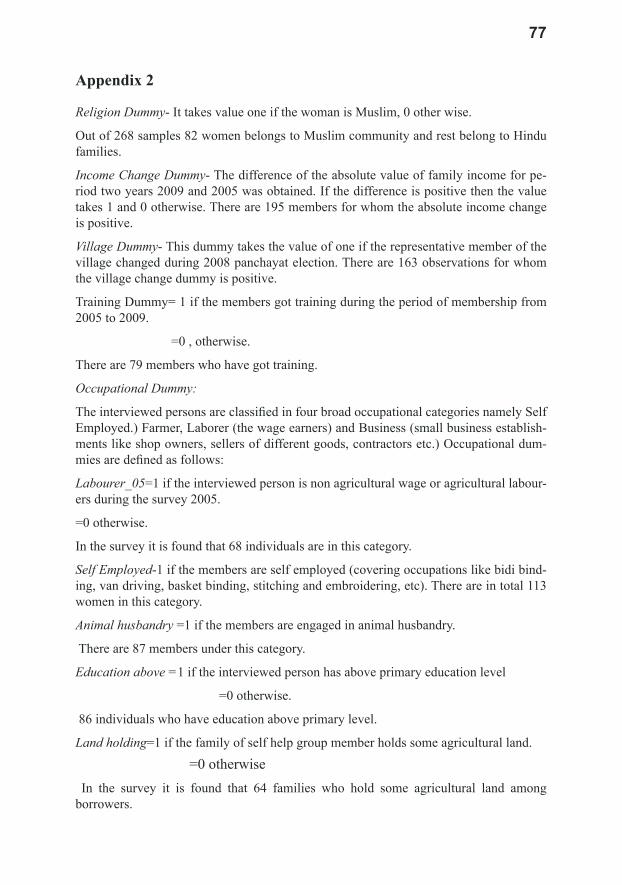
Religion Dummy- It takes value one if the woman is Muslim, 0 other wise.
Out of 268 samples 82 women belongs to Muslim community and rest belong to Hindu families.
Income Change Dummy- The difference of the absolute value of family income for pe-riod two years 2009 and 2005 was obtained. If the difference is positive then the value takes 1 and 0 otherwise. There are 195 members for whom the absolute income change is positive.
Village Dummy- This dummy takes the value of one if the representative member of the village changed during 2008 panchayat election. There are 163 observations for whom the village change dummy is positive.
Training Dummy= 1 if the members got training during the period of membership from 2005 to 2009.
=0 , otherwise.
There are 79 members who have got training.
Occupational Dummy:
The interviewed persons are classified in four broad occupational categories namely Self Employed.) Farmer, Laborer (the wage earners) and Business (small business establish-ments like shop owners, sellers of different goods, contractors etc.) Occupational dum-mies are defined as follows:
Labourer_05=1 if the interviewed person is non agricultural wage or agricultural labour-ers during the survey 2005.
=0 otherwise.
In the survey it is found that 68 individuals are in this category.
Self Employed-1 if the members are self employed (covering occupations like bidi bind-ing, van driving, basket binding, stitching and embroidering, etc). There are in total 113 women in this category.
Animal husbandry =1 if the members are engaged in animal husbandry.
There are 87 members under this category.
Education above =1 if the interviewed person has above primary education level
=0 otherwise.
86 individuals who have education above primary level.
Land holding=1 if the family of self help group member holds some agricultural land.
=0 otherwise In the survey it is found that 64 families who hold some agricultural land among borrowers.
78
Status_Dummy_1=1, if the woman has higher status in the family than husband . =0 , otherwise,
Status_Dummy_2=1 , If the woman has same status as that of her husband in the family =0, otherwise.
References[1] Banerjee (Chatterjee), T (2009), “Economic Impact of Self Help Groups—A Case
Study”, Journal of Rural Development, Vol 20, No. 4, pp.451-467[2] Bardhan, P, S. Mitra, D. Mookherjee and A. Sarkar (2008), “Political Participation,
Clientelism And Targeting of Local Government Programs: Analysis of Survey Results from Rural West Bengal”, India, Discussion Paper, ERU/2008-03 April 15, 2008, http://www.isical.ac.in/~eru/erudp/2008-03.pdf
[3] Garikipati, S (2009), “My Money But Not My Time: Microcredit and Woman’s Time-Use”,wp2009/41,http://www.liv.ac.uk/managementschool/research/work-ing%20papers/working_papers.htm
[4] Garikipati, Supriya(2008), “The Impact of Lending to Women on Household Vulnerability and Women’s Empowerment: Evidence from India” , World Development ,Vol. 36, No. 12, pp. 2620–2642.
[5] Imai, S Katsushi , Thankom Arun and Samuel Kobina Annim(2010), “Microfinance and Household Poverty Reduction: New Evidence from India”, doi:10.1016/j., World Development,.2010.04.006.
[6] Khandker, S (2003), “Micro-Finance and Poverty Evidence Using Panel Data from Bangladesh”, Policy Research Working Paper 2945, World Bank, Research Development Group.
[7] Khandker, S. (2005), “Microfinance and poverty: Evidence using panel data from Bangladesh”, World Bank Economic Review, Vol- 19, No. 2, pp.263–286.
[8] McKernan Signe-Mary (2002), “The Impact of Microcredit Programs on Self-Employment Profits: Do Noncredit Program Aspects Matter?”, The Review of Economics and Statistics, Vol. 84, No. 1, pp. 93-115
[9] Parida. C Purna and Anusree Sinha (2010) , “Performance and Sustainability of Self-Help Groups in India: A Gender Perspective”, Asian Development Review, Vol. 27, No. 1, pp. 80–103
[10] Srinivasan, N (2009), Micro Finance India State of the Sector Report 2009, Sage.[11] Swain Bali Ranjula and Adel Varghese(2009) , “Does Self Help Group Participation
Lead to Asset Creation?” , World Development ,Vol. 37, No. 10, pp. 1674–1682.[12] Swain Bali Ranjula and FanYang Wallentin(2009), “Does Microfinance Empower
Women?”, International Review of Applied Economics, Vol- 23, No.5,pp. 541-556. [13] Swain Bali Ranjula and Maria Floro (2007), “Effect of Microfinance on
Vulnerability, Poverty and Risk in Low Income Households”, Working Paper 2007:31, Department of Economics, Uppsala University, 2007.
[14] Tassel, Eric Van (2004), “Household bargaining and microfinance”, Journal of Development Economics, Vol- 74, No. 2, pp. 449-468.
[15] Tedeschi, G. (2008), “Overcoming selection bias in microcredit impact assess-ments: A case study in Peru”, Journal of Development Studies, Vol-44, No. 4, pp.504–518.