myth and reality in the search for the wider benefits of
TRANSCRIPT
Myth and reality in the search
for the wider benefits of
transport
Roger Vickerman
Centre for European, Regional and Transport Economics
University of Kent, Canterbury, UK
TSU Seminar Series: The Future of Transport,
Oxford, 23 February 2011
2
Introduction and motivation• Transport as a determinant of land use and
economic development (wider economic benefits -WEB) the subject of much controversy
• Formal appraisal techniques tend either– to exclude the possibility of wider economic impacts
because of the fear of double counting
– or simply include an arbitrary add on
• Recent work has improved our understanding of the way in which accessibility– affects the performance of firms,
– labour markets.
3
Introduction and motivation• However, the empirical evidence remains
problematic– endogeneity and causality questions
– conflicts between macro-and micro-based estimates
– the interrelationship and spillovers between different areas
• This has policy implications:– underinvestment in transport infrastructure could lead
to• lower growth• congestion
– overinvestment could lead to • problems for public budgets• negative externalities associated with over expansion.
4
Outline• Transport and the local economy
• Transport policy objectives
• The agglomeration issue
• Looking for evidence:– Macro studies
– Market studies
– Micro studies
• Implications for appraisal
• Implications for policy
5
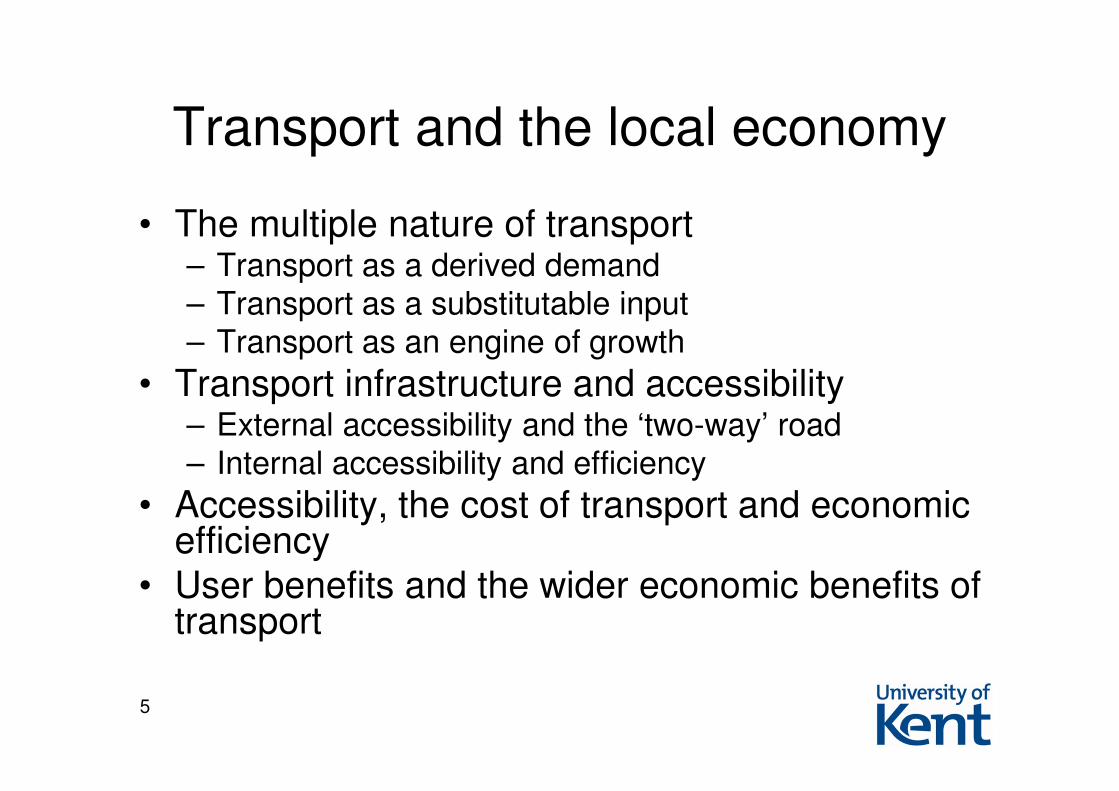
Transport and the local economy
• The multiple nature of transport– Transport as a derived demand
– Transport as a substitutable input
– Transport as an engine of growth
• Transport infrastructure and accessibility– External accessibility and the ‘two-way’ road
– Internal accessibility and efficiency
• Accessibility, the cost of transport and economic efficiency
• User benefits and the wider economic benefits of transport
6
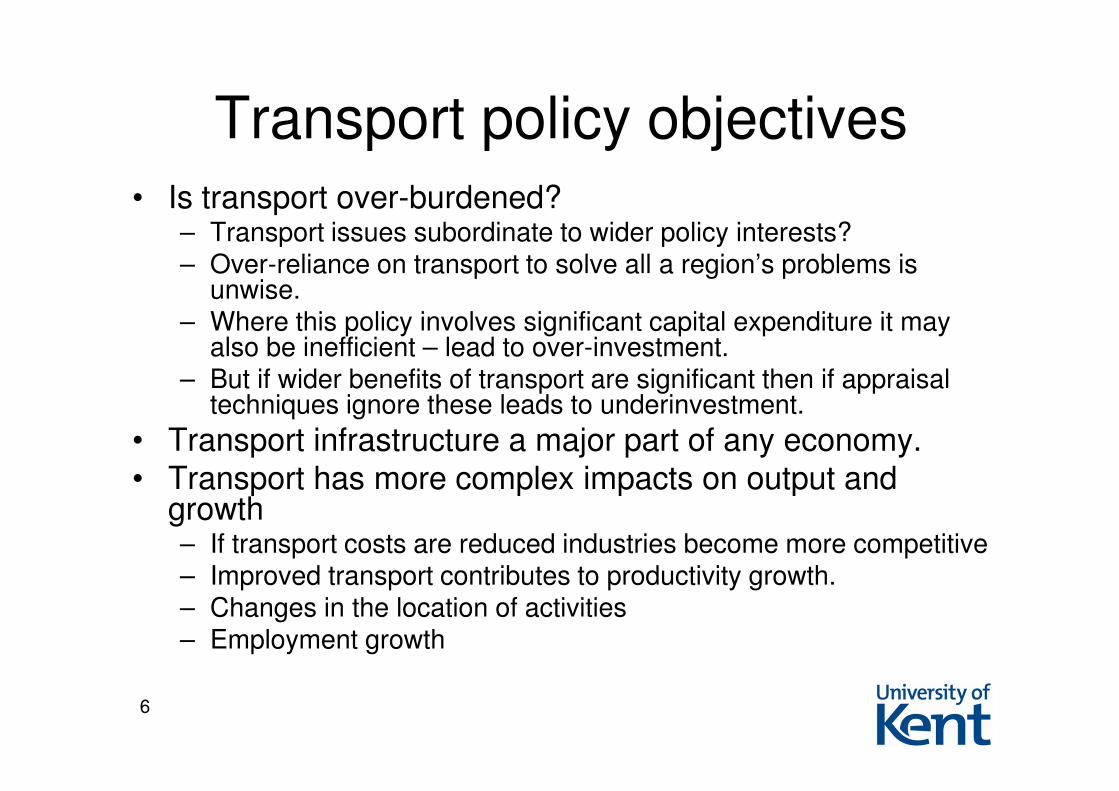
Transport policy objectives• Is transport over-burdened?
– Transport issues subordinate to wider policy interests? – Over-reliance on transport to solve all a region’s problems is
unwise. – Where this policy involves significant capital expenditure it may
also be inefficient – lead to over-investment. – But if wider benefits of transport are significant then if appraisal
techniques ignore these leads to underinvestment.
• Transport infrastructure a major part of any economy.
• Transport has more complex impacts on output and growth– If transport costs are reduced industries become more competitive – Improved transport contributes to productivity growth. – Changes in the location of activities– Employment growth
7
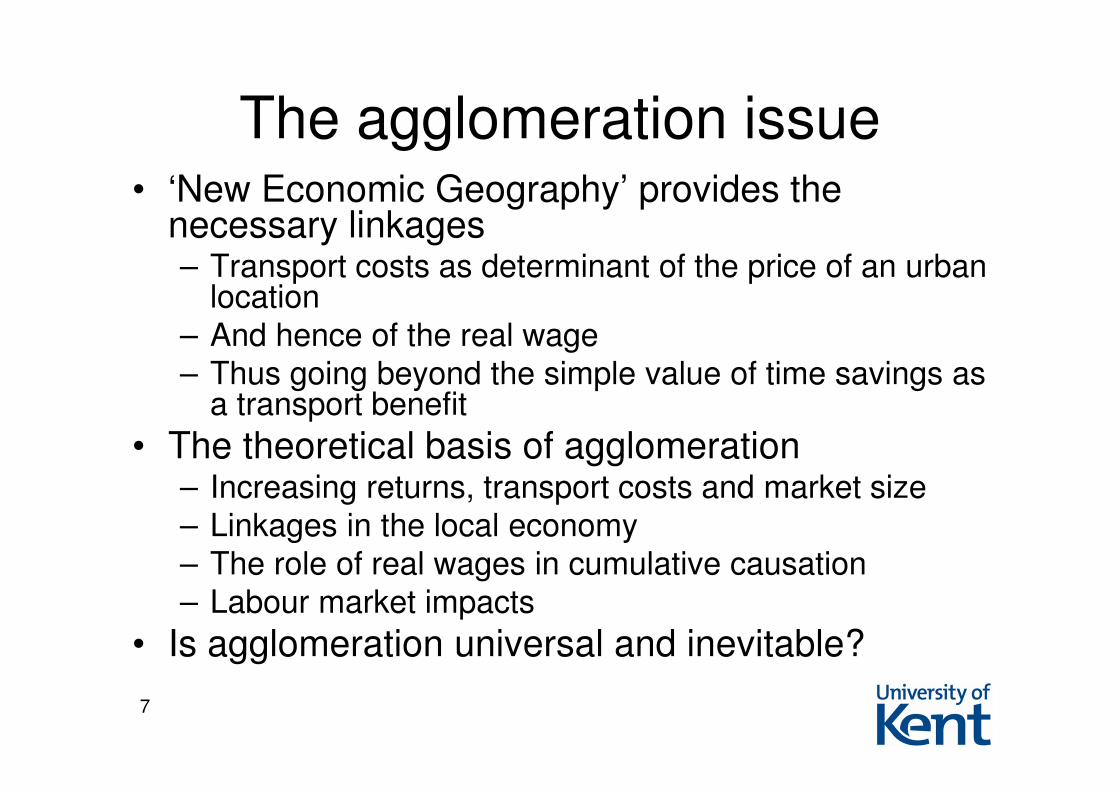
The agglomeration issue• ‘New Economic Geography’ provides the
necessary linkages– Transport costs as determinant of the price of an urban
location
– And hence of the real wage
– Thus going beyond the simple value of time savings as a transport benefit
• The theoretical basis of agglomeration– Increasing returns, transport costs and market size
– Linkages in the local economy
– The role of real wages in cumulative causation
– Labour market impacts
• Is agglomeration universal and inevitable?

8
Labour market impacts • Removal of barriers - integration of labour
markets
• Agglomeration benefits in labour markets– Changing participation rates
– Increased working hours
– Moves to more productive jobs - increased size of commuting area has impacts on productivity and wage differentials
• Dangers of transferring parameters – Between modes
– Between cities
– Does analysis of effects on individual city regions work for inter-city connections?

9
Costs/
Benefits
Labour market sizeL0
B0
C0
α
β
γ
δ
W (= wage gap)
City size and agglomeration benefits
After Venables (2007)
No agglomeration economies:Wage gap unchanged at B0
LM size increases to L1’Net Benefits = α+β
β′
γ′
Transport costs fall C0 to C1
Agglomeration economies:Wage gap increases to B1
LM size increases to L1
Net Benefits = α+(β+β′)+δ
B1
L1′ L1
C1
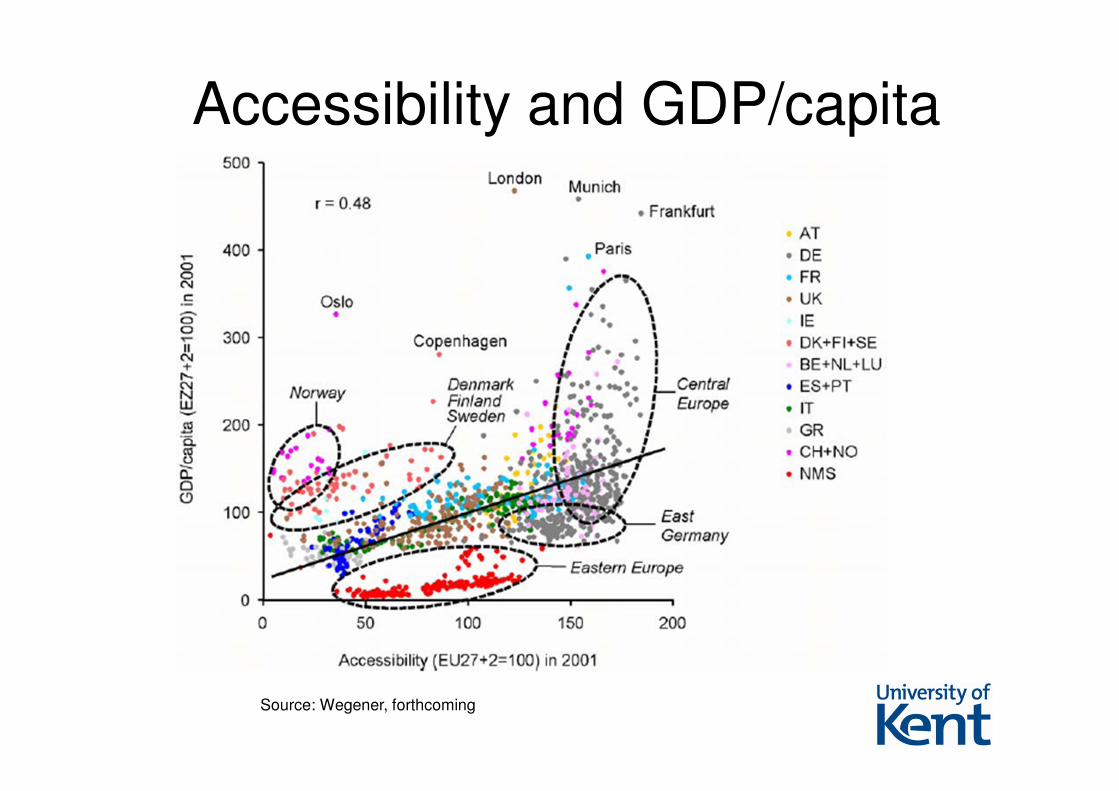
Accessibility and GDP/capita
Source: Wegener, forthcoming

11
Looking for the evidence• Theoretical explanations and numerical simulations
demonstrate relevance, but useful application requires empirical evidence based on real data
• But such evidence is not straightforward and depends on:– The geographical scale of the empirical study
– The unit of analysis
– The ability to control for other factors which determine urban development
• Look at three levels and types of study– Those which only look at macro aggregates
– Those which examine the working of individual markets
– Those which look in detail at the behavioural responses of individual agents.
12
Evidence – macro studies• The Aschauer legacy
– The productivity of public infrastructure
– Public infrastructure and the enhancement of the productivity of private infrastructure
– Debunking crowding out
– Excessive optimism
– Geographic scale
• Econometric problems– Causality
– Spatial autocorrelation and spatial spillovers
• What should we measure?– Output
– Employment
– Productivity
13
Evidence – macro studies
• Alternatives to aggregate econometrics– Land Use Transport Interaction Models
• Multiple markets with specific transport use
• Based on static input-output relations
• Need to allow for dynamic behavioural response
– Computable General Equilibrium Models• Allow for whole network evaluation
• More interaction between markets
• Identify case specificity of results
• Imply larger wider benefits/user benefits
• Ex post studies of impacts– Rare and less encouraging
14
Evidence – market studies• Exploring detail of agglomeration models
• Competition effects– Ambiguity
– Pro-competitive effects from lower transport costs
– Limited by existence of imperfect competition and rent seeking
• Agglomeration effects– Localisation economies
– Urbanisation economies
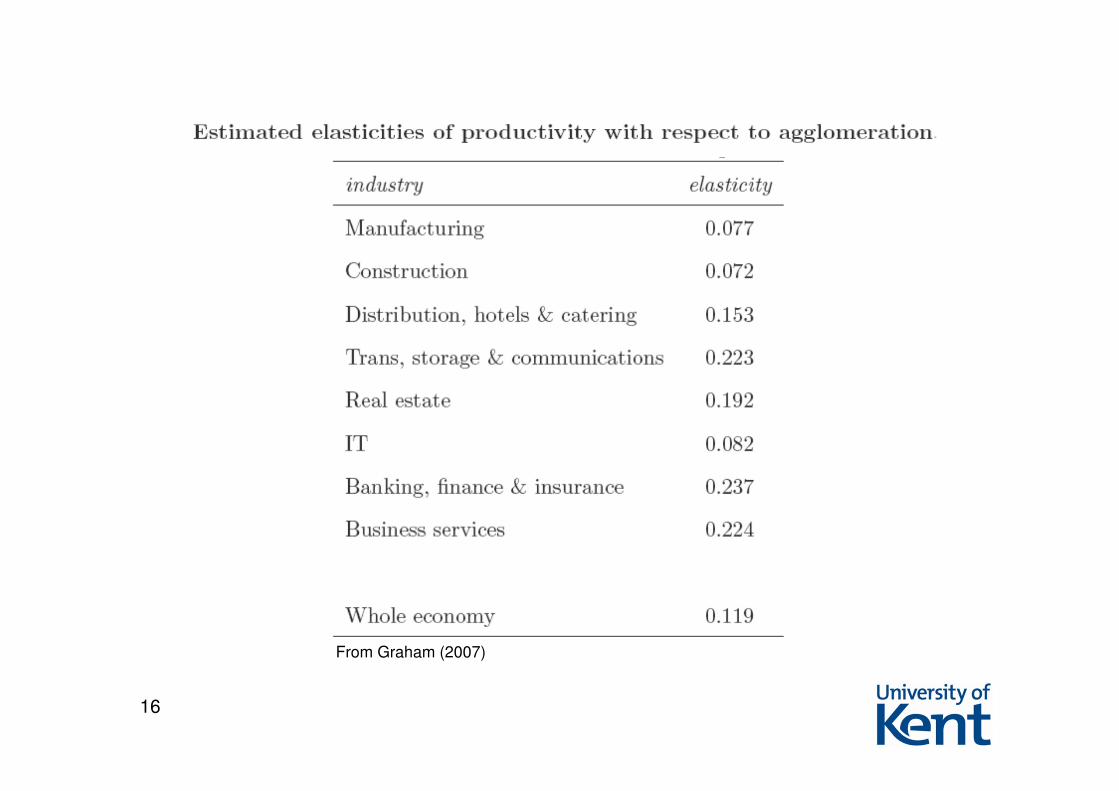
– Productivity effects – elasticities typically 0.01 to 0.4 for industry but 0.2 or higher for services
– Spatial scale variations
• Linkage effects – Labour markets
15
Estimating elasticities
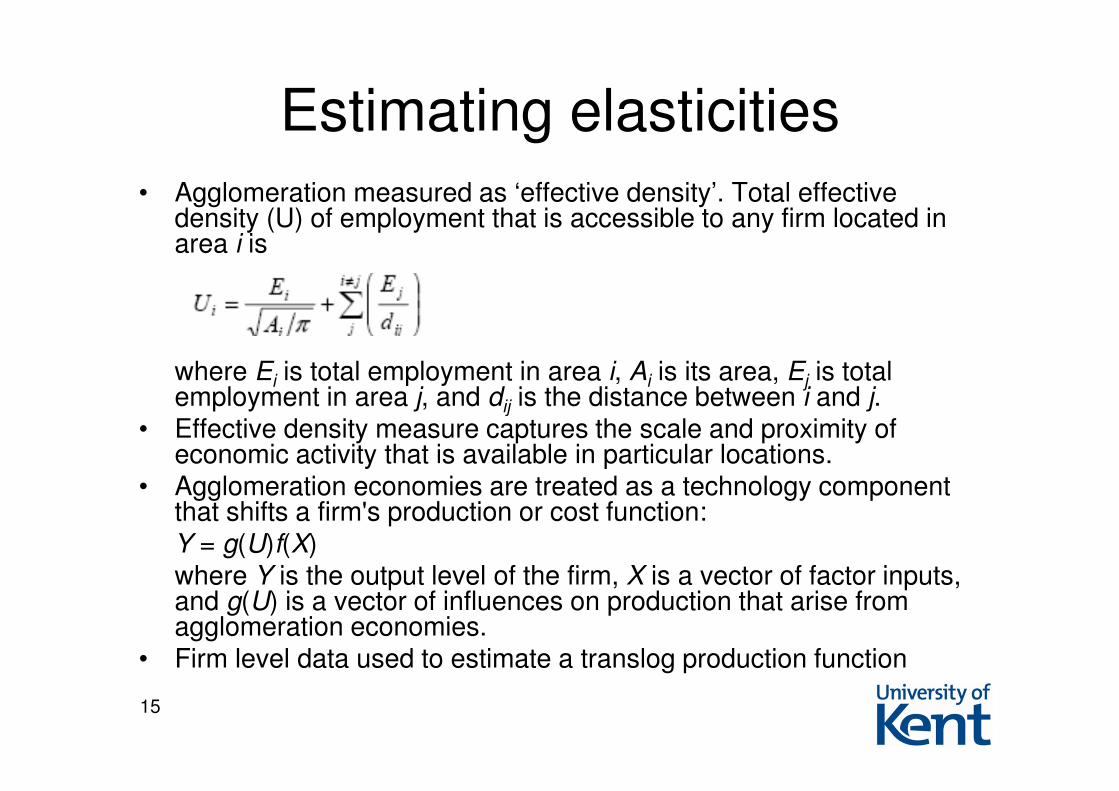
• Agglomeration measured as ‘effective density’. Total effective density (U) of employment that is accessible to any firm located in area i is
where Ei is total employment in area i, Ai is its area, Ej is total employment in area j, and dij is the distance between i and j.
• Effective density measure captures the scale and proximity of economic activity that is available in particular locations.
• Agglomeration economies are treated as a technology component that shifts a firm's production or cost function:Y = g(U)f(X)where Y is the output level of the firm, X is a vector of factor inputs, and g(U) is a vector of influences on production that arise from agglomeration economies.
• Firm level data used to estimate a translog production function
16
From Graham (2007)
17
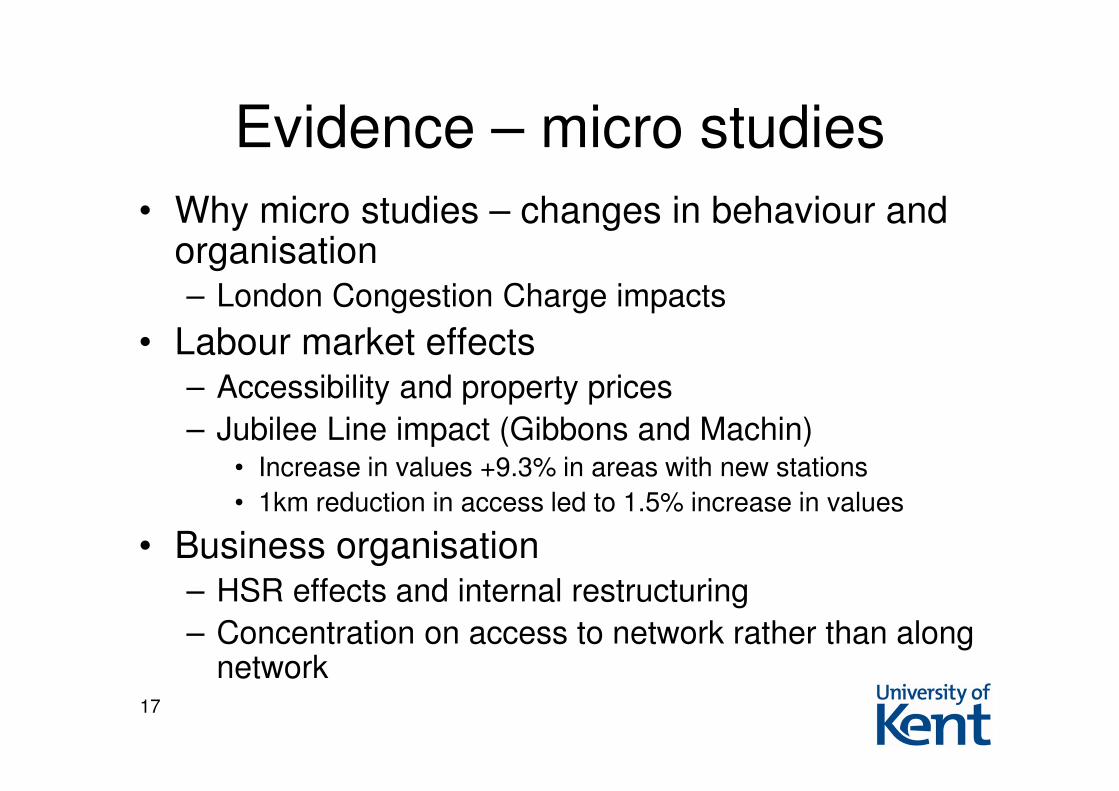
Evidence – micro studies
• Why micro studies – changes in behaviour and organisation– London Congestion Charge impacts
• Labour market effects– Accessibility and property prices
– Jubilee Line impact (Gibbons and Machin)• Increase in values +9.3% in areas with new stations
• 1km reduction in access led to 1.5% increase in values
• Business organisation – HSR effects and internal restructuring
– Concentration on access to network rather than along network
18
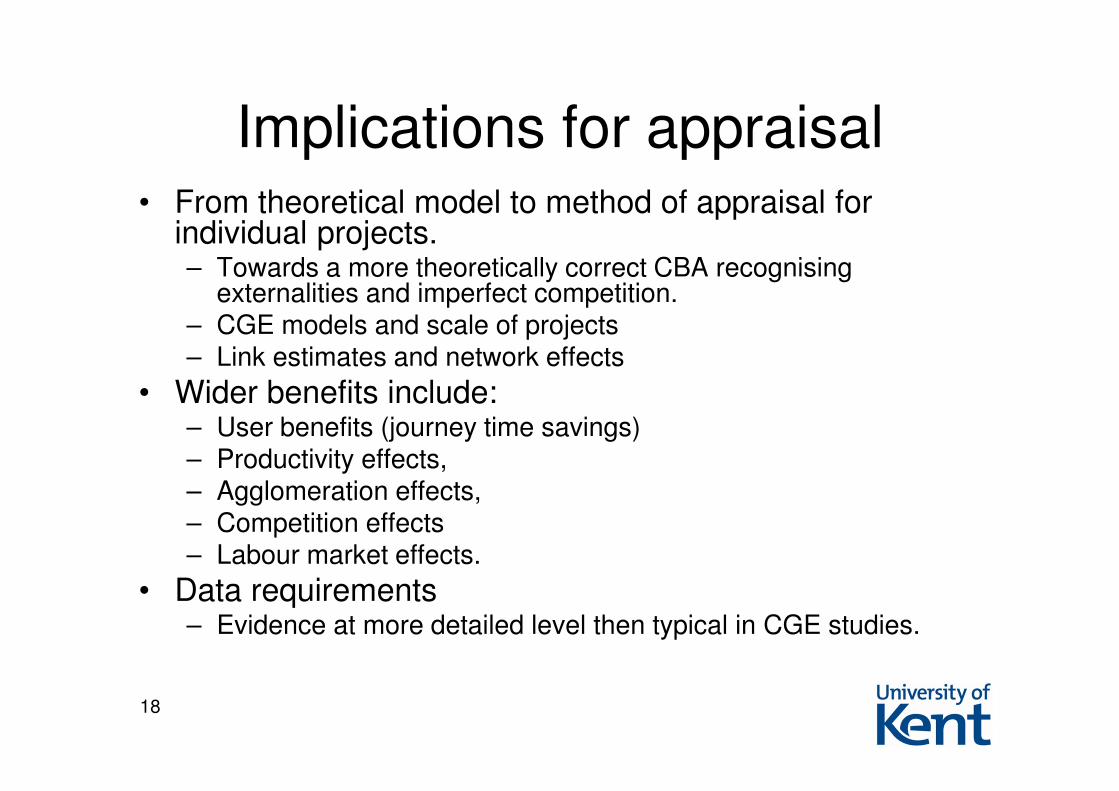
Implications for appraisal• From theoretical model to method of appraisal for
individual projects. – Towards a more theoretically correct CBA recognising
externalities and imperfect competition.– CGE models and scale of projects– Link estimates and network effects
• Wider benefits include:– User benefits (journey time savings)– Productivity effects, – Agglomeration effects, – Competition effects– Labour market effects.
• Data requirements– Evidence at more detailed level then typical in CGE studies.
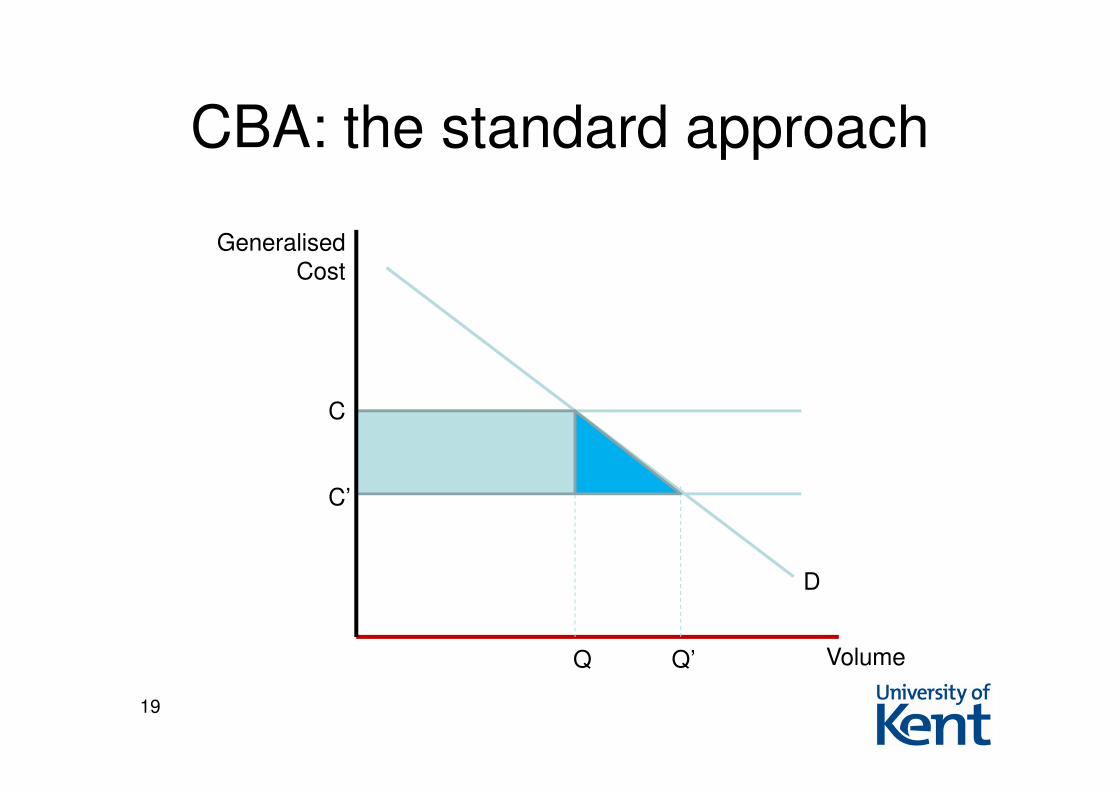
CBA: the standard approach
19
C
C’
Q Q’
Generalised
Cost
Volume
D

CBA: the standard approach• But what are the assumptions lying behind this?
– Perfect competition so that p=mc
– No externalities so that mc=smc
– No returns to scale so mc constant
– Demand is only responsive to a change in price, not a change in supply (i.e. a fixed trip matrix)
• Suppose we change these assumptions– mc is upward sloping and smc>mc
– But with increasing returns mc could slope down
– p≠mc
– And D could shift outwards in response to changing opportunities
– But suppose that agglomeration also caused mc to shift downwards
– Is the outcome now so determinate?20
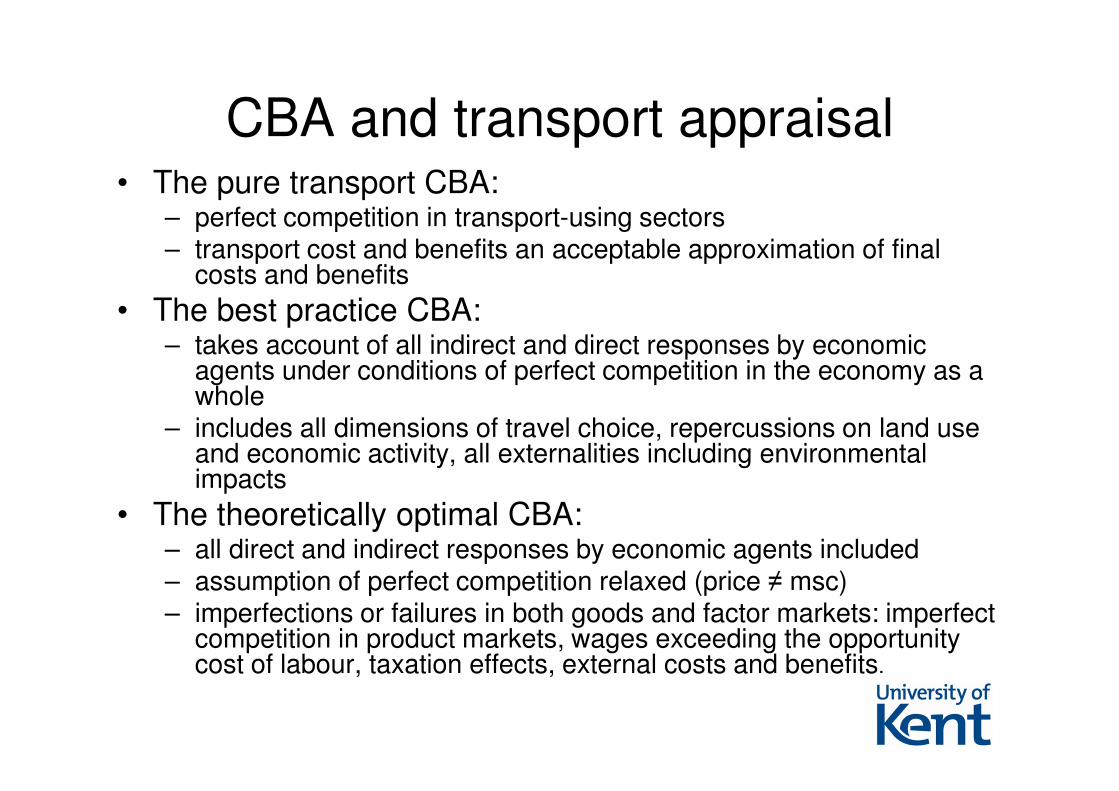
CBA and transport appraisal• The pure transport CBA:
– perfect competition in transport-using sectors– transport cost and benefits an acceptable approximation of final
costs and benefits
• The best practice CBA: – takes account of all indirect and direct responses by economic
agents under conditions of perfect competition in the economy as a whole
– includes all dimensions of travel choice, repercussions on land use and economic activity, all externalities including environmental impacts
• The theoretically optimal CBA: – all direct and indirect responses by economic agents included – assumption of perfect competition relaxed (price ≠ msc)– imperfections or failures in both goods and factor markets: imperfect
competition in product markets, wages exceeding the opportunity cost of labour, taxation effects, external costs and benefits.

22
Two case studies• Crossrail
– Urban rail project in London
– Cost GBP16bn
– Direct user benefits insufficient
– But could have significant agglomeration benefits?
• HS2– High-speed rail line London-Birmingham (with
possible extensions northwards)
– Cost GBP25.5bn
– Direct user benefits estimated sufficient
– But wider benefits add (although relatively smaller than urban situation)
– Have all the impacts been captured?
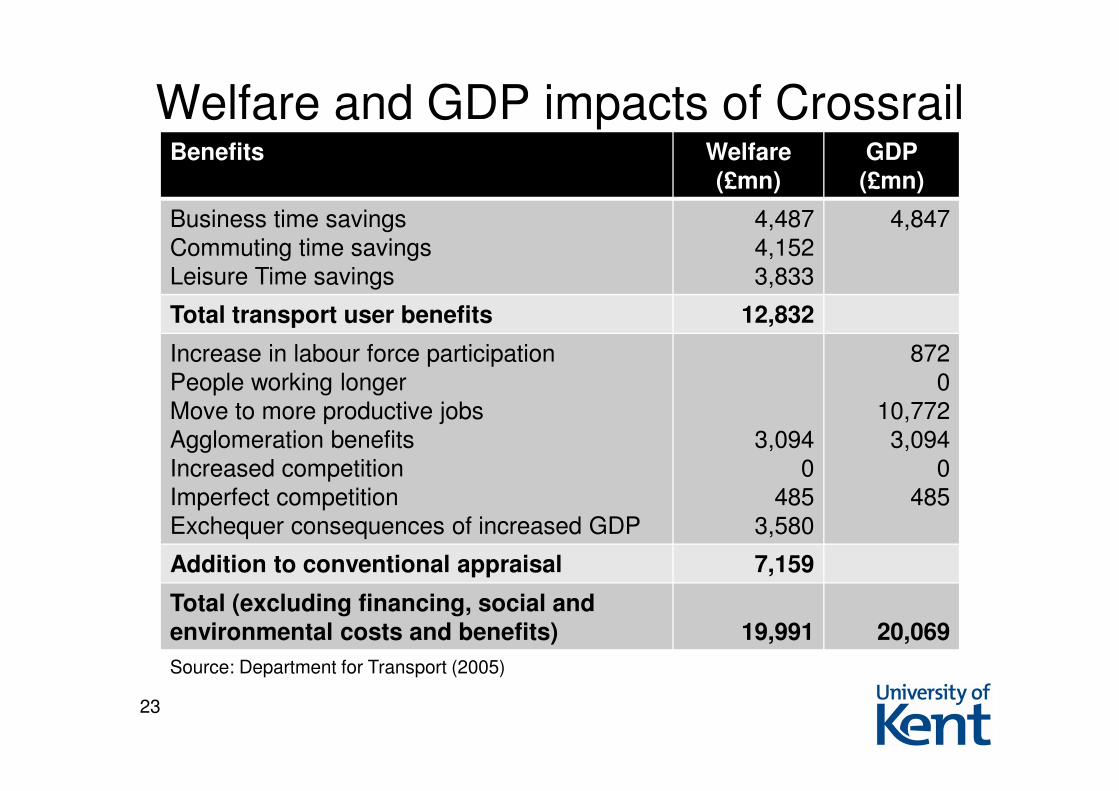
Welfare and GDP impacts of Crossrail
23
Benefits Welfare
(£mn)
GDP
(£mn)
Business time savings
Commuting time savings
Leisure Time savings
4,487
4,152
3,833
4,847
Total transport user benefits 12,832
Increase in labour force participation
People working longer
Move to more productive jobs
Agglomeration benefits
Increased competition
Imperfect competition
Exchequer consequences of increased GDP
3,094
0
485
3,580
872
0
10,772
3,094
0
485
Addition to conventional appraisal 7,159
Total (excluding financing, social and environmental costs and benefits) 19,991 20,069
Source: Department for Transport (2005)

Estimated Benefits from HS2
24
Benefits £mn
Time savings
Business user savings
Commuting and leisure savings
Other benefits – accidents, air quality, noise
17,600
11,100
<100
Total transport user benefits 28,700
Labour market impacts
Increase in labour force participation
People working longer
Mover to more productive jobs
Exchequer consequences of increased GDP
Agglomeration benefits
Increased competition
Imperfect competition
0
0
Not included
0
2,000
0
1,600
Total additional benefits 3,600
Total (excluding financing, social and
environmental costs and benefits) 32,300
Source: Department for Transport (2010)

Costs and Benefits of HS2 PV 2009 over 60yrs at 2009 prices
25
£bn
Transport user benefits
Business
Other
Other benefits (excl. carbon)
Net transport benefits
17.6
11.1
<0.1
28.7
Wider economic impacts
Net benefits incl WEI
3.6
32.3
Capital costs
Operating costs
Total costs
17.8
7.6
25.5
Revenues
Indirect taxes
Net costs to Government
15
-1.5
11.9
Benefit cost ratio without WEI
Benefit cost ratio with WEI
2.4
2.7
Source: Department for Transport (2010)

26
Implications for policy
• Simple rules are dangerous– Investment in transport can damage your health
– Failure to invest in transport can damage it too
• Appraisal rules need to be comprehensive but transparent – Decisions have to be robust
– But clearly understood by all stakeholders
• Levels of decision making– Spillovers
– Policy refraction in multi-level governments
– Jurisdictional competition and over- or under-investment

27
Concluding remarks
• Full circle on wider benefits– From “transport is critical”
– To “beware double counting”
– To “wider benefits are the key”
• But beware all simple rules in transport appraisal
• There remains much on the research agenda– Imperfect competition and the productivity gains from
transport
– Micro-behavioural evidence
– Link versus network effects
– Spillovers and jurisdictional competition
– More ex post studies, does transport investment really make the difference claimed?