mysql performance webinar
TRANSCRIPT


Copyright © 2015, Oracle and/or its affiliates. All rights reserved. |
MySQL Performance Tuning
Abel Flórez MySQL Technical Account Manager September 2015

Copyright © 2015, Oracle and/or its affiliates. All rights reserved. |
Safe Harbor Statement
The following is intended to outline our general product direction. It is intended for information purposes only, and may not be incorporated into any contract. It is not a commitment to deliver any material, code, or functionality, and should not be relied upon in making purchasing decisions. The development, release, and timing of any features or functionality described for Oracle’s products remains at the sole discretion of Oracle.
3

Copyright © 2015, Oracle and/or its affiliates. All rights reserved. |
Program Agenda
General Info
InnoDB
Query Cache – Older systems
Threads and Table Cache
Session Level
Tools for monitoring, analyzing, and tuning queries
1
2
3
4
4
5
6

Copyright © 2015, Oracle and/or its affiliates. All rights reserved. |
Program Agenda
General Info
InnoDB
Query Cache – Older systems
Threads and Table Cache
Session Level
Tools for monitoring, analyzing, and tuning queries
1
2
3
5
4
5
6
Copyright © 2015, Oracle and/or its affiliates. All rights reserved. |
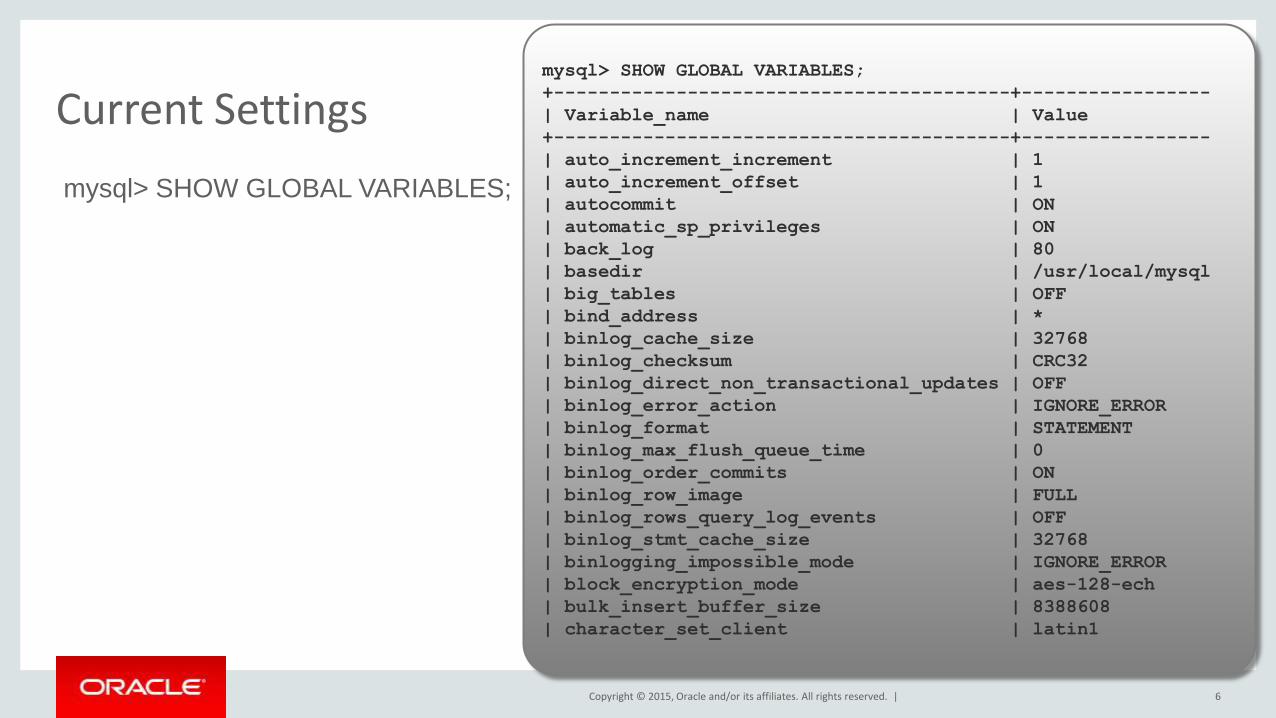
Current Settings
mysql> SHOW GLOBAL VARIABLES;
6
mysql> SHOW GLOBAL VARIABLES;
+-----------------------------------------+-----------------
| Variable_name | Value
+-----------------------------------------+-----------------
| auto_increment_increment | 1
| auto_increment_offset | 1
| autocommit | ON
| automatic_sp_privileges | ON
| back_log | 80
| basedir | /usr/local/mysql
| big_tables | OFF
| bind_address | *
| binlog_cache_size | 32768
| binlog_checksum | CRC32
| binlog_direct_non_transactional_updates | OFF
| binlog_error_action | IGNORE_ERROR
| binlog_format | STATEMENT
| binlog_max_flush_queue_time | 0
| binlog_order_commits | ON
| binlog_row_image | FULL
| binlog_rows_query_log_events | OFF
| binlog_stmt_cache_size | 32768
| binlogging_impossible_mode | IGNORE_ERROR
| block_encryption_mode | aes-128-ech
| bulk_insert_buffer_size | 8388608
| character_set_client | latin1

Copyright © 2015, Oracle and/or its affiliates. All rights reserved. |
Current Settings • my.cnf / my.ini
7
# The following options will be passed to MySQL clients
[client]
#password = your_password
#port = 5622
#socket = /tmp/mysql.5.6.22.sock
# The MySQL server
[mysqld]
####################
# specific to this test instance
port = 5622
socket = /tmp/mysql.5.6.22.sock
log-error = /usr/local/mysql/data/error.log
basedir = /usr/local/mysql
datadir = /usr/local/mysql/data
safe-user-create
####################
server-id = 1
sql_mode = NO_ENGINE_SUBSTITUTION,STRICT_TRANS_TABLES
table_open_cache = 4000

Copyright © 2015, Oracle and/or its affiliates. All rights reserved. |
Current Status
mysql> SHOW GLOBAL STATUS;
8
mysql> SHOW GLOBAL STATUS;
+--------------------------------------+---------------+
| Variable_name | Value |
+--------------------------------------+---------------+
| Aborted_clients | 9363 |
| Aborted_connects | 15925 |
| Binlog_cache_disk_use | 15684 |
| Binlog_cache_use | 272758675 |
| Bytes_received | 1219816389366 |
| Bytes_sent | 5227022143540 |
| Com_admin_commands | 12803263 |
| Com_assign_to_keycache | 0 |
| Com_alter_db | 0 |
| Com_alter_db_upgrade | 0 |
| Com_alter_event | 0 |
| Com_alter_function | 0 |
| Com_alter_procedure | 0 |
| Com_alter_server | 0 |
| Com_alter_table | 37 |
| Com_alter_tablespace | 0 |
| Com_analyze | 0 |
| Com_begin | 33025640 |
| Com_binlog | 0 |
| Com_call_procedure | 0 |
| Com_change_db | 1 |
| Com_change_master | 0 |
| Com_check | 0 |
| Com_checksum | 0 |
| Com_commit | 33025622 |

Copyright © 2015, Oracle and/or its affiliates. All rights reserved. |
COM_*
• Counters for each command
9
| Com_resignal | 0 |
| Com_revoke | 0 |
| Com_revoke_all | 0 |
| Com_rollback | 0 |
| Com_rollback_to_savepoint | 0 |
| Com_savepoint | 0 |
| Com_select | 1530076294 |
| Com_set_option | 18004985 |
| Com_signal | 0 |
| Com_show_authors | 0 |
| Com_show_binlog_events | 0 |
| Com_show_binlogs | 27498 |
| Com_show_charsets | 1 |
| Com_show_collations | 39 |
| Com_show_contributors | 0 |
| Com_show_create_db | 3 |
| Com_show_create_event | 0 |
| Com_show_create_func | 1120 |
| Com_show_create_proc | 14499 |
| Com_show_create_table | 183538 |
| Com_show_create_trigger | 0 |
| Com_show_databases | 435 |
| Com_show_engine_logs | 0 |
| Com_show_engine_mutex | 0 |
| Com_show_engine_status | 1180106 |
| Com_show_events | 0 |
| Com_show_errors | 0 |
| Com_show_fields | 2915144 |
| Com_show_function_status | 29 |
https://dev.mysql.com/doc/refman/5.6/en/server-status-variables.html
show global status like 'Com_%';

Copyright © 2015, Oracle and/or its affiliates. All rights reserved. |
Additional Commands
• Connections and Max_used_connections
10
https://dev.mysql.com/doc/refman/5.6/en/server-status-variables.html

Copyright © 2015, Oracle and/or its affiliates. All rights reserved. |
Additional Commands
• Connections and Max_used_connections
• Queries and Questions
11
https://dev.mysql.com/doc/refman/5.6/en/server-status-variables.html

Copyright © 2015, Oracle and/or its affiliates. All rights reserved. |
Additional Commands
• Connections and Max_used_connections
• Queries and Questions
• Slow_queries
12
https://dev.mysql.com/doc/refman/5.6/en/server-status-variables.html
Copyright © 2015, Oracle and/or its affiliates. All rights reserved. |
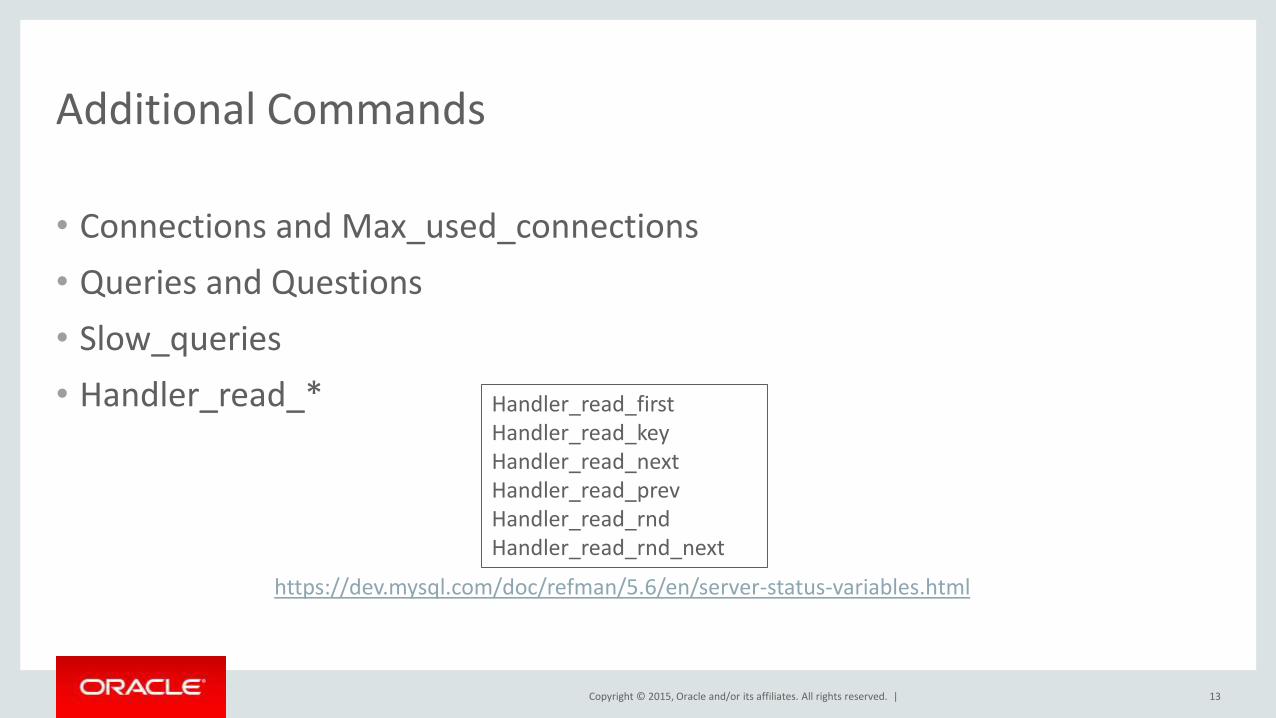
Additional Commands
• Connections and Max_used_connections
• Queries and Questions
• Slow_queries
• Handler_read_*
13
Handler_read_first Handler_read_key Handler_read_next Handler_read_prev Handler_read_rnd Handler_read_rnd_next
https://dev.mysql.com/doc/refman/5.6/en/server-status-variables.html

Copyright © 2015, Oracle and/or its affiliates. All rights reserved. |
Program Agenda
General Info
InnoDB
Query Cache – Older systems
Threads and Table Cache
Session Level
Tools for monitoring, analyzing, and tuning queries
1
2
3
14
4
5
6
Copyright © 2015, Oracle and/or its affiliates. All rights reserved. |
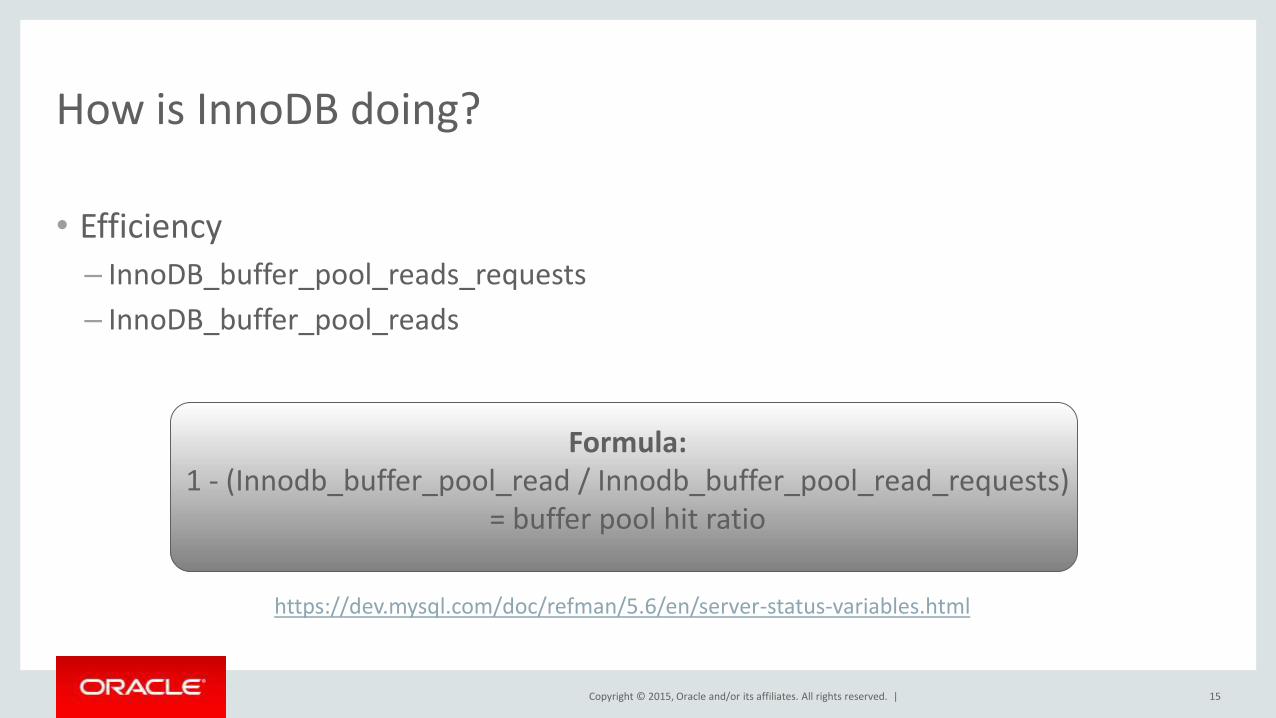
How is InnoDB doing?
• Efficiency
– InnoDB_buffer_pool_reads_requests
– InnoDB_buffer_pool_reads
15
Formula: 1 - (Innodb_buffer_pool_read / Innodb_buffer_pool_read_requests)
= buffer pool hit ratio
https://dev.mysql.com/doc/refman/5.6/en/server-status-variables.html

Copyright © 2015, Oracle and/or its affiliates. All rights reserved. |
innodb_buffer_pool_size
• Global
• Caches data and indexes
• Larger values reduce IO
• 80% max
16
https://dev.mysql.com/doc/refman/5.6/en/innodb-buffer-pool.html

Copyright © 2015, Oracle and/or its affiliates. All rights reserved. |
innodb_log_file_size
• Size of file on disk
• Larger the file, the less checkpoint activity
• Size for each log file
• Max combined log file size
– 4G <= 5.5
– 512G = 5.6
• Larger the log file ➯ longer recovery time
17
http://dev.mysql.com/doc/refman/5.6/en/innodb-parameters.html

Copyright © 2015, Oracle and/or its affiliates. All rights reserved. |
innodb_log_buffer_size
• Buffer for writing to log files on disk
• Large transactions? Write heavy?
– Yes – increasing can help with IO
• Default: 8M
18
http://dev.mysql.com/doc/refman/5.6/en/innodb-parameters.html

Copyright © 2015, Oracle and/or its affiliates. All rights reserved. |
innodb_file_per_table
• .ibd files
• Default: Off <= 5.6.5 > On
• TRUNCATE for a table is faster
• Can monitor table size on the file system
• Can store specific tables on different storage devices
• (5.6) Transportable tablespaces
19
http://dev.mysql.com/doc/refman/5.6/en/innodb-parameters.html
Copyright © 2015, Oracle and/or its affiliates. All rights reserved. |
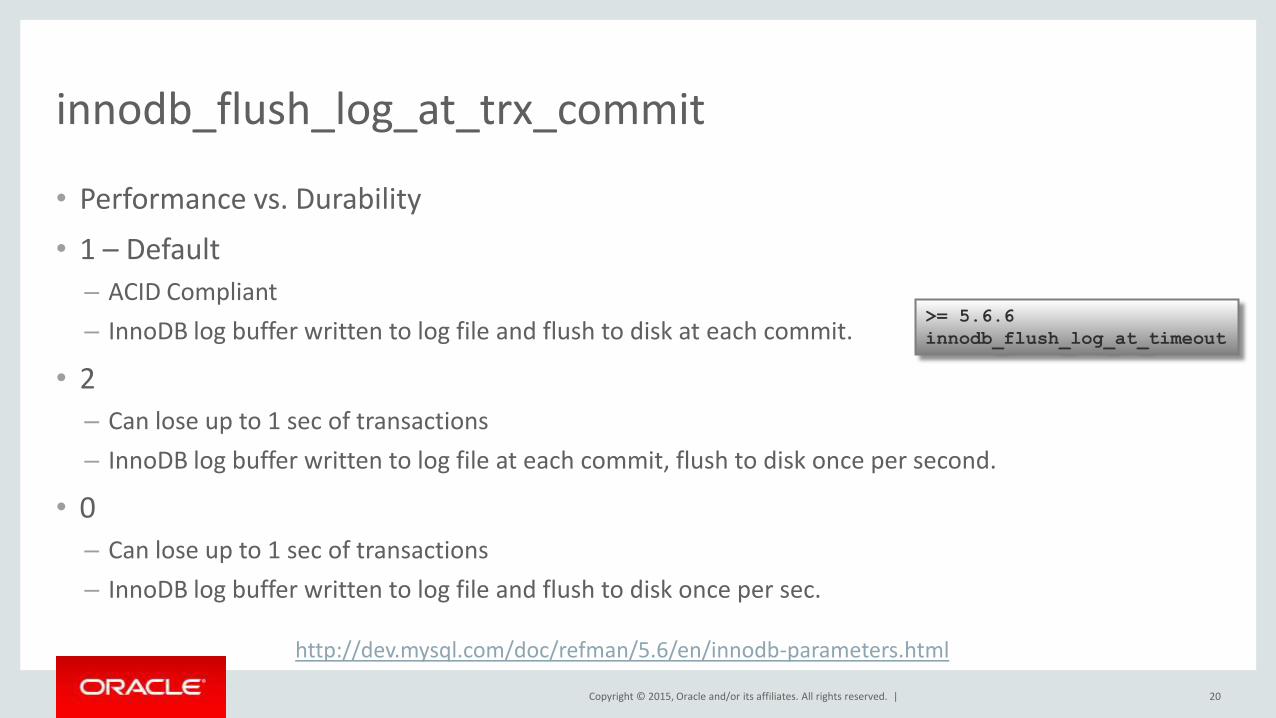
innodb_flush_log_at_trx_commit
• Performance vs. Durability
• 1 – Default
– ACID Compliant
– InnoDB log buffer written to log file and flush to disk at each commit.
• 2
– Can lose up to 1 sec of transactions
– InnoDB log buffer written to log file at each commit, flush to disk once per second.
• 0
– Can lose up to 1 sec of transactions
– InnoDB log buffer written to log file and flush to disk once per sec.
20
http://dev.mysql.com/doc/refman/5.6/en/innodb-parameters.html
>= 5.6.6
innodb_flush_log_at_timeout

Copyright © 2015, Oracle and/or its affiliates. All rights reserved. |
innodb_buffer_pool_instances
• 5.6
• Problem: contention for the buffer pool resources
• For systems with large multi-GB buffer pools
• Total buffer pools size divided between this many instances
• Each instance
– Manages its own resources
– Has its own mutex
21
http://dev.mysql.com/doc/refman/5.6/en/innodb-parameters.html
Copyright © 2015, Oracle and/or its affiliates. All rights reserved. |
innodb_stats_persistent
• Specifies whether InnoDB index statistics are persisted to disk.
22
http://dev.mysql.com/doc/refman/5.6/en/innodb-parameters.html

Copyright © 2015, Oracle and/or its affiliates. All rights reserved. |
Program Agenda
General Info
InnoDB
Query Cache
Threads and Table Cache
Session Level
Tools for monitoring, analyzing, and tuning queries
1
2
3
23
4
5
6

Copyright © 2015, Oracle and/or its affiliates. All rights reserved. |
How is the QC doing?
• Qcache_total_blocks
• Qcache_free_blocks
• Qcache_lowmem_prunes
24
https://dev.mysql.com/doc/refman/5.6/en/query-cache-status-and-maintenance.html https://dev.mysql.com/doc/refman/5.6/en/server-status-variables.html
SHOW VARIABLES LIKE 'have_query_cache';
Copyright © 2015, Oracle and/or its affiliates. All rights reserved. |
How is the QC doing? (cont.)
• Qcache_hits
• Qcache_inserts
• Qcache_not_cached
• Qcache_queries_in_cache
25
https://dev.mysql.com/doc/refman/5.6/en/query-cache-status-and-maintenance.html https://dev.mysql.com/doc/refman/5.6/en/server-status-variables.html
Copyright © 2015, Oracle and/or its affiliates. All rights reserved. |
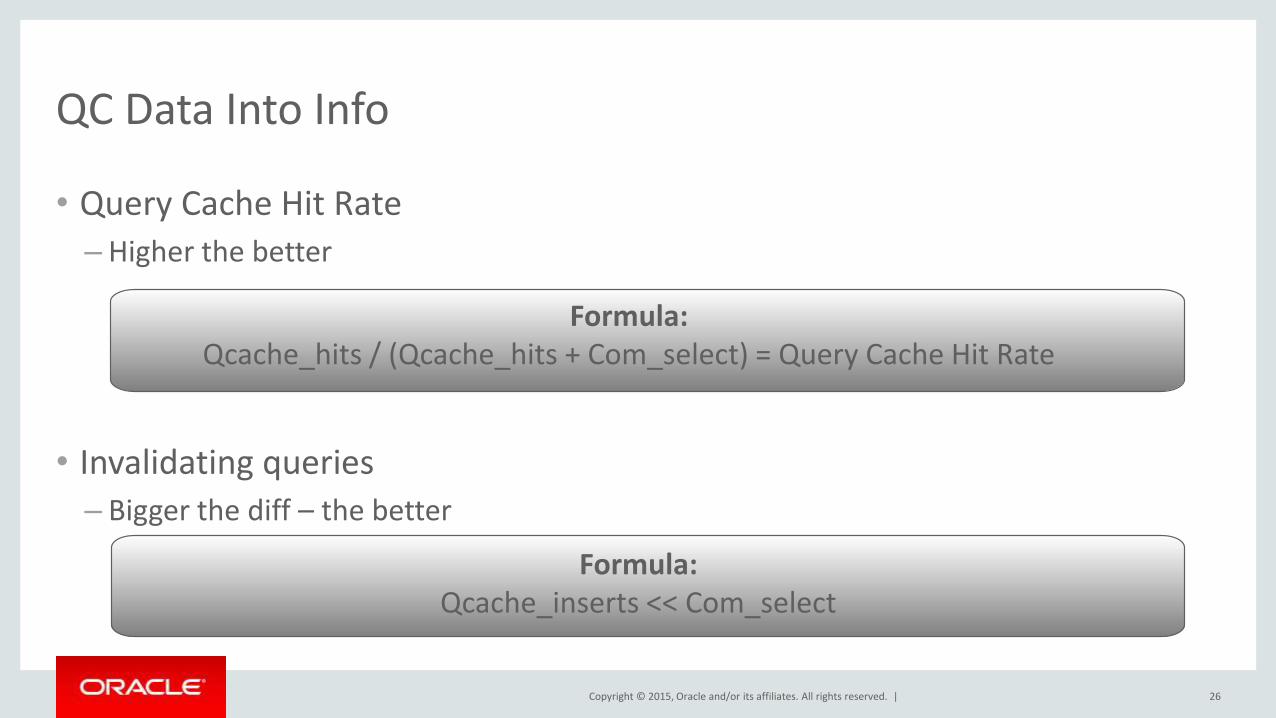
• Query Cache Hit Rate
– Higher the better
• Invalidating queries – Bigger the diff – the better
Formula: Qcache_hits / (Qcache_hits + Com_select) = Query Cache Hit Rate
Formula: Qcache_inserts << Com_select
QC Data Into Info
26

Copyright © 2015, Oracle and/or its affiliates. All rights reserved. |
query_cache_size
• Global
• Allocated all at once
• Default: disabled
• Default size:
– 0 < 5.6.8
– 1M >= 5.6.8
27
https://dev.mysql.com/doc/refman/5.6/en/query-cache-configuration.html
https://dev.mysql.com/doc/refman/5.6/en/server-system-variables.html
Copyright © 2015, Oracle and/or its affiliates. All rights reserved. |
query_cache_type
• Global – but can be session
• 3 options
– 0 “Off”
– 1 “On”
– 2 “On Demand”
• Default:
– 1 < 5.6.8
– 0 >= 5.6.8
28

Copyright © 2015, Oracle and/or its affiliates. All rights reserved. |
Program Agenda
General Info
InnoDB
Query Cache – Older systems
Threads and Table Cache
Session Level
Tools for monitoring, analyzing, and tuning queries
1
2
3
29
4
5
6

Copyright © 2015, Oracle and/or its affiliates. All rights reserved. |
Threads
• Threads == Connections
• Thread Cache
– Threads_cached
– Threads_connected
– Threads_created
30
Formula: Threads_created / Connections = Thread cache miss rate
https://dev.mysql.com/doc/refman/5.6/en/server-status-variables.html https://dev.mysql.com/doc/refman/5.6/en/connection-threads.html

Copyright © 2015, Oracle and/or its affiliates. All rights reserved. |
thread_cache_size
• Global but grows as needed
• Number to be cached until needed
• May increase performance with lots of new connections
– Or maybe not
31
Formula: 100 – ((Threads_created / Connections) * 100) =
Thread cache efficiency
https://dev.mysql.com/doc/refman/5.6/en/connection-threads.html
https://dev.mysql.com/doc/refman/5.6/en/server-system-variables.html

Copyright © 2015, Oracle and/or its affiliates. All rights reserved. |
table_cache
• table_cache <= 5.1.3 > table_open_cache
• Expands as needed
• Number of open tables for all connections
• Watch Opened_tables
32
https://dev.mysql.com/doc/refman/5.6/en/table-cache.html https://dev.mysql.com/doc/refman/5.6/en/server-status-variables.html
Copyright © 2015, Oracle and/or its affiliates. All rights reserved. |
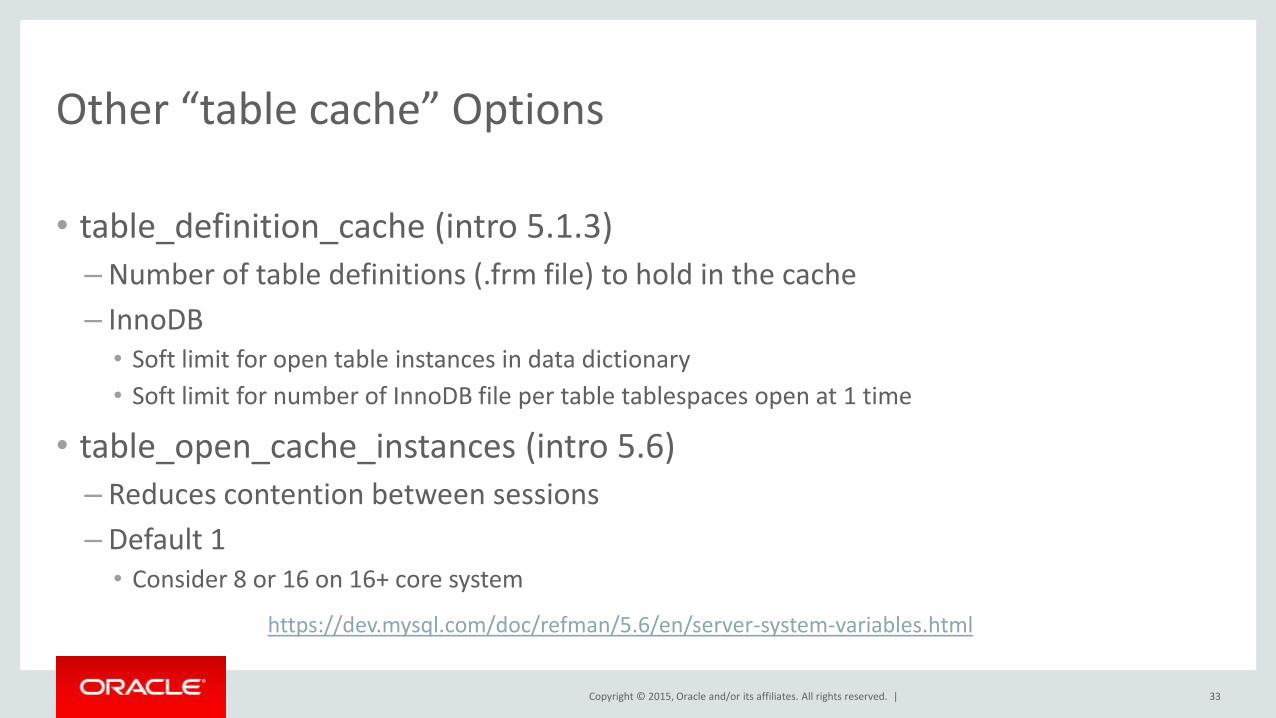
Other “table cache” Options
• table_definition_cache (intro 5.1.3)
– Number of table definitions (.frm file) to hold in the cache
– InnoDB • Soft limit for open table instances in data dictionary
• Soft limit for number of InnoDB file per table tablespaces open at 1 time
• table_open_cache_instances (intro 5.6) – Reduces contention between sessions
– Default 1 • Consider 8 or 16 on 16+ core system
33
https://dev.mysql.com/doc/refman/5.6/en/server-system-variables.html

Copyright © 2015, Oracle and/or its affiliates. All rights reserved. |
Program Agenda
General Info
InnoDB
Query Cache – Older systems
Threads and Table Cache
Session Level
Tools for monitoring, analyzing, and tuning queries
1
2
3
34
4
5
6
Copyright © 2015, Oracle and/or its affiliates. All rights reserved. |
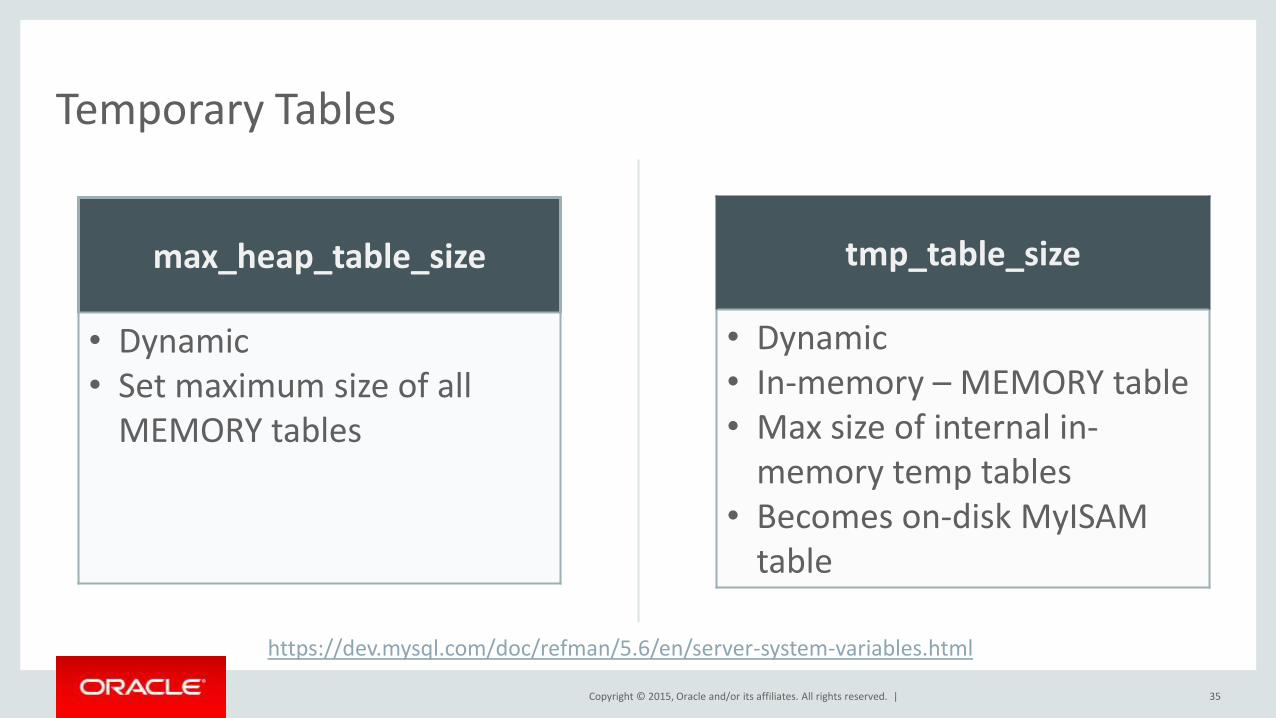
Temporary Tables
35
max_heap_table_size
• Dynamic • Set maximum size of all
MEMORY tables
tmp_table_size
• Dynamic • In-memory – MEMORY table • Max size of internal in-
memory temp tables • Becomes on-disk MyISAM
table
https://dev.mysql.com/doc/refman/5.6/en/server-system-variables.html
Copyright © 2015, Oracle and/or its affiliates. All rights reserved. |
sort_buffer_size
• Dynamic
• Doing a sort – allocates a buffer this size
• Helps with ORDER BY and/or GROUP BY
• Watch Sort_merge_passes
36
https://dev.mysql.com/doc/refman/5.6/en/server-system-variables.html

Copyright © 2015, Oracle and/or its affiliates. All rights reserved. |
Program Agenda with Highlight
General Info
InnoDB
Query Cache – Older systems
Threads and Table Cache
Session Level
Tools for monitoring, analyzing, and tuning queries
1
2
3
37
4
5
6
Copyright © 2015, Oracle and/or its affiliates. All rights reserved. |
Tools
Performance schema
MySQL sys schema
EXPLAIN & Optimizer trace
MySQL Enterprise Monitor (MEM)
Copyright © 2015, Oracle and/or its affiliates. All rights reserved. |
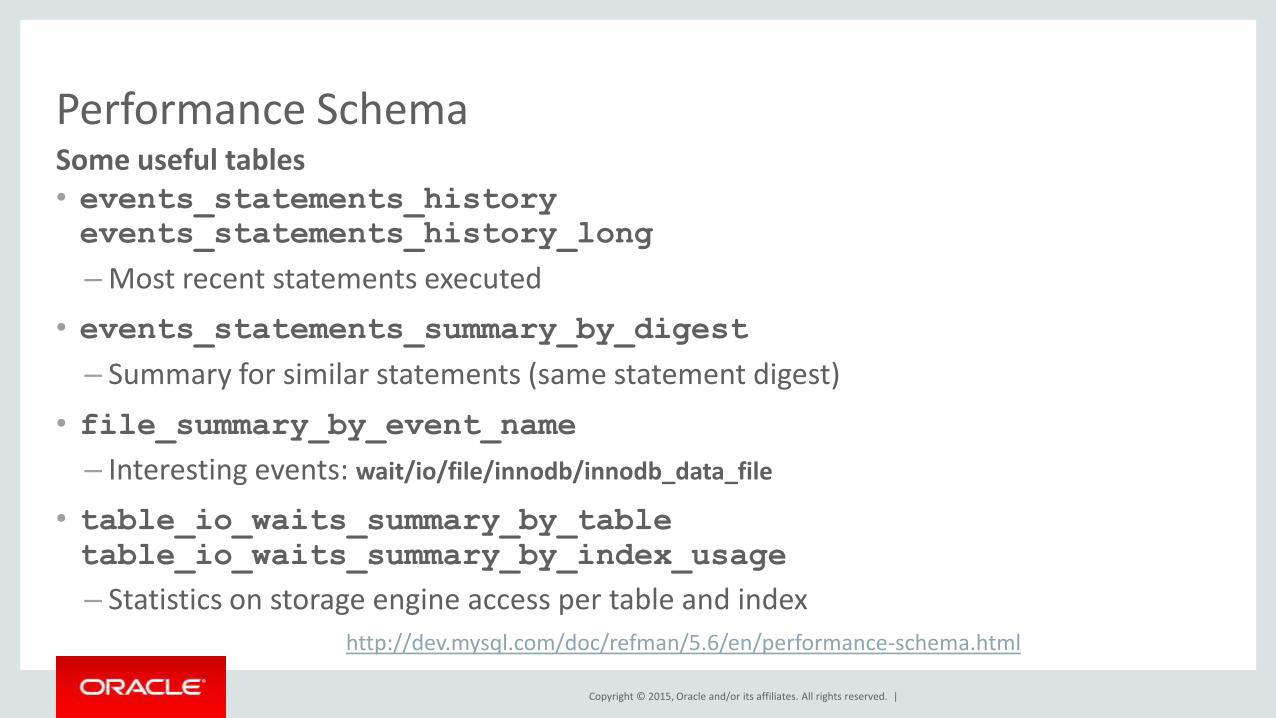
Performance Schema
• events_statements_history events_statements_history_long
– Most recent statements executed
• events_statements_summary_by_digest
– Summary for similar statements (same statement digest)
• file_summary_by_event_name
– Interesting events: wait/io/file/innodb/innodb_data_file
• table_io_waits_summary_by_table table_io_waits_summary_by_index_usage
– Statistics on storage engine access per table and index
Some useful tables
http://dev.mysql.com/doc/refman/5.6/en/performance-schema.html

Copyright © 2015, Oracle and/or its affiliates. All rights reserved. |
Performance Schema
• Normalization of queries to group statements that are similar to be grouped and summarized:
SELECT * FROM orders WHERE o_custkey=10 AND o_totalprice>20 SELECT * FROM orders WHERE o_custkey = 20 AND o_totalprice > 100
SELECT * FROM orders WHERE o_custkey = ? AND o_totalprice > ?
• events_statements_summary_by_digest
DIGEST, DIGEST_TEXT, COUNT_STAR, SUM_TIMER_WAIT, MIN_TIMER_WAIT, AVG_TIMER_WAIT, MAX_TIMER_WAIT, SUM_LOCK_TIME, SUM_ERRORS, SUM_WARNINGS, SUM_ROWS_AFFECTED, SUM_ROWS_SENT, SUM_ROWS_EXAMINED, SUM_CREATED_TMP_DISK_TABLES, SUM_CREATED_TMP_TABLES, SUM_SELECT_FULL_JOIN, SUM_SELECT_FULL_RANGE_JOIN, SUM_SELECT_RANGE, SUM_SELECT_RANGE_CHECK, SUM_SELECT_SCAN, SUM_SORT_MERGE_PASSES, SUM_SORT_RANGE, SUM_SORT_ROWS, SUM_SORT_SCAN, SUM_NO_INDEX_USED, SUM_NO_GOOD_INDEX_USED, FIRST_SEEN, LAST_SEEN
Statement digest

Copyright © 2015, Oracle and/or its affiliates. All rights reserved. |
Performance Schema
• Tables: events_statements_current (Current statement for each thread) events_statements_history (10 most recent statements per thread) events_statements_history_long (10000 most recent statements)
• Columns: THREAD_ID, EVENT_ID, END_EVENT_ID, EVENT_NAME, SOURCE, TIMER_START, TIMER_END, TIMER_WAIT, LOCK_TIME, SQL_TEXT, DIGEST, DIGEST_TEXT, CURRENT_SCHEMA, OBJECT_TYPE, OBJECT_SCHEMA, OBJECT_NAME, OBJECT_INSTANCE_BEGIN, MYSQL_ERRNO, RETURNED_SQLSTATE, MESSAGE_TEXT, ERRORS, WARNINGS, ROWS_AFFECTED, ROWS_SENT, ROWS_EXAMINED, CREATED_TMP_DISK_TABLES, CREATED_TMP_TABLES, SELECT_FULL_JOIN, SELECT_FULL_RANGE_JOIN, SELECT_RANGE, SELECT_RANGE_CHECK, SELECT_SCAN, SORT_MERGE_PASSES, SORT_RANGE, SORT_ROWS, SORT_SCAN, NO_INDEX_USED, NO_GOOD_INDEX_USED, NESTING_EVENT_ID, NESTING_EVENT_TYPE
Statement events
Copyright © 2015, Oracle and/or its affiliates. All rights reserved. |
MySQL sys Schema
• Started as a collection of views, procedures and functions, designed to make reading raw Performance Schema data easier
• Implements many common DBA and Developer use cases
• Now bundled within MySQL Workbench 6.1
• Available on GitHub
– https://github.com/MarkLeith/mysql-sys
• Examples of very useful functions:
– format_time() , format_bytes(), format_statement()

Copyright © 2015, Oracle and/or its affiliates. All rights reserved. |
MySQL sys Schema
statement_analysis: Lists a normalized statement view with aggregated statistics, mimics the MySQL Enterprise Monitor Query Analysis view, ordered by the total execution time per normalized statement mysql> select * from statement_analysis limit 1\G
*************************** 1. row ***************************
query: INSERT INTO `mem__quan` . `nor ... nDuration` = IF ( VALUES ( ...
db: mem
full_scan:
exec_count: 1110067
err_count: 0
warn_count: 0
total_latency: 1.93h
max_latency: 5.03 s
avg_latency: 6.27 ms
Example
lock_latency: 00:18:29.18
rows_sent: 0
rows_sent_avg: 0
rows_examined: 0
rows_examined_avg: 0
tmp_tables: 0
tmp_disk_tables: 0
rows_sorted: 0
sort_merge_passes: 0
digest: d48316a218e95b1b8b72db5e6b177788!
first_seen: 2014-05-20 10:42:17

Copyright © 2015, Oracle and/or its affiliates. All rights reserved. |
EXPLAIN & Optimizer trace
• EXPLAIN shows the selected plan
• TRACE shows WHY the plan was selected:
– Alternative plans
– Estimated costs
– Decisions made
• JSON format
Copyright © 2015, Oracle and/or its affiliates. All rights reserved. |
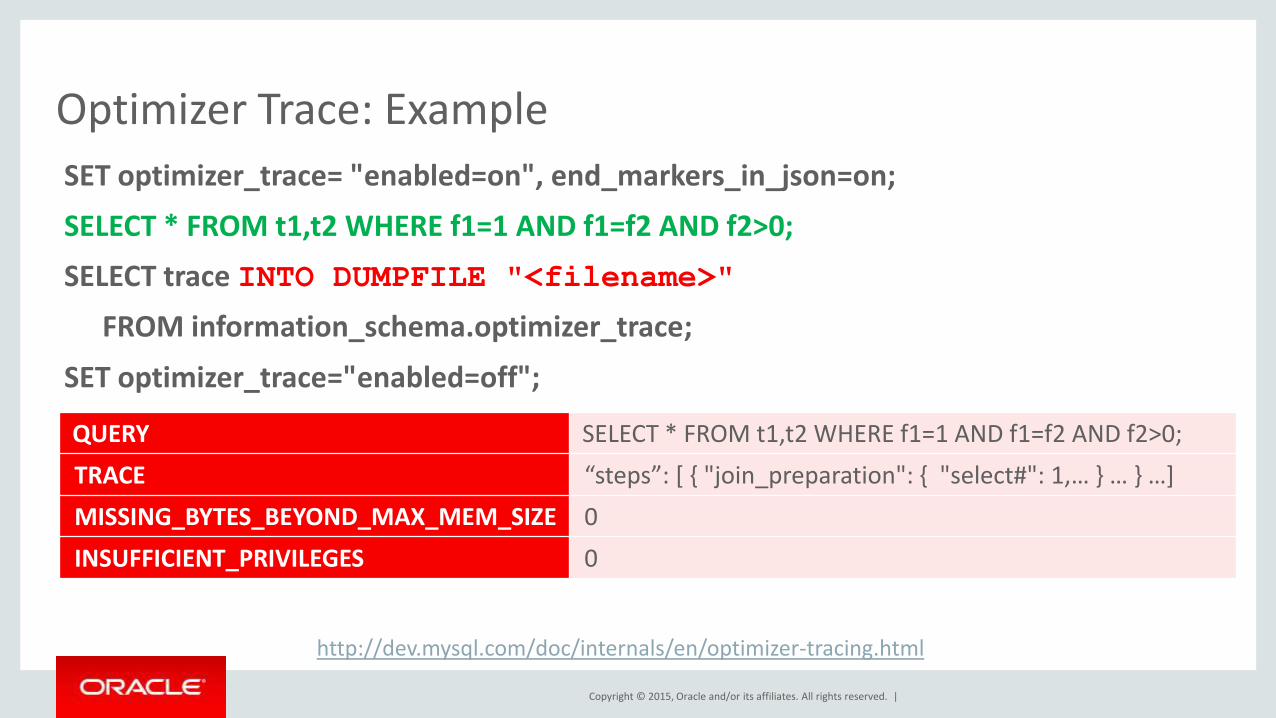
Optimizer Trace: Example
SET optimizer_trace= "enabled=on", end_markers_in_json=on;
SELECT * FROM t1,t2 WHERE f1=1 AND f1=f2 AND f2>0;
SELECT trace INTO DUMPFILE "<filename>"
FROM information_schema.optimizer_trace;
SET optimizer_trace="enabled=off";
QUERY SELECT * FROM t1,t2 WHERE f1=1 AND f1=f2 AND f2>0;
TRACE “steps”: [ { "join_preparation": { "select#": 1,… } … } …]
MISSING_BYTES_BEYOND_MAX_MEM_SIZE 0
INSUFFICIENT_PRIVILEGES 0
http://dev.mysql.com/doc/internals/en/optimizer-tracing.html
Copyright © 2015, Oracle and/or its affiliates. All rights reserved. |
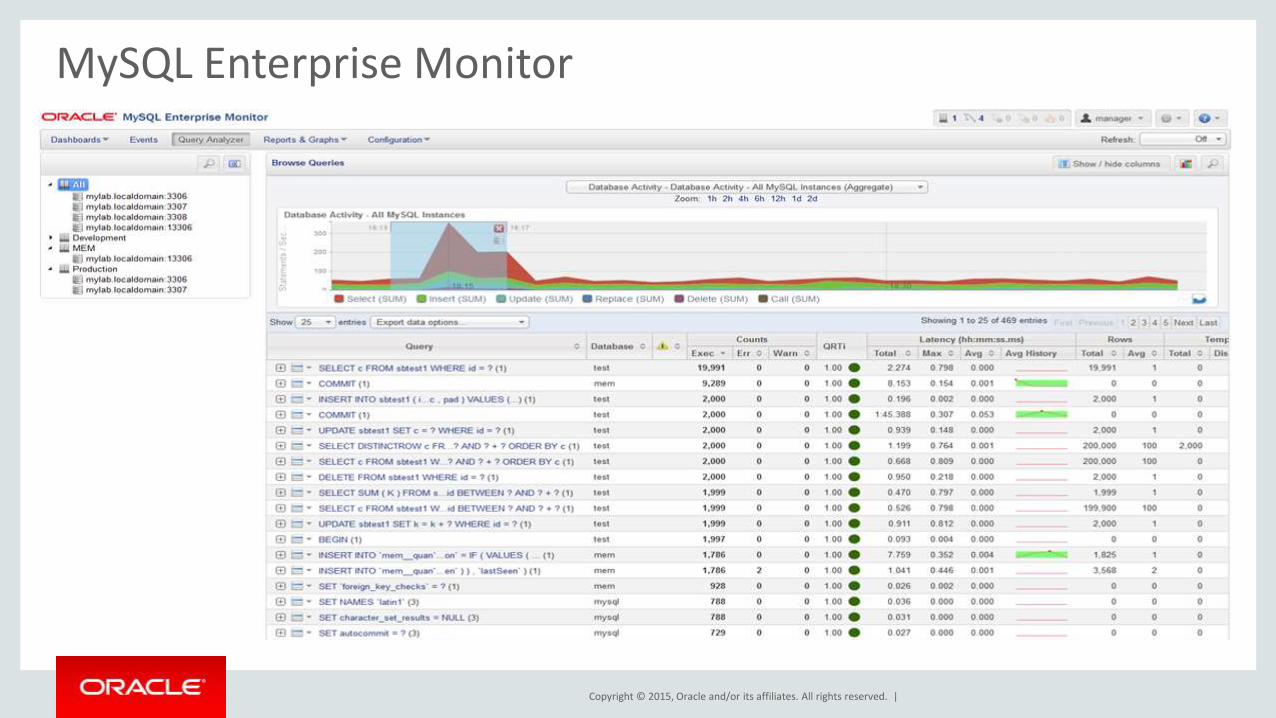
MySQL Enterprise Monitor

Copyright © 2015, Oracle and/or its affiliates. All rights reserved. |
Performance Issues Exposed Via Monitoring
• Unplanned configuration values
• Going to disk too often (wasted IOPs)
• Inefficient query plans
• Statements issued too often
Copyright © 2015, Oracle and/or its affiliates. All rights reserved. |
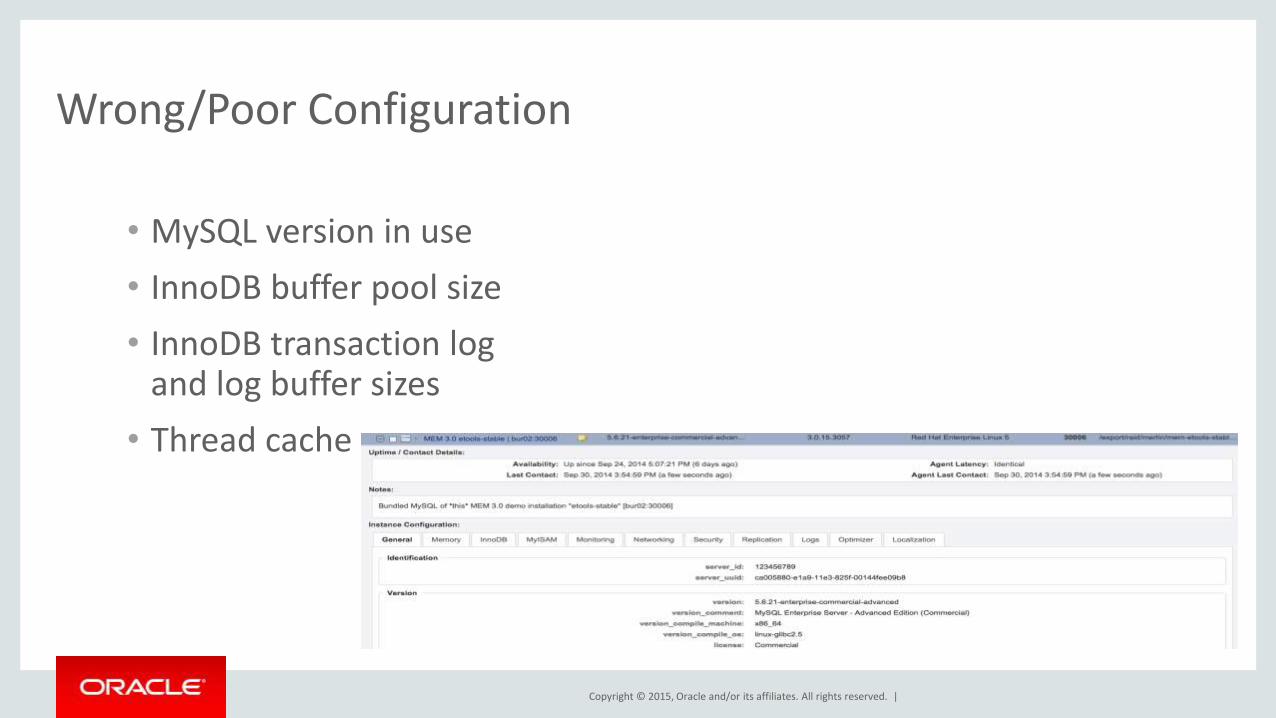
Wrong/Poor Configuration
• MySQL version in use
• InnoDB buffer pool size
• InnoDB transaction log and log buffer sizes
• Thread cache
Copyright © 2015, Oracle and/or its affiliates. All rights reserved. |
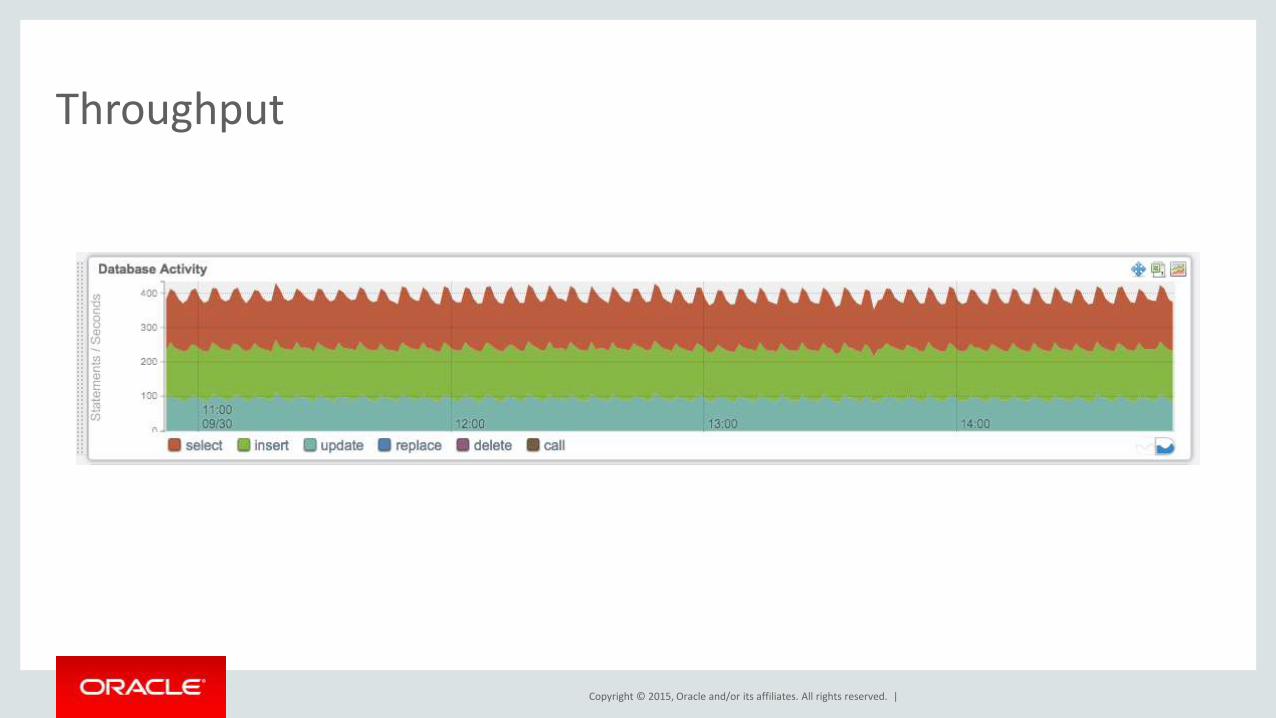
Throughput

Copyright © 2015, Oracle and/or its affiliates. All rights reserved. |
Concurrency
Copyright © 2015, Oracle and/or its affiliates. All rights reserved. |
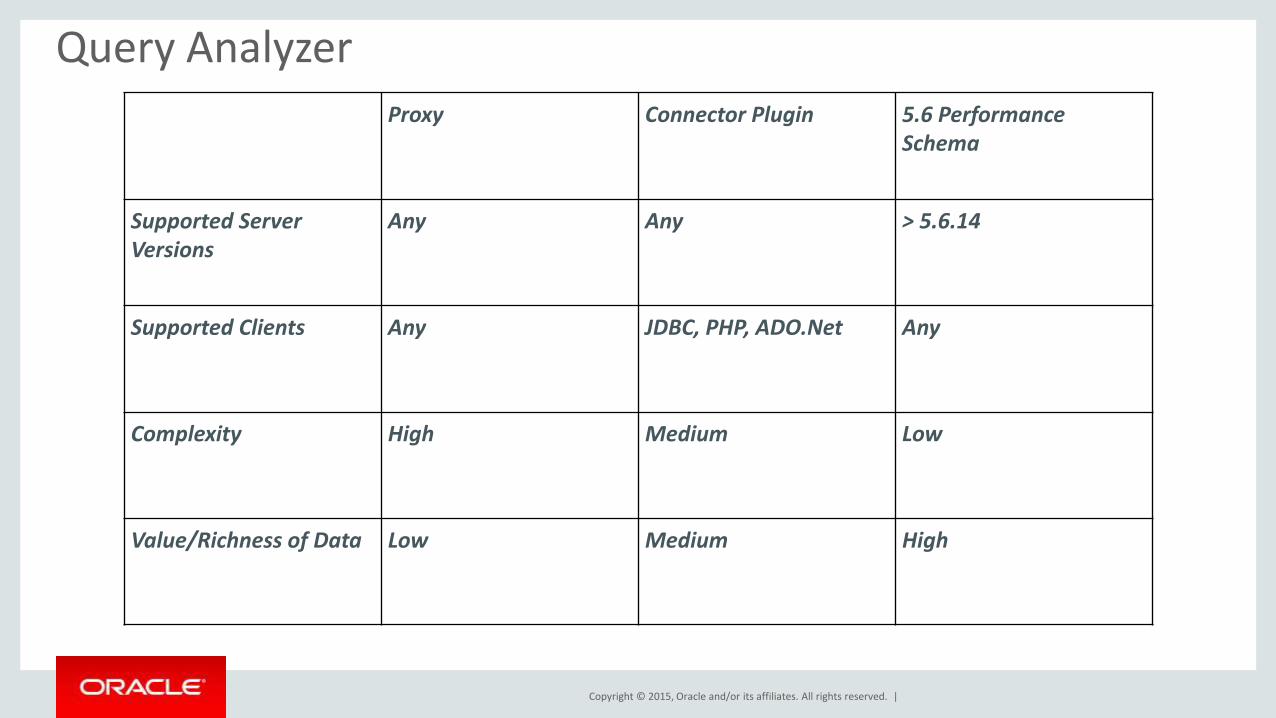
Query Analyzer Proxy Connector Plugin 5.6 Performance
Schema
Supported Server Versions
Any Any > 5.6.14
Supported Clients Any JDBC, PHP, ADO.Net Any
Complexity High Medium Low
Value/Richness of Data Low Medium High

Copyright © 2015, Oracle and/or its affiliates. All rights reserved. |
Query Analyzer Details

Copyright © 2015, Oracle and/or its affiliates. All rights reserved. |
Queries and databases

Copyright © 2015, Oracle and/or its affiliates. All rights reserved. |
Missing Indexes

Copyright © 2015, Oracle and/or its affiliates. All rights reserved. |
High Rate of Low Latency Statements
Copyright © 2015, Oracle and/or its affiliates. All rights reserved. |
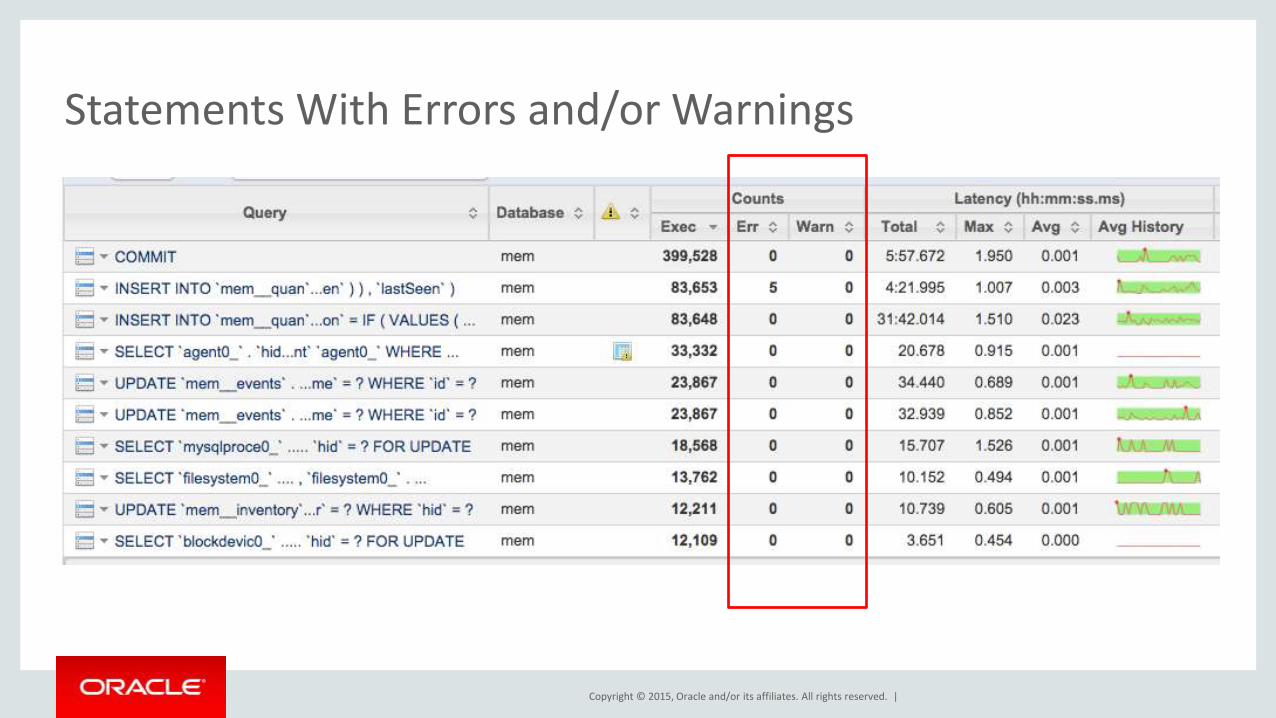
Statements With Errors and/or Warnings
Copyright © 2015, Oracle and/or its affiliates. All rights reserved. |
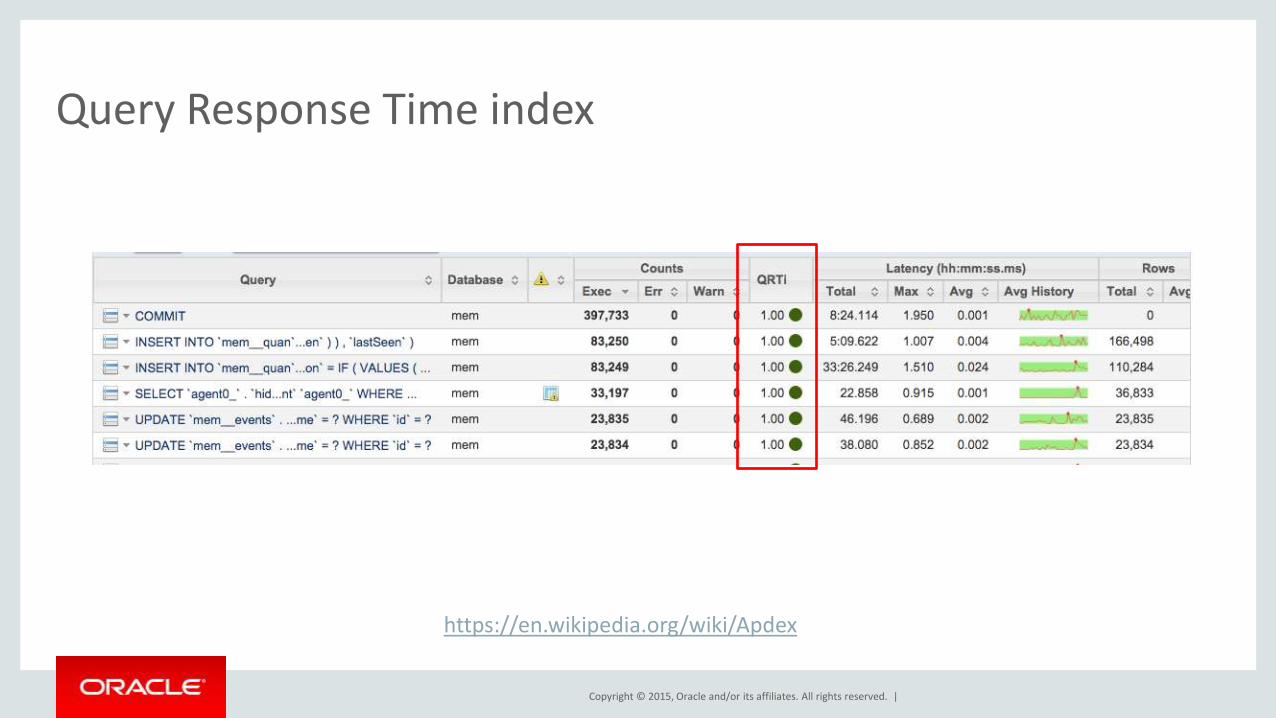
Query Response Time index
https://en.wikipedia.org/wiki/Apdex

Copyright © 2015, Oracle and/or its affiliates. All rights reserved. |
High Average Latency Statements

Copyright © 2015, Oracle and/or its affiliates. All rights reserved. |
New, Un-optimized Statements

Copyright © 2015, Oracle and/or its affiliates. All rights reserved. |
Extra Information from >= 5.6 and Performance Schema
Copyright © 2015, Oracle and/or its affiliates. All rights reserved. |
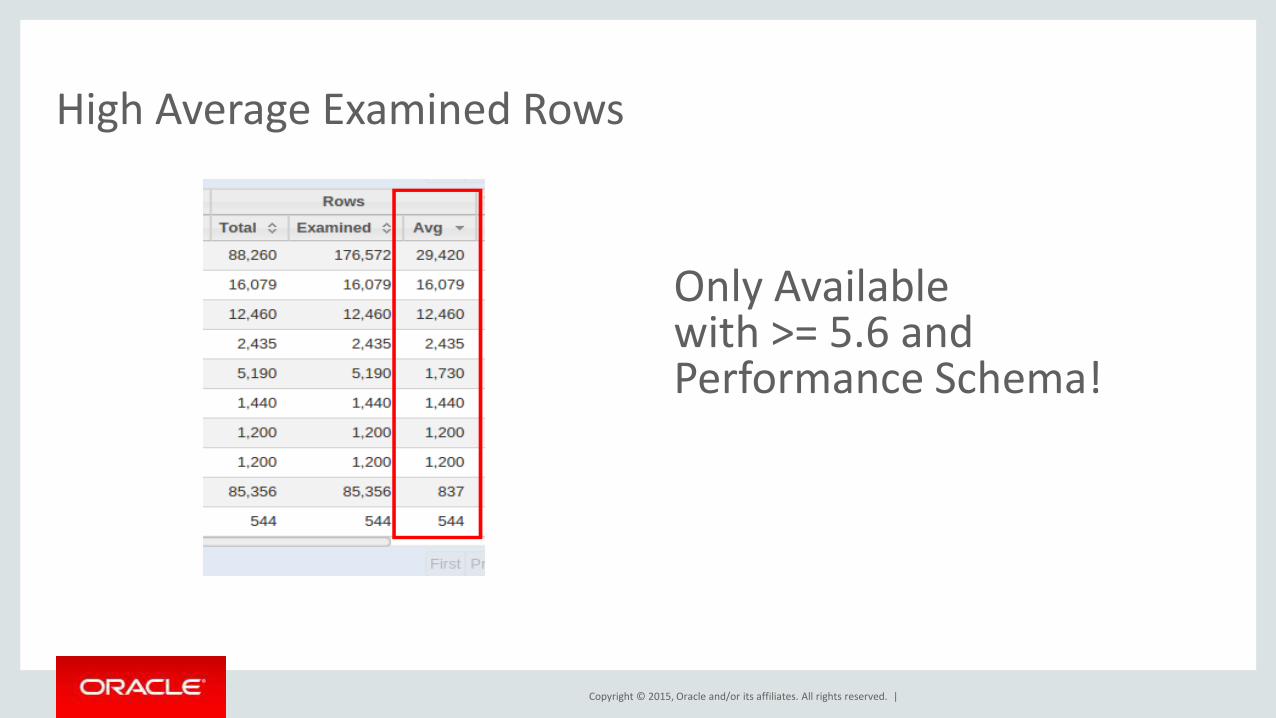
High Average Examined Rows
Only Available with >= 5.6 and Performance Schema!

Copyright © 2015, Oracle and/or its affiliates. All rights reserved. |
On-Disk Temporary Tables
Only Available with >= 5.6 and Performance Schema!
Copyright © 2015, Oracle and/or its affiliates. All rights reserved. |
How Do I Get it?
• Part of the MySQL Enterprise Subscription
• Trial Licenses
• Oracle Software Delivery Cloud
➯ https://edelivery.oracle.com/
➯ “MySQL Database Product Pack”

Copyright © 2015, Oracle and/or its affiliates. All rights reserved. |
Thank you for attending!
64
