mysql 8.0 performance - lefred.be · the following is intended to outline our general product...
TRANSCRIPT
Copyright © 2012, Oracle and/or its affiliates. All rights reserved. Insert Information Protection Policy Classification from Slide 12
Insert Picture HereMySQL 8.0 Performance: Tuning for High Load
Dimitri KRAVTCHUK MySQL Performance Architect @Oracle

The following is intended to outline our general product direction. It is intended for information purposes only, and may not be incorporated into any contract. It is not a commitment to deliver any material, code, or functionality, and should not be relied upon in making purchasing decisions. The development, release, and timing of any features or functionality described for Oracle’s products remains at the sole discretion of Oracle.
Are you Dimitri?.. ;-)
• Yes, it's me :-) • Hello from Paris! ;-) • Passionated by Systems and Databases Performance • Previous 15 years @Sun Benchmark Center • Started working on MySQL Performance since v3.23 • But during all that time just for “fun” only ;-) • Since 2011 “officially” @MySQL Performance full time now • http://dimitrik.free.fr/blog / @dimitrik_fr
Agenda
• Overview of MySQL Performance • Tuning & Workarounds • Q & A

Why MySQL Performance ?...

Why MySQL Performance ?..
• Any solution may look “good enough”...

Why MySQL Performance ?..
• Until it did not reach its limit..
Why MySQL Performance ?..
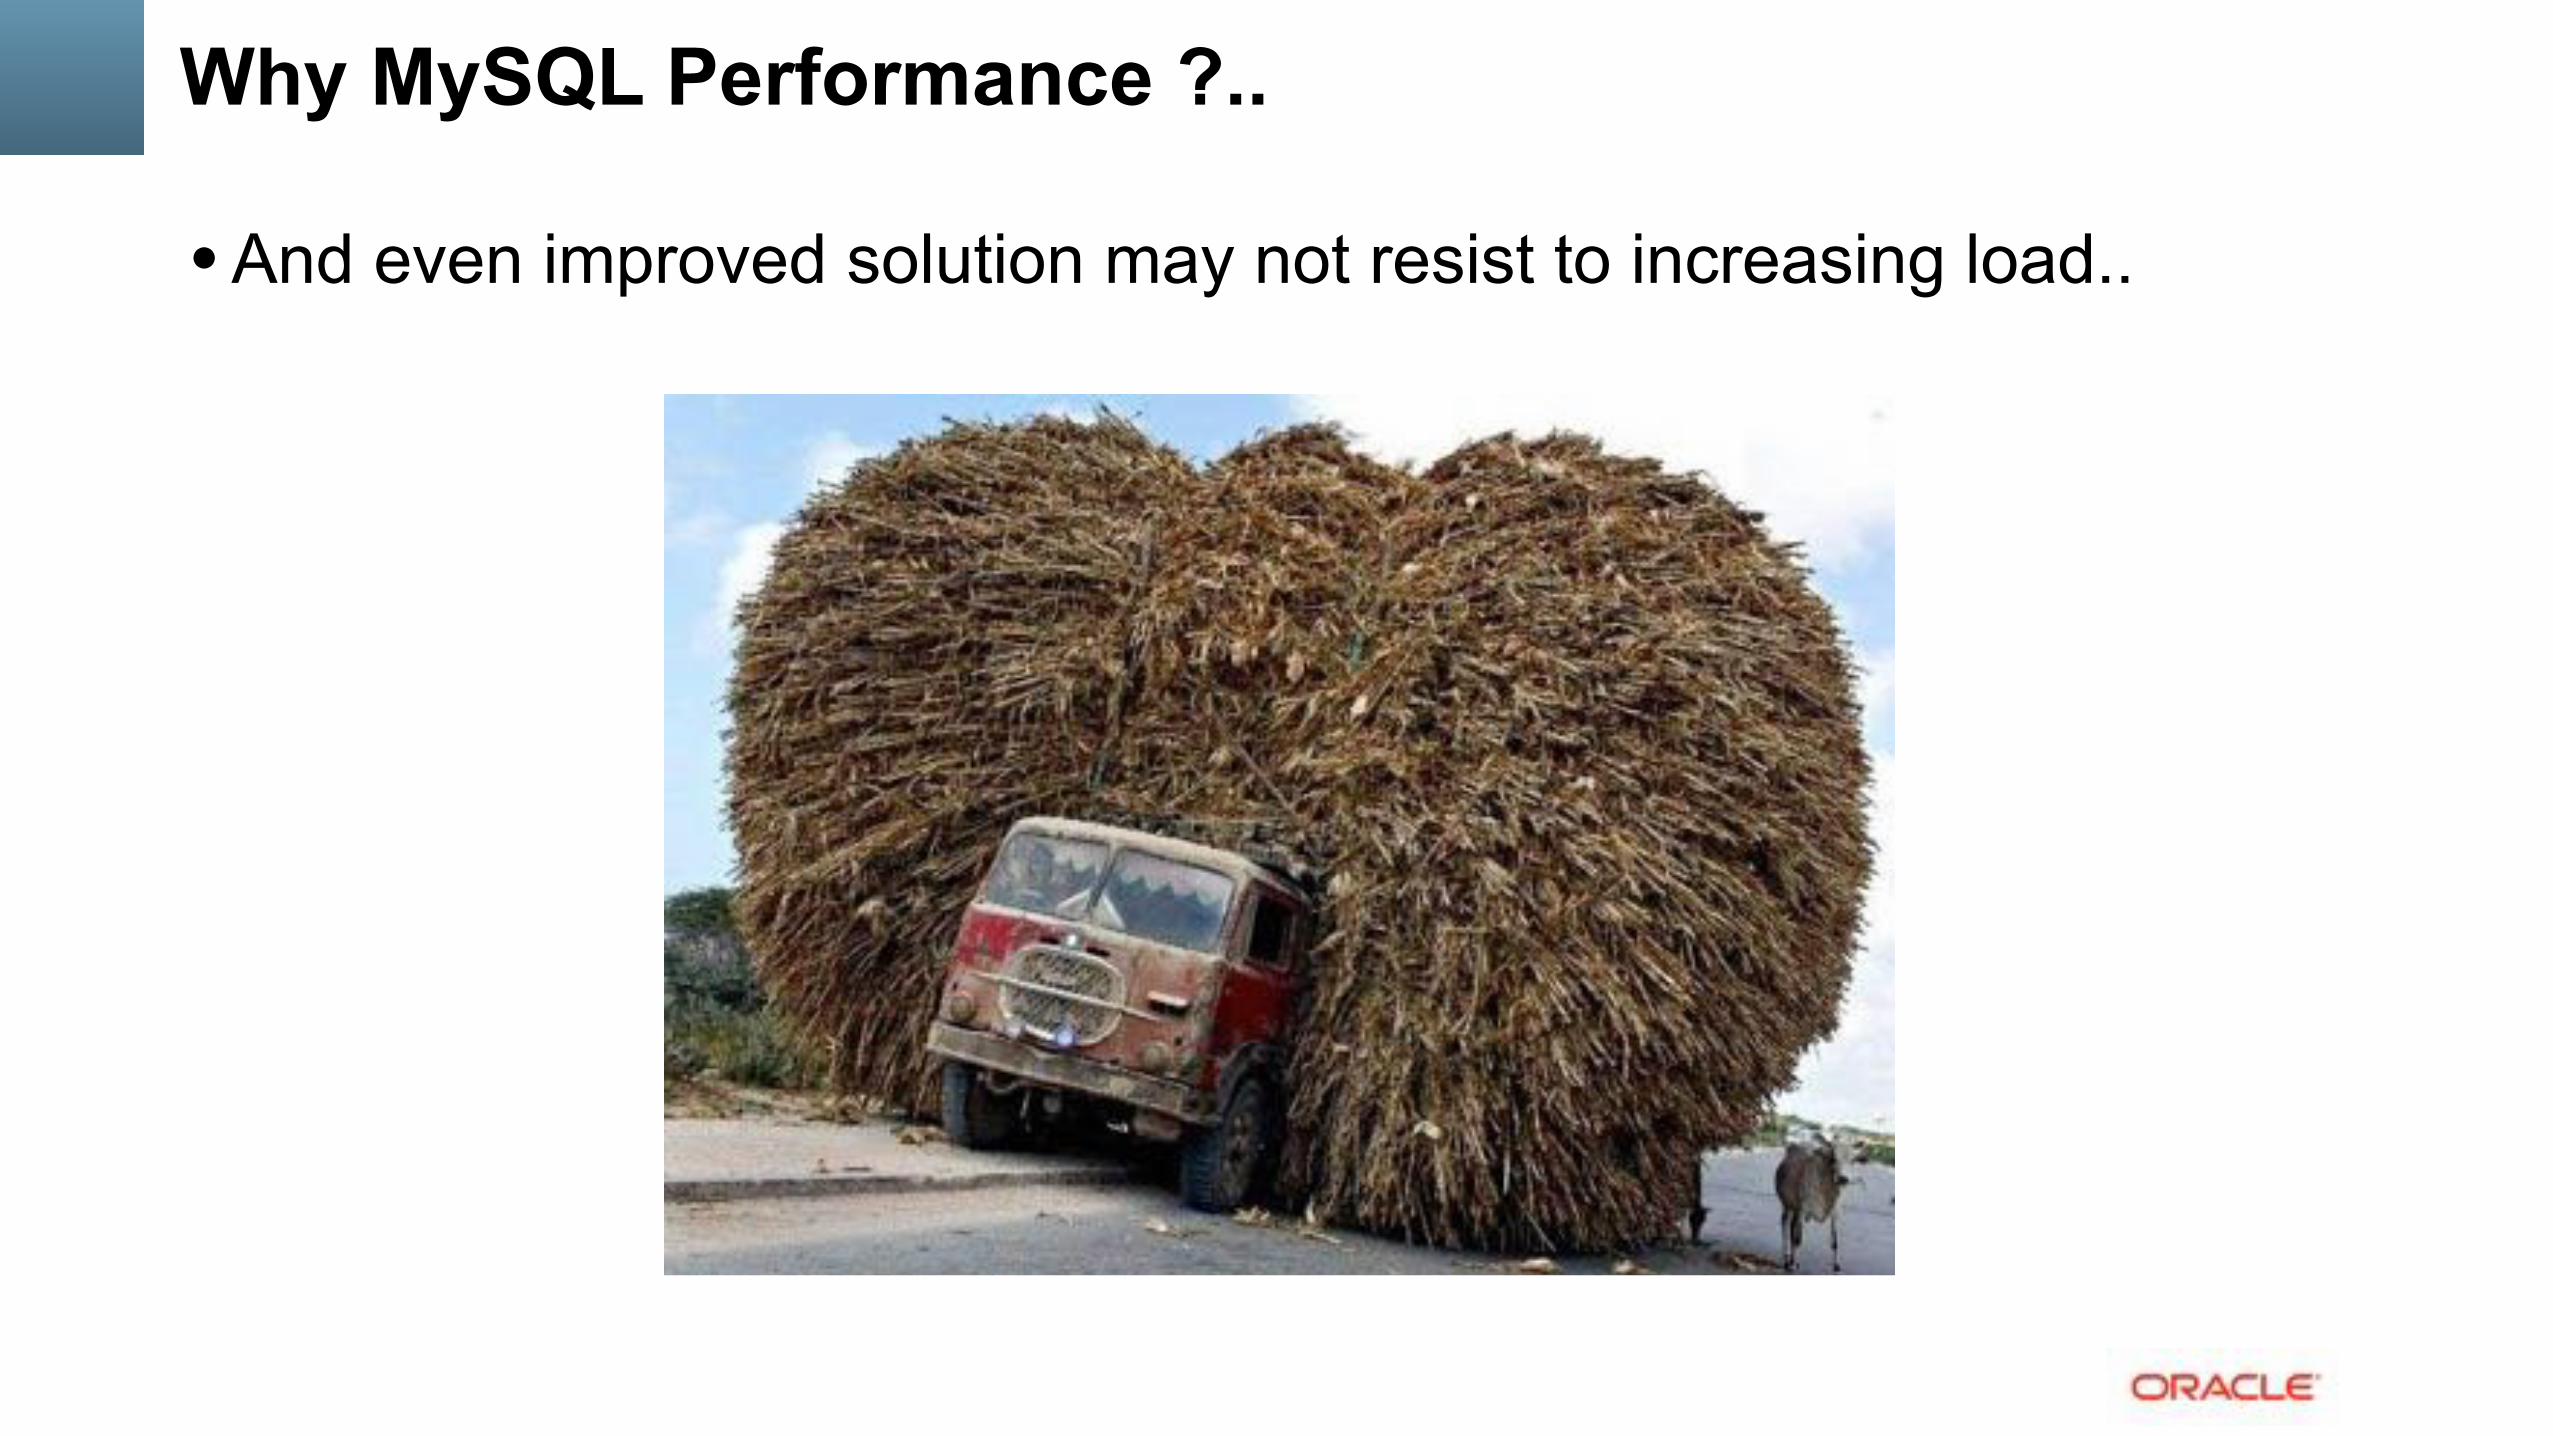
• And even improved solution may not resist to increasing load..

Why MySQL Performance ?..
• And reach a similar limit..
Why MySQL Performance ?..
• Analyzing your workload performance and testing your limits may help you to understand ahead the resistance of your solution to incoming potential problems ;-)

Why MySQL Performance ?..
• However : • Even a very powerful solution but
leaved in wrong hands may still be easily broken!... :-)

The MySQL Performance Best Practice #1 is... ???..

The MySQL Performance Best Practice #1 is... ???..
USE YOUR BRAIN !!! ;-)

The MySQL Performance Best Practice #1 is... ???..
USE YOUR BRAIN !!! ;-)
THE MAIN SLIDE! ;-))

#2 - Monitoring is THE MUST ! even don’t start to touch anything
without monitoring.. ;-)
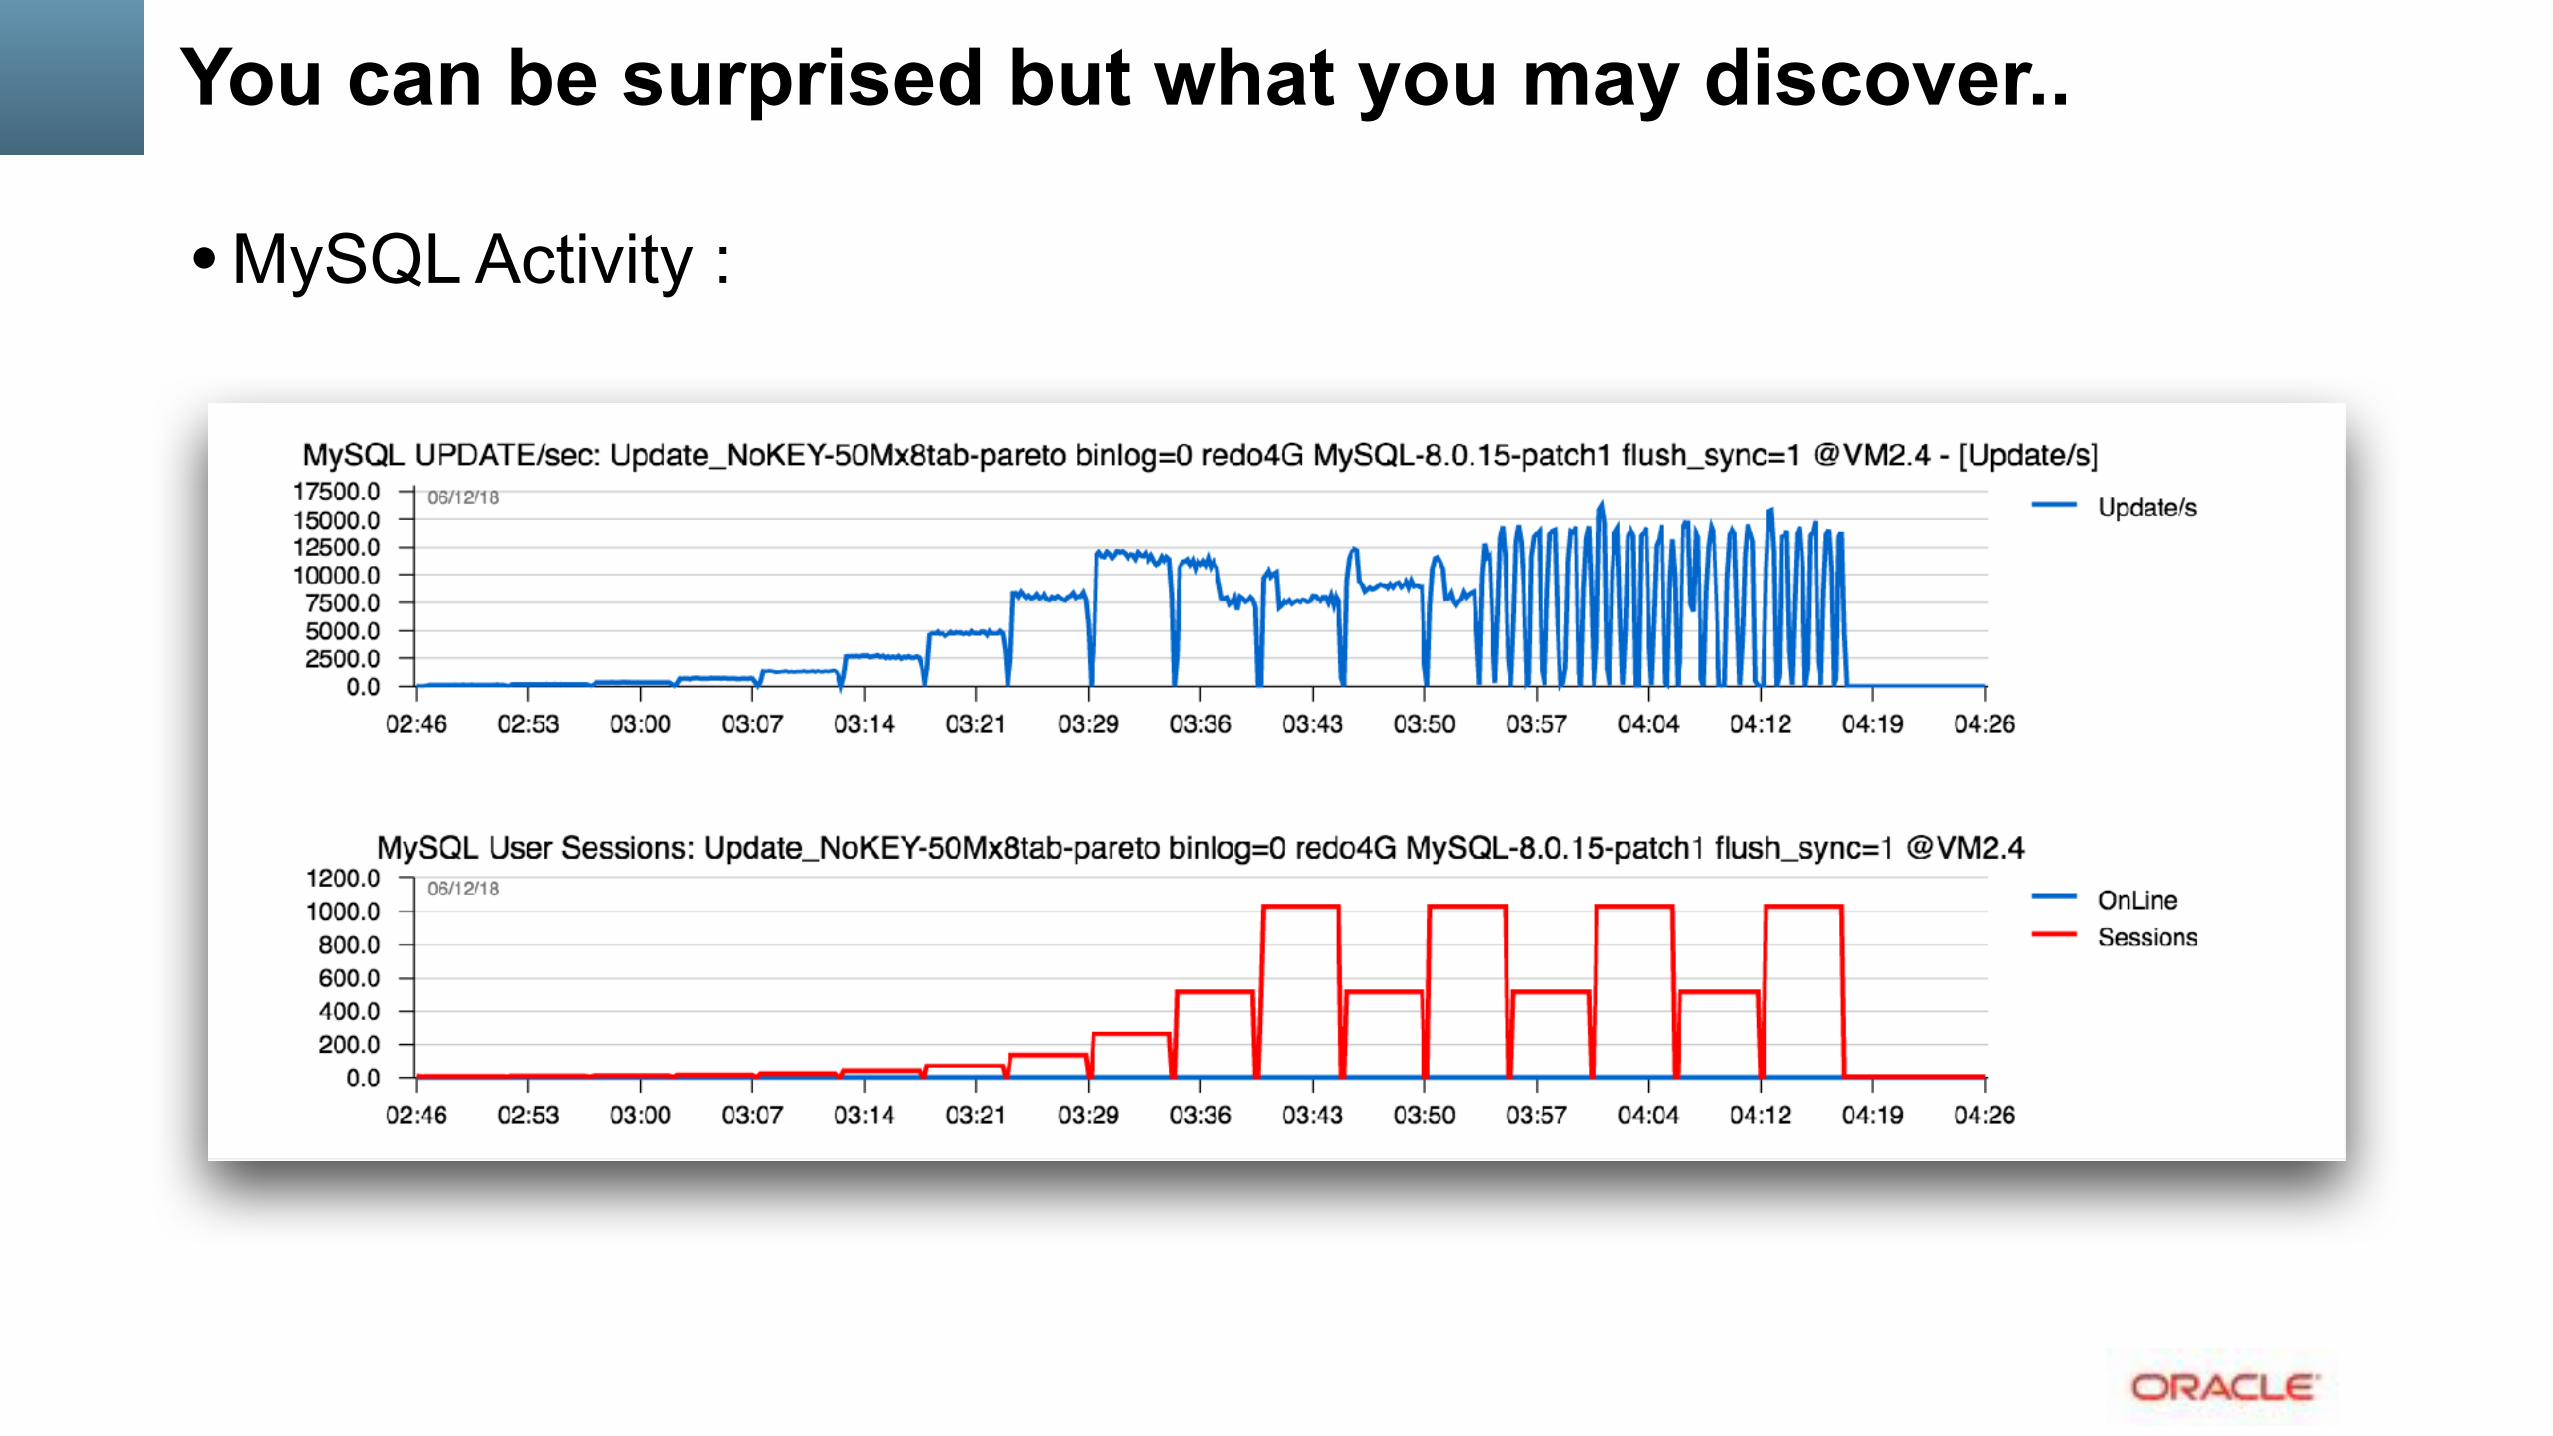
You can be surprised but what you may discover..
• MySQL Activity :

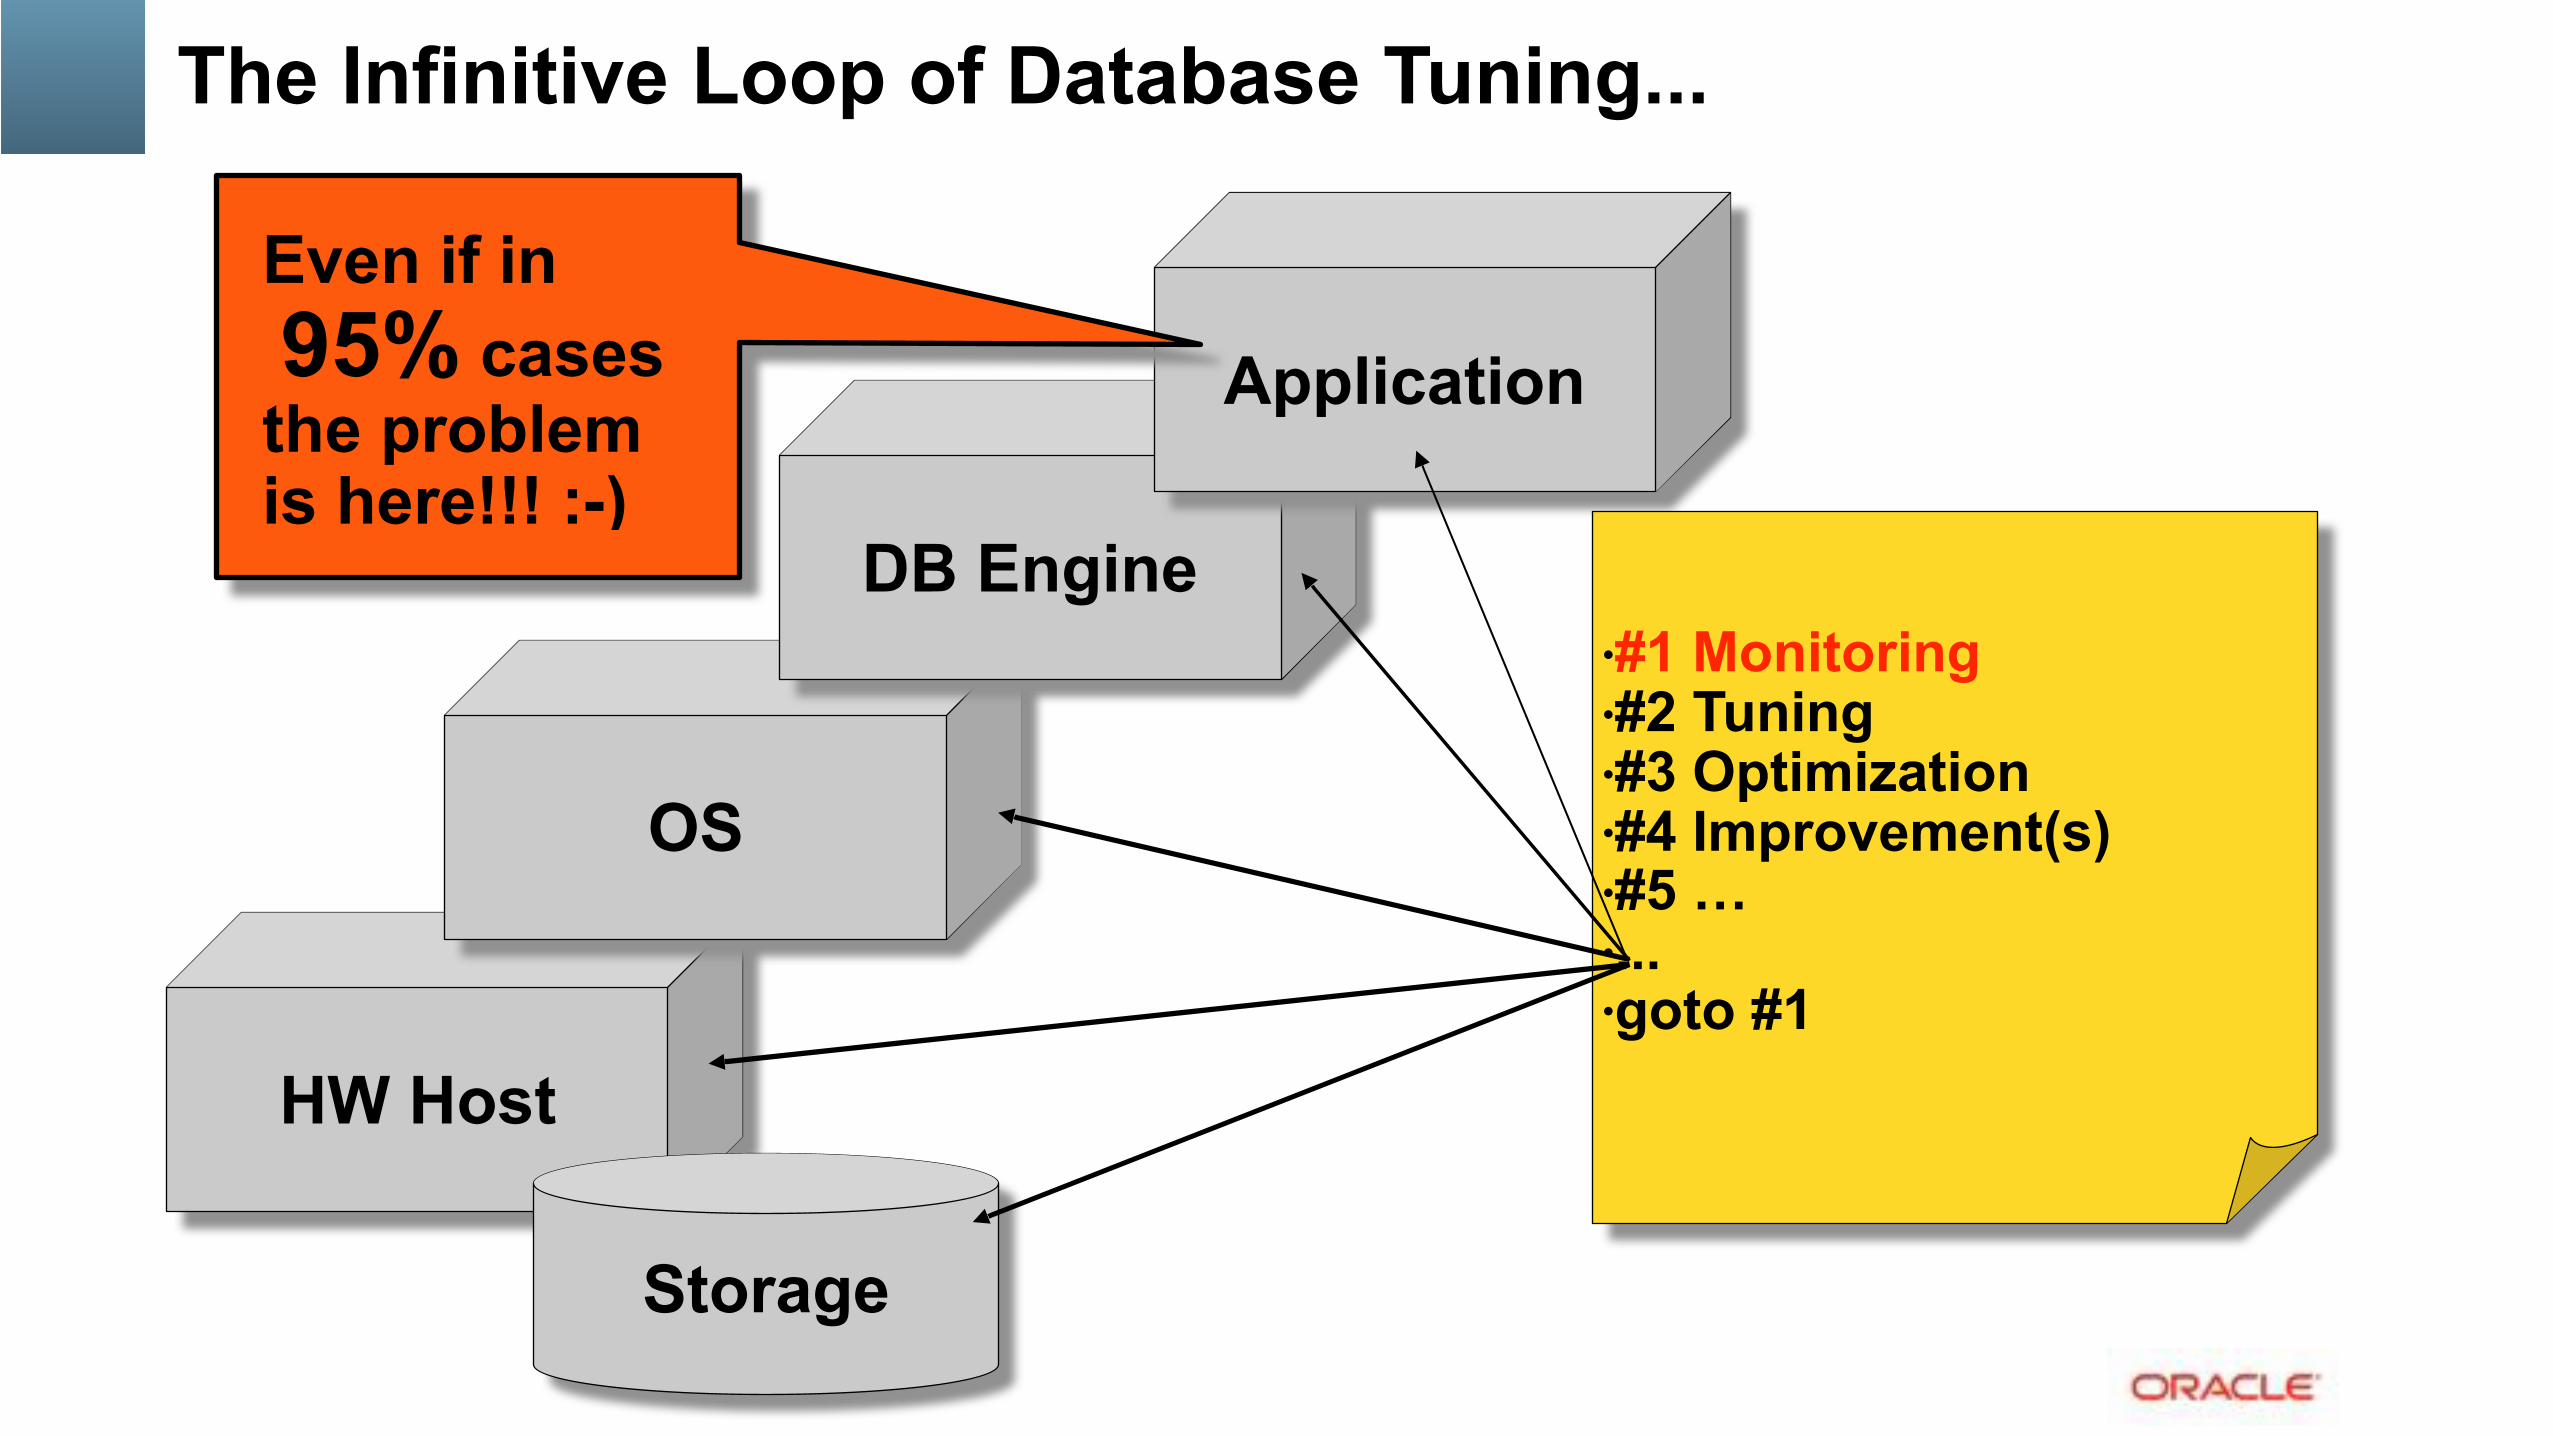
The Infinitive Loop of Database Tuning...
HW Host
Storage
OS
DB Engine
Application
•#1 Monitoring •#2 Tuning •#3 Optimization •#4 Improvement(s) •#5 … •... •goto #1
The Infinitive Loop of Database Tuning...
HW Host
Storage
OS
DB Engine
Application
•#1 Monitoring •#2 Tuning •#3 Optimization •#4 Improvement(s) •#5 … •... •goto #1
Even if in 95% cases the problem is here!!! :-)

Sources of information
• MySQL / InnoDB : • show engine innodb status • show engine innodb mutex • INNODB_METRICS • show global status • Performance Schema (PFS) / SYS Schema • …
• System (linux) • perf top -z <= quick overview of what is hot • vmstat / mpstat / iostat / etc.. • pstack / quickstack <= for debugging only • …

Hosting System
• CPU • latest / fastest
• Network • connect rate / SSL => connection multiplexing (via proxy ?) • VM ? => check driver scalability / limits
• Storage • flash ! (please, love your data !)
• OS • jemalloc !!!

RO Point-Selects @MySQL 8.0 (Dec.2017)
• Sysbench Point-Selects 10Mx8tab @2CPU Sockets • 2CPU Sockets Broadwell v4 : 44cores-HT • 2CPU Sockets Skylake Platinum : 48cores-HT • => near 80% gain in peak QPS !! already 50% on 32usr load !!
��������������������������������������������� ������� ���������� �����
���������� �����
���������
� � �� �� ��� �������
��������
���������
���������
���������������������������������������
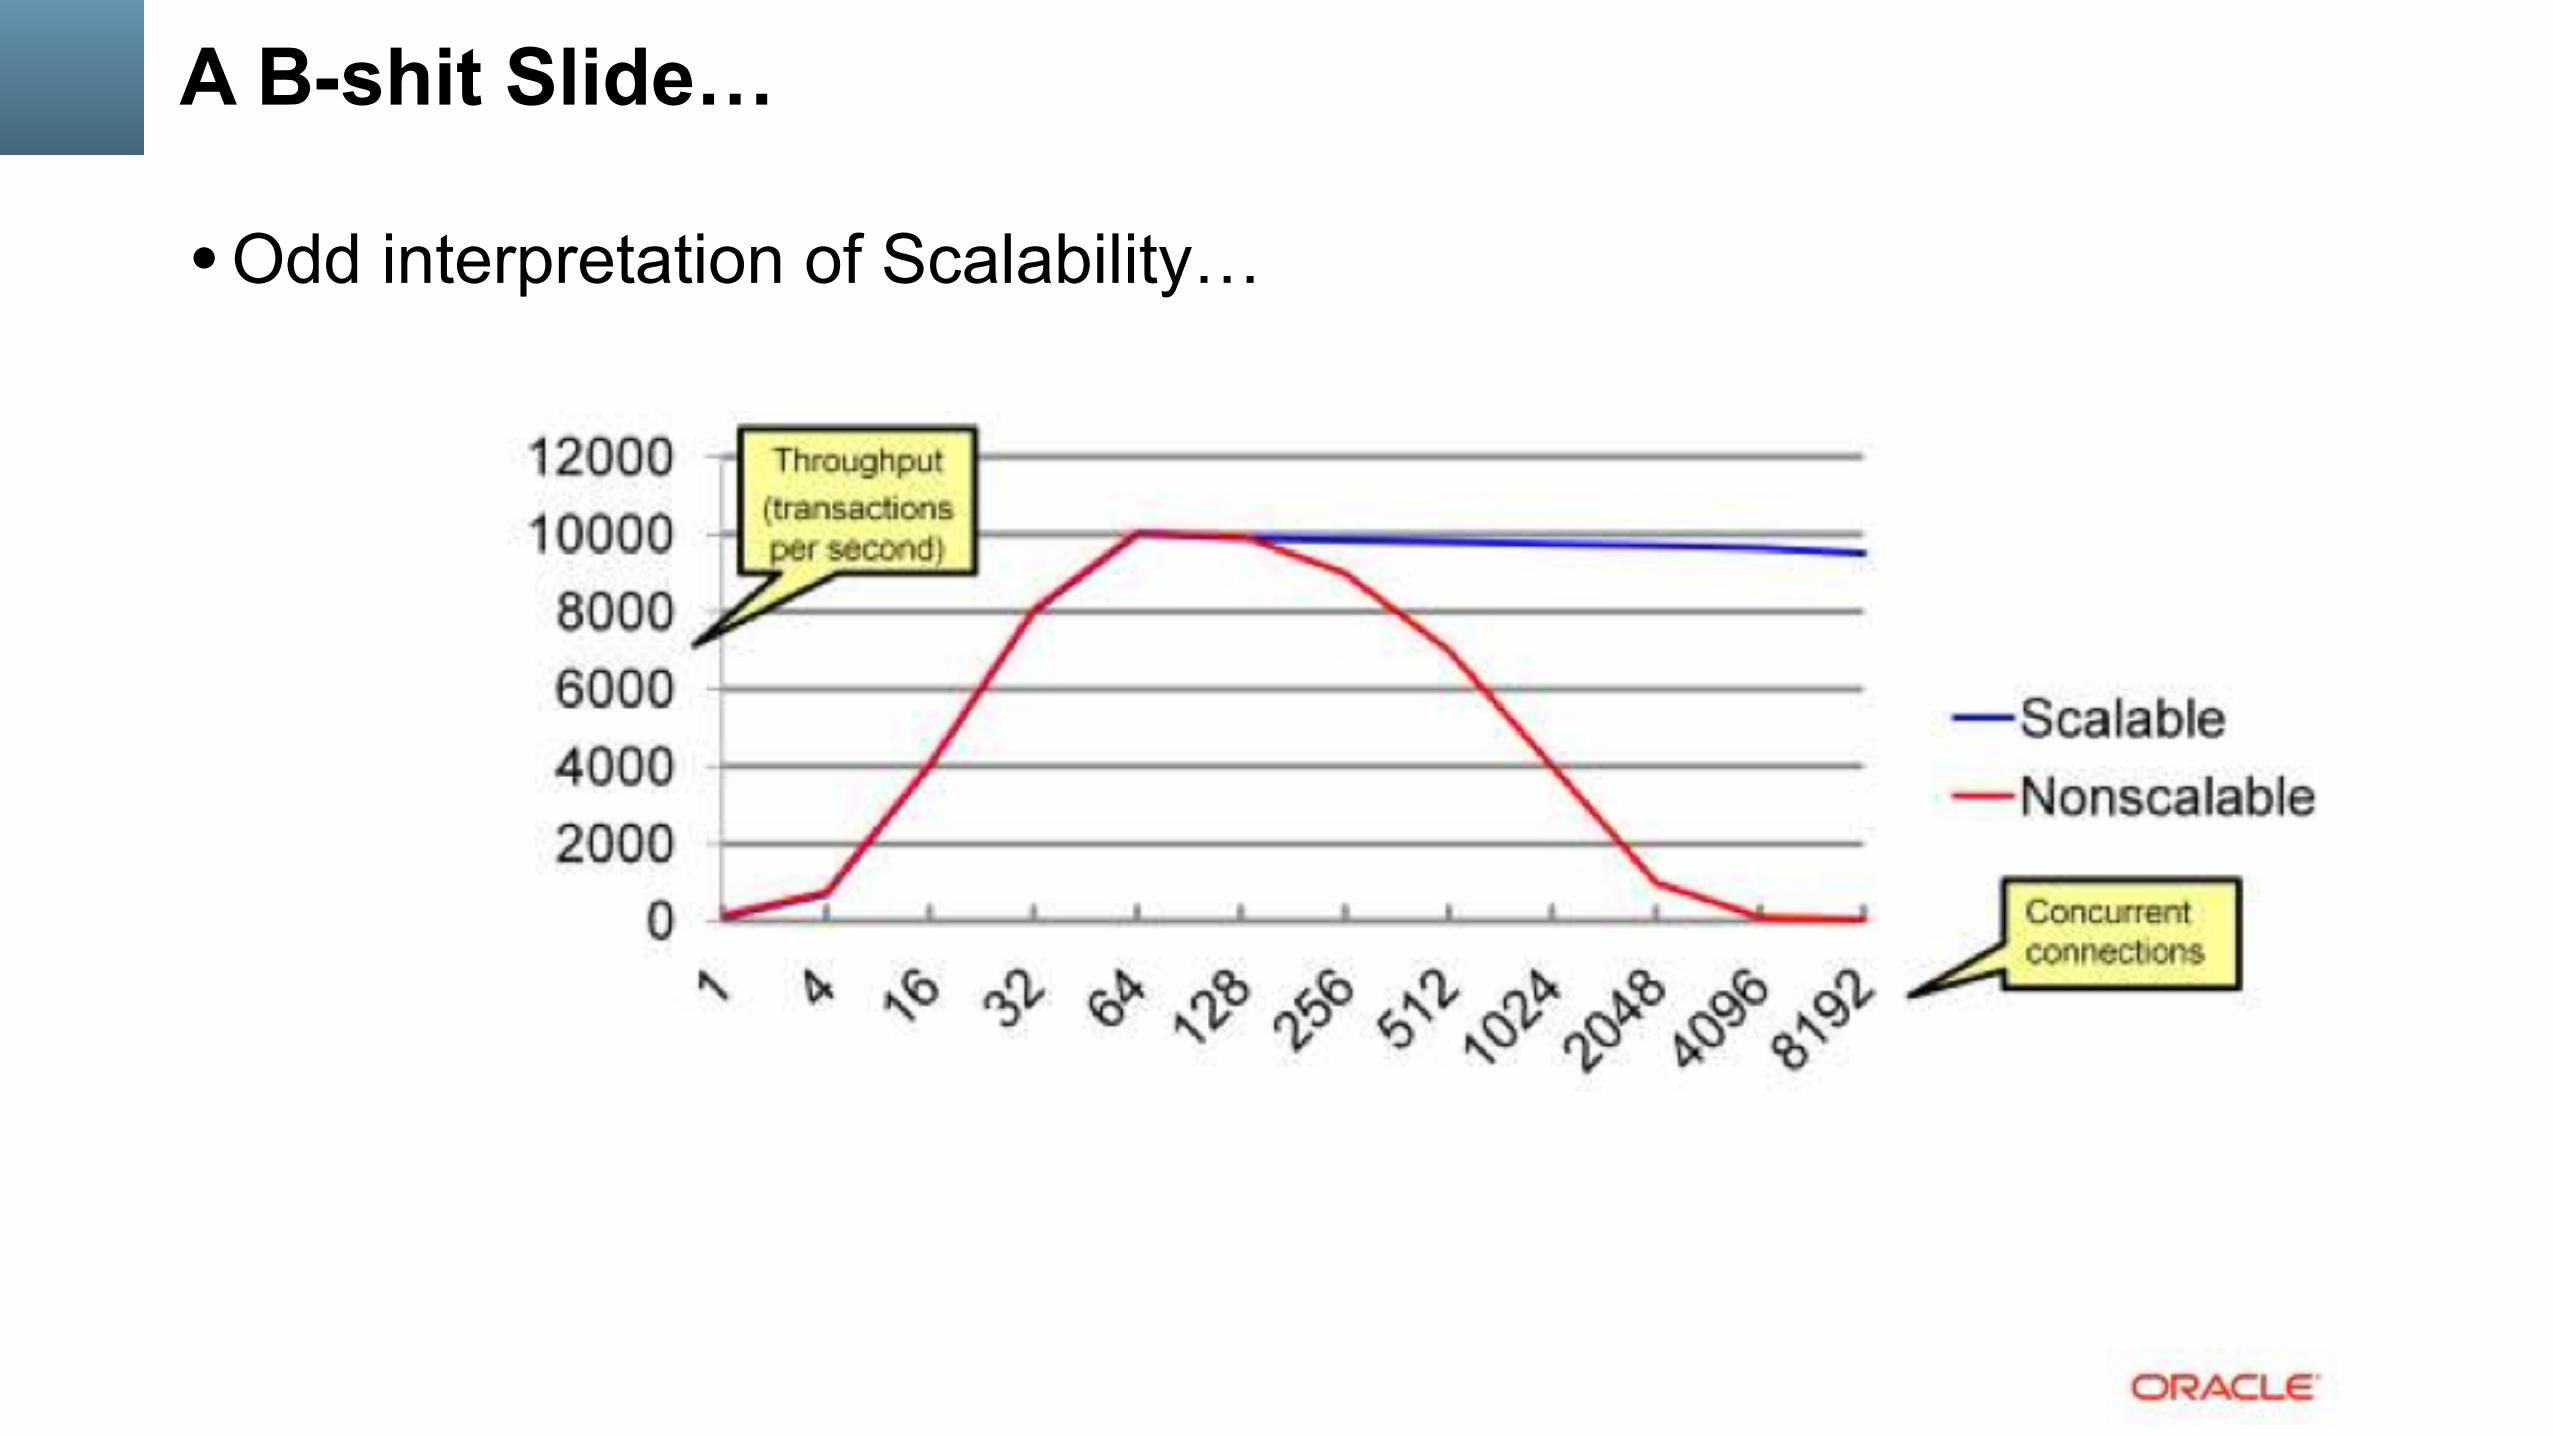
A B-shit Slide…
• Odd interpretation of Scalability…
A B-shit Slide… (2)
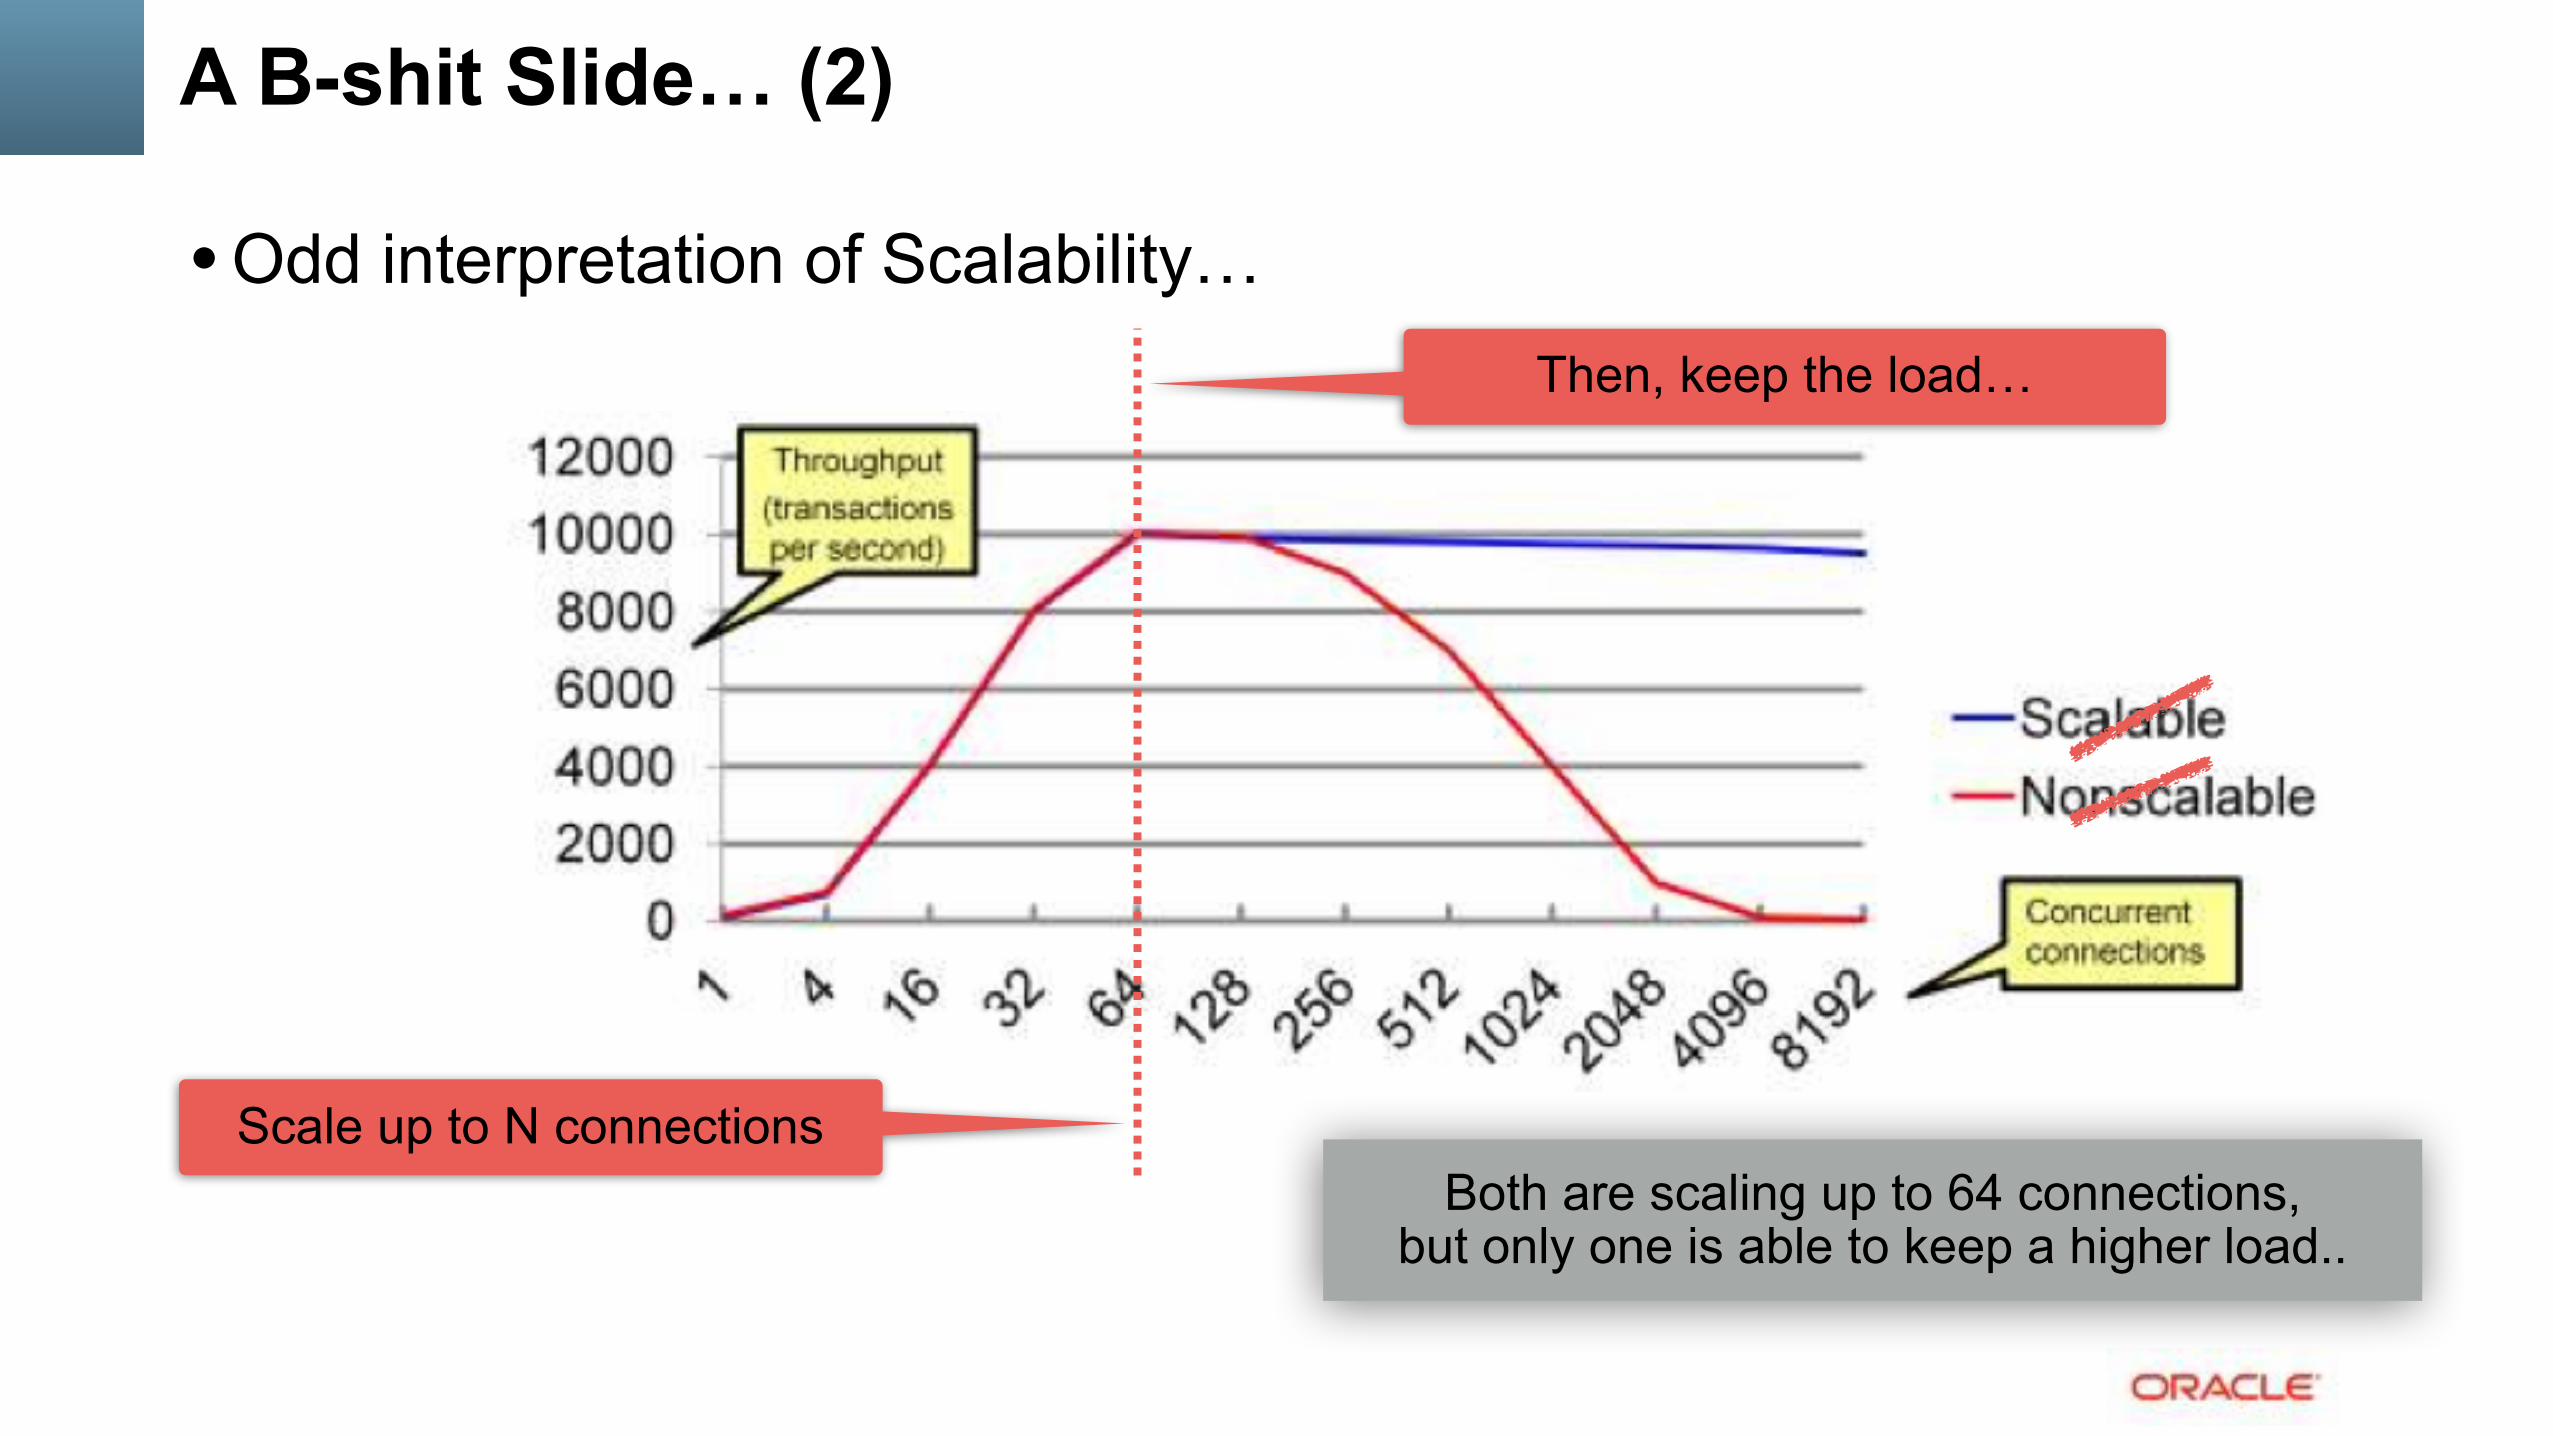
• Odd interpretation of Scalability…
Scale up to N connections
Then, keep the load…
Both are scaling up to 64 connections, but only one is able to keep a higher load..
MySQL on High Load
• Once you’ve reached your Max TPS on your system : • try to understand first what is limiting you? (I/O, CPU, Network, MySQL internals?) • the next goal then: to avoid a TPS “regression” on a higher load
• How to keep your Max TPS on a higher load too? • the dumb rule : avoid to have a load higher than you’re able to keep ! ;-) • seriously :
• if you hit internal contention (MySQL code) => limiting InnoDB thread concurrency may help • if you hit data contention (your app code) => limiting transaction concurrency may help as well • your best friends : ThreadPool / ProxySQL / etc..
• NOTE : there is no “magic” for response time : • if your Max TPS you’re reaching on N users • and able to keep the same Max TPS on N x2 users (or x3, x4, etc.) • your response time may only grow! (and be x2 times bigger (or x3, or x4, etc.))
Recognize your Workload by “pattern” ;-)
• In-Memory Workload : • you don’t have IO reads
• IO-bound Workload : • you have IO reads ;-))
• Read-Only (RO) : • you don’t have any data writes
• Read+Write (RW) : • you have data writes ;-))

In-Memory Read-Only Scalability
• RO : since MySQL 5.7 is “generally” OK, but • Block Locks <= workaround : ProxySQL Query Cache • Lookups via Sec.IDX <= possible workaround : use PK, AHI • UTF8 <= use 8.0 ;-)

IO-bound Read-Only Scalability
• RO : since MySQL 5.7 is “generally” OK, but • Block Locks <= workaround : ProxySQL Query Cache • Lookups via Sec.IDX <= possible workaround : use PK, AHI • UTF8 <= use 8.0 ;-) • Global lock on every IO read <= use 8.0 ;-)
IO-bound Point-Selects @MySQL 8.0 (Apr.2018)
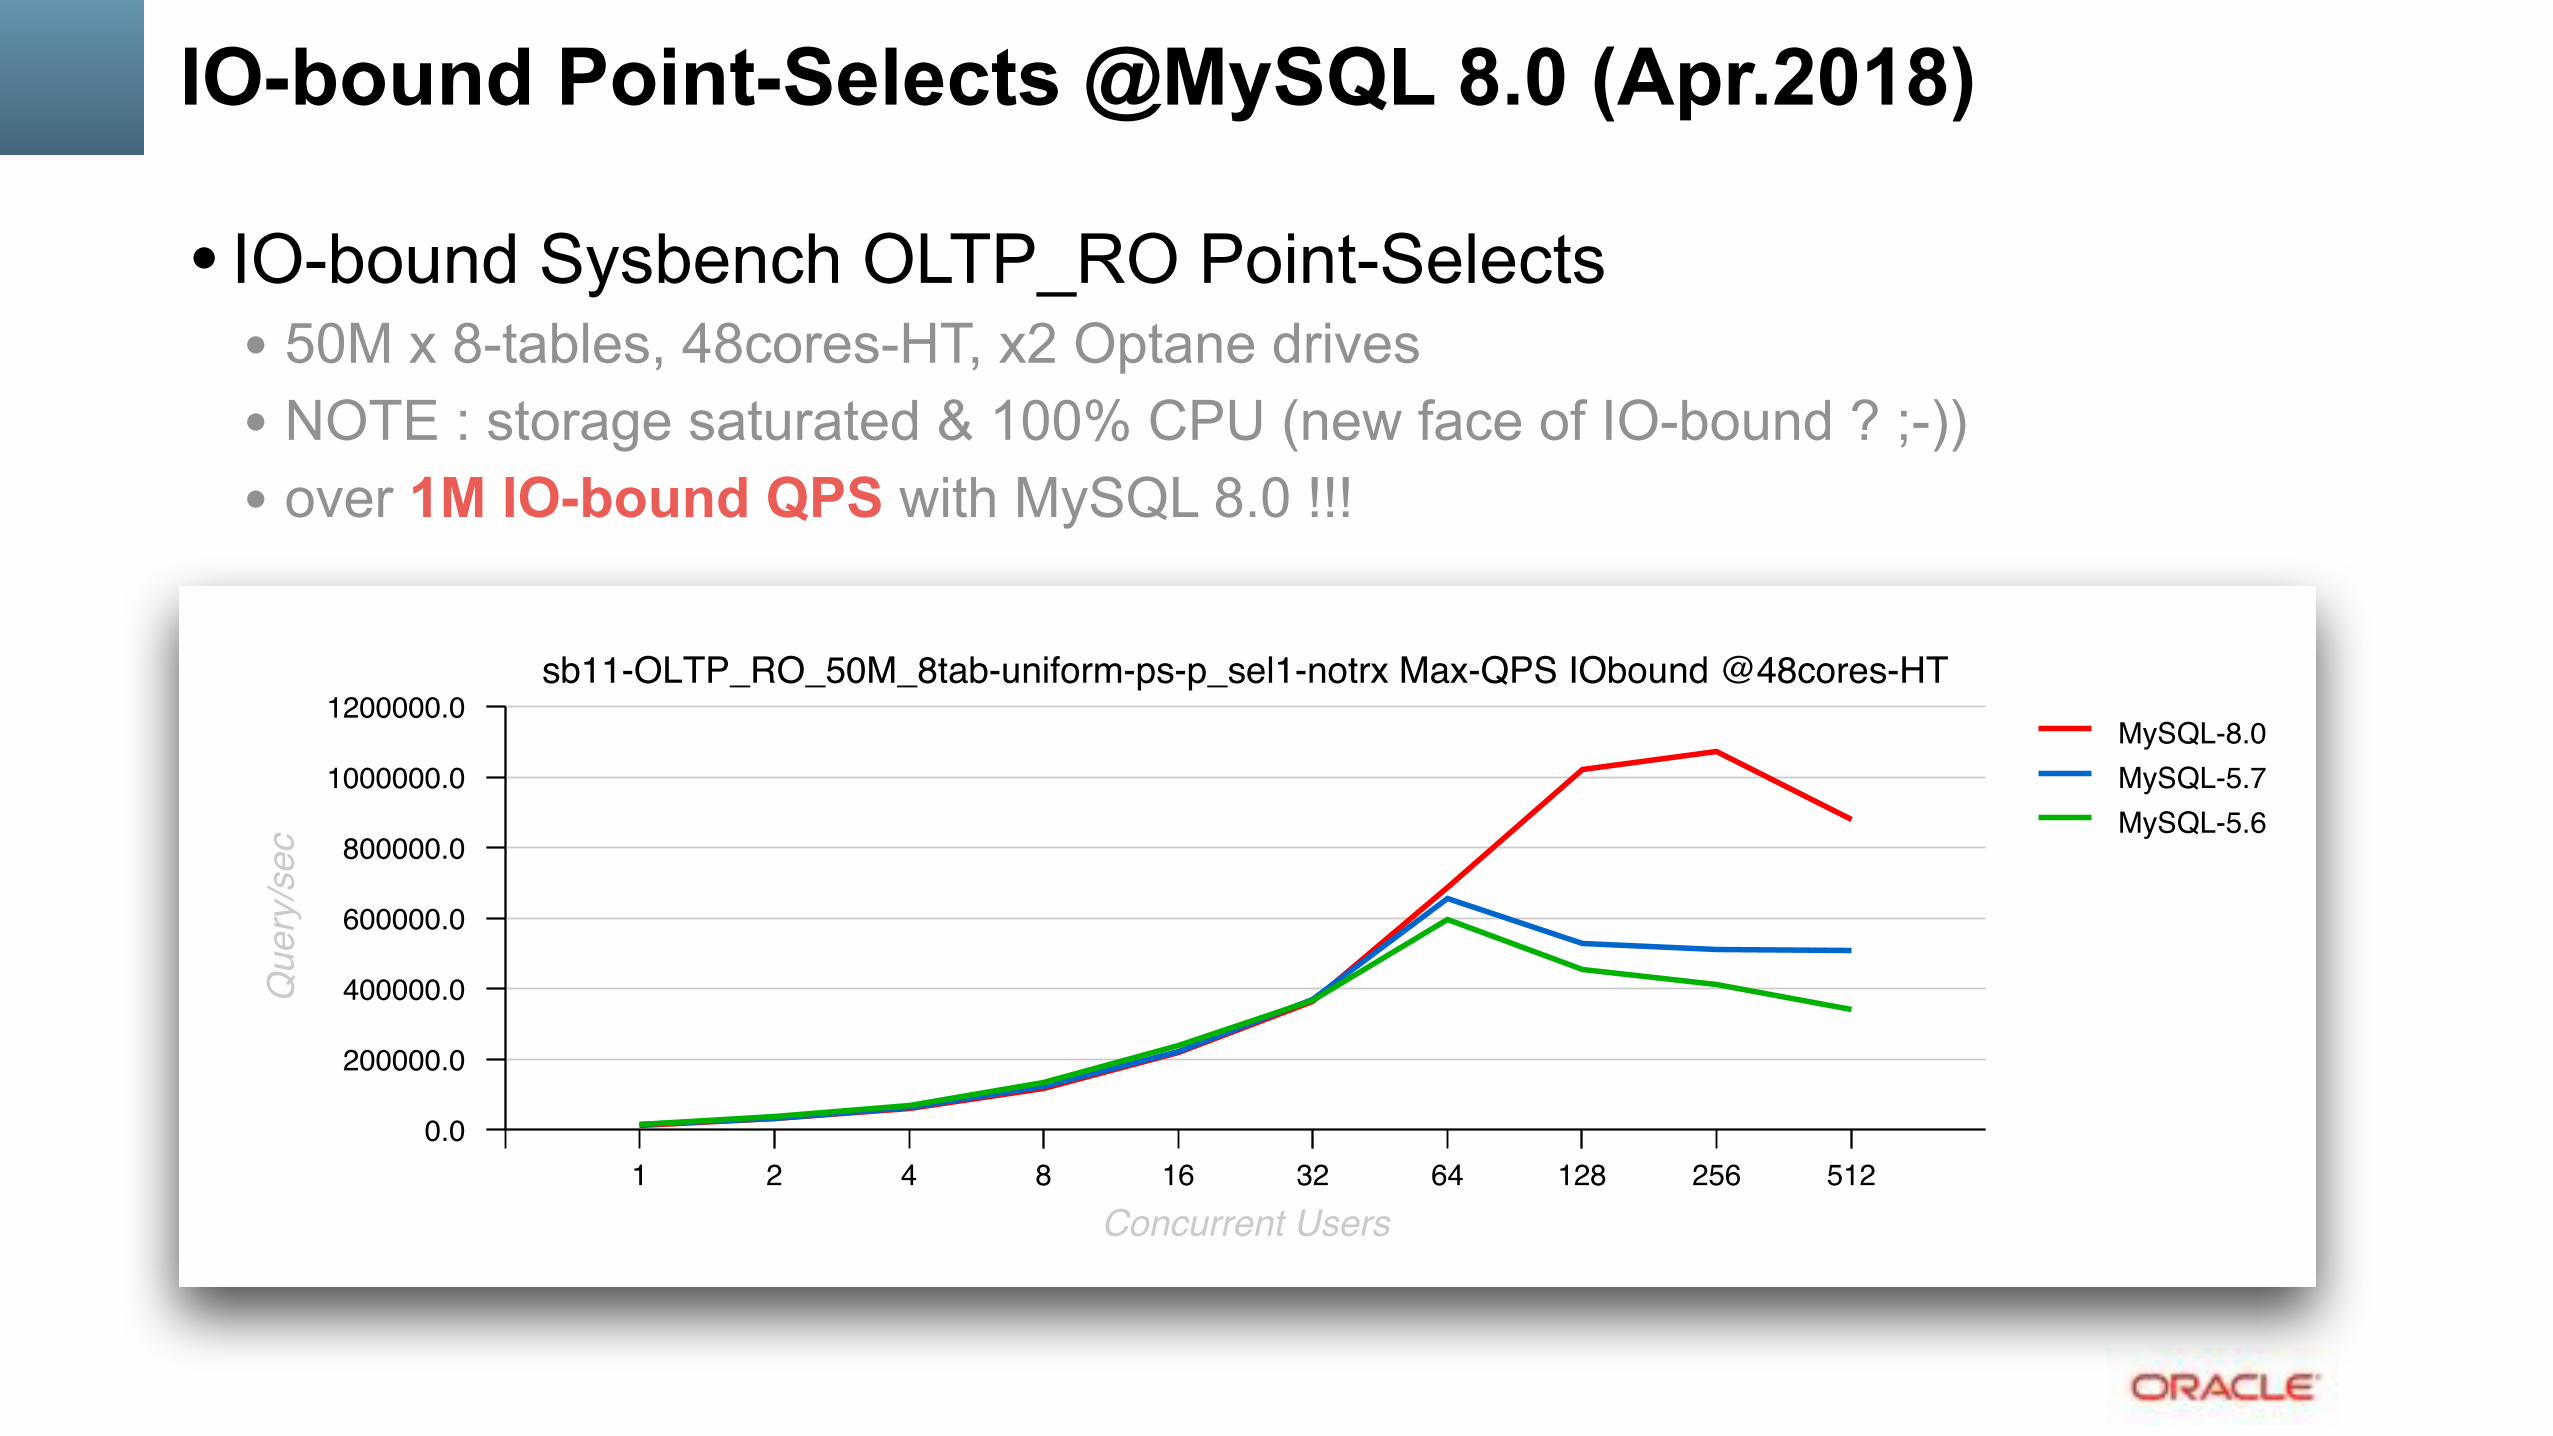
• IO-bound Sysbench OLTP_RO Point-Selects • 50M x 8-tables, 48cores-HT, x2 Optane drives • NOTE : storage saturated & 100% CPU (new face of IO-bound ? ;-)) • over 1M IO-bound QPS with MySQL 8.0 !!!
��������������������������������������������� ������� ������� �����������
���������� �����
���������
� � � � �� �� �� ��� ��� ������
��������
��������
��������
��������
���������
������������������������������������

Read+Write Scalability
• RW : • always has IO writes ! • storage is very important ! • max REDO write rate = your max TRX rate (TPS) • REDO write+fsync latency = your TRX response time
• In-Memory : • REDO writes + background(!) DATA writes (dirty pages flushing) • as long as DATA flushing follows your REDO writes => all OK • big enough REDO size can lower requirement for storage performance
• IO-bound : • REDO writes + awaited(!) DATA writes + DATA reads ! • you can read DATA only into Free page => if no more Free pages = TRX stall.. • storage capacity becomes extremely important !
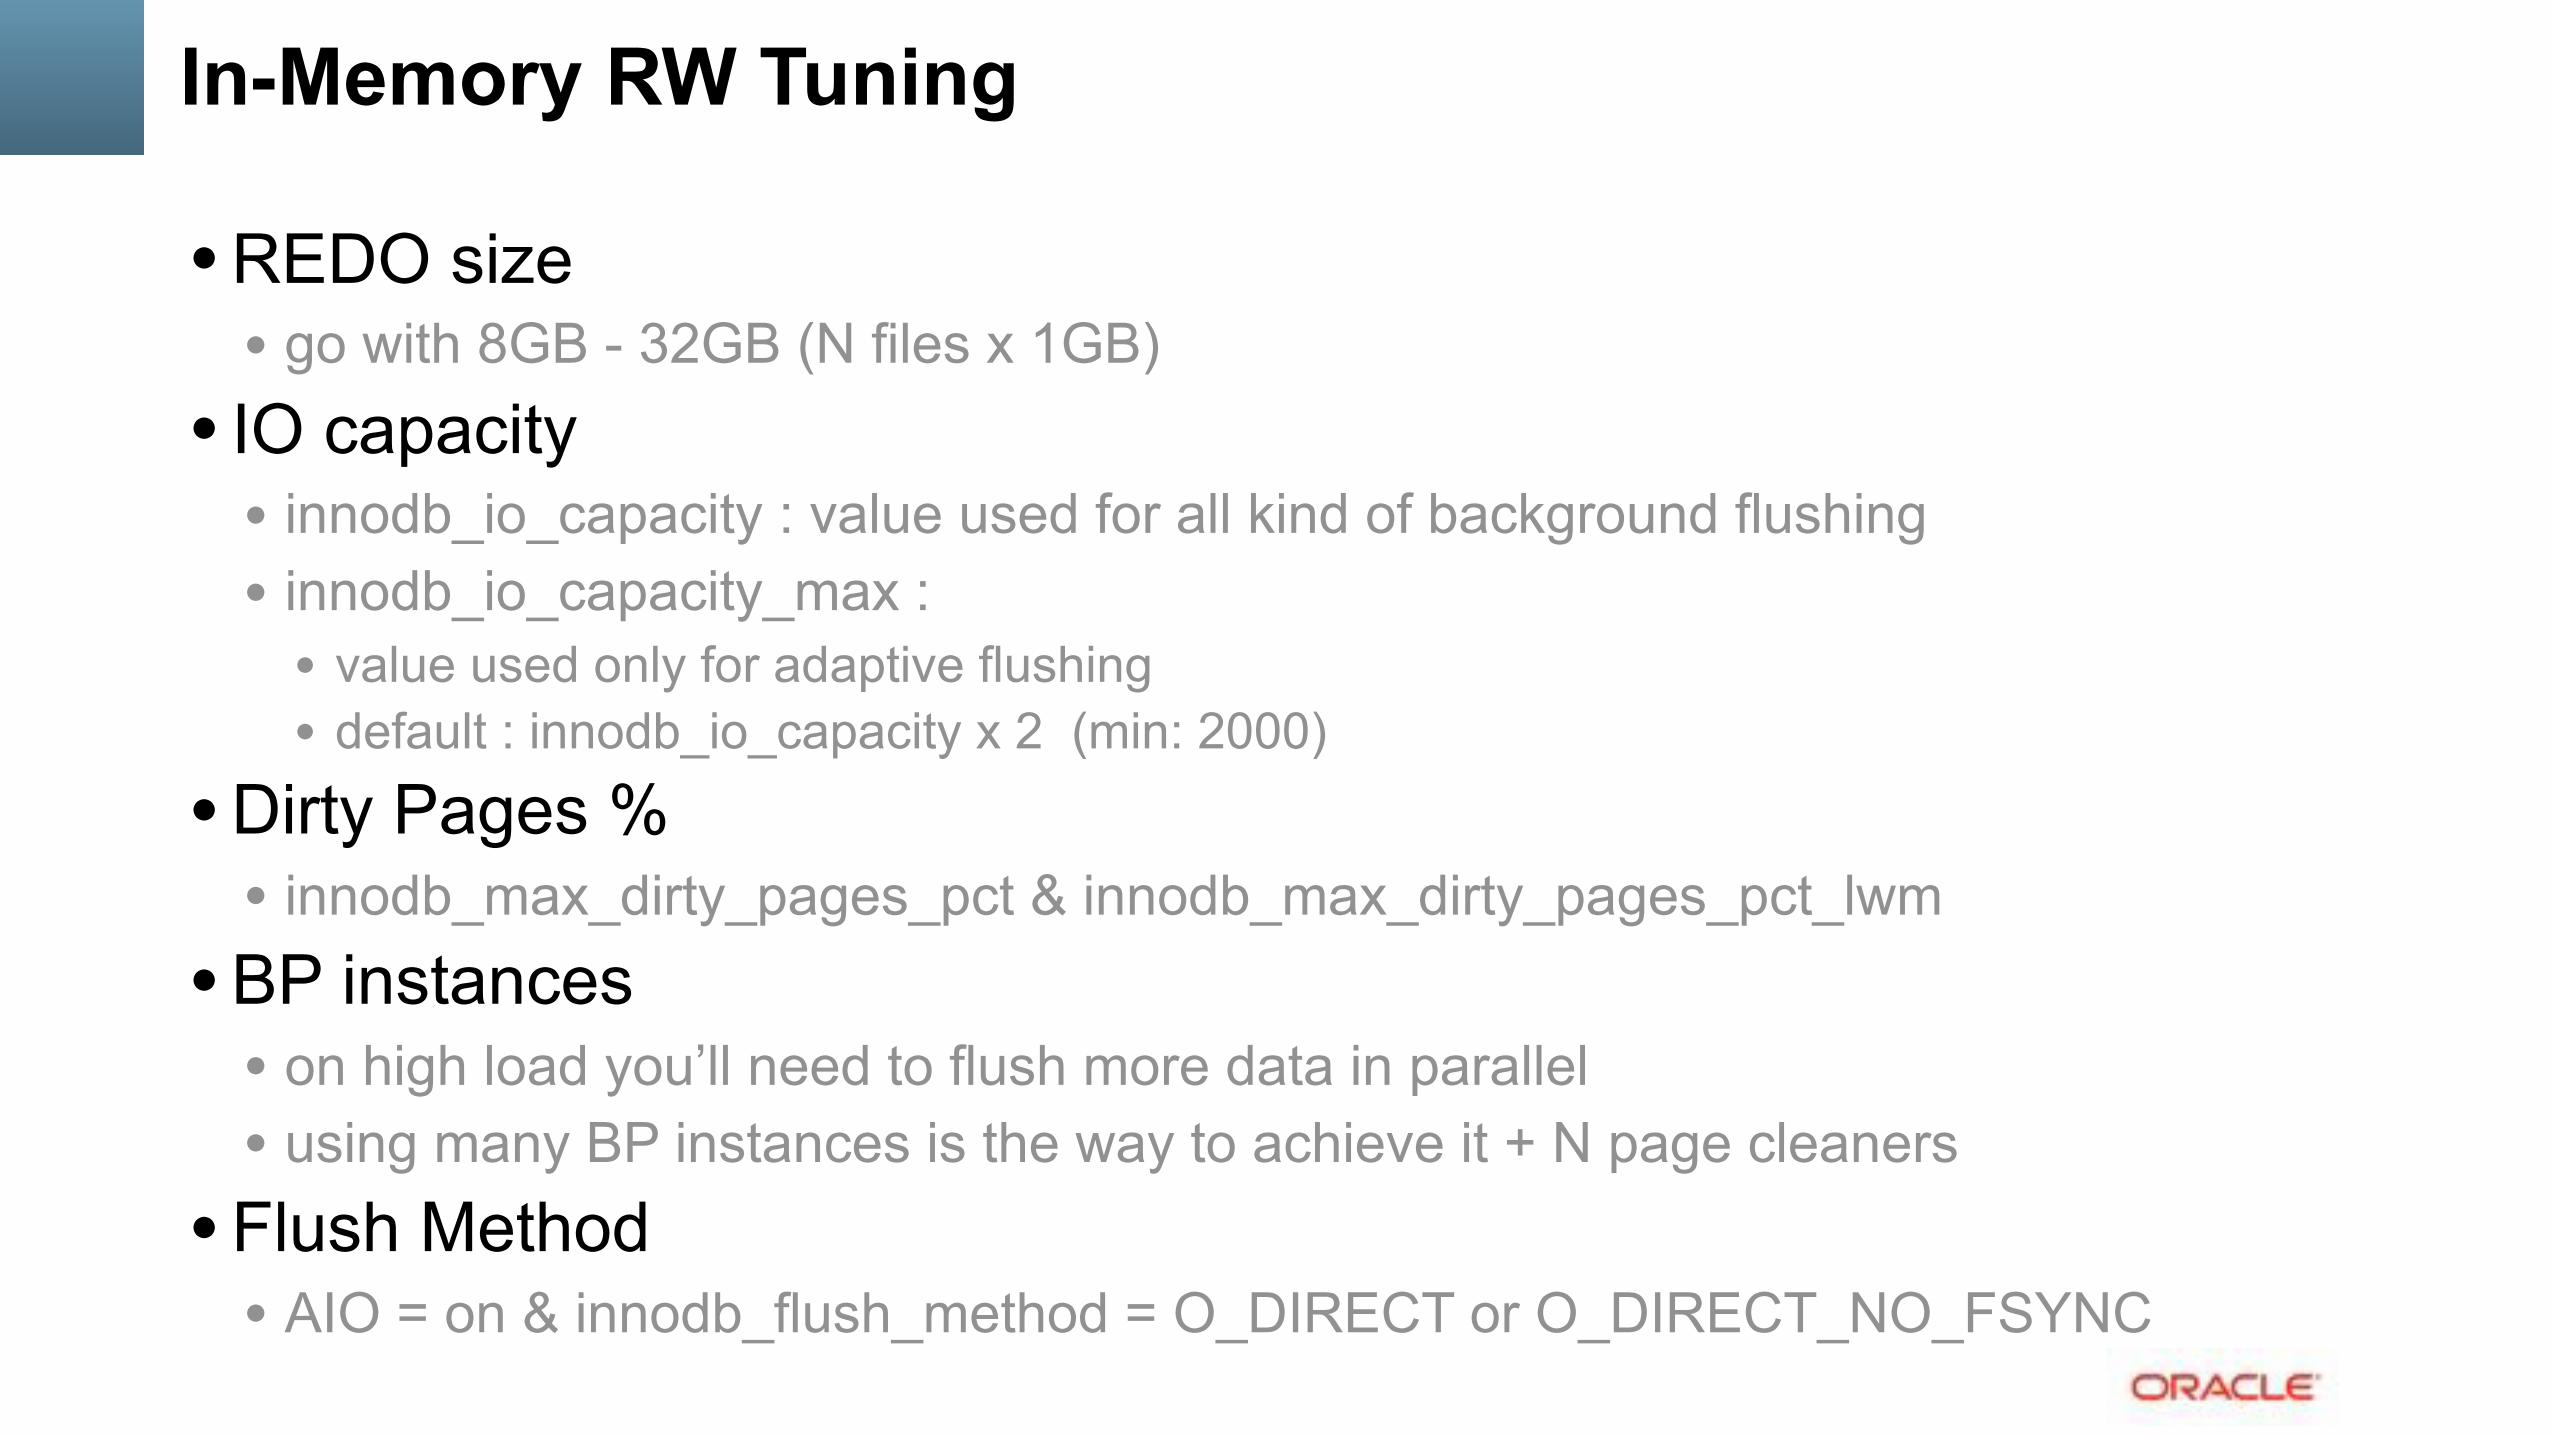
In-Memory RW Tuning
• REDO size • go with 8GB - 32GB (N files x 1GB)
• IO capacity • innodb_io_capacity : value used for all kind of background flushing • innodb_io_capacity_max :
• value used only for adaptive flushing • default : innodb_io_capacity x 2 (min: 2000)
• Dirty Pages % • innodb_max_dirty_pages_pct & innodb_max_dirty_pages_pct_lwm
• BP instances • on high load you’ll need to flush more data in parallel • using many BP instances is the way to achieve it + N page cleaners
• Flush Method • AIO = on & innodb_flush_method = O_DIRECT or O_DIRECT_NO_FSYNC
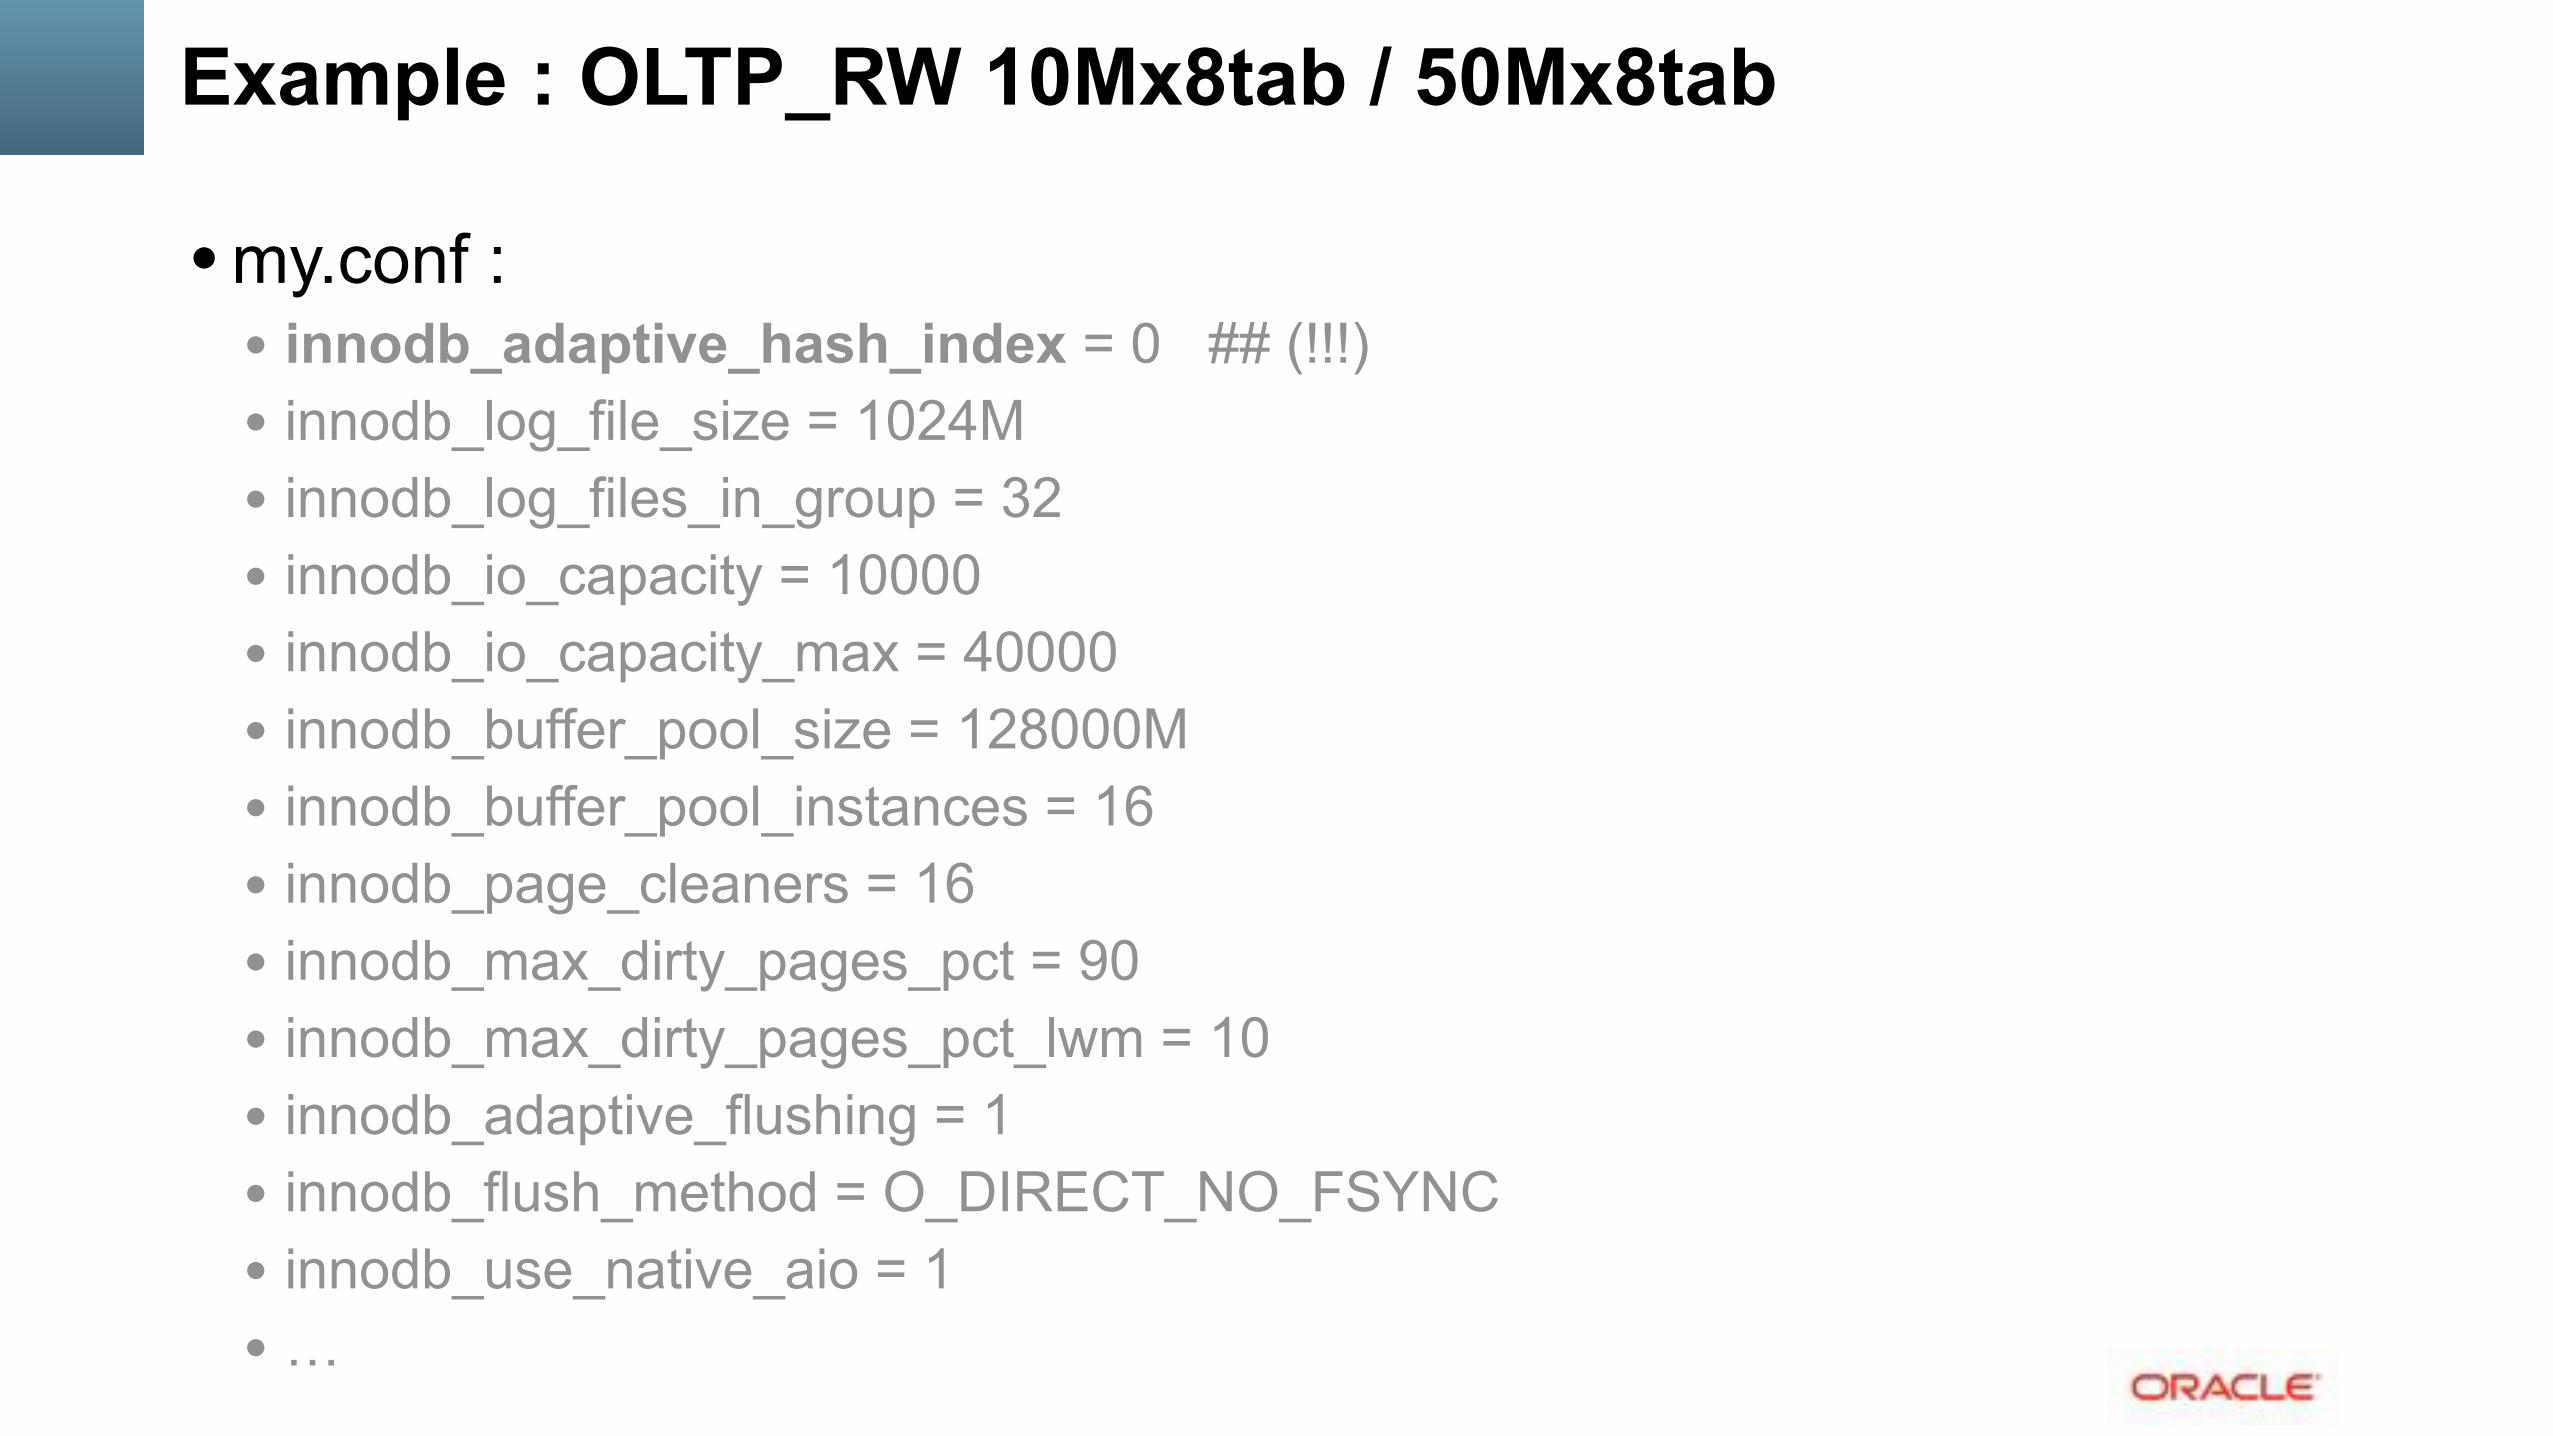
Example : OLTP_RW 10Mx8tab / 50Mx8tab
• my.conf : • innodb_adaptive_hash_index = 0 ## (!!!) • innodb_log_file_size = 1024M • innodb_log_files_in_group = 32 • innodb_io_capacity = 10000 • innodb_io_capacity_max = 40000 • innodb_buffer_pool_size = 128000M • innodb_buffer_pool_instances = 16 • innodb_page_cleaners = 16 • innodb_max_dirty_pages_pct = 90 • innodb_max_dirty_pages_pct_lwm = 10 • innodb_adaptive_flushing = 1 • innodb_flush_method = O_DIRECT_NO_FSYNC • innodb_use_native_aio = 1 • …
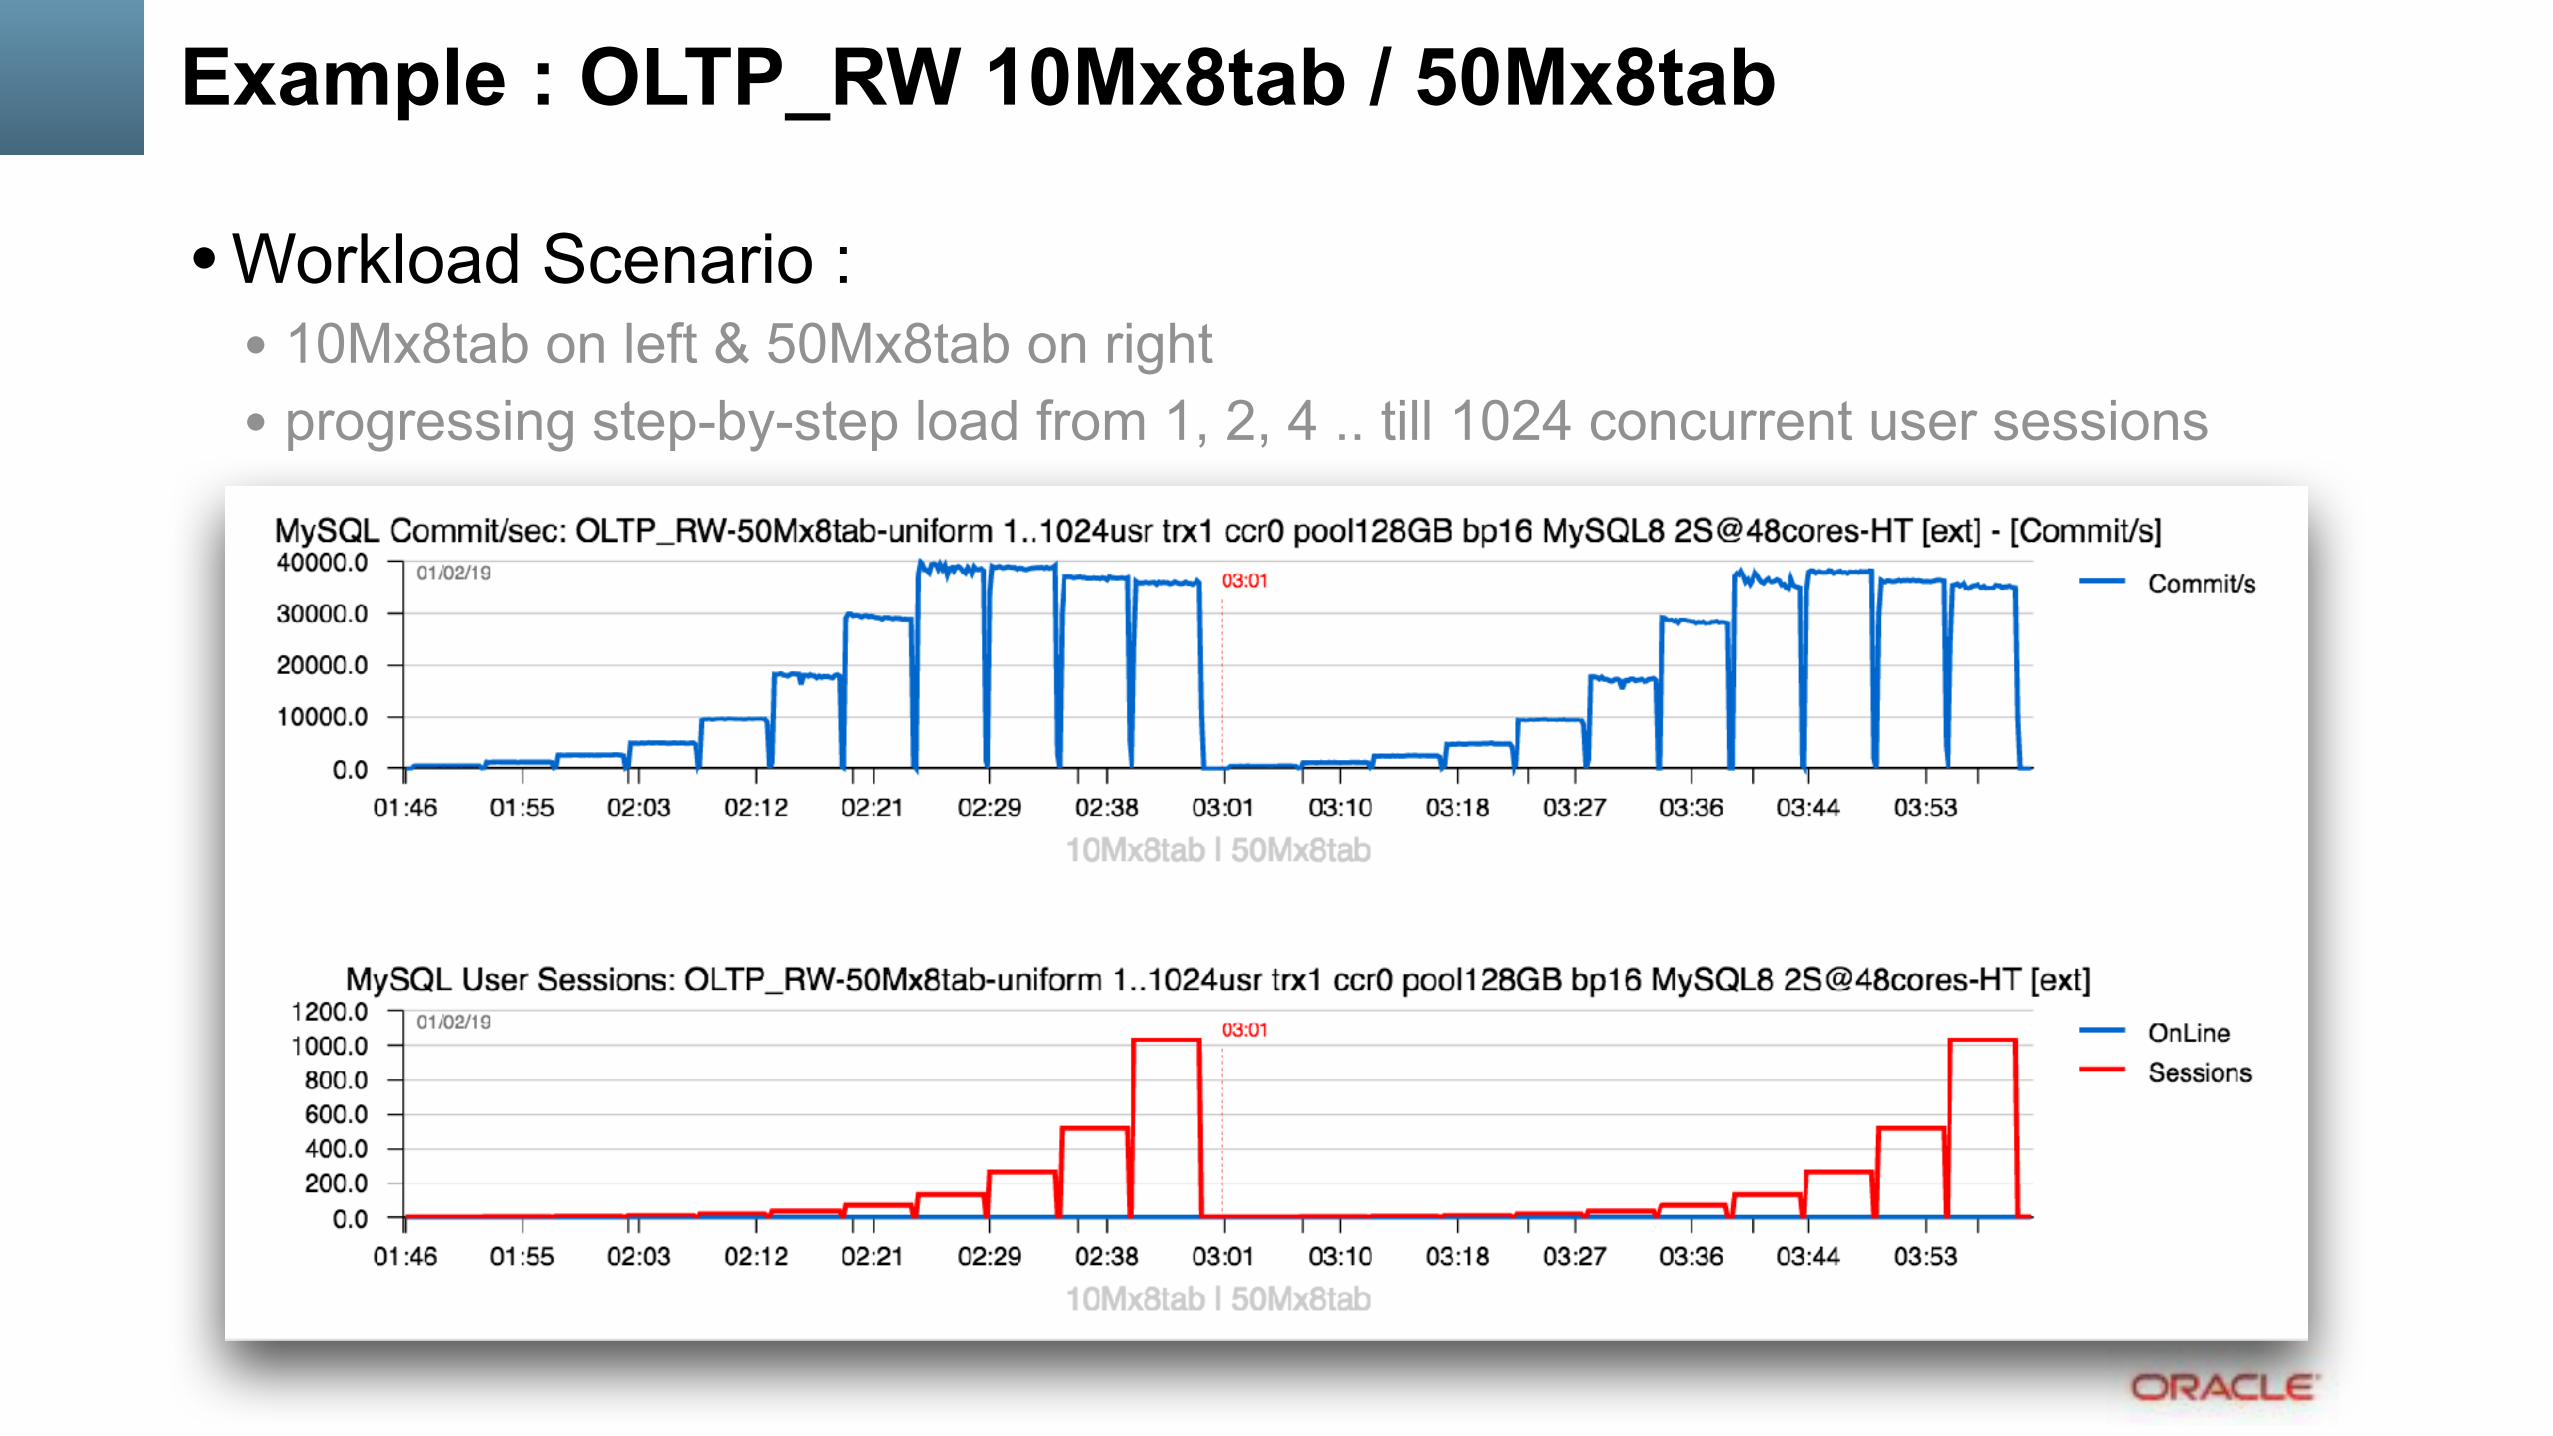
Example : OLTP_RW 10Mx8tab / 50Mx8tab
• Workload Scenario : • 10Mx8tab on left & 50Mx8tab on right • progressing step-by-step load from 1, 2, 4 .. till 1024 concurrent user sessions
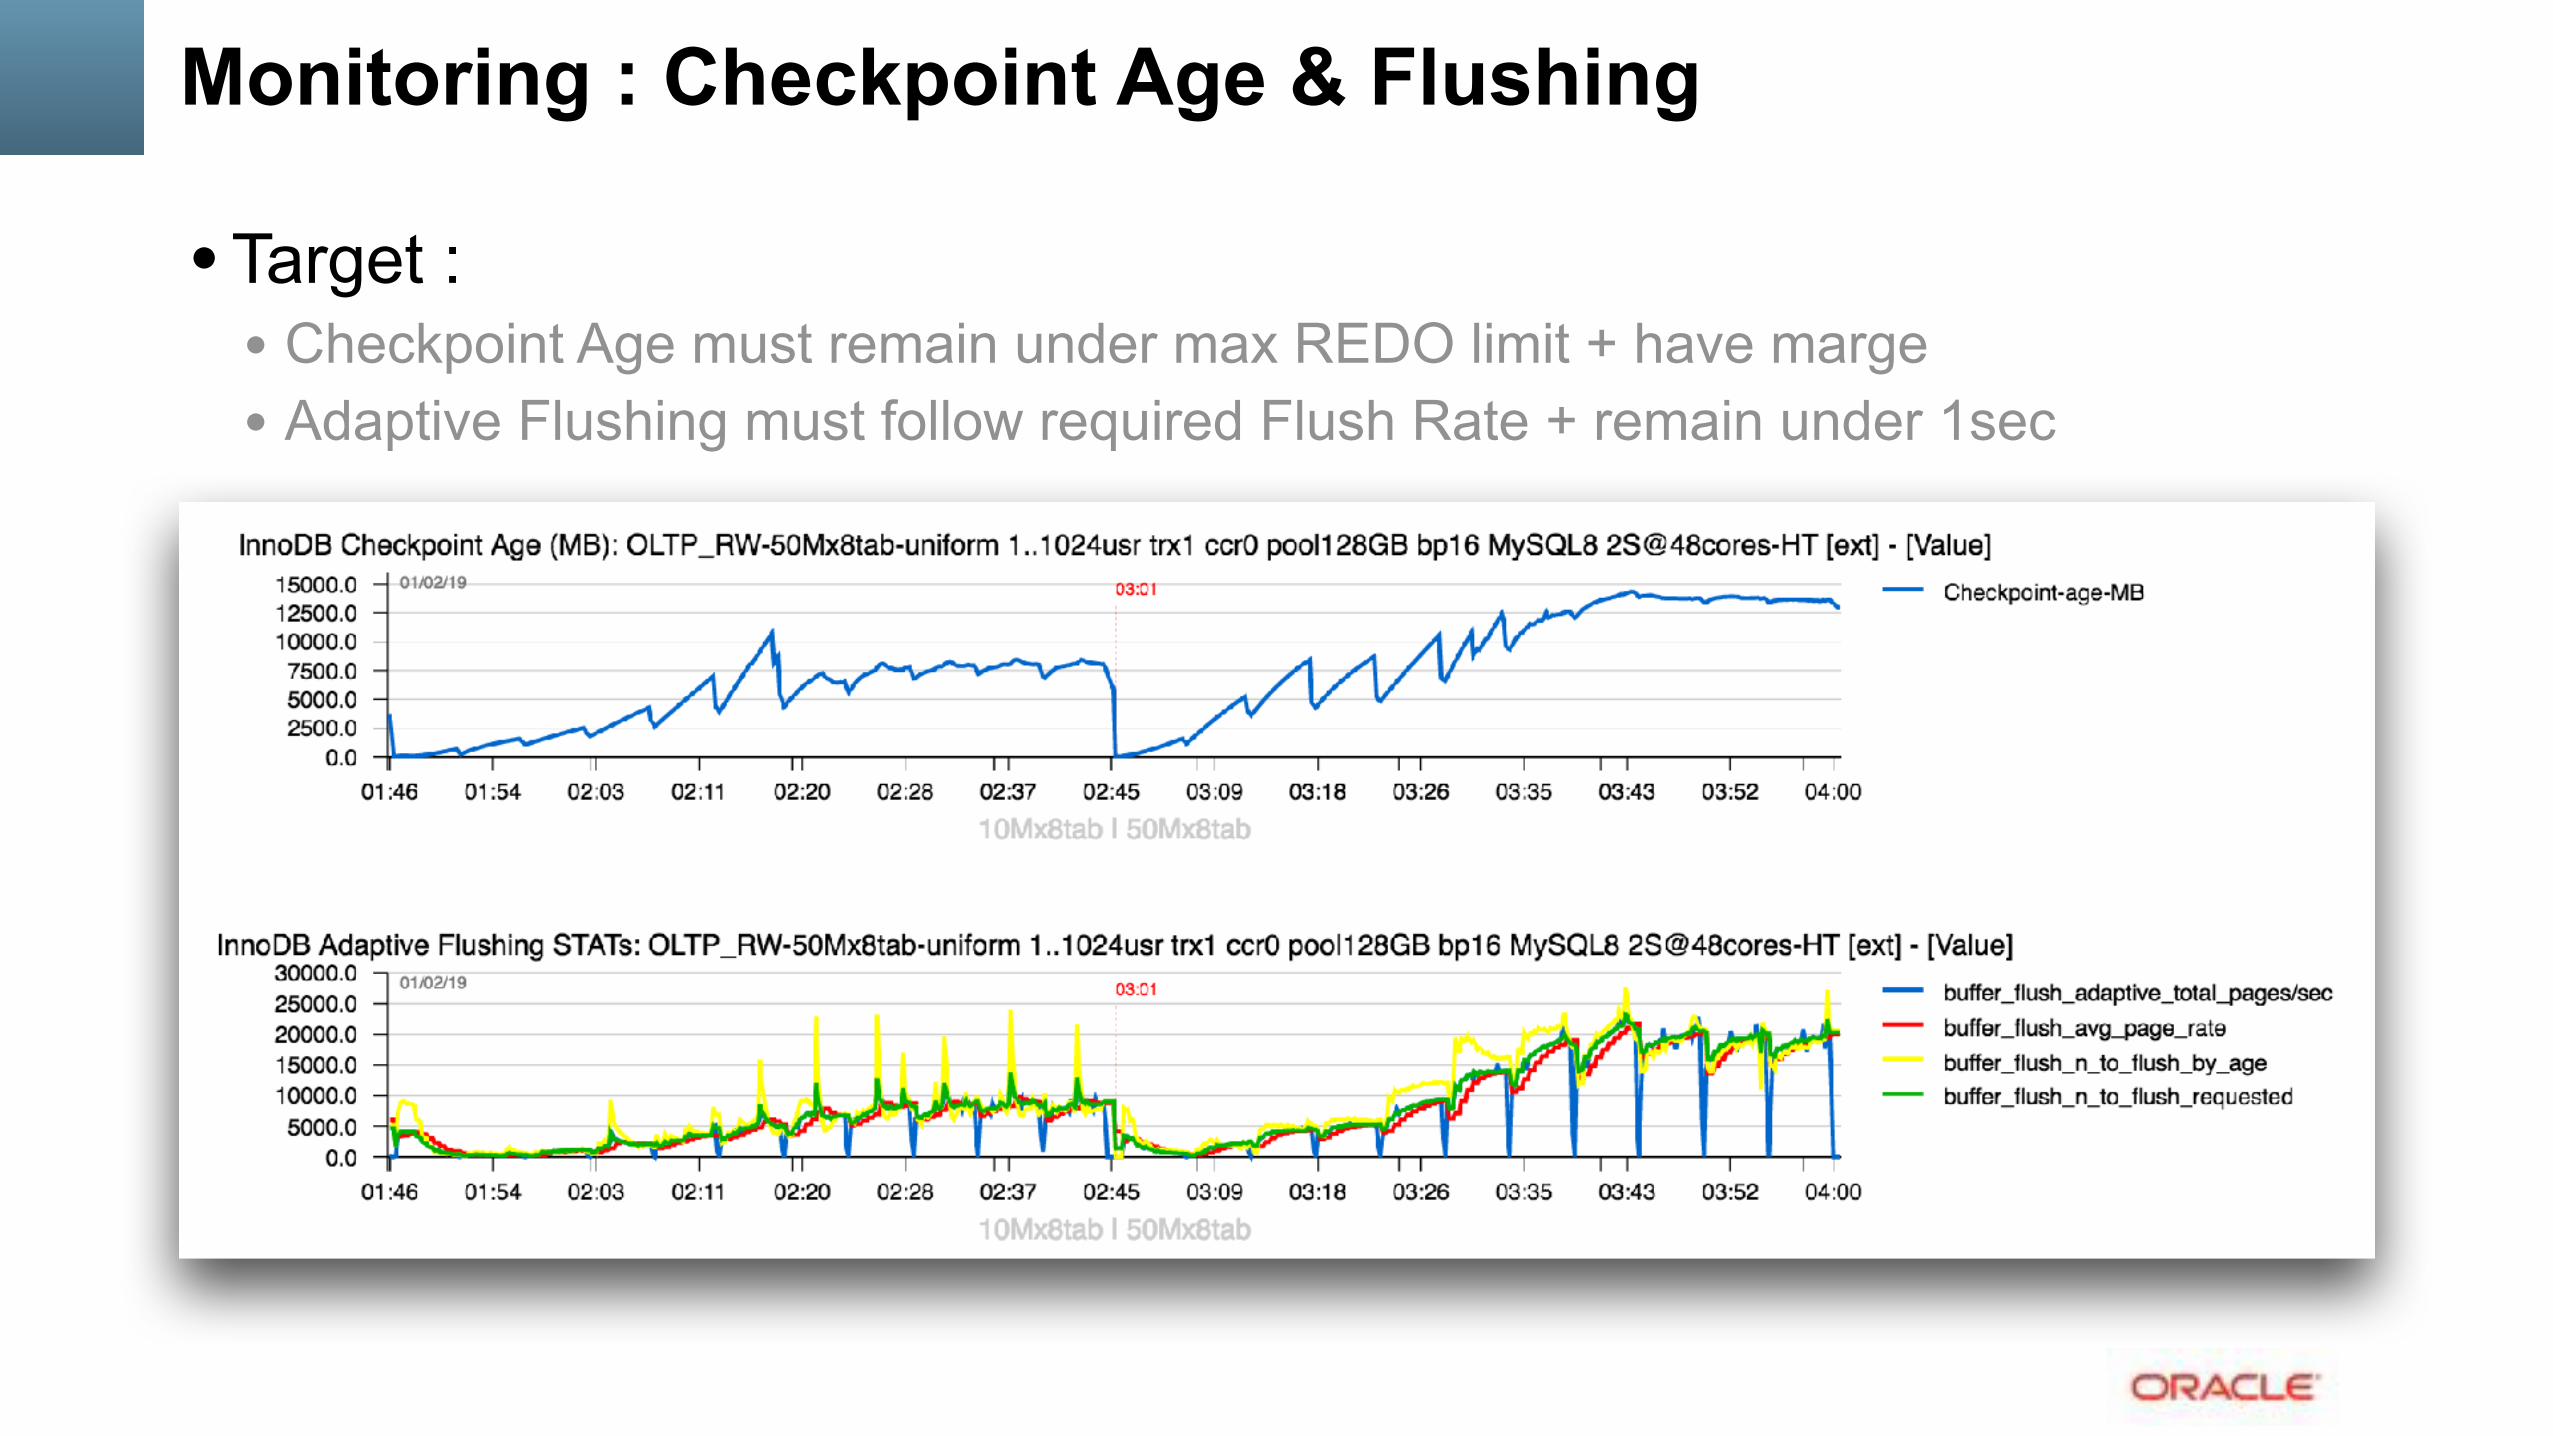
Monitoring : Checkpoint Age & Flushing
• Target : • Checkpoint Age must remain under max REDO limit + have marge • Adaptive Flushing must follow required Flush Rate + remain under 1sec
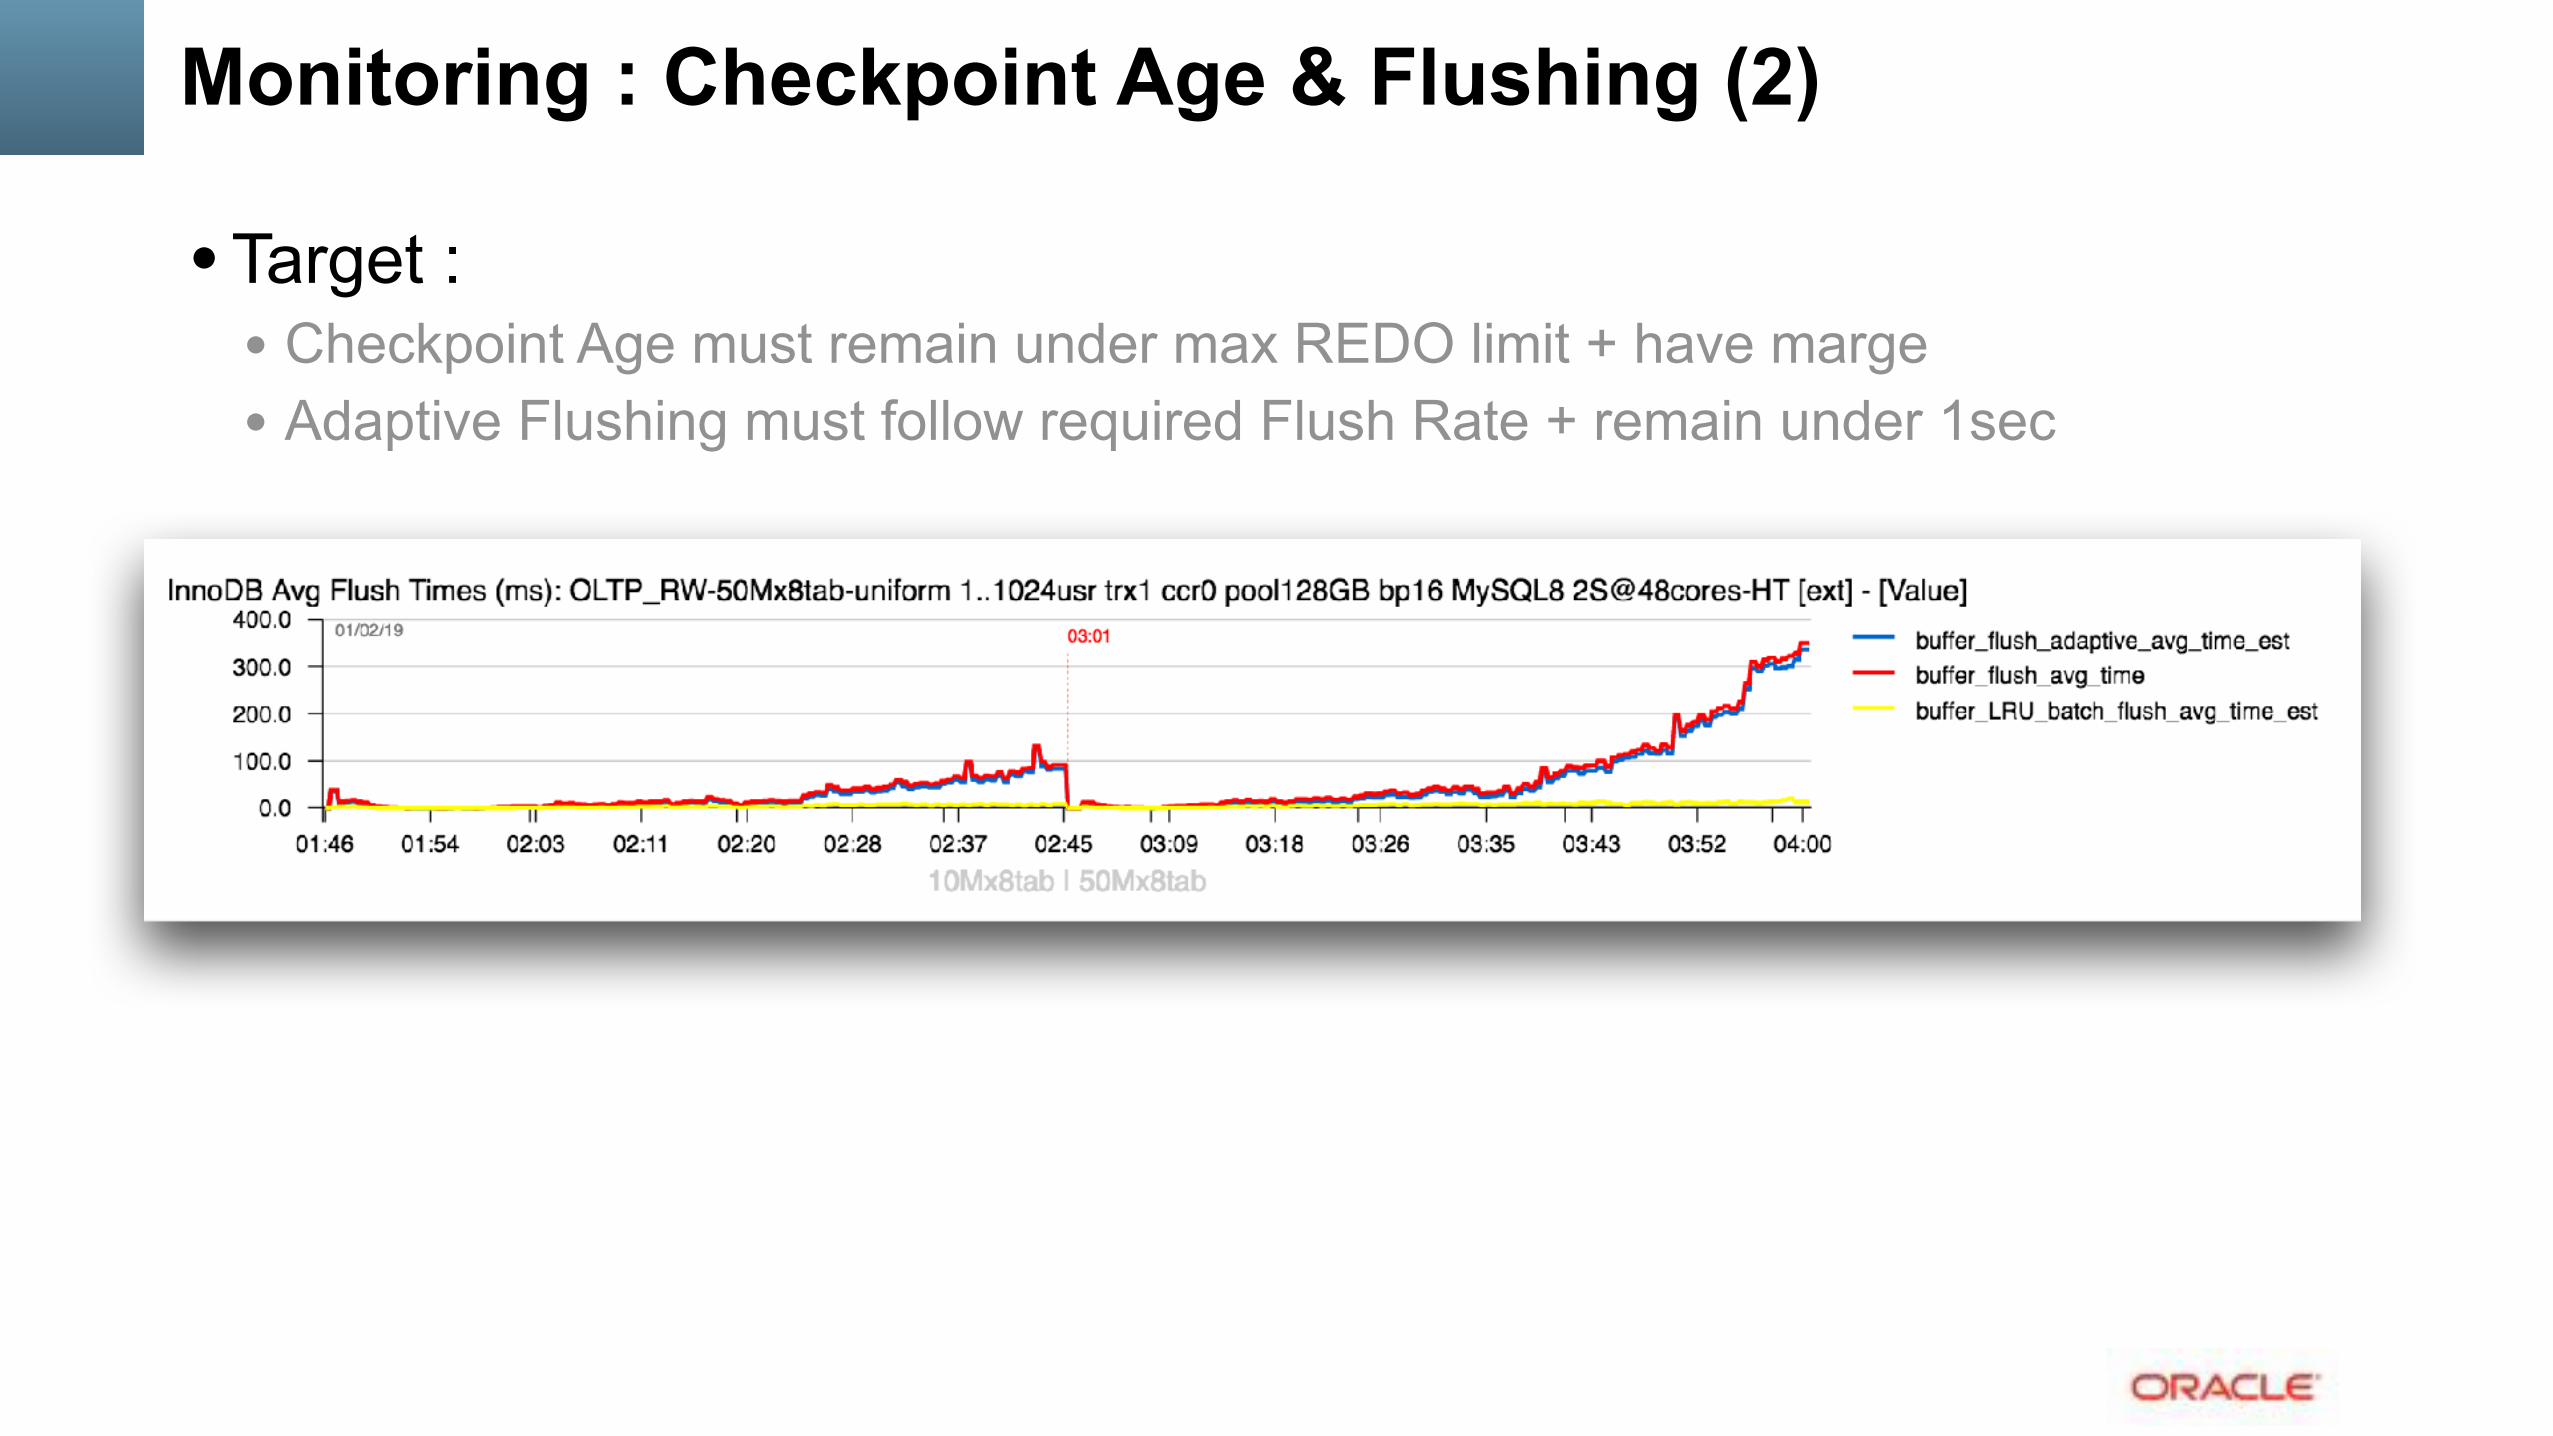
Monitoring : Checkpoint Age & Flushing (2)
• Target : • Checkpoint Age must remain under max REDO limit + have marge • Adaptive Flushing must follow required Flush Rate + remain under 1sec
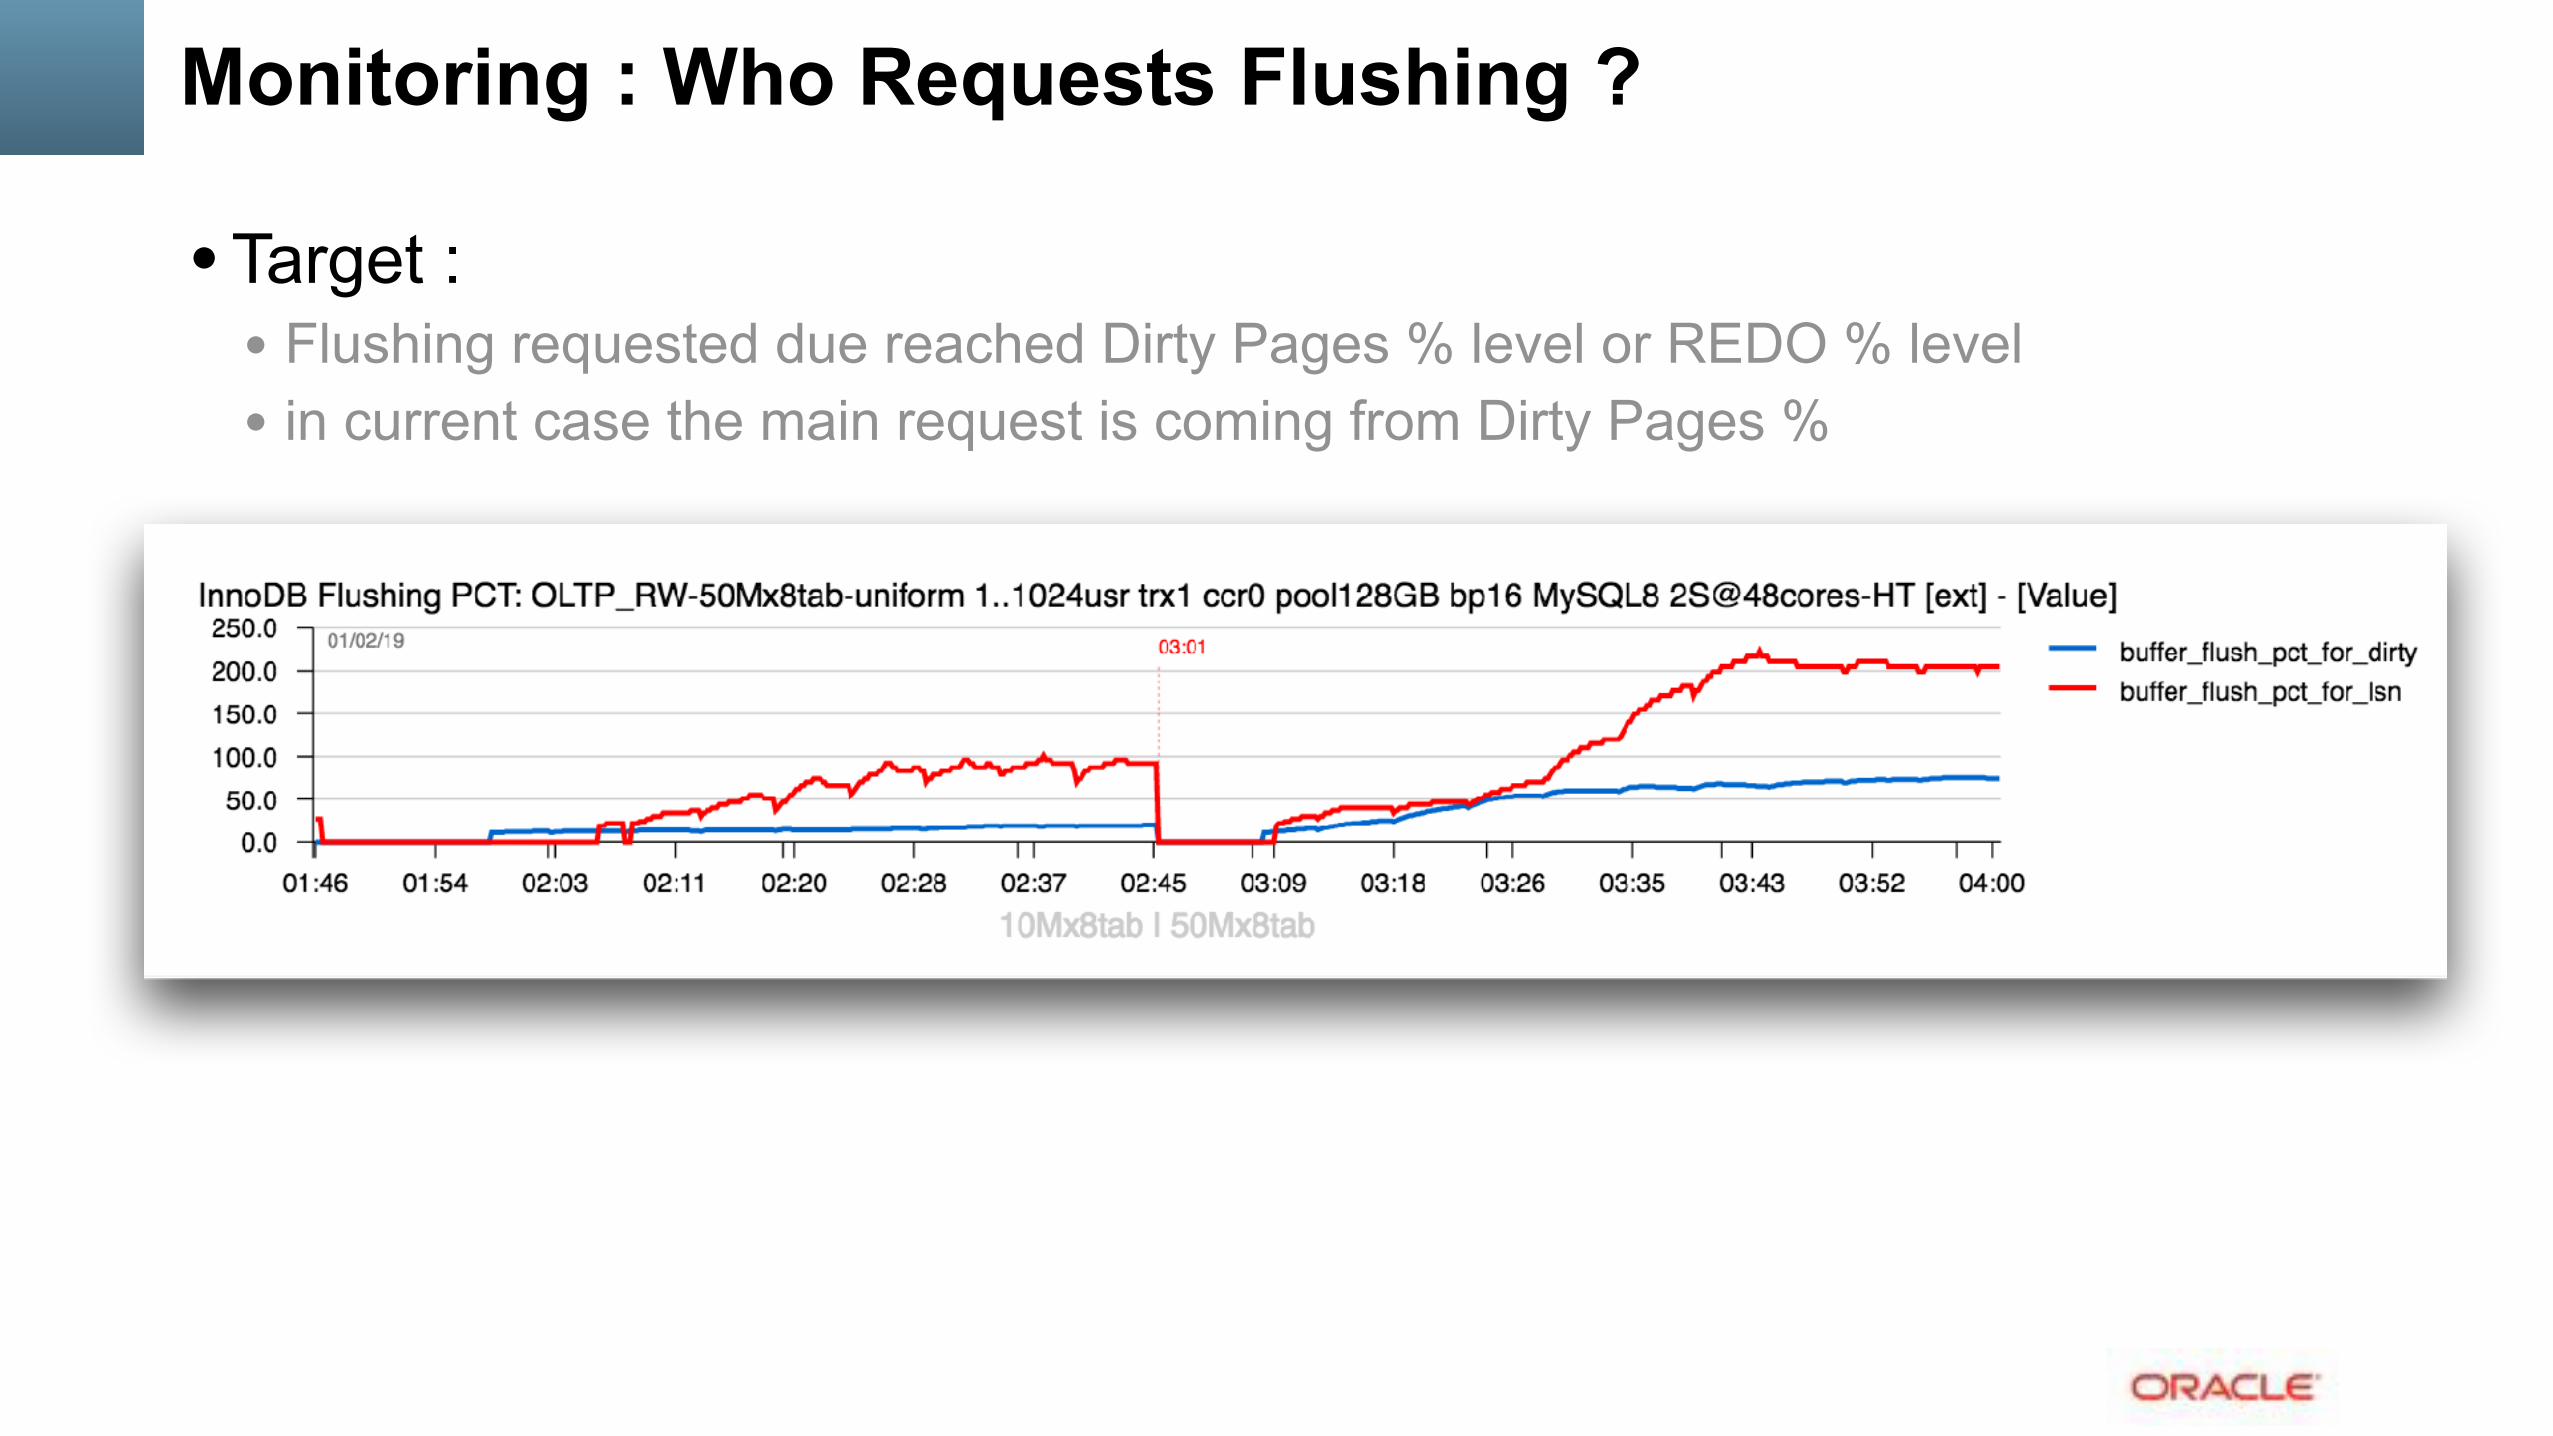
Monitoring : Who Requests Flushing ?
• Target : • Flushing requested due reached Dirty Pages % level or REDO % level • in current case the main request is coming from Dirty Pages %
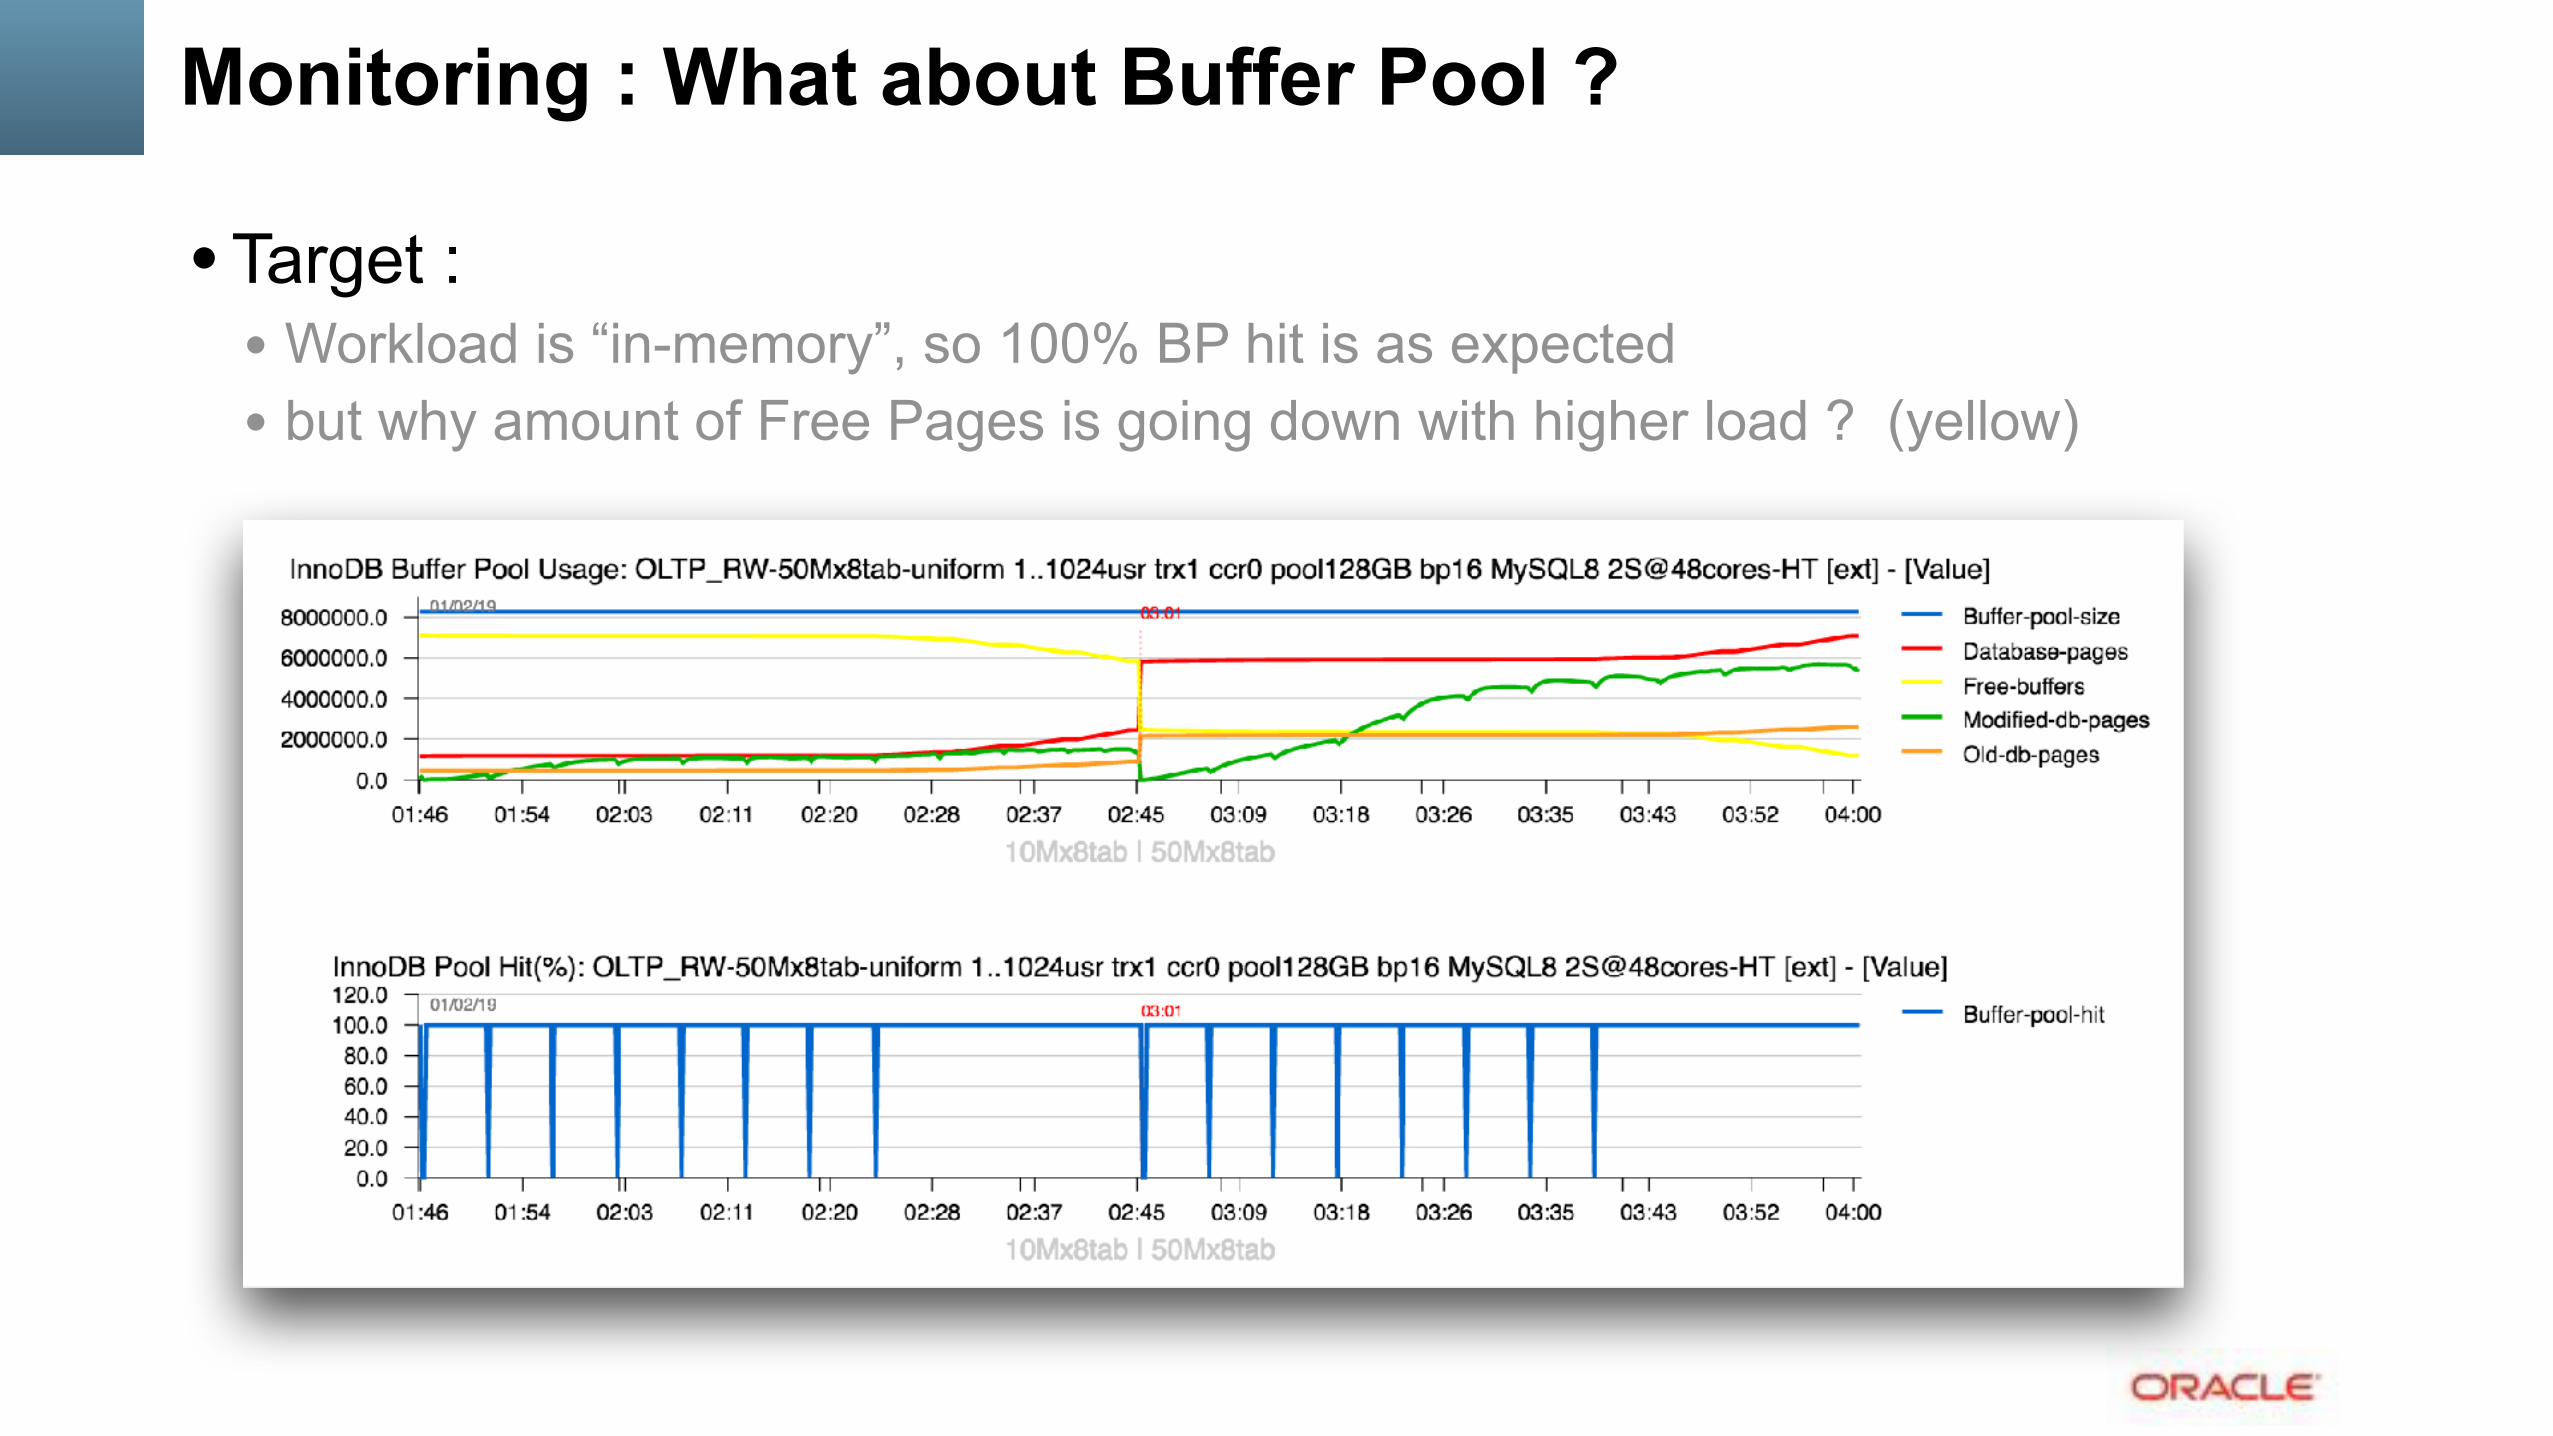
Monitoring : What about Buffer Pool ?
• Target : • Workload is “in-memory”, so 100% BP hit is as expected • but why amount of Free Pages is going down with higher load ? (yellow)

Monitoring : What is the Free Page Demand ?
• Target : • Free Page requests/sec • any waits / loops ? => no..
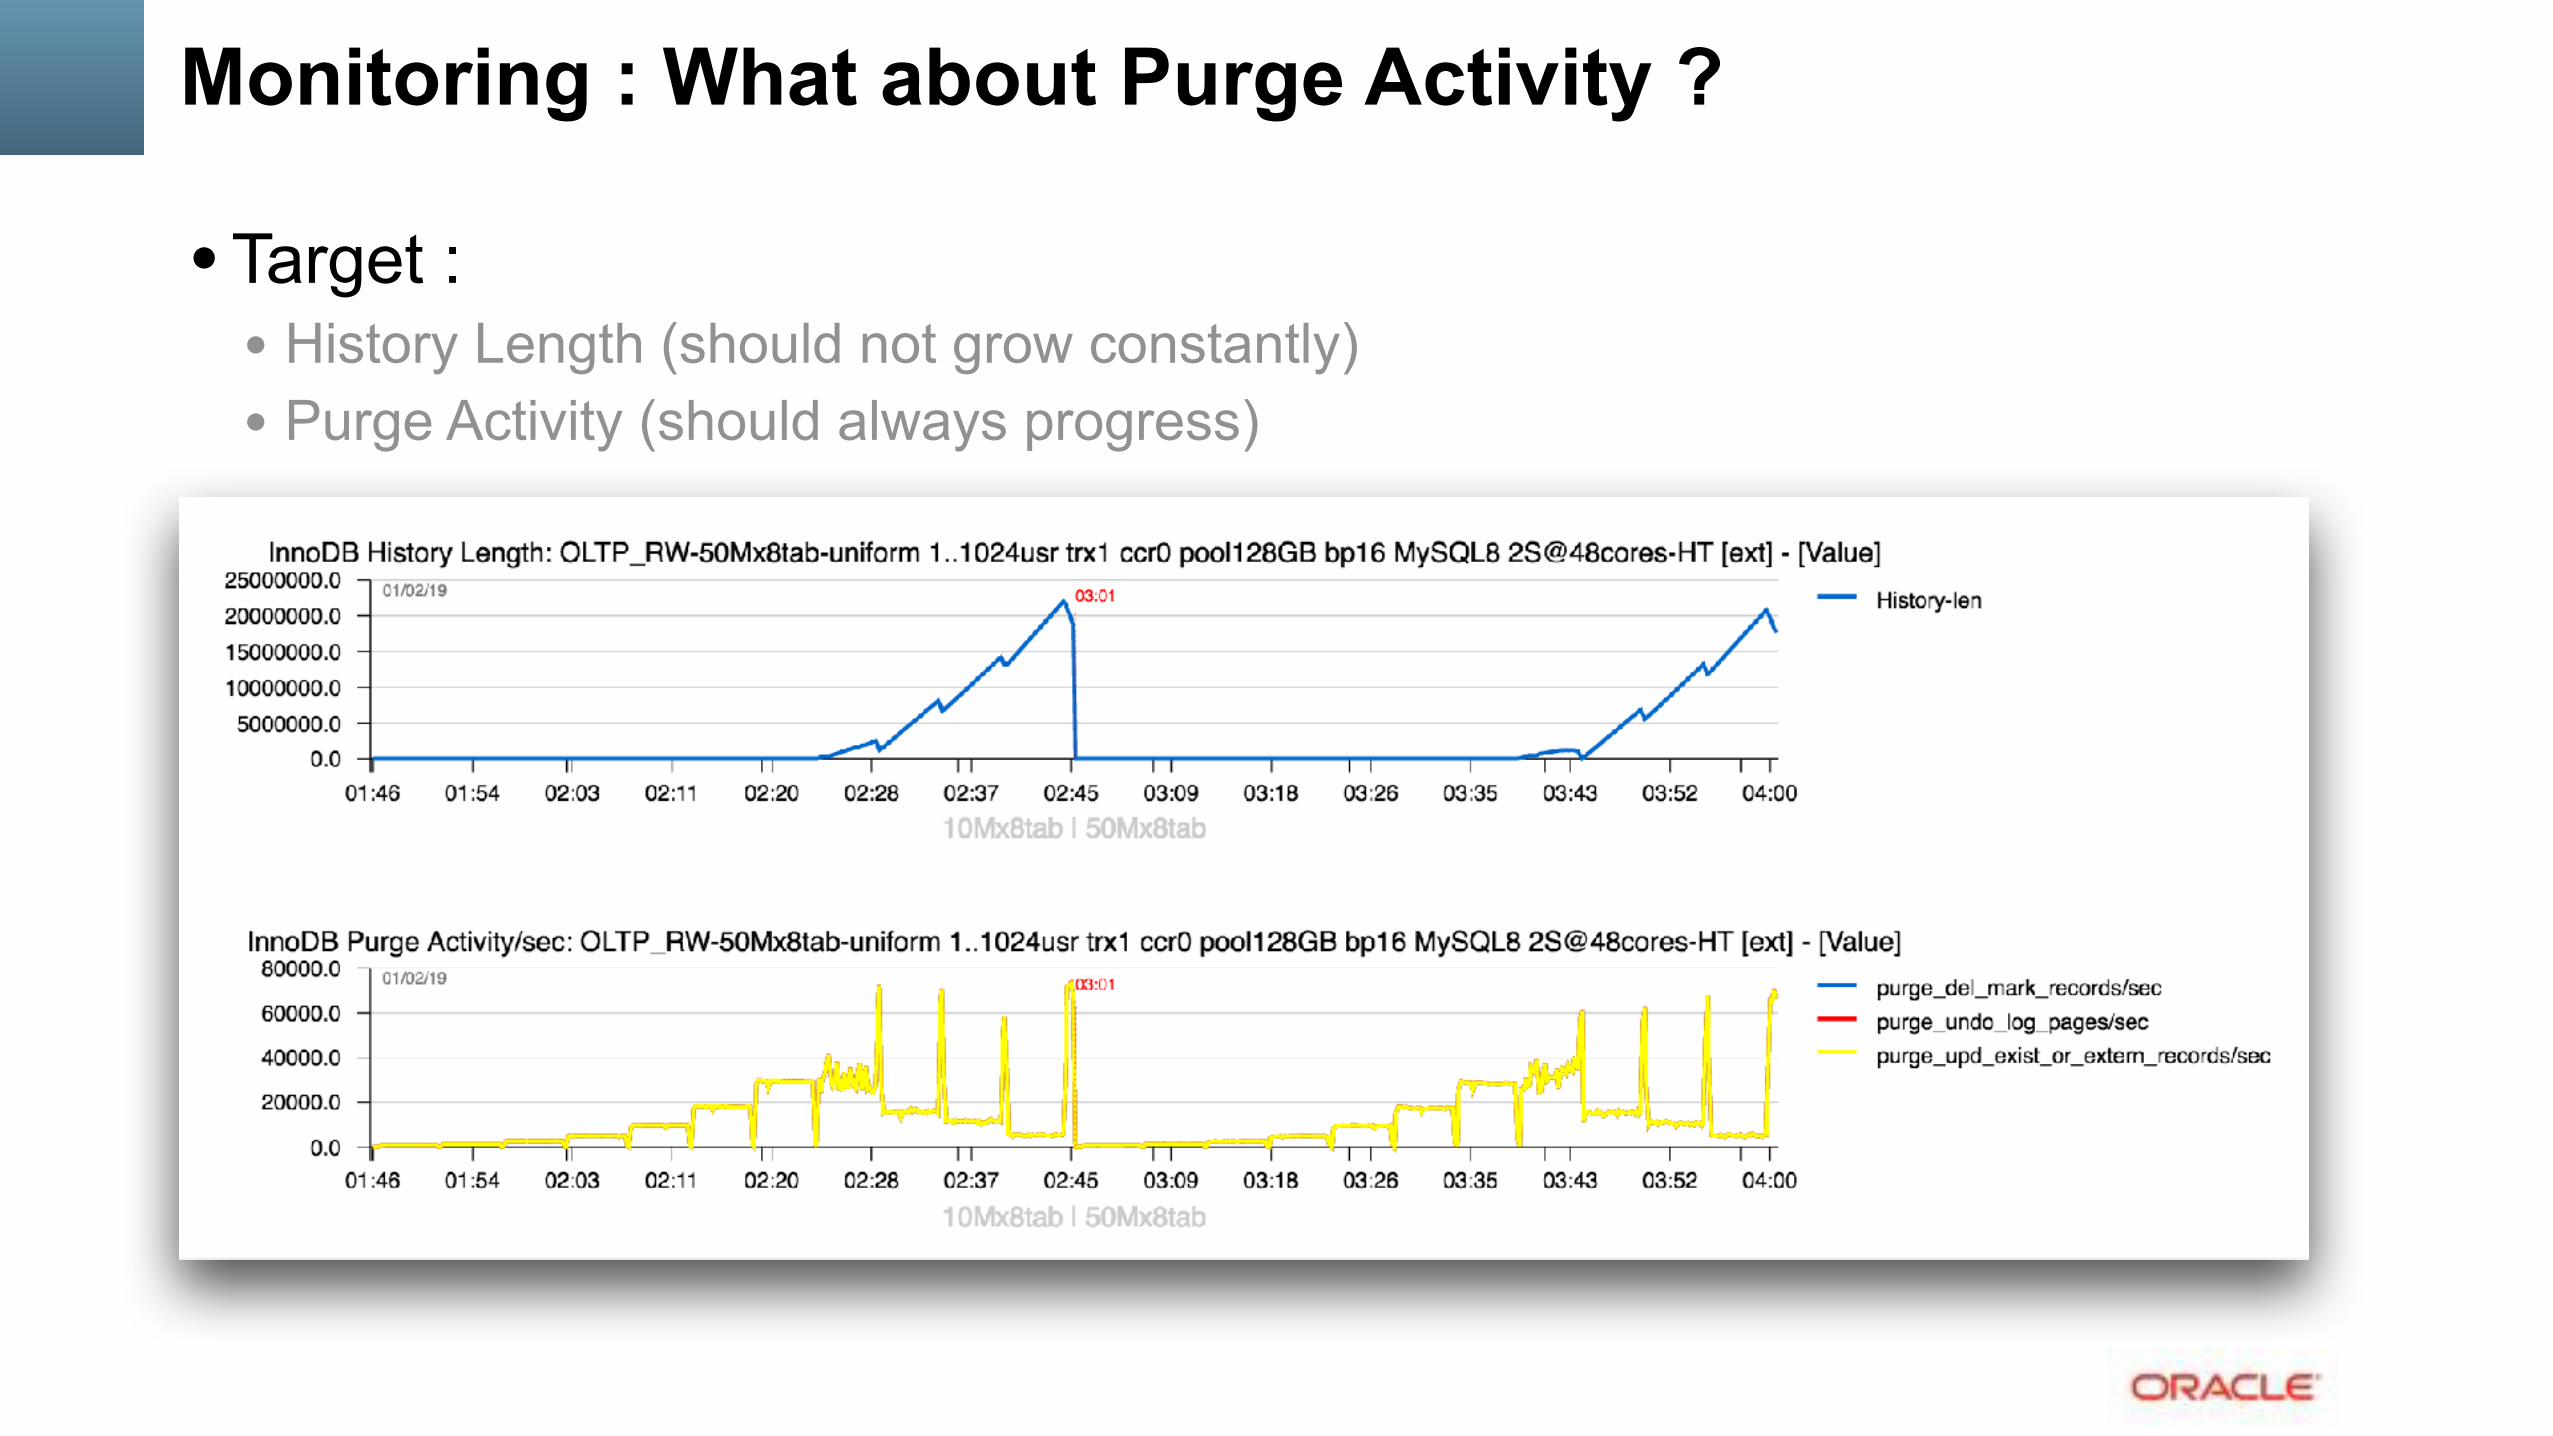
Monitoring : What about Purge Activity ?
• Target : • History Length (should not grow constantly) • Purge Activity (should always progress)
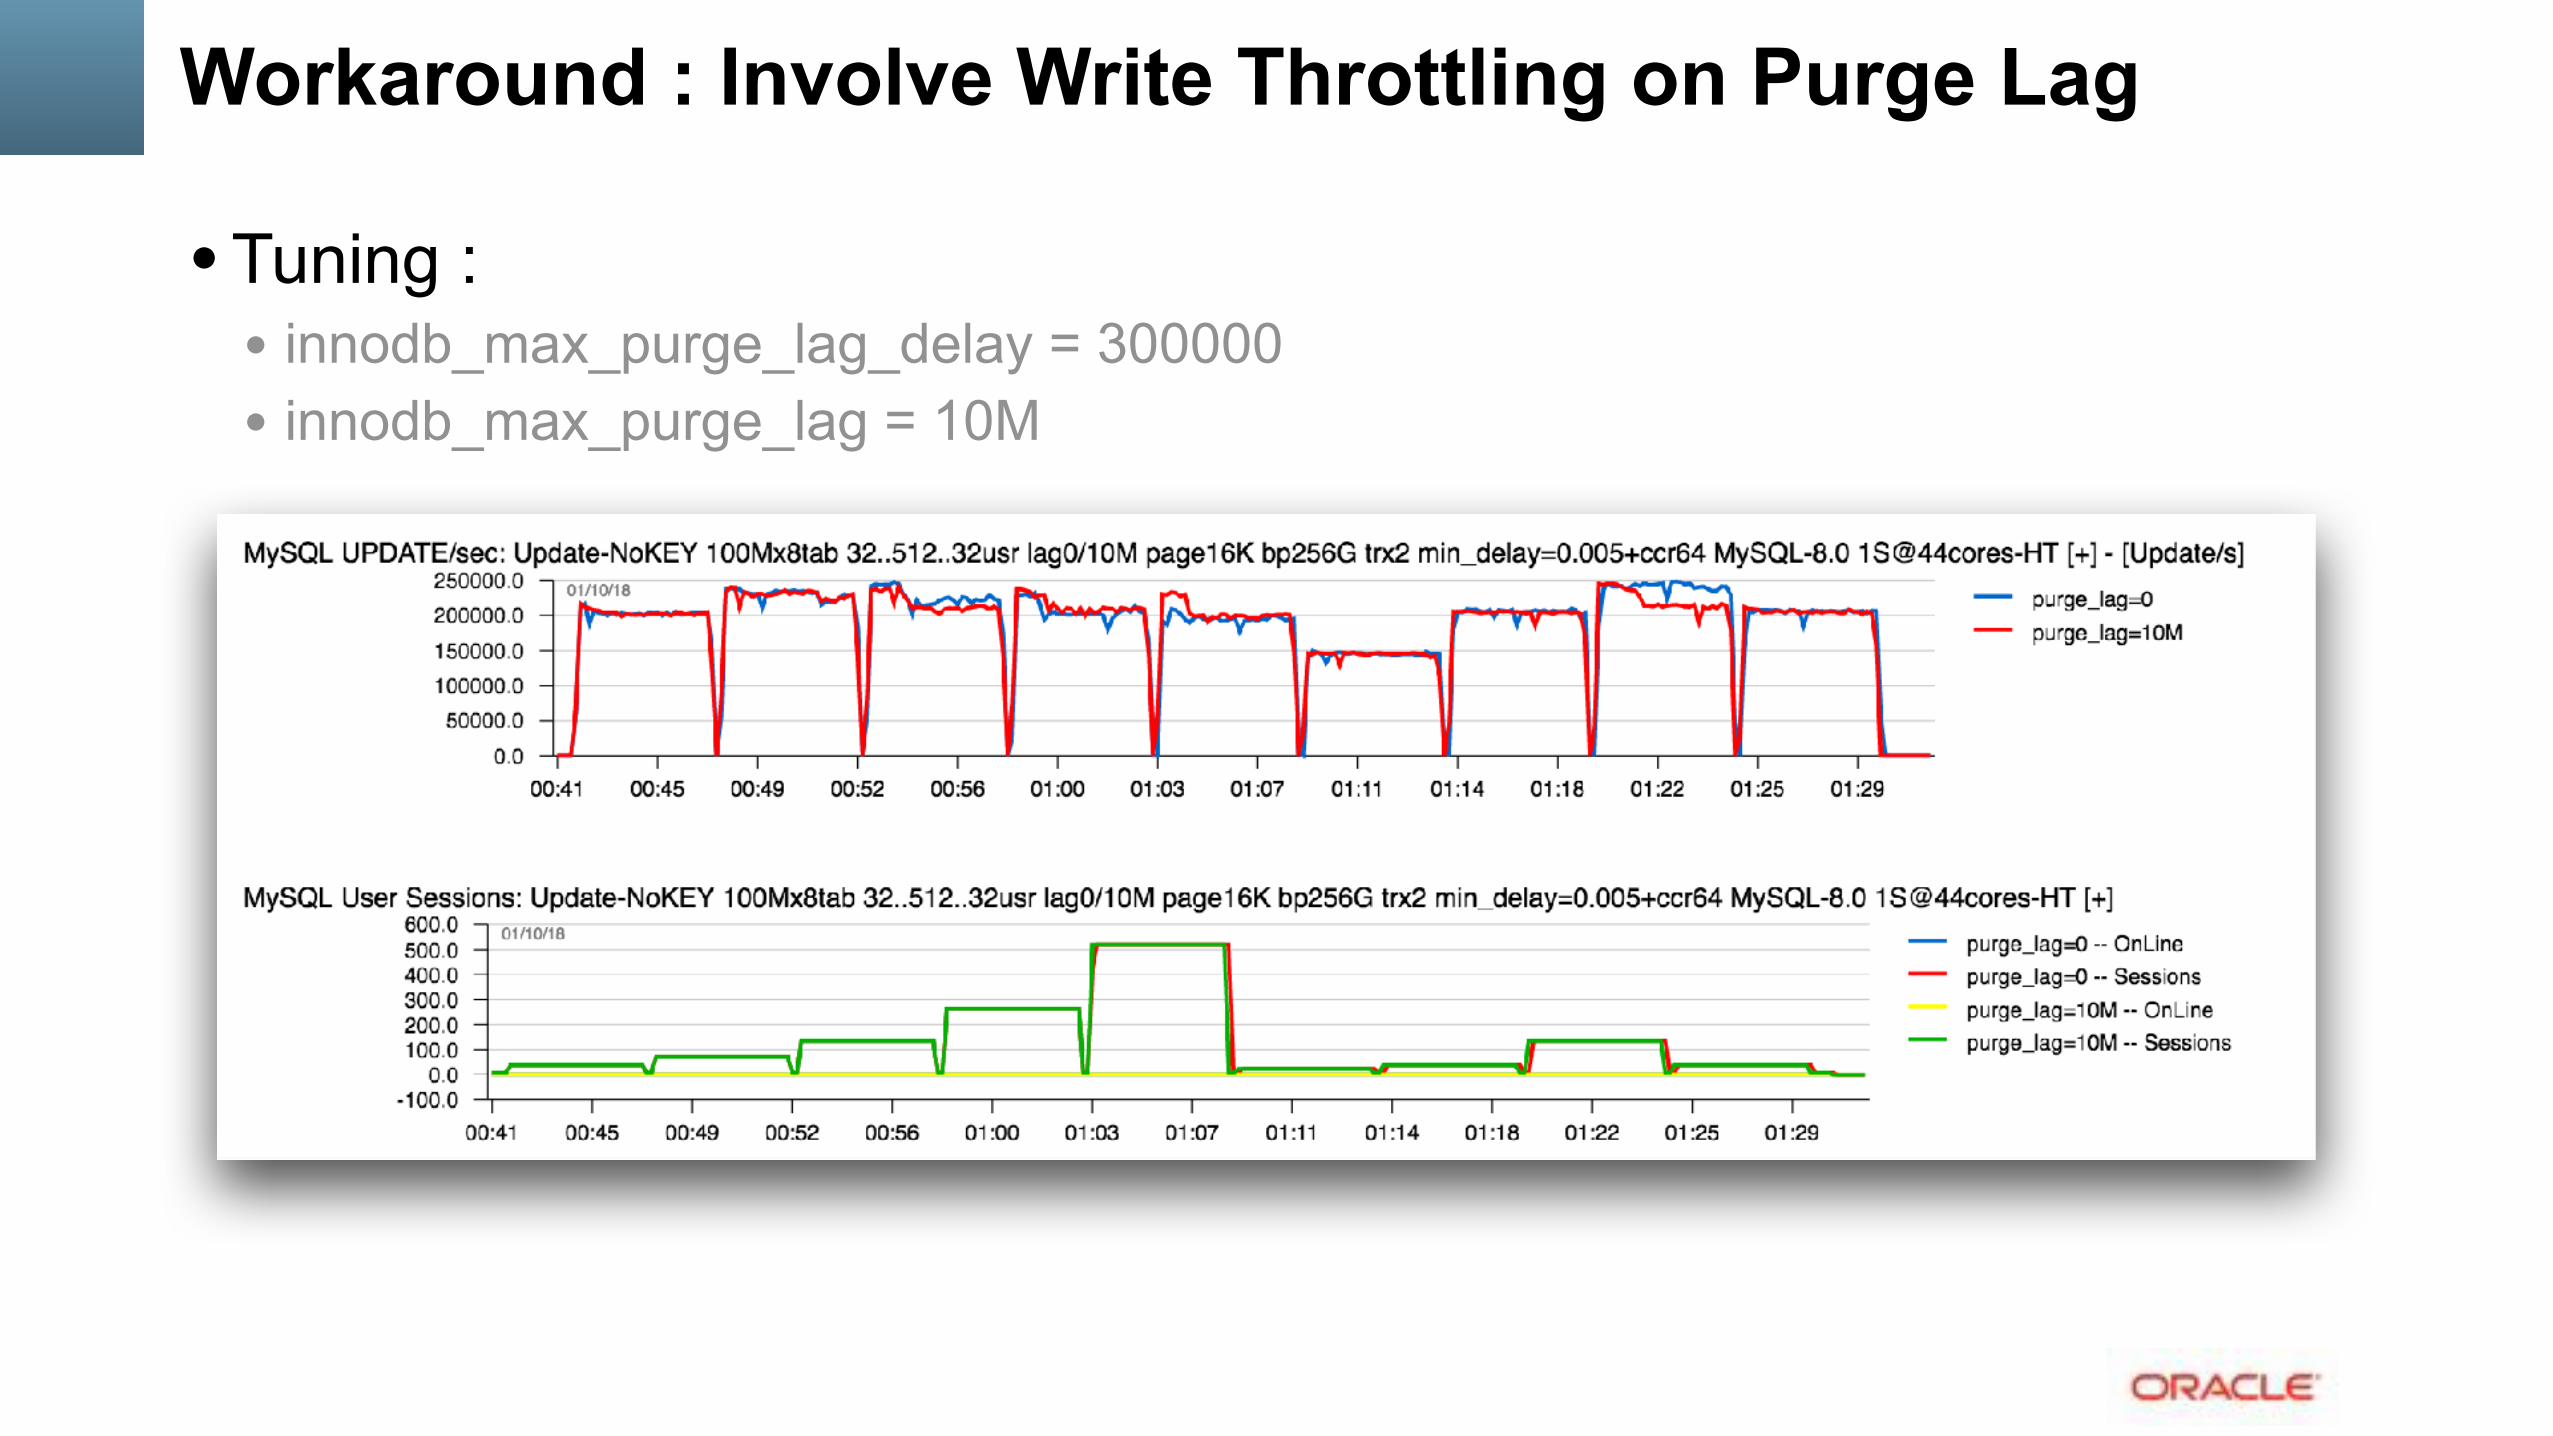
Workaround : Involve Write Throttling on Purge Lag
• Tuning : • innodb_max_purge_lag_delay = 300000 • innodb_max_purge_lag = 10M
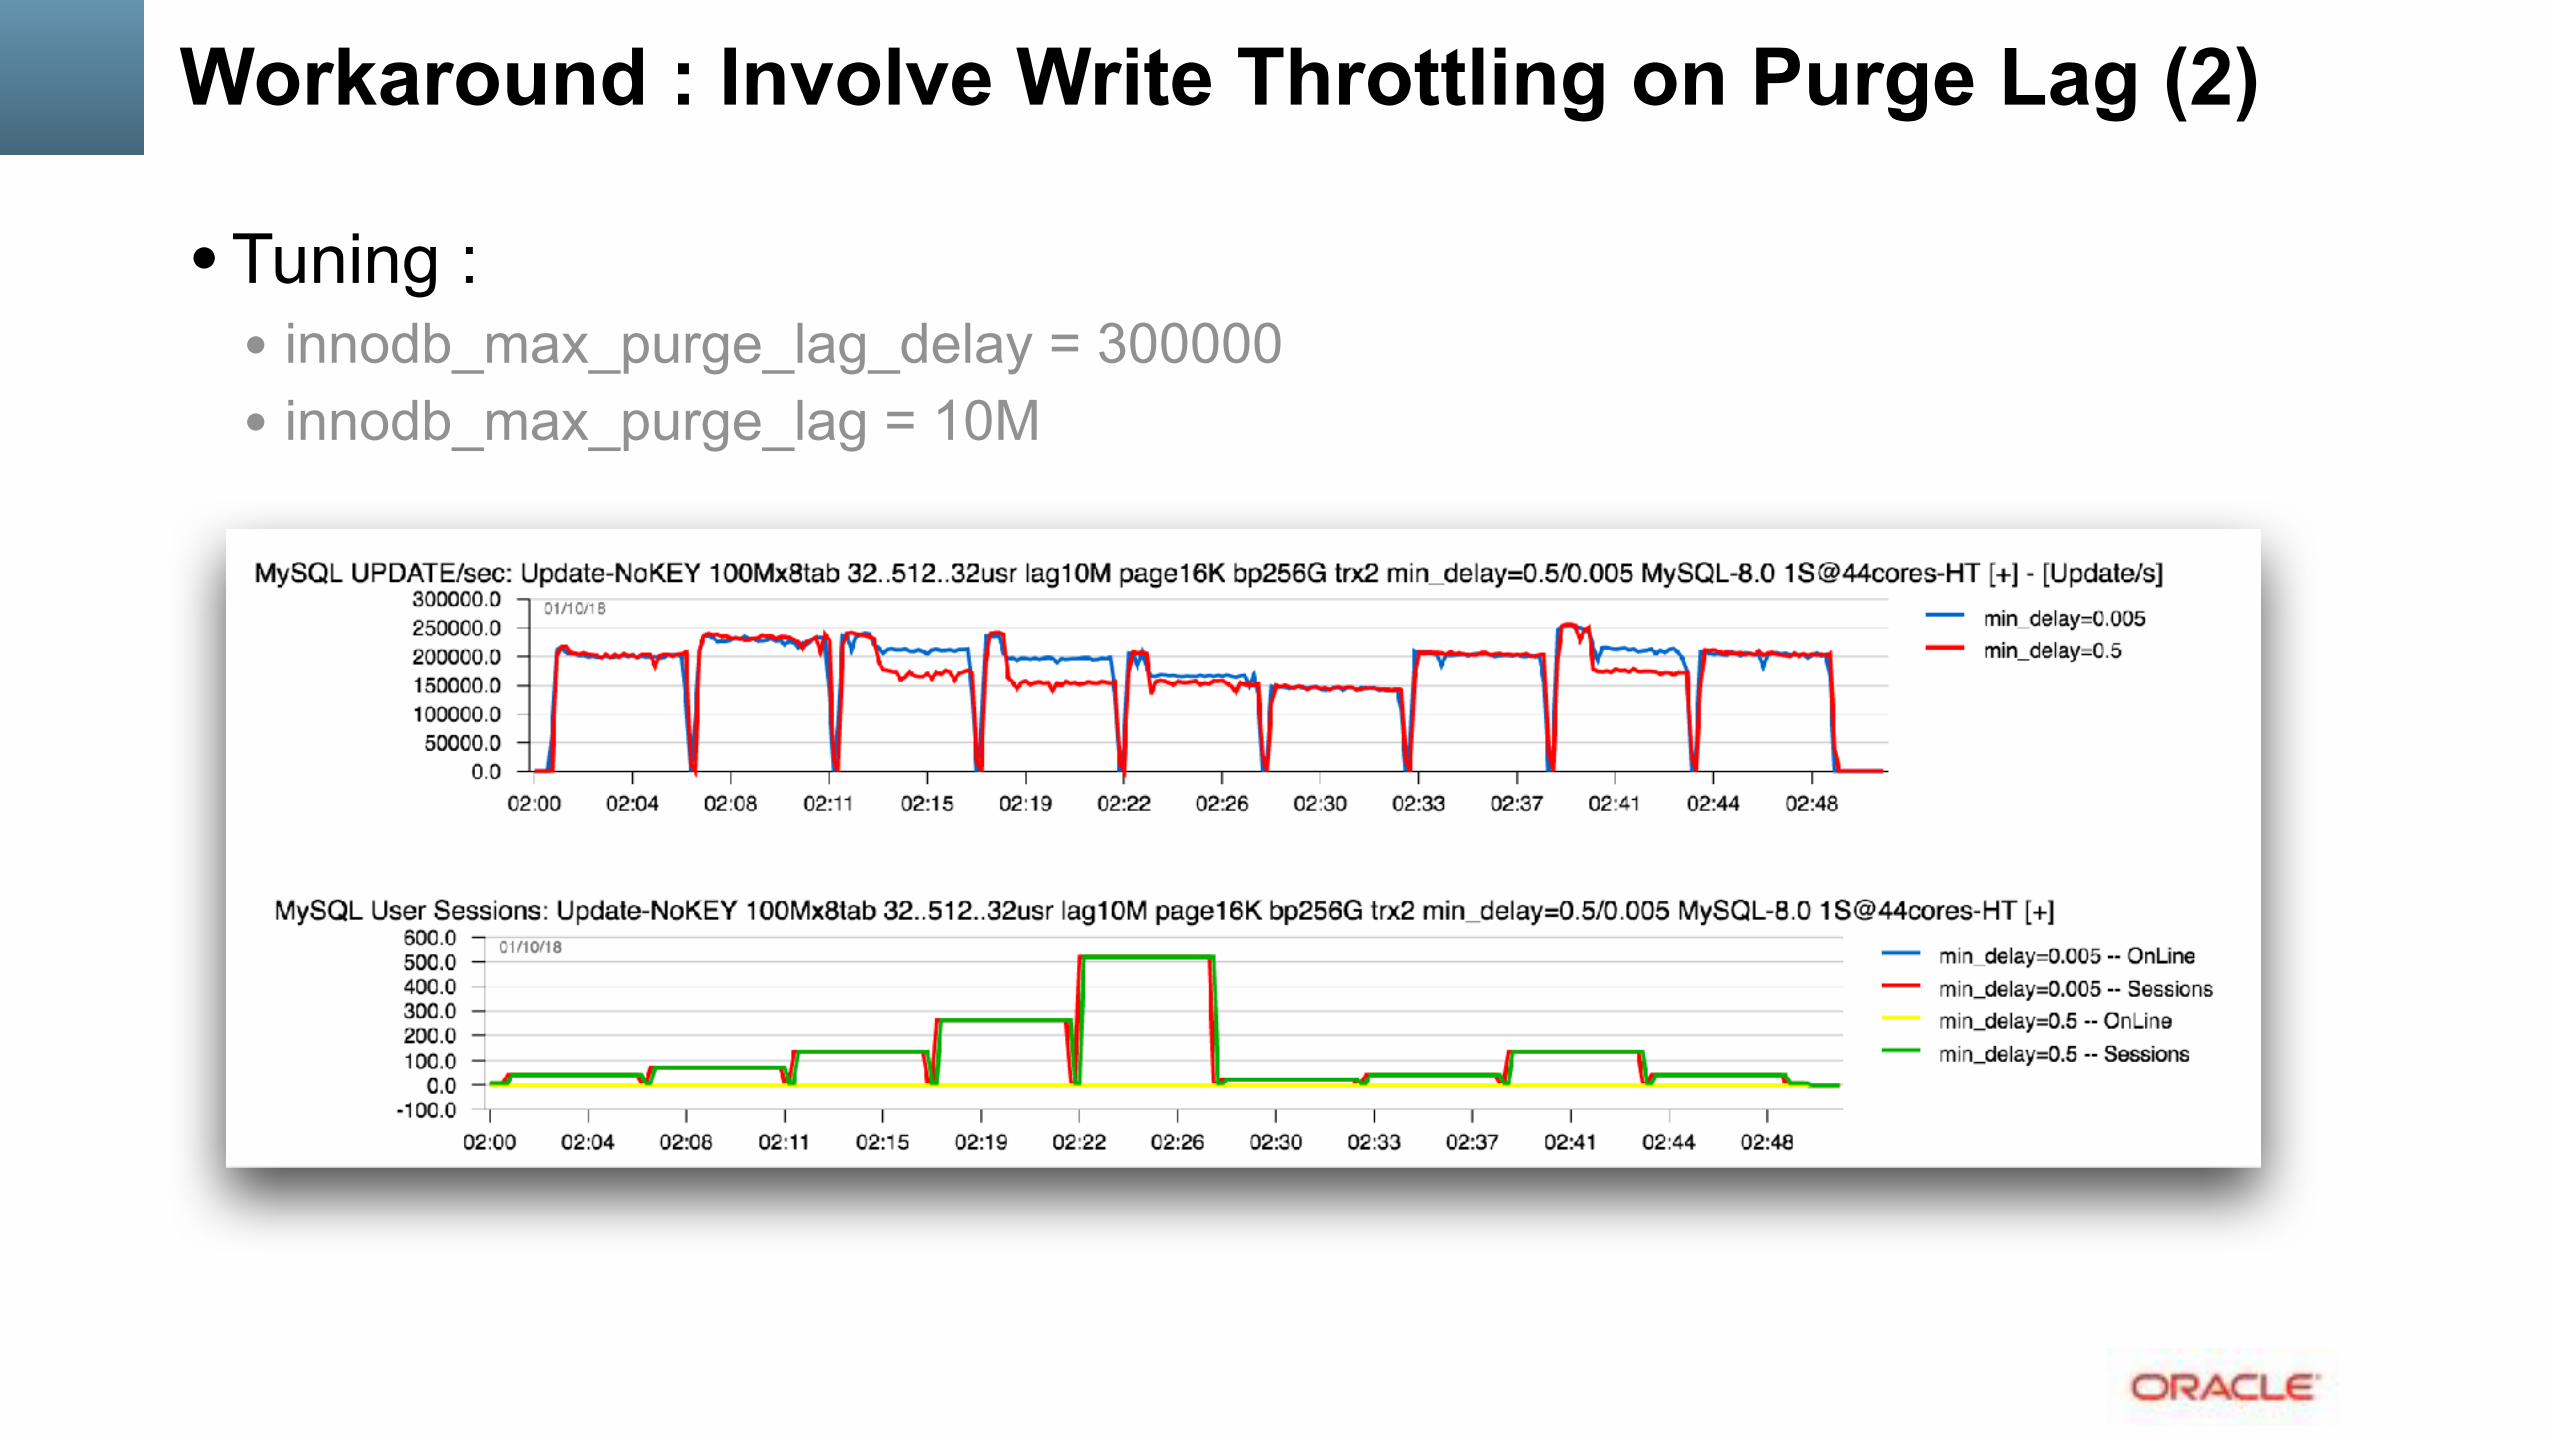
Workaround : Involve Write Throttling on Purge Lag (2)
• Tuning : • innodb_max_purge_lag_delay = 300000 • innodb_max_purge_lag = 10M
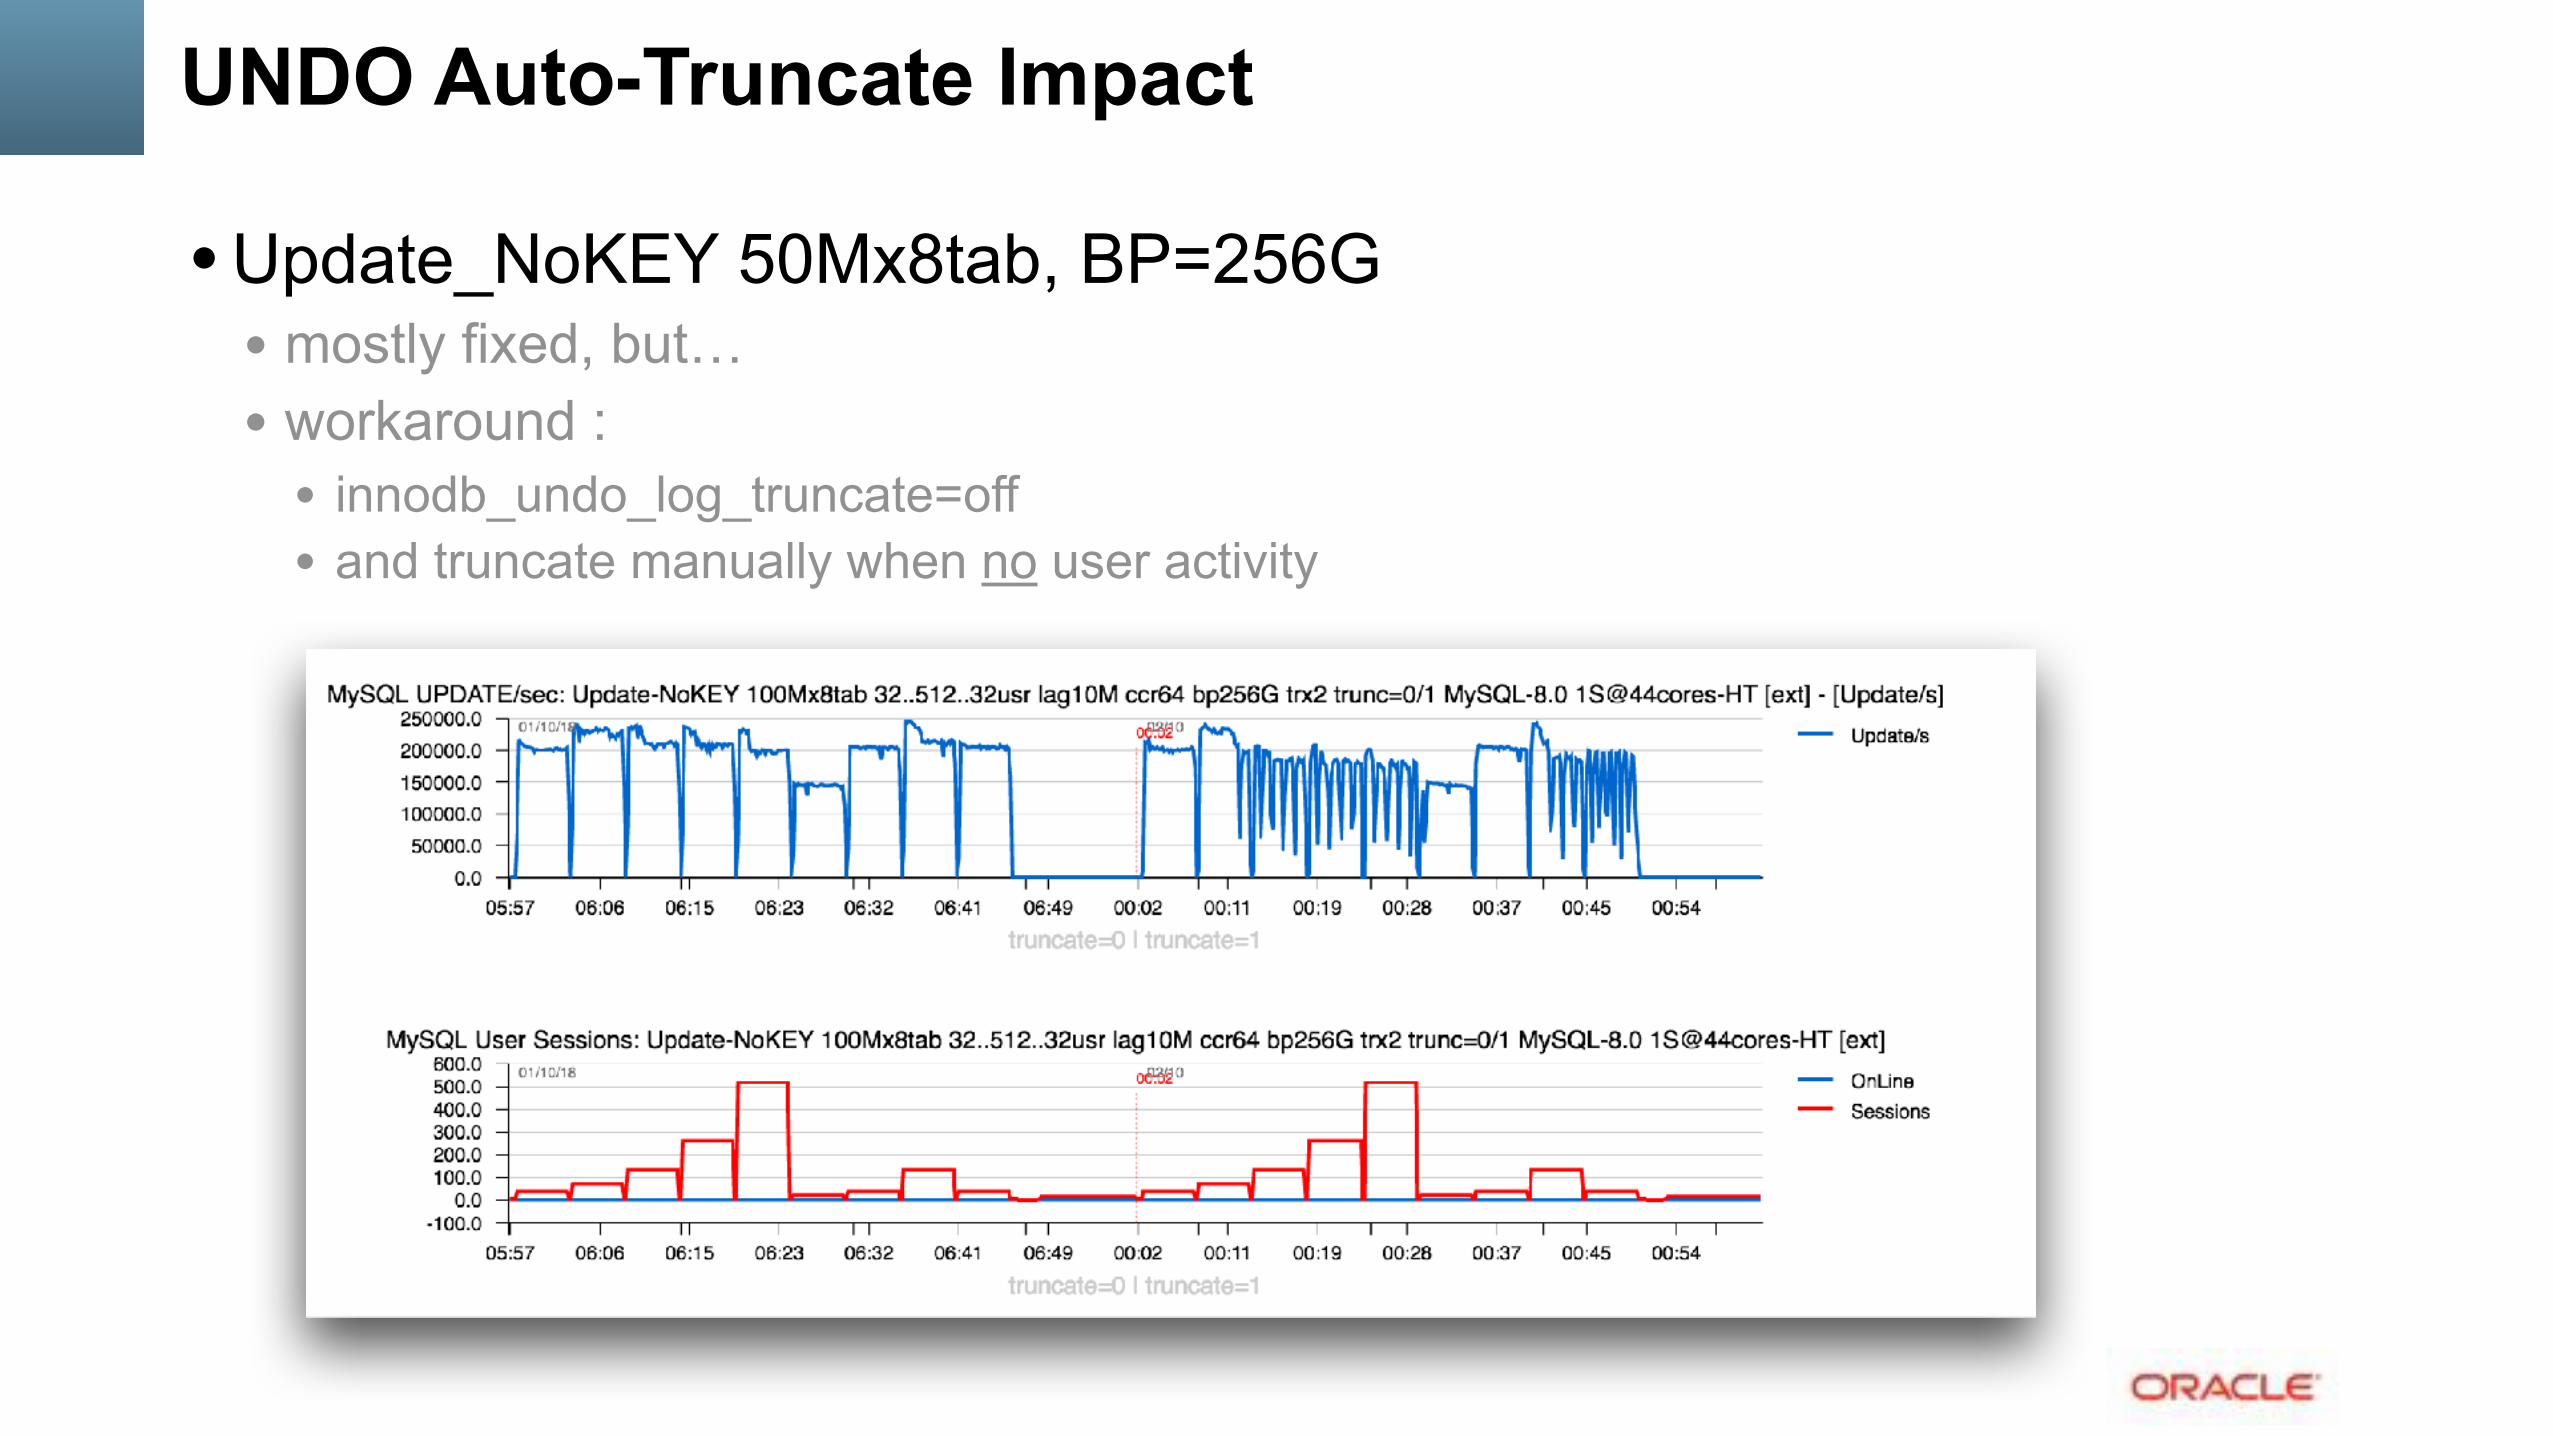
UNDO Auto-Truncate Impact
• Update_NoKEY 50Mx8tab, BP=256G • mostly fixed, but… • workaround :
• innodb_undo_log_truncate=off • and truncate manually when no user activity

• Old design -vs- New design (simplified) :
FS cache
FS cache
Log Buffer
MySQL 8.0 : Re-Designed REDO
REDO REDO
Log Buffer
Log Writer
Log Flusher
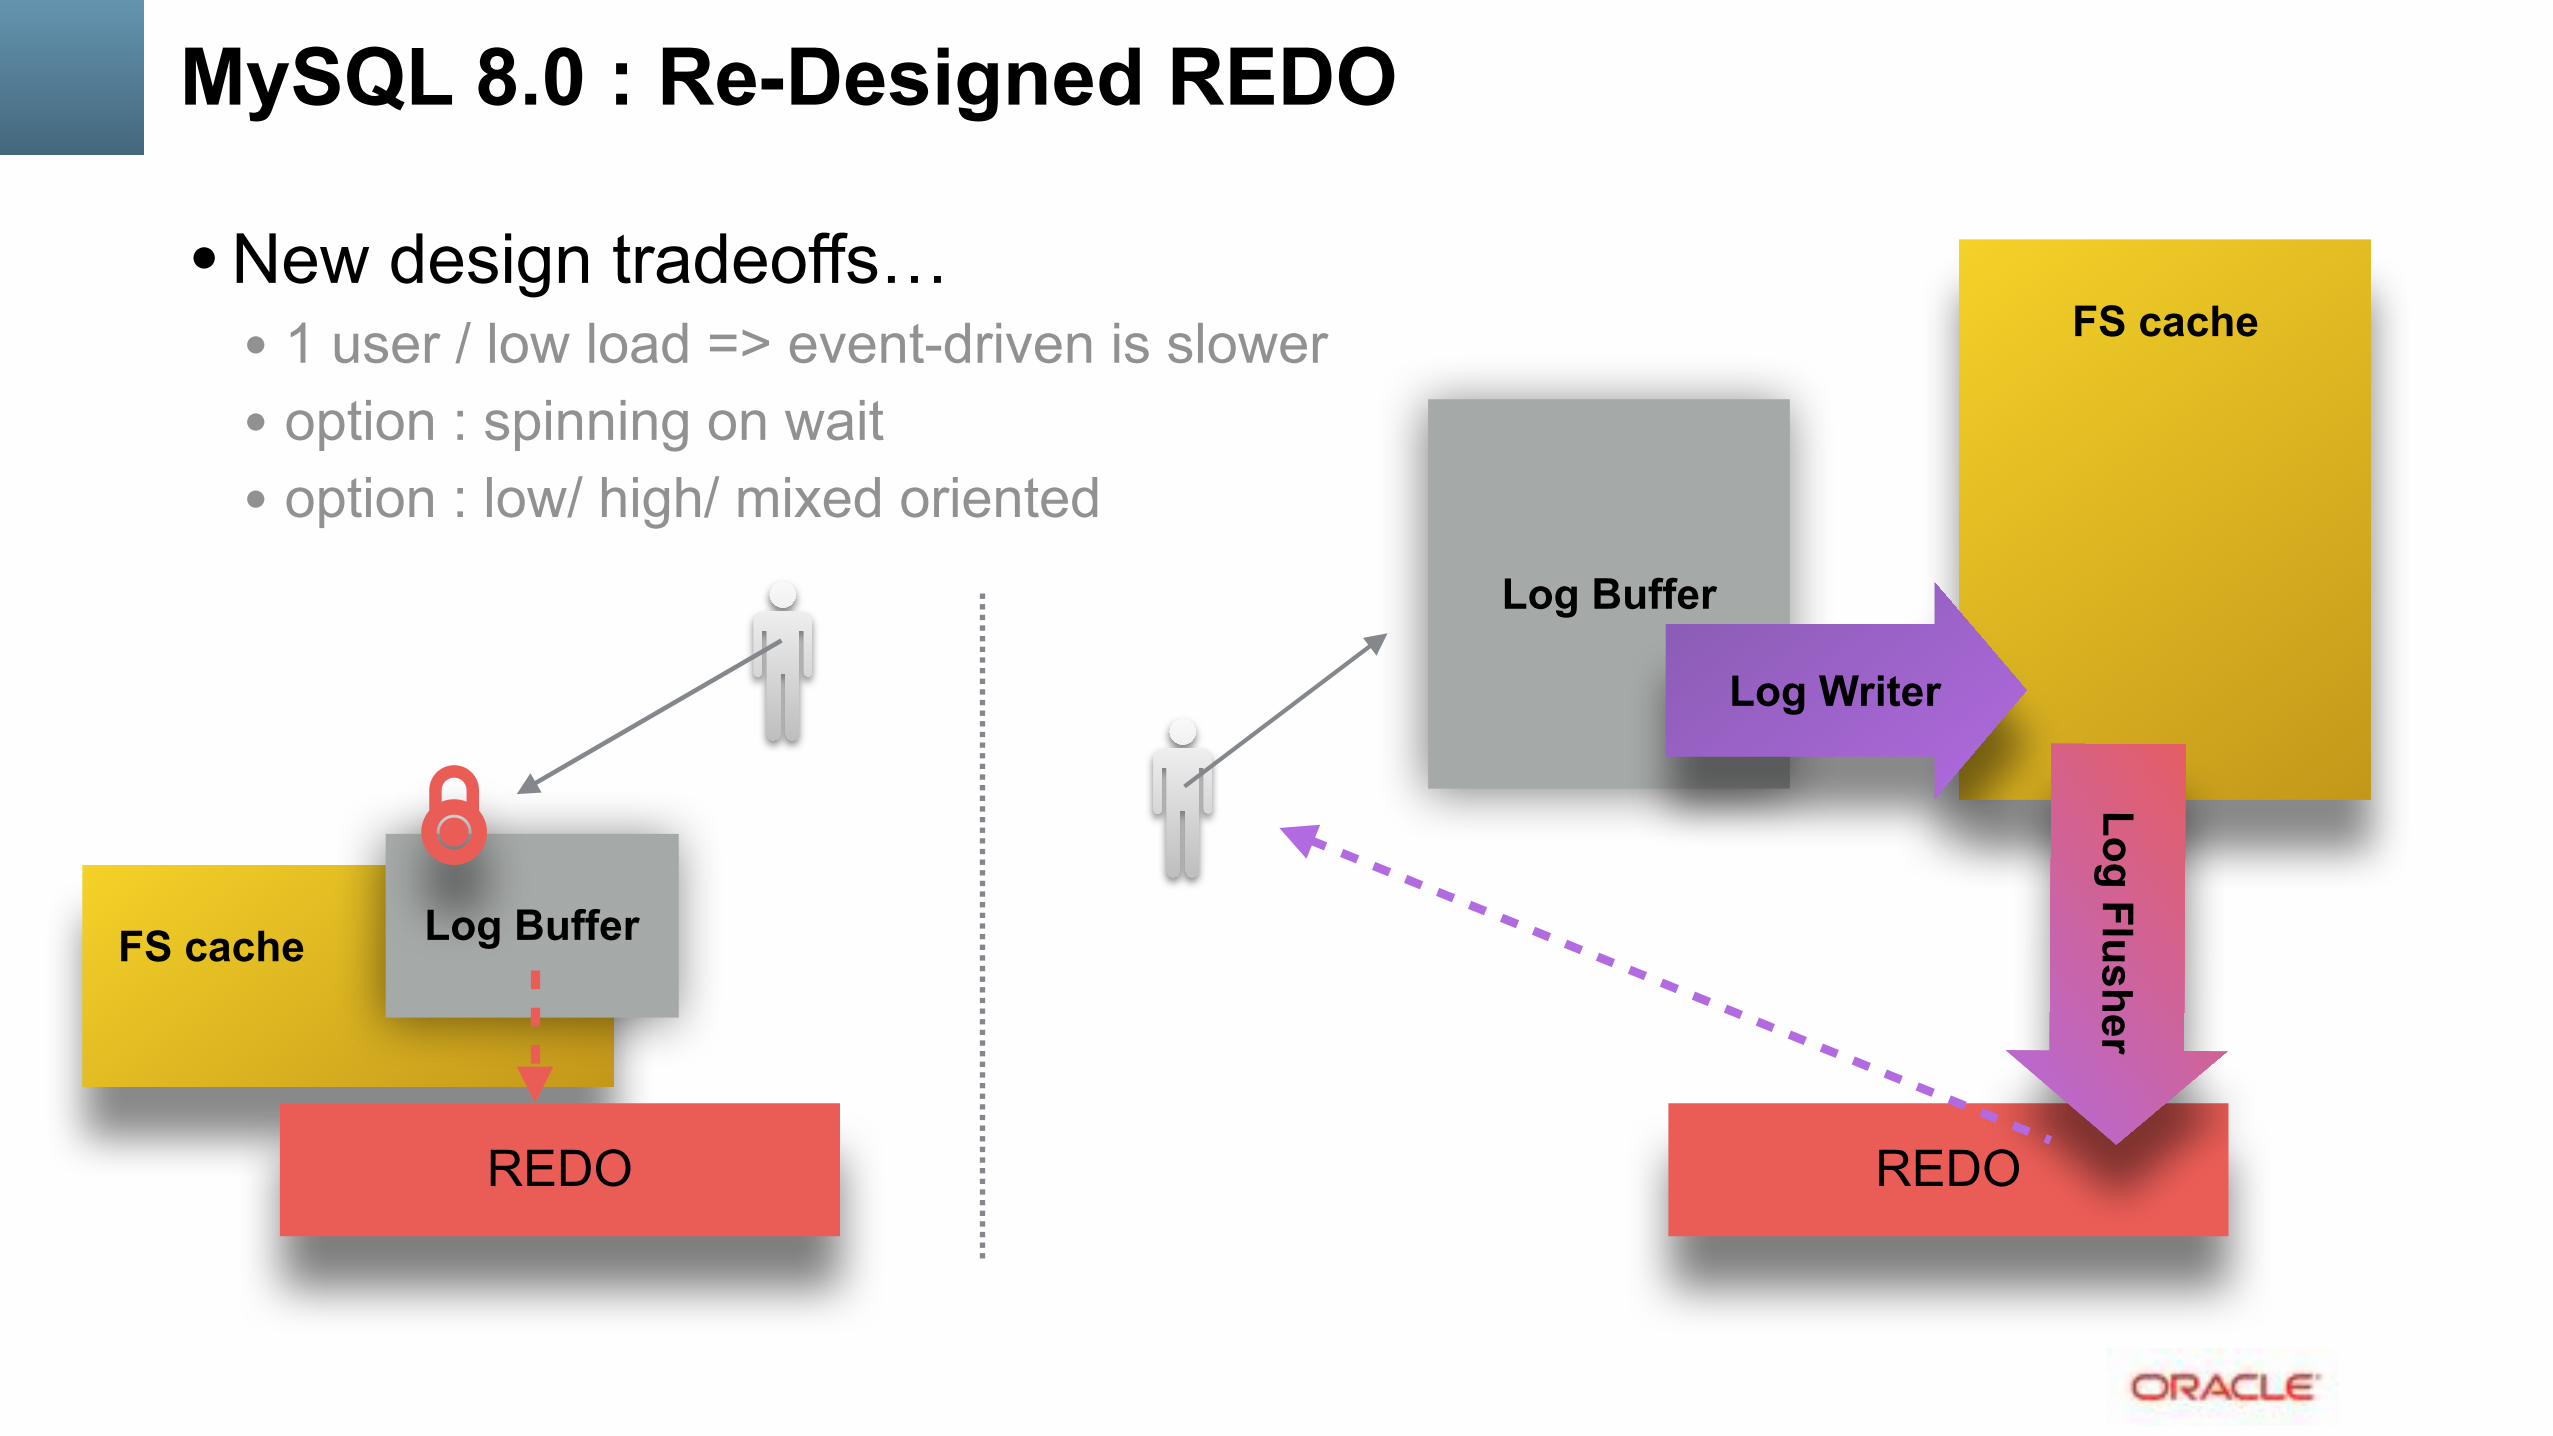
• New design tradeoffs… • 1 user / low load => event-driven is slower • option : spinning on wait • option : low/ high/ mixed oriented
FS cache
FS cache
Log Buffer
MySQL 8.0 : Re-Designed REDO
REDO REDO
Log Buffer
Log Writer
Log Flusher

MySQL 8.0 : Re-Designed REDO
• New design tradeoffs… • innodb_log_wait_for_flush_spin_hwm : fsync max usec time (def: 400) • innodb_log_spin_cpu_pct_hwm : max CPU% usage (def: 50)
MySQL 8.0 : adaptive spinning - CPU usage hwm - flush time hwm

Monitoring : REDO stats
• Target : • CPU% • REDO flush time Avg / Max
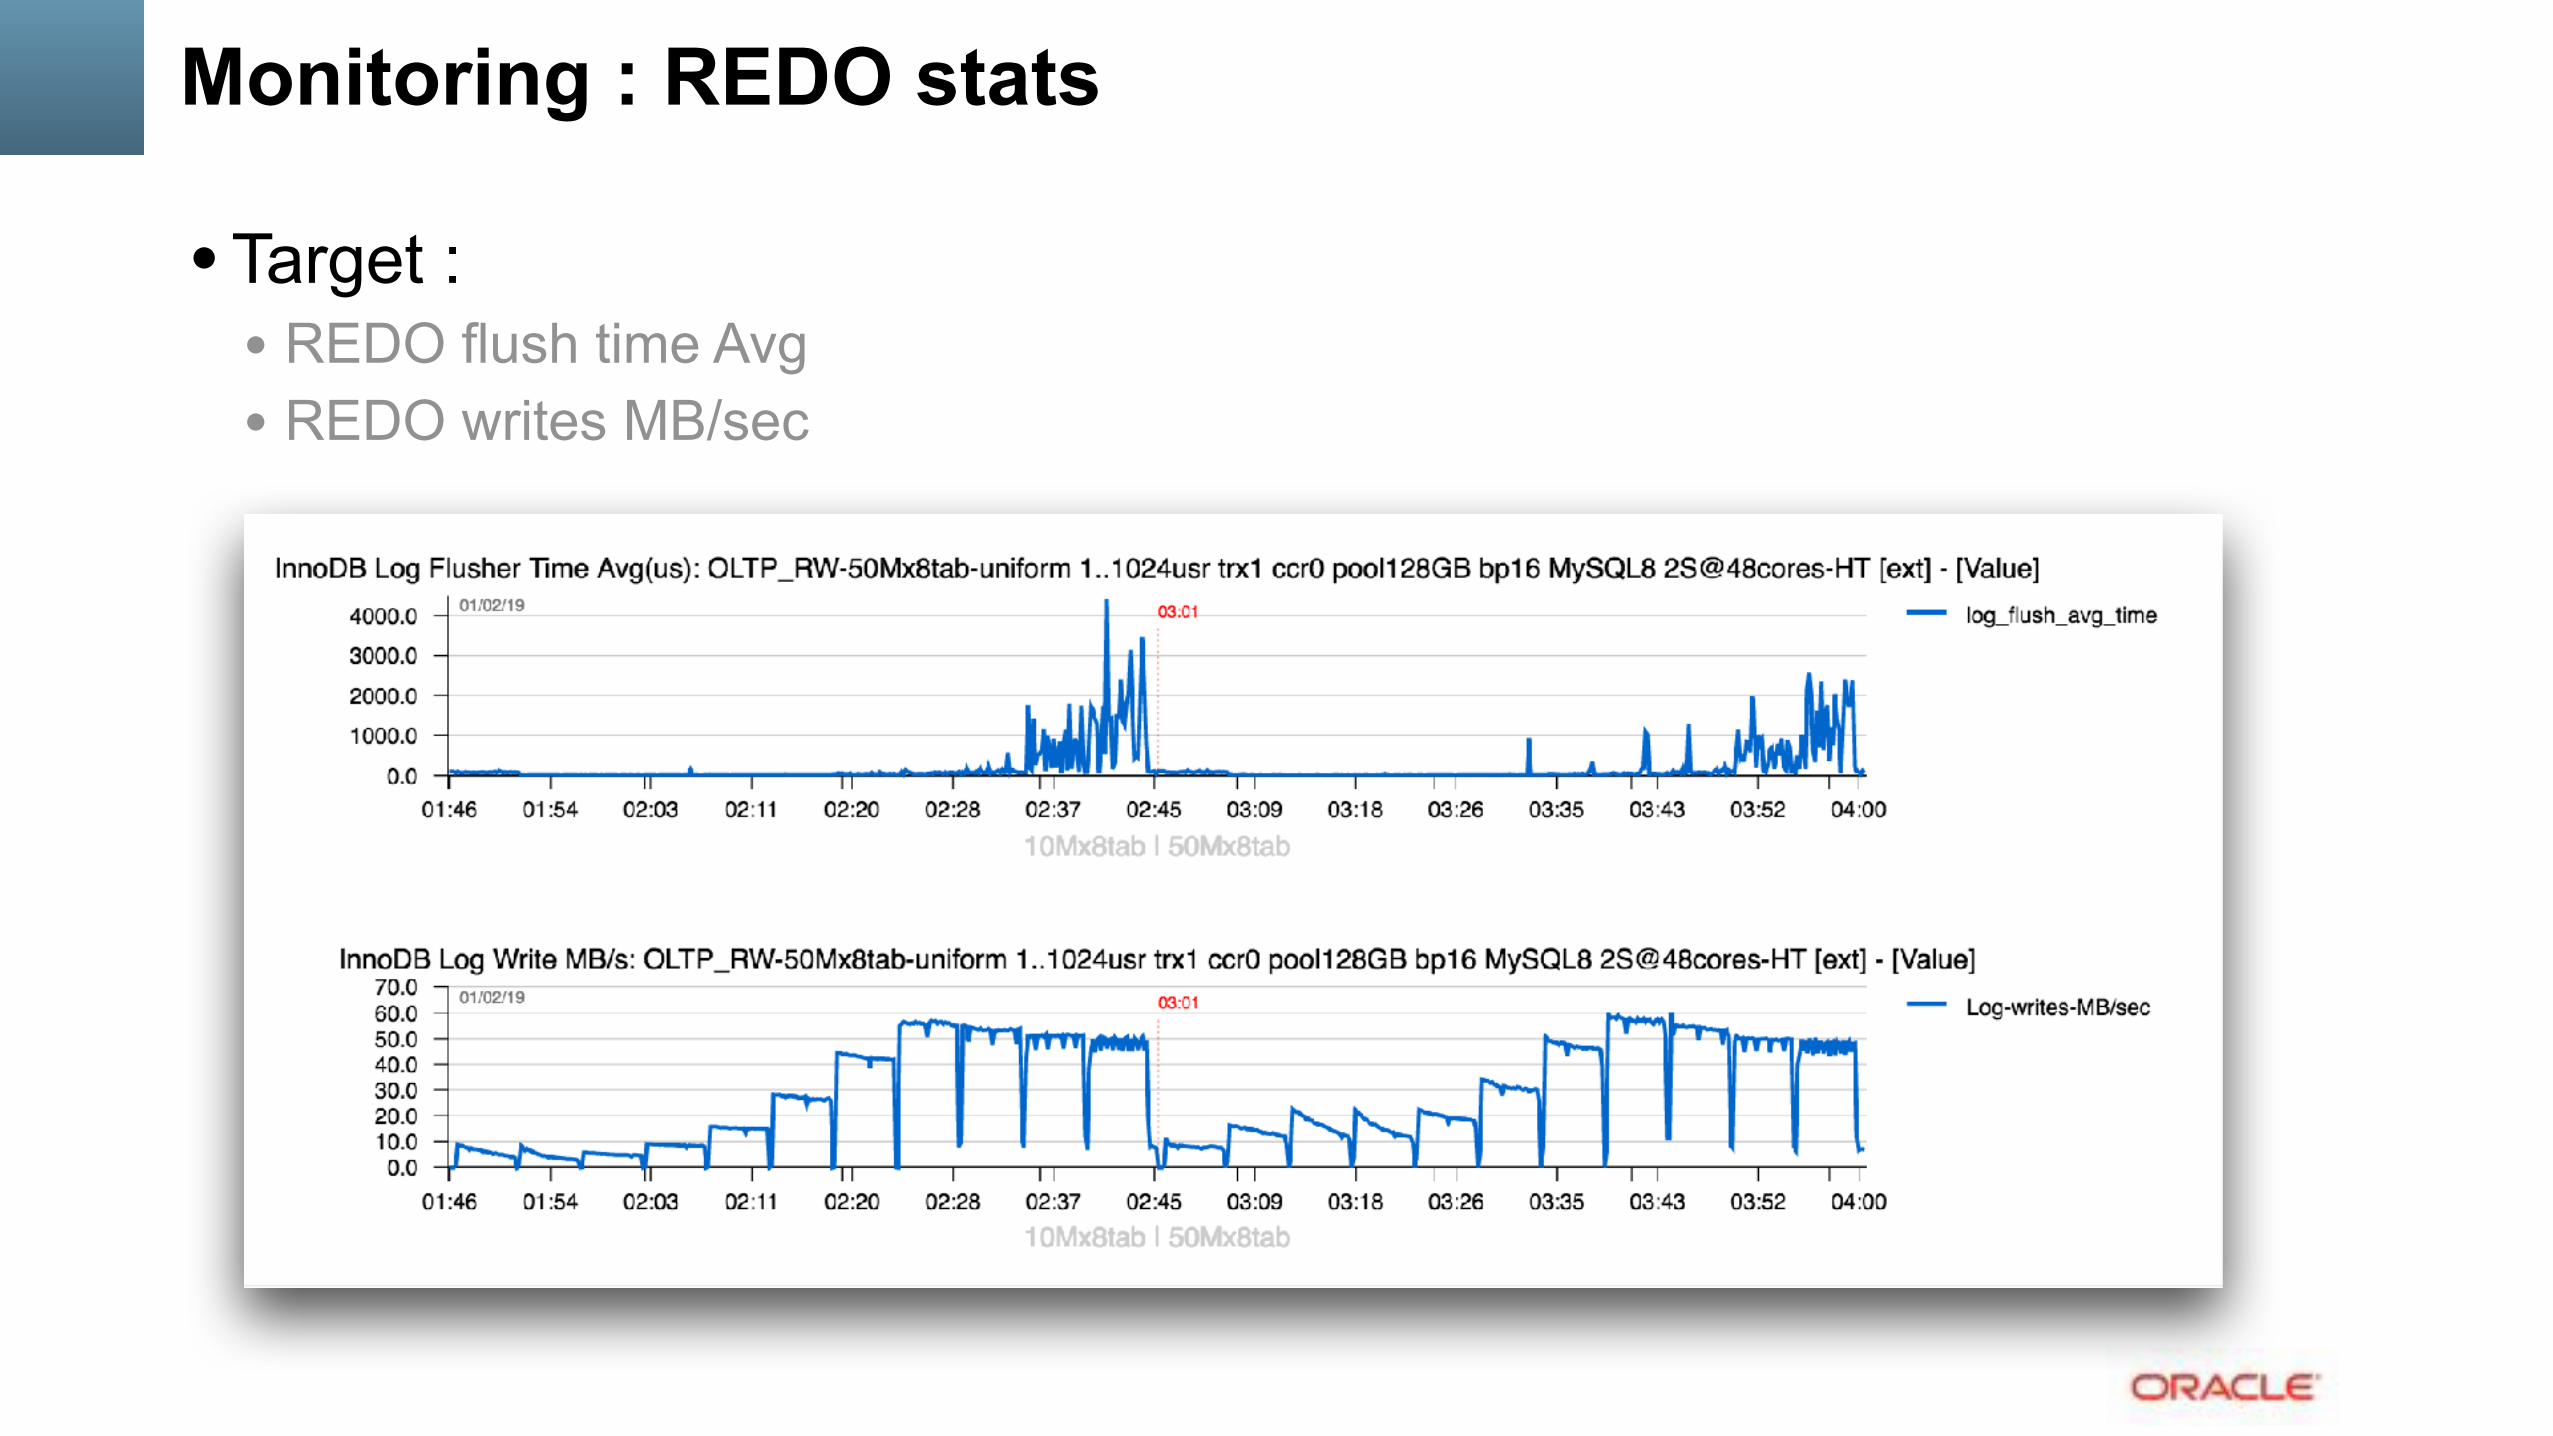
Monitoring : REDO stats
• Target : • REDO flush time Avg • REDO writes MB/sec
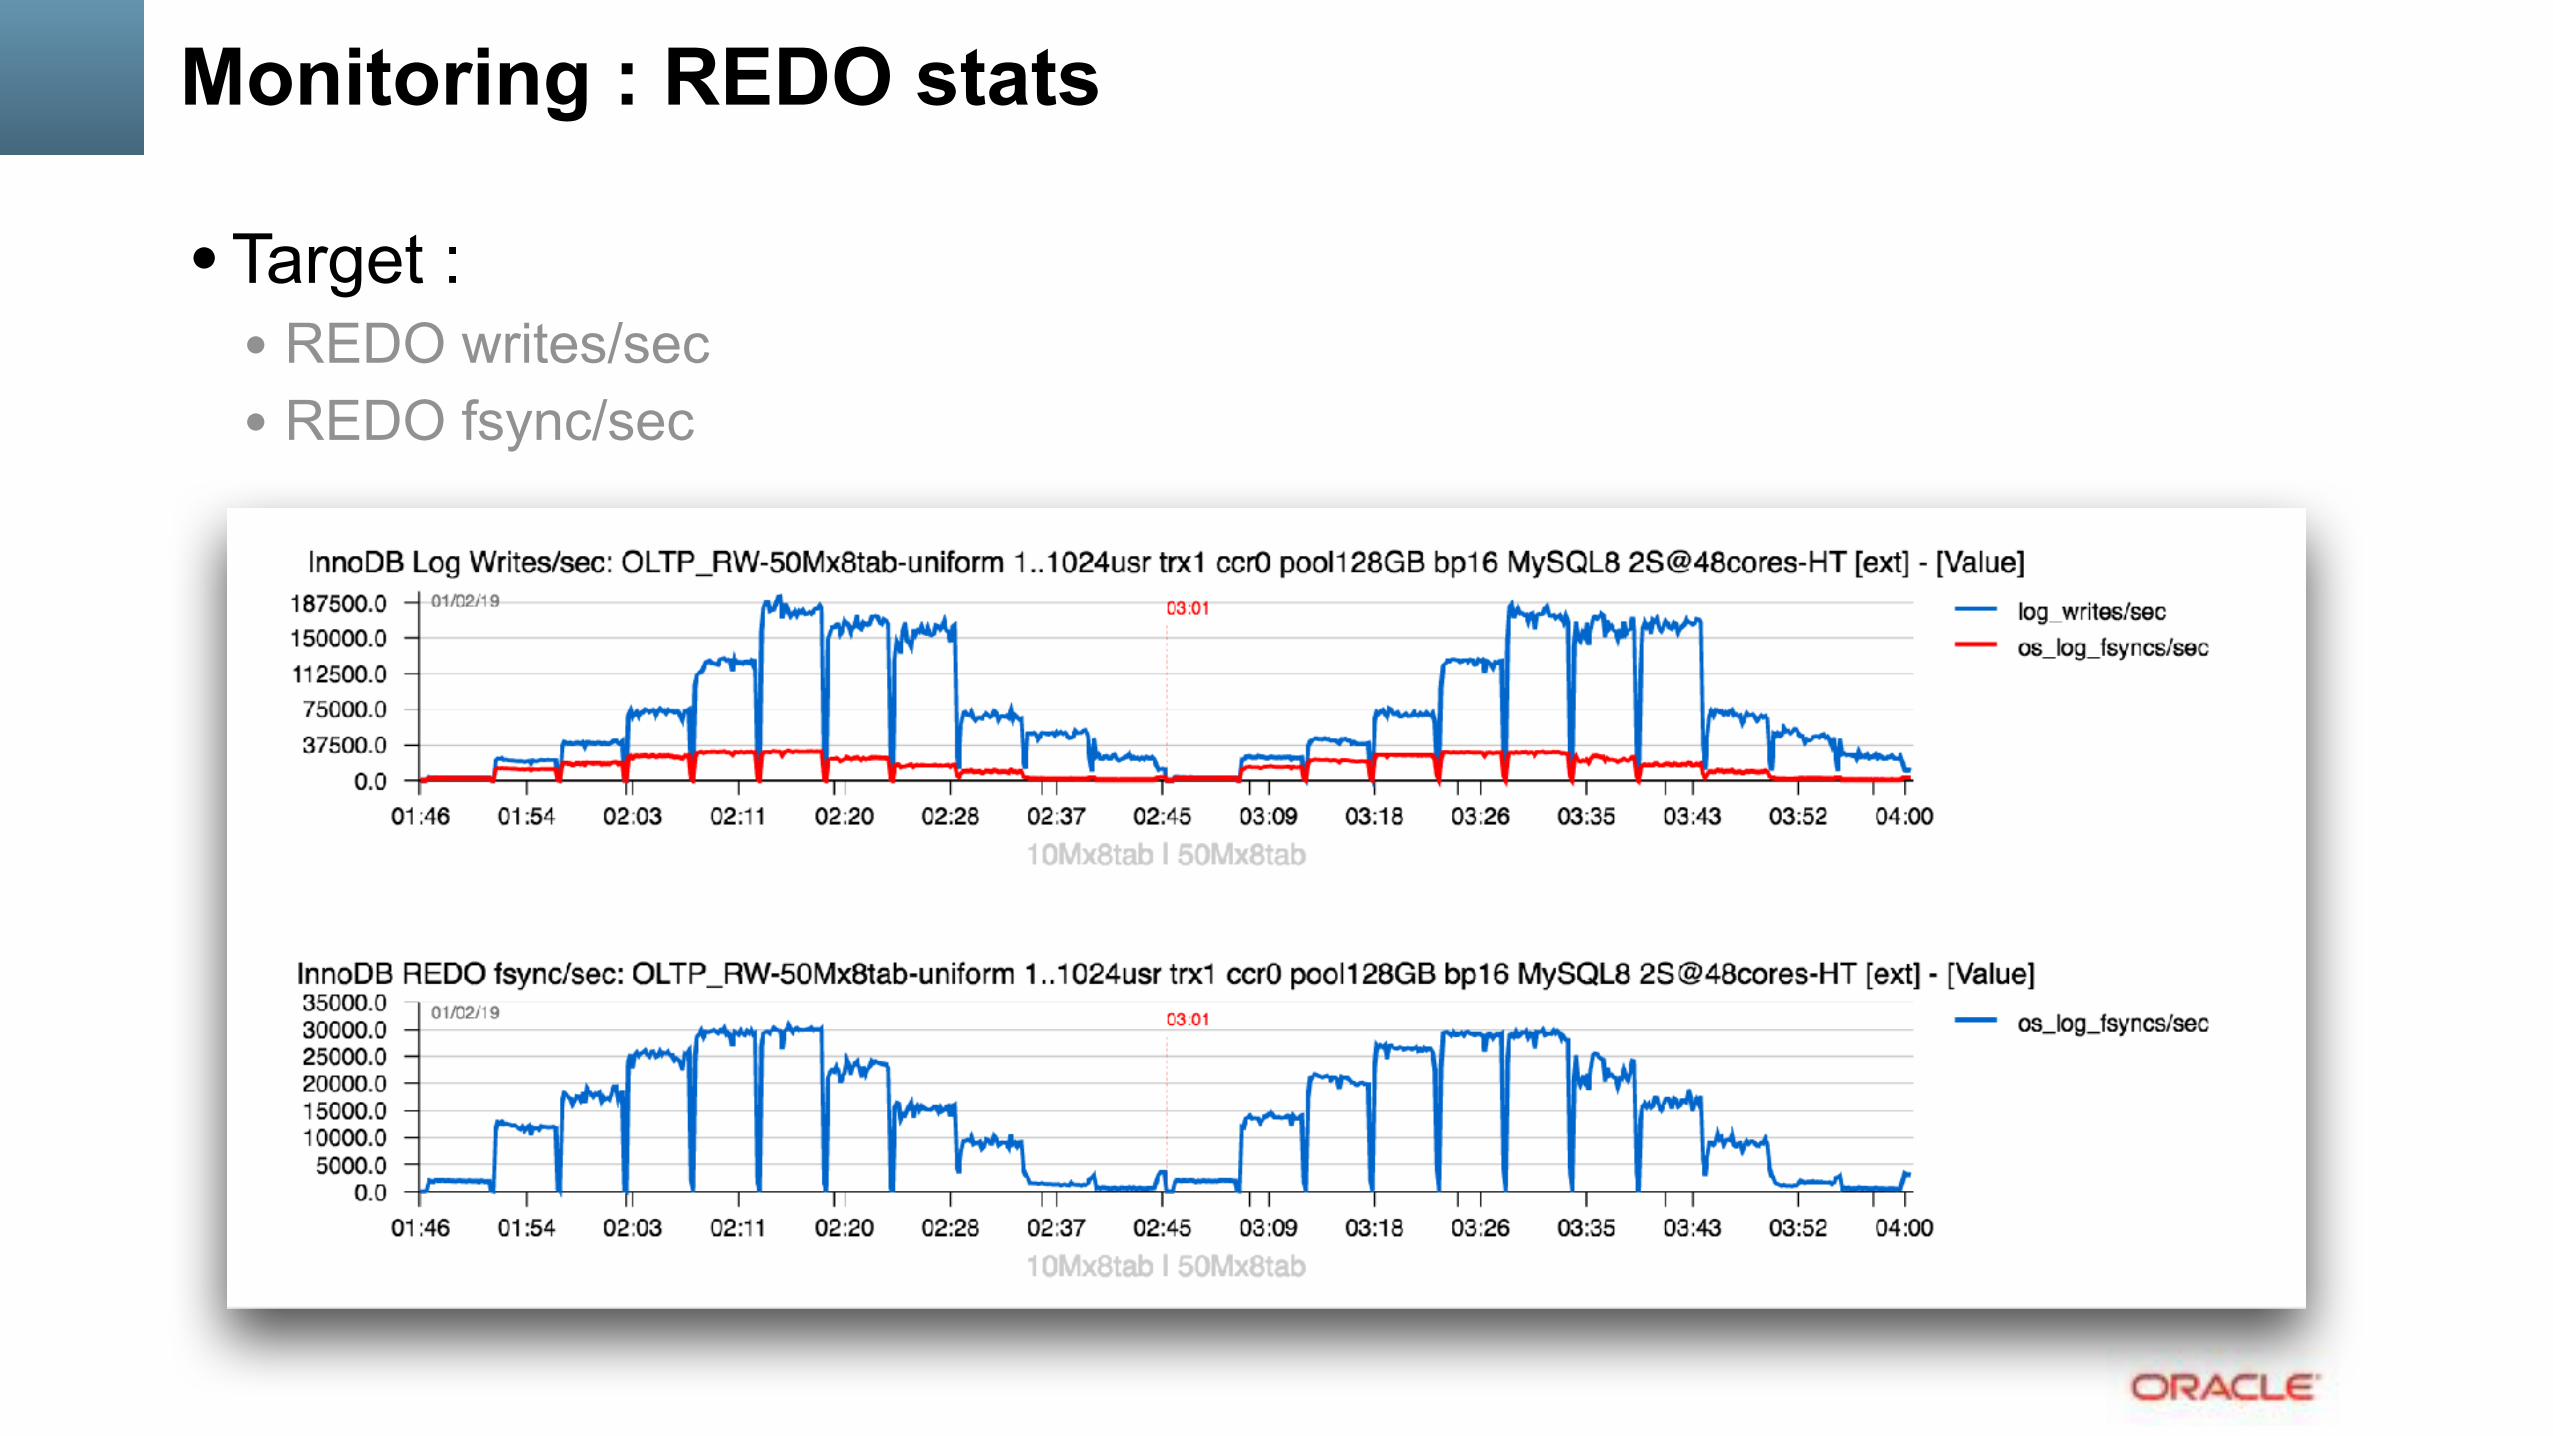
Monitoring : REDO stats
• Target : • REDO writes/sec • REDO fsync/sec

IO-bound RW Tuning
• All previous for In-Memory is still valid ;-)) • LRU Depth
• check the Free Page request rate • tune LRU Depth accordingly.. • LRU Depth >= Free Pages requests/sec / BP instances • Example :
• innodb_buffer_pool_instances = 24 • innodb_page_cleaners = 24 • innodb_lru_scan_depth = 10K
• Check if IO reads are not blocking your IO writes ;-)) • limiting thread concurrency to lower IO reads • ex. innodb_thread_concurrency = 64 • using 4K page size can help to lower IO activity if data access is mostly random • NOTE : right now there is NO limits for IO reads / writes for such kind of workloads !

Example : OLTP_RW 50Mx8tab with 64G / 32G BP
• Workload Scenario : • BP=64G on left & BP=32G on right • progressing step-by-step load from 1, 2, 4 .. till 1024 concurrent user sessions
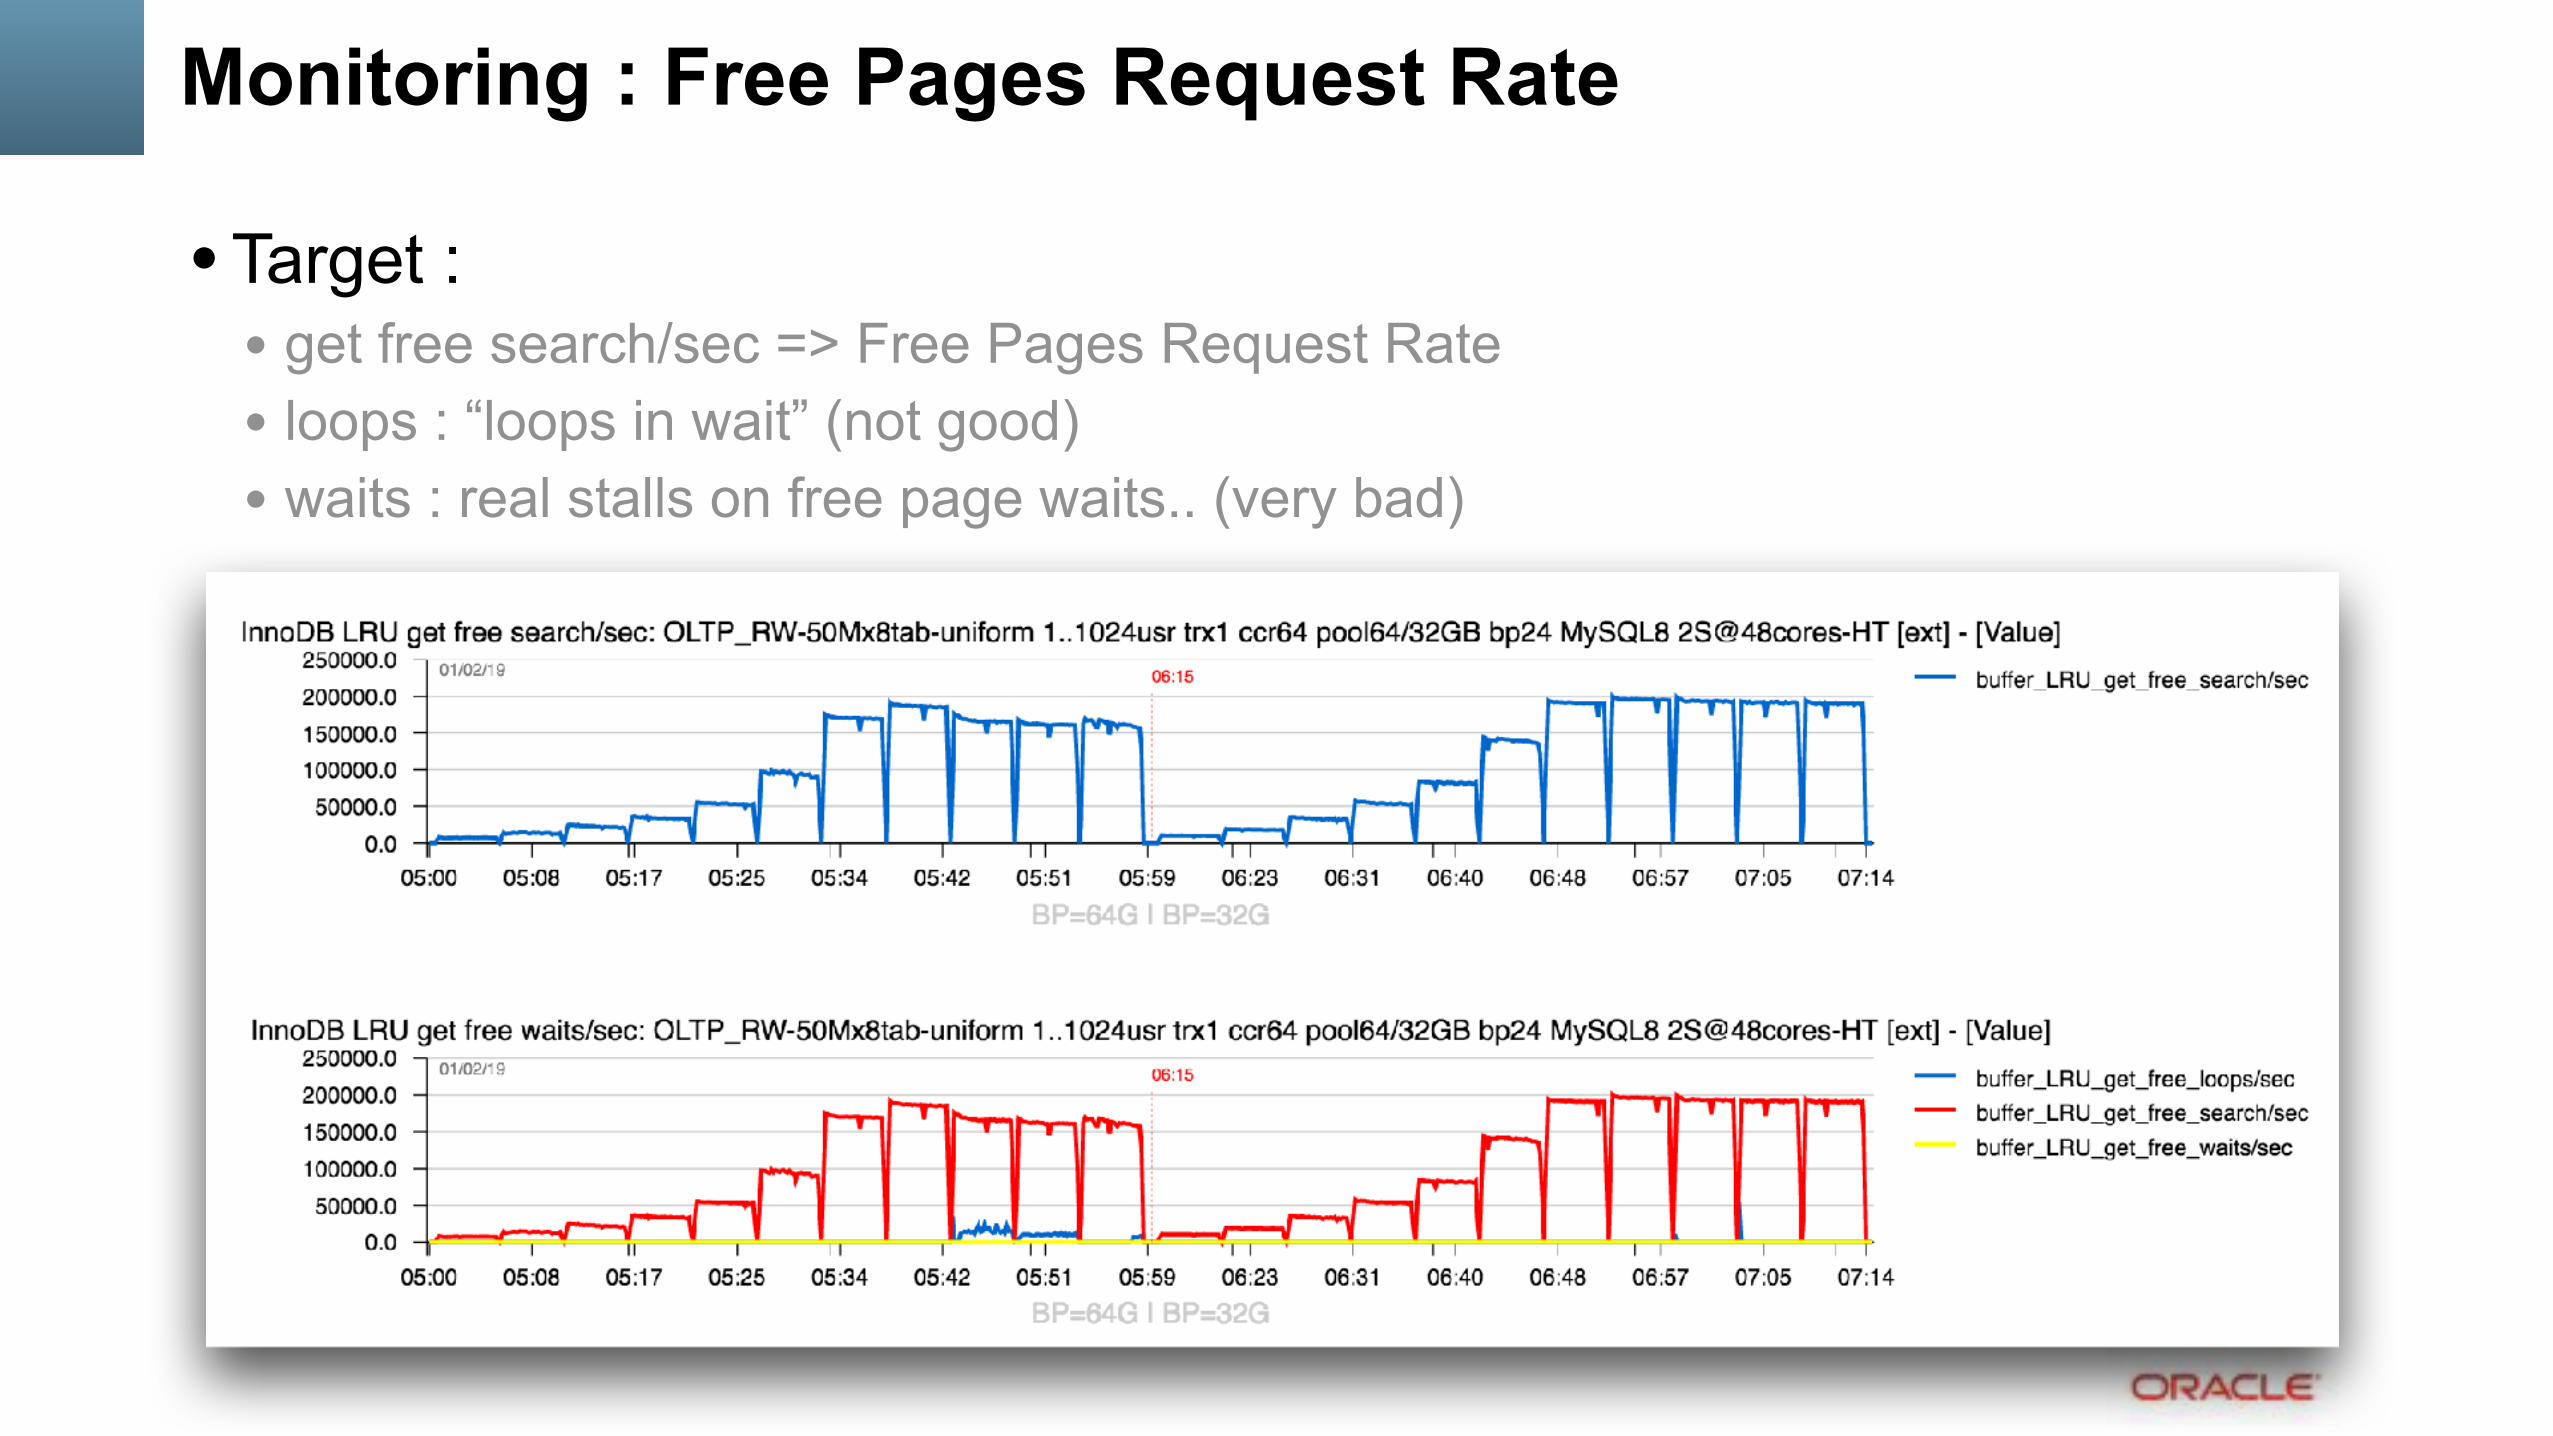
Monitoring : Free Pages Request Rate
• Target : • get free search/sec => Free Pages Request Rate • loops : “loops in wait” (not good) • waits : real stalls on free page waits.. (very bad)
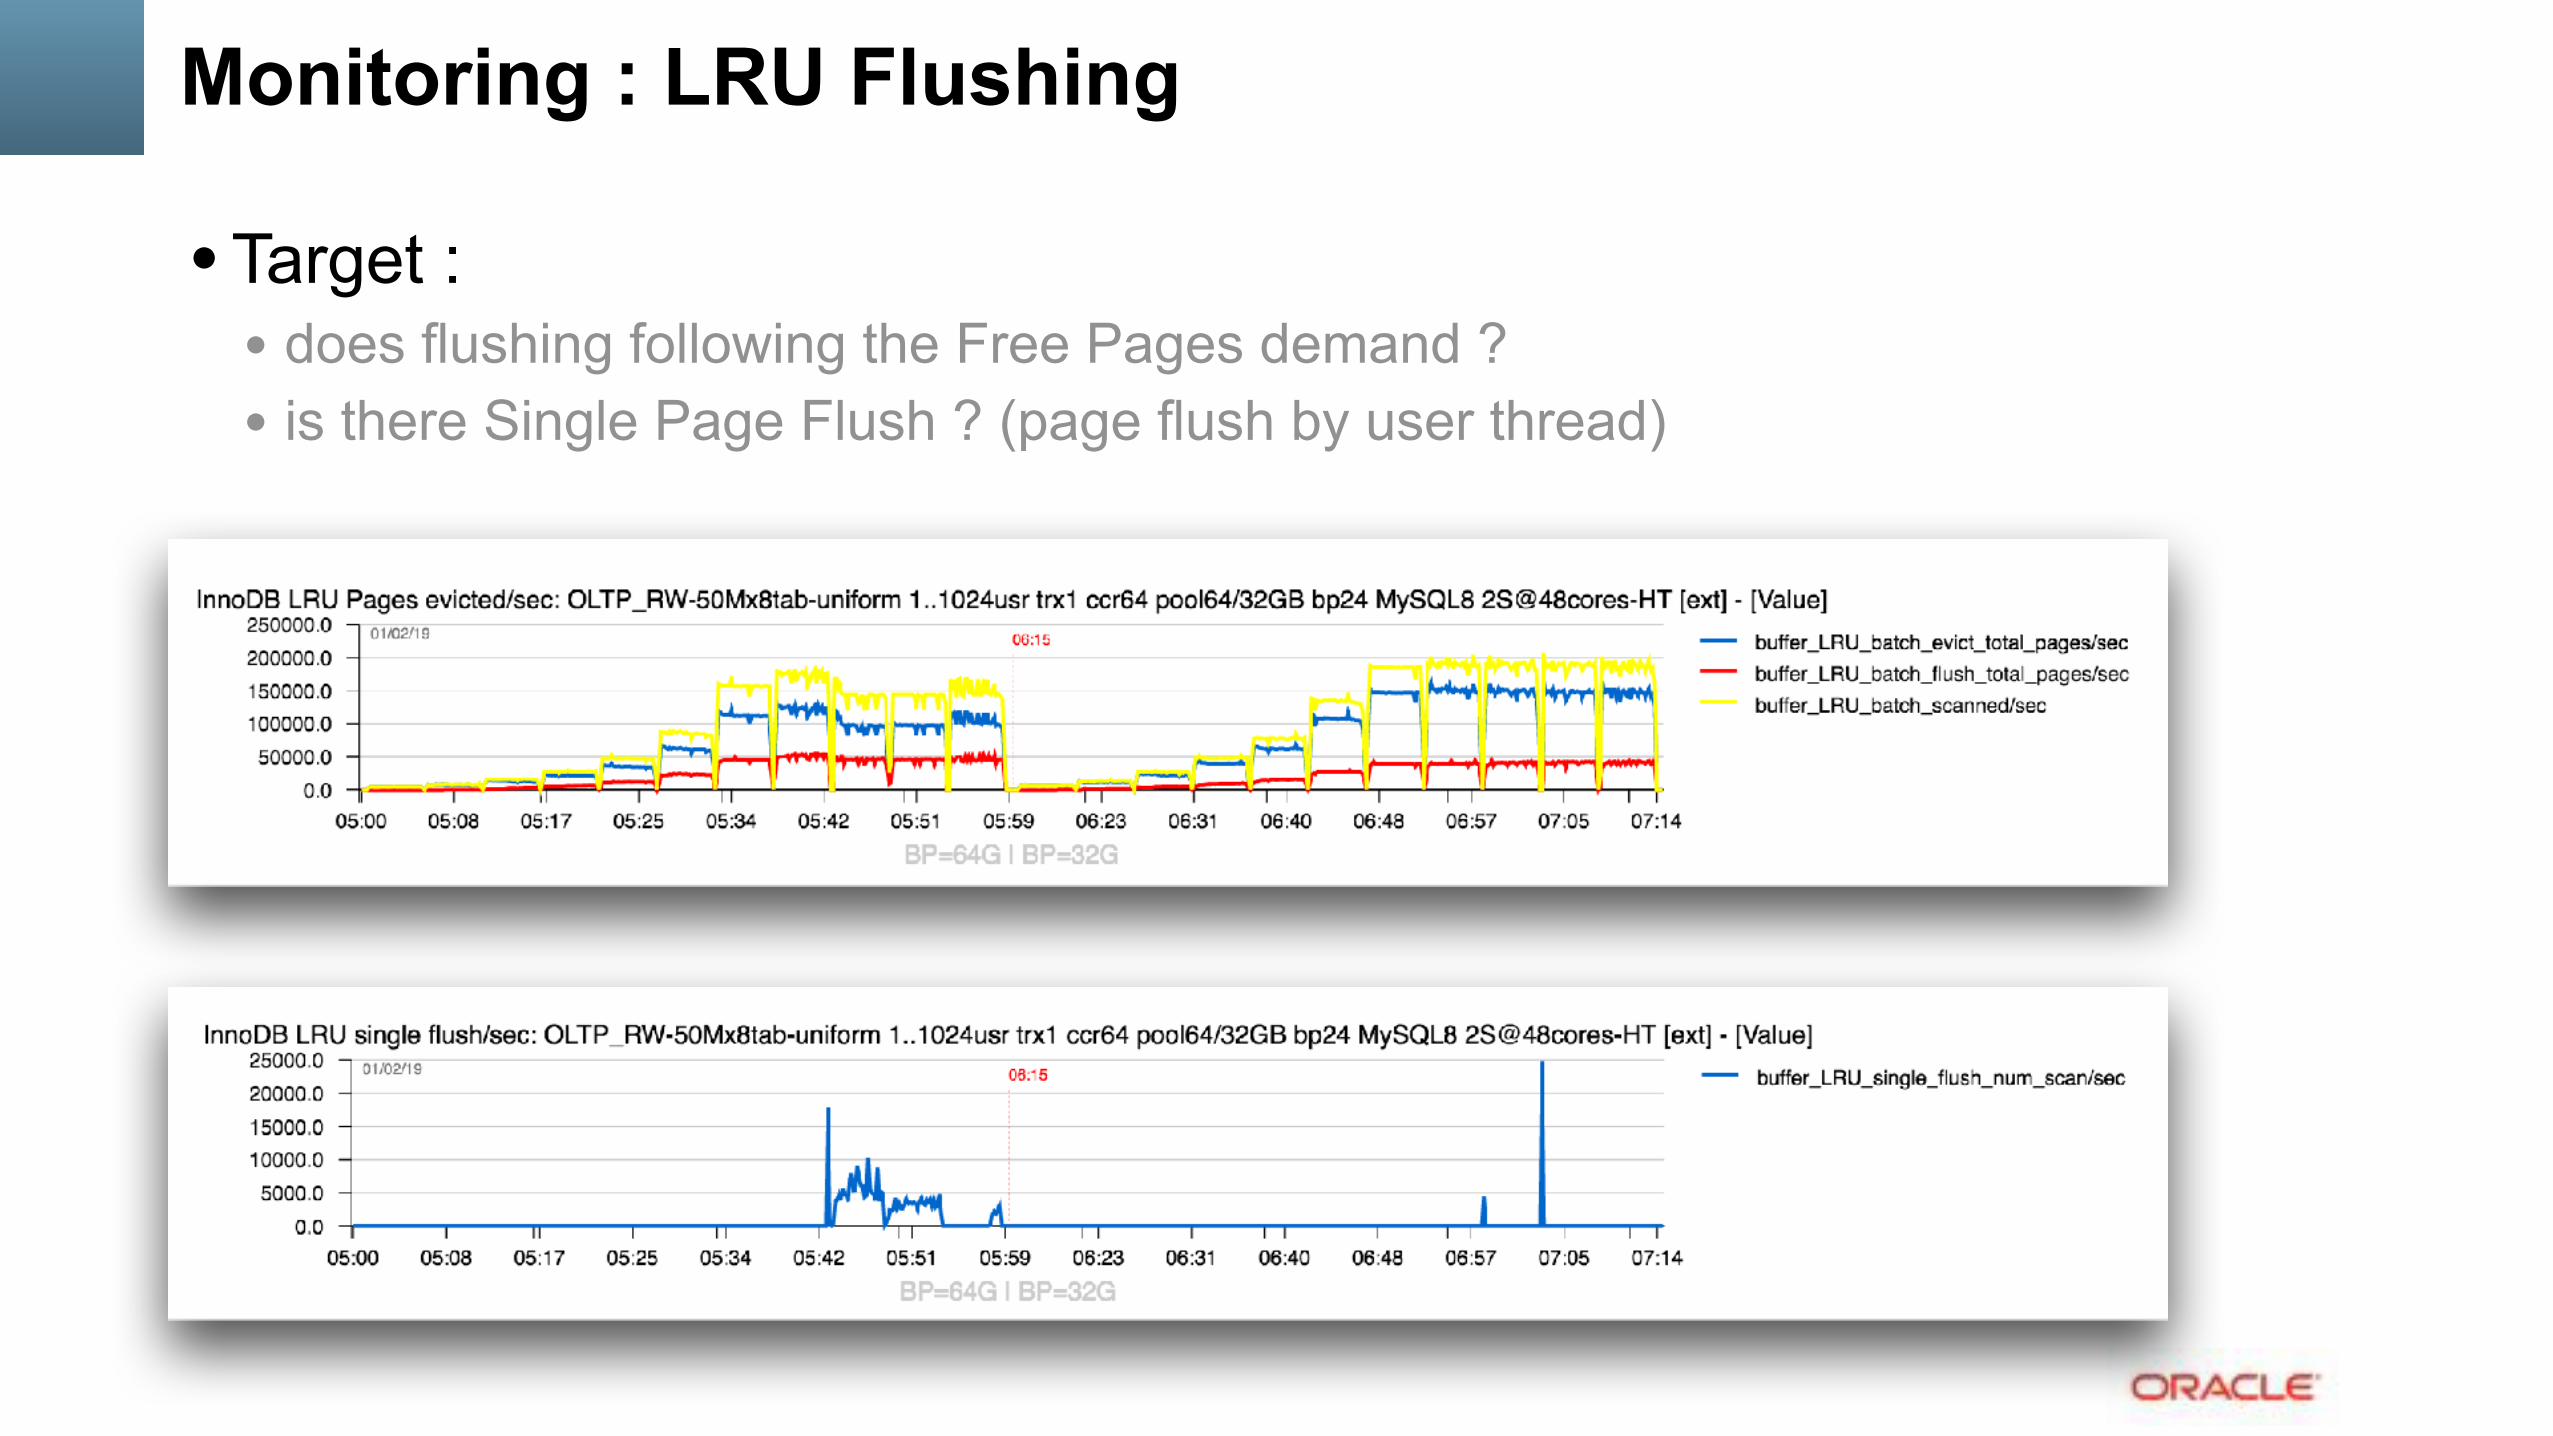
Monitoring : LRU Flushing
• Target : • does flushing following the Free Pages demand ? • is there Single Page Flush ? (page flush by user thread)

Monitoring : Flushing Times
• Target : • do we finish flushing within 1sec ? • no.. — and the fix here is to go with 32 or 48 BP instances ! ;-))

Once again about File System : EXT4 or XFS ?
• same OLTP_RW, BP=64G, double write = 0
• same OLTP_RW, BP=64G, double write = 1
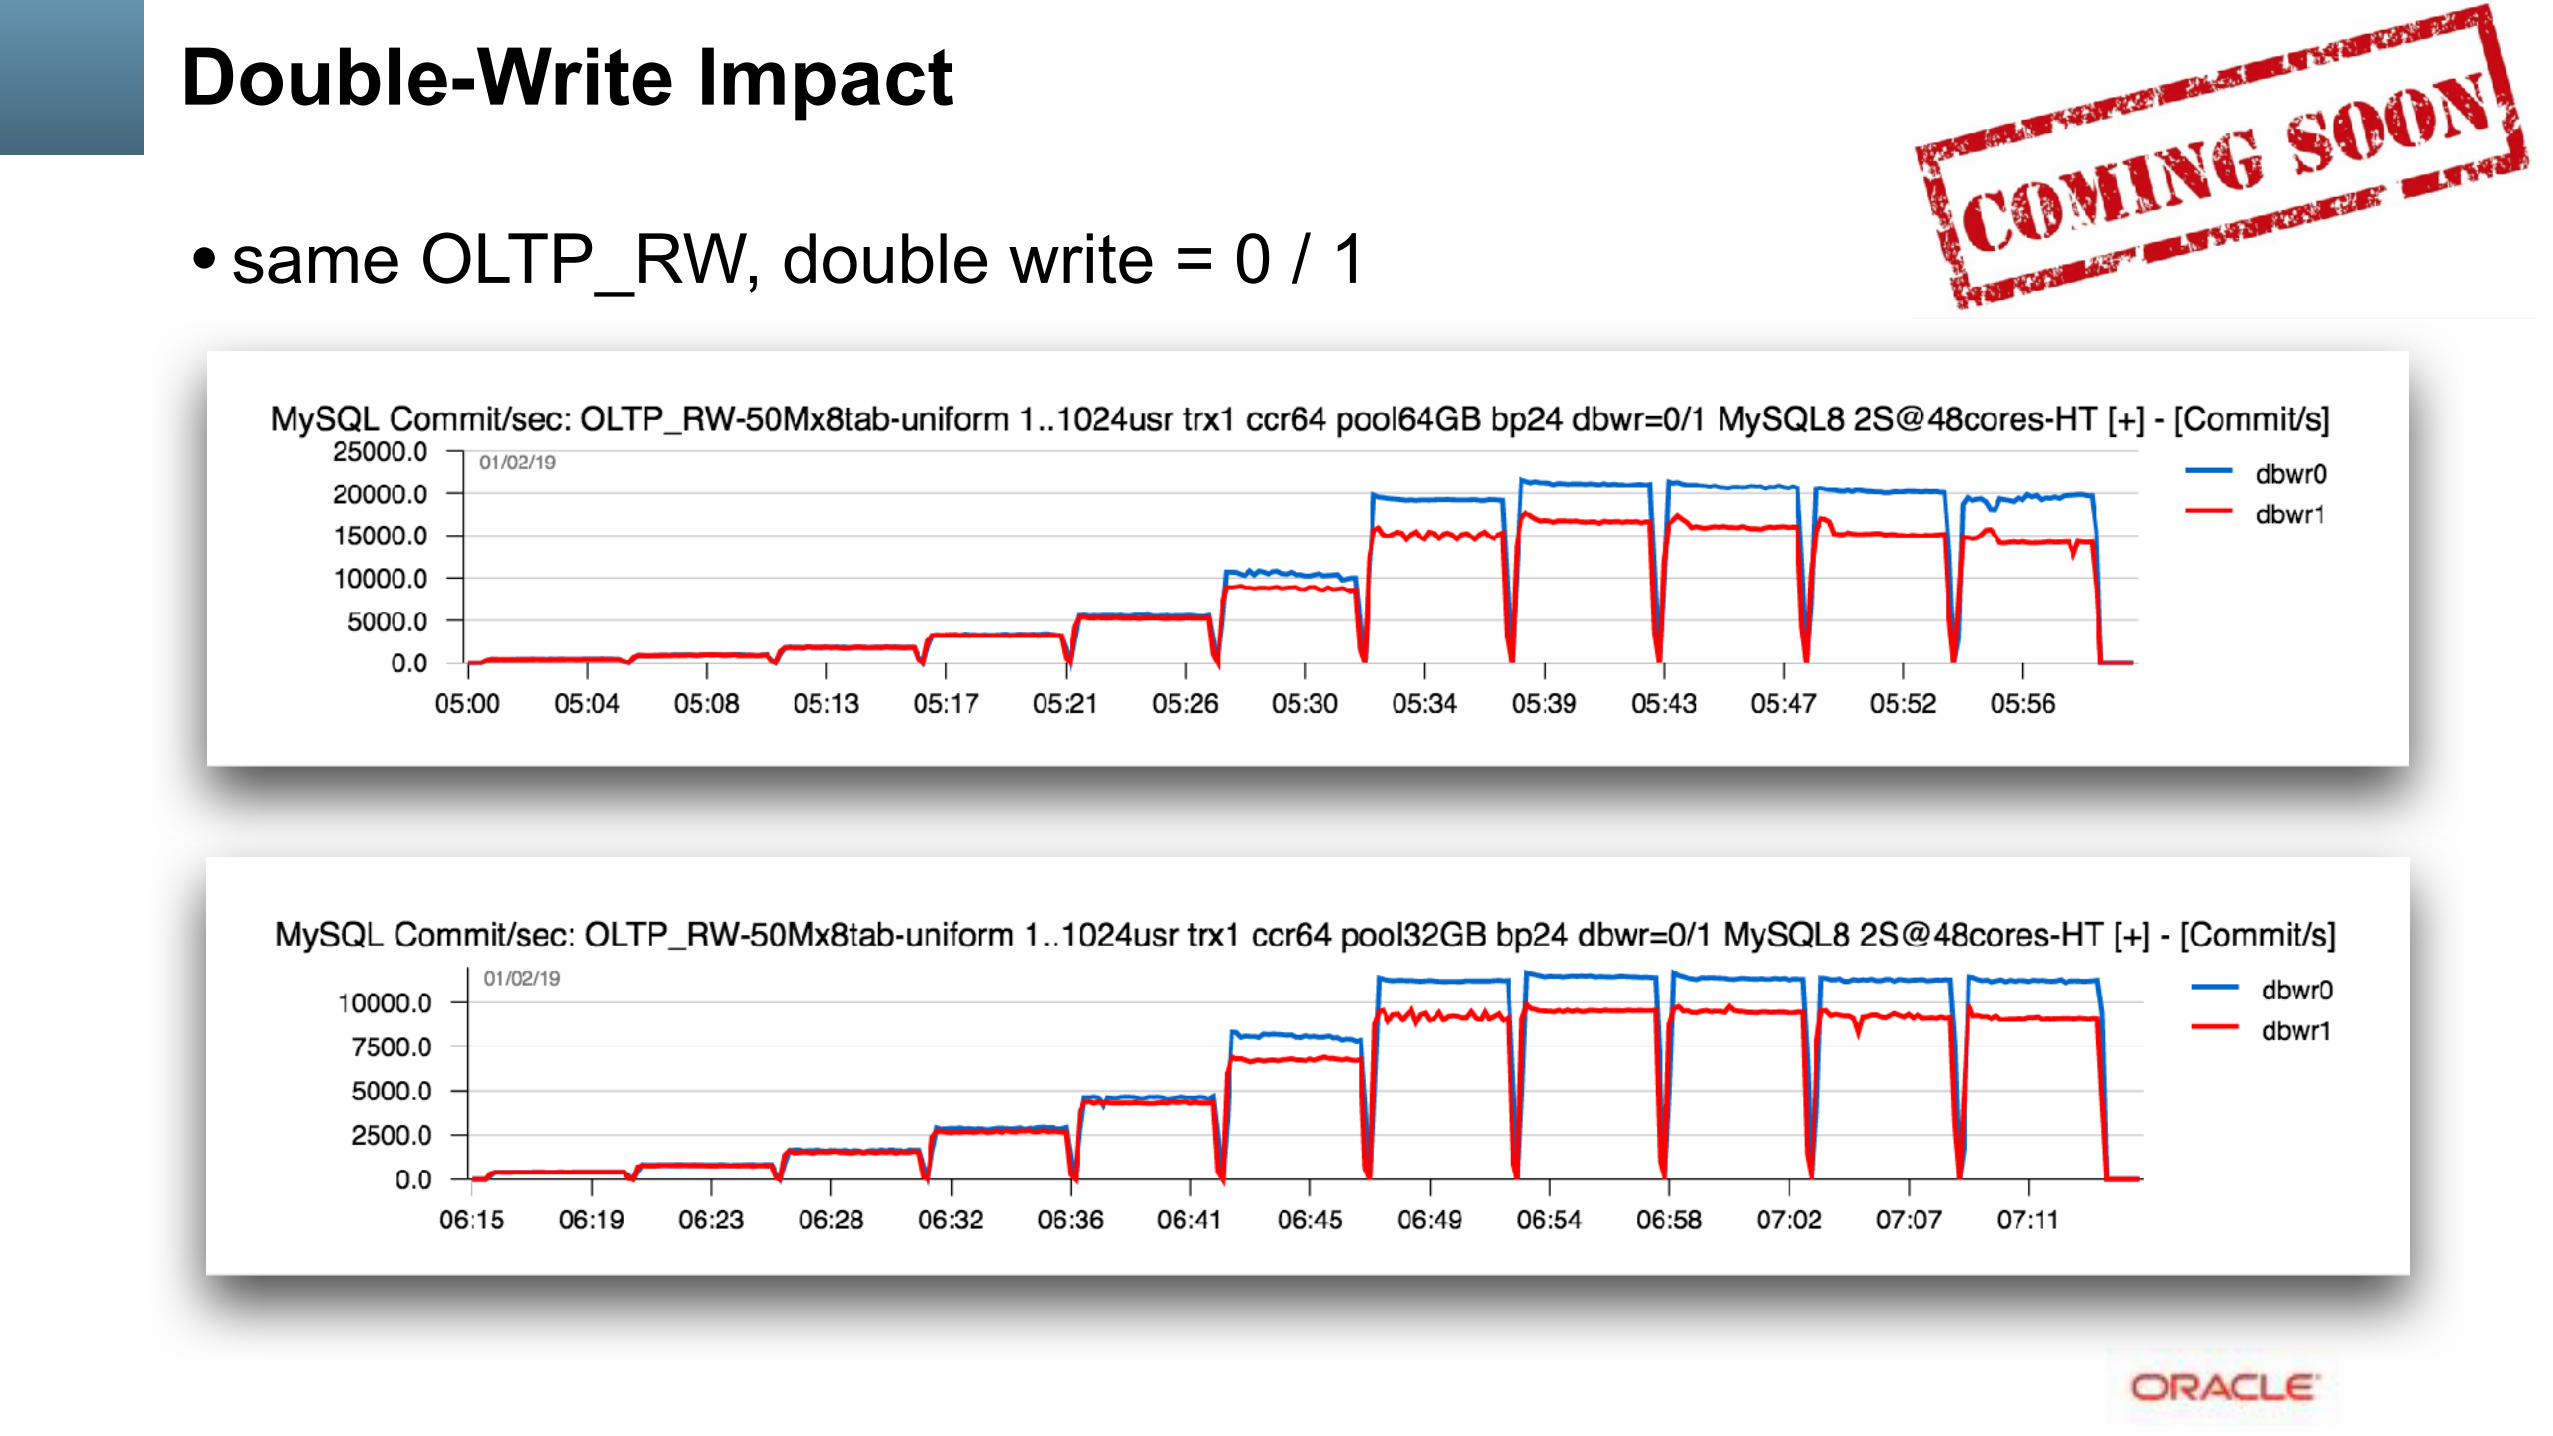
Double-Write Impact
• same OLTP_RW, double write = 0 / 1

Overall Scalability Issues
• RO : • Block Locks <= workaround : ProxySQL Query Cache • Lookups via Sec.IDX <= possible workaround : use PK, AHI • UTF8 <= use 8.0 ;-) • Global lock on every IO read <= use 8.0 ;-)
• RW : • REDO log related bottlenecks.. <= new REDO since 8.0 !! • Double Write.. <= coming soon with 8.0 update (!!) • TRX management contentions.. <= work-in-progress, prototyped.. • LOCK management.. <= work-in-progress, prototyped.. • RR / RC isolation.. <= work-in-progress, prototyped.. • UPDATE Performance.. <= use 8.0, and stay tuned ;-) • INSERT Performance.. <= possible workaround : use partitions • Purge lagging.. <= not yet solved, but you can truncate UNDO

OLTP_RW latin1 @MySQL 8.0 (Apr.2018)
• 45K (!!) TPS Sysbench OLTP_RW 10Mx8tab, trx_commit=1, 2S • 30% gain vs MySQL 5.7 • 50% gain vs MySQL 5.6
������������������������������������ ������� ���� �����������
���������� �����
����������������
� � �� �� ��� �������
�������
�������
�������
�������
����������������������������������������������
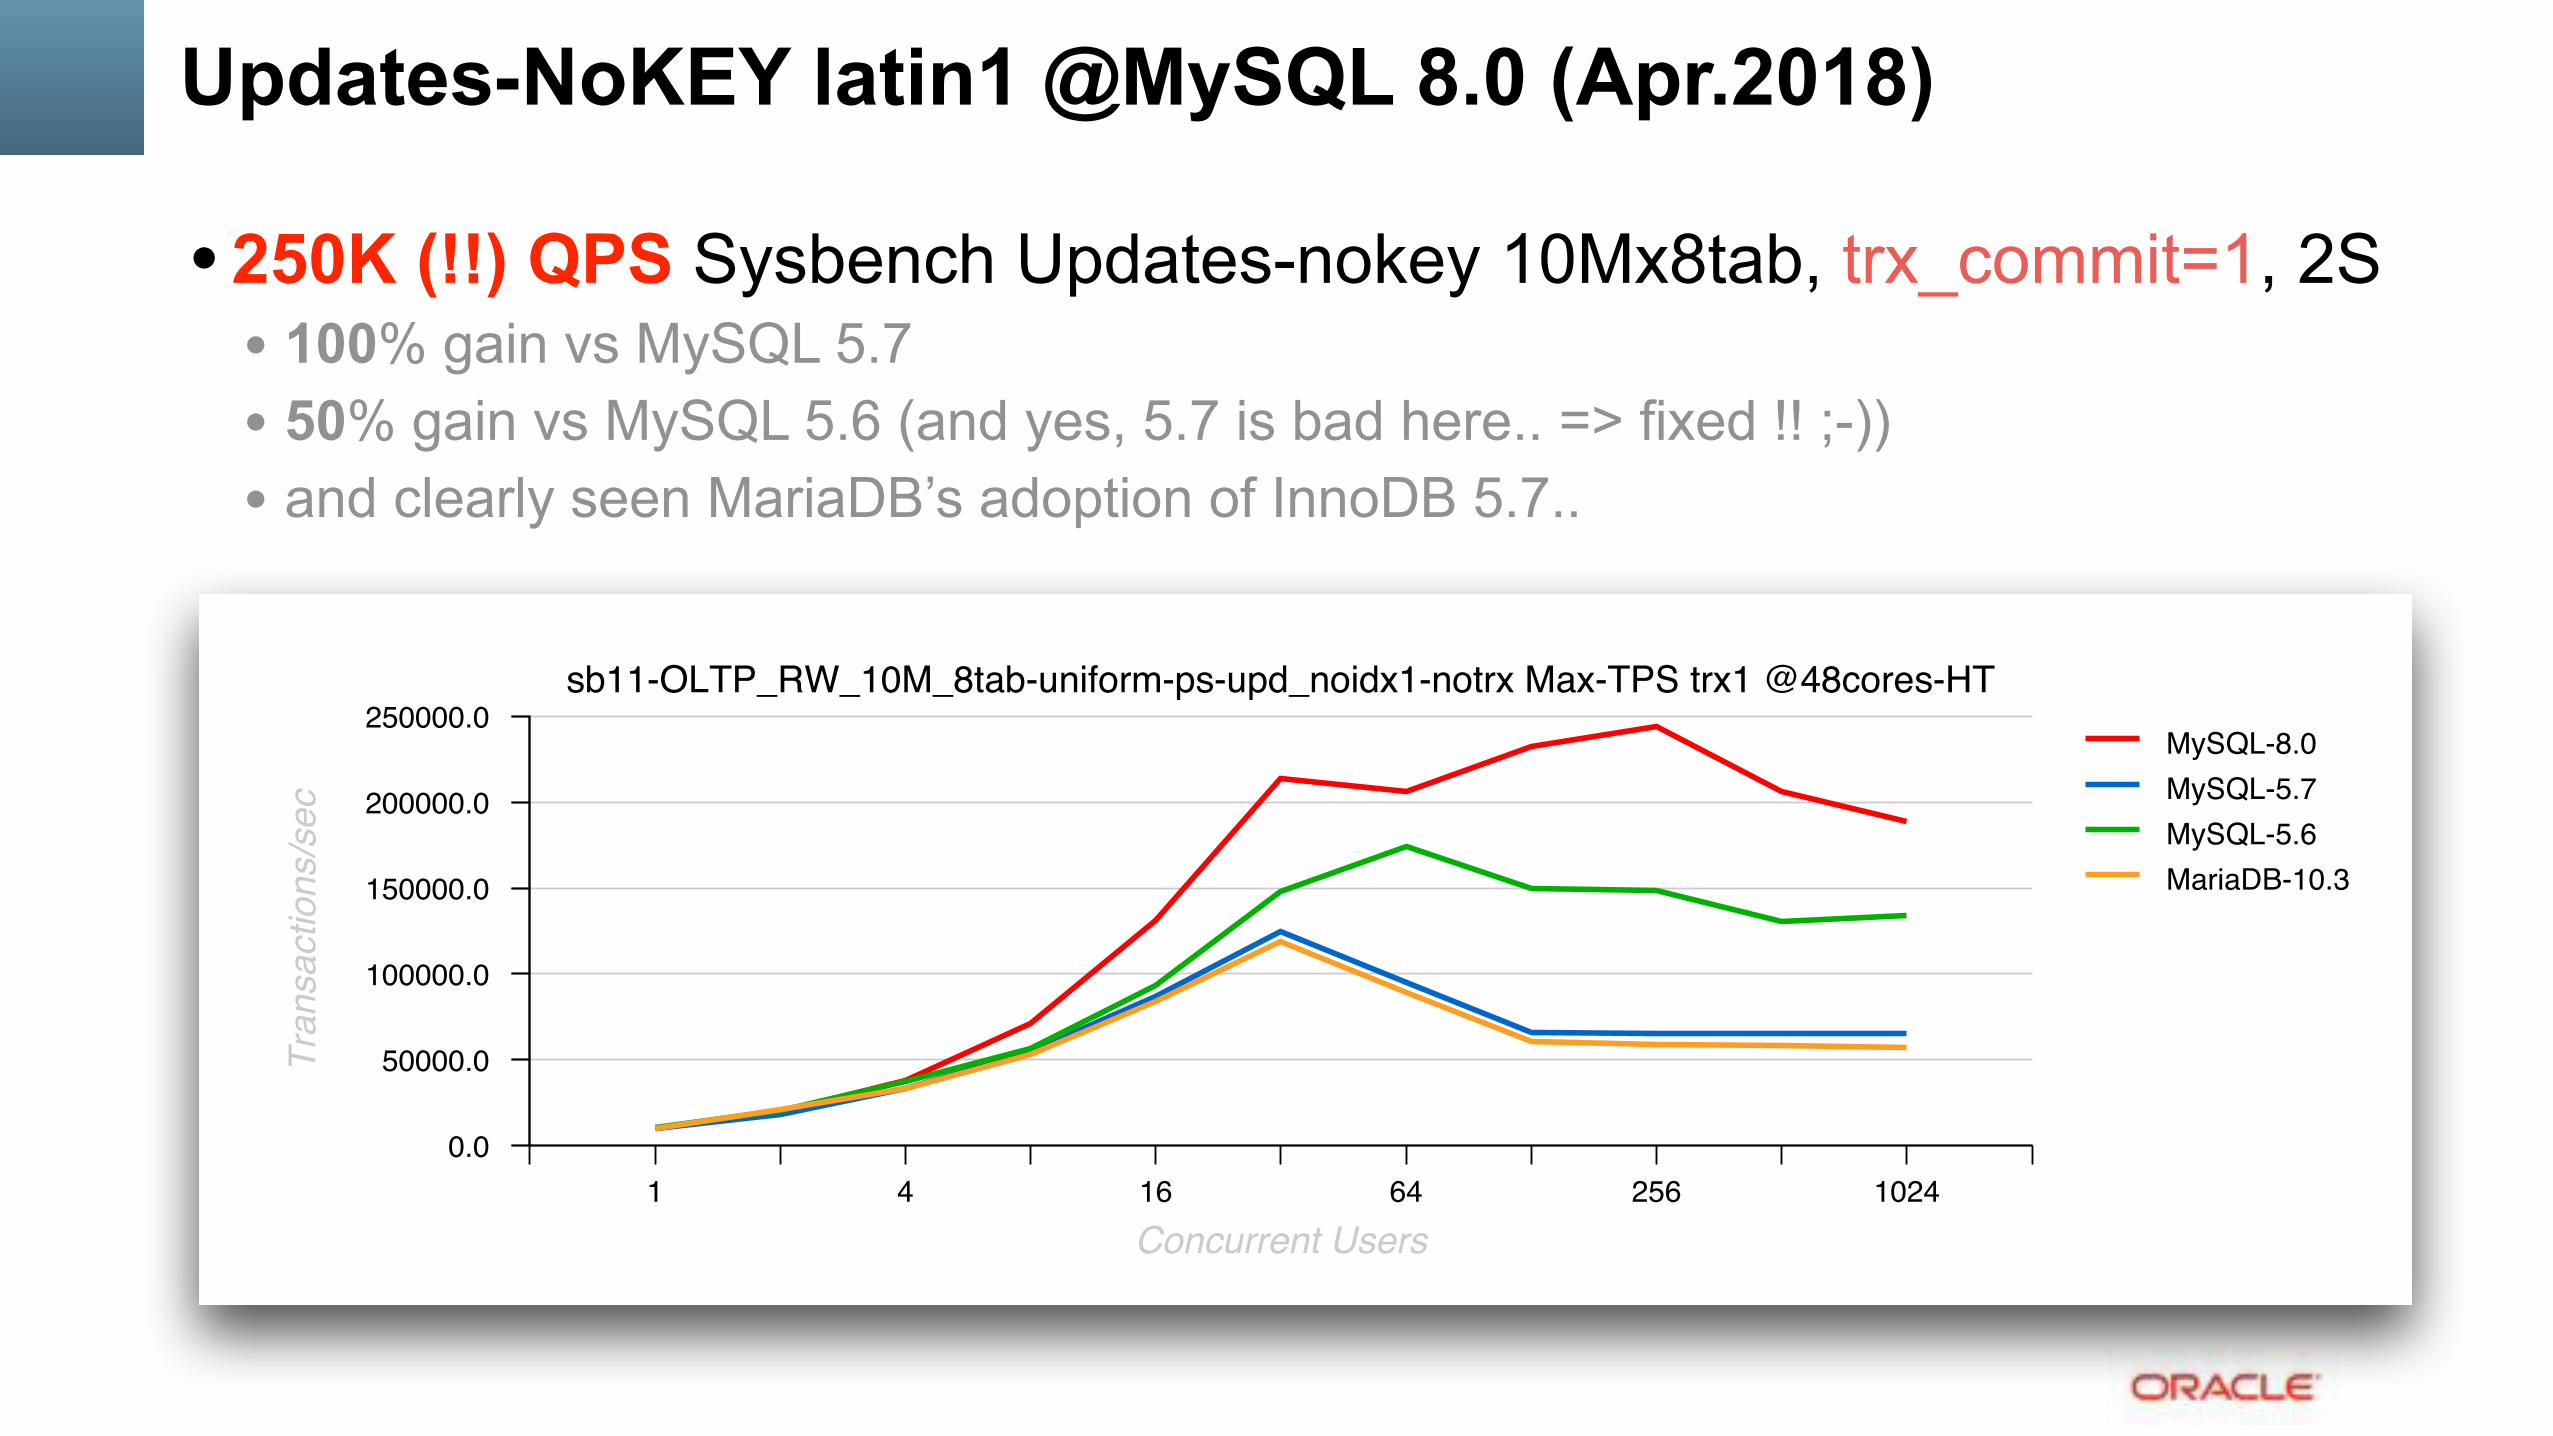
Updates-NoKEY latin1 @MySQL 8.0 (Apr.2018)
• 250K (!!) QPS Sysbench Updates-nokey 10Mx8tab, trx_commit=1, 2S • 100% gain vs MySQL 5.7 • 50% gain vs MySQL 5.6 (and yes, 5.7 is bad here.. => fixed !! ;-)) • and clearly seen MariaDB’s adoption of InnoDB 5.7..
������������������������������������������������� ������� ���� �����������
���������� �����
����������������
� � �� �� ��� �������
�������
��������
��������
��������
�����������������������������������������������

Binlog Impact
• OLTP_RW / Update_NoKEY 10Mx8tab, BP=32G • yes it sucks, yes we MUST do something.. • workaround : … 🤔 …

Hope you’re seeing much more clear now ;-)
• And there is less mystery for you around MySQL Performance Tuning • Most of stuff is available since MySQL 8.0 only.. • So, DON’T wait to try & upgrade !!! :-)

One more thing ;-)
• All graphs are built with dim_STAT (http://dimitrik.free.fr) • All System load stats (CPU, I/O, Network, RAM, Processes,...)
• Mainly for Linux, Solaris, OSX (and any other UNIX too :-) • Add-Ons for MySQL, Oracle RDBMS, PostgreSQL, Java, etc. • Linux : PerfSTAT (“perf” based), mysqlSTACK (quickstack based)
• MySQL Add-Ons: • mysqlSTAT : all available data from “show status” • mysqlLOAD : compact data, multi-host monitoring oriented • mysqlWAITS : top wait events from Performance SCHEMA • InnodbSTAT : most important data from “show innodb status” • innodbMUTEX : monitoring InnoDB mutex waits • innodbMETRICS : all counters from the METRICS table • And any other you want to add! :-)
• Links • http://dimitrik.free.fr - dim_STAT, dbSTRESS, Benchmark Reports, etc. • http://dimitrik.free.fr/blog - Articles about MySQL Performance, etc.