myoglobin detection on sic: immunosensor development for
TRANSCRIPT

University of South FloridaScholar Commons
Graduate Theses and Dissertations Graduate School
January 2013
Myoglobin Detection on SiC: ImmunosensorDevelopment for Myocardial InfarctionAlexandra Oliveros VillalbaUniversity of South Florida, [email protected]
Follow this and additional works at: http://scholarcommons.usf.edu/etd
Part of the Biomedical Engineering and Bioengineering Commons, and the Electrical andComputer Engineering Commons
This Dissertation is brought to you for free and open access by the Graduate School at Scholar Commons. It has been accepted for inclusion inGraduate Theses and Dissertations by an authorized administrator of Scholar Commons. For more information, please [email protected].
Scholar Commons CitationOliveros Villalba, Alexandra, "Myoglobin Detection on SiC: Immunosensor Development for Myocardial Infarction" (2013). GraduateTheses and Dissertations.http://scholarcommons.usf.edu/etd/4740
Myoglobin Detection on SiC: Immunosensor Development for Myocardial Infarction
by
Alexandra Oliveros Villalba
A dissertation submitted in partial fulfillment of the requirements for the degree of
Doctor of Philosophy Department of Electrical Engineering
College of Engineering University of South Florida
Co-Major Professor: Stephen E. Saddow, Ph.D. Co-Major Professor: Mark J. Jaroszeski, Ph.D.
Andrew Hoff, Ph.D. Sylvia Thomas, Ph.D. Nathan Gallant, Ph.D.
Anthony Guiseppi-Eli, Ph.D.
Date of Approval: May 21, 2013
Keywords: Biosensor, impedance spectroscopy, silicon carbide, biocompatibility, self-assembled monolayers
Copyright © 2013, Alexandra Oliveros Villalba

DEDICATION
"To my family,
your encouragement in the hardest times made me the person I am today. Thank you for being
the light that brightened my path in the darkest times"

ACKNOWLEDGMENTS
I would like to thank my major professor, Dr. S.E. Saddow and co-major professor, Dr.
M.J. Jaroszeski for believing in me and for nominating me for the Presidential Doctoral
Fellowship. For always providing the financial support and resources, including their expertise to
succeed in the completion of my work. To Dr. A. Guiseppi-Eli for all the discussions and
guidance that contributed to chapter 2 and chapter 3, and for encouraging me to explore the
field of potentiostatic and impedance based sensors. I want to also thank Dr. A. Sagüés for
sharing his knowledge and expertise and for teaching me the basics in electrochemistry, the
time spent in your lab made possible chapter 4.
I want to express my gratitude to Dr. A. Hoff for his advice in the area of device
processing and characterization. To Dr. S. Thomas for helping me understand what the PhD is
about, and helping me to be practical and prioritize effectively. I wish to thank Dr. N. Gallant for
providing his expertise in the area of biomaterials and cell mechanics when I was working with
graphene.
To my colleagues from the Walter Schottky Institute, Dr. I.D. Sharp, Dr S. Schoell and M.
Sachsenhauser, thank you for teaching me about organic functionalization of SiC and providing
XPS analysis. I want to express my gratitude to C. Kotanen, J. Byrd and N. Wilson from the
Center for bioelectronics, biosensors and biochips for their help when I started learning about
impedance spectroscopy. Also, to E. Paz and A. Sanchez for their assistance using the
potentiostat and setting up my workspace in the USF corrosion lab.

Thank you to T. Chapman for assisting me in ordering the chemicals and providing
advice for my cell culture technique.
For providing expertise and advice when I developed my protocols and cell culture
assays, protein conjugation and antibody immobilization I want to thank L. West. To the NREC
staff, R. Tufts, R. Everly, J. Bieber and Dr Y. Emirov for providing their expert advice and
training in some of the tools I needed to build my devices.
I also want to thank B. Batson for providing resources outside of the lab to network with
students and professionals and plan my career path. Last, but not least, I want to express my
gratitude to Dr. C. Locke and Dr. C. Frewin who taught me all the techniques and were there
with me from the start of this journey. To my colleagues that were in the SiC group: Dr. C.
Coletti for starting the bio-SiC research, Dr. N. Schettini for performing the hema-compatibility
SiC experiments. And to those who are in the group: Dr S. Afroz and Dr M. Reyes for growing
the SiC films, M. Nezafati for helping me with the characterization of the SiC, J. Register for
working on the a-SiC and J. King for building the glove box used for the SAM preparation.

i
TABLE OF CONTENTS
LIST OF TABLES ....................................................................................................................... iv LIST OF FIGURES ..................................................................................................................... v ABSTRACT ............................................................................................................................. ix CHAPTER 1: INTRODUCTION TO A MYOCARDIAL INFARCTION SILICON CARBIDE
IMMUNOSENSOR ................................................................................................ 1 1.1 Research Objective and Motivation ......................................................................... 1 1.2 Acute and Silent Myocardial Infarction .................................................................... 2
1.2.1 Silent Myocardial Infarction ...................................................................... 3 1.2.2 Diagnosis of Myocardial Infarction ............................................................ 4 1.2.3 Biochemical Markers for Diagnosis of AMI ............................................... 5
1.3 Immunosensors ...................................................................................................... 8 1.3.1 Immunoreaction/Biomolecular Recognition Element. ................................ 9
1.4 Electrical and Electrochemical Impedance Sensors .............................................. 12 1.4.1 Impedance Spectroscopy ....................................................................... 12 1.4.2 The Double Layer Capacitance .............................................................. 15 1.4.3 Electrode Configuration .......................................................................... 16 1.4.4 Electrochemical Immunosensor .............................................................. 18
1.5 Summary .............................................................................................................. 19 CHAPTER 2: FUNDAMENTALS OF SILICON CARBIDE BASED IMMUNOSENSOR .............. 22
2.1 Note to Reader ..................................................................................................... 22 2.2 SiC as a Biomaterial for Biosensors ...................................................................... 22
2.2.1 SiC Polytypes, Synthesis and Preparation .............................................. 23 2.2.2 SiC a Unique Material for Biosensing ..................................................... 25 2.2.3 Biosensor Configurations Employing SiC ............................................... 30
1.2.3.1 Myoglobin .................................................................................. 6 1.2.3.2 Cardiac Troponin (cTn) .............................................................. 6 1.2.3.3 Creatine Kinase (CK) ................................................................. 7
1.3.1.2.1 Physical Immobilization ............................................. 11 1.3.1.2.2 Covalent Immobilization ............................................ 11 1.3.1.2.3 Bioaffinity Immobilization ........................................... 12
1.3.1.1 Antibody Structure ..................................................................... 9 1.3.1.2 Antibody Immobilization ........................................................... 10
1.4.4.1 Amperometry Based Immunosensors ...................................... 18 1.4.4.2 Potentiometry Based Immunosensors ...................................... 18 1.4.4.3 Conductometry Based Immunosensors ................................... 19
2.2.3.1 Electrically-Based SiC Biosensors ........................................... 31 2.2.3.2 Optically-Based SiC Biosensors .............................................. 36 2.2.3.3 SiC MEMs Biosensors ............................................................. 38
ii
2.3 Electrochemistry of Semiconductors ..................................................................... 39 2.3.1 Energy Levels in Semiconductors .......................................................... 39
2.3.2 The Electrolyte ....................................................................................... 41 2.3.3 The Semiconductor|Electrolyte Interface ............................................... 42
2.3.4 The Determination of the Flat Band Potential Using Mott-Schottky Plots ....................................................................................................... 45
2.4 Summary .............................................................................................................. 46 CHAPTER 3: SIC FUNCTIONALIZATION ................................................................................ 47
3.1 Note to Reader ..................................................................................................... 47 3.2 SiC Chemical Functionalization (SAMs) ................................................................ 48 3.3 Increased Cell Proliferation on Surface Modified 6H-SiC ...................................... 51
3.3.1 Substrate Preparation............................................................................. 51 3.3.2 Preparation of APTES, APDEMS and Octadecene on 6H-SiC
Substrates .............................................................................................. 52
3.4 Surface Modification and Covalent Immobilization of Anti-Myoglobin on 3C-SiC ....................................................................................................................... 58
3.4.1 Preparation of 3C-SiC for Surface Modification ...................................... 59 3.4.2 Surface Functionalization of 3C-SiC with APTES ................................... 59
3.4.3 Anti-Myoglobin Immobilization on the 3C-SiC|APTES Surfaces ............. 61
3.5 Summary .............................................................................................................. 69 CHAPTER 4: MYOGLOBIN DETECTON VIA IMPEDANCE SPECTROSCOPY ON 3C-
SIC (100) ............................................................................................................. 72 4.1 Electrochemical Cell Construction ......................................................................... 73
4.1.1 3C-SiC (100) Working Electrode Fabrication .......................................... 73
4.1.2 SiC Electrochemical Cell ........................................................................ 78 4.2 Specimen Preparation and Testing Methodology .................................................. 80 4.3 Impedance Spectroscopy of the Functionalized 3C-SiC Surface .......................... 81
4.3.1 Analysis of Impedance Spectroscopy Results for Surface C* ................. 82 4.3.2 Analysis of Impedance Spectroscopy Results for Surface B* ................. 83 4.3.3 Analysis of Impedance Spectroscopy Results for Surface A* ................. 86
4.4 Equivalent Circuit Used to Fit the Impedance Spectroscopy Results .................... 88 4.4.1 Model Fitting for Surface C*.................................................................... 90 4.4.2 Model Fitting for Surface B* .................................................................... 90 4.4.3 Model Fitting for Surface A* .................................................................... 91
4.5 Cyclic Polarization Tests on 3C-SiC ...................................................................... 97 4.6 Mott-Schottky Plots of Functionalized 3C-SiC ....................................................... 98
4.6.1 Analysis of Mott-Schottky Plots for Surface C* ....................................... 98
2.3.1.1 Fermi Level and Band Bending ................................................ 40
2.3.3.1 Space Charge Layer in Accumulation and Depletion ............... 44
3.3.2.1 Methodology for Surface Characterization ............................... 52 3.3.2.2 Biocompatibility Assessment ................................................... 53 3.3.2.3 SiC Substrate Characterization ................................................ 54 3.3.2.4 Cell Viability and Morphology ................................................... 55
3.4.2.1 Characterization of the 3C-SiC|APTES Surface ...................... 60
3.4.3.1 Evaluation of Anti-Myoglobin Immobilization On 3C-SiC|APTES Surfaces Via AFM ................................................. 63
3.4.3.2 Analysis of the Specificity of the 3C-SiC|Anti-Myoglobin Surface to Myoglobin ............................................................... 64
4.1.1.1 Characterization of In-Situ Doped 3C-SiC (100) Films ............. 73

iii
4.6.2 Analysis of Mott-Schottky Plots for Surface B*...................................... 100 4.6.3 Analysis of Mott-Schottky Plots for Surface A*...................................... 105
4.7 Discussion and Conclusions of the Myoglobin Detection on SiC Via Impedance Spectroscopy ................................................................................... 108
CHAPTER 5: CONCLUSIONS AND FUTURE WORK ............................................................ 112
5.1 Conclusions ........................................................................................................ 113 5.2 Future Work ........................................................................................................ 113
REFERENCES ....................................................................................................................... 116 APPENDICES ......................................................................................................................... 134
Appendix A Calculation of the Expected Capacitance of the SiC Space Charge Region..................................................................................................... 135
A.1 Capacitance of SiC After OH Termination ............................................... 135 A.2 Capacitance of SiC After APTES Surface Modification ............................ 135 A.3 Fit of the Experimental Data .................................................................... 135 A.4 Fitting of the CV Results for the SiC After OH Termination ...................... 136 A.5 Fitting of the CV Results for the SiC After APTES Surface
Functionalization ..................................................................................... 137 Appendix B Permission for Reproduction of Materials ................................................. 139

iv
LIST OF TABLES
Table 1 Main sensors application and SiC polytype and requirements, adapted from [95] ........ 30 Table 2 SAM characterization via AFM and water contact angle analysis ................................. 54 Table 3 Percentage change in the values of Rct, Cdl, Rcs and Csc for surface C* ......................... 95 Table 4 Percentage change in the values of Rct, Cdl, Rcs and Csc for surface B* ........................ 95 Table 5 Percentage change in the values of Rct, Cdl, Rcs and Csc for surface A* ......................... 96 Table 6 Flat band potential at 1 kHz and 10 kHz for surface C* .............................................. 101 Table 7 Flat band potential at 1 kHz , 10 kHz and 100 kHz for surface B* ............................... 107 Table 8 Flat band potential at 1 kHz and 10 kHz for surface A* ............................................... 107

v
LIST OF FIGURES
Figure 1 Possible causes of myocardial infarction illustrated in the heart .................................... 3 Figure 2 ECG representations a) P,Q,R,S & T Waves b) normal sinus rhythm [26] and c)
myocardial infarction rhythm ......................................................................................... 5 Figure 3 Detection methods for diagnostic applications using immunoreactions ......................... 9 Figure 4 Immunoglobulin (IgG) simplified structure. .................................................................. 10 Figure 5 Common equivalent circuits used in impedance spectroscopy .................................... 14 Figure 6 Nyquist plot for the equivalent circuit in Figure 5a ....................................................... 15 Figure 7 Simplified scheme of the Helmholtz layer that exists between an electrode and
electrolyte solution ...................................................................................................... 16 Figure 8 Illustration of the basic setup for the measurement of electrical or
electrochemical impedance spectroscopy. ................................................................... 17 Figure 9 Schematic of a typical Ion-selective field effect transistor (ISFET) structure ................ 19 Figure 10 All SiC crystals are formed via bi-layers of C and Si, covalently bonded to form
a tetrahedron that forms the basic building block of SiC, adapted from [84]. ............. 24 Figure 11 Atomic stacking sequence of the relevant SiC polytypes viewed in the 11-20
plane ......................................................................................................................... 24 Figure 12 Scheme of a sensor device that includes a transistor, a resonator and resistive
measurements between the finger electrodes ........................................................... 36 Figure 13 Fermi level at equilibrium in a) n-type and b) p-type semiconductor. ......................... 41 Figure 14 Representation of energy levels in a polar solution ................................................... 42 Figure 15 Double layer at the semiconductor|electrolyte interface ............................................ 43 Figure 16 Band bending in an n-type semiconductor a) Flat band potential b) depletion
and c) accumulation. ................................................................................................. 45

vi
Figure 17 AFM micrographs comparing the morphology of (a) 6H-SiC, (b) 1-octadecene functionalized 6H-SiC after alkylation, (c) APDEMS, and (d) APTES functionalized 6H-SiC after silanization ..................................................................... 55
Figure 18 Proliferation of H4 and PC12 cell lines on the (0001) 6H-SiC substrates as a
function of surface termination, as determined by MTT assay analysis ..................... 57 Figure 19 AFM micrographs for H4 cells, fixed (top row) and live (bottom row), on the
untreated a) and b) and modified c) through h) 6H-SiC substrates ............................ 58 Figure 20 AFM micrographs for PC12 cells, fixed (top row) and live (bottom row), on the
untreated a) and b) and modified c) through h) 6H-SiC substrates ............................58 Figure 21 AFM micrographs (1000 X 1000 nm2, z scale 3 nm) of a) hydroxylated 3C-SiC
b) Corresponding APTES modified surfaces .............................................................60 Figure 22 a) C-1s core level spectra and b) N-1s core level spectra of the 3C-SiC after
HF dip and APTES surface functionalization .............................................................61 Figure 23 Process followed for anti-myoglobin immobilization ...................................................62 Figure 24 AFM micrograph (1000 X 1000 nm2, z scale 5 nm, non-contact mode) after
myoglobin immobilization a) surface A (covalent immobilization and BSA blocking), b) surface B (non-covalent adsorption) and c) surface C (covalent immobilization and no BSA blocking..........................................................................64
Figure 25 Illustration of the sequence followed to test the specificity of the SiC modified
surfaces ....................................................................................................................66 Figure 26 Normalized fluorescent intensity of Alexa-Fluor 488 labeled myoglobin and
hemoglobin bound to APTES (left), anti-myoglobin (center) and anti-hemoglobin immobilized on SiC (right) with their respective controls .......................67
Figure 27 Green signal extracted from fluorescent images before background
subtraction for the tested surfaces ............................................................................68 Figure 28 AFM micrograph of the in-situ doped SiC films (USF1-12-17) used for the
electrochemical measurements .................................................................................74 Figure 29 SEM images taken on the in-situ doped SiC films used for the electrochemical
measurements ..........................................................................................................76 Figure 30 Characterization of the in-situ doped 3C-SiC wafers using Hg probe. a) CV
measurements and b) calculated doping concentration (Nd) ....................................77 Figure 31 Process steps to fabricate ohmic contacts on in-situ doped 3C-SiC (100) .................78 Figure 32 a) Inter-contact resistance for ohmic contacts fabricated on in-situ doped 3C-
SiC and b) pattern of the SiC electrode .....................................................................78
vii
Figure 33 a) Diagram for the electrochemical cell used to study the SiC electrode before and after surface modification ...................................................................................80
Figure 34 Nyquist plots obtained for each layer needed to form surface C* on specimen
a) 18F obtained from wafer USF1-13-18 and b) 17R from wafer USF1-13-17 ...........82 Figure 35 Bode plot on SiC, after APTES and after myoglobin incubation (surface C*) on
specimen a) 18F obtained from wafer USF1-13-18 b) inset for the |Z| at high frequencies for 18F c) 17R from wafer USF1-13-17 and d) inset for the |Z| at high frequencies for 17R |Z| .....................................................................................84
Figure 36 Nyquist plots obtained for each layer needed to form surface B* on specimen
a) 17P and b) 17Q both from wafer USF1-13-17 .......................................................85 Figure 37 Bode plot of each layer that forms surface B* on specimen a) 17P b) inset for
the |Z| at high frequencies for 17P c) 17Q and d) inset for the |Z| at high frequencies for 17Q ...................................................................................................86
Figure 38 Nyquist plots obtained for each layer needed to form surface A* on specimen
a) 17C obtained from wafer USF1-13-17 and b) 18C from wafer USF1-13-18 ..........87 Figure 39 Bode plots obtained for each layer that forms surface A* on specimen a) 17C
obtained from wafer USF1-13-17 b) inset for the |Z| at high frequencies for 17C c) 18C from wafer USF1-13-18 and d) inset for the |Z| at high frequencies for 18C |Z| ............................................................................................88
Figure 40 Equivalent circuit used to perform the fitting of the impedance spectra
obtained for surfaces A*, B* and C* ........................................................................90 Figure 41 Schematic that illustrates the change in band bending after a) APTES,
antibody immobilization and b) protein binding to antibody modified surfaces. .......92 Figure 42 Fitted values of Rct for a) surfaces C*, b) surfaces B*, and c) surfaces A* .................93 Figure 43 Fitted values of Rcs for a) surfaces C*, b) surfaces B*, and c) surfaces A* .................94 Figure 44 Potentiodynamic scan taken on SiC after OH termination .........................................97 Figure 45 CV and Mott-Schottky plots obtained for each layer needed to form surface C*
at 1kHz on specimen a) and c) 18F obtained from wafer USF1-13-18 and b) and d) 17R from wafer USF1-13-17 ..........................................................................99
Figure 46 Comparison of CV plots obtained for surface C* at 1kHz ( Bare SiC
APTES, Myoglobin) and 10kHz ( Bare APTES Myoglobin) on specimen 17R .................................................................................. 100
Figure 47 CV and Mott-Schottky plots obtained for each layer needed to form surface B*
at 1kHz on specimen a) and c) 17P and b) and d) 17Q both from wafer USF1-13-17 ....................................................................................................................... 102
viii
Figure 48 Mott-Schottky plots obtained for specimen 17P after OH termination at a) 1 kHz b) 10 kHz and c) 100 kHz on specimen on 17P.. ............................................ 104
Figure 49 a) CV and b) Mott-Schottky plots obtained surface B* at 100kHz on specimen
on 17P. ................................................................................................................... 105 Figure 50 CV and Mott-Schottky plots obtained for each layer needed to form surface A*
at 1kHz on specimen a) and c) 17C and b) and d) 18B ........................................... 106 Figure 51 SEM images taken on a-SiC films ........................................................................... 115 Figure 52 Photograph of a) IME built on a-SiC and b) SEM image of the Ti/Au digits of
the IME built on a-SiC ............................................................................................ 115 Figure A.1 Experimental and fitted CV data for SiC ................................................................. 137 Figure A.2 Experimental and fitted CV data for APTES coated SiC ......................................... 138 Figure B.1 IEEE policy for using IEEE intelectual property in a thesis or dissertation work...... 139 Figure B.2 Reprint permission from Cambridge University Press ............................................ 140 Figure B.3 Permission of reproduction of articles from Biomedical Microdevices
(Springer) .............................................................................................................. 141 Figure B.4 Permission to use excerpts of a co-authored book chapter (Publisher:
Elsevier) ................................................................................................................ 142

ix
ABSTRACT
Silicon carbide (SiC) has been around for more than 100 years as an industrial material
and has found wide and varied applications because of its unique electrical and thermal
properties. In recent years there has been increased attention on SiC as a viable material for
biomedical applications. Among these applications are those where SiC is used as a substrate
material for biosensors and biotransducers, taking advantage of its surface chemical,
tribological and electrical properties.
In this work we have used the proven bio- and hema-compatibility of SiC to develop a
viable biorecognition interface using SiC as the substrate material for myocardial infarction
detection. The approach followed included the development of an electrochemical-based sensor
in which 3C-SiC is used as the active electrode and where flat band potential energy changes
are monitored after successive modification of the SiC with aminopropyltriethoxysilane, anti-
myoglobin and myoglobin incubation.
We have studied the quality of self assembled monolayers obtained by surface
modification of SiC using organosilanes such as aminopropyltriethoxysilane and octadecene,
which is the starting point for the immobilization of cells or proteins on a substrate. We
employed this technique on 6H-SiC where we were able to control the proliferation of H4 human
neuroglioma and PC12 rat pheochromocytoma cells in vitro. Finally, aminopropyltriethoxysilane
(APTES) was successfully used to immobilize anti-myoglobin on the 3C-SiC electrodes as
demonstrated by fluorescence microscopy results. The electrical characterization of the
surfaces was performed via impedance spectroscopy and by measuring changes in flat band
potential using the Mott-Schottky plot technique.

x
Changes in flat band and impedance of the SiC/antibody/protein interface would allow us
to detect changes in the space charge region of the semiconductor. However, we believe that
because of the presence of surface states and different crystal defects on the 3C-SiC we did not
observed repeatable results that allowed us to identify the presence of myoglobin in solution. In
addition, certain modifications need to be performed to the electrochemical cell in order to
confirm the presence of the myoglobin immobilized on the functionalized SiC surfaces.

1
1 CHAPTER 1: INTRODUCTION TO A MYOCARDIAL INFARCTION SILICON
CARBIDE IMMUNOSENSOR
1.1 Research Objective and Motivation
Enabling the continuous monitoring of physiological parameters that provide a physician
with the knowledge to determine a proper therapy for their patient is becoming a major area of
interest in the biomedical research [1]. The use of biomarkers, in addition to other techniques,
can produce more effective and targeted diagnoses provided that they can be implemented in
real-time [2].
Individuals with silent cardiac syndrome develop myocardial infarctions (MI) that go
unnoticed and require periodic examinations [3]. The continual monitoring of Troponin I,
Creatine kinase (CK1) and Myoglobin can provide highly specific diagnostic data even before
the clinical manifestations of a MI becomes apparent. Myoglobin concentrations rise quickly
after a MI event and it is thus considered a biomarker for the early detection of MI [4].
Silicon Carbide (SiC), and more specifically 3C-SiC, has been shown to be a bio- and
hema-compatible semiconductor material [5]. Various forms of SiC have been extensively used
and studied, such as amorphous SiC, as a heart stent coating [6, 7], and it has been shown to
be a promising material for long-term biological applications [8]. The fact that 3C-SiC can be
grown by chemical vapor deposition (CVD) on Si substrates has made it an attractive material
for BioMEMs applications and field effect devices such as the field effect transistor or FET [9,
10]. The principle of operation of a FET biosensor is based on the assumption that charged
molecules in close proximity to the semiconductor induce an electric field that penetrates the
2
near-surface region of the semiconductor and alters the conductivity of the semiconductor, a
change which can be sensed electronically.
Proteins such as antibodies and myoglobin have many charges and the use of
alternating current (AC) and electrochemical impedance spectroscopy (EIS) allow the
measurement of changes produced by the mentioned molecules once immobilized on a
semiconductor or a metal surface. The use of EIS allows one to identify physical processes
related to biological process on the SiC surface that dominate different parts of the impedance
spectrum [11].
1.2 Acute and Silent Myocardial Infarction
Heart attack is the usual name given to acute myocardial infarction (AMI), even though it
is also used to refer to other diseases. This condition can be the first manifestation of a coronary
disorder or it can become a major concern for patients with established coronary disease. AMI
is probably one of the main diseases to cause death, mostly in developed countries. Statistics
suggest that around 1.5 million heart attacks occur each year, one occurs every twenty seconds
and a possible death every minute [12]. The intensive care unit (ICU) usually contains a
significant number of patients having underlying cardiac disease. This includes patients with
acute myocardial infarction, acute heart failure, among other symptoms [13].
The two words, myocardial and infarction, imply that cardiac myocytes in the heart tissue
die, mainly because of a lack of oxygen [14]. Myocardial infarction consists of irreversible
necrosis in heart muscle after a prolonged ischemia. Oxygen is supplied to the heart through the
arteries in order to complete metabolic processes.
Plaque rupture or thrombus formation in a coronary vessel may cause a reduction of
blood supply to an area of the myocardium along with an imbalance in the oxygen supply [15],
see Figure 1. If blood flow to the heart is interrupted, the tissue that has suffered necrosis will
not recover and is usually covered by a collagen scar. The consequence is that the heart action

3
potential will occur at a slower rate, resulting in a low heartbeat rate that will be prolonged so
that the healthy tissue can contract. Healthy heart muscle does not relax because the electrical
impulse can reenter and trigger healthy heart muscle to beat again. If the beat rate reaches 200
beats per minute, heart output and blood flow are reduced to zero and eventually the heart
stops beating.
Figure 1 Possible causes of myocardial infarction illustrated in the heart.
In an event where there is of lack of oxygen in the heart, a reduction in the metabolism in
the organ occurs, which reduces the force of muscular contraction and a decrease of the
systolic wall motion in the affected region. In addition to the mentioned changes, there is
diastolic relaxation with abnormal systolic contractile function and a thickening of the heart walls
which leads to the formation of ischemic tissue.
1.2.1 Silent Myocardial Infarction
A silent myocardial infarction is defined as heart ischemia with no symptoms related to
the same, i.e., an absence of chest discomfort [3, 16]. It has been estimated that silent ischemia
occurs in 2-4% of the adult population [17]. Typically in 20 - 60% of patients that present acute

4
myocardial infarction the classic symptoms are not displayed and are classified as silent
myocardial infarction [18]. Since no symptoms are noticed at the time of the occurrence of the
infarction, it is typically detected by a surveillance of ECG, during which some of the patients
show atypical symptoms [19]. Patients that are predisposed to this condition include individuals
with renal failure [20], patients with sudden death [21] and those with unstable angina [22].
1.2.2 Diagnosis of Myocardial Infarction
Diagnosing cardiac infarction is a difficult task, especially in the ICU mainly due to the
non-specificity of clinical signs and symptoms. Sometimes, the symptoms are non-specific and
the disease can be misdiagnosed and attributed to gastrointestinal, neurological, pulmonary or
musculoskeletal disorders, especially in diabetics and the elderly [23]. The criteria for diagnosis
of AMI includes: Symptoms of ischemia, chest pain (when the infarction lasts for more than 20
min) or coronary occlusion, electrocardiogram (ECG) changes of new ischemia such as ST
segment elevation or depression and development of pathological Q waves (see Figure 2),
evidence of loss of myocardium (using imaging methods) or regional wall motion abnormality
[24]. Moreover, changes in ECG present low sensitivity and sometimes the AMI could be silent
with no chest pain or other symptoms. The methods to detect silent ischemia include the use of
a treadmill or echocardiography. However, they tend not to be precise because the silent
infarction usually occurs during periods of low activity including rest or sleep. A Holster monitor
is also used because it provides the advantage of monitoring the patient during their daily
routines; however the ST segments of the ECG recorded tend to be non-specific and there is
high variability in the data recorded from day to day. In addition a Holster monitoring can only be
used for 72 hrs. [25].
Continuous monitoring of the physiologic conditions and prompt treatment can reduce
mortality and improve patient outcome.

5
a) b) c)
Figure 2 ECG representations a) P,Q,R,S & T Waves b) normal sinus rhythm [26] and c) myocardial infarction rhythm. Note the elevation of the ST segment in yellow.
1.2.3 Biochemical Markers for Diagnosis of AMI
Biochemical markers are macromolecules present in the sarcolemmal membrane of
myocytes. Typically, they are not present in blood, but they begin to diffuse into the cardiac
interstitial tissue and into the micro-vascular and lymphatic tissue after an injury. When these
molecules are present in the blood circulation this can be taken as an indication of myocardial
necrosis and most of the time it is confirmed using ECG and/or imaging techniques. The main
proteins that appear in the circulation after heart tissue damage include: Myoglobin, cardiac
troponin (cTn) T and I, creatine kinase (CK) and lactate dehydrogenase (LDH) [27]. Levels of
myoglobin rise and fall rapidly after 24 hrs., whereas levels of cTn and CK can remain elevated
for up to one week [28].
In patients with diagnostic ECG changes cardiac markers are only useful to confirm the
diagnosis, but they become essential for patients with non-specific symptoms since the use of
biochemical markers enhance previous clinical ECG information [23]. The advantage of
combining cardiac markers with other methods resides in the possibility of determining the
severity of the disease in addition to prognosis values that can be used to formulate the
appropriate therapy.
ST segment
QT interval
PR interval
PR segment
QRS complex
6
1.2.3.1 Myoglobin
Myoglobin is a compact heme protein with a low molecular weight of around 17.8KD (kilo
Dalton). It is mainly found in cardiac and skeletal muscle, and facilitates the transport of oxygen
to the cell mitochondria [29]. Myoglobin is one of the earliest known and commercially available
biochemical markers used for the detection of AMI. After the first symptoms of AMI are detected
it is rapidly released from the site of injury and its sensitivity is greater than CK-MB and cTn.
The concentration of Myoglobin in serum levels increases within 2 hrs. after myocardial
infarction and reaches a peak concentration after 6 - 9 hrs. [30]. A serum concentration of
myoglobin greater than 110 μg/L is considered abnormal and indicative of AMI [14].
Nevertheless, when using this biomarker one has to consider that since it is present in both
skeletal and cardiac muscle, it would be released into the bloodstream after damage to any of
these. It is recommended that a combination of two biomarkers, such as cTn or CK-MB, be
used to diagnose AMI as it serum levels of myoglobin are also elevated due to neuromuscular
disorders, renal failure, exercise or drug intake [31].
1.2.3.2 Cardiac Troponin (cTn)
Troponin is a molecular complex with a relative mass of 80 KD and is formed by three
subunits: TnC the Ca binding subunit, TnT the tropomyosin binding subunit and TnI the
inhibitory subunit. The cTnI is expressed only in the myocardium. This protein plays a significant
role in muscle contraction coupled with ATPase. In cardiac muscle, this protein regulates
muscle contraction in response to intracellular Ca concentration [32].
The cTn biomarker has demonstrated high specificity and is sensitive to detect cardiac
injury [33]. Elevations in this biomarker's levels are registered after 6 - 9 hrs. after onset of the
infarction symptoms. It has excellent myocardial tissue specificity as well as high clinical
sensitivity and reflects even microscopic zones of myocardial necrosis [27].
7
Blood samples are typically drawn from the patient within 6- 9 hrs. after the onset of
symptoms, and additional samples are taken 12 - 24 hrs. if the initial measurements do not
present high enough levels. cTnI is also useful for late or continuous monitoring of AMI because
elevated concentrations in the blood can be detected after 5 - 8 days of AMI onset. In addition, a
rising or falling pattern is needed to distinguish background levels of cTn, for example, patients
with chronic renal failure from patients with AMI. The disadvantage of the current methods used
is that when this type of analysis is performed the results are needed in 30 min, but the reality is
that results are usually available after 2 hrs. [34].
1.2.3.3 Creatine Kinase (CK)
Creatine kinase is a dimeric enzyme with a molecular weight ~80 KD that exists as three
different isozymes: MM (muscle), MB (hybrid), and BB (brain). The isozymes names indicate the
tissue of origin. For instance, the CK-MB has its highest concentration in heart muscle, and that
is the main reason to use it as a diagnostic of myocardial infarction [35]. As with cTn, an
increase in CK-MB level can be used as a measurement for the diagnosis of myocardial
infarction. For this particular enzyme, gender specific values should be taken into consideration.
Similarly to the evaluation of cnT, the CK-MB measurement should be done at the time of the
first evaluation of the patient and within 6–9 h later in order to demonstrate the rise or fall of CK-
MB levels for the diagnosis of AMI. In addition, in a few cases patients may require an additional
sample to be drawn between 12 and 24 h if the earlier CK-MB measurements were not high
enough to account for AMI diagnosis. Nonetheless, measurements of CK-MB alone are not
recommended for diagnosis of AMI because of the large skeletal muscle distribution and the
lack of specificity of this enzyme [27].

8
1.3 Immunosensors
Immunosensors can play an important role in the improvement of public health by
providing for rapid detection, high sensitivity, and specificity in areas such as clinical chemistry,
food quality, and environmental monitoring [36]. In contrast to immunoassays, like ELISA
(enzyme immunosorbent linked assay) the development of transducer technology allows for the
detection of trace substances in the environment of interest using label-free detection methods.
This allows one to analyze the target substance more quickly than with conventional methods
such as ELISA.
The design of a biosensor involves the inclusion of a biological receptor, used for the
detection of a target analyte. Typically the receptor is immobilized onto a physical or
physicochemical transducer, which translates the biological interaction between the receptor
and the target analyte into an electrical signal. Examples of biological receptors include:
enzymes, antibodies or antibody fragments, membrane receptors, whole cells, and DNA
fragments. In particular, the term immunosensor is specifically employed to describe devices
that take advantage of the affinity and the specificity between an antibody and the
corresponding antigen to detect and quantify the presence of substances such as viruses,
microorganisms, and toxins in a mixture to be analyzed [36, 37].
In order to build an efficient immunosensor/biosensor, the immobilized molecule should
possess a low degree of nonspecific binding (NSB). Although antibodies are highly specific to a
particular antigen, NSB could occur due to the matrix or surface where the antibody is to be
immobilized or different components in the sample serum that may interact with the sensor
substrate [37].
Some of the most frequent transducer methods are based on electrochemistry,
fluorescence, interferometry, resonance, and reflectometry. Figure 3 shows an illustration of
several detection methods used to detect immunoreactions.

9
Figure 3 Detection methods for diagnostic applications using immunoreactions. Based on [36].
1.3.1 Immunoreaction/Biomolecular Recognition Element.
The use of an antibody as the recognition element in biological devices, has received
increased attention because they can be obtained from natural sources and present a high
degree of specificity to the molecule of interest.
1.3.1.1 Antibody Structure
An antibody is a globular protein with approximately 150 kD molecular weight and can
have different amino acid sequences which makes them a diverse protein [38]. Since the
function of an antibody is to bind to foreign molecules, the typical method used to synthesize
them includes the use of B-lymphocytes in the presence of an antigen, i.e. a molecule that does
not belong to the animal. Different classes of antibodies have a unique amino acid sequence
that can bind to a specific epitope, located on the so called "arms" of the antibody; whereas the
"stem" defines the biological activity that defines the response to an antigen including allergy,
lysis or phagocytosis [36, 38].
The principal antibody found in serum is immunoglobulin or IgG. The simplified structure
of an antibody is illustrated in Figure 4 using IgG as a typical example. It consists of two heavy

10
chains (VH and CH1) and two light chains (VL and CL) that contain functional domains. The Fab
portion contains the structural recognition domain while the Fc region does not bind to an
antigen and is known as the effector domain. The Fab fragments can be obtained by using
reducing agents, which could produce an improved immobilization and exposure of the binding
sites for immunosensor device construction [38, 39].
Figure 4 Immunoglobulin (IgG) simplified structure.
1.3.1.2 Antibody Immobilization
An effective immobilization of the biorecognition element, i.e. antibody, on the device
surface is important. Complete loss of protein activity could happen due to random orientation
and structural deformation of the antibody molecule once immobilized on the surface [40]. For
this reason, the orientation, distribution and density of the antibodies on the surface should be
controlled if possible. The use of self-assembled monolayers and Langmuir-Blodgett films [41,
42] are widely used for the mentioned purpose in addition to the use of a crosslinking agent [8,
43] or through entrapment in a gel matrix or polymer [44].

11
Immobilization techniques are mainly based on three mechanisms that include: physical,
covalent or bioaffinity. There is no unique strategy that works for immobilizing all types of
proteins and some work better compared to others when implemented in immunosensors.
1.3.1.2.1 Physical Immobilization
This method is based on the adsorption of proteins to flat surfaces via intermolecular
forces, such as ionic bonds and polar interactions [40]. This is a fast and simple method but
useful only in single-use assays because the proteins may be removed by buffers or detergents
when performing and experiment [37, 40].
If this method is used for protein immobilization, the resulting layer may tend to be
randomly oriented. Likewise, a high density packed layer may block the protein active site which
interferes with their functional properties (e.g. it may prevent antigen-antibody binding) [40]. This
method of protein immobilization is typically used in enzyme-linked immunosorbent assay
(ELISA) preparation, for which polystyrene plates have been optimized to increase antibody
adsorption [37]
1.3.1.2.2 Covalent Immobilization
The advantage of using a covalent binding method for protein (or antibody)
immobilization is that the attachment of the molecule is more stable with long-term preservation
of its activity, thus making it possible to regenerate the surface after performing the assay.
The covalent bond obtained after applying this method is formed between side chains
exposed functional groups of the protein with the ones on the modified substrate. The latter
ones are obtained by chemical modification of the surface using the techniques mentioned in
section 1.4. The resulting bond is almost irreversible with high surface coverage [40].
12
Covalent binding is achieved with heterobifunctional and homobifunctional crosslinking
reagents. One of the disadvantages of using covalent binding is that linking chemistries are not
always selective. For instance, if coupling is done between a surface and an antibody and the
lysine group is targeted, random orientation of the protein could be the product because this
amino acid is found throughout the antibody structure.
1.3.1.2.3 Bioaffinity Immobilization
The immobilization of proteins through biochemical affinity reactions presents an
advantage over the other immobilization techniques presented because this method provides
oriented immobilization of the protein of interest. The idea being that not only the immobilization
of the protein is achieved but also it allows the researcher to detach proteins and use the
surface more than one time for different assays [40]. The most common system used for this
purpose is the biotin-avidin/streptavidin system, which is a very strong non-covalent bond with
an affinity ~ 1015. Such a strong bond allows the use of harsh biochemical assays [37].
Avidin can bind with up to four molecules of biotin and this glycoprotein is soluble in
aqueous solution. The bond between avidin and biotin is not affected by pH, temperature or
organic solvents [45]. On the other hand, biotin is a small molecule and its conjugation to
macromolecules does not affect its functionality. The use of sulfo-NHS of biotin is employed to
target amine groups on surfaces (e.g. aminopropyltriethoxysilane) [46, 47].
1.4 Electrical and Electrochemical Impedance Sensors
1.4.1 Impedance Spectroscopy
The characterization of the electrical properties of materials, conducting or
semiconducting electrodes, and their interfaces can be done using a very sensitive technique

13
known as impedance spectroscopy. The use of impedance spectroscopy allows the
investigation of the dynamics of bound or mobile charges in the bulk or interfacial regions of
conductors, semiconductors and even insulators [48].
The general approach is to apply an electrical stimulus (i.e. AC voltage or current) to the
electrodes and measure the response (resulting AC current or voltage) [48]. The applied AC
voltage is sinusoidal given by (1), where ω is the radial frequency and Vm is the peak voltage.
The current (e.g. response to the voltage stimulus) is characterized by the amplitude, Im and the
phase shift, φ as seen in (2).. In impedance based biosensors the applied AC voltage is small (
c.a. 10 – 25 mV) because the I-V relationship is linear only for small perturbations [49].
Likewise, the probe molecules should not be disturbed (covalent bond energies are ~ 1-3 eV),
which can be easily achieved with impedance spectroscopy.
𝑉 = 𝑉𝑚 sin𝜔𝑡 (1)
𝐼 = 𝐼𝑚 sin(𝜔𝑡 + φ) (2)
The ratio of Vm/ Im and the phase φ are used to determine the impedance of the device
under test, represented as a complex number, as in (3), with magnitude and phase:
𝑍 = 𝑅 + 𝑗𝑋 (3)
|𝑍| = √𝑅2 + 𝑋2 and φ = arctan 𝑋/𝑅 (4)
If the voltage is applied at different frequencies an impedance spectrum is obtained. This
is displayed in a Nyquist plot, that shows the imaginary component of the impedance on the y
axis and the real component on the x axis and in a Bode plot.
Specific regions of the spectrum can be linked to characteristic frequency ranges linked
to different phenomena that occur at the electrode interface [50]. The impedance spectrum is
interpreted based on an equivalent circuit that best fits the data. The equivalent circuit usually
consists of configurations of resistors and capacitors in series, parallel, or both. In Figure 5 we
present the two main equivalent circuits used. The differences between the circuit in Figure 5a
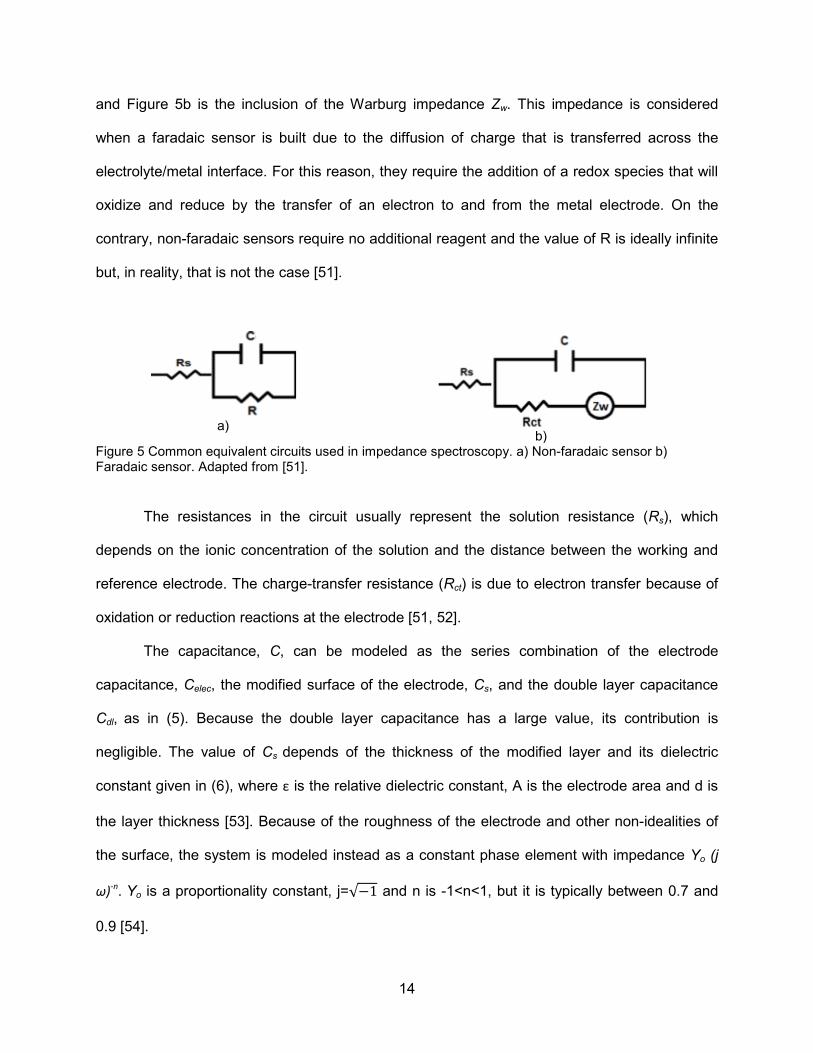
14
and Figure 5b is the inclusion of the Warburg impedance Zw. This impedance is considered
when a faradaic sensor is built due to the diffusion of charge that is transferred across the
electrolyte/metal interface. For this reason, they require the addition of a redox species that will
oxidize and reduce by the transfer of an electron to and from the metal electrode. On the
contrary, non-faradaic sensors require no additional reagent and the value of R is ideally infinite
but, in reality, that is not the case [51].
a)
b) Figure 5 Common equivalent circuits used in impedance spectroscopy. a) Non-faradaic sensor b) Faradaic sensor. Adapted from [51].
The resistances in the circuit usually represent the solution resistance (Rs), which
depends on the ionic concentration of the solution and the distance between the working and
reference electrode. The charge-transfer resistance (Rct) is due to electron transfer because of
oxidation or reduction reactions at the electrode [51, 52].
The capacitance, C, can be modeled as the series combination of the electrode
capacitance, Celec, the modified surface of the electrode, Cs, and the double layer capacitance
Cdl, as in (5). Because the double layer capacitance has a large value, its contribution is
negligible. The value of Cs depends of the thickness of the modified layer and its dielectric
constant given in (6), where ε is the relative dielectric constant, A is the electrode area and d is
the layer thickness [53]. Because of the roughness of the electrode and other non-idealities of
the surface, the system is modeled instead as a constant phase element with impedance Yo (j
ω)-n. Yo is a proportionality constant, j=√−1 and n is -1<n<1, but it is typically between 0.7 and
0.9 [54].

15
1𝐶
= 1𝐶𝑑𝑙
+ 1𝐶𝑒𝑙𝑒𝑐
+ 1𝐶𝑠
(5)
𝐶𝑠 = 𝜀𝜀𝑜𝐴𝑑
(6)
The values of C, Rs and Rct can be estimated using the Nyquist plot as seen in Figure 6.
Rs and Rct are obtained from the intercept with the Z' axis and C from the value of ω (2πf) at the
value of Z" max. At low frequencies diffusion affects the mass-transfer control process, this is
the Warburg impedance, Zw with a phase of 45°.
Figure 6 Nyquist plot for the equivalent circuit in Figure 5a.
1.4.2 The Double Layer Capacitance
When a metal electrode is polarized and is in contact with an ionic solution it attracts
ions of opposite charge. Hence, an excess of ions buildup at the interface. Because of the
accumulation of these ions at the interface, their concentration in the electrolyte decays
exponentially and also the electric field produced in the vicinity of the metal/electrolyte interface
[51]. This interface can be described as a capacitor whose plates are the metal surface and the
ions adsorbed at the surface, which is commonly known as the Helmholtz layer. An adsorbed
layer of water molecules at the interface separates the ions from the solid surface. The
Helmholtz layer is formed by two planes: the inner Helmholtz plane formed by solvent molecules
or ions in direct contact with the metal (i.e. specifically adsorbed), and the outer Helmholtz plane
0.0E+00
2.5E+04
5.0E+04
7.5E+04
0.0E+00 2.5E+04 5.0E+04 7.5E+04 1.0E+05 1.3E+05
-Z"/
ohm
*cm
2
Z'/ohm*cm2
Rs+Rct
ω=1/RctC
ωω
0∞
16
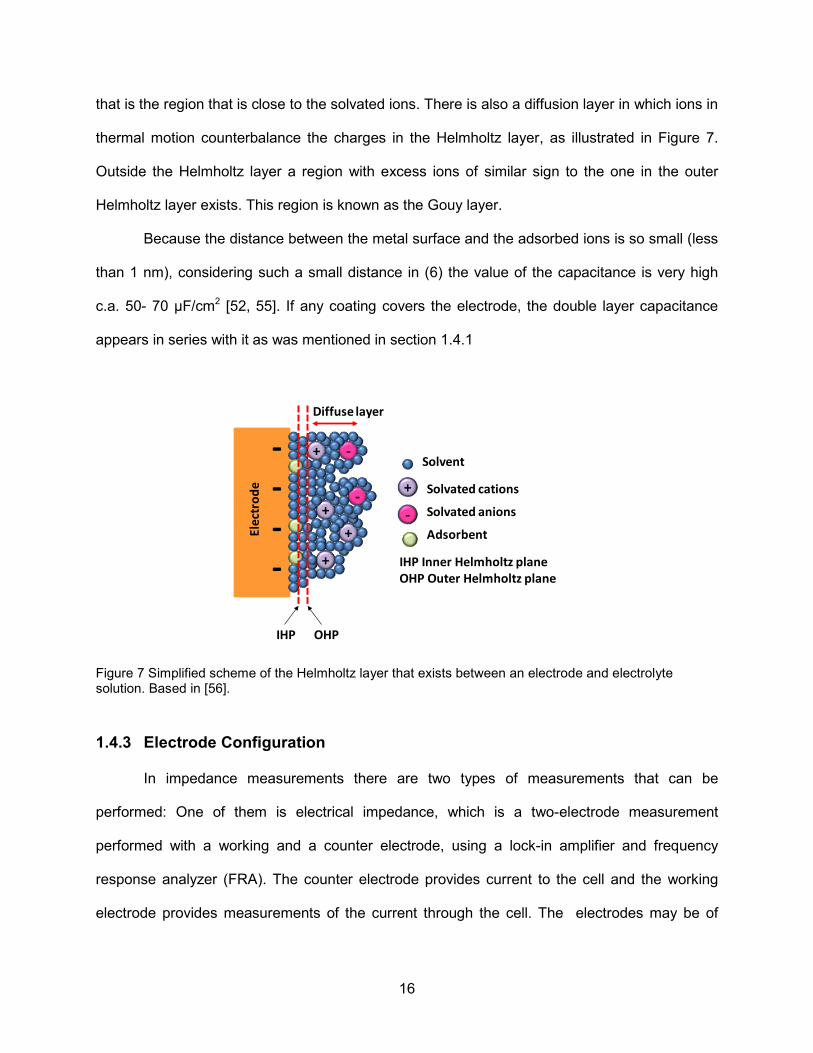
that is the region that is close to the solvated ions. There is also a diffusion layer in which ions in
thermal motion counterbalance the charges in the Helmholtz layer, as illustrated in Figure 7.
Outside the Helmholtz layer a region with excess ions of similar sign to the one in the outer
Helmholtz layer exists. This region is known as the Gouy layer.
Because the distance between the metal surface and the adsorbed ions is so small (less
than 1 nm), considering such a small distance in (6) the value of the capacitance is very high
c.a. 50- 70 μF/cm2 [52, 55]. If any coating covers the electrode, the double layer capacitance
appears in series with it as was mentioned in section 1.4.1
Figure 7 Simplified scheme of the Helmholtz layer that exists between an electrode and electrolyte solution. Based in [56].
1.4.3 Electrode Configuration
In impedance measurements there are two types of measurements that can be
performed: One of them is electrical impedance, which is a two-electrode measurement
performed with a working and a counter electrode, using a lock-in amplifier and frequency
response analyzer (FRA). The counter electrode provides current to the cell and the working
electrode provides measurements of the current through the cell. The electrodes may be of
+
+
+
+
-
-
----
IHP OHP
+
-
Solvent
Solvated cations
AdsorbentElec
trod
e
IHP Inner Helmholtz plane OHP Outer Helmholtz plane
Solvated anions
Diffuse layer

17
equal or different area [48, 57]. A two-electrode measurement is used to measure high
impedance materials where the impedance of the cables is not significant [48].
The other type of impedance measurement is electrochemical impedance, which is a
three or four electrode measurement, with a working, counter and reference electrode. The
three-electrode measurement set-up is typically used in corrosion experiments while the four-
electrode measurement technique is used with low impedance materials and to compensate for
any voltage drop due to connections to the working electrode. Since the measurement is
performed using a potentiostat, the reference electrode is used to reference the interrogating
voltage that is applied to the cell [57]. In Figure 8, we present the basic instrumentation and set-
up for an electrical/electrochemical measurements.
Figure 8 Illustration of the basic setup for the measurement of electrical or electrochemical impedance spectroscopy. A two-electrode impedance biosensor is shown connected to the FRA.
In an electrochemical cell the reference electrode maintains a fixed electrical potential
between the working electrode and the solution. This allows a known voltage to be applied. A
standard hydrogen electrode is the preferred option but a piece of wire can be used as a
pseudoreference electrode and provides for a reproducible and stable potential in the cell [58].
Frequency response analyzerPotentiostat
Reference electrode
Proteins in electrolyte

18
1.4.4 Electrochemical Immunosensor
Electrochemical immunosensors are based on the detection of an immunoreaction using
as a transduction method such as amperometry, potentiometry or conductometry which
measures current, electrical potential or conductivity, respectively.
1.4.4.1 Amperometry Based Immunosensors
The principle of amperometric sensors is based on the measurement of a current flow
generated by an oxidation-reduction reaction (redox) at a constant applied voltage. Since many
proteins are not able to act as redox partners in electrochemical reactions, a catalyzing label of
a redox chemical reaction is the target analyte at the sensing electrode [36, 59]. Enzymes such
as horseradish peroxidase and glucose oxidase have been used as labels [60]. Some of the
most popular amperometric sensors includes glucose electrodes and the detection of
Escherichia coli in bacterial contamination of food [61, 62]
1.4.4.2 Potentiometry Based Immunosensors
Potentiometric biosensors measure the variation in charge-density on the surface of the
electrode after a molecule has been bound to a surface or a catalytic process has taken place
on it. This type of sensor operates at constant (almost zero) current [63]. Ion-selective field
effect transistors (ISFET, a modified MOSFET) are based on the interaction of H ions from the
solution and the surface of an insulating layer that induces an electric field in the transistor
substrate between the source and drain. The substrate potential also changes with different
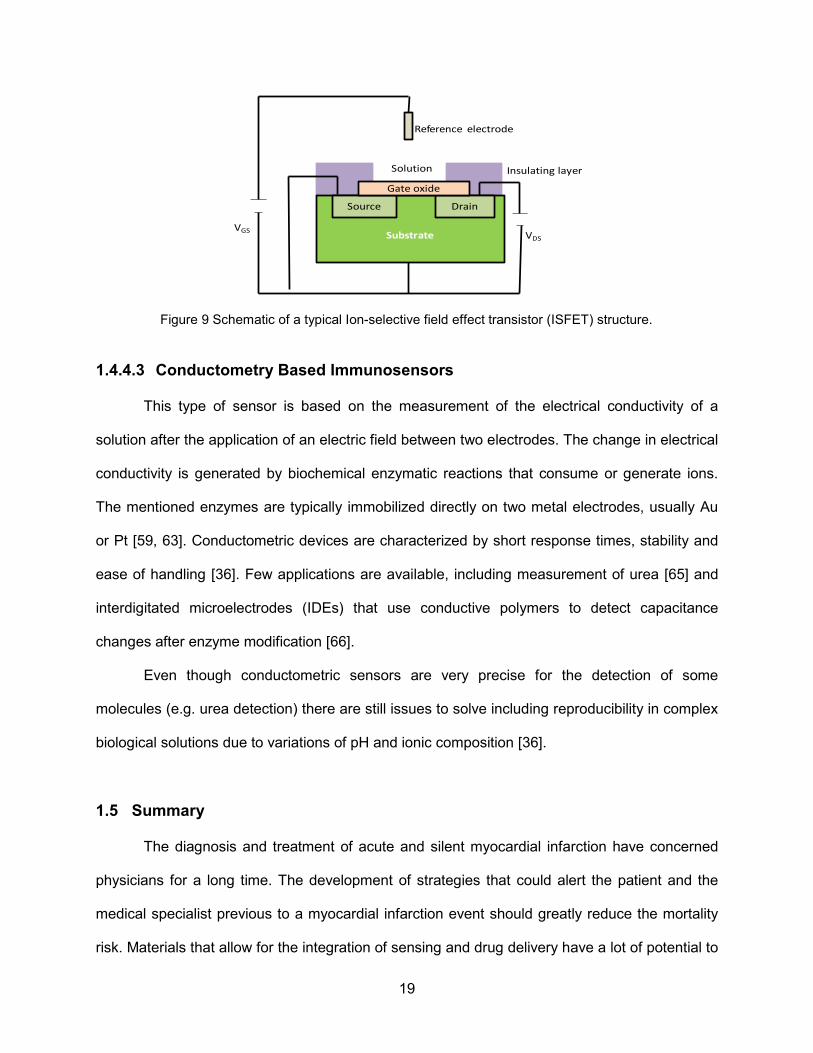
analyte concentrations [59, 63]. An illustration of the basic structure of an ISFET device is
presented in Figure 9.
Some of the applications include enzymatic-based reactions to detect urea, glucose
oxidase, urease and pathogen detection [62, 64].
19
Figure 9 Schematic of a typical Ion-selective field effect transistor (ISFET) structure.
1.4.4.3 Conductometry Based Immunosensors
This type of sensor is based on the measurement of the electrical conductivity of a
solution after the application of an electric field between two electrodes. The change in electrical
conductivity is generated by biochemical enzymatic reactions that consume or generate ions.
The mentioned enzymes are typically immobilized directly on two metal electrodes, usually Au
or Pt [59, 63]. Conductometric devices are characterized by short response times, stability and
ease of handling [36]. Few applications are available, including measurement of urea [65] and
interdigitated microelectrodes (IDEs) that use conductive polymers to detect capacitance
changes after enzyme modification [66].
Even though conductometric sensors are very precise for the detection of some
molecules (e.g. urea detection) there are still issues to solve including reproducibility in complex
biological solutions due to variations of pH and ionic composition [36].
1.5 Summary
The diagnosis and treatment of acute and silent myocardial infarction have concerned
physicians for a long time. The development of strategies that could alert the patient and the
medical specialist previous to a myocardial infarction event should greatly reduce the mortality
risk. Materials that allow for the integration of sensing and drug delivery have a lot of potential to
Substrate
Source Drain
Gate oxide
VDSVGS
Insulating layer
Reference electrode
Solution
20
replace current diagnostic techniques. Semiconductor materials are ideal candidates as the
substrate of such devices since they allow for the integration of ‘system on a chip’ platforms. In
this work we present a study of the use of the electrical, chemical and polytypic properties of
silicon carbide to build a sensor to diagnose acute myocardial infarction. Because this material
has also shown biocompatibility and hema-compatibility properties, which will described in
Chapter 2, there is a possibility that with the appropriate configuration it can be used in
implantable applications to accurately detect silent myocardial infarction in real-time.
In this chapter we described the basic principles involved in building an immunosensor
device for the mentioned purpose. Since this technique is based in cardiac biomarker
recognition by an antibody, we explained the process to bind antibodies to a substrate and the
basics of impedance spectroscopy as the technique to detect protein binding on the sensor
structure.
This dissertation has been organized by chapters. In Chapter 2 we provide a short
literature review regarding the versatility of SiC as a biosensor and biocompatible material. In
addition, the physics principles behind building a potentiometric biosensor for detection of
myocardial infarction are described. We explain the dynamics at the electrolyte/semiconductor
interface and how the energy levels in the material are affected by it.
Chapter 3 covers the application of self-assembled monolayers (SAMs) on SiC, as the
first layer in the immunosensor construction. We explore the use of SAMs, both to increase cell
proliferation on 6H-SiC and to immobilize anti-myoglobin on 3C-SiC for the detection of
myoglobin, one of the biomarkers related to myocardial infarction. We employed surface
characterization techniques such as: XPS, AFM and surface water contact angle to characterize
the functionalized surfaces and the quality of the anti-myoglobin immobilization process on 3C-
SiC and the cell morphology on modified 6H-SiC.
Chapter 4 presents an overview of the development of a potentiometric sensor using 3C-
SiC as the platform. We investigate the changes in the flat band potential of 3C-SiC after the

21
surface modification with aminopropyltriethoxysilane (APTES) and the immobilization of different
concentrations of myoglobin. We use Mott-Schottky plots and impedance spectroscopy to study
the changes in the space charge region of the semiconductor that are affected by the charges of
the antibodies and proteins immobilized on its surface. Finally, Chapter 5 covers the
conclusions and future work that will lead into the construction of long-term cardiovascular SiC
sensors.

22
2 CHAPTER 2: FUNDAMENTALS OF SILICON CARBIDE BASED IMMUNOSENSOR
2.1 Note to Reader
Parts of this chapter have been previously published [67] and are utilized with
permission of the publisher.
2.2 SiC as a Biomaterial for Biosensors
The realization of bioelectronic devices based on wide bandgap (WBG) compound
semiconductors has shown increased interest in recent years. The application of such materials
for the realization of field effect transistors (FETs) [68, 69] are just one example of the
multifunctional properties that make them promising materials in the fabrication of high
performance microelectronic devices to interface with biological systems. One of the main
concerns in materials research for biomedical applications is the search for materials that
produce low or no adverse reaction when implanted in the body and that can therefore be
implanted long-term. In the field of semiconductors, silicon (Si) has always been the preferred
substrate material for micro-devices due to its low-cost and high-quality. However, it presents
several drawbacks that limit its use in biomedical applications. Si has been used in Ion Sensitive
Field Effect Transistors (ISFETs) for interfacing with neuronal networks or living tissue [70, 71].
Nevertheless, the implantation of a Si Utah probe in a cat's brain has resulted in a
chronic astroglial response that limits the time of functionality of the device [72]. The fact that Si
is also opaque to visible wavelengths limits its applicability in certain fields (e.g. retinal implants)
and may be undesired in others, where optical inspection/sensing might be required (e.g.
23
labeled biomarker detection). In general, the properties of WBG materials are superior to those
of Si for biological applications, and can yield long-term stability under chemically harsh
environments and physiological conditions [69]. A few examples of the extensive use of some
WBG materials in the biomedical field include: GaN and AlGaN which have proven to be
chemically stable and naturally biocompatible [73]. AlGaN, AlN and ZnO present piezoelectric
properties ideal to build resonator devices for high mass sensitive sensor devices and for
biosensor applications [74, 75].
AlN-based light emitter devices (LEDs) are expected to emit in the deep UV (wavelength
~ 210 nm) which makes it appealing for the detection of small toxic and cancer causing particles
[76]. Silicon carbide (SiC) possesses good biocompatibility [5, 77-79] in addition to high
chemical inertness and can be used to make different types of electronic devices with similar
processes used in Si processing. For example, gas sensors [68, 80] have been built, strong
needles for organ transplantation monitoring [10] and Schottky devices for high power
applications, which are commercially available [81], among others.
In this chapter we present a survey of the progress in SiC biosensor related research
and the basics of semiconductor/electrolyte physics involved in semiconductor immunosensor
construction.
2.2.1 SiC Polytypes, Synthesis and Preparation
SiC is a material that consists of the covalent bonding of Si and C atoms, in a
tetrahedron form in which Si (or C) is the central atom. The high mechanical and chemical
stability of the material are determined by the very short bond length, shown in Figure 10 and,
hence, a very high bond strength is present in the SiC structure [82, 83]. It belongs to the class
of wide band gap (WBG) semiconductors with band gap energy from 2.4 to 3.2eV depending on
the polytype.

24
Figure 10 All SiC crystals are formed via bi-layers of C and Si, covalently bonded to form a tetrahedron that forms the basic building block of SiC, adapted from [84].
SiC can be formed in amorphous, polycrystalline and monocrystalline solid forms. It has
more than 200 polymorphic forms, called polytypes, but 3C-SiC, 4H-SiC and 6H-SiC are the
most readily grown and can be purchased on the market. The stacking order of the double
layers of Si and C atoms defines the different polytypes of SiC. In Figure 11, the three different
positions that the stacking sequence assumes in the lattice are reported as A, B and C, where k
and h denote crystal symmetry points that are cubic and hexagonal, respectively. For example,
3C-SiC (or β-SiC), is the cubic form where the 3 delineates that 3 bi-layers of Si-C are needed
to form the basic structure and C indicates that the crystal form is cubic. This polytype presents
an ABC… sequence (Figure 11far right). 4H-SiC and 6H-SiC (α-SiC) are the hexagonal forms,
where the 4 and 6 delineate that 4 and 6 bi-layers are needed while the H indicates that the
crystal form is hexagonal. They have stacking sequences that are ABCB (Figure 11far left) and
ABCACB (Figure 11 middle) for 4H-SiC and 6H-SiC, respectively.
Figure 11 Atomic stacking sequence of the relevant SiC polytypes viewed in the 11-20 plane. From left to right, 4H-SiC, 6H-SiC, and 3C-SiC, adapted from [84].
C
Si
C C
1.89 Å
3.08 Å
A
B
C
B
A A A
B B
C C
AA
B
C
k
k
kk1
k2h
h

25
Amorphous silicon carbide, denoted typically as a-SiC, is inherently insulating, it has
high-K dielectric properties, high wear resistance, and works well as a durable coating, which is
the product of the amorphous microstructure and low deposition temperatures used. The lower
deposition temperature prevents any dopants that may be present during the deposition process
from being electrically activated [85]. a-SiC is now being used as an inert encapsulating coating
for in vivo prosthetics and it has been approved for commercial use as a coating for heart stents
[86]. The deposition of a-SiC can be performed in a number of ways. including sputtering,
chemical vapor deposition (CVD or PECVD) , and pulsed laser deposition (PLD) [85].
Polycrystalline materials consist of several small crystalline regions, called grains or
crystallites, bonded together by crystallographically defective regions called grain boundaries.
Grain formation in polycrystalline films grown using CVD processes is sensitive to several
parameters such as temperature, deposition rate, dopant concentration, pressure, and impurity
concentration. Unlike single-crystal SiC, poly-silicon carbide, or poly-SiC, can be grown on a
wide variety of substrates, at lower temperatures (500–1,200 °C), and a wider set of processes
exist compared to monocrystalline epitaxial film growth. Poly-SiC growth has been
demonstrated on widely used surface micromachining substrates such as Si, Si3N4, and SiO2
[87]. Likewise, the deposition of a poly-Si seed-layer on oxide to realize MEMS structures such
as cantilevers and membranes can be easily released leaving behind high-quality 3C-SiC
structures [88]. For the crystalline form of SiC the dominant application is power electronic
devices, where the crystal of choice is 4H-SiC due to it having the highest band gap (3.2 eV)
while 6H-SiC is ideally suited for solid-state lighting (LEDs) as its lattice constant is close to that
of the GaN family of alloys used in advanced LEDs [84].
2.2.2 SiC a Unique Material for Biosensing
SiC’s electrical, mechanical and thermal properties determine its suitability as a
biomaterial and biosensing substrate. It possesses high thermal conductivity, on par with copper

26
at room temperature [89], its Young's modulus is higher than that of Si, and its high breakdown
field ~ 2 MVcm-1 [90], is double than that of Si. SiC has been recognized as a viable material for
applications involving high temperatures or hostile environments [89]. The chemical inertness of
SiC suggests a high resistance to corrosion in harsh environments such as body fluids. In
addition, its high elastic modulus, and low friction coefficient [91], make SiC an ideal material for
smart-implants and in-vivo biosensors [92].
Compared to other semiconductors, SiC's wide band-gap increases its sensing
capabilities. For instance, 4H-SiC presents a bandgap of 3.23 eV thus greatly reducing the
number of electron-hole pairs formed from thermal activation across the band-gap, which allows
high temperature operation of SiC sensors (indeed the intrinsic carrier concentration of SiC is
~10-6-10-8 cm-3 while for Si is ~1010 cm-3, more than 16 orders of magnitude lower than Si [91,
93, 94]). In addition to the fact that its refractive index is greater than that of other materials,
such as diamond, its transparency to visible light and UV wavelength absorption, make it an
ideal material for optical-based biosensing devices [95].
One of the main biomedical applications of SiC has been as a hard coating for non-
fouling coronary heart stents [6, 7, 96, 97]. In-vitro and in-vivo tests done by Amon et al. showed
that a-SiC on stainless steel stents had no cytotoxic reaction to L929 mice fibroblasts, and that
there was no thrombus formation on stented vessels after blood perfusion for three days [98].
Moreover, they found that fibrin formation was significantly reduced at the a-SiC surface as
compared with 316L stainless steel heart stents. Rzany et al., exposed both 316L stainless steel
uncoated and coated with a-SiC to circulating human blood for 15 min, and observed a dense
fibrin network with incorporated blood cells on the metallic surface whereas only single thrombi
and erythrocytes were observed on the a-SiC-coated surface [6]. In a two-year clinical study
that was conducted on 300 patients using the BIOTRONIK (Germany) Tenax stent covered with
a-SiC, the authors concluded that a-SiC stents significantly reduced early and late coronary
events, possibly due to the attenuation of progressive endothelial cell growth at the site of

27
intervention [97]. Several studies found similar results when implanting a-SiC stents with low
rates of death, emergency revascularization, stent-related myocardial infarction and stent
thrombosis [99-101]. For a complete review in the topic see [7].
SiC is also considered a popular material to be used as a passivation layer for prosthetic
bone and hip implants. Biomorphic SiC ceramics are very promising as load bearing and base
materials for dental and orthopedic implants, mainly due to its excellent mechanical properties.
Will et al. [102] used biomorphous SiC that was processed from sipo wood by heating in an inert
atmosphere and infiltrating the resulting carbon replica with a liquid silicon melt at 1450°C. After
performing in-vitro experiments using simulated body fluid, the authors observed the formation
of a bone-like apatite reaction layer on the biomorphic SiC surface [7]. On the other hand,
Santavirta et al. [103] investigated the cytotoxicity of Ti based pins for hip replacement implants
compared to coated SiC-Ti pins. By using a colony outgrowth inhibition test of JCRB0603 cells,
they found that SiC-Ti particles did not inhibit colony outgrowth [103]. In their work, Saki et al.
[104] investigated the viability and cell attachment of osteoblast like cell (Saos-2) on a ceramic
bio-scaffold of hydroxyapatite-alumina and SiC (HA-Al2 SiC). Cell growth and viability studies
using trypan blue showed that the scaffold is able to support osteoblast attachment and growth,
with 89% of the cells harvested alive on the scaffolds compared to 97.5% of the cells harvested
from tissue culture polystyrene after one week. [104].
It has been reported in the literature that some SiC-based whiskers and powders show a
certain degree of toxicity [105]. For this reason, it is necessary to understand what form of SiC is
needed for a particular application because SiC shows different biocompatibility trends
according to the SiC type and the organism that it is brought in contact with [5]. Svensson et al.
have studied the toxicity of asbestos and compared the hazardous crocidolite to SiC whiskers
by studying the cloning efficiency of V79 cells [105]. These authors concluded that if the
materials are not handled or processed properly they can exhibit high cytotoxiciy levels,
dependent also on the concentration of the material. Nevertheless, Rödelsperger and Brückel
28
demonstrated that carcinogenicity of SiC based particles is related to the shape and size of the
fragments; whiskers being carcinogenic while granular SiC has a lower carcinogenic potency
[106]. Bluet et al., reported on a selective cytotoxicity of 3C-SiC QDs in-vitro to epithelial and
cancer cells. They investigated AT-84 cells, derived from oral squamous carcinoma as well as
HSC-2 cells and S-G cells which are immortalized gingival epithelioid cells. The authors
observed that significant changes of the AT-84 cells occurred after incubation with the SiC-QDs
with indented borders and irregular shapes. Using MTTs assays they were able to show that
treatment of the cells with 10 µg/ml and 50 µg/ml of NPs did not affect their viability after 72 hrs,
however this was not so for the immortalized epithelioid cell line, which suggests the potential of
SiC QDs as anti-tumoral agents [107].
Other authors have found that the effect of single crystalline SiC on cells or tissues
proved to be non-invariant. The fact that SiC can be formed in different polytypes, as explained
before, could be one of the reasons for this behavior. For instance, Colleti et al. tested the
biocompatibility of crystalline SiC using in-vitro techniques with B16-F10 mouse melanoma, BJ
human fibroblast, and human keratinocyte (HaCaT) cell lines, and found that there was
qualitatively no difference between 3C, 4H- and 6H-SiC in terms of cell viability and proliferation
[77]. An in-vitro study performed by Frewin et al. on 3C-SiC and nanocrystalline diamond with
PC12 (rat pheochromocytoma) and H4 (human neuroglioma) cell lines showed superior
lamellipodia permissiveness on 3C-SiC compared to Si. But the cells on the other polytypes,
6H- and 4H-SiC, showed reduced cell viabilities and substrate permissiveness [78, 108]. The
same group also investigated biocompatibility of 3C-SiC in-vivo using C56BL/6 mice. They
compared the response of 3C-SiC against Si at 5, 10, and 35 days after implanting the materials
in a wild-type mouse’s brain. Using CD45 dye to observe the activation of microglia and
macrophages, the authors showed that the 3C-SiC surfaces revealed limited immunoresponse
and significantly reduced microglia compared to the Si substrate [109].
29
It has also been determined that less biofouling and platelet aggregation occurred on
3C-SiC when exposed to blood, which can be an advantage for bioelectronic device fabrication.
Schettini et al., concluded that 3C-SiC is a hema-compatible material compared to 4H- and 6H-
SiC which did not show the same behavior. In fact 4H- and 6H-SiC were similar to Si, a known
non-hema-compatible material [110]. The different responses of the skin, brain and blood cells
to the three popular SiC polytypes may be attributed to the surface charge, roughness and the
chemical properties of the surface. Clearly it is very important to know which form of SiC is
being exposed to biological matter as it may indeed affect the biological response.
Finally, implantable biosensors formed from 3C-SiC, while bio-benign, must also adopt
approaches to address the challenges of chronic indwelling biocompatibility. Among these are;
design approaches that eliminate sharp edges that will otherwise be a source of tissue irritation
that provoke the inflammatory response [111], surface modification with biomimetic chemistries
such as polyethylene glycol (PEG) and methacryloyloxyethyl phosphorylcholine (MPC) that
have been shown to resist extracellular matrix protein adsorption/denaturation [112, 113], the
use of bioresponsive hydrogels [114] in support of the chronic release of anti-inflammatory and
immunosuppressant drugs such as dexamethasone [115, 116] and the release of factors such
as vascular endothelial growth factor (VEGF) that promotes vascularization [117] and basic
fibroblastic growth factor (bFGF) that promotes angiogenesis [118]. These approaches are
among those actively under investigation as a means to limit fibrotic encapsulation [119] of
implantable biosensors [120].
The major advantages of 3C-SiC in biosensor applications are its chemical inertness
and thus likely robustness to wear and oxidative degradation following implantation. The ease
and reproducibility of quantitative surface modification and functionalization also supports
quantitative immobilization of biomolecules leading to high reproducibility and a likely low
coefficient of variation in bioanalytical applications. The principal disadvantage is its cost due to
the high growth temperatures needed to form the material as well as the lack of wet-chemical

30
etching (indeed, a benefit in terms of material stability) which poses some challenges in the
device fabrication arena.
2.2.3 Biosensor Configurations Employing SiC
From the device design perspective, SiC has been considered an ideal material for
power devices and systems. However, as we have described in the previous sections, its
properties also make it suitable for biomedical applications. For the construction of biological
MEMs devices, 3C-SiC is the material of choice because it is less expensive, less polar than
other SiC polytypes and is grown on Si which permits the implementation of the processing
techniques used for that material [121, 122].
Depending on the device to be built, the different forms/polytypes of SiC provide specific
advantages.
Table 1 Main sensors application and SiC polytype and requirements, adapted from [95]. Device application SiC polytype/form Material criteria for application
Biomedical sensors
Semi-insulating hexagonal polytype (4H-SiC /6H-SiC)
• Transparency • Low leakage (at room
temperature) Porous hexagonal polytype (6H-SiC)
• Thick free standing layers
SiC (amorphous) coating • Biochemical inertness Hall and temperature sensors
Semi-insulating 4H-SiC with epilayer
• Low leakage (at high temperature)
MEMs-NEMs resonators Heteroepitaxial (3C-SiC) • Low gradient and in-plane stress Pressure sensors, accelerometer, HT gas sensors
Heteroepitaxial (3C-SiC) • Low gradient and in-plane stress • Appropriate electrical
characteristics
For instance, for biomedical devices that require low leakage and/or biochemical
inertness one polytype may prove to be superior while films needed for the construction of
MEMs devices demand certain mechanical properties and processing tools that may favor a

31
difference polytype. In Table 1 we provide a list of the typical applications with the potential for
success and the material type recommended, based on the work of [95].
2.2.3.1 Electrically-Based SiC Biosensors
The electronic properties of SiC have made it a suitable material for biomedical devices,
especially those that are based on a surface impedance change or are electrochemistry related.
For these particular applications, doping level, surface termination and choice of SiC polytype
play an important role, since the background current and voltammetric reactivity of SiC
electrodes would be affected. When SiC is appropriately doped, the conductivity of this material
dramatically increases and exhibits electrical characteristics similar to carbon materials [123].
But in contrast to carbon, the close-packed hexagonal or cubic-SiC structure should afford a
well-defined surface for electron transfer [124]. Thus, the use of doped SiC as an electrode
material has not been widely researched for electrochemistry based applications. In the work
performed by Hume and Kolthoff, a SiC electrode was used as an oxidation-reduction indicator
electrode in potentiometric titrations of potassium iodide with permanganate and with ceric
sulfate of ferrous iron with permanganate, of titanous chloride with ferric chloride, and of
hydrochloric acid with sodium hydroxide [125]. The electrodes were made with single crystal
SiC and their behavior was studied by measuring their potential against a calomel electrode.
The authors concluded that the SiC electrode behaved similarly to an oxidation-reduction
indicator material such as Au and Pt. Meier et al. implemented a chemical vapor deposition
method using tetramethylsilicon and a resistively heated carbon fiber to produce a concentric
SiC conductor that proved to be suitable for voltammetric measurements [126]. They found that
the SiC electrode in 0.1 M H2SO4 showed a wide potential window, free from interference from
+1.4 V to -1.2 V vs. a Ag/AgCl electrode.
Singh and Buchanan built a SiC-C fiber electrode for detection of electroactive
neurotransmitters, namely dopamine and vitamin C [127]. The fabrication of this electrode was

32
based on an electrolytic etching technique developed by the authors. The SiC provided
insulation near the carbon tip and highly localized charge transfer, stiffness and protection by
inhibition of O2, H2O and ionic diffusion. The sensing of dopamine hydrochloride and vitamin C
was done by voltammetric and impedance spectroscopy techniques, monitoring oxidation
currents that varied linearly with their concentration. They also recorded in-vivo action potentials
from anesthetized rat brains with very high signal to noise ratio. Wu et al. also worked on the
detection of ascorbic acid (AA) and dopamine (DA) [128]. In their study they were able to
resolve the overlapping voltammetric responses of AA, DA and uric acid (UA) on a SiC-coated
glassy carbon (GC) electrode, and the selective determination of DA in the presence of AA and
UA with a sensitivity of 16.9 A M-1 cm-2 and a detection limit of 0.05 μM [128].
Salimi et al. used SiC nanoparticles to modify a GC electrode to detect insulin
concentrations via electrocatalytic oxidation [129]. Using cyclic voltammetry, differential pulse
voltammetry (DPV) and flow injection analysis (FIA), the authors found a dynamic linear range
of detection up to 600 pM, sensitivity of 710 pApM-1cm-1 and a detection limit of 3.3 pM. Their
electrode demonstrated high sensitivity, excellent catalytic activity, short response time, and
long term stability [129]. A superoxide dismutase (SOD) biosensor based on SiC nanoparticles
has been reported by Rafee-Pour et al. The characterization and analytical performance of the
biosensor was based on direct voltammetry and amperometry of immobilized SOD onto the
surface of a GC electrode modified with SiC nanoparticles. They found that the response of the
sensor was stable after 24 hrs. of storage in a pH 7 solution, perhaps due to the chemical
stability of the SiC film. In addition, they demonstrated that the sensor presented a sensitivity of
1.46 nA*μM-1 and 1.375 nA*μM-1 with a detection limit of 1.66 μM and 1.4 μM for cathodic or
anodic detection of superoxide, respectively [130]. In the recent years, research has been
focused on the detection of DNA bases via electrochemical methods on SiC modified sensors.
Ghavami et al. implemented a glassy carbon (GC) electrode modified with SiC nanoparticles for
simultaneous determination of DNA bases using differential pulse voltammetry (DPV) [131].
33
They found that no specific electron transfer mediator or reagent was necessary to build the
biosensor. The detection limit of the GC/SiC electrodes toward guanine (G), adenine (A),
thymine (T) and cytosine (C) determinations were 0.015, 0.015, 0.14, and 0.14 μM, respectively
and the sensitivities were 0.3877 0.3289 0.0175 and 0.0499 µA/ μM, respectively. The sensor
exhibited good stability, reproducibility and long lifetime [131]. Yang et al. presented the surface
modification of nanocrystalline SiC with diazonium salts via electrochemical methods for later
DNA bonding with a nitrophenyl film to the modified electrodes [132]. They showed that the
modified electrode presented a wider potential window and lower background current than GC
electrodes. The authors also demonstrated successful DNA immobilization on the modified SiC
surfaces using Cy5 labeled cDNA with increased red fluorescence on the nitrophenyl|SiC
surfaces compared to the bare SiC. Likewise, the voltammogram of hybridized DNA indicated
the presence of target DNA [132].
Godignon's group has focused their efforts on developing temperature and impedance
based sensors on SiC. Mainly needles for open heart surgery monitoring or graft monitoring of
organs during transplantation and transportation. They concluded that the control of the surface
properties of the material is a challenge when building biomedical devices [95] . Their
impedance microsystem consisted of four Pt electrodes on an isolated semi-insulating SiC
substrate. A Pt serpentine conductor served as the temperature sensor with the aim of
distinguishing impedance changes due to either tissue or thermal effects. In their work, the
authors also identified the advantages and potential of using SiC for DNA polymerase chain
reaction (PCR) electrophoresis chips because of the high electric field strength and resistivity of
semi-insulating SiC, in addition to its high thermal conductivity [95]. The same group expanded
the description of myocardial ischemia monitoring probes and transplantation organ/tissue
ischemia monitoring with SiC impedance based needles in the articles by Pascual et al. [133],
Gabriel et al. [10] and Gomez et al. [134]. The article by Pascual et al. focuses on the

34
fabrication, packaging and mechanical properties of the devices for such application, whereas
the last two also consider the electrical characterization of the probes.
In their study, Pascual et al. described the fabrication of the needles on both 6H-SiC and
4H-SiC wafers with four Pt electrodes insulated from the substrate and passivated with SiO2 and
Si3N4 layers including the temperature sensor structure described above. The mechanical tests
they performed included simulations with ANSYS 5.6 and an INSTRON 4464 system to test
compression and bending of the needles. The authors also determined the forces needed to
penetrate heart tissue. The values obtained were 1.32 N, which was lower than 1.35 N for Si.
Likewise, the maximum bending force that could be applied to the needle tip without breakage
of the same was 17.4 N compared to 16.4 N for Si. The fact that the needles fulfill the
mechanical requirements for this application are an indication of the possibility of using these
types of probes to reduce organ bleeding upon needle insertion [133].
In terms of the benefits of using SiC as ischemia monitoring probes, both Gomez et al.
[134] and Gabriel et al. [10] concluded that there is less leakage current in a SiC impedance
sensor compared to Si-based devices that present current leakage paths across the substrate
at high frequencies (i.e. above 5 kHz), which generates a false impedance change [134]. In fact,
Gomez et al. compared in-vitro experiments of four electrode measurements in 0.09% or 0.9%
NaCl from 10 Hz to 1 MHz with a modified in-vivo system where the probes where placed close
to the cortico-medullar junction of male Wistar rats (Ifa Credo) and measured the impedance in
the 100 Hz to 100 kHz range. They demonstrated that the operating range of SiC-based
impedance probes can be extended up to the 100 kHz range with the possibility of performing
multi-frequency analysis and the creation of more accurate frequency-dependent analytical
models of impedance [134]. Besides performing in-vitro characterization of the device, Gabriel
et al., presented in their article an extensive mechanical analysis of the Si and SiC wafers used
to build their probes [10]. They confirmed the values for hardness, elastic modulus and fracture
toughness of the SiC and Si substrates but also the modulus of rupture for the fabricated

35
probes. They emulated real-life conditions in a deflection test whereby they anchored the needle
at one end and applied force from the nanoindenter on the other. The critical load at which the
SiC needles fractured was 2.5 times higher than for Si needles (1053±200 mN vs. 452±37 mN).
In addition, they found a modulus of rupture 4 times higher for SiC needles than that of Si
needles (774 MPa vs. 188 MPa), which demonstrated the superior mechanical and electrical
properties of SiC for impedance based needle probes [10].
Multi-electrode arrays (MEAs) with semi-insulating 6H-SiC have also been demonstrated
by Godignon et al. In their article, the authors describe the construction of a 16 electrode MEA
with locally grown carbon nanotubes (CNTs) on Pt electrodes to improve the electrode to
medium impedance and growth of neurons on the MEAs. A reduction in the electrode
impedance was obtained with CNTs grown on the Pt electrodes compared to bare Pt
electrodes. In addition uniform CNT growth on SiC based MEAs was achieved because of the
better temperature uniformity on the material.
In the same work the authors describe the material considerations to build a micro-fluidic
chamber with 3C-SiC on silicon-on-insulator (SOI) wafers, for magnetic resonance imaging
(MRI) equipment [121].
The area of Field Effect Transistors (FETs) on SiC has not been significantly exploited
for biological applications. FETs made of SiC can function at high temperatures, in particular
FET-based gas sensors that operate around 1000°C have made use of this property [9]. Also,
prototypes and commercially available devices can be found that operate at very high
frequency, high power and in harsh environments, such as Schottky devices from Infineon
Technologies (Germany) [81], UV flame detectors from General Electric (U.S.A.) [135] and gas
sensors developed by SenSiCAB (Sweden) [136] . The possibility to integrate SiC and grow
other materials on its surface, for example AlN that enables a wider bandgap of ~ 6 eV
(depending on the polytype), allows the integration with resonators on the same chip [68]. Lloyd
Spetz et al. reported the measurement of NO, an interesting gas to measure due to its

36
participation in the metabolism in an individual's breath [137]. They proposed a multifunctional
sensor device with an integrated transistor, resonator and resistivity change measurements. A
heterostructure that may be realized, for example SiC|ZnO, as in Figure 12, can provide
biosensing based on the current change between the source and drain as a function of the gate
voltage after immobilization of biomolecules in the gate area. A FET biosensor of this type,
responsive to EH changes in the environment modulated by a biological reaction, is known as an
ion specific FET (i.e., ISFET) device. An ISFET is in essence a transistor without a gate
electrode that requires an external reference electrode for operation. For this reason, the
authors investigated a preliminary device using a MOS (metal on semiconductor) structure
using Ti/Au, Al2O3 and a Si substrate [137].
Figure 12 Scheme of a sensor device that includes a transistor, a resonator and resistive measurements between the finger electrodes. a) Side view and b) Top view of the device proposed by [137].
2.2.3.2 Optically-Based SiC Biosensors
As was mentioned in Section 2.3, SiC also presents appropriate optical properties to
develop biocompatible optical based detection sensors. In particular, quantum dots (QDs) have
proven to be a growing research field for SiC. QDs are interesting tools for cell tagging because
of their properties including: their size and tunable emission spanning from the ultraviolet to the
near infrared, the high extinction coefficient combined with a comparable quantum yield to
37
fluorescent dyes, and resistance to photo-oxidation (i.e. photobleaching) [138]. Botsoa et al. bio-
imaged living cells with SiC QDs. They fabricated 3C-SiC nanoparticles by means of
electrochemical anodization of a low resistivity 3C-SiC polycrystalline wafer and subsequent
grinding and centrifugation to collect particles less than 10 nm in size. Different concentrations
(0.1 to 2 g/l) of the SiC QD suspension was added to 3T3-L1 fibroblasts and incubated for 15
hrs. and then analyzed with fluorescent microscopy, using UV/violet excitation. The authors
found that the QDs are strongly localized inside the cells, mainly at the nucleus and they noted
a heterogenous distribution of the fluorescent intensity. The cells were also incubated for one
week with QDs and were found to be alive, which evidenced the non-toxic effect of the 3C-SiC
particles to the cells [138]. Another material that is showing good promise as an optical
biosensor substrate is amorphous SiC, or a-SiC.
Caputo et al. have reported on a two-color a-Si/a-SiC photosensor for DNA detection.
The sensor is based in the detection of DNA strands labeled with two fluorochromes (Alexa
Fluor 350 and Cy5) using a p-i-n-i-p a-Si/a-SiC stacked structure that basically detects different
spectral regions depending on the voltage applied to the diode structure [139]. They used a UV
radiation source that excited the biomolecule markers inducing fluorescence; the re-emitted light
that passed through a glass/TCO layer and was absorbed by the a-Si/a-SiC photosensor
producing a photocurrent that was proportional to the quantity of fluorochromes present. In this
work, the authors reported detection limits of 10 nmol/l and 400 nmol/l for Alexa Fluor 350 and
Cy5 labeled DNA strands, respectively [139]. But SiC can also be used for biological imaging in
fluidic environments. Taubner et al. reported the successful development of a 3C-SiC based
superlens for near-field scanning optical microscopy (NSOM) [140]. A free standing 440 nm
thick 3C-SiC film grown on a (100) Si substrate is the core of the superlens with a 220 nm thick
SiO2 film that allows the thin film superlens to be displaced at the required distance (~880 nm)
from the specimen when applying the NSOM technique. The use of a SiC superlens structure
allowed them to enhance the spatial resolution of the subsurface features by a factor of 4
38
compared with near-field imaging without superlensing of the SiC slab. The possibility of
incorporating a 3C-SiC superlens to a microfluidic device could enable in-situ NSOM imaging of
biological samples. An evanescent waveguide structure microfabricated in SiC on Si substrates
was recently reported by Pandraud et al. Interestingly, the relatively large index of refraction of
a-SiC, compared to similarly-deposited Si3N4 and SiO2, enhances the ability of the waveguide
structure to sense chemicals. The authors concluded that surface roughness of the a-SiC is
such that the propagation loss was reduced to 1–5 dB/cm [141].
2.2.3.3 SiC MEMs Biosensors
The mechanical, chemical and electrical properties of SiC that were described in the
previous sections also make SiC an attractive structural material for MEMS and NEMS
applications. SiC MEMs have been typically used in applications that include harsh chemical,
high-radiation or high-temperature environments; for which Si is not suitable. The evaluation of
MEMs materials performed by Kotzar et al., demonstrated the biocompatibility of seven MEMs
materials including single crystal 3C-SiC [79]. The materials were evaluated using a baseline of
the ISO-10993 standard for physicochemical and biocompatibility tests. The main focus of the
article was to understand the effect of sterilization on the material surface and its cytotoxic effect
by culturing L-929 mouse fibroblast cells on the surfaces for 48 hrs. The authors showed that
neither Si3N4 nor SiC elicited significant non-biocompatible responses which renders them
suitable for future BioMEMs applications [79].
The high Young’s modulus of SiC enables the fabrication of wide frequency resonators.
Until now, this has been the main structure developed and studied on 3C-SiC, with cantilevers
or bridge structures that could be very useful for mass detection, gas sensing or biomolecule
identification [95]. SiC membranes vary in thickness and typically a 2 µm-thick membrane is
able to withstand pressures of over 100 PSI without breaking. For practical, long-term
micromachined BioMEMS pressure sensors, one would need to incorporate biocompatible and

39
antifouling characteristics [122]. a-SiC is also an attractive material for MEMS and NEMS
applications because it retains the mechanical and chemical durability of its crystalline
counterparts [142], while being electrically insulating and being processed at much lower
substrate temperatures. Its electrically insulating properties enable its use for dielectric isolation
instead of SiO2 and Si3N4. Typically a-SiC is used as an etch mask for bulk micromachining as
in the work by Iliescu et al. [143] where a-SiC is implemented as a protective mask to increase
the etching resistance towards SiO2 with the aim to fabricate microfluidic channels. In some
cases, a-SiC is used as a planarizing membrane to cover the microchannel. Later, Iliescu et al
studied the use of 2.5 μm low stress a-SiC membranes for cell culture, potentially valuable for
bioMEMs applications. They pre-treated micromachined a-SiC membranes with 40% NH4F and
incubated NIH3T3 fibroblasts for 24 and 48 hrs on the membranes. Using microscopy they
found that the cells proliferated more on the a-SiC membrane than on monocrystalline SiC
[144].
2.3 Electrochemistry of Semiconductors
In this work we aim to use Silicon carbide (SiC) as an electrode that will produce a
change in its electrical properties after protein binding for the diagnosis of acute myocardial
infarction. The use of SiC for this purpose requires the understanding of solid state physics and
electrochemistry because phenomena associated with both disciplines will be seen in the
SiC/electrolyte (e.g. Phosphate Buffered Saline) system. In this section we will present a brief
introduction to the semiconductor physics content related to semiconductor electrochemistry.
2.3.1 Energy Levels in Semiconductors
A semiconductor is characterized by electron energy levels which are described by
energy bands. In all semiconductors there is a forbidden energy region or gap in which energy
40
states cannot exist in the absence of crystal defects. This energy gap (i.e. the semiconductor
band gap) determines the properties of the material. Energy bands are only permitted above
and below this energy gap. The upper bands are called conduction bands and the lower ones
are called valence bands [145].
Electrons can be excited to the conduction band thermally, optically or photochemically.
In order to achieve doped semiconductor films, an additional element is introduced into the
semiconductor such that these processes are satisfied at low temperatures (ideally below room
temperature). For example, the addition of P in a Si crystal introduces occupied energy levels
into the band gap close to the lower end of the conduction band, which allows for an easier
promotion of electrons to the conduction band [146]. Thus P doped Si is n-type due to the fact
that the conduction band is populated with electrons independent of device electrical bias,
surface charge and band bending.
2.3.1.1 Fermi Level and Band Bending
The Fermi level (EF) is defined as the energy level at which the probability of occupation
by an electron is 0.5. A more meaningful way to think of this is that this is the ‘halfway point’,
meaning half of the electrons in the semiconductor are above and half below this value. For an
intrinsic, or undoped, semiconductor the Fermi level is found at the mid-point of the band gap
[146]. If the position of the Fermi level within the bandgap is known, the density of electrons and
holes can be calculated from equations (7) and (8), where EF,n and EF,p are quasi Fermi levels
for electrons and holes, respectively, n and p, are the density of electrons and holes, NC is the
density of states at the lower edge of the conduction band and NV is the density of states at the
upper edge of the valence band [145].
𝐸𝐹,𝑛 = 𝐸𝐶 − 𝑙𝑛 �𝑁𝐶𝑛� (7)
𝐸𝐹,𝑝 = 𝐸𝐶 − 𝑙𝑛 �𝑁𝑉𝑝� (8)

41
At equilibrium, the Fermi level is constant throughout the semiconductor. For an n-type
semiconductor, the Fermi level lies above the midgap level and below the conduction band,
whereas for a p-type semiconductor it is found below midgap and above the valence band (see
Figure 13a. and b.). The Fermi level of a semiconductor varies with the applied potential; for
example, moving to more negative potentials will raise the Fermi level [146].
a.
b.
Figure 13 Fermi level at equilibrium in a) n-type and b) p-type semiconductor. EC and EV are conduction and valence band edges, respectively.
2.3.2 The Electrolyte
Electrical current in liquid electrolytes is carried by ions that are formed by dissociation of
salts like KCl or Na2SO4 in a suitable polar solvent, which is usually water. Both positive and
negative ions are produced by dissociation and are found in equal concentrations in the water.
For reference, electrolyte conductivities > 10-2Ω-1*cm-1 and with ion concentrations of > 10-1 M
are required in order to achieve an adequate level of conductance in an electrochemical cell
[147].
In term of electronic energy levels, an ion or molecule in solution presents a tendency to
release (occupied level) or to accept (free level) electrons when the molecule approaches an
electrode or another ion. The energy level model in electrolytes can be more complicated than
the one of semiconductors, because of the interactions of ions with the solvent and thermal
fluctuations. As a result of thermal fluctuations it is not possible to determine the exact energy of
the ion at a specific time. Hence, ionic energy levels in solutions are described in terms of
probability distributions, similarly to the case presented for semiconductors [148].
EF,n
Ec
EV
Ei EF,p
Ec
EV
Ei

42
In Figure 14 the ideal probability distribution of the energy levels in the electrolyte is
represented by two Gaussian functions centered at Eox (potential of oxidizing species, i.e.,
accepts an electron) and Ered (reducing species, i.e., donates an electron). Eredox refers to a state
where equal numbers of reducing and oxidizing agents are present in solution [148, 149].
𝐸𝑟𝑒𝑑𝑜𝑥 = 12
(𝐸𝑟𝑒𝑑 + 𝐸𝑜𝑥) (9)
Figure 14 Representation of energy levels in a polar solution. Adapted from [148].
An effective Fermi energy in the solution is defined as Eredox. If equilibrium is reached
with an electrode in solution the Fermi energy of the electrode will move to Eredox due to electron
exchange with the redox couple [149]. This is the definition of equilibrium in the
electrolyte/electrode (or semiconductor) system.
2.3.3 The Semiconductor|Electrolyte Interface
The distribution of charge and potential in a semiconductor and an electrolyte when they
are brought into contact is similar to the case described in section 1.4.2. However, given that
semiconductors have lower carrier density than metals, the counter charges described before
are distributed below the interface and a layer known as the space charge region (SCR) in the
Eox
Eredox
Ered
W(E)
E

43
semiconductor is formed [150]. The SCR in the semiconductor is in contact with the Helmholtz
layer in the electrolyte which is followed by the Gouy layer as seen in Figure 15 [149, 150].
Figure 15 Double layer at the semiconductor|electrolyte interface.
The total charge at the semiconductor|electrolyte interface consists of the fixed charge
in the SCR, the surface state charge, the charge of ions adsorbed in the Helmholtz layer and
the ions in the diffuse, or Gouy, layer. The typical thickness of the Helmholtz layer is ~ 0.4-0.6
nm, the SCR is ~10-1000 nm and ~ 1-10 nm for the diffuse layer [150, 151]. Because the
thickness of the SCR depends on the concentration of mobile charge carriers it is proportional to
the Debye length. The Debye length defines the distance over which a charge imbalance (i.e.
caused by an applied electric field) is neutralized by majority carriers under steady state or
equilibrium conditions [152]. The Debye length is approximately 100 nm for semiconductors with
a doping concentration of ~ 1015 cm-3 and around 10 nm in dilute 0.01 M ionic solutions [153].
The capacitance of this interface can be represented as the series capacitances in (10),
where CSC, CH and Cd are the capacitance of the SCR, the Helmholtz and the Gouy layers,
respectively.
1𝐶
= 1𝐶𝑆𝐶
+ 1𝐶𝐻
+ 1𝐶d
(10)
-
-
-
-
+
+
++++
IHP OHP
+
-
Solvent
Solvated cations
Adsorbent
IHP Inner Helmholtz plane OHP Outer Helmholtz planeSCR Space charge region
Solvated anions
Diffuse (Gouy) layer
----
n-type
SCR

44
For highly concentrated electrolytes ( > 0.01 M ) the contribution of Cd can be neglected
[154]. For an ideal semiconductor|electrolyte interface the major potential drop will be across
the space charge layer and the total capacitance of the system will be due to CSC. In addition
the values of CSC are between 0.001-1 μF/cm2 in contrast to those of CH that are between 10-
100 uF/cm2 and the region with the lower capacitance tends to dominate the total capacitance
of the system [155]. In the case when the semiconductor is degenerately doped (i.e. doping
concentration is 1019-1021 cm-3) or when it is in accumulation the system behaves as a
metal|electrolyte interface and CH dominates the total capacitance in the system [151].
2.3.3.1 Space Charge Layer in Accumulation and Depletion
If a potential is applied to a semiconductor electrode in solution a reorganization of
charges takes place until equilibrium is re-established. This means that the Fermi level in the
semiconductor must equal the Fermi level of the solution. The Fermi level in the bulk of the
semiconductor remains constant but the change in potential in the SCR produces a degree of
bending at the edge of the conduction and the valence bands.
Three situations can be identified which are referred to as flat band potential (the bands
are flat), depletion (the semiconductor surface is depleted of mobile charges) and accumulation
(the semiconductor surface is full of mobile charges). When at the applied potential the Fermi
level is equal to the redox potential of the electrolyte the flat band condition is achieved and
there is no band bending (see Figure 16a). The potential is therefore known as the flat band
potential. For an n-type semiconductor, if the applied voltage is anodic (positive potential) the
SCR is depleted of majority carriers, the bands bend upwards and the SCR presents an excess
of fixed positive charge (see Figure 16b). On the contrary, if the voltage is cathodic (negative
potential), there is an accumulation of mobile charges in the SCR and the band edges bend
downwards (see Figure 16c). When the semiconductor electrode is in accumulation it will act

45
like a metal due to the high density of charges at the surface [155]. The thickness of the
accumulation layer is typically close to 10 nm [149].
a)
b)
c) Figure 16 Band bending in an n-type semiconductor a) Flat band potential b) depletion and c) accumulation.
2.3.4 The Determination of the Flat Band Potential Using Mott-Schottky Plots
The measurement of the capacitance across the SCR provides important information
about possible changes in the energy bands of the semiconductor due to the reaction with the
electrolyte or when charged molecules are deposited on its surface. If the position of the band
edges is of interest one can perform capacitance-voltage measurements, also known as Mott-
Schottky plots [151, 155]. The Mott-Schottky relation for an n-type semiconductor is shown in
equation (11). Where ND is the doping concentration, εo is the permittivity of free space, ε is the
dielectric constant of the semiconductor, q is the charge of the electron, T is temperature, k is
Boltzmann’s constant, V is the applied voltage and VFB is the flat band potential at which the
bands are "flat" across the semiconductor-electrolyte interface.
1𝐶𝑆𝐶2
= 2𝑁𝐷𝜀𝜀𝑜𝑞
�𝑉 − 𝑉𝐹𝐵 −𝑘𝑇𝑞� (11)
A plot of 1/CSC2 as a function of the potential (vs. the reference electrode) should be a
straight line with a slope proportional to the doping density and in which the intercept with the V
axis equals the flat band potential [155]. The depletion width can also be determined using
equation (12)
EF
EC
EV
Electrode Electrolyte
Space charge region
EF
EC
EV
Electrode Electrolyte
EF
EC
EV
Electrode Electrolyte
Space charge region

46
𝑊 = 2𝑁𝐷𝜀𝜀𝑜𝑞
�𝑉 − 𝑉𝐹𝐵 −𝑘𝑇𝑞
(12)
It is important to emphasize that there can be deviations from the ideal behavior
presented in this section due to irregularities in the surface including surface roughness [156],
non-uniform spatial doping and the presence of deep donor and acceptor impurities [151, 157].
Also, a contribution from the Helmholtz capacitance [158], ionic adsorption at the surface [159],
presence of an oxide film [160] may also result in non-ideal behavior.
2.4 Summary
In the first part of this chapter we have provided an overview of the major types and
possible applications of SiC for biomedical sensors. The possibility of the integration of other
materials and systems on SiC increases the possibilities to create complex devices that can
perform multiple biomolecule detection and analysis on a single platform. We also discussed
several SiC material properties that put it in the advantage to be used as a biosensor substrate
with respect to other materials. For instance, the remarkable chemical and mechanical
properties, and the fact that SiC can be produced into different forms (e.g. BioSiC made from
wood, a-SiC, nanoporous SiC, etc.), and polytypes (i.e. cubic, rhombahedral and hexagonal)
make it suitable for a wide variety of applications.
After exposing the reasons to use SiC in electrically-based biosensors, the second part
of this chapter dealt with the basics and physics behind the use of the Mott-Schottky technique
which we plan to use to detect myoglobin on SiC sensor surfaces. We describe the principles
behind the semiconductor|electrolyte interface since the measurement is based on the
capacitance changes in the space charge region of the semiconductor. The concepts described
both in this chapter and chapter 1 provide the basics for the promising technique to detect
myocardial infarction using impedance and field effect based SiC biosensors.
47
3 CHAPTER 3: SIC FUNCTIONALIZATION
3.1 Note to Reader
The results presented in this chapter have been published [161-165] and are utilized
with permissions of the publisher ("Reprinted with permissions").
Most biomolecule recognition-based systems require immobilization of specific
molecules with controlled structural order and composition. A viable immobilization approach is
covalent attachment [166]. Surface functionalization provides many advantages in the
development of semiconductor based biosensors, including the control of the interfacial
properties of the substrate material itself. In addition, surface functionalization is one of the main
tools used for covalent biomolecule immobilization. It may be used for imparting molecular
functionality to the substrate, thus enabling sensitivity towards chemical stimuli [167].
Self-assembled monolayers (SAMs) are composed of organic molecules that are
covalently immobilized on the surface of the semiconductor via suitable linker groups [168-170].
In general, hydrogen- (H-) or hydroxide- (OH-) terminated surfaces provide the reactive sites
necessary to obtain high quality monolayers. Hydrosilylation and silanization are two common
surface functionalization processes that have been used extensively on Si substrates [167, 170,
171] and SAMs synthesized in this way have been analyzed in detail, with either suppression or
enhancement of cell spreading and proliferation depending on the identity of the molecular end-
group of the SAM [172].

48
Hydrosilylation of Si typically involves the attachment of long-chain alkenes to the
surface of the H-terminated semiconductor through addition reactions, resulting in formation of
Si-C covalent bonds with the surface [170, 173]. Silanization, on the other hand, requires an
OH-terminated surface which can react with the alkoxy groups of organosilane molecules [167,
173]. The functionalization of SiC is possible using both alkenes and organosilanes, similar to
the processes used for Si, but certain differences in the surface preparation must be addressed
[168, 173-176]. Treating 6H-SiC (0001) with HF creates a nearly perfect OH-terminated surface
[177]. Alkoxylation using alkenes is possible on OH-terminated surfaces via a Markovnikov
addition reaction, but leads to a Si-O-C bonding configuration that is chemically less stable than
direct Si-C bonding [173].
3.2 SiC Chemical Functionalization (SAMs)
Practical studies have been performed by different groups to gain insight into the bio-
functionalization of SiC. Rosso et al. demonstrated successful alkyl monolayers covalently
bound on HF-treated SiC surfaces, including 6H-SiC (0001) and 6H-SiC (0001) and
polycrystalline 3C-SiC, through thermal reaction [173] and UV irradiation [174] with 1-alkenes.
They concluded that the attachment of alkyl chains on the SiC surfaces seemed to occur via the
formation of an ether bond between a thin oxycarbide layer and the second carbon of the
double bond. Their results included very hydrophobic methyl-terminated surfaces on flat SiC,
which they showed to be stable under harsh acidic conditions (e.g., no change in water contact
angle after 4 h in 2 M HCl at 90 °C), while their stability in alkaline conditions (pH 11 at 60 °C)
also superseded that of analogous monolayers such as those on Au, Si, and SiO2. Similarly,
Schoell et al. demonstrated the covalent functionalization of aminopropyldiethoxymethylsilane
(APDEMS) and octadecyltrimethoxysilane (ODTMS) on n-type 6H-SiC (0001) (i.e., Si-face)
surfaces via wet chemical processing techniques [176]. Desorption temperatures in the range of
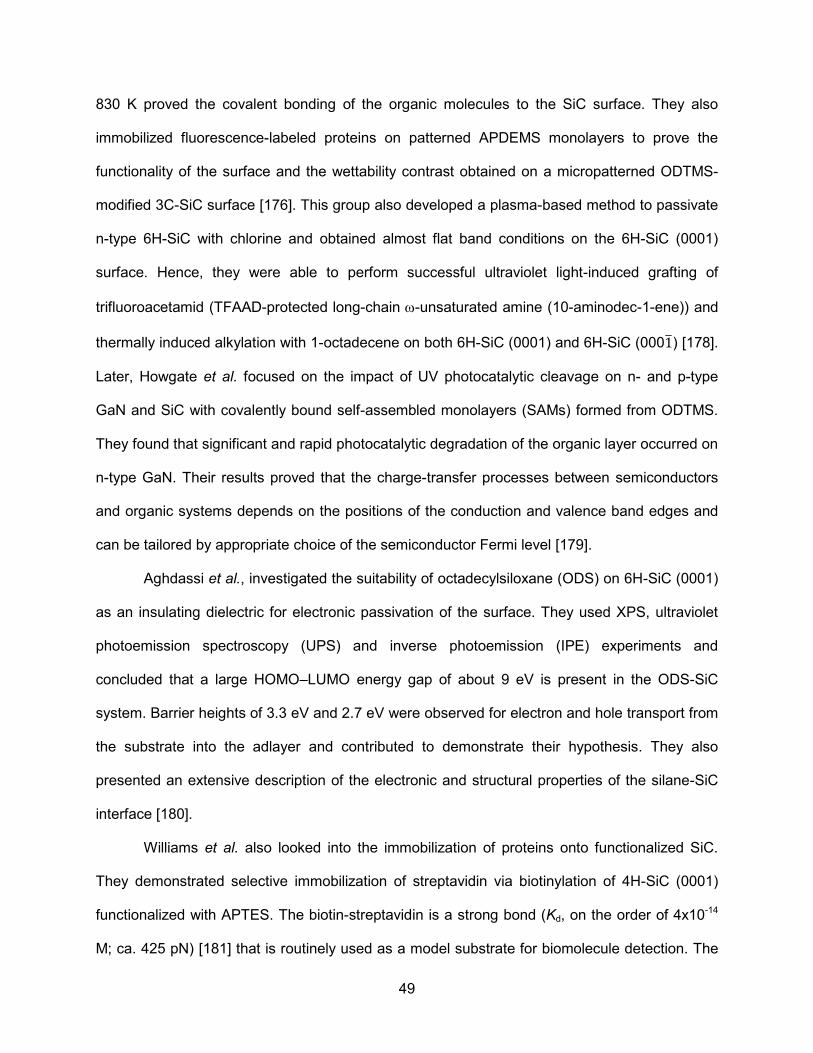
49
830 K proved the covalent bonding of the organic molecules to the SiC surface. They also
immobilized fluorescence-labeled proteins on patterned APDEMS monolayers to prove the
functionality of the surface and the wettability contrast obtained on a micropatterned ODTMS-
modified 3C-SiC surface [176]. This group also developed a plasma-based method to passivate
n-type 6H-SiC with chlorine and obtained almost flat band conditions on the 6H-SiC (0001)
surface. Hence, they were able to perform successful ultraviolet light-induced grafting of
trifluoroacetamid (TFAAD-protected long-chain ω-unsaturated amine (10-aminodec-1-ene)) and
thermally induced alkylation with 1-octadecene on both 6H-SiC (0001) and 6H-SiC (0001�) [178].
Later, Howgate et al. focused on the impact of UV photocatalytic cleavage on n- and p-type
GaN and SiC with covalently bound self-assembled monolayers (SAMs) formed from ODTMS.
They found that significant and rapid photocatalytic degradation of the organic layer occurred on
n-type GaN. Their results proved that the charge-transfer processes between semiconductors
and organic systems depends on the positions of the conduction and valence band edges and
can be tailored by appropriate choice of the semiconductor Fermi level [179].
Aghdassi et al., investigated the suitability of octadecylsiloxane (ODS) on 6H-SiC (0001)
as an insulating dielectric for electronic passivation of the surface. They used XPS, ultraviolet
photoemission spectroscopy (UPS) and inverse photoemission (IPE) experiments and
concluded that a large HOMO–LUMO energy gap of about 9 eV is present in the ODS-SiC
system. Barrier heights of 3.3 eV and 2.7 eV were observed for electron and hole transport from
the substrate into the adlayer and contributed to demonstrate their hypothesis. They also
presented an extensive description of the electronic and structural properties of the silane-SiC
interface [180].
Williams et al. also looked into the immobilization of proteins onto functionalized SiC.
They demonstrated selective immobilization of streptavidin via biotinylation of 4H-SiC (0001)
functionalized with APTES. The biotin-streptavidin is a strong bond (Kd, on the order of 4x10-14
M; ca. 425 pN) [181] that is routinely used as a model substrate for biomolecule detection. The

50
authors found, using different characterization techniques that included XPS, ellipsometry,
contact angle and fluorescence microscopy, that an optimization of the APTES layer was critical
to the successful streptavidin immobilization, in addition to a biotinylation step prior to the
streptavidin attachment to prevent non-specific binding of this protein with the 4H-SiC|APTES
surfaces [182]. What is interesting in their work is that they present an alternative hydroxylation
to the diluted HF dip step used by other authors, and employed instead a treatment with oxygen
plasma (20% O2/ 80% Ar) to grow a thin oxide followed by exposure to air for 2-3 hrs to allow for
chemisorption of water molecules that facilitates the silanization process [182].
Petoral et al. reported on the surface functionalization with
mercaptopropyltrimethoxysilane (MPTMS) of wide band gap semiconductors including SiC,
ZnO, and GaN. They used n-type 4H-SiC (both 4H-SiC (0001) and 4H-SiC (0001)), and the
MPTMS monolayers were prepared by evaporation of a pure solution in a sealed vacuum
chamber for 1 hr. Using XPS and water contact angle measurements they observed the
formation of a monomolecular layer of MPTMS on the SiC surfaces [183]. In addition, they
immobilized an amino acid derivative pTyr-PT but only on MPTMS-functionalized ZnO and GaN
surfaces. Yakimova et al. used a similar process to functionalize SiC and, in addition to
MPTMS, also studied APTES films on 4H-SiC. They also evaluated the electrical contribution
from the organic layers and their behavior as a possible insulator on SiC, similar to SiO2. They
used silver epoxy as a back contact and a thick probe as the gate contact. What they found was
that the device exhibited a Schottky diode like I-V characteristic similar to a reference sample
with no isolation layer and one sample with a 1 nm thick SiO2 film [69].
Bhowmick et al. demonstrated the successful covalent functionalization of quartz and n-
type 6H-SiC with APTES and benzo(ghi)perylene-1,2-dicarboxylic dye. The authors used XPS
to show the presence of the APTES layer but concluded that not all amino groups of the
APTES-functionalized surfaces reacted to bind the dye molecules [184]. They also found that
the dye functionalization was not uniform throughout the surface, showing different island sizes

51
of the dye and including different chemical environments on SiC. Nevertheless, their
fluorescence lifetime measurements indicate the presence of more than one local environment
for surface-bound benzo(ghi)perylene-1,2-dicarboxylic anhydride independent of the substrates
and that the single-crystal SiC surface provided a more homogeneous environment than the
quartz surface [184]. Protein-resistant SiC surfaces, to prevent device failure due to fibrous
encapsulation, were investigated by Qin et al. The authors prepared films terminated with
oligo(ethylene glycol) (OEG) via photochemical grafting onto 3C-SiC. By immersing the OEG
coated samples in a 0.1% fibrinogen solution in PBS for 1 hr they determined, using the N-1s
signal from XPS, that the OEG coating reduced the non-specific adsorption of fibrinogen on the
substrates by 99.5% and remained resistant after storage in PBS for 4 weeks at 37.1°C [185].
3.3 Increased Cell Proliferation on Surface Modified 6H-SiC
In this section, we demonstrate that the proliferation and attachment of two immortalized
neuronal cell lines can be enhanced after bio-functionalization of 6H-SiC using both
hydrophobic and mildly hydrophilic SAM layers. The contrasting properties of the functionalized
surfaces are shown to affect the cell response to the surfaces, which were assessed through
the observation of PC12 and H4 cell proliferation and morphology.
3.3.1 Substrate Preparation
Two 6H-SiC off-axis n-type wafers (3.43º off-axis, Si (0001) face, 420 μm thick),
purchased from Cree, Inc. were diced into 5x5 mm2 die. A hydrogen etching process was first
performed in order to obtain well-ordered, atomically flat surfaces free of polishing scratches
and with reduced defect densities [186, 187]. The samples were then ultrasonically cleaned in
acetone, methanol, and isopropanol, followed by a 10 min. immersion in piranha solution
(H2SO4:H2O2 2:1). A sequence of oxygen plasma (2450 MHz, 200 W, 1.4 mbar) treatment and

52
etching for 5 min in 5% diluted HF to obtain the hydroxyl (-OH) termination was performed twice
before functionalizing the surfaces. The thermal alkylation process with 1-octadecene was
performed directly on OH-terminated surfaces. For the silanization processes, using
aminopropyldiethoxymethylsilane (APDEMS) and aminopropyltriethoxysilane (APTES), the
oxygen plasma step was replaced with an HCl (1:2, HCl:H2O) dip followed by a 5% diluted HF
dip, the last step was performed to obtain the hydroxyl (-OH) termination.
3.3.2 Preparation of APTES, APDEMS and Octadecene on 6H-SiC Substrates
After cleaning and etching of the samples, alkylation of 6H-SiC (0001) was performed by
reaction of the hydroxylated surfaces with 1-octadecene for 120 min at 200 °C under Ar. The
samples were then ultrasonically cleaned in hexane, chloroform, and methanol for 10 min each.
The silanization reactions were performed by immersing the samples in 10% APDEMS (or
APTES) in anhydrous toluene for 90 min at room temperature in an N2 environment, followed by
ultrasonic cleaning in toluene and isopropanol, for 20 min each. After SAM formation, the
samples were placed in ethanol to prevent bacterial growth and surface oxidation before cell
seeding.
3.3.2.1 Methodology for Surface Characterization
Static water contact angle (SWCA) measurements were performed using a KSV
CAM101 system from KSV Instruments. Briefly, a 3 µl droplet of DI water was deposited on
three different samples for each of the surfaces prepared. The droplet contact angle was
determined by measuring the angles between the baseline of the drop and the tangent of the
same. In addition, atomic force microscopy (AFM) topography measurements of the surfaces
were performed using an XE-100 Advanced Scanning Microscope from Park Systems under
ambient conditions. Surface scans of 5µm x 5µm area were collected in tapping mode, and the

53
overall RMS roughness (Rq) was calculated using the Park Systems XEI image analysis
software.
3.3.2.2 Biocompatibility Assessment
Two immortalized neural cell lines obtained from American Type Culture Collection
(ATCC, Manassas, VA) were used for this study: H4 human neuroglioma (ATCC # HTB-148)
and PC12 Rat pheochromocytoma (ATCC # CRL-1721). The H4 cell line was cultured in
advanced Dulbecco’s Modified Eagle’s Medium (DMEM) supplemented with 10% fetal bovine
serum (FBS), 2.2 mM L-glutamine GlutaMAX-1, and 1% penicillin-streptomycin (PS). The PC12
line was grown in Kaighn’s F-12K media supplemented with 10% FBS, 10% horse serum, and
1% PS. The media and sera were purchased from Invitrogen.
In order to perform the MTT assay and determine the cell proliferation on the substrates,
each of the tested samples was placed into one well of a 12-well plate. Cell concentrations of
5x10⁵ cells/ml for both the H4 and PC12 cell lines were seeded in each well while adding 2 ml of
cell media, followed by incubation at 37 °C for 96 hrs. in a 5% CO2 and 95% relative humidity
atmosphere. MTT assays were then performed in accordance with the procedures outlined in
[78], with each assay repeated three times and in triplicate for each type of sample and for the
polystyrene (PSt) control. The results were normalized with respect to the PSt control reading
and statistical analysis was performed using ANOVA and the Tukey test, with an established
statistical significance of p < 0.05. For the cell morphology and evaluation of filopodia and
lamellipodia extensions, 12 well plates were also used, and 5x10³ cells/ml were seeded under
the same environmental conditions. After 48 hrs., the samples were removed from the media
and the cells were fixed using 4% paraformaldehyde and methanol. The AFM micrographs were
taken in contact mode and the live cells were immersed in DPBS solution during the

54
measurements. The AFM images were used to identify the filopodia and lamellipodia by relative
height (∼200-300 nm) and to assess spreading on the different surfaces.
3.3.2.3 SiC Substrate Characterization
The characterization of SAM-functionalized SiC substrates using X-ray photoelectron
spectroscopy (XPS), ellipsometry, contact angle measurements, AFM topography, and Fourier
transform infrared spectroscopy (FTIR) have been previously reported [169, 173, 176, 184]. We
confirmed the characteristics of the functionalized SiC surfaces that are most pertinent to the
current study (i.e. topography and wettability) prior to cell seeding. Static water contact angle
(SWCA) measurements give an indication of the degree of hydrophobicity and hydrophilicity of
the functionalized substrates. Table 2 contains the SWCA and RMS roughness values (reported
as the statistical mean ± standard deviation of the mean) for the surfaces tested. We observed
hydrophobic behavior for the 1-octadecene-treated sample, consistent with molecular methyl
end-groups [173, 188].
Table 2 SAM characterization via AFM and water contact angle analysis. Substrate Surface Roughness,
Rqa (nm RMS) Contact angle b(º)
6H-SiC untreated 0.30±0.1 19±2 6H-SiC with 1-octadecene
0.34±0.1 101±5
6H-SiC with APDEMS 0.36±0.1 48±4 6H-SiC with APTES 0.38±0.2 54±2 a Average surface roughness calculated from 5µm x 5µm scan areas averaged over 5 scans per surface. b Contact angles measured with 3 μL water droplets and averaged over 3 different surface readings.
The APDEMS and APTES surfaces were moderately hydrophilic, with values in the
expected range for amino end-groups [172, 176]. The untreated sample exhibited hydrophilic
behavior, consistent with a native oxide. Surface topography analysis with AFM showed a very
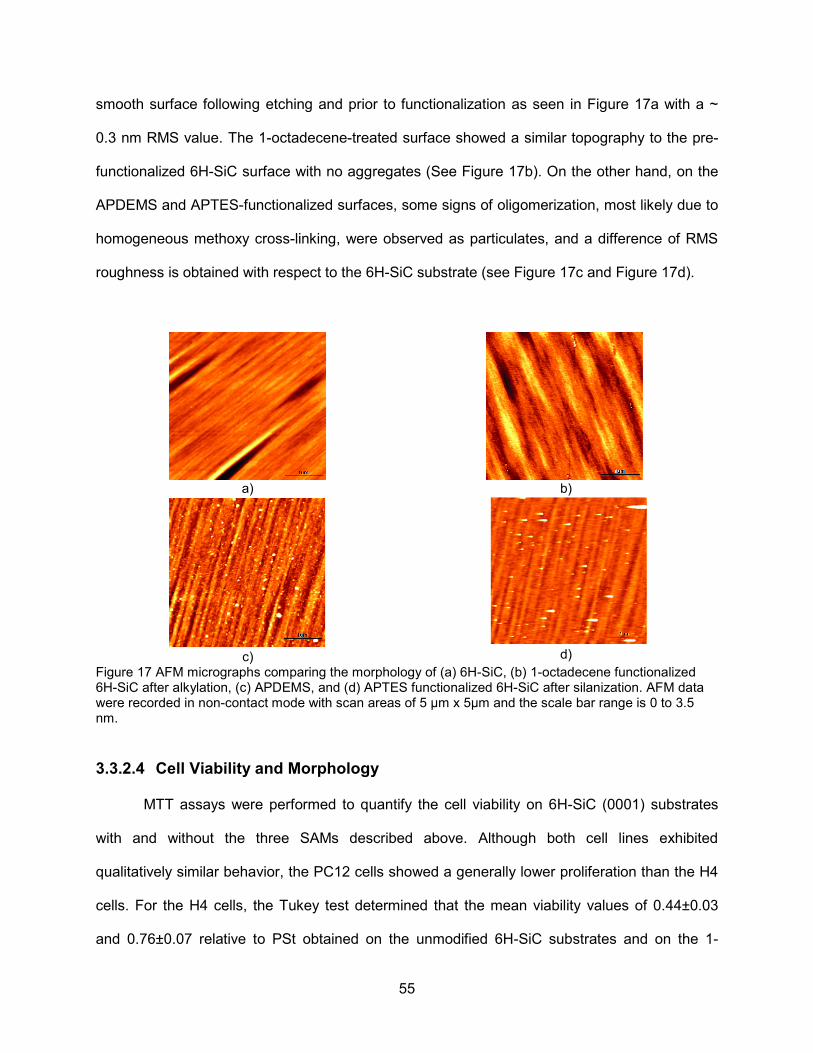
55
smooth surface following etching and prior to functionalization as seen in Figure 17a with a ~
0.3 nm RMS value. The 1-octadecene-treated surface showed a similar topography to the pre-
functionalized 6H-SiC surface with no aggregates (See Figure 17b). On the other hand, on the
APDEMS and APTES-functionalized surfaces, some signs of oligomerization, most likely due to
homogeneous methoxy cross-linking, were observed as particulates, and a difference of RMS
roughness is obtained with respect to the 6H-SiC substrate (see Figure 17c and Figure 17d).
a)
b)
c)
d)
Figure 17 AFM micrographs comparing the morphology of (a) 6H-SiC, (b) 1-octadecene functionalized 6H-SiC after alkylation, (c) APDEMS, and (d) APTES functionalized 6H-SiC after silanization. AFM data were recorded in non-contact mode with scan areas of 5 µm x 5µm and the scale bar range is 0 to 3.5 nm.
3.3.2.4 Cell Viability and Morphology
MTT assays were performed to quantify the cell viability on 6H-SiC (0001) substrates
with and without the three SAMs described above. Although both cell lines exhibited
qualitatively similar behavior, the PC12 cells showed a generally lower proliferation than the H4
cells. For the H4 cells, the Tukey test determined that the mean viability values of 0.44±0.03
and 0.76±0.07 relative to PSt obtained on the unmodified 6H-SiC substrates and on the 1-
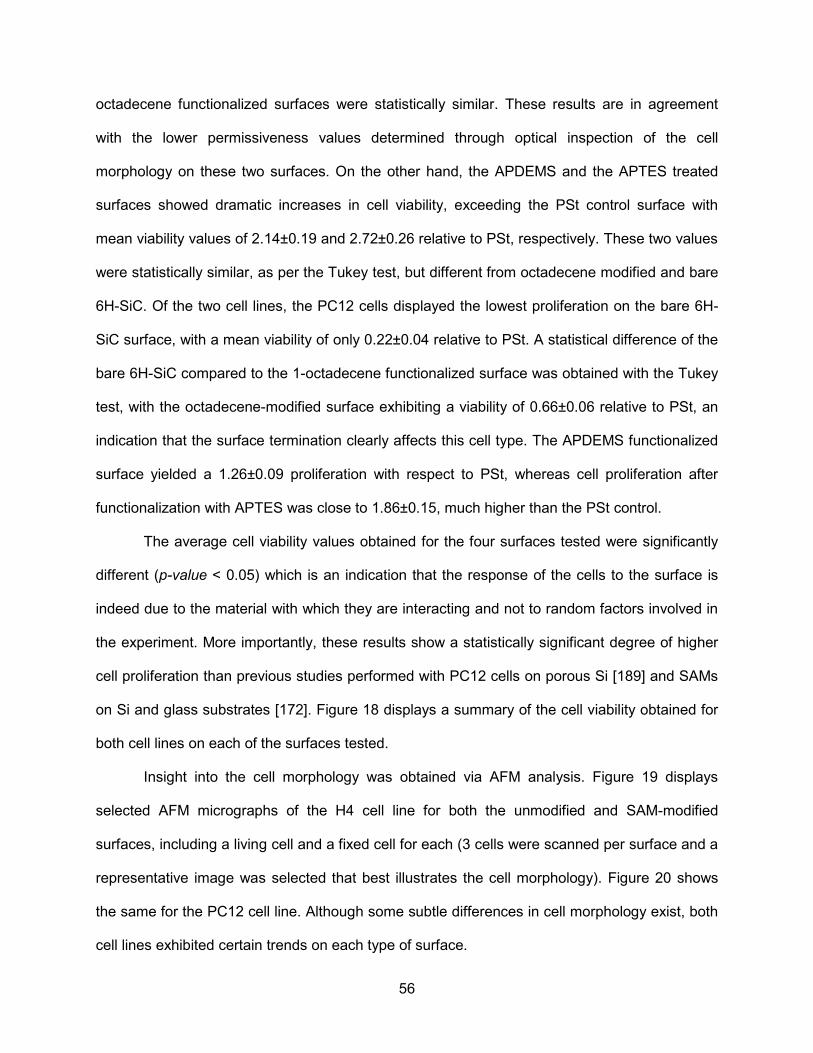
56
octadecene functionalized surfaces were statistically similar. These results are in agreement
with the lower permissiveness values determined through optical inspection of the cell
morphology on these two surfaces. On the other hand, the APDEMS and the APTES treated
surfaces showed dramatic increases in cell viability, exceeding the PSt control surface with
mean viability values of 2.14±0.19 and 2.72±0.26 relative to PSt, respectively. These two values
were statistically similar, as per the Tukey test, but different from octadecene modified and bare
6H-SiC. Of the two cell lines, the PC12 cells displayed the lowest proliferation on the bare 6H-
SiC surface, with a mean viability of only 0.22±0.04 relative to PSt. A statistical difference of the
bare 6H-SiC compared to the 1-octadecene functionalized surface was obtained with the Tukey
test, with the octadecene-modified surface exhibiting a viability of 0.66±0.06 relative to PSt, an
indication that the surface termination clearly affects this cell type. The APDEMS functionalized
surface yielded a 1.26±0.09 proliferation with respect to PSt, whereas cell proliferation after
functionalization with APTES was close to 1.86±0.15, much higher than the PSt control.
The average cell viability values obtained for the four surfaces tested were significantly
different (p-value < 0.05) which is an indication that the response of the cells to the surface is
indeed due to the material with which they are interacting and not to random factors involved in
the experiment. More importantly, these results show a statistically significant degree of higher
cell proliferation than previous studies performed with PC12 cells on porous Si [189] and SAMs
on Si and glass substrates [172]. Figure 18 displays a summary of the cell viability obtained for
both cell lines on each of the surfaces tested.
Insight into the cell morphology was obtained via AFM analysis. Figure 19 displays
selected AFM micrographs of the H4 cell line for both the unmodified and SAM-modified
surfaces, including a living cell and a fixed cell for each (3 cells were scanned per surface and a
representative image was selected that best illustrates the cell morphology). Figure 20 shows
the same for the PC12 cell line. Although some subtle differences in cell morphology exist, both
cell lines exhibited certain trends on each type of surface.

57
Figure 18 Proliferation of H4 and PC12 cell lines on the (0001) 6H-SiC substrates as a function of surface termination, as determined by MTT assay analysis. Results are normalized to the polystyrene control well and are expressed as the sample distribution of the mean (𝑥) and standard error of the mean (σM), normalized to the PSt readings.
For the bare 6H-SiC and 1-octadecene modified surfaces, AFM micrographs showed
elongated or rounded cells with few focal points or filopodia and lamellipodia extensions.
Indeed, the lamellipodia areas seen on those surfaces were not significant with respect to the
total cellular areas (see Figure 19 and Figure 20). For both cell lines on the APDEMS and
APTES treated surfaces, cells with elongated shapes that were flattened and expanded over
larger surface areas were observed, suggesting good attachment and consistent with the high
proliferation observed using MTT assays.
Additionally, there was evidence of focal point attachment, filopodia and lamellipodia
extensions, as well as intercellular interaction. These results compliment the MTT assays, which
showed greater proliferation on these surfaces compared to the untreated and 1-octadecene
modified 6H-SiC surfaces.
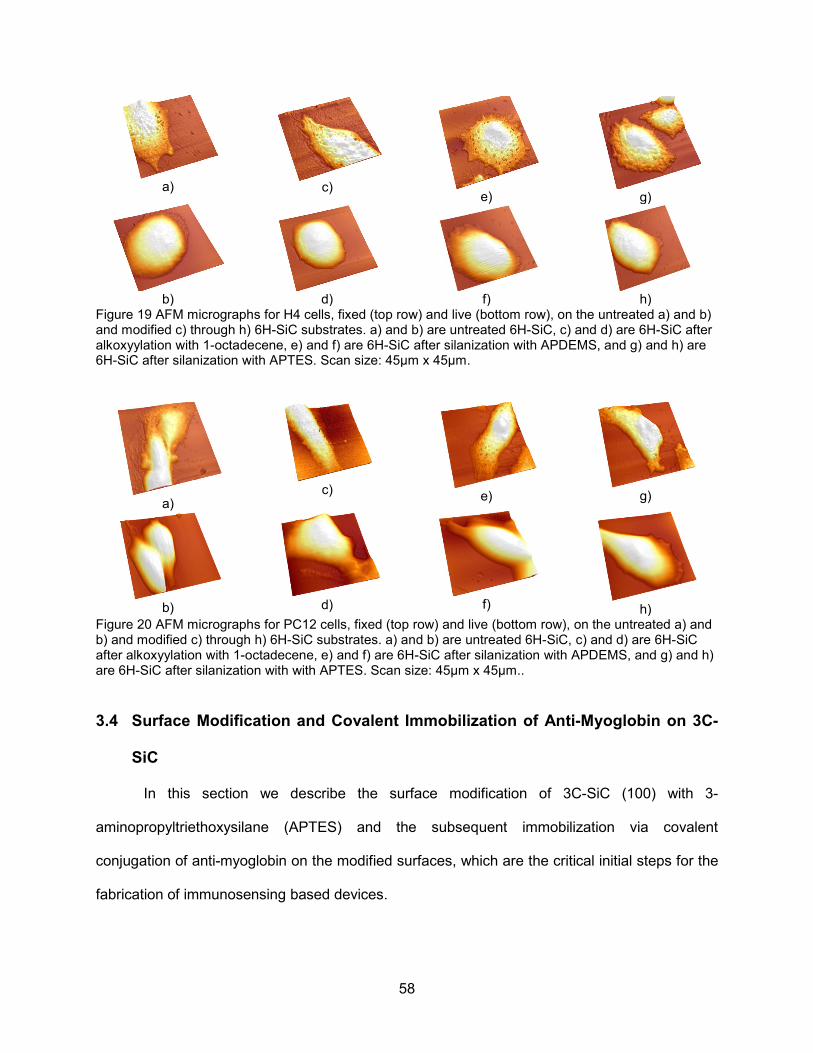
58
a)
c)
e)
g)
b)
d)
f)
h)
Figure 19 AFM micrographs for H4 cells, fixed (top row) and live (bottom row), on the untreated a) and b) and modified c) through h) 6H-SiC substrates. a) and b) are untreated 6H-SiC, c) and d) are 6H-SiC after alkoxyylation with 1-octadecene, e) and f) are 6H-SiC after silanization with APDEMS, and g) and h) are 6H-SiC after silanization with APTES. Scan size: 45µm x 45µm.
a)
c)
e)
g)
b)
d)
f)
h) Figure 20 AFM micrographs for PC12 cells, fixed (top row) and live (bottom row), on the untreated a) and b) and modified c) through h) 6H-SiC substrates. a) and b) are untreated 6H-SiC, c) and d) are 6H-SiC after alkoxyylation with 1-octadecene, e) and f) are 6H-SiC after silanization with APDEMS, and g) and h) are 6H-SiC after silanization with with APTES. Scan size: 45µm x 45µm..
3.4 Surface Modification and Covalent Immobilization of Anti-Myoglobin on 3C-
SiC
In this section we describe the surface modification of 3C-SiC (100) with 3-
aminopropyltriethoxysilane (APTES) and the subsequent immobilization via covalent
conjugation of anti-myoglobin on the modified surfaces, which are the critical initial steps for the
fabrication of immunosensing based devices.
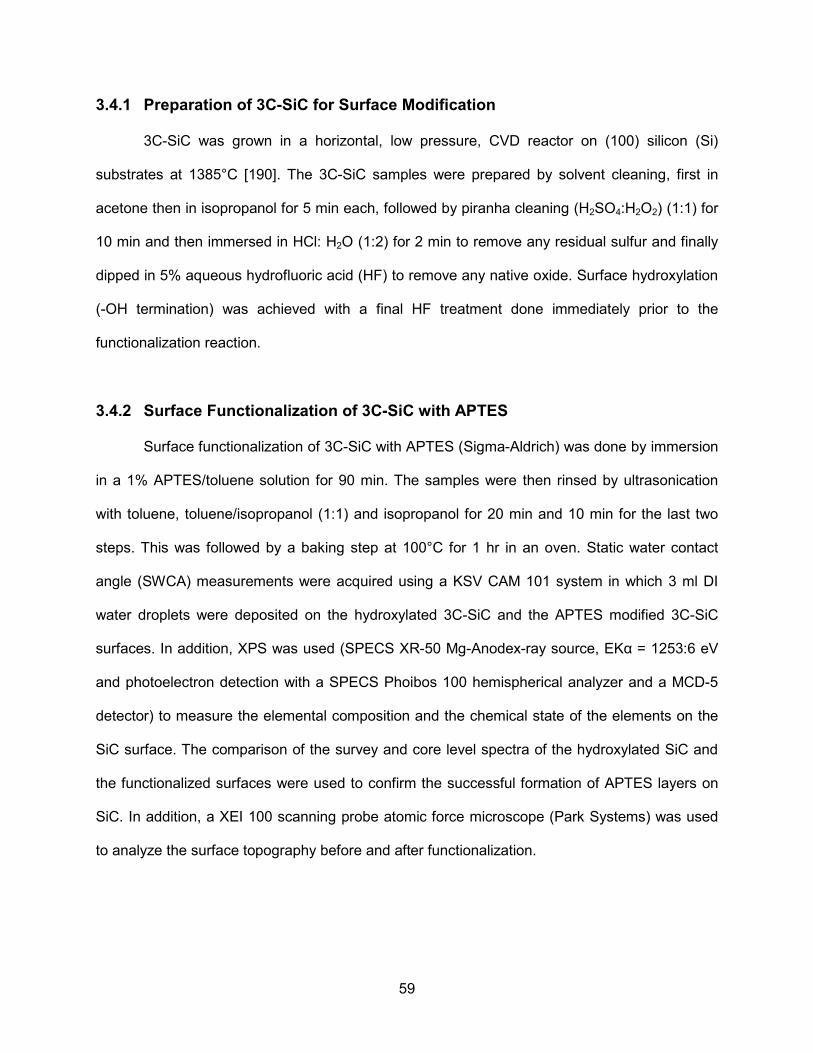
59
3.4.1 Preparation of 3C-SiC for Surface Modification
3C-SiC was grown in a horizontal, low pressure, CVD reactor on (100) silicon (Si)
substrates at 1385°C [190]. The 3C-SiC samples were prepared by solvent cleaning, first in
acetone then in isopropanol for 5 min each, followed by piranha cleaning (H2SO4:H2O2) (1:1) for
10 min and then immersed in HCl: H2O (1:2) for 2 min to remove any residual sulfur and finally
dipped in 5% aqueous hydrofluoric acid (HF) to remove any native oxide. Surface hydroxylation
(-OH termination) was achieved with a final HF treatment done immediately prior to the
functionalization reaction.
3.4.2 Surface Functionalization of 3C-SiC with APTES
Surface functionalization of 3C-SiC with APTES (Sigma-Aldrich) was done by immersion
in a 1% APTES/toluene solution for 90 min. The samples were then rinsed by ultrasonication
with toluene, toluene/isopropanol (1:1) and isopropanol for 20 min and 10 min for the last two
steps. This was followed by a baking step at 100°C for 1 hr in an oven. Static water contact
angle (SWCA) measurements were acquired using a KSV CAM 101 system in which 3 ml DI
water droplets were deposited on the hydroxylated 3C-SiC and the APTES modified 3C-SiC
surfaces. In addition, XPS was used (SPECS XR-50 Mg-Anodex-ray source, EKα = 1253:6 eV
and photoelectron detection with a SPECS Phoibos 100 hemispherical analyzer and a MCD-5
detector) to measure the elemental composition and the chemical state of the elements on the
SiC surface. The comparison of the survey and core level spectra of the hydroxylated SiC and
the functionalized surfaces were used to confirm the successful formation of APTES layers on
SiC. In addition, a XEI 100 scanning probe atomic force microscope (Park Systems) was used
to analyze the surface topography before and after functionalization.
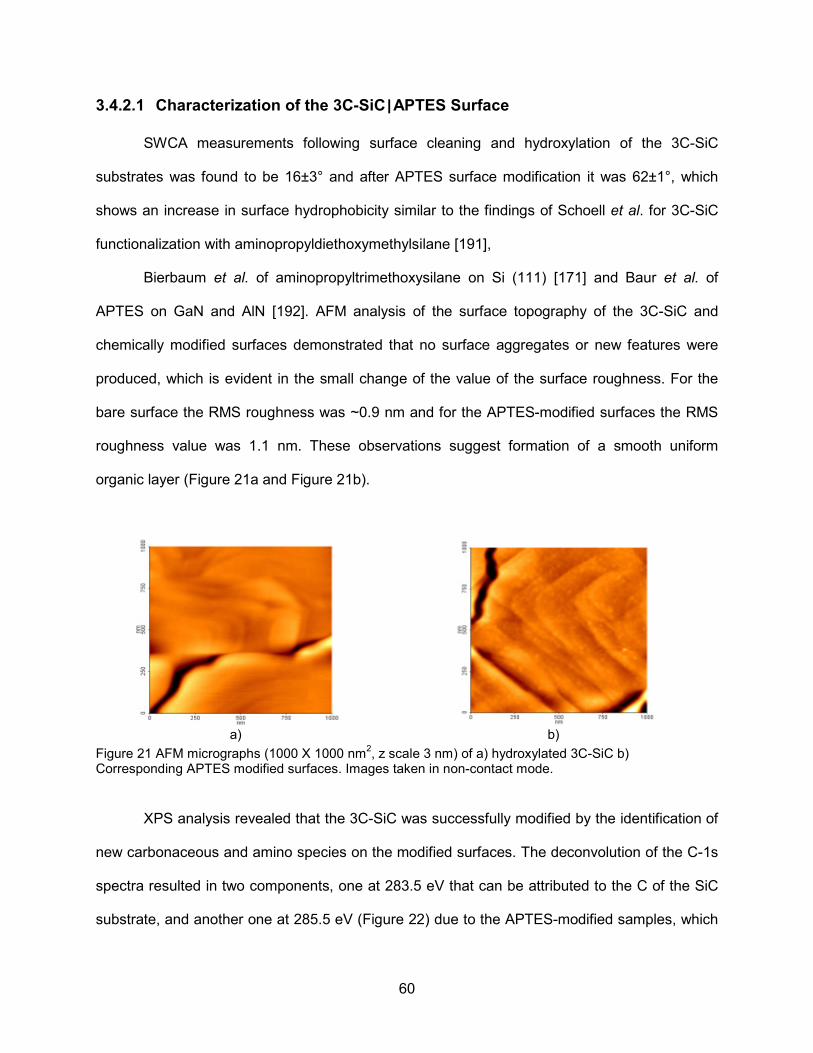
60
3.4.2.1 Characterization of the 3C-SiC|APTES Surface
SWCA measurements following surface cleaning and hydroxylation of the 3C-SiC
substrates was found to be 16±3° and after APTES surface modification it was 62±1°, which
shows an increase in surface hydrophobicity similar to the findings of Schoell et al. for 3C-SiC
functionalization with aminopropyldiethoxymethylsilane [191],
Bierbaum et al. of aminopropyltrimethoxysilane on Si (111) [171] and Baur et al. of
APTES on GaN and AlN [192]. AFM analysis of the surface topography of the 3C-SiC and
chemically modified surfaces demonstrated that no surface aggregates or new features were
produced, which is evident in the small change of the value of the surface roughness. For the
bare surface the RMS roughness was ~0.9 nm and for the APTES-modified surfaces the RMS
roughness value was 1.1 nm. These observations suggest formation of a smooth uniform
organic layer (Figure 21a and Figure 21b).
a) b)
Figure 21 AFM micrographs (1000 X 1000 nm2, z scale 3 nm) of a) hydroxylated 3C-SiC b) Corresponding APTES modified surfaces. Images taken in non-contact mode.
XPS analysis revealed that the 3C-SiC was successfully modified by the identification of
new carbonaceous and amino species on the modified surfaces. The deconvolution of the C-1s
spectra resulted in two components, one at 283.5 eV that can be attributed to the C of the SiC
substrate, and another one at 285.5 eV (Figure 22) due to the APTES-modified samples, which

61
can be attributed to hydrocarbons at the surface. These peaks have also been identified by
Schoell et al. and Rosso et al. in previous reports on 6H-SiC and 3C-SiC surface
functionalization [173, 176, 191]. Following surface modification with APTES, an attenuation of
the SiC substrate peaks for the C1s core level was observed, as seen in Figure 22a, due to the
presence of overlying organic layers.
For the N-1s core level spectra, two components were resolved at 400.5 eV and 404.2
eV (Figure 22b), which arise from terminal -NH2 and -NH3+ functional groups [171, 191]. This
result demonstrates the effective formation of thin organic layers with a high concentration of
reactive NH2 groups that would allow for successful attachment of the anti-myoglobin on the
surface.
a)
b)
Figure 22 a) C-1s core level spectra and b) N-1s core level spectra of the 3C-SiC after HF dip and APTES surface functionalization. The solid lines give the fitted spectral components of the deconvoluted data.
3.4.3 Anti-Myoglobin Immobilization on the 3C-SiC|APTES Surfaces
The immobilization of anti-myoglobin (Fitzgerald Industries) on the APTES modified SiC
surface was performed via covalent conjugation at a concentration of 100 μg/ml. Covalent
coupling was achieved by activating carboxylic acid groups of anti-myoglobin with 2 mM 1-ethyl-
3-(3-dimethylaminopropyl)carbodiimide hydrochloride (EDC) (ProteochemTM). Since EDC
produces a reactive unstable intermediate, 5 mM N-hydroxy-sulfosuccinimide (Sulfo-NHS)
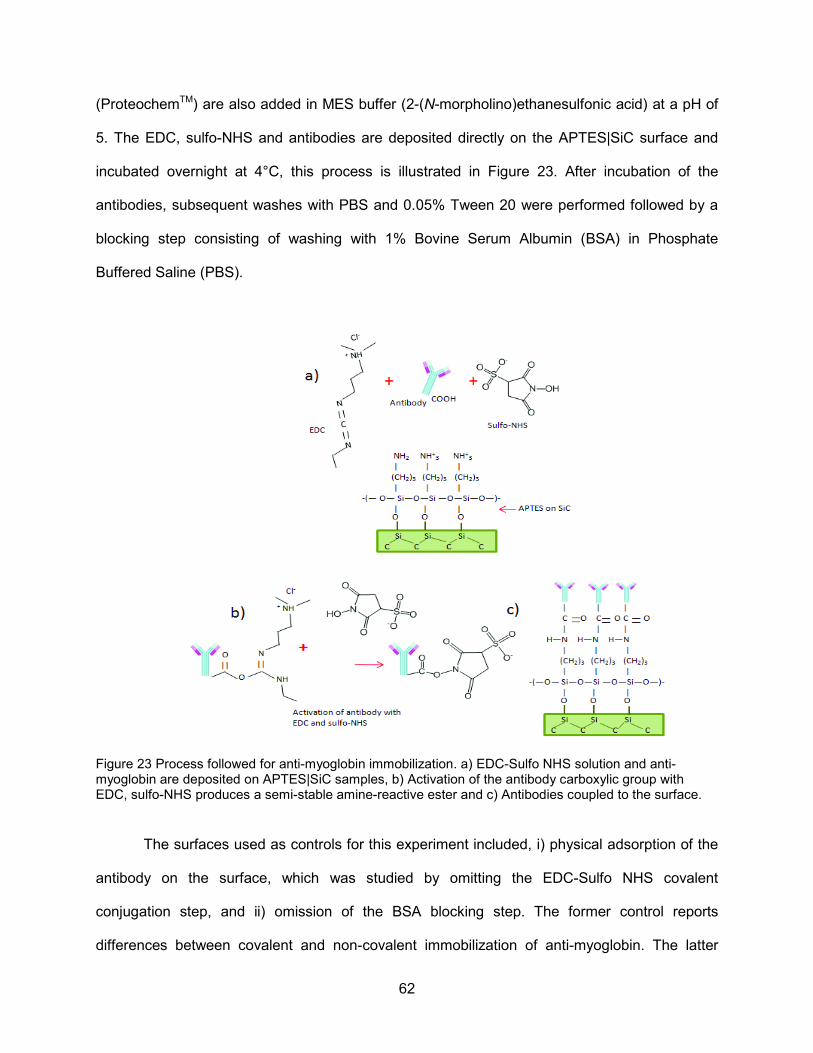
62
(ProteochemTM) are also added in MES buffer (2-(N-morpholino)ethanesulfonic acid) at a pH of
5. The EDC, sulfo-NHS and antibodies are deposited directly on the APTES|SiC surface and
incubated overnight at 4°C, this process is illustrated in Figure 23. After incubation of the
antibodies, subsequent washes with PBS and 0.05% Tween 20 were performed followed by a
blocking step consisting of washing with 1% Bovine Serum Albumin (BSA) in Phosphate
Buffered Saline (PBS).
Figure 23 Process followed for anti-myoglobin immobilization. a) EDC-Sulfo NHS solution and anti-myoglobin are deposited on APTES|SiC samples, b) Activation of the antibody carboxylic group with EDC, sulfo-NHS produces a semi-stable amine-reactive ester and c) Antibodies coupled to the surface.
The surfaces used as controls for this experiment included, i) physical adsorption of the
antibody on the surface, which was studied by omitting the EDC-Sulfo NHS covalent
conjugation step, and ii) omission of the BSA blocking step. The former control reports
differences between covalent and non-covalent immobilization of anti-myoglobin. The latter

63
control investigated blocking by the adsorption of BSA as a means to prevent non-specific
adsorption of Myoglobin. AFM was employed to monitor the surface topography after antibody
immobilization and to check the uniformity of the surface. Likewise, fluorescent microscopy was
used as a means to test the specificity of the Myoglobin to the anti-myoglobin immobilized on
the 3C-SiC surfaces.
3.4.3.1 Evaluation of Anti-Myoglobin Immobilization On 3C-SiC|APTES Surfaces
Via AFM
The qualitative evaluation of the anti-myoglobin immobilization was done with AFM.
Three types of surfaces were evaluated: Surface A, covalent conjugation of anti-myoglobin to
the surface followed by BSA blocking, Surface B, non-covalent linkage of anti-myoglobin to the
surface followed by BSA blocking, and Surface C, with no BSA blocking step following the
EDC/Sulfo-NHS covalent coupling of anti-myoglobin to the surface.
Surface A shows a uniform and densely packed antibody film with some isolated
proteins. Some of the images present particles with a diameter ~20 nm while for others the
length was close to 50 nm (Figure 24a). We also observed that the particles have a globular
shape due to its protein nature, as was reported by several authors [193-195]. On the other
hand, Surface B presents smaller particles packed in molecular arrays where the antibodies
appear to adsorb in clusters. However, there are certain regions where no antibody adsorption
occurred as seen in Figure 24b. This surface presents non-specific adsorption of anti-myoglobin
because of the absence of covalent conjugation with EDC/Sulfo NHS. In addition, there are
lower amounts of anti-Myoglobin on Surface B compared to Surfaces A and C. A blocking agent
was used to fill up those gaps where covalent immobilization of anti-Myoglobin has not occurred
and to prevent cross-reactivity and/or non-specific adsorption of other proteins.

64
For Surface C, where the BSA blocking step was omitted, similar images to Figure 24a
were obtained; however, there were fewer clusters and less protein accumulation, which can be
seen in some of the darker spots in Figure 24c. The larger aggregates on Surface A are likely
due to the presence of BSA, a well know sticky protein, that readily adsorbs and forms
aggregates. Surface C reflects the absence of the blocking protein, as the size of the particles
have been reduced to an average of 30 nm. If the blocking step with BSA is omitted, the
antibody immobilization process is not affected. However, it may impact the successful
quantification of the antibody-antigen interaction because non-specific binding of the myoglobin
(antigen) could possibly take place on the surface, which leads to poor results.
a) b)
c) Figure 24 AFM micrograph (1000 X 1000 nm2, z scale 5 nm, non-contact mode) after myoglobin immobilization a) surface A (covalent immobilization and BSA blocking), b) surface B (non-covalent adsorption) and c) surface C (covalent immobilization and no BSA blocking.
3.4.3.2 Analysis of the Specificity of the 3C-SiC|Anti-Myoglobin Surface to
Myoglobin
Specificity of an immunosensor to the antigen of interest is one of the main properties
that can be accomplished with immunosensors, as was explained in Chapter 1. For this reason,
after performing the characterization of the anti-myoglobin immobilized on the APTES modified
3C-SiC we used fluorescent microscopy to detect anti-myoglobin/myoglobin binding.

65
In this experiment we labeled myoglobin (Fitzgerald Industries) and hemoglobin (Sigma-
Aldrich) with Alexa Fluor-488 (Life technologies) and incubated for 2 hrs. [196, 197] the anti-
myoglobin immobilized on functionalized SiC surfaces. The idea being that when the myoglobin
binds to the respective anti-myoglobin (Surface A*) it will produce a strong green luminescence
signal. The hemoglobin was used as a negative control (Surface B*), since hemoglobin should
not bind to anti-myoglobin functionalized surfaces. In addition, the incubation of the proteins
directly on the SiC|APTES surfaces (Surface C*) is considered the second negative control.
The fluorescent intensity of the anti-myoglobin surfaces (Surface D*) was also measured
as a negative control with lower values expected than on Surface A* because there is no
presence of the labeled protein on the surfaces. As a positive control, anti-hemoglobin was
immobilized on 3C-SiC|APTES surfaces and the labeled hemoglobin was used as the target
proteins. In addition, myoglobin was incubated on anti-hemoglobin as the negative control. We
refer to the respective surfaces in the positive control as Surface A** for SiC|APTES|anti-
hemoglobin|BSA|hemoglobin, Surface B** for SiC|APTES|anti-hemoglobin|BSA|myoglobin,
Surface C** for SiC|APTES|anti-hemoglobin|BSA| and Surface D** for
SiC|APTES|BSA|hemoglobin.
In Figure 25 we present an illustration of the surfaces tested in this section and the steps
followed to test the specificity of the SiC|APTES|anti-myoglobin surfaces to myoglobin. The
protocol used for the anti-myoglobin (or anti-hemoglobin) was initially the one we described in
Section 3.3.3. However, some modifications were made to this protocol because a strong signal
due to non-specific binding of myoglobin was observed in Surface B** and of hemoglobin on
Surface B*. For these reasons, the concentration of BSA as the blocking solution was increased
to 3% with 0.25% of Tween 20 [198, 199]. It has been shown by other authors that the addition
of Tween 20 to PBS helps to prevent non-specific adsorption of proteins on ELISA microtiter

66
plates [199] and of IgG on silanized Si surfaces after adding it to fetal calf serum blocking
solution [198].
The EDC-SulfoNHS protocol to crosslink the anti-myoglobin (or anti-hemoglobin) to the
SiC|APTES surfaces was also modified to prevent hydrolysis that could cause regeneration of
the carboxyl group in the antibodies after these are brought in contact with the 2 mM EDC-5mM
SulfoNHS solution [200, 201]. After mixing the anti-myoglobin (or anti-hemoglobin) in EDC-
SulfoNHS solution for 20 min we added 20 mM mercaptoethanol to quench the activation of the
carboxyl group in the antibodies according to the steps followed in [202]. After the activated
proteins reacted with the amino-terminated SiC|APTES surfaces, 10 mM hydroxylamine was
added. This step hydrolyzes any un-reacted NHS that could interact with myoglobin that we are
planning to detect [200, 201].
Figure 25 Illustration of the sequence followed to test the specificity of the SiC modified surfaces. The surfaces has been labeled from A* to E* to identify each of the treatments tested and the * to differentiate them from the surfaces tested in section 3.3.3.1.
SiC
1. SiC Surface functionalization with aminopropyltriethoxysilane (APTES)
2. Anti-myoglobin immobilization using EDC/Sulfo NHS coupling SiC
3. Block with 3% BSA with 0.25% Tween 20 (Surface D*) SiC
4. Incubate lableled protein for 2 hrs at room temperature
SiC|APTES|BSA|Anti-myoglobin|Myoglobin SiC|APTES|BSA|Anti-myoglobin|Hemoglobin(Surface A*) (Surface B*)
SiC
2a. Incubate lableled protein for 2 hrs at room temperature (Surface C*)
SiC | APTES | BSA| Myoglobin
SiC SiC
5. Quantify fluorescence using image J
APTES
Anti-Myoglobin
BSAAlexa-fluor 488 labeled myoglobin
Alexa-fluor 488 labeled hemoglobin
67
To take the fluorescent images we used a Leica compound microscope with a CCD
camera (SPOT5) and an exposure time of 5 sec. We took 5 images for each of the surfaces
tested and the green intensity was quantified by calculating the integrated density of the images
with ImageJ [8]. In order to process the data we subtracted the background (SiC substrate
without surface modification) from surfaces A* to D*. In addition, for simplicity all of the results
were normalized with respect to the average integrated density obtained on the surface where
we expected the highest fluorescence to be generated (Surface A*) and are reported in Figure
26. The data is reported as the sample distribution of the mean (𝑥) (n= 9) and the standard error
of the mean (σM). A t-test was performed for each surface with respect to their controls.
Figure 26 Normalized fluorescent intensity of Alexa-Fluor 488 labeled myoglobin and hemoglobin bound to APTES (left), anti-myoglobin (center) and anti-hemoglobin immobilized on SiC (right) with their respective controls. The results are expressed as the sample distribution of the mean (𝑥) and standard error of the mean (σM) and normalized to the positive control experiments in each test. + denotes p-values < 0.05 with respect to the antibody immobilized control and ++ denotes p-values < 0.05 with respect to the surface after APTES modification.
From the results presented in Figure 26 and Figure 27 we confirm the successful
immobilization of anti-myoglobin on SiC and the specificity to the target protein, i.e. myoglobin.
The fluorescent intensity levels on Surfaces A* and A** were higher compared to the control
0
0.2
0.4
0.6
0.8
1
1.2
SiC/APTES/BSA SiC/Anti-myo/BSA SiC/Anti-hemo/BSA
Nor
mal
ized
inte
nsity
MyoglobinHemoglobinNo protein
+ +
+ +++
++

68
surfaces, with a higher fluorescent level on surface A** compared to A*. On the other hand,
surfaces B* and B** did not show zero fluorescence and the degree of fluorescence was higher
than surfaces D* and D** but comparable to surfaces C* and C**. This is an indication that a low
degree of non-specific binding could occur on the surface but is not significant compared to
surfaces A* and A**. In addition this may not affect the detection of the target protein. Lastly,
surfaces D* and D** showed was very low fluorescence intensity (close to zero). The fact that
D** is lower than D* could be due to the higher fluorescence intensity on A** than on A*, which
influences the normalized results.
a) b) c) d)
e) f) g) h)
i) j) k) l) Figure 27 Green signal extracted from fluorescent images before background subtraction for the tested surfaces. The fluorescent intensity is represented in the RGB histogram (green channel) and microscope image a) and b) non-treated SiC, c) and d) Surface C* (no protein), e) and f) Surface C*, g) and h) Surface D*, i) and j) Surface B*, and k) and l) Surface A*.
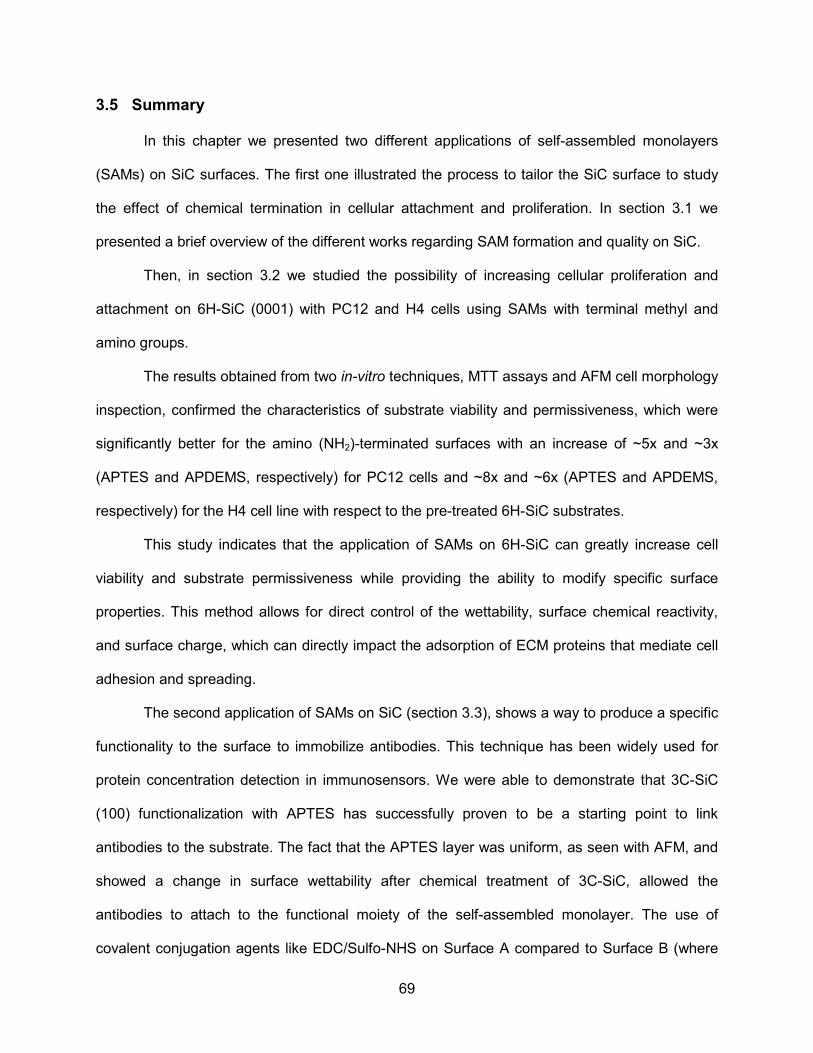
69
3.5 Summary
In this chapter we presented two different applications of self-assembled monolayers
(SAMs) on SiC surfaces. The first one illustrated the process to tailor the SiC surface to study
the effect of chemical termination in cellular attachment and proliferation. In section 3.1 we
presented a brief overview of the different works regarding SAM formation and quality on SiC.
Then, in section 3.2 we studied the possibility of increasing cellular proliferation and
attachment on 6H-SiC (0001) with PC12 and H4 cells using SAMs with terminal methyl and
amino groups.
The results obtained from two in-vitro techniques, MTT assays and AFM cell morphology
inspection, confirmed the characteristics of substrate viability and permissiveness, which were
significantly better for the amino (NH2)-terminated surfaces with an increase of ~5x and ~3x
(APTES and APDEMS, respectively) for PC12 cells and ~8x and ~6x (APTES and APDEMS,
respectively) for the H4 cell line with respect to the pre-treated 6H-SiC substrates.
This study indicates that the application of SAMs on 6H-SiC can greatly increase cell
viability and substrate permissiveness while providing the ability to modify specific surface
properties. This method allows for direct control of the wettability, surface chemical reactivity,
and surface charge, which can directly impact the adsorption of ECM proteins that mediate cell
adhesion and spreading.
The second application of SAMs on SiC (section 3.3), shows a way to produce a specific
functionality to the surface to immobilize antibodies. This technique has been widely used for
protein concentration detection in immunosensors. We were able to demonstrate that 3C-SiC
(100) functionalization with APTES has successfully proven to be a starting point to link
antibodies to the substrate. The fact that the APTES layer was uniform, as seen with AFM, and
showed a change in surface wettability after chemical treatment of 3C-SiC, allowed the
antibodies to attach to the functional moiety of the self-assembled monolayer. The use of
covalent conjugation agents like EDC/Sulfo-NHS on Surface A compared to Surface B (where

70
no EDC/Sulfo-NHS was used) yielded appreciable differences in the molecule conformation on
the surface, i.e. homogeneous and uniform for Surface A while Surface B had areas where no
proteins have been attached. We have also seen ovoid protrusions with diameters from 45 to 60
nm similar to the work done by Ehrhart et al. for hepatitis detection on polystyrene [19]. This
could be due to the superimposition of two Y shaped immunoglobulins (IgG) that were randomly
distributed on the surface. We would not expect the molecules to exhibit a Y shape because of
the conformational flexibility of IGgs and interactions with the substrate.
On the other hand, in the experiment performed to test protein specificity we observed
higher fluorescence values on sample A** compared to A*. The difference in the average
fluorescence values was also compared using the t-test (p-value < 0.01). We could attribute this
difference to possibly more uniform anti-hemoglobin (surface A**) layers that were formed on
the SiC|APTES surfaces. The antibody immobilization performed via covalent
heterobifunctional linkers produces random orientation and conformation of the antibodies on
the target substrate as mentioned in section 1.3.1.2. Some degree of non-specific adsorption of
myoglobin and hemoglobin was observed on surfaces C* and C**. Both surfaces presented
fluorescence intensities higher than the SiC|APTES surface and it was not surprising that the
values were similar to surfaces B* and B** in some specimens. The non-specific adsorption
could be due to electrostatic binding of myoglobin and hemoglobin on areas of the samples
where BSA has been displaced by the target molecule or regions where the APTES did not
conform properly on the surfaces. For instance, Williams et al have found that BSA and
streptavidin could non-specifically bind to APTES modified 4H-SiC, due to protonation of the
APTES terminal group at a pH ~ 7.4 causing electrostatic binding of the proteins to the surface
[203]. Other reasons for non-specific adsorption include the effect of surface roughness and
defects in the formation of homogeneous self-assembled monolayers and non-immobilized
bioreceptors as presented by Choi et al. This group has also shown that BSA can sometimes be

71
displaced by other proteins or form a multilayer with proteins with opposite charges [204]. Even
though we observed a similar behavior on our surfaces while looking for particular reasons for
the non-specific adsorption on SiC, modified surfaces are outside of the scope of this work. Also
because of the lower fluorescence intensity (2 times lower) on surfaces B* and B**, we
concluded that the signal due to non-specific adsorption is not high enough to generate a false
response when trying to target myoglobin. The results presented in this chapter suggest that
SiC is a suitable substrate material for cell-based and immunosensing devices as was shown in
sections 3.2 and 3.3.

72
4 CHAPTER 4: MYOGLOBIN DETECTON VIA IMPEDANCE SPECTROSCOPY ON
3C-SIC (100)
In Chapter 1 we described the concepts behind the construction of a SiC-based
immunosensor. This includes the detection analyte, the antibody, the covalent immobilization of
the antibody to solid surfaces, and the principal techniques employed to translate the antigen-
antibody binding mechanism in terms of a measureable signal. Then, in Chapter 2 we discussed
the properties and major works related to SiC biosensors, in addition to the physics behind the
semiconductor|electrolyte interface that provides an understanding in the principles behind an
immuno-electrochemical based device.
Before building a SiC CHEMFET to detect myocardial infarction we have decided to
understand how each of the layers involved in the immunosensor construction affect the space
charge region (SCR) of the semiconductor. For this reason, in this chapter we focus on the
application of the concepts and protocols described in the previous chapters to study the
changes in flat band potential and impedance in the SCR of 3C-SiC after formation of the
APTES (i.e. the starting point for antibody immobilization), anti-myoglobin immobilization and
afterwards, and the impact of adding different concentrations of myoglobin on top of the sensor
surface. This last step is done with the purpose of identifying if we can detect levels of
myoglobin similar to the those found in patients prone to AMI as well as healthy individuals
using electrochemical means. However, due to the limited number of SiC samples available, we
only tested one concentration of myoglobin ( 1 ug/ml), the same used in Chapter 3.

73
4.1 Electrochemical Cell Construction
4.1.1 3C-SiC (100) Working Electrode Fabrication
The 3C-SiC (100) films used in this work consist of a ~2 μm thick low-doped (Nd ~ 1014
cm-3) epitaxial film grown on a 4" Si (100) wafer as in [190] followed by a ~2 μm in-situ heavily-
doped 3C-SiC film. In-situ doping is accomplished during the epitaxial growth phase by
including 50 sccm of UHP N2 into the precursor gas mixture in [190].
4.1.1.1 Characterization of In-Situ Doped 3C-SiC (100) Films
The surfaces of USF1-12-017 and USF1-12-018 were characterized by means of
scanning AFM and electron microscopy (SEM), so that morphological information of the
semiconductor surface could be correlated with device performance presented later on in this
chapter.
Figure 28 shows topological data of the (100) SiC surface after AFM characterization of
USF1-12-017. The AFM micrograph shows large flat mesas, called anti-phase domains (APD),
with abrupt changes in height between the mesas, called anti-phase boundaries (APB). These
are a characteristic topographical feature of 3C-SiC grown on (100) Si substrates. The height
data shows many islands that are several tens of nanometers high with respect to the local
surrounding film clustered along the APB and loosely scattered on the domains. Plan-view SEM
micrographs of USF1-12-017 shows a surface morphology consisting of jagged, abrupt edge
discontinuities of the phase boundaries separating the large mosaic-like regions of the anti-
phase domains.
Close examination of the domain regions at magnifications >10 K (Figure 29b and 29d)
reveals subtle square-shaped terraces resulting from the step-flow growth of the heteroepitaxial
film.

74
Figure 28 AFM micrograph of the in-situ doped SiC films (USF1-12-17) used for the electrochemical measurements. Rq = 7.2±3 nm and classic anti-phase domains are clearly evident, as expected.
The SEM images of USF1-12-017 show small dark areas covering the surface. It is
interesting to note that the size of these features appear to be larger and more numerous along
the APB edges, while smaller dark anomalies are evenly-distributed across the APDs along the
step-edges of the terraces. Electron dispersion spectroscopy (EDS) analysis using an EDAX-
Phoenix EDS system was performed on the anomalous features. The EDS spectrum of the dark
areas indicated the anomalies were regions of carbon-rich silicon carbide. Analysis of the x-ray
spectrum by percentage of the number of atoms detected for the carbon-rich SiC reveals 63.5%
C and 36.5% Si, whereas the surrounding SiC demonstrated 49.5% C and 51% Si. A possible
hypothesis for the presence of these features could be due to a carbon-rich precursor gas
chemistry.
During the CVD growth process, the precursor gases decompose and adhere to the
substrate surface as adatoms. These adatoms diffuse along the surface until they encounter an
area of low energy, i.e. step edges on the film surface, and bind to the surrounding atoms. The
slightly higher bond energy of the C-C bond (346 KJ/ mol) may favor the formation of C-C bonds
over Si-C (318 KJ/ mol). Also, given that computational simulations have demonstrated that
carbon adatoms experience a lower surface diffusion energy barrier than silicon adatoms on the

75
(100) SiC surface [205], the likelihood of carbon adatoms bonding to one another in a carbon-
rich environment seems very plausible. Assuming the possibilities of the hypothesis, it would
make sense to see large and numerous anomalies present at the APBs. These results also
seem to suggest that any stoichiometric imbalances in the precursor gas composition that favor
a carbon-rich chemistry do not produce films with the excess carbon evenly distributed within
the film, but produce films consisting of localized areas of carbon-rich SiC embedded in a 1:1
stoichiometric SiC matrix.
The plan-view SEM images of USF1-12-018 also show the characteristic APB and APD
features seen on USF1-12-017. However, the surface does not demonstrate the same character
as the anomalies seen with the C-rich SiC film. The anomalies seen on the surface of USF1-12-
018 are larger, more isolated and far less numerous than the features seen on USF1-12-017.
These features appear to protrude from the surface, much like a hillock or an inclusion.
EDS analysis of the features show a very similar stoichiometric composition as the surrounding
film.
In order to determine the approximate doping concentration of the 3C-SiC films, the
wafers where RCA cleaned and CV (capacitance vs. voltage) measurements performed using a
Hg probe (LEI 2017B, Lehighton Electronics Inc.). Figure 30a and Figure 30b show the
Capacitance vs. applied potential (E) curve and the corresponding calculated doping
concentration with respect to the depletion width. Using the equations (11) and (12) described in
section 2.2 we obtained an average doping density for the in-situ doped 3C-SiC wafers of ~3.64
x 1018 cm-3.

76
a) b)
c) d)
Figure 29 SEM images taken on the in-situ doped SiC films used for the electrochemical measurements. The first wafer (USF1-13-17) corresponds to a) 5K magnification and b) 10K magnification, the second wafer grown (USF1-13-18) corresponds to a) 10K magnification and b) 20K magnification. The surface contains cluster defects in addition to anti-phase domains. Cluster defects can act as surface recombination centers that will directly impact CHEMFET operation.

77
a)
b)
Figure 30 Characterization of the in-situ doped 3C-SiC wafers using Hg probe. a) CV measurements and b) calculated doping concentration (Nd). An acceptable level of doping (~3.64 x 1018 cm-3) was achieved during growth which should be suitable for electrochemical measurements.
After confirming that the doping concentration was appropriate to make ohmic contacts
to SiC, we proceeded to e-beam evaporate Ti/Ni (20 nm/150 nm) followed by Ti/Au (25 nm/150
nm) where the Au layer was deposited to prevent oxidation of the contacts. A schematic of the
fabrication process of the SiC electrodes is shown in Figure 31. After contact formation, the
contacts were annealed for 3 min (10 cycles of 20 sec each) at 1050°C in a rapid thermal
annealer (Temp Teck Inc). Figure 32a shows the change in the inter-contact resistance before
(9.8±3 Ω*cm-1) and after (7.2±1 Ω*cm-1) annealing the specimens while Figure 32b shows a
picture of the contacts on the 3C-SiC sample. It is worth mentioning that two concentric
electrodes were fabricated in order to reduce any reduce any edge effects on the electric
field/current profile.
2.935E-10
2.940E-10
2.945E-10
2.950E-10
2.955E-10
2.960E-10
2.965E-10
-1.00 -0.75 -0.50
C (F
)E (V)
1E+17
1E+18
1E+19
0.0940 0.0939 0.0938 0.0936 0.0935 0.0933
Nd
/cm
^-3
Depth W (um)
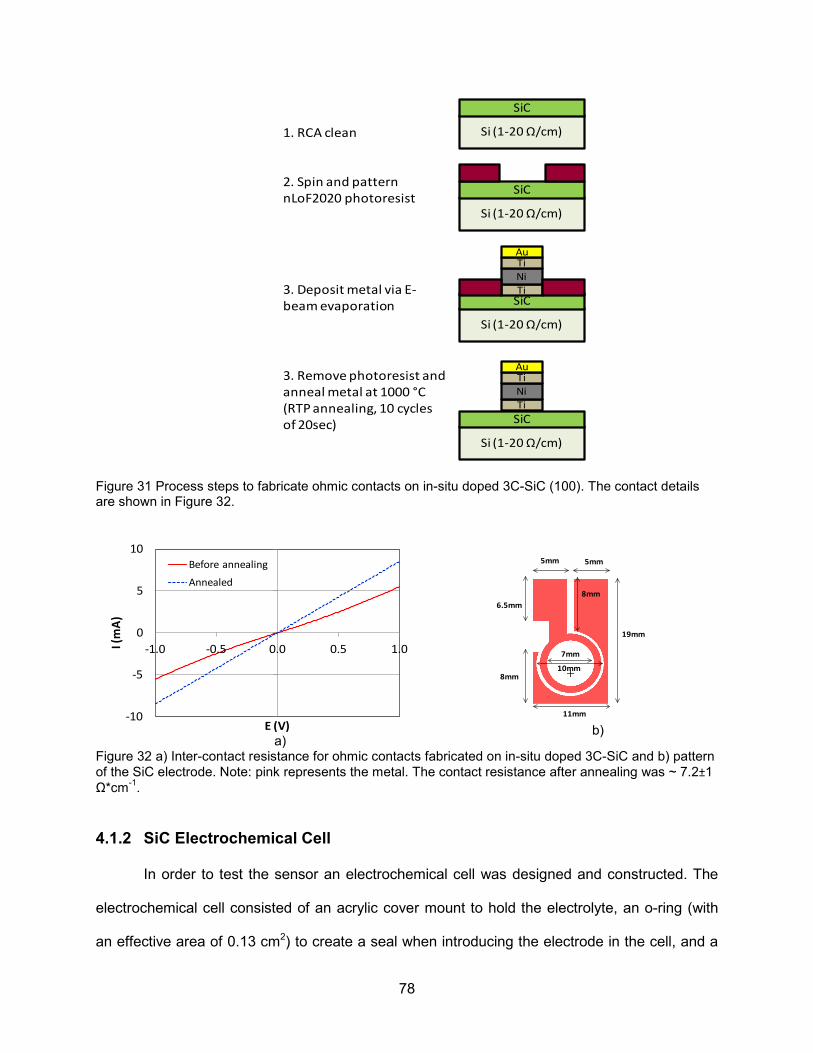
78
Figure 31 Process steps to fabricate ohmic contacts on in-situ doped 3C-SiC (100). The contact details are shown in Figure 32.
a)
b)
Figure 32 a) Inter-contact resistance for ohmic contacts fabricated on in-situ doped 3C-SiC and b) pattern of the SiC electrode. Note: pink represents the metal. The contact resistance after annealing was ~ 7.2±1 Ω*cm-1.
4.1.2 SiC Electrochemical Cell
In order to test the sensor an electrochemical cell was designed and constructed. The
electrochemical cell consisted of an acrylic cover mount to hold the electrolyte, an o-ring (with
an effective area of 0.13 cm2) to create a seal when introducing the electrode in the cell, and a
Si (1-20 Ω/cm)1. RCA clean
SiC
Si (1-20 Ω/cm)
SiCTiNiTiAu
3. Remove photoresist and anneal metal at 1000 °C (RTP annealing, 10 cycles of 20sec)
Si (1-20 Ω/cm)
SiC2. Spin and pattern nLoF2020 photoresist
Si (1-20 Ω/cm)
SiCTiNiTiAu
3. Deposit metal via E-beam evaporation
-10
-5
0
5
10
-1.0 -0.5 0.0 0.5 1.0I (m
A)
E (V)
Before annealing
Annealed
7mm
10mm
5mm 5mm
11mm
19mm
6.5mm
8mm
8mm

79
nylon base to which the cover mount was adjusted with two screws (see Figure 33a and Figure
33b).
The working electrode is the SiC specimen which consists of two concentric circular
electrodes as described in the previous section. This shape was chosen to have a uniform
current distribution across the SiC film when the current is applied from the potentiostat, as
shown in Figure 33a. The inside electrode is the one where the current is applied and the outer
one is where the voltage is probed with respect to the reference electrode. The reference
electrode was a miniature Ag/AgCl electrode for the potentiodynamic tests and, for the Mott-
Schottky and impedance spectroscopy tests, a Ti wire electrode with an outer mixed-metal-
oxide surface was used as a low impedance reference electrode [58]. This later electrode was
previously calibrated against the Ag/AgCl electrode. In all cases, the potentials have been
converted to the saturated calomel electrode (SCE) scale for reporting purposes [8].
A Ti wire was used also as the counter electrode to provide a pathway for the current
through the electrolyte. The four-electrode configuration was employed to avoid any voltage
drop at the current insertion contact that could be caused by non-idealities of the ohmic contacts
[206].
The electrochemical cell arrangement is presented in Figure 33a. We also show the
equivalent capacitance and resistance in the same figure for reference. For simplicity, we have
not included the double layer capacitance in this figure.

80
a)
b)
Figure 33 a) Diagram for the electrochemical cell used to study the SiC electrode before and after surface modification. Equivalent electrical parameters are shown to indicate their position with respect to the device and measurement apparatus. b) Picture of the SiC cell used in the laboratory. The WE (E) and WE(I) are circular electrodes as shown on the right.
4.2 Specimen Preparation and Testing Methodology
The SiC samples were solvent cleaned in an ultrasonic bath for 5 min in acetone and
isopropanol and rinsed in DI water. The specimens were then immersed in diluted HF (1:100,
HF: DI water) for 5 min to remove the native oxide and to obtain a hydroxyl (-OH) terminated
surface. After cleaning the specimens and modifying the surfaces as described in section
3.3.3.2., three different tests were performed: 1) Impedance spectroscopy in the frequency
range of 0.01Hz - 300kHz at 10 mVrms. 2) Mott-Schottky plots were obtained from 1kHz and
10kHz with a voltage sweep of -0.6V to 0.6V (vs. SCE) with an amplitude of 10 mVrms and
WE (I)
Electrolyte
WE (E)
RE (E)
Csc
Rs
RscSiC
CE (I)
Si
WE: Working electrodeCE: Counter electrodeRE: Reference electrode
I: Current E: Potential (Voltage)
Ref. electrode (RE1)
Counter electrode
WE (Current)WE (Potential)
WE (I)WE (E)

81
50mV/s scan rate. This voltage range was chosen in order to avoid modifying the test due to H2
evolution or O2 reduction on the surfaces. 3) Cyclic polarization was performed in the same
voltage range used for the Mott-Schottky experiments (5mV/s scan rate) to determine the open
circuit potential (OCP) and the degree of passivation of the SiC electrodes before and after
surface functionalization (including the antibody immobilization step). All the experiments were
performed in Dr. Alberto Sagüés’ laboratory in the dark at ~ 21 ± 2°C using a Gamry Reference
600 potentiostat. In all cases the electrolyte used was 0.1 M Phosphate buffer saline, PBS (KCl
2.68mM, KH2PO4 1.47 mM, NaCl 136.89 mM and Na2HPO4 8.10 mM).
4.3 Impedance Spectroscopy of the Functionalized 3C-SiC Surface
For the impedance spectroscopy, a total of seven specimens were tested. The idea was
to perform these experiments to understand trends and identify the passivation of the surfaces
after surface modification. This experiment was planned to test the same surfaces described in
section 3.3.3.2. However, due to availability of the material the surfaces included in the
impedance and Mott-Schottky experiments were surface A* (i.e. myoglobin bound to anti-
myoglobin modified surfaces), surface B* (i.e. hemoglobin bound to anti-myoglobin modified
surfaces) and surface C* (i.e. myoglobin immobilized on SiC|APTES surfaces) described in the
mentioned section. The purpose of using surfaces B* and C* was to have two different controls
that would allow us to identify if there are changes, or not, in impedance and flat band potential
in the cases where the target protein myoglobin should bind to the anti-myoglobin modified SiC.
The impedance spectra (as well as Mott-Schottky) were collected after each step of the
preparation of the surfaces. That means that for surface A* we did an impedance test after
hydroxylation of SiC, after APTES functionalization, after anti-myoglobin functionalization and
finally after myoglobin incubation. In the following section we will discuss the results for each of
the mentioned surfaces.
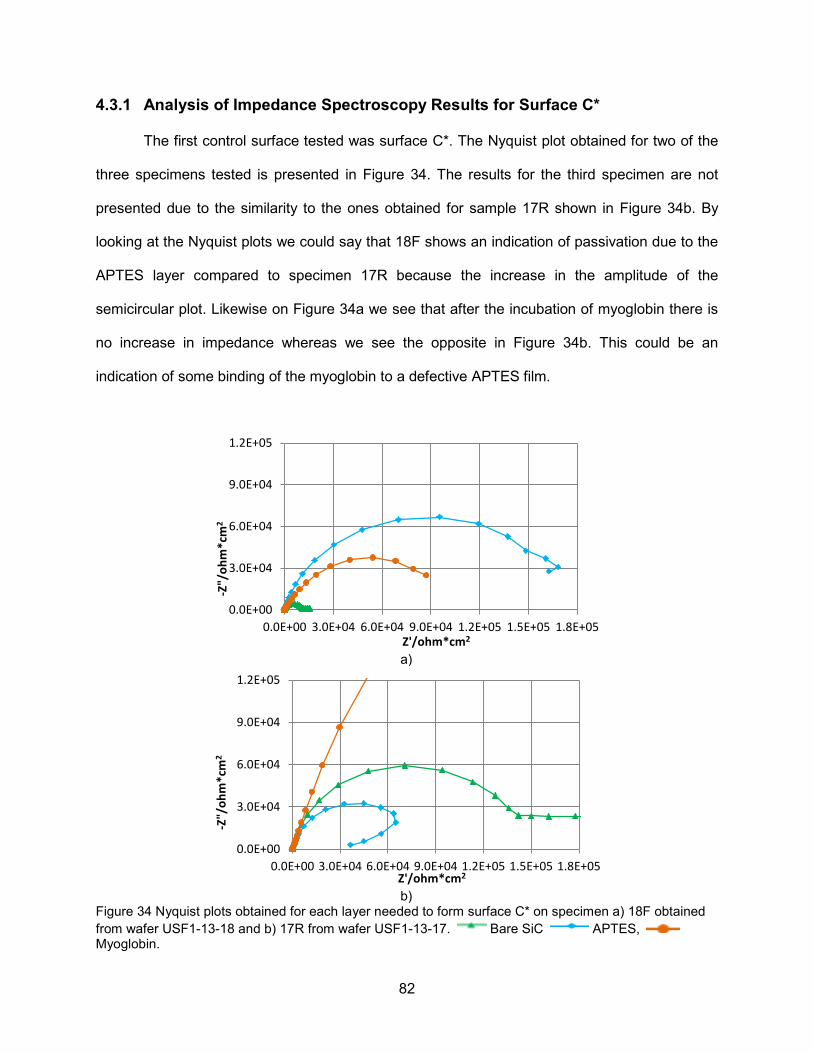
82
4.3.1 Analysis of Impedance Spectroscopy Results for Surface C*
The first control surface tested was surface C*. The Nyquist plot obtained for two of the
three specimens tested is presented in Figure 34. The results for the third specimen are not
presented due to the similarity to the ones obtained for sample 17R shown in Figure 34b. By
looking at the Nyquist plots we could say that 18F shows an indication of passivation due to the
APTES layer compared to specimen 17R because the increase in the amplitude of the
semicircular plot. Likewise on Figure 34a we see that after the incubation of myoglobin there is
no increase in impedance whereas we see the opposite in Figure 34b. This could be an
indication of some binding of the myoglobin to a defective APTES film.
a)
b)
Figure 34 Nyquist plots obtained for each layer needed to form surface C* on specimen a) 18F obtained from wafer USF1-13-18 and b) 17R from wafer USF1-13-17. Bare SiC APTES, Myoglobin.
0.0E+00
3.0E+04
6.0E+04
9.0E+04
1.2E+05
0.0E+00 3.0E+04 6.0E+04 9.0E+04 1.2E+05 1.5E+05 1.8E+05
-Z"/
ohm
*cm
2
Z'/ohm*cm2
0.0E+00
3.0E+04
6.0E+04
9.0E+04
1.2E+05
0.0E+00 3.0E+04 6.0E+04 9.0E+04 1.2E+05 1.5E+05 1.8E+05
-Z"/
ohm
*cm
2
Z'/ohm*cm2

83
The Bode plots shown in Figure 35 show evidence of the non-idealities in the impedance
magnitude for both specimens prior to the functionalization, especially at lower frequencies. The
lower frequencies (f< 1Hz) typically represent the behavior of the double layer capacitance
[207]. As can be seen from the insets of Figure 35b and Figure 35d, at higher frequencies (>
100 kHz) the curves do not fully converge to the same impedance value due to differences in
the solution resistance. This behavior may be due to variations in the position of the reference
electrode when the samples are withdrawn and reintroduced in the electrochemical cell after
performing surface modification steps. In addition, we see that for specimen 17R the magnitude
of impedance is almost the same as that for the bare SiC surface after APTES functionalization
but decreases for frequencies < 1kHz. It could be that the APTES layer formation on this
sample did not result in a homogeneous layer. For sample 17R, the myoglobin incubation step
seems to result in the highest impedance from the Nyquist plots, higher than the curve obtained
for the APTES modified surface. In the Bode plots (see Figure 35) the impedance appears to be
higher at lower frequencies (< 1Hz) but lower than APTES at higher frequencies. For 18F, the
impedance presents a different behavior than on 17R, with a small increase after APTES
functionalization, mostly at < 1Hz and then decreases after myoglobin incubation on the
samples for all the frequency range tested.
4.3.2 Analysis of Impedance Spectroscopy Results for Surface B*
For surface B*, the one in which anti-myoglobin immobilization has been performed and
hemoglobin is incubated to test for non-specific binding, three samples were also tested.
However we noted metal residue (maybe from the liftoff step) on one of the samples and it was
therefore not included in the analysis. From Figure 36 we identify similar trends on both
specimens but the impedance tends to be higher on 17Q for the Bare SiC and APTES treated
surface compare to 17P. There is an indication of an increase in the real and imaginary
components from the starting hydroxylated SiC surface to the anti-myoglobin surface. We
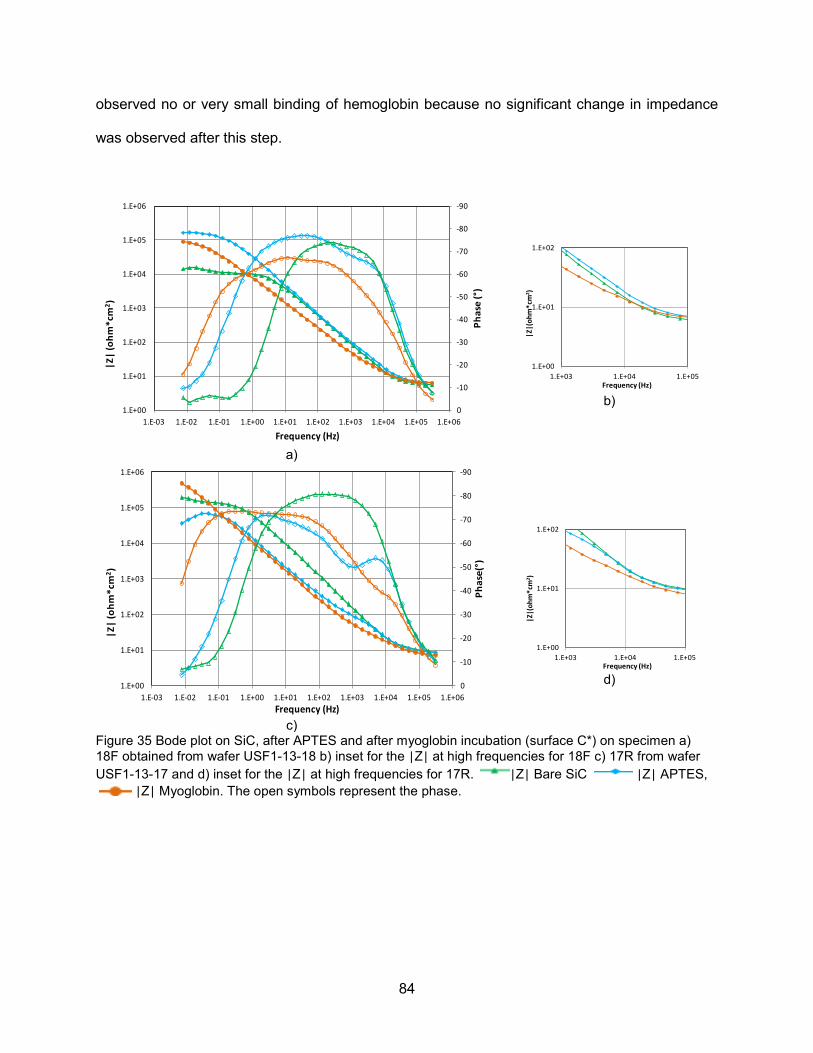
84
observed no or very small binding of hemoglobin because no significant change in impedance
was observed after this step.
a)
b)
c)
d)
Figure 35 Bode plot on SiC, after APTES and after myoglobin incubation (surface C*) on specimen a) 18F obtained from wafer USF1-13-18 b) inset for the |Z| at high frequencies for 18F c) 17R from wafer USF1-13-17 and d) inset for the |Z| at high frequencies for 17R. |Z| Bare SiC |Z| APTES,
|Z| Myoglobin. The open symbols represent the phase.
-90
-80
-70
-60
-50
-40
-30
-20
-10
01.E+00
1.E+01
1.E+02
1.E+03
1.E+04
1.E+05
1.E+06
1.E-03 1.E-02 1.E-01 1.E+00 1.E+01 1.E+02 1.E+03 1.E+04 1.E+05 1.E+06
Phas
e (°
)
|Z|
(ohm
*cm
2 )
Frequency (Hz)
1.E+00
1.E+01
1.E+02
1.E+03 1.E+04 1.E+05
|Z|(
ohm
*cm
2 )
Frequency (Hz)
-90
-80
-70
-60
-50
-40
-30
-20
-10
01.E+00
1.E+01
1.E+02
1.E+03
1.E+04
1.E+05
1.E+06
1.E-03 1.E-02 1.E-01 1.E+00 1.E+01 1.E+02 1.E+03 1.E+04 1.E+05 1.E+06
Phas
e(°)
|Z|
(ohm
*cm
2 )
Frequency (Hz)
1.E+00
1.E+01
1.E+02
1.E+03 1.E+04 1.E+05
|Z|(
ohm
*cm
2 )
Frequency (Hz)

85
a)
b)
Figure 36 Nyquist plots obtained for each layer needed to form surface B* on specimen a) 17P and b) 17Q both from wafer USF1-13-17. Bare SiC APTES, Anti-Myoglobin Hemoglobin.
The Bode plots for surface B* are shown in Figure 37. The inset shown in Figure 37b
and Figure 37d illustrates a similar tendency for the impedance magnitude on both specimens.
However, we have to be careful when judging the results because of the variability in the
solution resistance. Similar to what we observed in Figure 35a for specimen 18F, there is an
increase in impedance after APTES functionalization suggesting passivation of the surfaces due
to increased impedance with respect to the surfaces with no treatment (Bare SiC). This effect is
increased after the anti-myoglobin linking step in the Nyquist plot presented in Figure 36, but it
shows a decrease in impedance. For specimen 17P, the impedance is higher after anti-
myoglobin immobilization at f < 1Hz, but is lower at all frequencies for 17Q (see Figure 37).
0.0E+00
1.0E+06
2.0E+06
3.0E+06
0.0E+00 1.0E+06 2.0E+06
-Z"
(ohm
*cm
2 )
Z' (ohm*cm2)
0.0E+00
1.0E+06
2.0E+06
3.0E+06
0.0E+00 1.0E+06 2.0E+06
-Z" (
ohm
*cm
2 )
Z' (ohm*cm2)

86
a)
b)
c)
d)
Figure 37 Bode plot of each layer that forms surface B* on specimen a) 17P b) inset for the |Z| at high frequencies for 17P c) 17Q and d) inset for the |Z| at high frequencies for 17Q. Both specimens were obtained from wafer USF1-13-17. |Z| Bare SiC |Z| APTES, |Z| Anti-Myoglobin
|Z| Hemoglobin. The open symbols represent the phase.
4.3.3 Analysis of Impedance Spectroscopy Results for Surface A*
The last surface that we tested was surface A*, our target protein, myoglobin,
immobilized on anti-myoglobin linked to SiC. In this case one out of three specimens showed
evidence on myoglobin immobilization on the surfaces. From the Nyquist plots we observed an
increase in the real and imaginary components of the impedance after APTES functionalization
-90
-80
-70
-60
-50
-40
-30
-20
-10
01.E+00
1.E+01
1.E+02
1.E+03
1.E+04
1.E+05
1.E+06
1.E+07
1.E-03 1.E-02 1.E-01 1.E+00 1.E+01 1.E+02 1.E+03 1.E+04 1.E+05 1.E+06
Phas
e (°
)
|Z|(
ohm
*cm
2 )
Frequency/Hz
1.E+00
1.E+01
1.E+02
1.E+03 1.E+04 1.E+05
|Z|
(ohm
*cm
2 )
Frequency (Hz)
-90
-80
-70
-60
-50
-40
-30
-20
-10
01.E+00
1.E+01
1.E+02
1.E+03
1.E+04
1.E+05
1.E+06
1.E+07
1.E-03 1.E-02 1.E-01 1.E+00 1.E+01 1.E+02 1.E+03 1.E+04 1.E+05 1.E+06
Phas
e (°
)
|Z|
(ohm
*cm
2 )
Frequency (Hz)
1.E+00
1.E+01
1.E+02
1.E+03 1.E+04 1.E+05
|Z| (
ohm
*cm
2 )
Frequency (Hz)
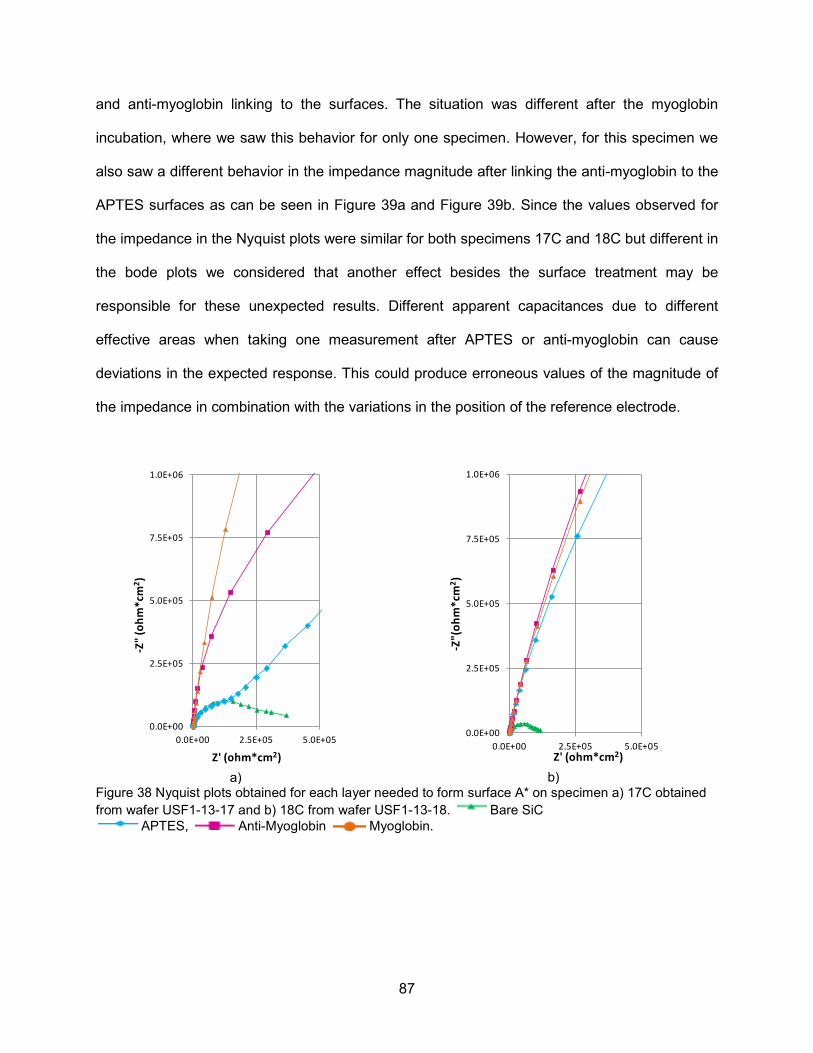
87
and anti-myoglobin linking to the surfaces. The situation was different after the myoglobin
incubation, where we saw this behavior for only one specimen. However, for this specimen we
also saw a different behavior in the impedance magnitude after linking the anti-myoglobin to the
APTES surfaces as can be seen in Figure 39a and Figure 39b. Since the values observed for
the impedance in the Nyquist plots were similar for both specimens 17C and 18C but different in
the bode plots we considered that another effect besides the surface treatment may be
responsible for these unexpected results. Different apparent capacitances due to different
effective areas when taking one measurement after APTES or anti-myoglobin can cause
deviations in the expected response. This could produce erroneous values of the magnitude of
the impedance in combination with the variations in the position of the reference electrode.
a)
b)
Figure 38 Nyquist plots obtained for each layer needed to form surface A* on specimen a) 17C obtained from wafer USF1-13-17 and b) 18C from wafer USF1-13-18. Bare SiC
APTES, Anti-Myoglobin Myoglobin.
0.0E+00
2.5E+05
5.0E+05
7.5E+05
1.0E+06
0.0E+00 2.5E+05 5.0E+05
-Z" (
ohm
*cm
2 )
Z' (ohm*cm2)
0.0E+00
2.5E+05
5.0E+05
7.5E+05
1.0E+06
0.0E+00 2.5E+05 5.0E+05
-Z"(
ohm
*cm
2 )
Z' (ohm*cm2)

88
a)
b)
c)
d)
Figure 39 Bode plots obtained for each layer that forms surface A* on specimen a) 17C obtained from wafer USF1-13-17 b) inset for the |Z| at high frequencies for 17C c) 18C from wafer USF1-13-18 and d) inset for the |Z| at high frequencies for 18C. |Z| Bare SiC |Z| APTES, |Z| Anti-Myoglobin |Z| Myoglobin. The open symbols represent the phase.
4.4 Equivalent Circuit Used to Fit the Impedance Spectroscopy Results
As was explained in section 1.4.1, Nyquist and Bode plots can be associated with an
equivalent circuit of resistors and capacitors. Fitting our data to an equivalent model will provide
more information regarding the quality of the films and the changes in the SCR after the surface
modification. In Figure 40 the equivalent model used in this work is presented. It includes two
-90
-80
-70
-60
-50
-40
-30
-20
-10
01.E+00
1.E+01
1.E+02
1.E+03
1.E+04
1.E+05
1.E+06
1.E+07
1.E+08
1.E-03 1.E-02 1.E-01 1.E+00 1.E+01 1.E+02 1.E+03 1.E+04 1.E+05 1.E+06
Phas
e (°)
|Z| (
ohm
*cm
2 )
Frequency (Hz)1.E+00
1.E+01
1.E+02
1.E+03 1.E+04 1.E+05
|Z| (
ohm
*cm
2 )
Frequency (Hz)
-90
-80
-70
-60
-50
-40
-30
-20
-10
01.E+00
1.E+01
1.E+02
1.E+03
1.E+04
1.E+05
1.E+06
1.E+07
1.E+08
1.E-03 1.E-02 1.E-01 1.E+00 1.E+01 1.E+02 1.E+03 1.E+04 1.E+05 1.E+06
Phas
e (°
)
|Z|(
ohm
*cm
2 )
Frequency (Hz)1.E+00
1.E+01
1.E+02
1.E+03 1.E+04 1.E+05
|Z| (
ohm
*cm
2 )
Frequency (Hz)
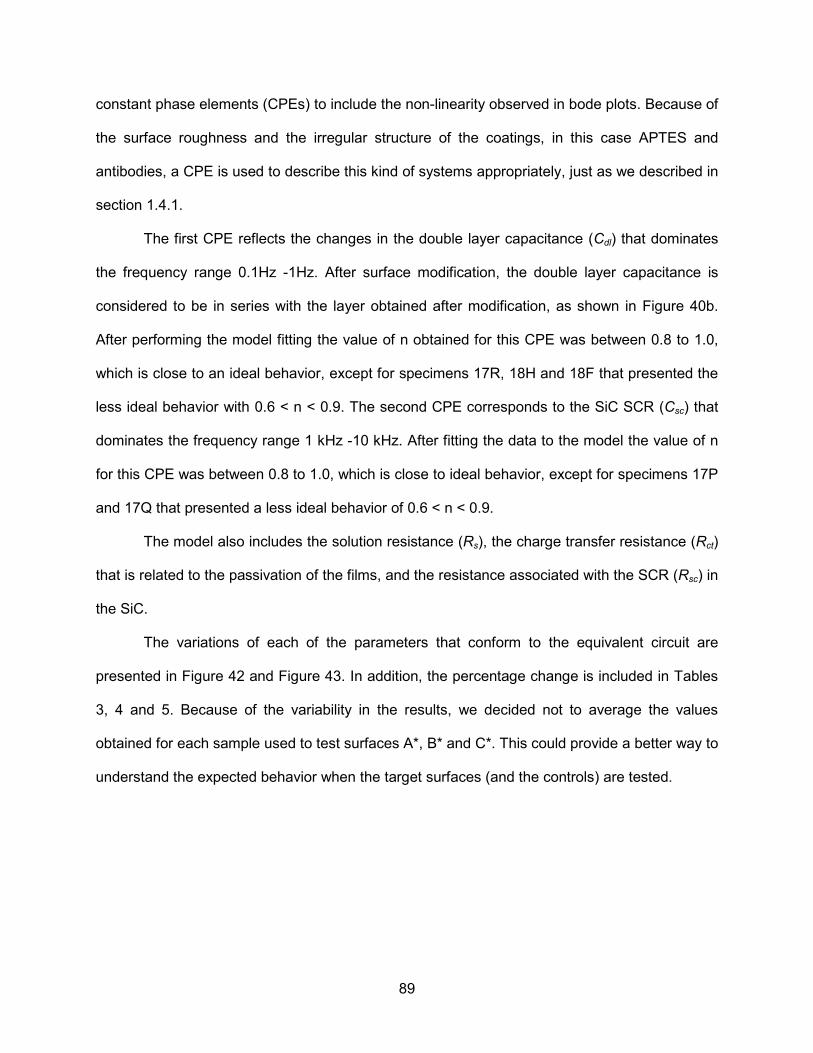
89
constant phase elements (CPEs) to include the non-linearity observed in bode plots. Because of
the surface roughness and the irregular structure of the coatings, in this case APTES and
antibodies, a CPE is used to describe this kind of systems appropriately, just as we described in
section 1.4.1.
The first CPE reflects the changes in the double layer capacitance (Cdl) that dominates
the frequency range 0.1Hz -1Hz. After surface modification, the double layer capacitance is
considered to be in series with the layer obtained after modification, as shown in Figure 40b.
After performing the model fitting the value of n obtained for this CPE was between 0.8 to 1.0,
which is close to an ideal behavior, except for specimens 17R, 18H and 18F that presented the
less ideal behavior with 0.6 < n < 0.9. The second CPE corresponds to the SiC SCR (Csc) that
dominates the frequency range 1 kHz -10 kHz. After fitting the data to the model the value of n
for this CPE was between 0.8 to 1.0, which is close to ideal behavior, except for specimens 17P
and 17Q that presented a less ideal behavior of 0.6 < n < 0.9.
The model also includes the solution resistance (Rs), the charge transfer resistance (Rct)
that is related to the passivation of the films, and the resistance associated with the SCR (Rsc) in
the SiC.
The variations of each of the parameters that conform to the equivalent circuit are
presented in Figure 42 and Figure 43. In addition, the percentage change is included in Tables
3, 4 and 5. Because of the variability in the results, we decided not to average the values
obtained for each sample used to test surfaces A*, B* and C*. This could provide a better way to
understand the expected behavior when the target surfaces (and the controls) are tested.
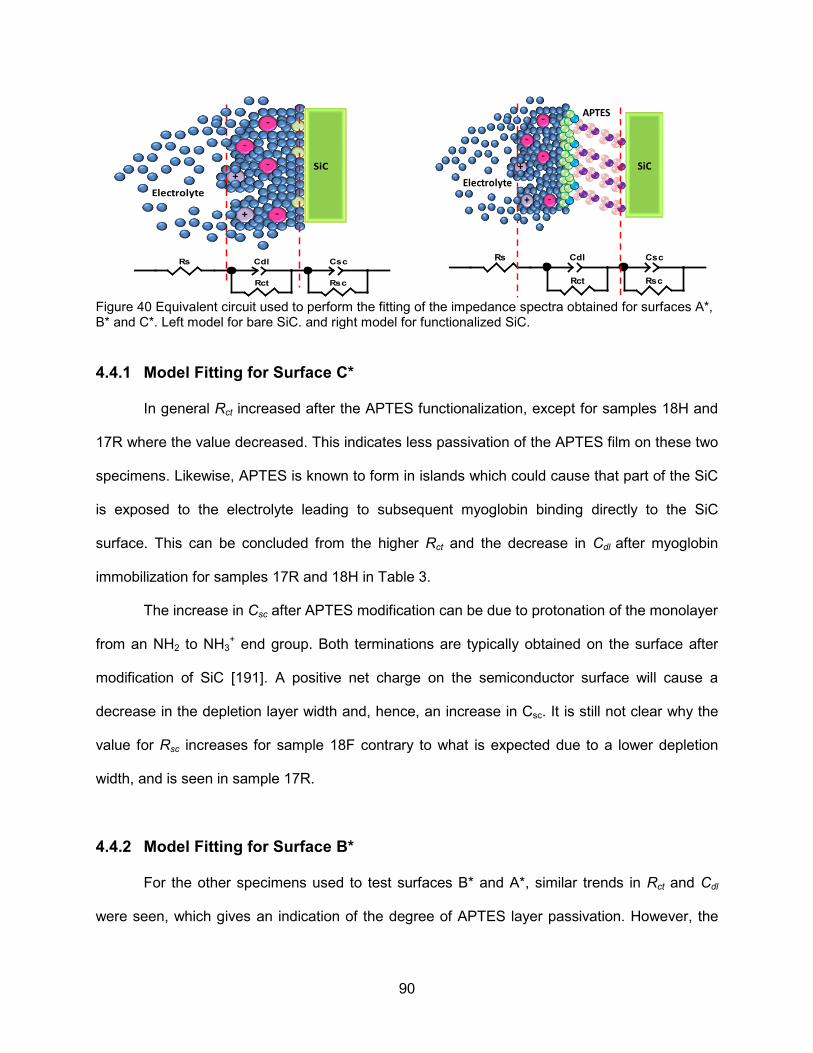
90
Figure 40 Equivalent circuit used to perform the fitting of the impedance spectra obtained for surfaces A*, B* and C*. Left model for bare SiC. and right model for functionalized SiC.
4.4.1 Model Fitting for Surface C*
In general Rct increased after the APTES functionalization, except for samples 18H and
17R where the value decreased. This indicates less passivation of the APTES film on these two
specimens. Likewise, APTES is known to form in islands which could cause that part of the SiC
is exposed to the electrolyte leading to subsequent myoglobin binding directly to the SiC
surface. This can be concluded from the higher Rct and the decrease in Cdl after myoglobin
immobilization for samples 17R and 18H in Table 3.
The increase in Csc after APTES modification can be due to protonation of the monolayer
from an NH2 to NH3+ end group. Both terminations are typically obtained on the surface after
modification of SiC [191]. A positive net charge on the semiconductor surface will cause a
decrease in the depletion layer width and, hence, an increase in Csc. It is still not clear why the
value for Rsc increases for sample 18F contrary to what is expected due to a lower depletion
width, and is seen in sample 17R.
4.4.2 Model Fitting for Surface B*
For the other specimens used to test surfaces B* and A*, similar trends in Rct and Cdl
were seen, which gives an indication of the degree of APTES layer passivation. However, the
-
-
-
-
+
+ SiC
Electrolyte
Rs Cdl
Rct
Csc
Rsc
-
-
-
-
+
+
APTES
SiCElectrolyte
Rs Cdl
Rct
Csc
Rsc
91
rest of the parameters do not present the percentage increase that was expected for all the
specimens. In the case of specimens 17P and 17Q (surface B* test) the Rct after anti-myoglobin
immobilization was reduced. One could think that the cross-linking of the anti-myoglobin
surfaces did not result in a uniform film. From Figure 37, the change in the impedance
magnitude is small which can be misinterpreted when fitting the model or perhaps a different
model should be used to fit the data. However, Csc shows an increase that could indicate the
presence of the positive charges due to the antibodies. It could also be an increase in
protonated end-groups of the APTES films that could prevent the anti-myoglobin from linking to
the surface. The final treatment that included the hemoglobin immobilization showed very small
changes in Rct for sample 17P but much higher increase on sample 17Q, which could suggest
NSB on the later sample. These results were not completely clear because the analysis of Csc
gives an indication of very little changes in the depletion width in the semiconductor.
4.4.3 Model Fitting for Surface A*
Similar trends with respect to the samples used to test surface B* were identified for
specimens 17C, 18B and 18C that were used surface A*. Even though some inconsistencies
where seen for Cdl, Rsc and Csc, one can see that for sample 17C the increase in Rct and
increase in Cdl, together with an increase in Csc after myoglobin immobilization, provides an
indication of the detection of the protein on this specimen.
On the other hand, on 18C after the myoglobin immobilization step we did not see
significant changes in Rct, Cdl in addition to a very small increase in Csc that confirms that no
protein was detected on this sample.
The net charge of the APTES, the antibodies and the later protein binding affect the
band bending of the semiconductor, as mentioned in chapter 2. From the model fitting some
conclusions were drawn and, in other to give the reader a more clear explanation, we provide
an illustration of changes in the SCR of the semiconductor for a particular charge present at the

92
semiconductor-electrolyte interface. Both the APTES and antibodies present a positive net
charge [208, 209], whereas myoglobin and hemoglobin tend to be negatively charged in buffers
with pH above their isoelectric point (pI). The pI for myoglobin is 7.2 and for hemoglobin is 6.5
[210, 211]. However, the conformation of the protein could change once bound to the surface
and also the amino acids that are exposed and that determine its net charge. When the n-type
semiconductor, SiC in this case, is in depletion (see chapter 2) and brought in contact with
positive charges the upward band bending is reduced by an amount proportional to Efb. In this
case, a small amount of majority carriers is induced close to the interface leading to a decrease
in depletion width, increase in capacitance and decrease in impedance. On the other hand, for a
negative charge molecular layer, the upward bending is increased and also the flat band
potential moves towards more negative values. In addition, an increase in impedance and
decreased capacitance are expected due a larger depletion width. For more details see the
illustration in Figure 41.
a)
b)
Figure 41 Schematic that illustrates the change in band bending after a) APTES, antibody immobilization and b) protein binding to antibody modified surfaces.
EF,n
Ec
EV
EiE (V)
+
-Efb after APTES or antibody
Efb (Bare SiC)
Efb after myoglobinEfb after APTES or antibodyEF,n
Ec
EV
EiE (V)
+
-

93
a)
b)
c)
d)
e)
f) Figure 42 Fitted values of Rct for a) surfaces C*, b) surfaces B*, and c) surfaces A*. Fitted values of Cdl for d) surfaces C*, e) surfaces B*, and f) surfaces A*. These values were obtained after fitting the equivalent circuit model described in Figure 40.
1.E+00
1.E+01
1.E+02
1.E+03
1.E+04
1.E+05
1.E+06
1.E+07
1.E+08
Bare SiC APTES Myo
Rct
(ohm
*cm
2 )
USF18F
USF18H
USF17R
1.E+02
1.E+03
1.E+04
1.E+05
1.E+06
1.E+07
1.E+08
Bare SiC APTES AntiMyo Hemo
Rct
(oh
m*
cm2)
USF17P
USF17Q
1.E+02
1.E+03
1.E+04
1.E+05
1.E+06
1.E+07
1.E+08
Bare SiC APTES AntiMyo Myo
Rct
(oh
m*
cm2)
USF17C
USF18B
USF18C
1.E-07
1.E-06
1.E-05
1.E-04
1.E-03
Bare SiC APTES Myo
Yo (o
hm-1
*cm
2 *sn )
USF18F
USF18H
USF17R
1.E-07
1.E-06
1.E-05
1.E-04
1.E-03
Bare SiC APTES AntiMyo Hemo
Yo (o
hm-1
*cm
2 *sn )
USF17P
USF17Q
1.E-07
1.E-06
1.E-05
1.E-04
1.E-03
Bare SiC APTES AntiMyo Myo
Yo (o
hm-1
*cm
2 *sn )
USF17C
USF18B
USF18C

94
a)
b)
c)
d)
e)
f)
Figure 43 Fitted values of Rcs for a) surfaces C*, b) surfaces B*, and c) surfaces A*. Fitted values of Csc d) surfaces C* e) surfaces B* and f) surfaces A*. These values were obtained after fitting the equivalent circuit model in Figure 40.
1.E+00
1.E+01
1.E+02
1.E+03
1.E+04
1.E+05
1.E+06
1.E+07
1.E+08
Bare SiC APTES Myo
Rsc (
ohm
*cm
2 )
USF18F
USF18H
USF17R
1.E+00
1.E+01
1.E+02
1.E+03
1.E+04
1.E+05
1.E+06
1.E+07
1.E+08
Bare SiC APTES AntiMyo Hemo
Rsc
(o
hm
*cm
2 )
USF17P
USF17Q
1.E+00
1.E+01
1.E+02
1.E+03
1.E+04
1.E+05
1.E+06
1.E+07
1.E+08
Bare SiC APTES AntiMyo Myo
Rsc
(ohm
*cm
2 )
USF17C
USF18B
USF18C
1.E-07
1.E-06
1.E-05
1.E-04
1.E-03
Bare SiC APTES Myo
Yo (o
hm-1
*cm
2 *sn )
USF18F
USF18H
USF17R
1.E-07
1.E-06
1.E-05
1.E-04
1.E-03
Bare SiC APTES AntiMyo Hemo
Yo (o
hm-1
*cm
2 *sn )
USF17P
USF17Q
1.E-07
1.E-06
1.E-05
1.E-04
1.E-03
Bare SiC APTES AntiMyo Myo
Yo (o
hm-1
*cm
2 *sn )
USF17C
USF18B
USF18C

95
Table 3 Percentage change in the values of Rct, Cdl, Rcs and Csc for surface C*.
Rct Cdl
∆ APTES-Bare ∆ Myo-APTES ∆ APTES-Bare ∆ Myo-APTES
18F 18H 17R
1895.78 -78.61 -24.64
12.40 2568.54 -99.95
-97.03 397.75 58.46
8.94 37.46 -46.06
Rsc Csc
18F 18H 17R
712.24 488.43 -76.54
-100.00 -96.48 3161.57
28.25 0.53 590.68
15.02 81.70 .76
Table 4 Percentage change in the values of Rct, Cdl, Rcs and Csc for surface B*.
Rct Cdl
∆ APTES-Bare ∆ AntiMyo-APTES ∆ Hemo-AntiMyo ∆ APTES-Bare ∆ AntiMyo-APTES ∆ Hemo-AntiMyo
17P 17Q
1691 371.54
-60.44 -61.16
-4.22 94.38
-84.7 -66.32
18.54 44.63
-5.5 -13.75
Rsc Csc
17P 17Q
19 290
671.8 94.1
3537 -60.66
-11.44 -9.78
19.45 44
2.5 -6.28
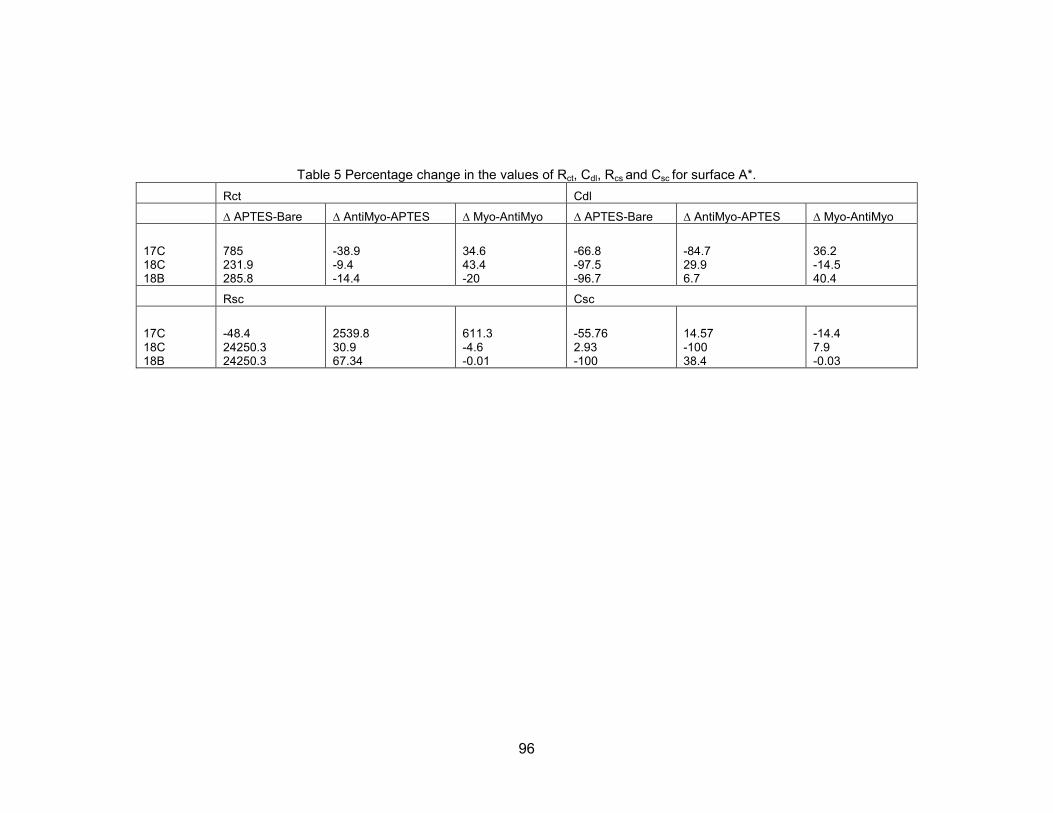
96
Table 5 Percentage change in the values of Rct, Cdl, Rcs and Csc for surface A*.
Rct Cdl
∆ APTES-Bare ∆ AntiMyo-APTES ∆ Myo-AntiMyo ∆ APTES-Bare ∆ AntiMyo-APTES ∆ Myo-AntiMyo
17C 18C 18B
785 231.9 285.8
-38.9 -9.4 -14.4
34.6 43.4 -20
-66.8 -97.5 -96.7
-84.7 29.9 6.7
36.2 -14.5 40.4
Rsc Csc
17C 18C 18B
-48.4 24250.3 24250.3
2539.8 30.9 67.34
611.3 -4.6 -0.01
-55.76 2.93 -100
14.57 -100 38.4
-14.4 7.9 -0.03
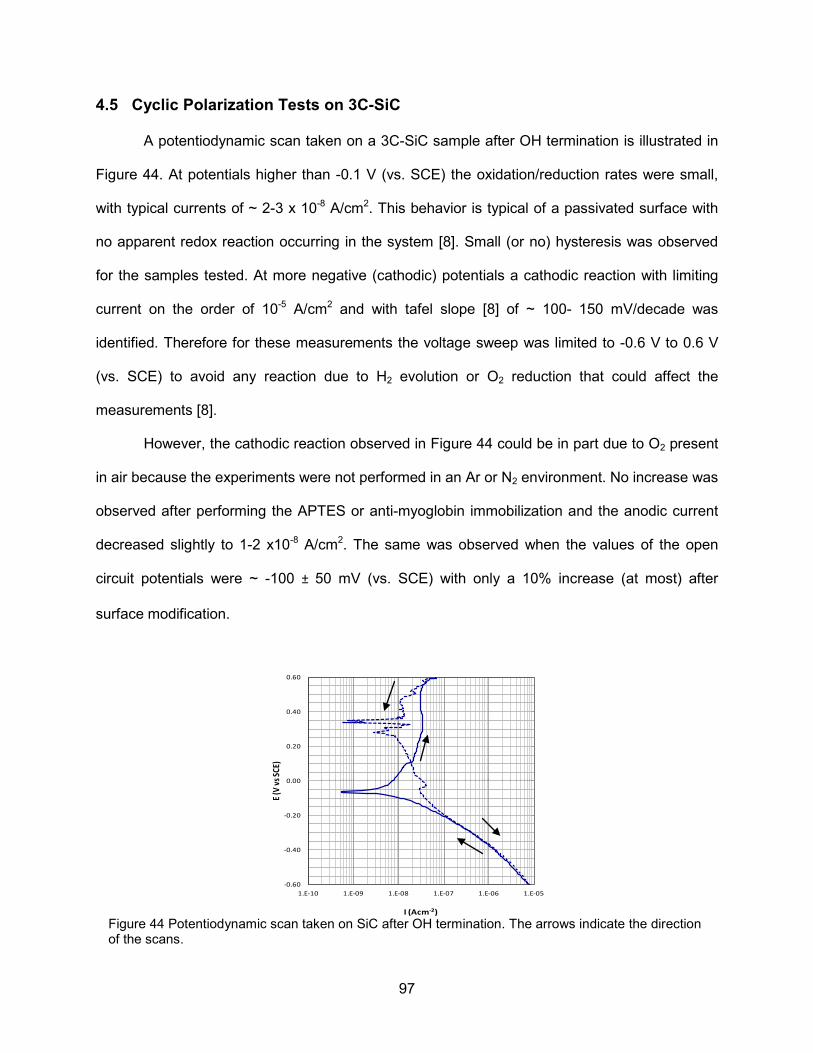
97
4.5 Cyclic Polarization Tests on 3C-SiC
A potentiodynamic scan taken on a 3C-SiC sample after OH termination is illustrated in
Figure 44. At potentials higher than -0.1 V (vs. SCE) the oxidation/reduction rates were small,
with typical currents of ~ 2-3 x 10⁻⁸ A/cm2. This behavior is typical of a passivated surface with
no apparent redox reaction occurring in the system [8]. Small (or no) hysteresis was observed
for the samples tested. At more negative (cathodic) potentials a cathodic reaction with limiting
current on the order of 10-5 A/cm2 and with tafel slope [8] of ~ 100- 150 mV/decade was
identified. Therefore for these measurements the voltage sweep was limited to -0.6 V to 0.6 V
(vs. SCE) to avoid any reaction due to H2 evolution or O2 reduction that could affect the
measurements [8].
However, the cathodic reaction observed in Figure 44 could be in part due to O2 present
in air because the experiments were not performed in an Ar or N2 environment. No increase was
observed after performing the APTES or anti-myoglobin immobilization and the anodic current
decreased slightly to 1-2 x10⁻⁸ A/cm2. The same was observed when the values of the open
circuit potentials were ~ -100 ± 50 mV (vs. SCE) with only a 10% increase (at most) after
surface modification.
Figure 44 Potentiodynamic scan taken on SiC after OH termination. The arrows indicate the direction of the scans.
-0.60
-0.40
-0.20
0.00
0.20
0.40
0.60
1.E-10 1.E-09 1.E-08 1.E-07 1.E-06 1.E-05
E (V
vs SC
E)
I (Acm-2)

98
4.6 Mott-Schottky Plots of Functionalized 3C-SiC
The Mott-Schottky plots obtained for the same surfaces described in the previous
section provided some information that could help us to better understand the impedance
results. However, a strong hysteresis was observed on some specimens which can be due to
the presence of surface states and defects as described in section4.1.1. For the analysis of the
Mott-Schottky plots, we used a model that included the series resistance (Rs) due to the
reference electrode, in series with a capacitor due to the semiconductor (Csc) in parallel with a
resistor (Rsc) to account for imperfections of the material.
4.6.1 Analysis of Mott-Schottky Plots for Surface C*
The results obtained for surface C* are shown in Figure 45. For specimen 18F after OH
termination a small peak close to -150 mV (vs. SCE) was identified which can be attributed to
the presence of surface states [212]. On both specimens 18F and 17R the value of the
capacitance increases after both APTES functionalization and myoglobin immobilization. While
there was not a big difference in capacitance on sample 18F after APTES, there was after
myoglobin incubation (a 3X increase). This behavior was not expected for sample 18F because
for this sample we assumed that myoglobin was not bound to the modified 3C-SiC surface
based on the Nyquist and impedance results (see Figure 34 and Figure 35). On the other hand,
there was a ~ 2X increase in capacitance from the bare substrate to the myoglobin
immobilization for sample 17R. We tried to maintain the same scale for the Mott-Schottky plots
but given the more pronounced changes in sample 17R compared to sample 18F.
Using the plots in Figure 45c and Figure 45d and equation (11) we found the flat band
potential (Efb) for the three specimens used to test surface C*. As we can see there is a strong
frequency dependence that is confirmed in Figure 46. At 10 kHz the values of the capacitance
are lower compare to the values obtained at 1 kHz. In addition, the change in capacitance after

99
APTES and myoglobin incubation is less at 10kHz than at 1kHz, which could be due to the
presence of surface states that have less effect at higher frequencies [151].
a)
b)
c)
d)
Figure 45 CV and Mott-Schottky plots obtained for each layer needed to form surface C* at 1kHz on specimen a) and c) 18F obtained from wafer USF1-13-18 and b) and d) 17R from wafer USF1-13-17.
Bare SiC APTES, Myoglobin. E denotes potential which is reported with respect to the SCE (saturated calomel electrode).
We can see in Table 6 that, in general, the flat band potentials are more negative at all
of the higher frequencies. For specimen 17R the standard deviation presents values that are
almost half of the calculated flat band potentials. The high values obtained for the standard
deviation of the Efb is a consequence of the hysteresis observed after running successive
experiments from -0.6V to 0.6 V (vs. SCE) and in the opposite direction. The hysteresis could
rise from the defects described in section 4.1.1 and surface states (trapped charges and
recombination), which was also seen in the variation of the value of Nd calculated after each
0.00E+00
1.00E-06
2.00E-06
3.00E-06
4.00E-06
5.00E-06
-0.6 -0.4 -0.2 0.0 0.2 0.4 0.6
C (F
*cm
-2 )
E (V vs SCE)
0.00E+00
1.00E-06
2.00E-06
3.00E-06
4.00E-06
5.00E-06
-0.6 -0.4 -0.2 0.0 0.2 0.4 0.6
C (F
*cm
-2 )
E (V vs SCE)
0
5E+11
1E+12
1.5E+12
-0.6 -0.4 -0.2 0.0 0.2 0.4 0.6
C -2
(cm
4 F-2
)
E (V vs SCE)
0
1.5E+12
3E+12
4.5E+12
-0.6 -0.4 -0.2 0.0 0.2 0.4 0.6
C -2
(cm
4 F-2
)
E (V vs SCE)
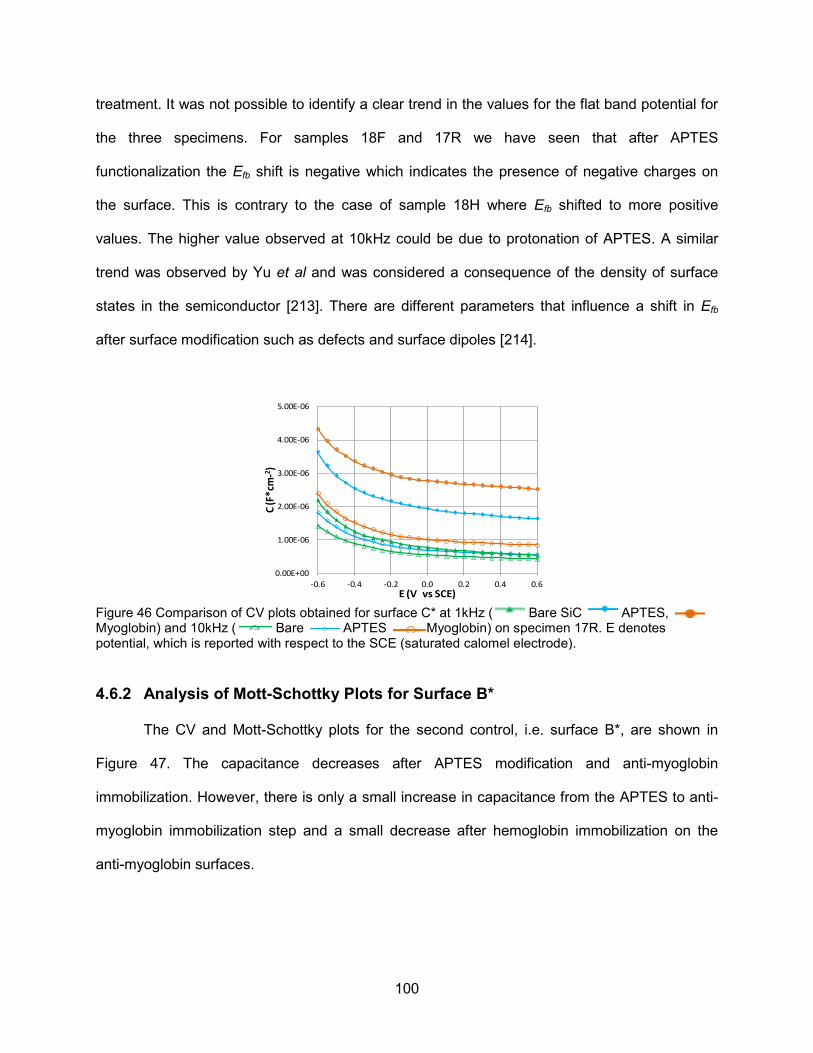
100
treatment. It was not possible to identify a clear trend in the values for the flat band potential for
the three specimens. For samples 18F and 17R we have seen that after APTES
functionalization the Efb shift is negative which indicates the presence of negative charges on
the surface. This is contrary to the case of sample 18H where Efb shifted to more positive
values. The higher value observed at 10kHz could be due to protonation of APTES. A similar
trend was observed by Yu et al and was considered a consequence of the density of surface
states in the semiconductor [213]. There are different parameters that influence a shift in Efb
after surface modification such as defects and surface dipoles [214].
Figure 46 Comparison of CV plots obtained for surface C* at 1kHz ( Bare SiC APTES, Myoglobin) and 10kHz ( Bare APTES Myoglobin) on specimen 17R. E denotes potential, which is reported with respect to the SCE (saturated calomel electrode).
4.6.2 Analysis of Mott-Schottky Plots for Surface B*
The CV and Mott-Schottky plots for the second control, i.e. surface B*, are shown in
Figure 47. The capacitance decreases after APTES modification and anti-myoglobin
immobilization. However, there is only a small increase in capacitance from the APTES to anti-
myoglobin immobilization step and a small decrease after hemoglobin immobilization on the
anti-myoglobin surfaces.
0.00E+00
1.00E-06
2.00E-06
3.00E-06
4.00E-06
5.00E-06
-0.6 -0.4 -0.2 0.0 0.2 0.4 0.6
C (F
*cm
-2 )
E (V vs SCE)

101
Table 6 Flat band potential at 1 kHz and 10 kHz for surface C*. Bare SiC APTES Myoglobin Efb (mV) Nd (cm-3) Efb (mV) Nd (cm-3) ∆ Efb (mV) Efb (mV) Nd (cm-3) ∆ Efb (mV) 18H
-775±17.7 -875±3.5
7.28x10¹⁸ 3.64x10¹⁸
-755±35 -720±14
1.45x10¹⁹ 4.85x10¹⁸
20±0 155±21
-361.25±507 -1600±0
1.82x10²⁰ 4.85x10¹⁹
-530±763 -880±28
1kHz 10kHz 18F 1kHz -590±84.8 1.46x10¹⁹ -955±35 2.43x10¹⁹ -365±120 -1200±212 1.46x10²⁰ -245±177 10kHz -845±7 3.64x10¹⁸ -875±35 7.28x10¹⁸ -30±28 -1350±155 1.82x10¹⁹ -475±35 17R 1kHz -593±298 1.46x10¹⁹ -1316±702 7.28x10¹⁹ -723±261 -2350±1504 3.64x10¹⁹ -1175±672 10kHz -790±456 1.46x10¹⁹ -1000±577 7.28x10¹⁹ -210±14 -1550±890.6 3.64x10¹⁸ -550±70.7

102
For the two specimens shown in Figure 47 the results were similar at 1kHz and 10kHz,
being the capacitance of specimen 17P was almost 3 times higher than that of sample 17Q. The
fact that the capacitance is ~ 2 μF/cm2 between 0.1V and 0.6 V (vs. SCE) can be due to the
presence of surface states that at 1kHz and 10kHz affect the interface in a way that we see the
effect of the double layer capacitance [215]. In both samples the same peak that was observed
in specimen 18F is also seen around -0.15 V (vs. SCE) and it shifts to -0.2 V (vs. SCE) after the
surface treatments. This is a consequence of surface states [212] which is confirmed in Figure
48. In this figure we can see that Mott-Schottky plots taken from -0.6 V to 0.6 V (vs. SCE) and in
the opposite direction present hysteresis and in Figure 48a the first scan performed present and
additional a peak ~ -0.15 V (vs. SCE) consistent with the behavior obtained in Figure 45a and
that is attributed to charge trapping and recombination in [149].
a)
b)
c)
d)
Figure 47 CV and Mott-Schottky plots obtained for each layer needed to form surface B* at 1kHz on specimen a) and c) 17P and b) and d) 17Q both from wafer USF1-13-17. Bare SiC APTES,
Anti-Myoglobin Hemoglobin.
0.0E+00
1.5E-06
3.0E-06
4.5E-06
6.0E-06
-0.6 -0.4 -0.2 0.0 0.2 0.4 0.6
C (F
*cm
-2)
E (V vs SCE)0.0E+00
1.5E-06
3.0E-06
4.5E-06
6.0E-06
7.5E-06
-0.6 -0.4 -0.2 0.0 0.2 0.4 0.6
C (F
*cm
-2)
E (V vs SCE)
0
4E+11
8E+11
1.2E+12
1.6E+12
-0.6 -0.4 -0.2 0.0 0.2 0.4 0.6
C -2
(cm
4*F-2
)
E (V vs SCE)
0
4E+11
8E+11
1.2E+12
1.6E+12
-0.6 -0.4 -0.2 0.0 0.2 0.4 0.6
C -2
(cm
4*F-2
)
E/V (SCE)

103
The frequency dependence of the CV and Mott-Schottky plots taken on the specimens
used to test surface B* is illustrated in Figure 48. A strong hysteresis effect is observed at 1 kHz
that is reduced at 10 kHz but does not disappear at the higher frequencies, say at 100 kHz. The
same effect is observed after taking the measurements on the modified surfaces. The reduced
hysteresis effect after APTES and anti-myoglobin immobilization may be an indication of the
passivation these layers provide by blocking any surface-charge exchange with the electrolyte.
However, for these specimens the measurements obtained at 100 kHz showed consistent
values of Nd from the starting surface to the last treatment, similar to the ones obtained for these
specimens with a Hg probe. In addition, the error in the calculated Efb (see Table 8) is less
compared to the 1kHz experiments.
Increasing the test frequency to 100 kHz (see Figure 49) shows almost no change in
capacitance after immobilization of hemoglobin, which confirms the specificity of the SiC-anti-
myoglobin substrates as indicated in section 3.3.3.2. This behavior is also confirmed in the
small change in Efb obtained from the Mott-Schottky plot in Figure 49b. At this frequency we
also see that at the more negative potentials the capacitance reaches a plateau that is more
stable after APTES formation, which has been related to the organic layer blocking the electrons
at the surface of the semiconductor [216].
The calculation of the Efb did not provide consistent results for both specimens after
each treatment at the different frequencies. In addition the values of the calculated Nd varied at
1kHz and 10kHz but was ~ 1018 cm-3 at 100kHz after each treatment was performed. This is an
indication of a reduced impact of the surface states at higher frequency. The variability in Nd is
also higher in sample 17P than in sample 17Q, which could be due to variations in SiC film
thickness because the wafer was not rotated during the growth process (there is a slight
variation in film thickness as a result). The higher Nd values measured for sample 17P could
also explain why variations in the Cdl or how the molecular layer affects the CV shown in Figure
47.

104
a)
b)
c)
Figure 48 Mott-Schottky plots obtained for specimen 17P after OH termination at a) 1 kHz b) 10 kHz and c) 100kHz on specimen on 17P. and represent scans taken from -0.6 to 0.6 V each followed by and taken from 0.6 to -0.6 V.
0
5E+10
1E+11
1.5E+11
2E+11
2.5E+11
-0.6 -0.4 -0.2 0.0 0.2 0.4 0.6
C -2
(F-2
* cm4 )
E (V vs SCE)
0
1.5E+11
3E+11
4.5E+11
6E+11
7.5E+11
-0.6 -0.4 -0.2 0.0 0.2 0.4 0.6
C -2
(F-2
* cm4 )
E (V vs SCE)
0
5E+11
1E+12
1.5E+12
2E+12
2.5E+12
-0.6 -0.4 -0.2 0.0 0.2 0.4 0.6
C -2
(F-2
* cm
4 )
E (V vs SCE)
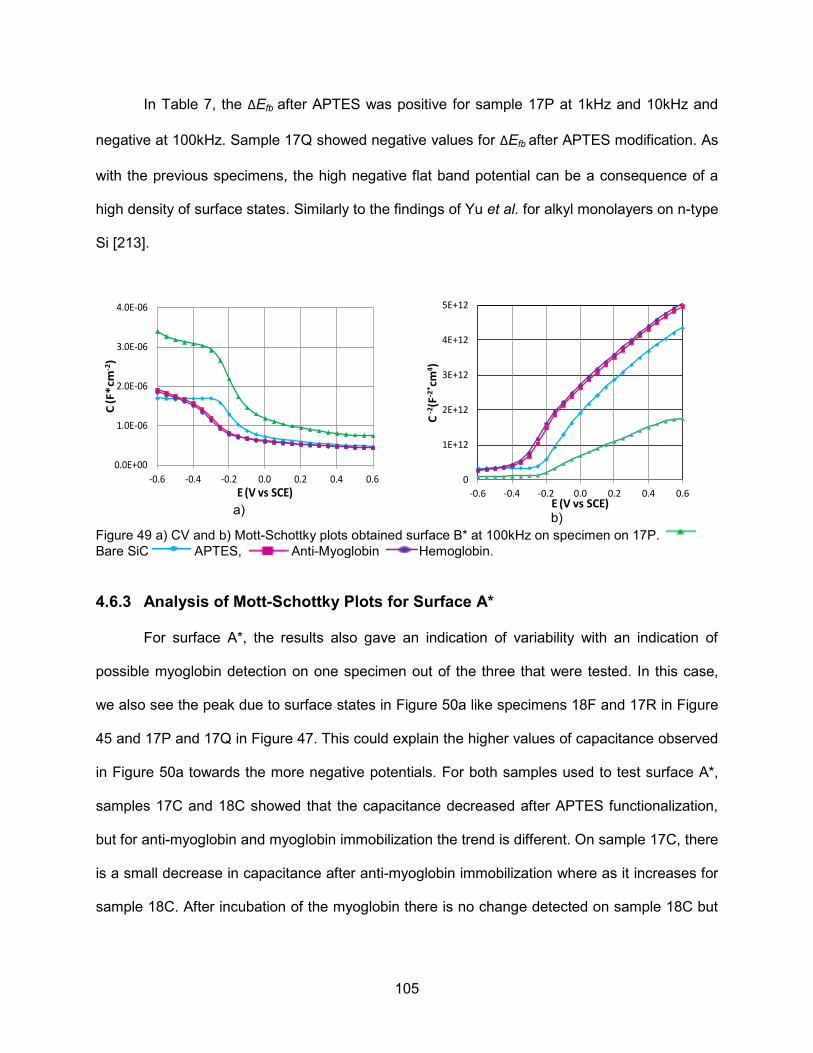
105
In Table 7, the ∆Efb after APTES was positive for sample 17P at 1kHz and 10kHz and
negative at 100kHz. Sample 17Q showed negative values for ∆Efb after APTES modification. As
with the previous specimens, the high negative flat band potential can be a consequence of a
high density of surface states. Similarly to the findings of Yu et al. for alkyl monolayers on n-type
Si [213].
a)
b) Figure 49 a) CV and b) Mott-Schottky plots obtained surface B* at 100kHz on specimen on 17P. Bare SiC APTES, Anti-Myoglobin Hemoglobin.
4.6.3 Analysis of Mott-Schottky Plots for Surface A*
For surface A*, the results also gave an indication of variability with an indication of
possible myoglobin detection on one specimen out of the three that were tested. In this case,
we also see the peak due to surface states in Figure 50a like specimens 18F and 17R in Figure
45 and 17P and 17Q in Figure 47. This could explain the higher values of capacitance observed
in Figure 50a towards the more negative potentials. For both samples used to test surface A*,
samples 17C and 18C showed that the capacitance decreased after APTES functionalization,
but for anti-myoglobin and myoglobin immobilization the trend is different. On sample 17C, there
is a small decrease in capacitance after anti-myoglobin immobilization where as it increases for
sample 18C. After incubation of the myoglobin there is no change detected on sample 18C but
0.0E+00
1.0E-06
2.0E-06
3.0E-06
4.0E-06
-0.6 -0.4 -0.2 0.0 0.2 0.4 0.6
C (F
*cm
-2)
E (V vs SCE)0
1E+12
2E+12
3E+12
4E+12
5E+12
-0.6 -0.4 -0.2 0.0 0.2 0.4 0.6
C -2
(F-2
* cm
4 )
E (V vs SCE)
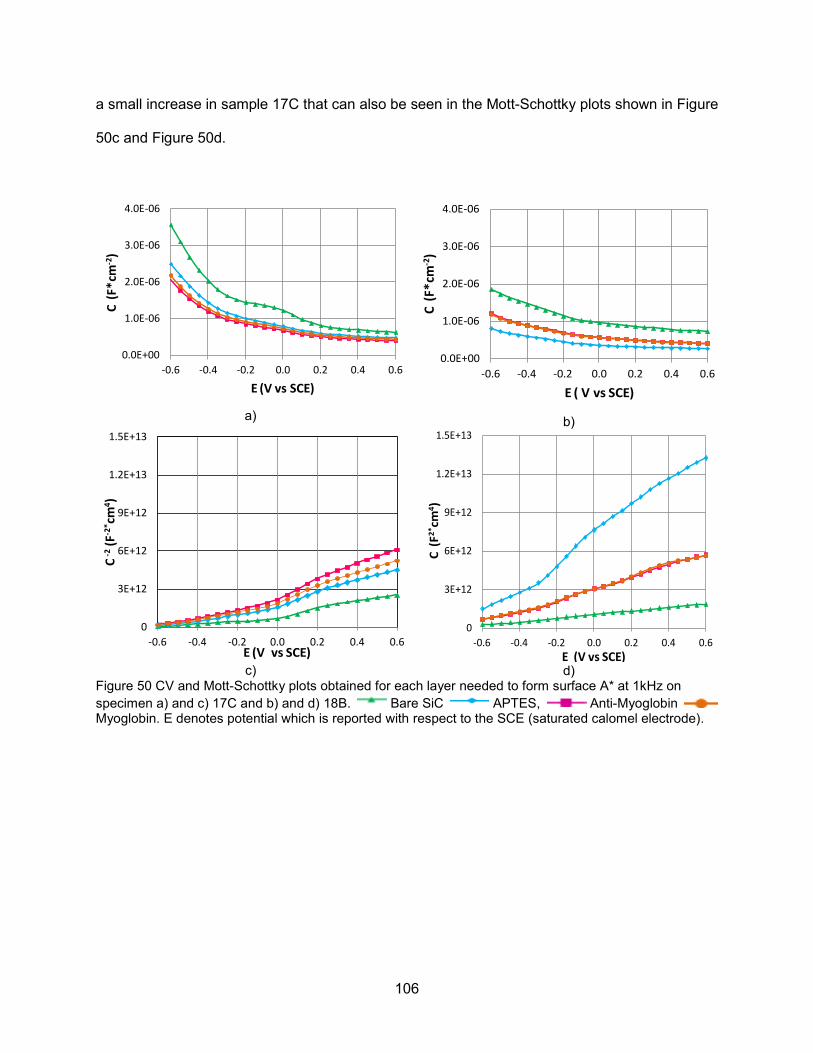
106
a small increase in sample 17C that can also be seen in the Mott-Schottky plots shown in Figure
50c and Figure 50d.
a)
b)
c)
d)
Figure 50 CV and Mott-Schottky plots obtained for each layer needed to form surface A* at 1kHz on specimen a) and c) 17C and b) and d) 18B. Bare SiC APTES, Anti-Myoglobin Myoglobin. E denotes potential which is reported with respect to the SCE (saturated calomel electrode).
0.0E+00
1.0E-06
2.0E-06
3.0E-06
4.0E-06
-0.6 -0.4 -0.2 0.0 0.2 0.4 0.6
C (F
*cm
-2)
E (V vs SCE)
0.0E+00
1.0E-06
2.0E-06
3.0E-06
4.0E-06
-0.6 -0.4 -0.2 0.0 0.2 0.4 0.6
C (F
*cm
-2)
E ( V vs SCE)
0
3E+12
6E+12
9E+12
1.2E+13
1.5E+13
-0.6 -0.4 -0.2 0.0 0.2 0.4 0.6
C -2
(F-2
* cm
4 )
E (V vs SCE)
0
3E+12
6E+12
9E+12
1.2E+13
1.5E+13
-0.6 -0.4 -0.2 0.0 0.2 0.4 0.6
C (F
2*cm
4 )
E (V vs SCE)
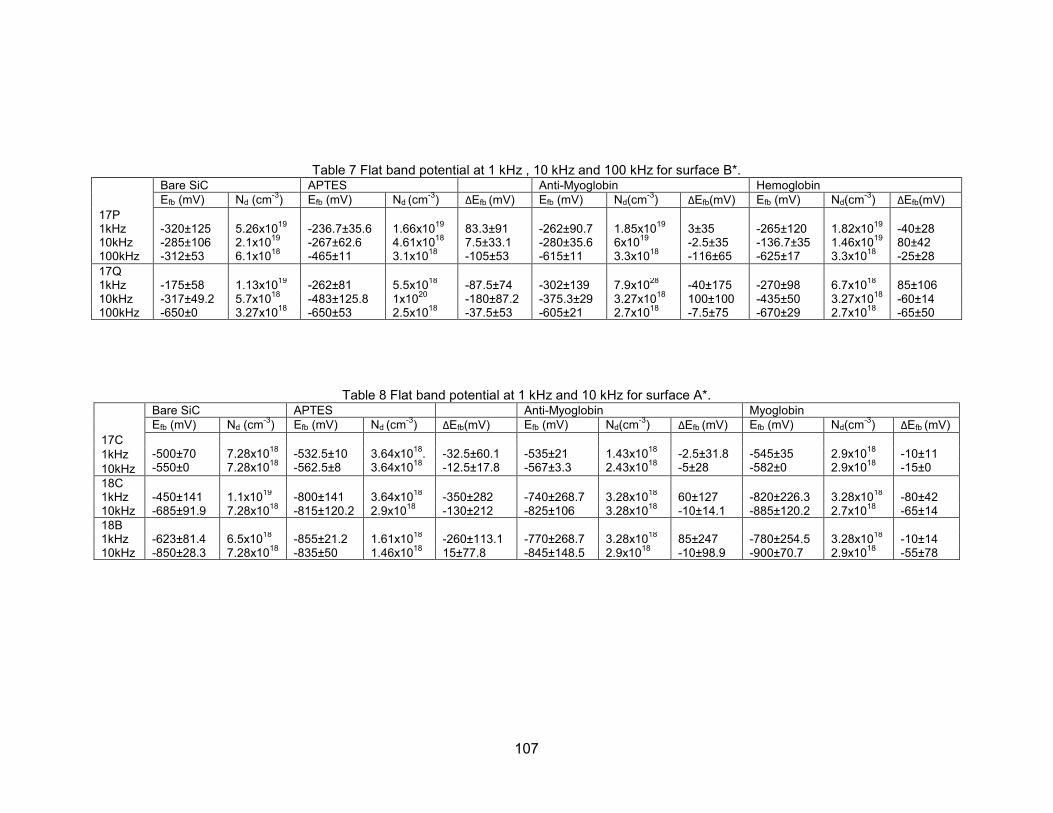
107
Table 7 Flat band potential at 1 kHz , 10 kHz and 100 kHz for surface B*. Bare SiC APTES Anti-Myoglobin Hemoglobin
Efb (mV) Nd (cm-3) Efb (mV) Nd (cm-3) ∆Efb (mV) Efb (mV) Nd(cm-3) ∆Efb(mV) Efb (mV) Nd(cm-3) ∆Efb(mV) 17P 1kHz 10kHz 100kHz
-320±125 -285±106 -312±53
5.26x10¹⁹ 2.1x10¹⁹
6.1x10¹⁸
-236.7±35.6 -267±62.6 -465±11
1.66x10¹⁹ 4.61x10¹⁸
3.1x10¹⁸
83.3±91 7.5±33.1 -105±53
-262±90.7 -280±35.6 -615±11
1.85x10¹⁹ 6x10¹⁹
3.3x10¹⁸
3±35 -2.5±35 -116±65
-265±120 -136.7±35 -625±17
1.82x10¹⁹ 1.46x10¹⁹
3.3x10¹⁸
-40±28 80±42 -25±28
17Q 1kHz -175±58 1.13x10¹⁹ -262±81 5.5x10¹⁸ -87.5±74 -302±139 7.9x1028 -40±175 -270±98 6.7x10¹⁸ 85±106 10kHz -317±49.2 5.7x10¹⁸ -483±125.8 1x10²⁰ -180±87.2 -375.3±29 3.27x10¹⁸ 100±100 -435±50 3.27x10¹⁸ -60±14 100kHz -650±0 3.27x10¹⁸ -650±53 2.5x10¹⁸ -37.5±53 -605±21 2.7x10¹⁸ -7.5±75 -670±29 2.7x10¹⁸ -65±50
Table 8 Flat band potential at 1 kHz and 10 kHz for surface A*. Bare SiC APTES Anti-Myoglobin Myoglobin
Efb (mV) Nd (cm-3) Efb (mV) Nd (cm-3) ∆Efb(mV) Efb (mV) Nd(cm-3) ∆Efb (mV) Efb (mV) Nd(cm-3) ∆Efb (mV) 17C
-500±70 -550±0
7.28x10¹⁸
7.28x10¹⁸
-532.5±10 -562.5±8
3.64x10¹⁸. 3.64x10¹⁸
-32.5±60.1 -12.5±17.8
-535±21 -567±3.3
1.43x10¹⁸ 2.43x10¹⁸
-2.5±31.8 -5±28
-545±35 -582±0
2.9x10¹⁸
2.9x10¹⁸
-10±11 -15±0
1kHz 10kHz 18C 1kHz -450±141 1.1x10¹⁹ -800±141 3.64x10¹⁸ -350±282 -740±268.7 3.28x10¹⁸ 60±127 -820±226.3 3.28x10¹⁸ -80±42 10kHz -685±91.9 7.28x10¹⁸ -815±120.2 2.9x10¹⁸ -130±212 -825±106 3.28x10¹⁸ -10±14.1 -885±120.2 2.7x10¹⁸ -65±14 18B 1kHz -623±81.4 6.5x10¹⁸ -855±21.2 1.61x10¹⁸ -260±113.1 -770±268.7 3.28x10¹⁸ 85±247 -780±254.5 3.28x10¹⁸ -10±14 10kHz -850±28.3 7.28x10¹⁸ -835±50 1.46x10¹⁸ 15±77.8 -845±148.5 2.9x10¹⁸ -10±98.9 -900±70.7 2.9x10¹⁸ -55±78

108
For these specimens it was not possible to obtain one unique conclusion from the
extrapolated flat band potentials. At 1 kHZ and 10 kHz, samples 17C and 18C had a ∆Efb from -
45 mV (vs. SCE) to -350 mV (vs. SCE) similar to sample 18B after APTES functionalization,
although the later only had a ∆Efb. of 15 (vs. SCE) Small changes in flat band potentials after
surface functionalization have been linked to no surface dipole formation on the surface [213].
On the other hand, in the cases where the ∆Efb is more than -100 mV can be a consequence of
the presence of surface states [213]. For the surface with the immobilized anti-myoglobin the
∆Efb is less than 100 mV (vs. SCE) for the three specimens being only -10 mV (vs. SCE) for
sample 18B and 18C at 10 kHz.
After myoglobin immobilization we can see in Table 8 that a very negative ∆Efb of ~ -1V
(vs. SCE) was observed. Myoglobin presents a negative charge at pH higher than 5.3 [210] and
for this reason the value that we found for the flat band potential after myoglobin immobilization
on the anti-myoglobin surfaces could be an indication of the detection. However, if we consider
the impedance results in Figure 38 and Figure 39 this could only be true for specimen 17C.
4.7 Discussion and Conclusions of the Myoglobin Detection on SiC Via
Impedance Spectroscopy
Even though the data obtained for the impedance detection of myoglobin on
functionalized 3C-SiC did not present a unified trend a few conclusions can be drawn from this
work. One step that proved to be very important to successfully perform the binding of the
protein to the surface was the preparation of the self-assembled monolayers. In section 3.1 we
presented an extensive discussion in the preparation and characterization of self-assembled
monolayers on SiC. Even though researchers have been successful in modifying the surface
termination of SiC this technique may not be adequate to guarantee the success in the
fabrication of a SiC-field effect device in contact with an electrolyte. This step will directly impact

109
the covalent linking of the antibodies, which also has problems on its own as discussed in
sections 1.3.1.2 and 3.3.3.
Since our main goal was to use the Mott-Schottky plots as the main characterization
approach to determine successful detection of myoglobin on SiC it is worth to spend some time
discussing some of the factors that could have impacted the variability in our results. One of the
main issues could be the position of the reference electrode, as we mentioned in section 4.3,
and the effective area that is exposed to the electrolyte that affects the apparent capacitance
measured which could be a consequence of not accurately measuring the pressing force of the
o-ring against the SiC sample. This could affect both the impedance and CV measurements and
provide variable results.
From the Mott-Schottky plots, it was interesting to see a peak in the CV plots that other
authors have seen as a consequence of the presence of surface states [216, 217]. In addition a
strong frequency dependence was also seen in all the specimens tested, an example is shown
in Figure 48 and Figure 49. This effect has been related to surface states [149, 156], non-
uniform spatial doping and the presence of deep donor and acceptor impurities [151, 157].
In most of the Mott-Schottky plots we observed two slopes, even for the SiC before the
chemical modification. Some authors have found a similar behavior on alkyl modified p-type and
n-type Si, which indicates that due to the thin films the semiconductor does not reach inversion
but goes into deep depletion and this has been explained by the presence of deep localized
levels [218]. Lauermann et al. also found it difficult to obtain straight and reproducible Mott-
Schottky plots with 6H-SiC and 3C-SiC, hence making it difficult to calculate accurately the flat
band potential [219]. Similarly to what we have found, their extrapolated flat band potential is ~ -
350 mV (vs. SCE) at pH 0 with an increase of 52 mV per pH, which gives ~ -450 mV (vs. SCE)
at pH 7. The results presented in Table 6 to Table 8 showed similar values and some were
higher in some cases. They concluded that the quality of the crystal and the presence of surface
states, obtained from photocurrent measurements, affected significantly their results [219].

110
We also found that in some cases the flat band potential shifted towards more negative
values after APTES and anti-myoglobin immobilization. Einati et al. found shifts towards positive
potentials after APDEMS functionalization of p-type Si and an increase in the magnitude
towards positive potentials have been attributed to protonation of the end-groups [214]. On the
other hand, a decrease and/or more negative flat band potentials have been identified when
negatively charged ions are adsorbed at a semiconductor surface [220]. And also on alkyl
monolayers films prepared on n-type Si in addition to a decrease in capacitance after
functionalization of the Si surfaces [213, 216]. The variability and flat band potential shift after
surface functionalization can be affected by defects in the structure. In particular, APTES has
been demonstrated to form in islands and tends to crosslink both the substrate and the
organosilane itself preventing the crosslinking of other proteins effectively to the surface [221,
222]. In some cases, the quality of the monolayer is not an issue, but the rearrangement of the
dipole charge on the substrate after adding the monolayer or the interaction of the monolayer
with the electrolyte [214]. In order to understand if the last two phenomena are affecting our
measurements further experimentation needs to be conducted.
Because of the variability on the results, we conclude that using the Mott-Schottky and
impedance spectroscopy techniques proved not to be reliable to detect myoglobin
immobilization under the specified conditions. Some authors have obtained similar uncertainty
in their work with the immobilization of anti-α-fetoprotein on p-type Si for the detection of the
respective antigen (α-fetoprotein). Due to inconsistency of their results at different frequencies
the authors opted to use the real component of the impedance obtained after Mott-Schottky
measurements at higher frequencies (e.g. 100kHz) to identify changes in antibody-antigen
binding [11]. Similarly, Bataillard et al. investigated the detection of the same antigen using also
anti-α-fetoprotein on p-type Si.

111
Because it was not possible to differentiate the flat band potential changes after the
surface modifications these authors opted to extend their scanning potential range to analyze
the molecular layer capacitance and not the capacitance in the space charge region of the
semiconductor [223]. Both of these approaches could be implemented in our research,
considering that by extending the voltage range other chemical processes could take place
during the experiment.
More experiments should be performed in order to explain some of the trends observed
for the parameters of the equivalent circuit model and the flat band potential shift. This includes
using an electrolyte with different pH, performing the EIS measurements at a fixed DC bias with
respect to the reference electrode, comparing the fitting of the data to other equivalent circuits,
among other changes in the electrochemical cell that will be described in Chapter 5.
112
5 CHAPTER 5: CONCLUSIONS AND FUTURE WORK
There are many opportunities to use SiC as a substrate and active material to be
incorporated in devices that require certain chemical, mechanical and electrical properties when
implanted in the harsh environment of the human body. In this dissertation we presented a
study that included the surface modification of SiC for the development of immunosensors. The
polytype of interest was 3C-SiC because of the proven hema-compatibility and biocompatibility
with several cell lines that indicated that it may be a viable substrate to detect biomarkers in
blood. Moreover, there is still a need to look for more explanations to identify how surface
charge, morphology, and chemical termination affect cell attachment and proliferation, as well
as toxic and pharmacokinetic effects of SiC in-vivo. In order to address hema-compatibility in-
vivo, hema-compatibility must be first studied under blood flow conditions and target the
expression of specific proteins such as P-selectin and fibrinogen [110, 224, 225].
We were also interested in using SiC to build a device to predict silent myocardial
infarction, because the integration of other materials and systems on SiC increases the
possibilities to create complex devices that can perform multiple biomolecule detection and
analysis on a single platform (i.e. system on a chip). At first glance, some of the proposed
devices built on SiC could be considered costly because of the costs associated with material
fabrication. At the same time, since SiC is a potential material for long-term device implantation,
other costs associated with patient treatment and multiple surgeries for implant replacement can
be reduced thus rendering SiC-based biosensors (like the one proposed in this work) more than
cost effective, not to mention the obvious improvement in the quality of life for patients who can
avoid repetitive surgical procedures.

113
5.1 Conclusions
In Chapter 2 we discussed some of the main advantages of using SiC in biosensors and
summarized the type of polytype and crystal suitable for particular applications. This depends
on a particular doping level selected in order for this material to be used in impedance or
potentiostatic systems. Likewise, care should be taken in the characterization of the SiC film or
polytype to be used. As we demonstrated in chapter4, the inherent presence of defects (e.g.
stacking faults, voids, etc.) significantly impacts the response of electrically based biosensors.
Since the surface functionalization of SiC with organic molecules is recognized as a
crucial step in biological sensor development, it has been demonstrated on all relevant forms of
SiC. In chapter 3 we demonstrated the successful immobilization of anti-myoglobin and later,
the detection of myoglobin via fluorescent microscopy. However, by performing impedance
spectroscopy experiments in Chapter 4 the binding of myoglobin on SiC modified surfaces was
not easy to identify. And we believe that the quality of the APTES films contributed significantly
to the results. For this reason, we suggest that more efforts should be dedicated to further
developing self-initiated photografting and photopolymerization (SIPGP) films on SiC [165, 226,
227]. These types of films could provide a more reproducible and uniform film for the precise
immobilization of antibodies or other targeted proteins.
5.2 Future Work
Because of the high variability of the results observed in the impedance spectroscopy
and Mott-Schottky measurements in sections 4.3 and 4.6, we propose to do several
modifications to the electrochemical setup. This includes making a fixture that provides a
precise method to fix the reference electrode (activated Ti mesh) every time the samples are
inserted or removed from the setup. In addition, because initially an SU8 coating was used as a
passivation layer for the electrode and it seemed to fail in some of the specimens thus affecting
114
the results, we propose to increase the inside diameter of the inner electrode compared to the
o-ring used to fix the sample. This way the metal of the electrode will not be exposed to the
electrolyte and there are no chances of having parasitic capacitance effects due to a failed
protective coating.
Another issue that was identified after building the cell was the use of screws to press
the sample against the o-ring (see Figure 33). This may contribute to differences in apparent
capacitance due to different pressure on the sample after surface treatment. It is not clear yet
how to improve this but we need to find a way to fix the sample without pressing to hard and
break it.
Using Si as a control experiment can also provide better insight into how the defects
inherent in the SiC material affects the results. Some similarities have been observed with some
of our results and similar work performed on Si. Because Si has been widely characterized and
it has less surface defects, having a highly doped n-type Si crystal could help to predict
impedance and flat band potential changes after the protein immobilization on these
semiconductor surfaces. In addition, we can perform the analysis and fitting the impedance
results with other equivalent circuit models that includes more resistive or capacitive elements
that resemble failed coatings [207, 215]. On the other hand, we can focus our work into
measuring the resistive or capacitive effect cause by the immobilized biomolecules
implementing an analysis approach like the ones proposed by Souteyrand et al. [228] and
Bataillard et al. [223] and described in section 4.7.
Lastly, since we also discussed in chapter 2 that SiC can be produced in different forms
(e.g. BioSiC made from wood, a-SiC, nanoporous SiC, etc.) and polytypes (i.e. cubic,
rombohedral and hexagonal) we can also explore the construction of interdigitated
microelectrode (IME) arrays on amorphous-SiC (a-SiC). The initial idea when this dissertation
work was started was to develop IMEs on SiC but, at the moment we did not have access to
insulating SiC material. Recently, we have developed in the SiC group with the support of the

115
NREC staff, 200 nm a-SiC films (via PECVD) that do not present apparent defects or pinholes
as demonstrated by the SEM images in Figure 51, taken at different magnifications with a
Hitachi SU-70 SEM. We have also built some IMEs on a-SiC and SiO2 using Ti/Au as the metal
electrode with a 5 μm and 10 μm pitch. The sensors showed a small leakage current, a good
indication of the insulating properties of the a-SiC films. However, some improvements may
need to be done regarding the mask used to make the devices, such as undercutting and non-
straight edges that were observed via SEM in Figure 52b.
a)
b)
Figure 51 SEM images taken on a-SiC films. Films deposited by J. Register and R. Everly in the Plasmatherm 700 PECVD took at the USF NREC core facility.
a)
b)
Figure 52 Photograph of a) IME built on a-SiC and b) SEM image of the Ti/Au digits of the IME built on a-SiC.

116
6 REFERENCES
[1] A. Guiseppi-Elie, "An implantable biochip to influence patient outcomes following trauma-induced hemorrhage," Anal Bioanal Chem, vol. 399, pp. 403-419, 2011.
[2] P. Connolly, "The potential for biosensors in cardiac surgery," Perfusion, vol. 19, pp.
247-249, 2004. [3] D. D. Gutterman, "Silent Myocardial Ischemia," Circulation, pp. 785 – 797, 2009. [4] R. H. Christenson and H. M. E. Azzazy, "Biochemical markers of the acute coronary
syndromes," Clinical Chemistry, vol. 44, pp. 1855–1864, 1998. [5] S. E. Saddow, C. L. Frewin, C. Coletti, N. Schettini, E. Weeber, a. Oliveros, et al.,
"Single-Crystal Silicon Carbide: A Biocompatible and Hemocompatible Semiconductor for Advanced Biomedical Applications," Materials Science Forum, vol. 679-680, pp. 824-830, 2011.
[6] A. Rzany, C. Harder, and M. Schaldach, " Silicon Carbide as an Anti-Thrombogenic
Stent Coating: An Example of a Science-Based Development Strategy " Progress in Biomedical Research, vol. 5, pp. 168-78, 2000.
[7] C. Hehrlein, "aSiC : H-coated Stents Stent Passivation with Silicon Carbide as a
Possible Alternative to Drug-eluting Stents – A Comprehensive Review of Pre-clinical and Clinical Results," Interventional Cardiology, vol. 4, pp. 60-63, 2009.
[8] A. Tlili, M. A. Jarboui, A. Abdelghani, D. M. Fathallah, and M. A. Maaref, "A novel silicon
nitride biosensor for specific antibody–antigen interaction," Materials Science and Engineering: C, vol. 25, pp. 490-495, 6// 2005.
[9] A. Lloyd Spetz, S. Nakagomi, and S. Savage, "High temperature SiC-FET chemical gas
sensors " in Advances in Silicon Carbide Processing and Applications, S. E. Saddow and A. Agrawal, Eds., ed Norwood, MA: Artech House, 2004, pp. 29–67.
[10] G. Gabriel, I. Erill, J. Caro, R. Gomez, D. Riera, R. Villa, et al., "Manufacturing and full
characterization of silicon carbide-based multi-sensor micro-probes for biomedical applications," Microelectronics Journal, vol. 38, pp. 406-415, Mar 2007.
[11] E. Souteyrand, J. P. Cloarec, J. R. Martin, C. Wilson, I. Lawrence, S. Mikkelsen, et al.,
"Direct Detection of the Hybridization of Synthetic Homo-Oligomer DNA Sequences by Field Effect," The Journal of Physical Chemistry B, vol. 101, pp. 2980-2985, 1997.

117
[12] A. M. Gutierrez, G. R. Reboredo, S. M. Mosca, and A. Catala, "Fatty acid composition and lipid peroxidation induced by ascorbate-Fe2+ in different organs of goose (Anser anser)," Comparative Biochemistry and Physiology C-Toxicology & Pharmacology, vol. 137, pp. 123-132, Feb 2004.
[13] S. J. H. A. S. McLean, and M. Salter "Bench-to-bedside review: the value of cardiac
biomarkers in the intensive care patient," Critical care (London, England), vol. 12, p. 215, 2008.
[14] N. K. J. Manoj, R. Lal, S. Mukherji, and V. Ramgopal Rao, Bionanotechnology Global
Prospects vol. CRC Press: Boca Raton, 2009. [15] M. Zafari, L. C. Afonso, K. Aggarwal, E. Bessman, and D. L. Coven, "Myocardial
Infarction," ed, 2011. [16] A. H. Ahmed, K. Shankar, H. Eftekhari, M. Munir, J. Robertson, A. Brewer, et al., "Silent
myocardial ischemia: Current perspectives and future directions," Exp Clin Cardiol, vol. 12, pp. 189-96, Winter 2007.
[17] C. Pepine, "Silent myocardial ischemia: Definition, magnitude, and scope of the
problem," Cardiology Clinics, vol. 4, pp. 577 – 581, 1986. [18] Y. Rozenman and M. S. Gotsman, "THE EARLIEST DIAGNOSIS OF ACUTE
MYOCARDIAL-INFARCTION," Annual Review of Medicine, vol. 45, pp. 31-44, 1994. [19] K. A. Ammar, J. A. Kors, B. P. Yawn, and R. J. Rodeheffer, "Defining unrecognized
myocardial infarction: a call for standardized electrocardiographic diagnostic criteria," Am Heart J, vol. 148, pp. 277-84, Aug 2004.
[20] K. Komukai, T. Ogawa, H. Yagi, T. Date, K. Suzuki, H. Sakamoto, et al., "Renal
insufficiency is related to painless myocardial infarction," Circ J, vol. 71, pp. 1366-9, Sep 2007.
[21] A. M. Amanullah and K. Lindvall, "Prevalence and significance of transient —
Predominantly asymptomatic — Myocardial ischemia on Holter monitoring in unstable angina pectoris, and correlation with exercise test and thallium-201 myocardial perfusion imaging," The American Journal of Cardiology, vol. 72, pp. 144-148, 7/15/ 1993.
[22] H. Mickley, "Ambulatory ST segment monitoring after myocardial infarction," Brittish
Heart Journal, vol. 71, pp. 113-114, 1994. [23] M. Plebani and M. Zaninotto, "Cardiac markers: present and future," International journal
of clinical & laboratory research, vol. 29, pp. 56-63, 1999. [24] B. Dey, R. Jain, A. Khera, V. Rao, N. Dhar, U. D. Gupta, et al., "Boosting with a DNA
vaccine expressing ESAT-6 (DNAE6) obliterates the protection imparted by recombinant BCG (rBCGE6) against aerosol Mycobacterium tuberculosis infection in guinea pigs," Vaccine, vol. 28, pp. 63-70, Dec 10 2009.

118
[25] K. M. Coy, G. A. Imperi, C. R. Lambert, and C. J. Pepine, "Silent myocardial ischemia during daily activities in asymptomatic men with positive exercise test responses," The American Journal of Cardiology, vol. 59, pp. 45-49, 1/1/ 1987.
[26] JHeuser, "Afib_ecg," ed: Wikimedia Commons, 2007. [27] K. Thygesen, J. S. Alpert, and H. D. White, "Universal definition of myocardial infarction,"
European heart journal, vol. 28, pp. 2525-38, 2007. [28] A. S. Jaffe, L. Babuin, and F. S. Apple, "Biomarkers in acute cardiac disease: the
present and the future," Journal of the American College of Cardiology, vol. 48, pp. 1-11, 2006.
[29] A. J. Anderson, "The Temperature Dependence of the Formal Potential and the Rate
Constant of the Heterogeneous Electron-Transfer Reaction of Myogl," 1999. [30] W. S. Kilpatrick, R. J. Spooner, P. Grant, and W. Tullett, "Is rapid myoglobin
measurement of diagnostic value in the emergency presentation of non-traumatic chest pain?," Journal of Accident Emergency Medicine, vol. 11, pp. 267-269, 1994.
[31] M. Plebani and M. Zaninotto, "Diagnostic strategies using myoglobin measurement in
myocardial infarction," Clinica chimica acta; international journal of clinical chemistry, vol. 272, pp. 69-77, 1998.
[32] S. Takeda, A. Yamashita, K. Maeda, and Y. Maéda, "Structure of the core domain of
human cardiac troponin in the Ca(2+)-saturated form," Nature, vol. 424, pp. 35-41, 2003. [33] A. S. Jaffe, J. Ravkilde, R. Roberts, U. Naslund, and F. S. Apple, "It's time for a change
to a troponin standard," Online, pp. 1216-1220, 2000. [34] D. Novis, B. Jones, J. C. Dale, and M. K. Walsh, "Biochemical markers of myocardial
injury test turnaround time: a College of American Pathologists Q-Probes study of 7020 troponin and 4368 creatine kinase-MB determinations in 159 institutions," Archives of pathology & laboratory medicine, vol. 128, pp. 158-64, 2004.
[35] D. M. Dawson, H. M. Eppenberger, and M. E. Eppenberger, "Multiple molecular forms of
creatine kinases," Annals of the New York Academy of Sciences, vol. 151, pp. 616-26, 1968.
[36] A. González Oliva, H. J. Cruz, and C. C. Rosa, "Immunosensors for Diagnostics,"
Sensors Update, vol. 9, pp. 283-312, 2001. [37] W. M. Albers, I. Vikholm, T. Viitala, and J. Peltonen, "Chapter 1 - Interfacial and
Materials Aspects of the Immobilization of Biomolecules onto Solid Surfaces," in Handbook of Surfaces and Interfaces of Materials, N. Hari Singh, M.Sc, and M. S. P. D. Ph.D.A2 - Hari Singh Nalwa, Eds., ed Burlington: Academic Press, 2001, pp. 1-31.
[38] K. Elgert, "Chapter 4: Antibody structure and function," in Immunology: Understanding
the immune system, ed: John Wiley & Sons, Inc, 1998, pp. 58-78.
119
[39] V. H. J. D. Andrade, "Protein adsorption and materials biocompatibility: A tutorial review and suggested hypotheses," in Advances in polymer science. Biopolymers/non-exclusion HPCL. vol. 79, ed Berlin, GE: Springer-Verlag, 1987, pp. 8-10.
[40] F. Rusmini, Z. Zhong, and J. Feijen, "Protein Immobilization Strategies for Protein
Biochips," Biomacromolecules, vol. 8, pp. 1775-1789, 2007/06/01 2007. [41] A. Abdelghani, S. Hleli, and K. Cherif, "Optical and electrochemical characterization of
self-assembled octadecyltrichlorosilane monolayer on modified silicon electrode," Materials Letters, vol. 56, pp. 1064-1068, 11// 2002.
[42] C. J. Barrelet, D. B. Robinson, J. Cheng, T. P. Hunt, C. F. Quate, and C. E. D. Chidsey,
"Surface Characterization and Electrochemical Properties of Alkyl, Fluorinated Alkyl, and Alkoxy Monolayers on Silicon," Langmuir, vol. 17, pp. 3460-3465, 2001/05/01 2001.
[43] G. A. Campbell and R. Mutharasan, "Detection and quantification of proteins using self-
excited PZT-glass millimeter-sized cantilever," Biosensors and Bioelectronics, vol. 21, pp. 597-607, 10/15/ 2005.
[44] M. G. Sankalia, R. C. Mashru, J. M. Sankalia, and V. B. Sutariya, "Physicochemical
characterization of papain entrapped in ionotropically cross-linked kappa-carrageenan gel beads for stability improvement using Doehlert shell design," Journal of Pharmaceutical Sciences, vol. 95, pp. 1994-2013, 2006.
[45] A. J. Fleischman, S. Roy, C. A. Zorman, and M. Mehregany, "Behavior of polycrystalline
SiC and Si surface-micromachined lateral resonant structures at elevated temperatures," Silicon Carbide, Iii-Nitrides and Related Materials, Pts 1 and 2, vol. 264-2, pp. 889-892, 1998.
[46] S. Luo and D. R. Walt, "Avidin-biotin coupling as a general method for preparing
enzyme-based fiber-optic sensors," Analytical Chemistry, vol. 61, pp. 1069-1072, 1989/05/01 1989.
[47] G. Palestino, V. Agarwal, R. Aulombard, E. a. Pérez, and C. Gergely, "Biosensing and
Protein Fluorescence Enhancement by Functionalized Porous Silicon Devices," Langmuir, vol. 24, pp. 13765-13771, 2008/12/02 2008.
[48] E. Barsoukov and J. R. Macdonald, Impedance Spectroscopy Theory, Experiment, and
Applications, 2nd ed. ed. Hoboken: John Wiley & Sons, Inc, 2005. [49] G. Barbero, A. L. Alexe-Ionescu, and I. Lelidis, "Significance of small voltage in
impedance spectroscopy measurements on electrolytic cells," Journal of Applied Physics, vol. 98, pp. 113703-5, 12/01/ 2005.
[50] D. Kell, "The principles and potential of electrical admittance spectroscopy: an
introduction," in Biosensors: Fundamentals and Applications, A. Turner, I. Karube, and G. Wilson, Eds., ed Oxford: Oxford University Press, 1987.
[51] J. S. Daniels and N. Pourmand, "Label-Free Impedance Biosensors: Opportunities and
Challenges," Electroanalysis, vol. 19, pp. 1239-1257, May 16 2007.
120
[52] A. J. Bard and L. R. Faulkner, Electrochemical methods : fundamentals and applications. New York: Wiley, 1980.
[53] I. O. K'Owino and O. A. Sadik, "Impedance Spectroscopy: A Powerful Tool for Rapid
Biomolecular Screening and Cell Culture Monitoring," Electroanalysis, vol. 17, pp. 2101-2113, 2005.
[54] P. Zoltowski, "On the electrical capacitance of interfaces exhibiting constant phase
element behaviour," Journal of Electroanalytical Chemistry, vol. 443, pp. 149-154, 2/10/ 1998.
[55] K. B. Oldham, A. M. Bond, and J. C. Myland, Electrochemical science and technology
fundamentals and applications. Chichester, West Sussex, U.K: John Wiley & Sons, 2012.
[56] B. Y. Chang and S. M. Park, "Electrochemical Impedance Spectroscopy," in Annual
Review of Analytical Chemistry, Vol 3. vol. 3, E. S. Yeung and R. N. Zare, Eds., ed Palo Alto: Annual Reviews, 2010, pp. 207-229.
[57] L. Yang and A. Guiseppi-Elie, "Impedimetric Biosensors for Nano- and Microfluidics," in
Encyclopedia of Microfluidics and Nanofluidics, D. Li, Ed., ed: Springer, 2008, pp. 811-823.
[58] P. Castro, A. A. Sagues, E. I. Moreno, L. Maldonado, and J. Genesca, "Characterization
of activated titanium solid reference electrodes for corrosion testing of steel in concrete," Corrosion vol. 58, pp. 609-617, 1996.
[59] P. B. Luppa, L. J. Sokoll, and D. W. Chan, "Immunosensors—principles and applications
to clinical chemistry," Clinica Chimica Acta, vol. 314, pp. 1-26, 12// 2001. [60] C. J. McNeil, D. Athey, and R. Renneberg, "Immunosensors for clinical diagnostics,"
EXS, vol. 81, pp. 17-25, 1997. [61] J. Rishpon, Gezundhajt, Y., Soussan, L., Rosen-Margalit, I., Hadas, E., "Biosensor
Design and Applications," in ACS Symposium Series, P. R. Mathewson and J. W. Finley, Eds., ed Washington, DC: American Chemical Society 511, 1992.
[62] A. P. F. Turner, Karube, I., Wilson, G.S., Biosensors: Fundamentals and Applications.
Oxford: Oxford Science Publications, 1987. [63] M. Grattarola and G. Massobrio, Bioelectronics handbook : MOSFETS, biosensors, and
neurons / Massimo Grattarola, Giuseppe Massobrio: New York : McGraw-Hill, c1998., 1998.
[64] U. Brand, B. Reinhardt, F. Rüther, T. Scheper, and K. Schügerl, "Bio-field-effect
transistors for process control in biotechnology," Sensors and Actuators B: Chemical, vol. 4, pp. 315-318, 6// 1991.
[65] B. A. Lawton, Z. H. Lu, R. Pethig, and Y. Wei, "Physico-Chemical studies of the activity
of urease and the development of a conductimetric urea sensor," Journal of Molecular Liquids, vol. 42, pp. 83-98, 10// 1989.

121
[66] A. Guiseppi-Elie, Wallace, G.G., Matsue, T., "Chemical and biological sensors based on electrocally conductive polymers," in Handbook of Conducting Polymers. vol. Two, T. Skotheim, Elsenbaumer, R., Reynolds, J. R., Ed., 3rd ed. ed New York: Marcel Dekker, 1998, pp. 963-992.
[67] A. Oliveros, A. Guiseppi-Elie, and S. Saddow, "Silicon carbide: a versatile material for
biosensor applications," Biomedical Microdevices, vol. 15, pp. 353-368, 2013/04/01 2013.
[68] A. Lloyd Spetz, S. Nakagomi, H. Wingbrant, M. Andersson, A. Salomonsson, S. Roy, et
al., " New Materials for Chemical and Biosensors " Materials and Manufacturing Processes, vol. 21, pp. 253-6, 2006.
[69] R. Yakimova, R. M. Petoral, G. R. Yazdi, C. Vahlberg, A. Lloyd Spetz, and K. Uvdal,
"Surface functionalization and biomedical applications based on SiC," Journal of Physics D: Applied Physics, vol. 40, pp. 6435-6442, 2007.
[70] P. Fromhertz, "The Neuron-semiconductor Interface," in In Bioelectronics: From Theory
to Applications, I. Willner and E. Katz, Eds., ed Weinheim: Wiley-VCH Verlag, 2005, pp. 339-393.
[71] P. Bergveld, "Thirty years of ISFETOLOGY," Sensors and Actuators B vol. 88, pp. 1-20,
2003. [72] P. J. Rousche and R. A. Normann, "Chronic recording capability of the Utah Intracortical
Electrode Array in cat sensory cortex," Journal of neuroscience methods, vol. 82, pp. 1-15, 1998.
[73] G. Steinhoff, O. Purrucker, M. Tanaka, M. Stutzmann, and M. Eickhoff, "AlxGa1–xN—A
New Material System for Biosensors," Advanced Functional Materials, vol. 13, pp. 841-6, 2003.
[74] R. P. Otoole, S. G. Burns, G. J. Bastiaans, and M. D. Porter, "Thin Aluminum Nitride
Film Resonators - Miniaturized High-Sensitivity Mass Sensors," Analytical Chemistry, vol. 64, pp. 1289-1294, Jun 1 1992.
[75] C. Deger, E. Born, H. Angerer, O. Ambacher, M. Stutzmann, J. Hornsteiner, et al.,
"Sound velocity of AlxGa1-xN thin films obtained by surface acoustic-wave measurements," Applied Physics Letters, vol. 72, pp. 2400-2402, May 11 1998.
[76] Y. Kawakami, S. Kamiyama, G. Hatakoshi, T. Mukai, Y. Narukawa, I. Nomura, et al.,
"Photonic devices," in In Wide Bandgap Semiconductors: Fundamental Properties and Modern Photonic and Electronic Devices, K. Takahashi, A. Yoshikawa, and A. Sandhu, Eds., ed Heidelberg, Germany: Springer-Verlag, 2007, pp. 146-7.
[77] C. Coletti, M. J. Jaroszeski, A. Pallaoro, A. M. Hoff, S. Iannotta, and S. E. Saddow,
"Biocompatibility and wettability of crystalline SiC and Si surfaces," Conf Proc IEEE Eng Med Biol Soc, pp. 5850-3, 22-26 August 2007 2007.

122
[78] C. L. Frewin, M. Jaroszeski, E. Weeber, K. E. Muffly, A. Kumar, M. Peters, et al., "Atomic force microscopy analysis of central nervous system cell morphology on silicon carbide and diamond substrates," Journal of Molecular Recognition, vol. 22, pp. 380-388, Sep-Oct 2009.
[79] G. Kotzar, M. Freas, P. Abel, A. Fleischman, S. Roy, C. Zorman, et al., "Evaluation of
MEMS materials of construction for implantable medical devices," Biomaterials, vol. 23, pp. 2737-2350, 2002.
[80] T. J. Fawcett, J. T. Wolan, A. L. Spetz, M. Reyes, and S. E. Saddow, "Thermal detection
mechanism of SiC based hydrogen resistive gas sensors," Applied Physics Letters, vol. 89, Oct 30 2006.
[81] A. J. Rosenbloom, Y. Shishkin, D. M. Sipe, Y. Ke, R. P. Devaty, and W. J. Choyke,
"Porous Silicon Carbide as a Membrane for Implantable Biosensors," Materials Science Forum, vol. 457-460, pp. 1463-1466, 2004.
[82] J. Deva Reddy, A. A. Volinsky, C. L. Frewin, C. Locke, and S. E. Saddow, "Mechanical
properties of single and polycrystalline SiC thin films," in Materials Research Society Meeting, 2008, pp. AA03 – AA06.
[83] M. Mehregany, C. A. Zorman, N. Rajan, and C. H. Wu, "Silicon carbide MEMS for harsh
environments," Proceedings of the IEEE, vol. 86, pp. 1594-1610, Aug 1998. [84] S. E. Saddow and A. Agrawal, "Chapter 1-Silicon carbide overview," in Advances in
Silicon Carbide Processing and Applications S. Saddow and A. Agrawal, Eds., First ed Norwood, MA: Norwood: Artech House, 2004, pp. 7-18.
[85] C. W. Locke, A. Severino, F. La Via, M. Reyes, J. Register, and S. E. Saddow, "Chapter
2 - SiC Films and Coatings: Amorphous, Polycrystalline, and Single Crystal Forms," in Silicon Carbide Biotechnology, ed Oxford: Elsevier, 2012, pp. 17-61.
[86] J. M. Goddard and J. H. Hotchkiss, "Polymer surface modification for the attachment of
bioactive compounds," Progress in Polymer Science, vol. 32, pp. 698-725, 2007. [87] G. Beheim and L. Evans, "Materials for microelectromechanical systems," in In MEMS:
design and fabrication, M. Gad-el-Hak, Ed., ed Boca Raton, FL: Taylor & Francis Group, 2006, pp. 5-7.
[88] C. Locke, C. Frewin, L. Abbati, and S. E. Saddow, "Demonstration of 3C-SiC MEMS
Structures on Polysilicon-on-oxide Substrates," in Materials Research Society Spring Meeting, San Francisco, CA, 2010, pp. 1246-B08-05.
[89] N. Wright and A. Horsfall, "SiC sensors: a review," Journal of Physics D: Applied
Physics, vol. 40, pp. 6345-54, 2007. [90] G. L. Harris, "Basic physicial properties," in Properties of silicon carbide, G. L. Harris,
Ed., ed United Kingdom: INSPEC, Institution of Electrical Engineers, 1995, p. 9.

123
[91] Y. Goldberg, M. Levinshtein, and S. Rumyantsev, "Silicon carbide (SiC)," in Properties of Advanced Semiconductor Materials: GaN, AIN, InN, BN, SiC, SiGe, M. Shur, M. Levinshtein, and S. Rumyantsev, Eds., ed New York, NY: John Wiley and Sons, 2001, pp. 93-147.
[92] X. Li, X. Wang, R. Bondokov, J. Morris, Y. H. An, and T. S. Sudarshan, "Micro/nanoscale
mechanical and tribological characterization of SiC for orthopedic applications " Journal of biomedical materials research. Part B, Applied biomaterials, vol. 72, pp. 353-61, 2004.
[93] A. B. Sproul and M. A. Green, "Improved value for the silicon intrinsic carrier
concentration from 275 to 375 K," Journal of Applied Physics, vol. 70, p. 846, 1991. [94] T. Ayalew, "SiC Semiconductor Devices, Technology, Modeling, and Simulation " Doctor
of technical sciences, Electrical and Computer Engineering, Vienna University of Technology, Austria, 2004.
[95] P. Godignon, "SiC Materials and Technologies for Sensors Development " Materials
Science Forum, vol. 483-485, pp. 1009-14, 2005. [96] C. Locke, R. Anzalone, A. Severino, C. Bongiorno, G. Litrico, F. La Via, et al., "High
Quality Single Crystal 3C-SiC(111) Films Grown on Si(111)," Materials Science Forum, vol. 615-617, pp. 145-148, 2009.
[97] U. Kalnins, A. Erglis, I. Dinne , I. Kumsars , and S. Jegerebce, "Clinical outcomes of
silicon carbide coated stents in patients with coronary artery disease," Med Sci Monit, vol. 8, pp. PI16-20, 2002.
[98] M. Amon, A. Bolz, and M. Schaldach, "Improvement of stenting therapy with a silicon
carbide coated tantalum stent," Journal of Material Science: Materials in medicine, vol. 7, pp. 273-278, 1996.
[99] C. Ozbek, A. Heisel, B. Gross, W. Bay, and H. Schieffer, "Coronary implantation of
silicone-carbide-coated Palmaz-Schatz stents in patients with high risk of stent thrombosis without oral anticoagulation," Catheterization and cardiovascular diagnosis, vol. 41, pp. 71-78, May 1997.
[100] D. Carrié, K. Khalifé, M. Hamon, B. Citron, J. P. Monassier, R. Sabatier, et al., "Initial
and follow-up results of the Tenax coronary stent," Journal of interventional cardiology vol. 14, pp. 1-5, 2001.
[101] J. Fournier, J. Calabuig, A. Merchan, J. Augé, R. Melgares, T. Colman, et al., "Initial
results and 6 month clinical follow-up after implantation of a silicon carbide coated coronary stent," Revista Española de Cardiología, vol. 54, pp. 567-572, 2001.
[102] J. Will, A. Hoppe, F. A. Muller, C. T. Raya, J. M. Fernandez, and P. Greil, "Bioactivation
of biomorphous silicon carbide bone implants," Acta Biomater, vol. 6, pp. 4488-94, Dec 2010.
124
[103] S. Santavirta, M. Takagi, L. Nordsletten, A. Anttila, R. Lappalainen, and Y. Konttinen, "Biocompatibility of silicon carbide in colony formation test in vitro," Archives of Orthopedic Trauma Surgery, vol. 118, pp. 89-91, 1998.
[104] M. Saki, M. Kazemzadeh Narbat, A. Samadikuchaksaraei, H. B. Ghafouri, and F.
Gorjipour, "Biocompatibility Study of a Hydroxyapatite-Alumina and Silicon Carbide Composite Scaffold for Bone Tissue Engineering," Yakhteh Medical Journal, vol. 11, pp. 55-60, 2009.
[105] I. Svensson, E. Artursson, P. Leanderson, R. Berglind, and F. Lindgren, "Toxicity in vitro
of some silicon carbides and silicon nitrides: whiskers and powders," American journal of industrial medicine, vol. 31, pp. 335-43, 1997.
[106] K. Rodelsperger and B. Bruckel, "The carcinogenicity of WHO fibers of silicon carbide:
SiC whiskers compared to cleavage fragments of granular SiC," Inhal Toxicol, vol. 18, pp. 623-31, Aug 2006.
[107] J. M. Bluet, J. Botsoa, Y. Zakharko, A. Geloen, S. Alekseev, O. Marty, et al., "Chapter 11
- SiC as a Biocompatible Marker for Cell Labeling," in Silicon Carbide Biotechnology, ed Oxford: Elsevier, 2012, pp. 377-429.
[108] C. L. Frewin, "The neuron-silicon carbide interface: biocompatibility study and BMI
device development," PhD Dissertaion Electrical Engineering, University of South Florida, Tampa, FL, 2009.
[109] C. L. Frewin, C. Locke, S. E. Saddow, and E. J. Weeber, "Single-Crystal Cubic Silicon
Carbide : An In Vivo Biocompatible Semiconductor for Brain Machine Interface Devices," in 33rd Annual International Conferen of the IEEE Engineering in Medicine and Biology Society, Boston, MA, 2011, pp. 2957-60.
[110] N. Schettini, M. J. Jaroszeski, L. West, and S. E. Saddow, "Chapter 5 -
Hemocompatibility Assessment of 3C-SiC for Cardiovascular Applications," in Silicon Carbide Biotechnology, ed Oxford: Elsevier, 2012, pp. 153-208.
[111] J. M. Anderson, "Chapter 4 Mechanisms of inflammation and infection with implanted
devices," Cardiovascular Pathology, vol. 2, pp. 33-41, 1993. [112] F. Nederberg, J. Watanabe, K. Ishihara, J. Hilborn, and T. Bowden, "Biocompatible and
biodegradable phosphorylcholine ionomers with reduced protein adsorption and cell adhesion," Journal of biomaterials science: Polymer edition, vol. 17, pp. 605-614, 2006.
[113] S. Abraham, S. Brahim, K. Ishihara, and A. Guiseppi-Elie, "Molecularly engineered
p(HEMA)-based hydrogels for implant biochip biocompatibility," Biomaterials, vol. 26, pp. 4767-78, 2005.
[114] A. N. Wilson and A. Guiseppi-Elie, "Bioresponsive Hydrogels," Advanced Healthcare
Materials, pp. n/a-n/a, 2012. [115] P. J. Barnes, "Inhaled Glucocorticoids for Asthma," New England Journal of Medicine,
vol. 332, pp. 868-875, 1995.
125
[116] L. S. Goodman, L. L. Brunton, B. Chabner, B. œ. C. Knollmann, and L. S. Goodman, Goodman & Gilman's The pharmacological basis of therapeutics, 12th ed. New York: McGraw-Hill, 2011.
[117] W. K. Ward, M. J. Quinn, M. D. Wood, K. L. Tiekotter, S. Pidikiti, and J. A. Gallagher,
"Vascularizing the tissue surrounding a model biosensor: how localized is the effect of a subcutaneous infusion of vascular endothelial growth factor (VEGF)?," Biosensors and Bioelectronics, vol. 19, pp. 155-163, 2003.
[118] G. Takagi, M. Miyamoto, S. Tara, I. Takagi, H. Takano, M. Yasutake, et al., "Controlled-
release basic fibroblast growth factor for peripheral artery disease: comparison with autologous bone marrow-derived stem cell transfer," Tissue Eng Part A, vol. 17, pp. 2787-94, 2011.
[119] B. D. Ratner, Biomaterials science : an introduction to materials in medicine, 2nd ed ed.
San Diego ; London: Elsevier Academic Press, 2004. [120] C. N. Kotanen, F. G. Moussy, S. Carrara, and A. Guiseppi-Elie, "Implantable enzyme
amperometric biosensors," Biosens Bioelectron, vol. 35, pp. 14-26, 2012. [121] P. Godignon, I. Maring, G. Gabriel, R. Gomez, M. Placidi, and R. Villa, "New generation
of SiC biodevices implemented on 4 inch wafers," Materials Science Forum, vol. 645-648, pp. 1097-1100, 2010.
[122] C. A. Zorman, "Silicon Carbide as a Material for Biomedical Microsystems," in
Symposium on Design, Test, Integration & Packaging of MEMS/MOEMS Rome, Italy, 2009.
[123] V. Chu, J. P. Conde, J. Jarego, P. Brogueira, J. Rodriguez, N. Barradas, et al.,
"Transport and Photoluminescence of Hydrogenated Amorphous Silicon-Carbon Alloys," Journal of Applied Physics, vol. 78, pp. 3164-3173, Sep 1 1995.
[124] H. Pierson, Handbook of Chemical Vapor Depostion, 2nd ed. Norwich, NY: Noyes
Publicatio, 1999. [125] D. Hume and I. Kolthoff, "The Silicon Carbide Electrode " Journal of american chemical
society, vol. 63, pp. 2805-6, 1941. [126] F. Meier, D. M. Giolando, and J. R. Kirchhoff, "Silicon carbide: a new electrode material
for voltammetric measurements " Chemical Communications, p. 2553, 1996. [127] S. Singh and R. C. Buchanan, "SiC-C fiber electrode for biological sensing," Materials
Science & Engineering C-Biomimetic and Supramolecular Systems, vol. 27, pp. 551-557, Apr 2007.
[128] W. C. Wu, H. W. Chang, and Y. C. Tsai, "Electrocatalytic detection of dopamine in the
presence of ascorbic acid and uric acid at silicon carbide coated electrodes," Chemical Communications, vol. 47, pp. 6458-6460, 2011.

126
[129] A. Salimi, L. Mohamadi, R. Hallaj, and S. Soltanian, "Electrooxidation of insulin at silicon carbide nanoparticles modified glassy carbon electrode," Electrochemistry Communications, vol. 11, pp. 1116-1119, Jun 2009.
[130] H. A. Rafiee-Pour, A. Noorbakhsh, A. Salimi, and H. Ghourchian, "Sensitive Superoxide
Biosensor Based on Silicon Carbide Nanoparticles," Electroanalysis, vol. 22, pp. 1599-1606, Jul 2010.
[131] R. Ghavami, A. Salimi, and A. Navaee, "SiC nanoparticles-modified glassy carbon
electrodes for simultaneous determination of purine and pyrimidine DNA bases," Biosensors and Bioelectronics, vol. 26, pp. 3864-3869, 2011.
[132] N. Yang, H. Zhuang, R. Hoffmann, W. Smirnov, J. Hees, X. Jiang, et al.,
"Nanocrystalline 3C-SiC electrode for biosensing applications," Analytical Chemistry, vol. 83, pp. 5827-30, Aug 1 2011.
[133] J. Pascual, F. Valvo, P. Godignon, J. Aguilo, J. Millan, J. Camassel, et al., "SiC base
micro-probe for myocardial ischemia monitoring," Silicon Carbide and Related Materials 2003, Prts 1 and 2, vol. 457-460, pp. 1483-1486, 2004.
[134] R. Gomez, A. Ivorra, R. Villa, P. Godignon, J. Millan, I. Erill, et al., "A SiC microdevice for
the minimally invasive monitoring of ischemia in living tissues," Biomed Microdevices, vol. 8, pp. 43-49, Mar 2006.
[135] D. M. Brown, J. Kretchmer, J. Fedison, and T. Dean, "The commercialization of the SiC
flame sensor," in Electrochemical Society Proceedings, 2002. [136] SenSiCAB. (2012, December 15). Sensors for cleaner air. [137] A. Lloyd Spetz, R. Pearce, L. Hedin, V. Khranovskyy, and F. Söderlind, "New transducer
material concepts for biosensors and surface functionalization " in SPIE, The International Society for Optical Engineering, 2009, pp. 7362-06.
[138] J. Botsoa, V. Lysenko, A. Géloën, O. Marty, J. M. Bluet, and G. Guillot, "Application of
3C-SiC quantum dots for living cell imaging," Applied Physics Letters, vol. 92, p. 173902, 2008.
[139] D. Caputo, G. de Cesare, A. Nascetti, and R. Scipinotti, "Two-Color Sensor for
Biomolecule Detection," Sensor Letters, vol. 6, pp. 542-547, Aug 2008. [140] T. Taubner, D. Korobkin, Y. Urzhumov, G. Shvets, and R. Hillenbrand, "Near-field
microscopy through a SiC superlens," Science, vol. 313, pp. 1595-1595, Sep 15 2006. [141] G. Pandraud, P. J. French, and P. M. Sarro, "Fabrication and characteristics of a
PECVD SiC evanescent wave optical sensor," Sensors and Actuators a-Physical, vol. 142, pp. 61-66, Mar 10 2008.
[142] C. A. Zorman and R. J. Parro, "Micro‐ and nanomechanical structures for silicon carbide
MEMS and NEMS," physica status solidi (b), vol. 245, pp. 1404-1424, 2008.
127
[143] C. Iliescu, D. P. Poenar, M. Carp, and F. C. Loe, "A microfluidic device for impedance spectroscopy analysis of biological samples," Sensors and Actuators B: Chemical, vol. 123, pp. 168-176, 2007.
[144] C. Iliescu, B. Chen, D. P. Poenar, and Y. Y. Lee, "PECVD amorphous silicon carbide
membranes for cell culturing," Sensors and Actuators B: Chemical, vol. 129, pp. 404-411, 2008.
[145] R. Memming, "Principles of Semiconductor Physics," in Semiconductor
Electrochemistry, ed: Wiley-VCH Verlag GmbH, 2007, pp. 1-21. [146] A. W. Bott, "Electrochemistry of Semiconductors," Current separations.com and Drug
development, vol. 17, p. 5, 1998. [147] R. Memming, "Electrochemical Systems," in Semiconductor Electrochemistry, ed: Wiley-
VCH Verlag GmbH, 2007, pp. 46-60. [148] I. Tiginyanu, S. Langa, H. Foell, and v. Ursachi, "Porous III-V Semiconductors ", ed,
2009. [149] S. R. Morrison, Electrochemistry at semiconductor and oxidized metal electrodes:
Plenum Press, 1980. [150] R. Memming, "Solid-Liquid Interface," in Semiconductor Electrochemistry, ed: Wiley-
VCH Verlag GmbH, 2007, pp. 81-111. [151] K. Rajeshwar, "Fundamentals of Semiconductor Electrochemistry and
Photoelectrochemistry," in Encyclopedia of Electrochemistry. vol. 6, S. Licht, Ed., ed: Wiley-VCH Verlag GmbH & Co. KGaA, 2007, pp. 1-45.
[152] D. K. Schroder, Semiconductor Material and Device Characterization: Wiley, 2006. [153] N. Sato, Electrochemistry at metal and semiconductor electrodes. Amsterdam ; New
York: Elsevier, 1998. [154] R. De Gryse, W. P. Gomes, F. Cardon, and J. Vennik, "On the Interpretation of
Mott‐Schottky Plots Determined at Semiconductor/Electrolyte Systems," Journal of The Electrochemical Society, vol. 122, pp. 711-712, January 1, 1975 1975.
[155] J. A. Turner, "Energetics of the semiconductor-electrolyte interface," Journal of Chemical
Education, vol. 60, pp. 327-329, 1983. [156] Y. B. Wang, R. K. Yuan, and M. Willander, "Capacitance of semiconductor-electrolyte
junction and its frequency dependence," Applied Physics A, vol. 63, pp. 481-486, 1996/11/01 1996.
[157] G. Nogami, "Characterization of Semiconductor Electrodes with a Deep Impurity Level,"
Journal of The Electrochemical Society, vol. 129, pp. 2219-2223, January 1, 1982 1982.

128
[158] K. Uosaki and H. Kita, "Effects of the Helmholtz Layer Capacitance on the Potential Distribution at Semiconductor/Electrolyte Interface and the Linearity of the Mott‐Schottky Plot," Journal of The Electrochemical Society, vol. 130, pp. 895-897, January 1, 1983 1983.
[159] A. J. Nozik and R. Memming, "Physical Chemistry of Semiconductor−Liquid Interfaces,"
The Journal of Physical Chemistry, vol. 100, pp. 13061-13078, 1996/01/01 1996. [160] J. H. Kennedy and K. W. Frese, "Flatband Potentials and Donor Densities of
Polycrystalline α ‐ Fe2 O 3 Determined from Mott‐Schottky Plots," Journal of The Electrochemical Society, vol. 125, pp. 723-726, January 1, 1978 1978.
[161] A. Oliveros, C. L. Frewin, S. J. Schoell, M. Hoeb, M. Stutzmann, I. D. Sharp, et al.,
"Assessment of cell proliferation on 6H-SiC bio-functionalized with self-assembled monolayers," Journal of Materials Research, vol. 28, pp. 78-86, 2013.
[162] A. Oliveros, A. Guiseppi-Elie, M. Jaroszeski, and S. E. Saddow, "Characterization of 3C-
SiC (100) as a platform for detecting the onset of acute myocardial infarction (AMI)," MRS Online Proceedings Library, vol. 1433, pp. null-null, 2012.
[163] A. Oliveros, A. Guiseppi-Elie, M. Jaroszeski, and S. E. Saddow, "Protein immobilization
on 3C-SiC (100) as a substrate for detecting the onset of acute myocardial infarction (AMI)," in Engineering in Medicine and Biology Society (EMBC), 2012 Annual International Conference of the IEEE, 2012, pp. 1643-1646.
[164] A. Oliveros, S. J. Schoell, C. Frewin, M. Hoeb, M. Stutzmann, I. D. Sharp, et al.,
"Biocompatibility Assessment of SiC Surfaces After Functionalization with Self Assembled Organic Monolayers," MRS Online Proceedings Library, vol. 1235, pp. null-null, 2009.
[165] S. J. Schoell, A. Oliveros, M. Steenackers, S. E. Saddow, and I. D. Sharp, "Chapter 3 -
Multifunctional SiC Surfaces: From Passivation to Biofunctionalization," in Silicon Carbide Biotechnology, ed Oxford: Elsevier, 2012, pp. 63-117.
[166] S. Brahim, A. M. Wilson, D. Narinesingh, E. Iwuoha, and A. Guiseppi-Elie, "Chemical
and biological sensors based on electrochemical detection using conducting electroactive polymers," Microchimica Acta, vol. 143, pp. 123-137, Dec 2003.
[167] M. Stutzmann, J. A. Garrido, M. Eickhoff, and M. S. Brandt, "Direct biofunctionalization
of semiconductors: A survey," Physica Status Solidi a-Applications and Materials Science, vol. 203, pp. 3424-3437, Nov 2006.
[168] A. Catellani and G. Cicero, "Modifications of cubic SiC surfaces studied by ab initio
simulations: from gas adsorption to organic functionalization," Journal of Physics D: Applied Physics, vol. 40, p. 6215, 2007.
[169] C. Vahlberg, G. R. Yazdi, R. M. Petoral, M. Syvajarvi, K. Uvdal, a. L. Spetz, et al.,
"Surface Engineering of Functional Materials for Biosensors," IEEE Sensors, 2005., pp. 504-507, 2005.
129
[170] M. R. Linford, P. Fenter, P. M. Eisenberger, and C. E. D. Chidsey, "Alkyl Monolayers on Silicon Prepared from 1-Alkenes and Hydrogen-Terminated Silicon," Journal of the American Chemical Society, vol. 117, pp. 3145-3155, 1995/03/01 1995.
[171] K. Bierbaum, M. Kinzler, C. Woell, M. Grunze, G. Haehner, S. Heid, et al., "A Near Edge
X-ray Absorption Fine Structure Spectroscopy and X-ray Photoelectron Spectroscopy Study of the Film Properties of Self-Assembled Monolayers of Organosilanes on Oxidized Si(100)," Langmuir, vol. 11, pp. 512-518, 1995.
[172] N. Faucheux, R. Schweiss, K. Lützow, C. Werner, and T. Groth, "Self-assembled
monolayers with different terminating groups as model substrates for cell adhesion studies," Biomaterials, vol. 25, pp. 2721-30, 2004.
[173] M. Rosso, A. Arafat, K. Schroen, M. Giesbers, C. S. Roper, R. Maboudian, et al.,
"Covalent attachment of organic monolayers to silicon carbide surfaces," Langmuir, vol. 24, pp. 4007-4012, Apr 15 2008.
[174] M. Rosso, M. Giesbers, A. Arafat, K. Schroen, and H. Zuilhof, "Covalently Attached
Organic Monolayers on SiC and SixN4 Surfaces: Formation Using UV Light at Room Temperature," Langmuir, vol. 25, pp. 2172-2180, Feb 17 2009.
[175] G. Cicero and A. Catellani, "Towards SiC surface functionalization: An ab initio study,"
Journal of Chemical Physics, vol. 122, Jun 1 2005. [176] S. J. Schoell, M. Hoeb, I. D. Sharp, W. Steins, M. Eickhoff, M. Stutzmann, et al.,
"Functionalization of 6H-SiC surfaces with organosilanes," Applied Physics Letters, vol. 92, Apr 14 2008.
[177] H. Tsuchida, I. Kamata, and K. Izumi, "Infrared attenuated total reflection spectroscopy
of 6H–SiC ( 0001) ," Journal of Applied Physics, vol. 85, pp. 3570-3574, 1999. [178] S. J. Schoell, J. Howgate, M. Hoeb, M. Auernhammer, J. A. Garrido, M. Stutzmann, et
al., "Electrical passivation and chemical functionalization of SiC surfaces by chlorine termination," Applied Physics Letters, vol. 98, May 2011.
[179] J. Howgate, S. J. Schoell, M. Hoeb, W. Steins, B. Baur, S. Hertrich, et al.,
"Photocatalytic Cleavage of Self-Assembled Organic Monolayers by UV-Induced Charge Transfer from GaN Substrates," Advanced Materials, vol. 22, pp. 2632-+, Jun 25 2010.
[180] N. Aghdassi, D. Dulson, S. Linden, L. Q. Li, L. F. Chi, and H. Zacharias, "Very large-
bandgap insulating monolayers of ODS on SiC," Applied Surface Science, vol. 258, pp. 7280-7285, Jul 15 2012.
[181] J. Wong, A. Chilkoti, and V. T. Moy, "Direct force measurements of the streptavidin–
biotin interaction," Biomolecular Engineering, vol. 16, pp. 45-55, 1999. [182] E. H. Williams, A. V. Davydov, A. Motayed, S. G. Sundaresan, P. Bocchini, L. J. Richter,
et al., "Immobilization of streptavidin on 4H-SiC for biosensor development," Applied Surface Science, vol. 258, pp. 6056-6063, Jun 1 2012.

130
[183] R. M. Petoral, G. R. Yazdi, A. L. Spetz, R. Yakimova, and K. Uvdal, "Organosilane-functionalized wide band gap semiconductor surfaces," Applied Physics Letters, vol. 90, May 28 2007.
[184] D. K. Bhowmick, S. Linden, A. Devaux, L. De Cola, and H. Zacharias, "Functionalization
of Amorphous SiO2 and 6H-SiC(0001) Surfaces with Benzo[ghi]perylene-1,2-dicarboxylic Anhydride via an APTES Linker," Small, vol. 8, pp. 592-601, Feb 20 2012.
[185] G. Qin, R. Zhang, B. Makarenko, A. Kumar, W. Rabalais, J. M. Lopez Romero, et al.,
"Highly stable, protein resistant thin films on SiC-modified silicon substrates," Chemical Communications, vol. 46, pp. 3289-3291, 2010.
[186] C. L. Frewin, C. Coletti, C. Riedl, U. Starke, and S. E. Saddow, "A Comprehensive Study
of Hydrogen Etching on the Major SiC Polytypes and Crystal Orientations," Materials Science Forum, pp. 615-617, 2009.
[187] C. Coletti, C. L. Frewin, S. E. Saddow, M. Hetzel, C. Virojanadara, and U. Starke,
"Surface studies of hydrogen etched 3C-SiC(001) on Si(001)," Applied Physics Letters, vol. 91, Aug 6 2007.
[188] I. D. Sharp, S. J. Schoell, M. Hoeb, M. S. Brandt, and M. Stutzmann, "Electronic
properties of self-assembled alkyl monolayers on Ge surfaces," Applied Physics Letters, vol. 92, Jun 2 2008.
[189] S. P. Low, K. Williams, L. T. Canham, and N. H. Voelcker, "Evaluation of mammalian cell
adhesion on surface-modified porous silicon," Biomaterials, vol. 27, pp. 4538-46, 2006. [190] M. Reyes, Y. Shishkin, S. Harvey, and S. E. Saddow, "Development of a high growth
rate 3C-SiC on Si CVD process," 2006, pp. 79-84. [191] S. J. Schoell, M. Sachsenhauser, A. Oliveros, J. Howgate, M. Stutzmann, M. S. Brandt,
et al., "Organic Functionalization of 3C-SiC Surfaces," ACS Applied Materials & Interfaces, vol. 5, pp. 1393-1399, 2013/02/27 2013.
[192] B. Baur, G. Steinhoff, J. Hernando, O. Purrucker, M. Tanaka, B. Nickel, et al., "Chemical
functionalization of GaN and AlN surfaces," Applied Physics Letters, vol. 87, pp. 263901-263901, 2005.
[193] W. Qian, D. Yao, F. Yu, B. Xu, R. Zhou, X. Bao, et al., "Immobilization of antibodies on
ultraflat polystyrene surfaces," Clin Chem, vol. 46, pp. 1456-63, Sep 2000. [194] L. Yang and Y. Li, "AFM and impedance spectroscopy characterization of the
immobilization of antibodies on indium-tin oxide electrode through self-assembled monolayer of epoxysilane and their capture of Escherichia coli O157:H7," Biosens Bioelectron, vol. 20, pp. 1407-16, Jan 15 2005.
[195] J. C. Ehrhart, B. Bennetau, L. Renaud, J. P. Madrange, L. Thomas, J. Morisot, et al., "A
new immunosensor for breast cancer cell detection using antibody-coated long alkylsilane self-assembled monolayers in a parallel plate flow chamber," Biosens Bioelectron, vol. 24, pp. 467-74, Nov 15 2008.

131
[196] N. A. Lapin and Y. J. Chabal, "Infrared Characterization of Biotinylated Silicon Oxide Surfaces, Surface Stability, and Specific Attachment of Streptavidin," The Journal of Physical Chemistry B, vol. 113, pp. 8776-8783, 2009/06/25 2009.
[197] B. S. Kang, F. Ren, L. Wang, C. Lofton, W. W. Tan, S. J. Pearton, et al., "Electrical
detection of immobilized proteins with ungated <equation><font face='verdana'>AlGaN</font>/<font face='verdana'>GaN</font></equation> high-electron-mobility Transistors," Applied Physics Letters, vol. 87, pp. 023508-023508-3, 2005.
[198] Z.-H. Wang and G. Jin, "Covalent immobilization of proteins for the biosensor based on
imaging ellipsometry," Journal of Immunological Methods, vol. 285, pp. 237-243, 2/15/ 2004.
[199] D. Huber, J. Rudolf, P. Ansari, B. Galler, M. Fuhrer, C. Hasenhindl, et al., "Effectiveness
of natural and synthetic blocking reagents and their application for detecting food allergens in enzyme-linked immunosorbent assays," Anal Bioanal Chem, vol. 394, pp. 539-48, May 2009.
[200] Thermo-Scientific. (July 25th). Protocol - EDC and Sulfo-NHS. Available:
http://www.piercenet.com/objects/view.cfm?type=page&ID=C0B555CC-0F33-4818-B09D-031E7FCF89FC
[201] G. T. Hermanson, "Chapter 5 - Heterobifunctional Crosslinkers," in Bioconjugate
Techniques (Second Edition), ed New York: Academic Press, 2008, pp. 276-335. [202] D. Maraldo and R. Mutharasan, "Optimization of antibody immobilization for sensing
using piezoelectrically excited-millimeter-sized cantilever (PEMC) sensors," Sensors and Actuators B: Chemical, vol. 123, pp. 474-479, 4/10/ 2007.
[203] E. H. Williams, A. V. Davydov, A. Motayed, S. G. Sundaresan, P. Bocchini, L. J. Richter,
et al., "Immobilization of streptavidin on 4H–SiC for biosensor development," Applied Surface Science, vol. 258, pp. 6056-6063, 2012.
[204] C. Seokheun and C. Junseok, "Methods of reducing non-specific adsorption in
microfluidic biosensors," Journal of Micromechanics and Microengineering, vol. 20, p. 075015, 2010.
[205] Q. A. Bhatti, G. J. Moran, and C. C. Matthai, "Computer Simulation of Surface Diffusion
of Silicon and Carbon Adatoms on SiC(001)," MRS Online Proceedings Library, vol. 423, pp. null-null, 1996.
[206] A. Sagues, J. T. Wolan, A. De Fex, and T. Fawcett, "Impedance behavior of nanoporous
SiC," Electrochimica Acta, vol. 51, pp. 1656–1663, 2006. [207] L. Wu, F. Camacho-Alanis, H. Castaneda, G. Zangari, and N. Swami, "Electrochemical
impedance spectroscopy of carboxylic-acid terminal alkanethiol self assembled monolayers on GaAs substrates," Electrochimica Acta, vol. 55, pp. 8758-8765, 12/1/ 2010.

132
[208] L. Olitzki, "Electric Charge of Antibodies," The Journal of Immunology, vol. 24, pp. 505-512, June 1, 1933 1933.
[209] Y. Cheng, P. Xiong, C. S. Yun, G. F. Strouse, J. P. Zheng, R. S. Yang, et al.,
"Mechanism and optimization of pH sensing using SnO2 nanobelt field effect transistors," Nano Lett, vol. 8, pp. 4179-84, Dec 2008.
[210] Y. Thiansilakul, S. Benjakul, and M. P. Richards, "Isolation, characterisation and stability
of myoglobin from Eastern little tuna (Euthynnus affinis) dark muscle," Food Chemistry, vol. 124, pp. 254-261, 1/1/ 2011.
[211] G. Gros, H. S. Rollema, W. Jelkmann, H. Gros, C. Bauer, and W. Moll, "Net charge and
oxygen affinity of human hemoglobin are independent of hemoglobin concentration," J Gen Physiol, vol. 72, pp. 765-773, 12/01 1978.
[212] A. Belaïdi, J. N. Chazalviel, F. Ozanam, O. Gorochov, A. Chari, B. Fotouhi, et al.,
"Silicon surface states and subsurface hydrogen," Journal of Electroanalytical Chemistry, vol. 444, pp. 55-60, 3/5/ 1998.
[213] H.-Z. Yu, S. Morin, D. D. M. Wayner, P. Allongue, and C. Henry de Villeneuve,
"Molecularly Tunable “Organic Capacitors” at Silicon/Aqueous Electrolyte Interfaces1," The Journal of Physical Chemistry B, vol. 104, pp. 11157-11161, 2000/11/01 2000.
[214] H. Einati, A. Mottel, A. Inberg, and Y. Shacham-Diamand, "Electrochemical studies of
self-assembled monolayers using impedance spectroscopy," Electrochimica Acta, vol. 54, pp. 6063-6069, 10/30/ 2009.
[215] W. Yang, J. E. Butler, J. J. N. Russell, and R. J. Hamers, "Direct electrical detection of
antigen-antibody binding on diamond and silicon substrates using electrical impedance spectroscopy," Analyst, vol. 132, pp. 296-306, 2007.
[216] P. Allongue, C. Henry de Villeneuve, and J. Pinson, "Structural characterization of
organic monolayers on Si〈111〉 from capacitance measurements," Electrochimica Acta, vol. 45, pp. 3241-3248, 6/23/ 2000.
[217] P. Allongue, C. H. D. Villeneuve, and P. Vi, "Molecularly Tunable “Organic Capacitors” at
Silicon/Aqueous Electrolyte Interfaces 1," Society, pp. 11157-11161, 2000. [218] E. J. Faber, "TOWARDS THE HYBRID ORGANIC SEMICONDUCTOR FET (HOSFET)
– Electrical and Electrochemical Characterization of Functionalized and Unfunctionalized, Covalently Bound Organic Monolayers on Silicon Surfaces," MESA Research Institute at the University of Twente, University of Twente, Enschede, Netherlands, 2006.
[219] I. Lauermann, R. Memming, and D. Meissner, "Electrochemical Properties of Silicon
Carbide," Journal of the Electrochemical Society, vol. 144, pp. 73-80, 1997. [220] J. A. Turner and B. A. Parkinson, "The application of chronocoulometry to the study of
adsorption at the semiconductor/electrolyte interface," Journal of Electroanalytical Chemistry and Interfacial Electrochemistry, vol. 150, pp. 611-617, 7/25/ 1983.

133
[221] E. Metwalli, D. Haines, O. Becker, S. Conzone, and C. G. Pantano, "Surface characterizations of mono-, di-, and tri-aminosilane treated glass substrates," Journal of colloid and interface science, vol. 298, pp. 825-31, 2006.
[222] R. G. Acres, A. V. Ellis, J. Alvino, C. E. Lenahan, D. A. Khodakov, G. F. Metha, et al.,
"Molecular Structure of 3-Aminopropyltriethoxysilane Layers Formed on Silanol-Terminated Silicon Surfaces," The Journal of Physical Chemistry C, vol. 116, pp. 6289-6297, 2012/03/15 2012.
[223] P. Bataillard, F. Gardies, N. Jaffrezic-Renault, C. Martelet, B. Colin, and B. Mandrand,
"Direct detection of immunospecies by capacitance measurements," Anal Chem, vol. 60, pp. 2374-9, Nov 1 1988.
[224] L. Corash, "Measurement of platelet activation by fluorescence-activated flow
cytometry," Blood Cells, vol. 16, pp. 97-106; discussion 107-8, 1990. [225] A. H. Lazarus, J. F. Wright, V. Blanchette, and J. Freedman, "Analysis of platelets by
flow cytometry," Transfusion Science, vol. 16, pp. 353-361, 12// 1995. [226] M. Steenackers, I. D. Sharp, K. Larsson, N. a. Hutter, M. Stutzmann, and R. Jordan,
"Structured Polymer Brushes on Silicon Carbide," Chemistry of Materials, vol. 22, pp. 272-278, 2010.
[227] C. N. Kotanen, C. Tlili, and A. Guiseppi-Elie, "Amperometric glucose biosensor based on
electroconductive hydrogels," Talanta, vol. 103, pp. 228-235, 1/15/ 2013. [228] E. Souteyrand, J. R. Martin, and C. Martelet, "Direct detection of biomolecules by
electrochemical impedance measurements," Sensors and Actuators B: Chemical, vol. 20, pp. 63-69, 1994.
[229] A. Carré, W. Birch, and V. Lacarrière, "Glass Substrates Modified With Organosilanes
For DNA Immobilization," in Silanes and other coupling agents vol. 4, ed: Brill, 2007, pp. 113-126.

134
APPENDICES

135
Appendix A Calculation of the Expected Capacitance of the SiC Space Charge
Region
In this appendix we include some calculations and fitting of the results obtained
experimentally from the electrochemical impedance and Mott-Schottky plots from Chapter 4.
A.1 Capacitance of SiC After OH Termination
Assuming a depletion width of 0.094 μm and Nd 3.64x 1018 cm-3 from the Hg probe
measurements we obtain the capacitance of the SiC space charge region using equation (13).
𝐶𝑆𝑖𝐶 = 𝜀𝜀𝑜𝑑
= 9.7𝑥8.85𝑥10−14
0.094𝑥10−4= 93.4 𝑛𝐹
𝑐𝑚2 (13)
A.2 Capacitance of SiC After APTES Surface Modification
In order to calculate the capacitance of the SiC|APTES surfaces, we assume that the
net charge of the APTES layer induces a depletion width in the semiconductor. Carre et al. [229]
proposed that APTES films have a density of ~ 1.2 amine groups/nm2.
If we assume Q = q/nm2 (q = 1.6x10⁻¹⁹ C), we have:
𝑄 = 𝑞 ∗ 𝑑 ∗ 𝑁𝑑. (14)
1014𝑞𝑐𝑚2 = 𝑞 ∗ 𝑑 ∗ 𝑁𝑑 (15)
𝑑 = 0.00002 𝑐𝑚 = 200 𝑛𝑚 (16)
Using equation (12) we calculate 𝐶𝑆𝑖𝐶 = 43 𝑛𝐹/𝑐𝑚2 after APTES functionalization.
A.3 Fit of the Experimental Data
Using expressions for the total capacitance in depletion and accumulation we fit the CV
data obtained for bare SiC and APTES modified SiC presented in section 4.6.3.

136
Appendix A (Continued)
A.4 Fitting of the CV Results for the SiC After OH Termination
Using the values obtained from extrapolating the Mott-Schottky plots presented in Figure
50 and Table 9, i.e. Efb = -550 mV and Nd = 7.28x1018 cm-3. We consider that in accumulation
there is a voltage drop both in the SCR and the Helmholtz capacitance, CH and that the charge
in the SCR (QSiC) is the same as in the Helmholtz layer, see (17). we used the calculated
capacitance in accumulation and depletion expressed in equations (18) to (20) to fit the
experimental data as shown in Figure 53. In this case we assumed a CH= 5 μF/cm2 in series
with the SiC's SCR capacitance.
In accumulation:
𝐸 − 𝐸𝑓𝑏 = 𝑉𝑆𝑖𝐶 + 𝑉𝐶𝐻 = 𝑄𝑆𝑖𝐶𝐶𝑆𝑖𝐶
− 𝑄𝑆𝑖𝐶𝐶𝐻
(17)
𝑄𝑆𝑖𝐶 = �2𝜀𝜀𝑜𝑘𝑇𝑁𝑑𝑒−𝑞𝑉𝑆𝑖𝐶2𝑘𝑇 (18)
𝐶𝑆𝑖𝐶 = �𝑞2𝜀𝜀𝑜𝑁𝑑2𝑘𝑇
𝑒−𝑞𝑉𝑆𝑖𝐶2𝑘𝑇 (19)
1𝐶𝑇
= 1𝐶𝑆𝑖𝐶
+ 1𝐶𝐻
(20)
In depletion:
𝐶𝑆𝑖𝐶 = �𝑞𝜀𝜀𝑜𝑁𝑑
2(𝐸−𝐸𝑓𝑏−𝑘𝑇𝑞 )
(21)
1𝐶𝑇
= 1𝐶𝑆𝑖𝐶
(22)
As seen in Figure A. 1 the best fitting is achieved including the Helmholtz capacitance
(CH) in accumulation and a difference of the calculated and experimental data is observed
between -200 and 200 mV probably due to the presence of surface states or defects that were
not considered in the simulated CV data.

137
Appendix A (Continued)
Figure A.1 Experimental and fitted CV data for SiC. Experimental bare SiC without CH in accumulation Including the CH= 5 μF/cm2 in accumulation .
A.5 Fitting of the CV Results for the SiC After APTES Surface Functionalization
Similarly to the calculations performed for the simulated CV data for the bare SiC, we
consider equations (17) to (19) for the total capacitance in accumulation and depletion.
However, equation (20) is modified as shown in (23) since we include the effect of the APTES
capacitance in series to the CH in accumulation. We assume a value of CAPTES= 4.4 uF/cm2 that
gives an approximate thickness of the APTES film of 5 Å lower than the 10 Å calculated via XPS
by Schoell et al. [191].
In accumulation:
1𝐶𝑇
= 1𝐶𝑆𝑖𝐶
+ 𝐶𝐻 +𝐶𝐴𝑃𝑇𝐸𝑆𝐶𝐻∗𝐶𝐴𝑃𝑇𝐸𝑆
(23)
We see in Figure A. 2 that the fitted data closely fits the experimental data but assuming
CH higher than for the bare SiC simulated data. The experimental data shows no "bumps" or
indications of surface states probably due to the insulating effect of the APTES films.
2.0E-07
1.6E-06
3.0E-06
4.4E-06
-0.6 -0.4 -0.2 0.0 0.2 0.4 0.6
C (F
*cm
-2)
E (V)

138
Appendix A (Continued)
Figure A.2 Experimental and fitted CV data for APTES coated SiC. Experimental APTES|SiC Including CAPTES = 4.4 μF/cm2 and CH= 7 μF/cm2 in accumulation Including CAPTES = 4.4
μF/cm2 and CH= 5 μF/cm2 in accumulation.
2.0E-07
9.0E-07
1.6E-06
2.3E-06
3.0E-06
-0.6 -0.4 -0.2 0.0 0.2 0.4 0.6
C (F
*cm
-2)
E (V)

139
Appendix B Permission for Reproduction of Materials
In the figure below is the permission from IEEE to use the material from [163] including
in Chapter 3, section 3.4 to 3.4.3.1, Figure 21, Figure 22, Figure 22 and Figure 24.
Figure B.1 IEEE policy for using IEEE intellectual property in a thesis or dissertation work.

140
Appendix B (Continued)
Below is the permission from Cambridge University Press to reproduce material from
[161] in Chapter 3, including sections 3.2 to 3.3.2.4, Figure 17 and Figure 18 and Table 2, in
addition to excerpts from [164] and [165] in sections 3.2 to 3.3.2.4 and excerpts of [162] in
section 3.4 and 3.4.3.1 and modifications of Figure 21 and Figure 22.
Figure B.2 Reprint permission from Cambridge University Press.

141
Appendix B (Continued)
Below is the permission to reproduce material from [67] in Chapter 2, including section
2.2 to section 2.2.3.3, Figure 10, Figure 11, Figure 12 and Table 1.
Figure B.3 Permission of reproduction of articles from Biomedical Microdevices (Springer).

142
Appendix B (Continued)
Below is permission to reproduce excerpts from [165] in Chapter 3, section 3.2 to section
3.3.2.4.
Figure B.4 Permission to use excerpts of a co-authored book chapter (Publisher: Elsevier).