my.fit.edumy.fit.edu/~akurdi2012/process lab 2/distillation... · web viewflorida institute of...
TRANSCRIPT
Florida Institute of Technology
College of Engineering
Department of Chemical Engineering
CHE – 4115ChE Process Laboratory II
Formal Report # 1
Experiment # 4Batch Distillation
Performed by: Abdullah Kurdi
For: Dr. Maria Pozo de Fernandez
Experiment performed on: April 12, 2016
Date: April 29, 2016
Team D Grade:Partners: H. Baatiyyah
N. Almakhmari K. Almansoori F. Alkhaldi
I. Introduction
Distillation is a separations method that is commonly use industry to separate
components or component groups from liquid mixtures by using their volatility as the mean of
separation. Distillation is used in oil refineries to separate crude oil into its derivatives like fuel
gas, light oils, gasoline and kerosene; it is also used in food processing and perfumery and
medicinal of herbs “herbal distillate”. Distillation comes in many forms some examples are
simple distillation, batch distillation, and vacuum distillation. The operation of distillation could
be designed as batch, of continues, with or without reflux.
In this experiment a batch distillation with total reflux was studied. The purpose of the
experiment was to evaluate the efficiency of the plate column.
II. Equipment and Procedure
The apparatus includes a glass distillation column that is flexible and can be used in
several ways to obtain useful data. The column has multiple plates, operates under vacuum and
has a jacket for insulation. The plates have disc bubble caps and liquid down-comers. There are
two fixed pots, each with a corresponding size electric mantle heater. Finally there is a condenser
on the top with a flow splitter to the distillate collection flask.
1
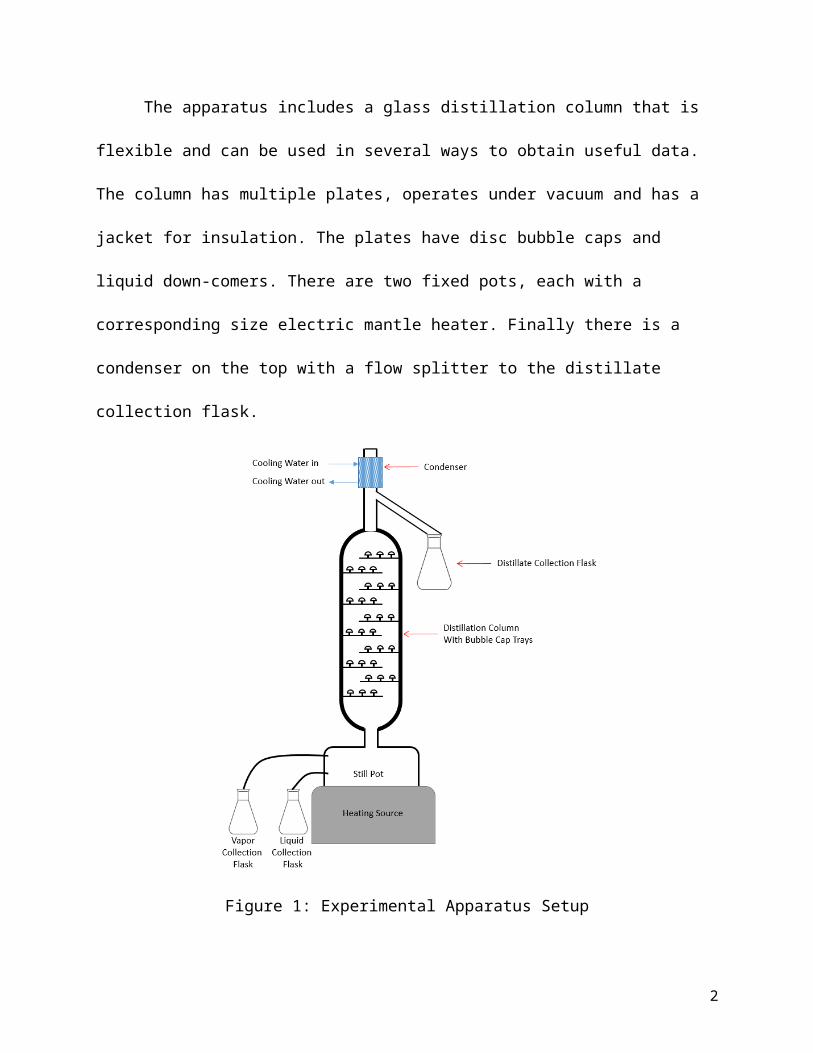
Figure 1: Experimental Apparatus Setup
The procedure start by obtaining 500 ml of water and 1000 ml of acetic acid, then
calculating the mole fraction for the initial mixture. The two are mixed together carefully via
adding acid to water. The glass joints are then slipped together such that they align and seal. The
distillate stopcock is then closed. The condenser cooling water is turned on at a moderate
flowrate; the heater for the reboiler is turned on as well at low heat, gradually increasing until a
slow boil occurs. The heat upward is gradually adjusted until water vapor is seen rising into the
condenser. When steady state is established, samples of approximately 50 ml each of liquid and
vapor in still pot, and distillate product. When taking a vapor sample, the flask should be
submerged in an ice bath. The volume and weight of the samples are measured, as well as the
temperature at both the still pot and at the top of the column. The temperature and flowrate of
2
both the inlet and outlet cooling water are also recorded. Another sample collection is then
repeated after a few minutes. Refer to the Batch Distillation Experiment handout for more
information regarding Safety precautions, pH meter procedure, Gas Chromatography operating
instructions, and choosing the proper Gas Chromatography settings(1).
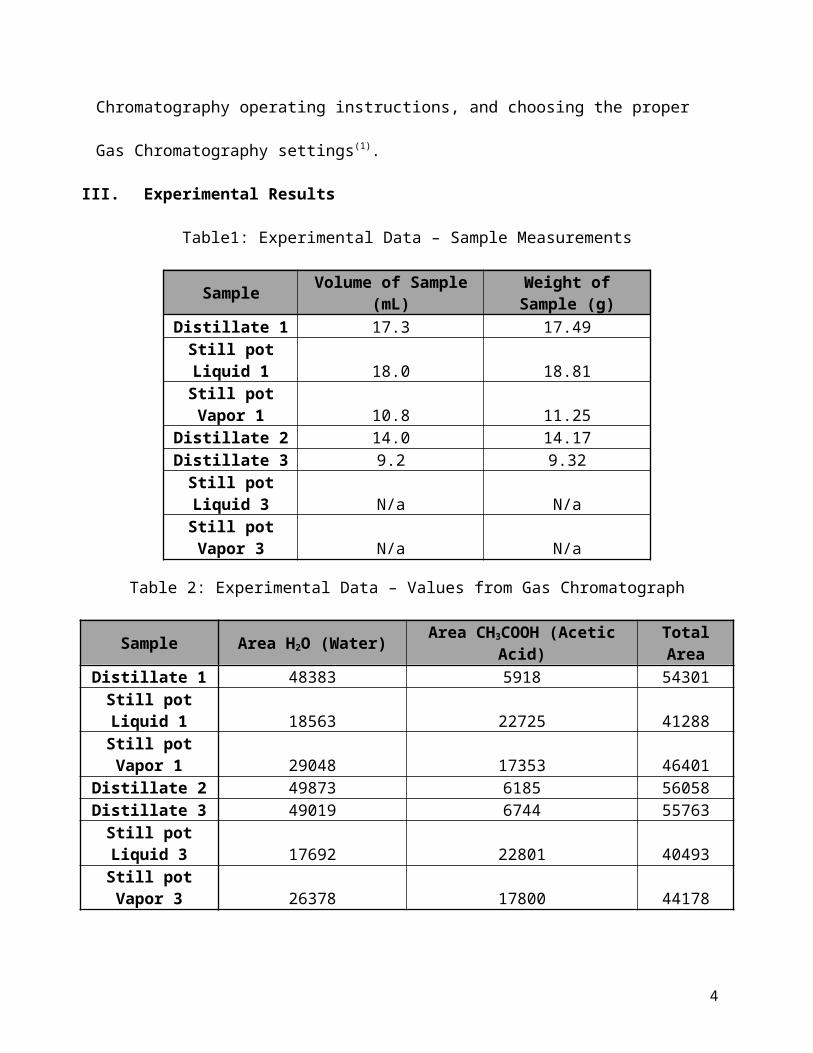
III. Experimental Results
Table1: Experimental Data – Sample Measurements
Sample Volume of Sample (mL) Weight of Sample (g)Distillate 1 17.3 17.49
Still pot Liquid 1 18.0 18.81Still pot Vapor 1 10.8 11.25
Distillate 2 14.0 14.17Distillate 3 9.2 9.32
Still pot Liquid 3 N/a N/aStill pot Vapor 3 N/a N/a
Table 2: Experimental Data – Values from Gas Chromatograph
Sample Area H2O (Water) Area CH3COOH (Acetic Acid) Total AreaDistillate 1 48383 5918 54301
Still pot Liquid 1 18563 22725 41288Still pot Vapor 1 29048 17353 46401
Distillate 2 49873 6185 56058Distillate 3 49019 6744 55763
Still pot Liquid 3 17692 22801 40493Still pot Vapor 3 26378 17800 44178
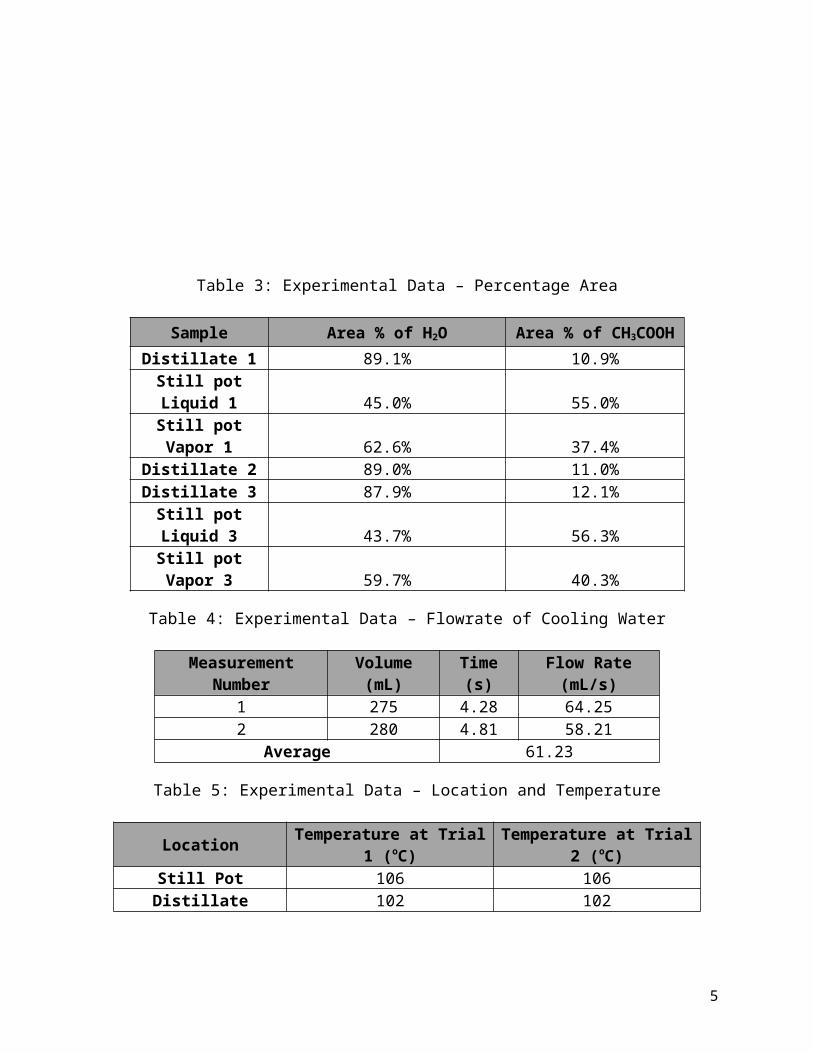
Table 3: Experimental Data – Percentage Area
3
Sample Area % of H2O Area % of CH3COOHDistillate 1 89.1% 10.9%
Still pot Liquid 1 45.0% 55.0%Still pot Vapor 1 62.6% 37.4%
Distillate 2 89.0% 11.0%Distillate 3 87.9% 12.1%
Still pot Liquid 3 43.7% 56.3%Still pot Vapor 3 59.7% 40.3%
Table 4: Experimental Data – Flowrate of Cooling Water
Measurement Number Volume (mL) Time (s) Flow Rate (mL/s)1 275 4.28 64.252 280 4.81 58.21
Average 61.23
Table 5: Experimental Data – Location and Temperature
Location Temperature at Trial 1 (oC) Temperature at Trial 2 (oC)Still Pot 106 106Distillate 102 102
Table 6: Volume Percentage, Mole Percent Acetic Acid, and Mole Percentage Water
Volume Percentage Mole Percentage AA
Mole Percentage Water
15.5 5.0 95.064.9 37.1 62.946.9 20.8 79.215.7 5.1 94.917.1 5.5 94.566.1 38.4 61.650.0 23.2 76.8
Table 7: McCabe-Thiele Results
Number of Real Stages 27Number of Ideal Trays 5.53% Efficiency 20.5
Table 8: Theoretical Number of Stages at Total Reflux Using Eq. 11.51(1)
4
Mole Percentage of Acetic Acid Mole Percentage of Water
5.0 95.037.1 62.9
α 1.8997Number of Theoretical Stages 2.76
Efficiency 10.2 %
Table 9: Water Mole Fraction, Total Moles in the Initial Still pot Mixture, Ratio of Final to Initial Moles, Flowrate of Cooling Water, and Heat Removed in the Condenser
Water Mole Fraction (xs1) 0.6Total Moles in initial Still pot Mixture
(S1)45.2
xdav 0.95
xsav 0.62
xs1 0.629xs2 0.616
S2/S1 (From xdav Equation) 0.96
S2/S1 (From Integral) 0.98S2 (From xd
av Equation) 43.39S2 (From Integral) 44.22
Db (From xdav Equation) 1.83
Db (From Integral) 1.01q (J/s) 256.0
5
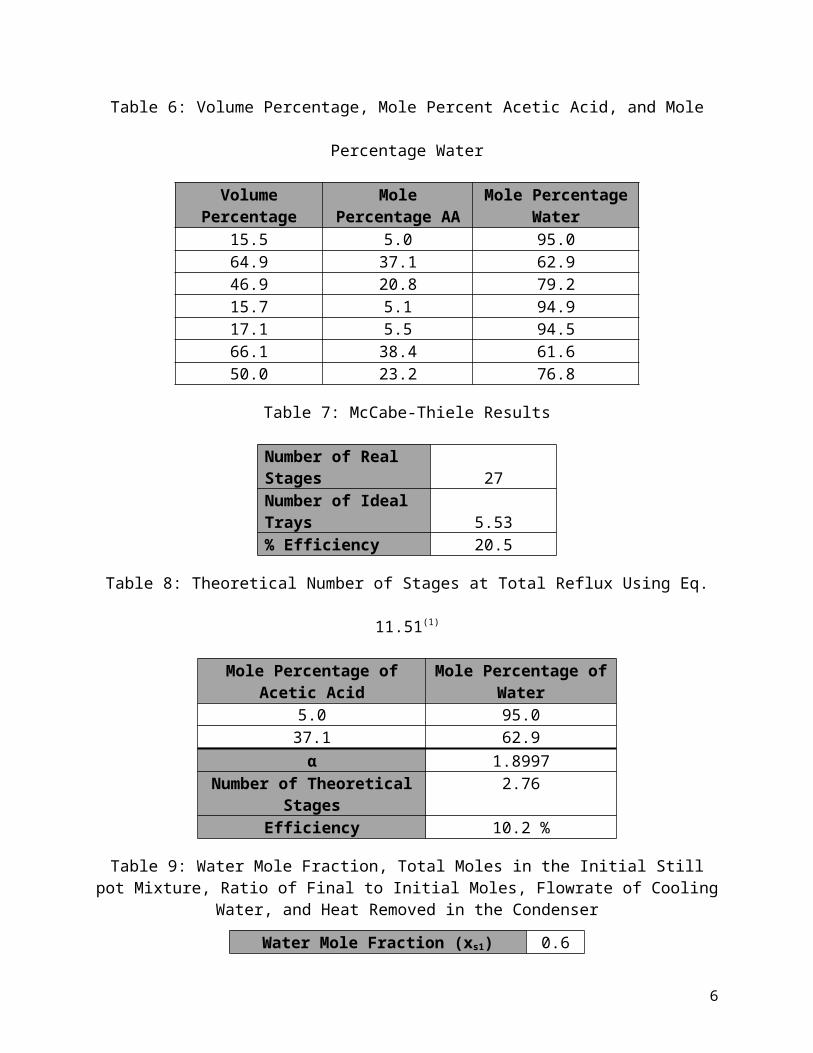
Figure 2: y-x Equilibrium Curve
Figure 3: Temperature versus x, y Curve
6
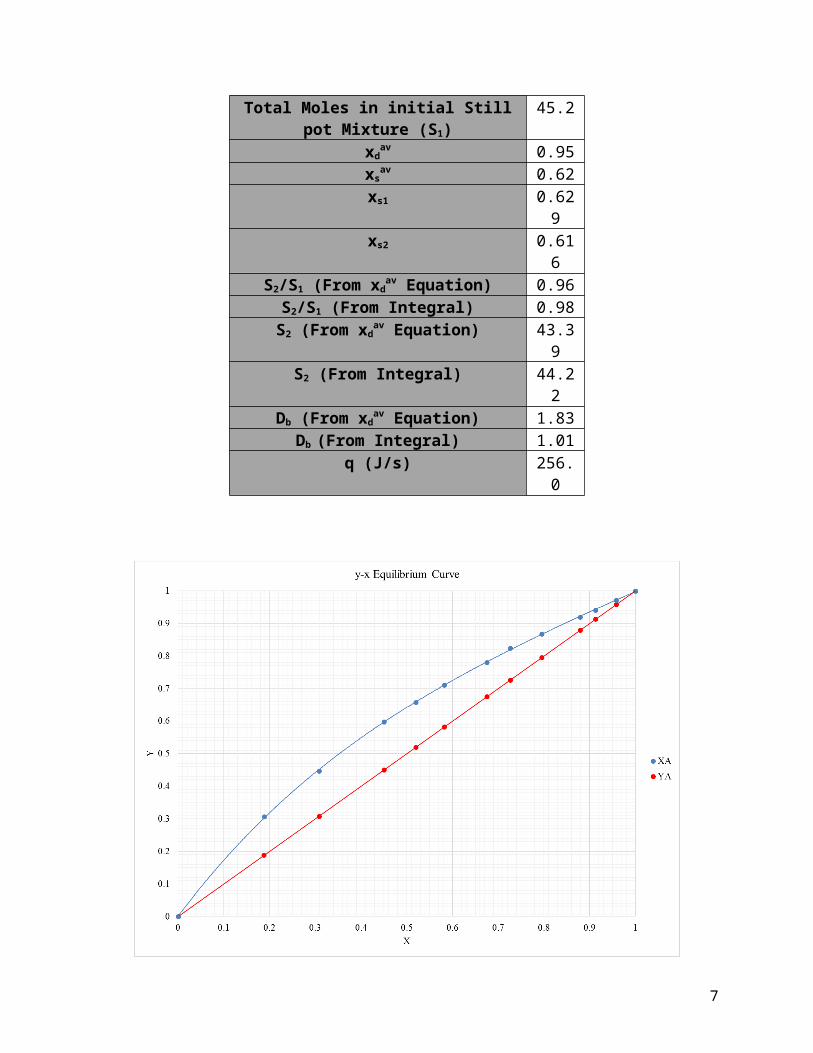
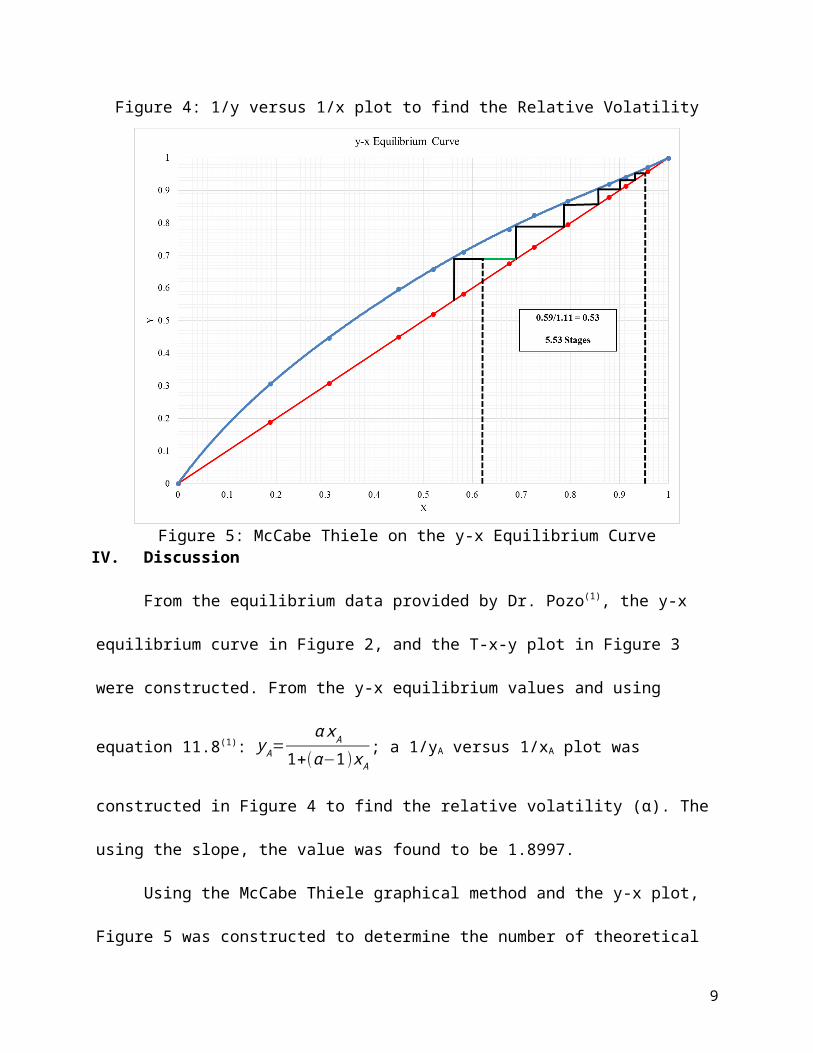
Figure 4: 1/y versus 1/x plot to find the Relative Volatility
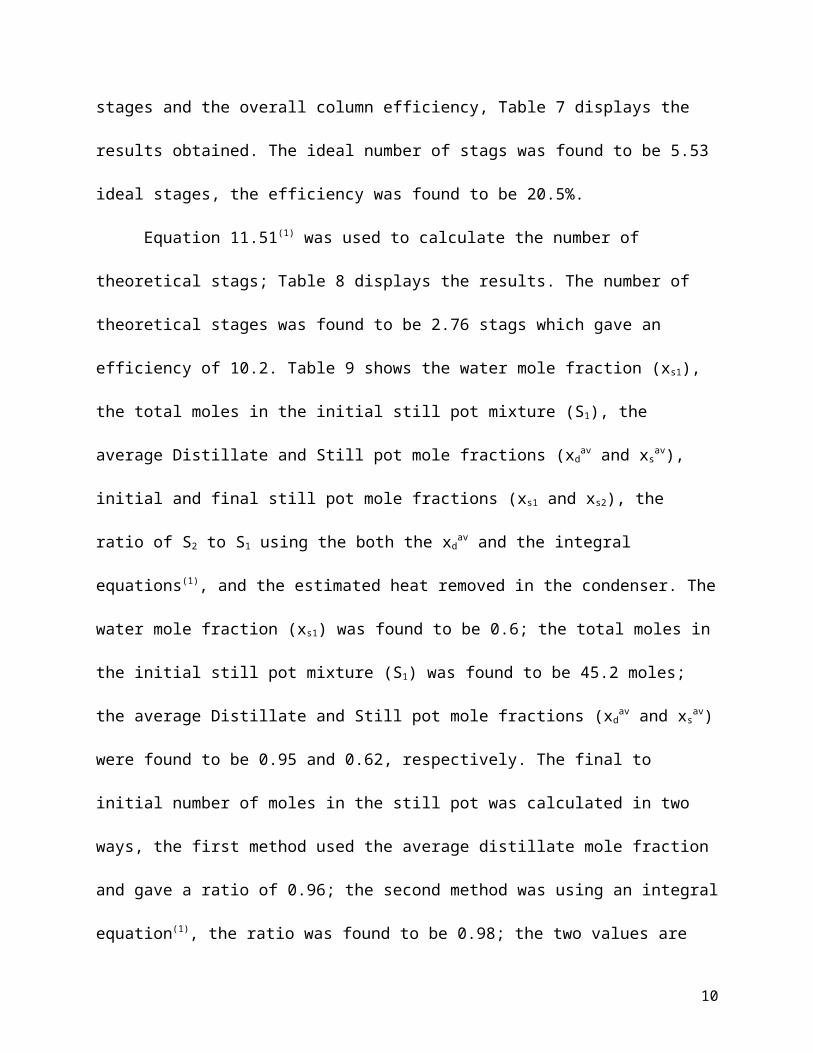
Figure 5: McCabe Thiele on the y-x Equilibrium Curve IV. Discussion
7
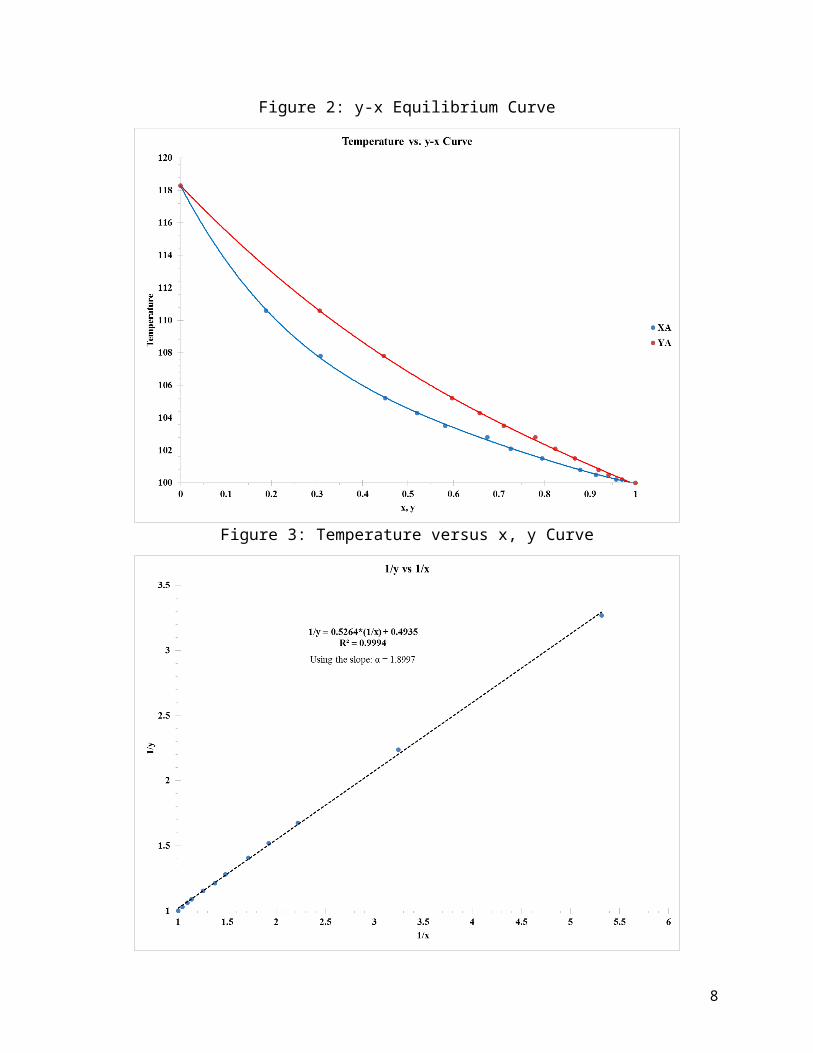
From the equilibrium data provided by Dr. Pozo(1), the y-x equilibrium curve in Figure 2,
and the T-x-y plot in Figure 3 were constructed. From the y-x equilibrium values and using
equation 11.8(1): y A=α x A
1+(α−1)x A; a 1/yA versus 1/xA plot was constructed in Figure 4 to find the
relative volatility (α). The using the slope, the value was found to be 1.8997.
Using the McCabe Thiele graphical method and the y-x plot, Figure 5 was constructed to
determine the number of theoretical stages and the overall column efficiency, Table 7 displays
the results obtained. The ideal number of stags was found to be 5.53 ideal stages, the efficiency
was found to be 20.5%.
Equation 11.51(1) was used to calculate the number of theoretical stags; Table 8 displays
the results. The number of theoretical stages was found to be 2.76 stags which gave an efficiency
of 10.2. Table 9 shows the water mole fraction (xs1), the total moles in the initial still pot mixture
(S1), the average Distillate and Still pot mole fractions (xdav and xs
av), initial and final still pot
mole fractions (xs1 and xs2), the ratio of S2 to S1 using the both the xdav and the integral
equations(1), and the estimated heat removed in the condenser. The water mole fraction (xs1) was
found to be 0.6; the total moles in the initial still pot mixture (S1) was found to be 45.2 moles; the
average Distillate and Still pot mole fractions (xdav and xs
av) were found to be 0.95 and 0.62,
respectively. The final to initial number of moles in the still pot was calculated in two ways, the
first method used the average distillate mole fraction and gave a ratio of 0.96; the second method
was using an integral equation(1), the ratio was found to be 0.98; the two values are very close to
each other with a 0.02 difference. The heat removed in the condenser was estimated to be 256
J/s.
V. Conclusion
8
In conclusion, the results obtained indicate accurate findings with respect to the theory.
The column efficiency was found to be very low and that can be related to the improper
insolation that resulted in a large heat loss. The lab helped in applying the concepts learned in
Separations class, which gave a good insight of the operations.
VI. Recommendations
In recommendation, the lab should have been conducted early in the semester to allow
more time for the students to participate in the data collection process. The insulation on the
column should be improved to increase the possibility of having better results. An external plate
should be obtained to provide the student with a sense feeling of how the plate operates.
VII. Reference
1. Chemical Engineering Process Lab II/Batch Distillation. 2016
VIII. Appendix A: Sample Calculations
Percentage Area of Acetic Acid:
%A AA=A AA
AH 2 O+A AA= 5918
48383+5918=10.9 %
Percentage Volume of Acetic Acid:%V AA=1.0831+1.3664 X AA−3.7666 ×10⁻³ X AA
2=1.0831+1.3664∗10.9−3.7666 ×10⁻³¿10.92=15.5% Percentage Mole of Acetic Acid:%Mole AA=1.5197+0.24127 X AA+7.3534 × 10⁻³ X AA
2=1.5197+0.24127∗10.9+7.3534 ×10⁻³ ¿10.92=5.0 % Still pot mole fraction of water:
X H 2 O=molesof water
totalnumber of moles=
500 mL∗1 g/ml18g /mol
500 mL∗1 g/ml18 g/mol
+ 1000mL∗1g /mL∗1.04960.05
=0.61
Relative volatility of Acetic Acid in Water (From Slope of Figure 4):
α= 10.5264
=1.8997
Theoretical Number of Trays:
n=
log [( x A
xB )d ( xB
x A )s]logα av
−1=log [( 0.9498
0.0502 )d( 0.3708
0.6292 )s]
log (1.8997 )−1=2.76 Trays
Column Efficiency:
9
Efficiency=ntheoretical
nactual∗100 %=2.76
27∗100 %=10.2 %
S2/S1 (from xdav):
ln ( S1
S2 )=∫x s2
x s1 dxs
xd−xs=
S1
S2=
xd−xs1
xd−xs2
= .95−.63.95−.62
=0.96
S2/S1 (from integral):S1
S2=
kx s−xs2
kx s−xs1
=(0.0403)(0.6225)−.62(0.0403)(0.6225)−.63
=0.98
Difference and Percentage Difference:Difference=0.98−0.96=0.02
% Difference=0.020.96
∗100 %=2.1 %
S2 Calculation:S2=S1−Db=45.22−1.006=44.22
S2 Calculation using S2/S1 (from integral):S2=0.9777∗S1=0.9777∗45.22=44.22
S2 Calculation using S2/S1 (from xdav):
S2=0.9597∗S1=0.9597∗45.22=43.39 Heat Removed from Condenser:
q=m c p ΔT=Qtρ c p ΔT =61.23 mLs
∗1 gmL
∗4.1814 JgK
∗(26−25 )=256 J /s
10
IX. Appendix B: Experimental Data
Table 10: Distillation Experiment
Sample measurements Values from Gas Chromatograph Area %
Sample Volume of Sample (mL)
Weight of Sample (g)
Area H2O (Water)
Area CH3COOH
(Acetic Acid)
Total Area
Area % of H2O
Area % of CH3COOH
Distillate 1 17.3 17.49 48383 5918 5430189.1% 10.9%
Still pot Liquid 1 18.0 18.81 18563 22725 4128845.0% 55.0%
Still pot Vapor 1 10.8 11.25 29048 17353 4640162.6% 37.4%
Distillate 2 14.0 14.17 49873 6185 5605889.0% 11.0%
Distillate 3 9.2 9.32 49019 6744 5576387.9% 12.1%
Still pot Liquid 3 N/a N/a 17692 22801 4049343.7% 56.3%
Still pot Vapor 3 N/a N/a 26378 17800 4417859.7% 40.3%
Flowrate of Cooling Water
Measurement number Volume (mL) Time (s) Flow Rate (mL/s)1 275 4.28 64.25
2 280 4.81 58.21
Average 61.23
Location Temperature at Trial 1 (C)
Temperature at Trial 2
(C)Still Pot 106 106Distillate 102 102
11