myeloma - anco-online.org · shaji kumar, jonathan l. kaufman, cristina gasparetto, joseph mikhael,...
TRANSCRIPT

1
MyelomaCloser to a Cure than Ever
Before
Jeffrey Wolf, MDMyeloma Program
University of California, San Francisco
0.0
0.1
0.2
0.3
0.4
0.5
0.6
0.7
0.8
0.9
1.0
Prop
ortio
n Su
rviv
ing
0 2 4 6 8 10 12 14 16 18 20Follow up from diagnosis (years)
Kumar S. Blood 2008;111: 2516 – 2520; Kumar S. Leukemia (2014) 28, 1122–1128.
Survival in Myeloma
2011-14
1961-70
2001-10
1991-2000

2
Changes in Diagnosis
Free Light Chain Ratio
Percentage Plasma Cells on Diagnostic Marrow
Use of Modern Imaging
Kyle R et al. N Engl J Med 2007;356:2582-2590
Characteristics of Active Multiple Myeloma and Its Precursors

3
Myeloman MM is characterized by:
n Excessive numbers of abnormal plasma cells in the bone marrow
u Overproduction of intact monoclonal immunoglobulins (IgG, IgA, IgD) or free antibody light chains
u concomitant drop in other immunoglobulins
u CRAB CriteriauHyperCalcemiauRenaluAnemiauBone Lesions Kufe. Cancer Medicine. 6th ed. 2003:2219.
Reproduced with permission from the Multiple Myeloma Research Foundation Web site. Available at: http://www.multiplemyeloma.org/about_myeloma/index.html
100
80
60
40
20
0
51% will convert in first 5 yrs~ 10% per yr
0 5 10 15 20 25
Prob
abili
ty o
f Pro
gres
sion
(%)
51
6673 78
4 1016
21
MGUSSmoldering MM
Smoldering Multiple Myeloma
Kyle RA, et al. N Engl J Med. 2007;356:2582-2590. Greipp PR, et al. J Clin Oncol. 2005;23:3412-3420.Yrs Since Diagnosis
27% more will convert in remaining 15 yrs~ 2% per yr
Mimics MGUS

4
HR: 13.7; P < .001
Biomarkers to Predict Risk of Progression
n FLC ratio ≥ 100 predicts risk (P < .0001)
n Clonal plasma cells in BM predicts risk (P < .001)
Larsen JT, et al. Leukemia. 2013;27:941-946. Kastritis E, et al. Leukemia. 2013;27:947-953.
FLC ratio ≥ 100FLC ratio < 100Median TTP:
15 mos Median TTP:55 mos
1.0
0.8
0.6
0.4
0.2
00 20 40 60 80 100 120
Mos to Progression
BM plasma cells < 60%
BM plasma cells ≥ 60%
% Pr
ogre
ssio
n to
Sy
mpt
omat
ic M
yelo
ma
% Pr
ogre
ssio
n to
MM
Mos to Progression720 6 12 18 24 30 36 42 48 54 60 66
1.0
0.8
0.6
0.4
0.2
0
Updated IMWG Criteria for Diagnosis of Multiple Myeloma
*C: Calcium elevation (> 11 mg/dL or > 1 mg/dL higher than ULN)R: Renal insufficiency (creatinine clearance < 40 mL/min or serum creatinine > 2 mg/dL)A: Anemia (Hb < 10 g/dL or 2 g/dL < normal)B: Bone disease (≥ 1 lytic lesions on skeletal radiography, CT, or PET-CT)
Rajkumar SV, et al. Lancet Oncol. 2014;15:e538-e548.
MGUS
§ M protein < 3 g/dL
§ Clonal plasma cells in BM < 10%
§ No myeloma defining events
Smoldering Myeloma
§ M protein ≥ 3 g/dL (serum) or ≥ 500 mg/24 hrs (urine)
§ Clonal plasma cells in BM ≥ 10% to 60%
§ No myeloma defining events
Multiple Myeloma
§ Underlying plasma cell proliferative disorder
§ AND 1 or more myeloma defining events
§ ≥ 1 CRAB* feature§ Clonal plasma cells in
BM ≥ 60%§ Serum free light
chain ratio ≥ 100§ > 1 MRI focal lesion
5
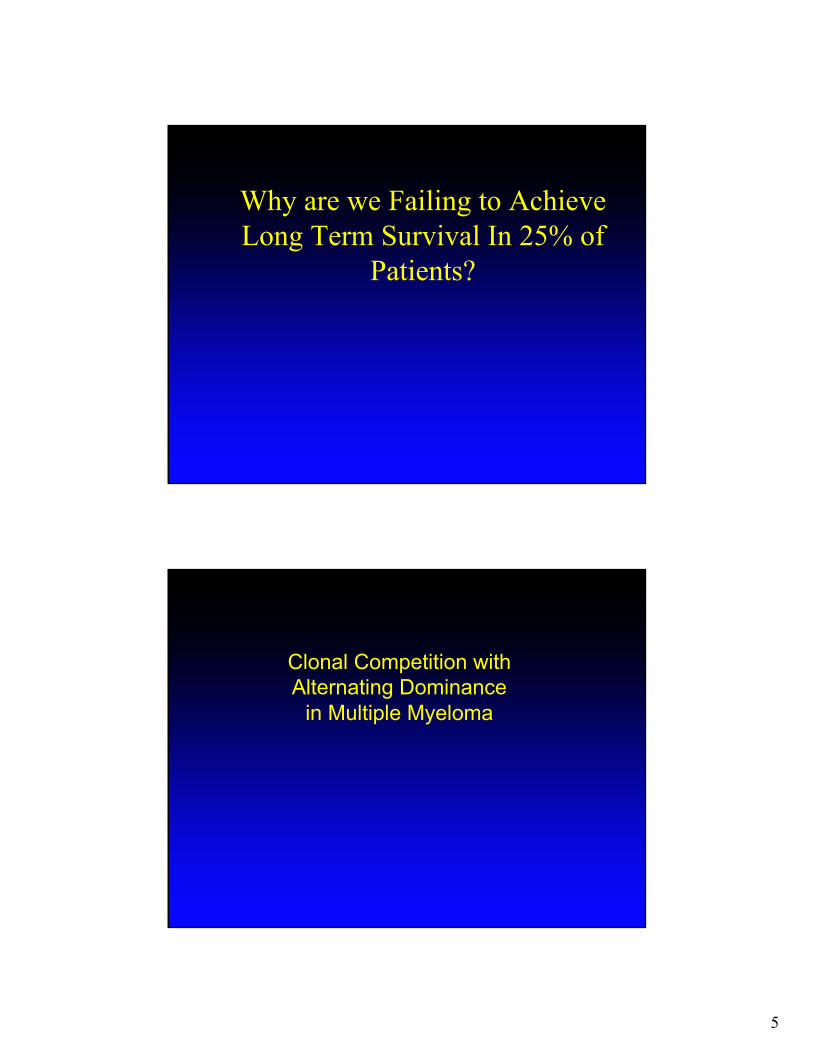
Why are we Failing to Achieve Long Term Survival In 25% of
Patients?
Clonal Competition with Alternating Dominance
in Multiple Myeloma

6
Clonal Competition with Alternating Dominance in Multiple MyelomaBased on iFISH and Array Comparative Genomic Hybridization (aCGH) at 7 time points
Keats, et.al.Blood, 2012
Pt with t(4;14)
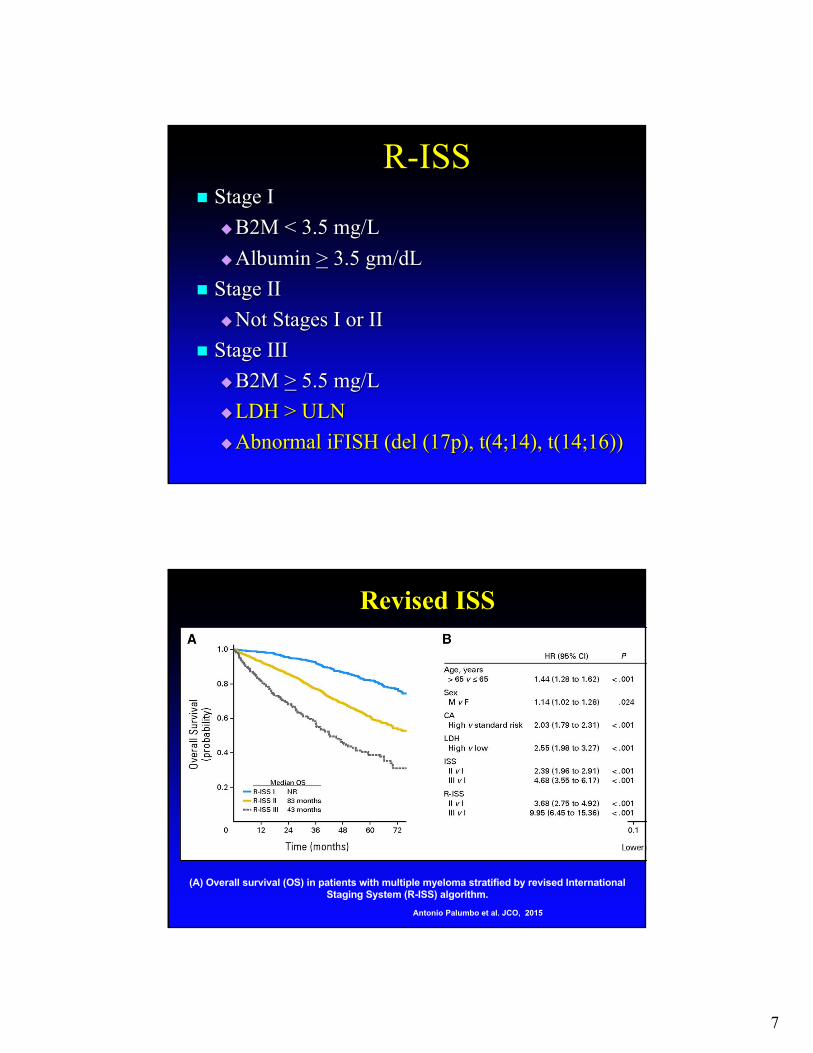
New Staging
Revised International Staging SystemR-ISS
7
R-ISSn Stage I
uB2M < 3.5 mg/LuAlbumin > 3.5 gm/dL
n Stage IIuNot Stages I or II
n Stage IIIuB2M > 5.5 mg/LuLDH > ULNuAbnormal iFISH (del (17p), t(4;14), t(14;16))
(A) Overall survival (OS) in patients with multiple myeloma stratified by revised International Staging System (R-ISS) algorithm.
Antonio Palumbo et al. JCO, 2015
Revised ISS

8
Evidence that Depth of Response Matters
CR and MRD
The Iceberg

9
CR vs nCR / VGPR / PR vs Less
Martinez-Lopez J, et al. Blood. 2011;118:529-534.
PFSP = 0.00001
1.0
0.9
0.8
0.7
0.6
0.50.4
0.3
0.1
0.2
0.0
0.9
0.8
0.7
0.6
0.50.4
0.3
0.1
0.2
0.00 05 510 1015 1520 years 20 years
CR (n=63) nCR (n = 66) + VGPR (n = 54) + PR (n = 114) SD (n = 12) + PD (n = 14)
Prognostic effect of CR patients vs those in nCR or VGPR or PR vs patients with SD or PD after HDT/ASCT
OSP = 0.00001
1.0
Minimal Residual Disease (MRD)
Standard Flow – 10-4
EuroFlow (8 color) – 10-5
Next Generation Sequencing – 10-6

10
Spanish Retrospective Look at MRD and Survival
Time to progression for patients achieving conventional complete remission (CR), according to minimal residual disease
(MRD) status as determined by deep sequencing (NGS).
Martinez-Lopez J et al. Blood 2014;123:3073-3079

11
Further Evidence that MRD Matters
IFM/DFCI 2009

12
Frontline Therapy for Patients Eligible (or Ineligible) for
Transplant
Discovery of Active Drugs in Multiple Myeloma
§ Melphalan§ Cytoxan§ Prednisone§ Dexamethasone§ Doxorubicin
§ Oprozomib§ Marizomib
§ Isatuximab
§ Venetoclax
§ Selinexor
§ CAR-T§ BiTES§ ADCs
§ Carfilzomib§ Pomalidomide§ Panobinostat
§ Daratumumab§ Ixazomib§ Elotuzumab
Old Drugs(1960s)
Recently ApprovedDrugs (2013-2015)
Future Drugs
§ Bortezomib§ Thalidomide§ Lenalidomide§ Liposomal
doxorubicin
Approved Drugs(2003-2007)

13
Improving Response Rates with Combination Therapies for Induction
Role of Autologous Transplant
IFM/DFCI 2009

14
27
IFM/DFCI Study Schema
12 months lenalidomide maintenance
5 cycles RVD
N=700(289assessedbyNGS
duetosampleavailability)
Melphalan + ASCT + 2
cycles RVD
BMMRD BMMRD
3 Cycles RVD
BMID
*comparisons to flow at all MRD time points
Ran
dom
izat
ion
IFM/DFCI2009
P<0.001
0
10
20
30
40
50
60
70
80
90
100
Patie
nts (
%)
350 296 228 128 24no HDT350 309 261 153 27HDT
N at risk
0 12 24 36 48
Months of follow-up
HDTno HDT
Transplant improved PFS

15
Impact of Treatment Arm on MRD and PFS
IFM/DFCI 2009MRD Impact on OS

16
Further Evidence for Role of Auto ASCT
KRd (? Improvement over RVd?)Jakubowiak, 2015

17
KRd + ASCTZimmerman, 2016
Role of Maintenance (Continuation) Therapy

18
Myeloma XI – Role of Lenalidomide Maintenance
Maintenance Meta-Analysis
19
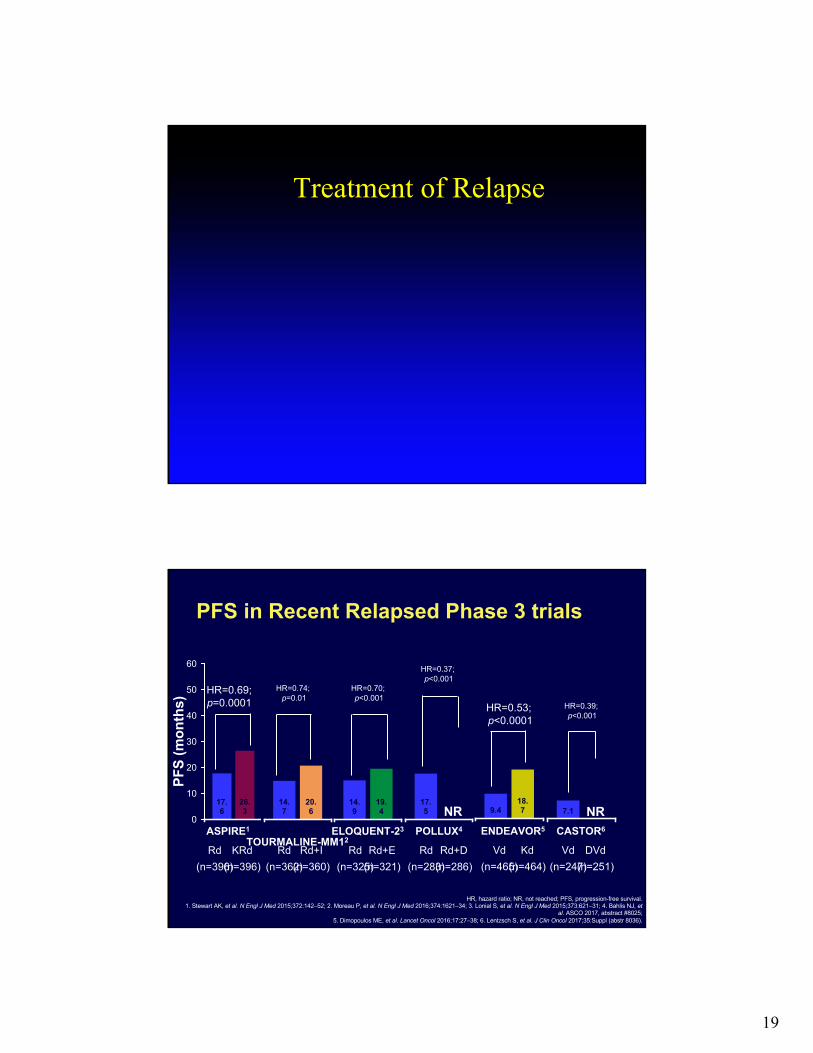
Treatment of Relapse
PFS in Recent Relapsed Phase 3 trials
17.5
HR, hazard ratio; NR, not reached; PFS, progression-free survival.1. Stewart AK, et al. N Engl J Med 2015;372:142–52; 2. Moreau P, et al. N Engl J Med 2016;374:1621–34; 3. Lonial S, et al. N Engl J Med 2015;373:621–31; 4. Bahlis NJ, et
al. ASCO 2017, abstract #8025; 5. Dimopoulos ME, et al. Lancet Oncol 2016;17:27–38; 6. Lentzsch S, et al. J Clin Oncol 2017;35:Suppl (abstr 8036).
17.6
26.3
0
10
20
30
40
50
60
14.9
19.4
14.7
20.6
ASPIRE1
TOURMALINE-MM12ELOQUENT-23 POLLUX4
KRd(n=396)
Rd(n=396)
Rd+I(n=360)
Rd(n=362)
Rd(n=325)
Rd+E(n=321)
Rd(n=283)
Rd+D(n=286)
PFS
(mon
ths)
HR=0.69;p=0.0001
HR=0.70; p<0.001
HR=0.74; p=0.01
HR=0.37; p<0.001
NR 9.418.7
ENDEAVOR5
Kd(n=464)
Vd(n=465)
HR=0.53; p<0.0001
7.1
CASTOR6
Vd(n=247)
DVd(n=251)
HR=0.39; p<0.001
NR

20
Castor: Vd vs Dara Vd
Pollux: Rd vs Dara Rd

21
New and Variations on Old Therapies
Venetoclax90 Minute Daratumumab (Sub Q Coming)
Once Weekly Carfilzomib
Efficacy of Venetoclax as Targeted Therapy for Relapsed/Refractory
t(11;14) Multiple Myeloma
Shaji Kumar, Jonathan L. Kaufman, Cristina Gasparetto, Joseph Mikhael, Ravi Vij, Brigitte Pegourie, Lofti Benboubker, Thierry Facon, Martine Amiot, Philippe Moreau, Elizabeth A. Punnoose, Stefanie Alzate, Martin Dunbar, Tu Xu, Suresh K. Agarwal, Sari Heitner Enschede, Joel D. Leverson, Jeremy A. Ross, Paulo C. Maciag, Maria Verdugo and Cyrille Touzeau
Blood 2017 :blood-2017-06-788786; doi: https://doi.org/10.1182/blood-2017-06-788786

22
Venetoclax in t(11;14) Mutated iFISH
Venetoclax (ABT-1999 / GDC-0199) Combined with Rituximab Induces Deep Responses in Relapsed / Refractory CLL 43
Venetoclax Combined With Bortezomib and Dexamethasone for Patients With
Relapsed/Refractory Multiple Myeloma
Philippe Moreau,1 Asher Chanan-Khan,2 Andrew W. Roberts,3 Amit B. Agarwal,4 Thierry Facon,5 Shaji Kumar,6 Cyrille Touzeau,1 Jaclyn Cordero,7 Jeremy Ross,7 Wijith Munasinghe,7 Jia Jia,7 Ahmed H. Salem,7 Joel Leverson,7 Paulo Maciag,7 Maria Verdugo,7 Simon J. Harrison8
American Society of Hematology – 58th Annual Meeting ● San Diego, California, USA ● December 4, 2016

23
0
2 0
4 0
6 0
8 0
1 0 0
Pe
rce
nta
ge
of
Pa
tie
nts
sCR CR VGPR PR
A l lP a t ie n t s
N = 6 6
P r io r T h e r a p ie s 1 - 3 > 3
n = 3 7 n = 2 9
O R R 6 7 %
24%
23%
15%
5 %
O R R 8 9 %
24%
32%
24%
9%
O R R 3 8 %
24%
10%
B o r t e z o m i bN o n - r e f r a c to r y R e f r a c t o r y S e n s i t i v e N a iv e n = 3 9 n = 2 6 n = 2 7 n = 1 2
O R R 9 0 %
26%
36%
20%
8%
O R R 3 1 %
23%
4 %
O R R 8 9 %
33%
30%
19%
7%
O R R 9 2 %
8%
50%
25%
9%
4 %4 %
ORR=PR or better; numbers are based on evaluable patients per subgroups.
Objective Responses
0
2 0
4 0
6 0
8 0
1 0 0
Pe
rce
nta
ge
of
Pa
tie
nts
sCR CR VGPR PR
A l lP a t ie n t s
N = 6 6
P r io r T h e r a p ie s 1 - 3 > 3
n = 3 7 n = 2 9
O R R 6 7 %
24%
23%
15%
5 %
O R R 8 9 %
24%
32%
24%
9%
O R R 3 8 %
24%
10%
B o r t e z o m i bN o n - r e f r a c to r y R e f r a c t o r y S e n s i t i v e N a iv e n = 3 9 n = 2 6 n = 2 7 n = 1 2
O R R 9 0 %
26%
36%
20%
8%
O R R 3 1 %
23%
4 %
O R R 8 9 %
33%
30%
19%
7%
O R R 9 2 %
8%
50%
25%
9%
4 %4 %
B o r te z o m ibN o n -R e f r a c to r y
a n d 1 - 3 P r io rT h e r a p ie s
n = 3 0
O R R 9 7 %
41%
23%
10%
23%
45Data cutoff of 19Aug2016
Dara Carfilzomib Dexamethasone
D-Kd

24
Study Design: D-Kd Arm of MMY1001
Ajai Chari, MD
• Open-label, non-randomized, multicenter, phase 1b study in RRMM patients• Per protocol, DARA was administered as a single first dose (n = 10) or as a split
first dose (n = 75)
D-Kd, daratumumab/carfilzomib/dexamethasone; IMiD, immunomodulatory drug; ECOG, Eastern Cooperative Oncology Group; LVEF, left ventricular ejection fraction; ANC, absolute neutrophil count; IV, intravenous; QW, every week; Q2W, every 2 weeks; Q4W, every 4 weeks; PD, progressive disease; PO, oral; OS, overall survival; NGS, next-generation sequencing; IFE, immunofixation; CR, complete response; VGPR, very good partial response.
Eligibility/treatment
• Relapsed MM– 1-3 prior lines of
therapy, including bortezomib and an IMiD
– Len-refractory patients allowed
• Carfilzomib-naïve• ECOG status ≤2
• LVEF ≥40%
• ANC ≥1 × 10⁹/L• Platelet count ≥75 ×
109/L
Dosing schedule (28-day cycles)
DARA: • Split first dosea: 8 mg/kg Days 1-2 of Cycle 1• Single first dose: 16 mg/kg on C1D1• 16 mg/kg IV QW on Cycles 1-2, Q2W on Cycles
3-6, and Q4W thereafter until PDCarfilzomibb: • 20 mg/m2 IV Cycle 1 Day 1• Escalated to 70 mg/m2 Cycle 1 Day 8+; weekly
(Days 1, 8, 15) until PDDexamethasone: • 40 mg/week (Days 1, 8, 15, 22) IV or PO until
PD
EndpointsPrimary• Safety, tolerabilitySecondary• ORR
• OSExploratory• PFS• MRD (NGS)c
• PK
aIn 500-mL dilution volume.bBoth 20 mg/m2 and 70 mg/m2 were administered as 30-minute IV infusions.cAmong patients evaluated for MRD, MRD was assessed using NGS at time of suspected CR and at 12 and 18 months after initial dose. In cases where DARA is suspected of interfering with IFE and preventing clinical CR response calls, subjects with VGPR may also be evaluated for MRD.
47
Most Common TEAEs (All Treated)
Ajai Chari, MD
Hematologic (>20%)
Percentage of patients
22
21
21
31
25
29
47
67
0 50 100
Lymphopenia
Neutropenia
Anemia
Thrombocytopenia
All
Grade 3/4
• Low neutropenia rates with D-Kd in RRMM• Similar safety profile observed for len-refractory patients
Percentage of patients
TEAE, treatment-emergent adverse event; URTI, upper respiratory tract infection.
Non-hematologic (>20%)
0
1
0
14
2
4
1
2
1
12
1
1
22
22
25
25
31
31
33
34
37
38
39
40
0 10 20 30 40 50
Back pain
Headache
Cough
Hypertens…
Diarrhea
Insomnia
Pyrexia
Dyspnea
Vomiting
Asthenia
URTI
Nausea
All
48

25
13% 10% 17%
44% 50% 37%
16% 10% 20%
11%8%
17%
0
10
20
30
40
50
60
70
80
90
100
All-treated n = 82
Len-refractory n = 48
Len-exposedbut not refractory
n = 30
OR
R, %
PR VGPR
Overall Responsea and Confirmed MRD-negative Rates
Ajai Chari, MD
• Median follow-up: 12.0 months• Optional MRD testing in 11 patients with CR/sCR; 4 were MRD negative at 10-5
Responses are anticipated to deepen over longer follow-up
≥CR27%
≥VGPR71%
ORR = 84%
4/11 pts
1/5 pts
2/4 pts
0
10
20
30
40
50
60
MR
D-n
egat
ive
rate
, %
36%
20%
50%
Len-refractory n = 5
MRD-negative rates (10-5) among
MRD-tested CR/sCR patients
All-treatedn = 11
PR, partial response; sCR, stringent complete response.aIn response-evaluable patients (received at least 1 administration of any component of study treatment and have at least 1 post baseline disease assessment) who were treated more than 2 cycles or discontinued study treatment.
Len-exposed but not
refractoryn = 4
ORR = 90%
≥CR37%
≥VGPR73%
49
≥CR19%
≥VGPR69%
ORR = 79%
Progression-free Survival Across Subgroups
Ajai Chari, MD
Encouraging PFS observed in lenalidomide- and PI/IMiD-refractory patients
• Median follow-up: 12.0 months
00 3 6 9 2412
60
40
20
80
100
% s
urvi
ving
with
out p
rogr
essi
on
Months1815
85513025
72412721
66352719
60322517
13672
2612136
11561
0000
No. at riskAll-treated
Len-refractoryLen-exposed
PI/IMiD-refractory
21
8351
NE, not estimable.50
14.1(95% CI, 12.0-NE)
Len-refractory
Len-exposed but not refractory
NE(95% CI, 9.4-NE)PI/IMiD-refractory
Median PFS, mo
NE
62%
87%
51%
12-month PFS, %
All-treated NE 71%

26
n Ninety-Minute Daratumumab Infusion Is Safe in Multiple Myeloma
n Hallie Barr, et. al. n Blood 2017 130:1889;
BCMA CAR-T Cell Therapy

27
Summary of Ongoing BCMA CAR-T Trials for MM
Name Anti-BCMA CAR Bb2121 LCAR-B38M CART-BCMA
Group NCI Bluebird/ Celgene Nanjng/Legend Biotech Novartis/Penn
Binder/co-stimulatory signal
Murine/CD3ζ, CD28
Murine/CD3ζ, 4-1BB
Murine/CD3ζ, 4-1BB
Fully human/CD3ζ,
4-1BB
Transfection γ-retroviral Lentiviral Lentiviral Lentiviral
BCMA expression required? Yes Yes Yes No
• All responding patients evaluated for MRD were MRD negative at 1 or more time points
• 2 nonresponders evaluated for MRD were MRD positive at month 1
BB 2121 PHASE I: TUMOR RESPONSE BY MRD
Response 50 × 106 150 × 106 450 × 106 800 × 106 TotalMRD-evaluableresponders
0 4 11 1 16
MRD-nega 0 4 (100) 11 (100) 1 (100) 16 (100)
Data cutoff: March 29, 2018. a
Of 16 MRD-negative responses: 4 at 10-6, 11 at 10-5, 1 at 10-4 sensitivity by Adaptive next-generation sequencing assay.

28
BB 2121 PHASE I: PROGRESSION-FREE SURVIVAL
PFS at Inactive (50 × 106) and Active (150–800 ×106) Dose Levelsa PFS in MRD-Negative Patientsa
Data cutoff: March 29, 2018. Median and 95% CI from Kaplan-Meier estimate. NE, not estimable. aPFS in dose escalation cohort.
50 × 106
(n=3)150–800 ×106 (n=18)
Events 3 10mPFS (95% CI), mo
2.7 (1.0–2.9)
11.8 (8.8–NE)
150–800 ×106 (n=16)
mPFS (95% CI), mo
17.7 (5.8–NE)
• mPFS of 11.8 months at active doses (≥150 × 106 CAR+ T cells) in 18 subjects in dose escalation phase
• mPFS of 17.7 months in 16 responding subjects who are MRD-negative
mPFS = 11.8 mo
mPFS = 2.7 mo
mPFS = 17.7 mo
BB 2121 Phase I

29

30
Thank You