mycobacterium tuberculosis complex drug … for disease control and prevention model performance...
TRANSCRIPT
Centers for Disease Control and Prevention Model Performance Evaluation Program
Mycobacterium tuberculosis Complex Drug Susceptibility Testing Program
Report of Results May 2013
Performance Evaluation Survey
Mycobacterium tuberculosis Complex Drug Susceptibility Testing Report for May 2013 Samples Survey
Purpose The purpose of this report is to present the results of the U.S. Centers for Disease Control and Prevention (CDC) Model Performance Evaluation Program (MPEP) for Mycobacterium tuberculosis complex drug susceptibility testing survey sent to participants in May 2013.
Report Content The material in this report was developed and prepared by
Cortney Stafford, MPH, MT (ASCP), Health Scientist, Laboratory Capacity Team, NCHHSTP, DTBE, LB
Beverly Metchock, DrPH, D(ABMM), Team Lead, Reference Laboratory, NCHHSTP, DTBE, LB
Acknowledged contributors: Lois Diem NCHHSTP, DTBE, LB; Mitchell Yakrus NCHHSTP, DTBE, LB; Angela Starks NCHHSTP, DTBE, LB
Contact Information Comments and inquiries regarding this report should be directed TBMPEP [email protected] 404-639-4013
The findings and conclusions in this report are those of the author(s) and do not necessarily represent the views of the Centers for Disease Control and Prevention.
Use of trade names and commercial sources is for identification only and does not imply endorsement by the U.S. Department of Health and Human Services.
CDC MPEP MTBC DST Report for May 2013 Survey 2
Table of Contents Mycobacterium tuberculosis Complex Drug Susceptibility Testing MPEP Report for May 2013 Samples Survey
Introduction: Overview of MPEP Final Report ................................................................................................................4
Expected Susceptibility Testing Results ...........................................................................................................................4
Abbreviations and Acronyms............................................................................................................................................5
Technical Notes.................................................................................................................................................................6
Descriptive Information about Participating Laboratories
Primary Classification..........................................................................................................................................7
Annual Number of M. tuberculosis Complex Drug Susceptibility Tests Performed...........................................8
M. tuberculosis Complex Drug Susceptibility Testing Methods Used ................................................................9
Antituberculosis Drugs Tested by Participants ..................................................................................................10
Detailed Information for Each Isolate
Isolate A .............................................................................................................................................................11
Isolate B .............................................................................................................................................................13
Isolate C .............................................................................................................................................................16
Isolate D.............................................................................................................................................................18
Isolate E .............................................................................................................................................................20
Equivalent Critical Concentrations .................................................................................................................................23
References.......................................................................................................................................................................24
CDC MPEP MTBC DST Report for May 2013 Survey 3

4 CDC MPEP MTBC DST Report for May 2013 Survey
Introduction: Overview of MPEP Final Report This aggregate report is prepared in a format that will allow laboratory personnel to compare their drug susceptibility testing (DST) results with those obtained by other participants using the same methods, drugs, and drug concentrations, by isolate. We encourage circulation of this report to personnel who are involved with DST or reporting and interpreting results for M. tuberculosis complex (MTBC) isolates.
MPEP is not a formal, graded proficiency testing program. It is an educational self-assessment tool for laboratory staff to monitor their ability to determine drug-resistance among isolates of MTBC. This report includes results for a subset of laboratories performing DST for MTBC in the United States. MPEP is a voluntary program and this report reflects data received from participating laboratory personnel.
CDC is neither recommending nor endorsing testing practices reported by participants. For approved standards, participants should refer to consensus documents published by the Clinical and Laboratory Standards Institute (CLSI), “Susceptibility Testing of Mycobacteria, Nocardiae, and Other Aerobic Actinomycetes; Approved Standard-Second Edition,” M24-A2 [1].
Expected Susceptibility Testing Results The table below provides the anticipated results of the panel that was sent to participants in May 2013. Although CDC recommends broth-based methods for routine first-line DST of MTBC isolates, this table provides the results obtained by the reference agar proportion method, except in the case of pyrazinamide, where MGIT was the testing method.
Table 1. Expected Results for May 2013 Survey
First-Line Drugs Second-Line Drugs
INH RMP EMB PZA Expected Resistance
2013A S S S S STR
2013B S R S S STR, KAN
2013C S S S S AMK, CAP, KAN
2013D S S S S CIP, OFL
2013E R S S S STR, ETA
Note—S=susceptible, R=resistant
AMK amikacin AP
agar proportion – performed on Middlebrook 7H10 or 7H11
bp base pair CAP capreomycin
CDC U.S. Centers for Disease Control and Prevention CLSI Clinical Laboratory and Standards Institute
Conc. Concentration DNA deoxyribonucleic acid
DST drug susceptibility testing ETA ethionamide
HMO Health Maintenance Organization INH isoniazid KAN kanamycin MDR multidrug-resistant
MGIT BACTEC MGIT 960 – Mycobacteria Growth Indicator Tube MIC minimum inhibitory concentration
MPEP Model Performance Evaluation Program MTBC Mycobacterium tuberculosis complex OFL ofloxacin
R resistant RMP rifampin RNA ribonucleic acid
S susceptible Sensititre Trek Diagnostic Systems Sensititre Susceptibility Panel STR streptomycin
TB tuberculosis VersaTREK VersaTREK Myco susceptibility kit XDR extensively drug-resistant
Abbreviations and Acronyms
CDC MPEP MTBC DST Report for May 2013 Survey 5
Technical Notes The following information pertains to all of the tables and figures for the MTBC isolates A, B, C, D, and E in this report.
• The source of data in all tables and figures is the May 2013 MPEP MTBC DST survey.
• First-line and second-line drugs have been separated into individual tables for each isolate. Streptomycin is now included as part of the second-line table.
• Laboratories that use more than one DST method are encouraged to test isolates with each of those methods at either CLSI-recommended or equivalent critical concentrations. Some laboratories have provided results for additional drug concentrations. Consequently, the number of results for some drugs may be greater than 90 (the number of participating laboratories). This report contains all results reported by participating laboratories, including drug concentrations with only one result.
• The tables indicate the number of reported results (S represents susceptible and R represents resistant) for each drug at the noted concentration (conc.).
• Separate tables for molecular testing are included where data is of note; otherwise findings are reported in the summary.
• A list of critical concentrations for antituberculosis drugs, by method, can be found at the end of this report.
• The Trek Sensititre system allows determination of a minimum inhibitory concentration (MIC) for each drug in the panel. Laboratories using this method must establish breakpoints to provide a categorical interpretation of S or R. For this report, the reported MIC is noted below the corresponding interpretation in each table.
• Of the 31 laboratories reporting second-line drug results (with the exception of streptomycin), only 9 (29%) tested all three second-line injectable drug and at least one fluoroquinolone needed to confidently define XDR TB. Second-line injectable drugs consist of amikacin, kanamycin, and capreomycin. Fluoroquinolones include ofloxacin, ciprofloxacin, levofloxacin, and moxifloxacin.
CDC MPEP MTBC DST Report for May 2013 Survey 6
1%
71%
20%
8%
Health Department Hospital Independent (non-hospital based) Other
Descriptive Information about Participant Laboratories
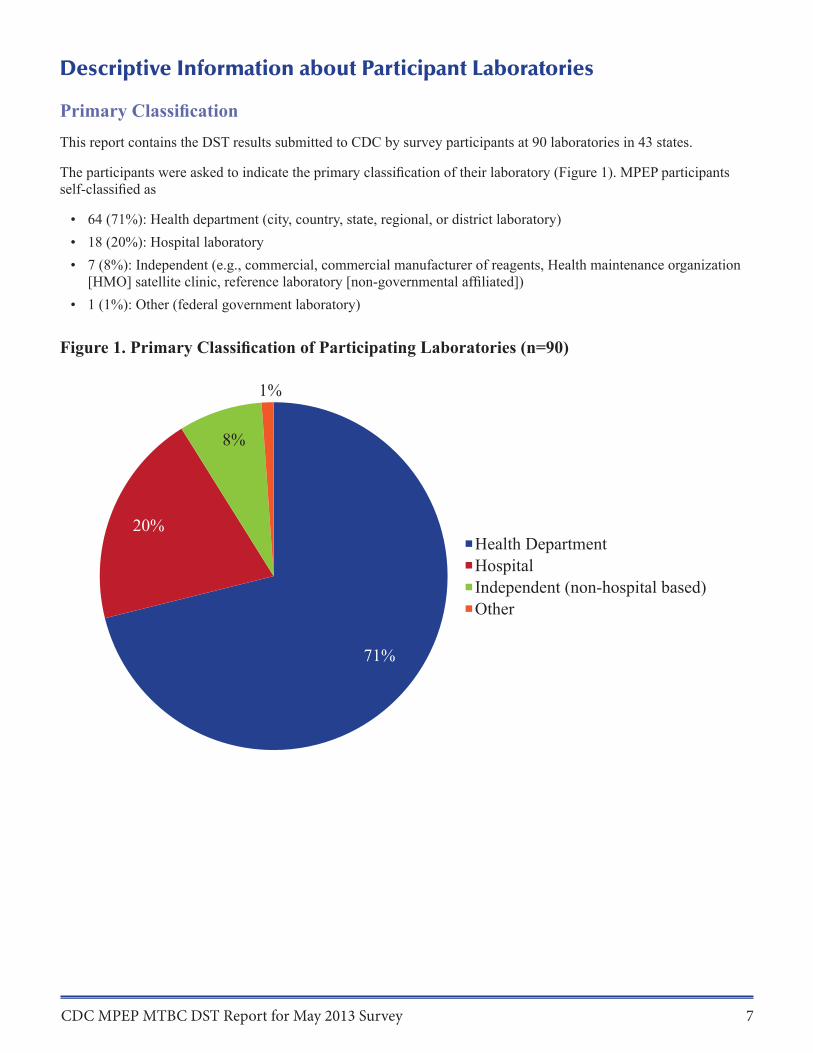
Primary Classification This report contains the DST results submitted to CDC by survey participants at 90 laboratories in 43 states.
The participants were asked to indicate the primary classification of their laboratory (Figure 1). MPEP participants self-classified as
• 64 (71%): Health department (city, country, state, regional, or district laboratory) • 18 (20%): Hospital laboratory • 7 (8%): Independent (e.g., commercial, commercial manufacturer of reagents, Health maintenance organization [HMO] satellite clinic, reference laboratory [non-governmental affiliated])
• 1 (1%): Other (federal government laboratory)
Figure 1. Primary Classification of Participating Laboratories (n=90)
CDC MPEP MTBC DST Report for May 2013 Survey 7
37
21
7 7
4 5 5
2 2
40
Num
ber
of L
abor
ator
ies R
espo
ndin
g
35
30
25
20
15
10
5
0 50 51-100 101-150 151-200 201-250 251-300 301-500 501-1000 1001
Number of Isolates Tested in 2011
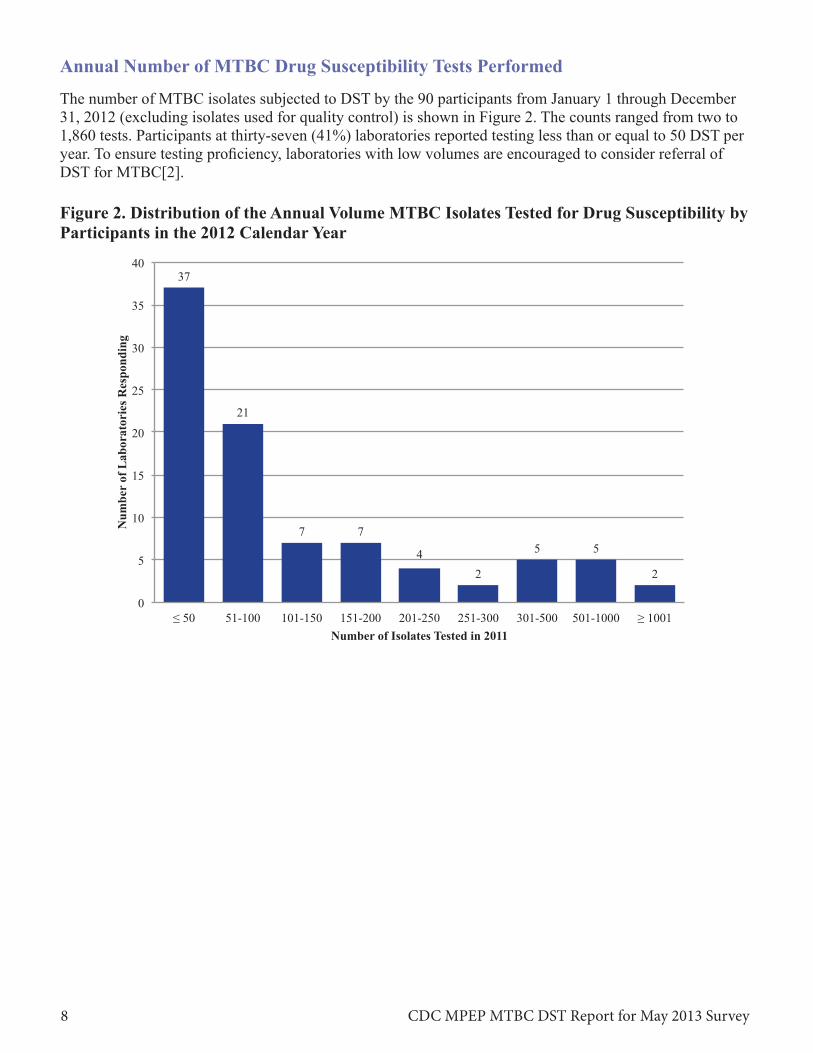
Annual Number of MTBC Drug Susceptibility Tests Performed
The number of MTBC isolates subjected to DST by the 90 participants from January 1 through December 31, 2012 (excluding isolates used for quality control) is shown in Figure 2. The counts ranged from two to 1,860 tests. Participants at thirty-seven (41%) laboratories reported testing less than or equal to 50 DST per year. To ensure testing proficiency, laboratories with low volumes are encouraged to consider referral of DST for MTBC[2].
Figure 2. Distribution of the Annual Volume MTBC Isolates Tested for Drug Susceptibility by Participants in the 2012 Calendar Year
CDC MPEP MTBC DST Report for May 2013 Survey 8

86
32
2 1
11
0
10
20
30
40
50
60
70
80
90
Num
ber
of
Lab
orat
orie
s Res
pond
ing
MGIT Agar Proportion VersaTREK Sensititre Molecular Methods Susceptibility Testing Methods
VersaTREK Sensititre Agar Proportion
MGIT 73%
MGIT & AP 19%
2% 1% 1% MGIT & Molecular
4%
Agar Proportion62%
AP & MGIT
7%
Sensititre MolecularAP & 2% 2%Molecular
3%
MGIT 24%
MTBC DST Methods Used by Participants
Participants were asked to report all DST methods that were used for these isolates. Fifty-eight (64%) laboratories used only one method. Thirty laboratories utilized two methods and two laboratories used three susceptibility methods. Molecular methods included— Laboratory Developed Tests (seven laboratories), Cepheid Xpert MTB/RIF assay (two laboratories), and Genotype MTBDRsl/Genotype MTBDRplus (two laboratories).
Figure 3. MTBC Susceptibility Test Method Used by Participants (n=132)
The breakdown of methods listed by first-line DST and second-line DST are show in Figure 4 and Figure 5. The method used by most participants for first-line DST was MGIT (95%), while agar proportion (71%) was the most common method noted for second-line DST.
Figure 4. First-Line DST Method (n=90) Figure 5. Second-Line DST Method (n=42)
CDC MPEP MTBC DST Report for May 2013 Survey 9
Ant
itube
rcul
osis
Drg
us T
este
d
Rifampin Isoniazid
Ethambutol Pyrazinamide
Streptomycin
Ofloxacin Ciprofloxacin Moxifloxacin Levofloxacin
Kanamycin Capreomycin
Amikacin
Ethionamide p-Aminosalicyclic Acid
Rifabutin Cycloserine 10
12 21
28
17 22 23
3 7
9 20
63
83 90 90 90
0 10 20 30 40 50 60 70 80 90 100 Number of Laboratories
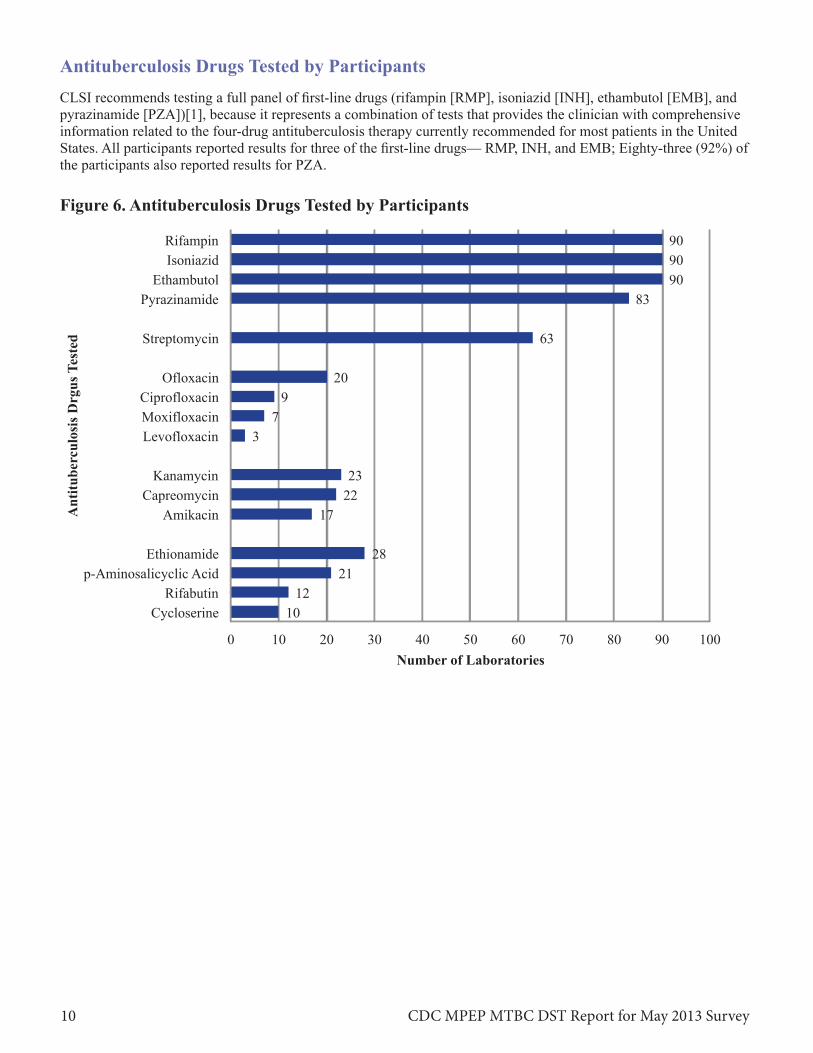
Antituberculosis Drugs Tested by Participants CLSI recommends testing a full panel of first-line drugs (rifampin [RMP], isoniazid [INH], ethambutol [EMB], and pyrazinamide [PZA])[1], because it represents a combination of tests that provides the clinician with comprehensive information related to the four-drug antituberculosis therapy currently recommended for most patients in the United States. All participants reported results for three of the first-line drugs— RMP, INH, and EMB; Eighty-three (92%) of the participants also reported results for PZA.
Figure 6. Antituberculosis Drugs Tested by Participants
CDC MPEP MTBC DST Report for May 2013 Survey 10
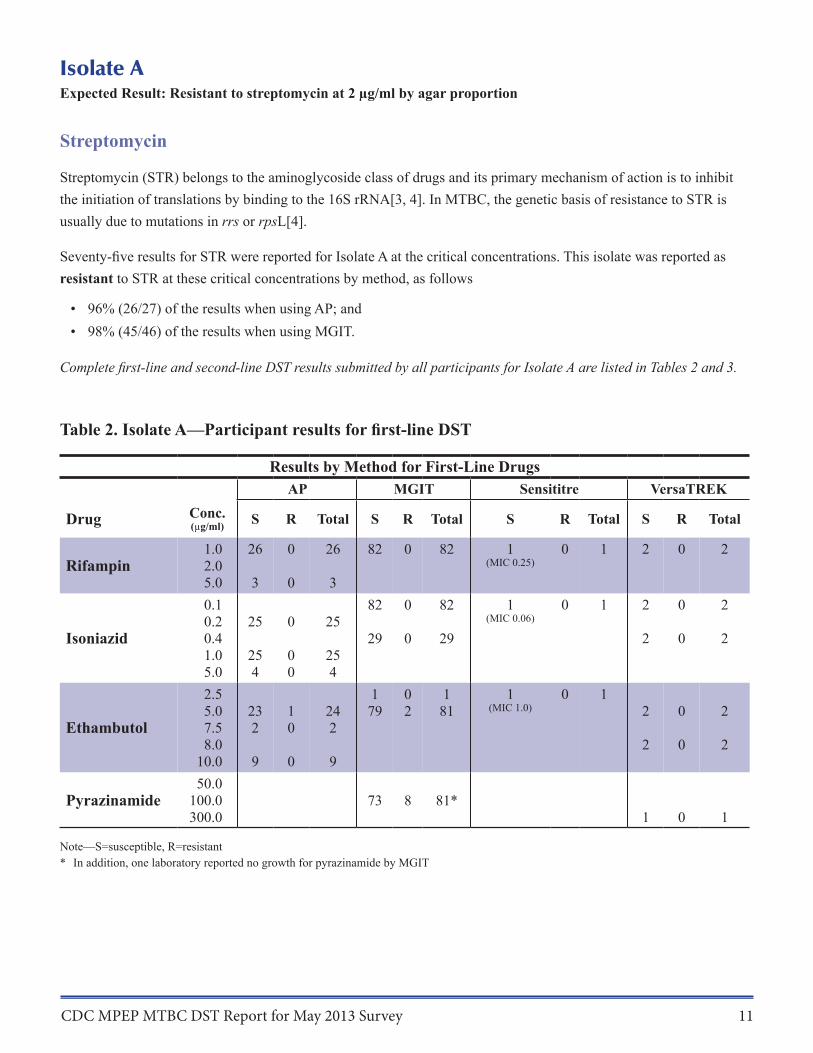
Isolate A Expected Result: Resistant to streptomycin at 2 µg/ml by agar proportion
Streptomycin
Streptomycin (STR) belongs to the aminoglycoside class of drugs and its primary mechanism of action is to inhibit the initiation of translations by binding to the 16S rRNA[3, 4]. In MTBC, the genetic basis of resistance to STR is usually due to mutations in rrs or rpsL[4].
Seventy-five results for STR were reported for Isolate A at the critical concentrations. This isolate was reported as resistant to STR at these critical concentrations by method, as follows
• 96% (26/27) of the results when using AP; and • 98% (45/46) of the results when using MGIT.
Complete first-line and second-line DST results submitted by all participants for Isolate A are listed in Tables 2 and 3.
Table 2. Isolate A—Participant results for first-line DST
Results by Method for First-Line Drugs
Drug Conc. (µg/ml)
AP MGIT Sensititre VersaTREK
S R Total S R Total S R Total S R Total
Rifampin 1.0 2.0 5.0
26
3
0
0
26
3
82 0 82 1 (MIC 0.25)
0 1 2 0 2
Isoniazid
0.1 0.2 0.4 1.0 5.0
25
25 4
0
0 0
25
25 4
82
29
0
0
82
29
1 (MIC 0.06)
0 1 2
2
0
0
2
2
Ethambutol
2.5 5.0 7.5 8.0
10.0
23 2
9
1 0
0
24 2
9
1 79
0 2
1 81
1 (MIC 1.0)
0 1 2
2
0
0
2
2
Pyrazinamide 50.0
100.0 300.0
73 8 81* 1 0 1
Note—S=susceptible, R=resistant * In addition, one laboratory reported no growth for pyrazinamide by MGIT
CDC MPEP MTBC DST Report for May 2013 Survey 11
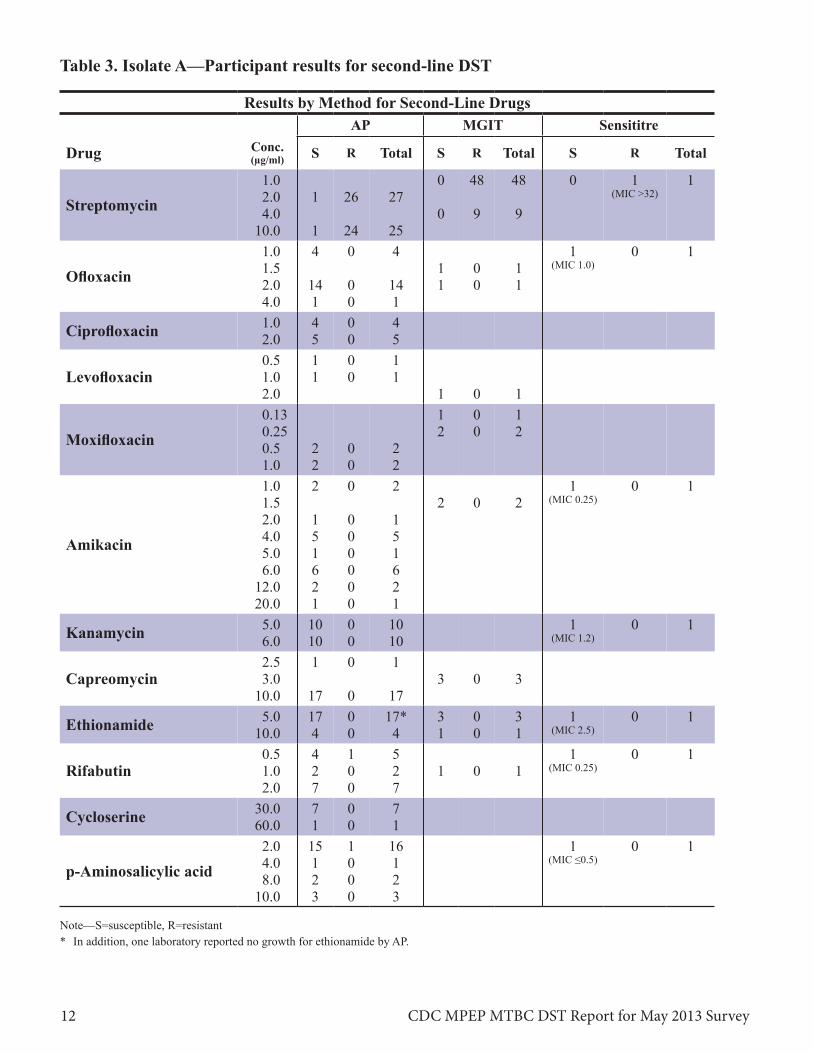
Table 3. Isolate A—Participant results for second-line DST
Results by Method for Second-Line Drugs
Drug Conc. (µg/ml)
AP MGIT Sensititre
S R Total S R Total S R Total
Streptomycin 1.0 2.0 4.0
10.0
1
1
26
24
27
25
0
0
48
9
48
9
0 1 (MIC >32)
1
Ofloxacin 1.0 1.5 2.0 4.0
4
14 1
0
0 0
4
14 1
1 1
0 0
1 1
1 (MIC 1.0)
0 1
Ciprofloxacin 1.0 2.0
4 5
0 0
4 5
Levofloxacin 0.5 1.0 2.0
1 1
0 0
1 1
1 0 1
Moxifloxacin 0.13 0.25 0.5 1.0
2 2
0 0
2 2
1 2
0 0
1 2
Amikacin
1.0 1.5 2.0 4.0 5.0 6.0
12.0 20.0
2
1 5 1 6 2 1
0
0 0 0 0 0 0
2
1 5 1 6 2 1
2 0 2 1
(MIC 0.25) 0 1
Kanamycin 5.0 6.0
10 10
0 0
10 10
1 (MIC 1.2)
0 1
Capreomycin 2.5 3.0
10.0
1
17
0
0
1
17 3 0 3
Ethionamide 5.0 10.0
17 4
0 0
17* 4
3 1
0 0
3 1
1 (MIC 2.5)
0 1
Rifabutin 0.5 1.0 2.0
4 2 7
1 0 0
5 2 7
1 0 1 1
(MIC 0.25) 0 1
Cycloserine 30.0 60.0
7 1
0 0
7 1
p-Aminosalicylic acid 2.0 4.0 8.0
10.0
15 1 2 3
1 0 0 0
16 1 2 3
1 (MIC ≤0.5)
0 1
Note—S=susceptible, R=resistant * In addition, one laboratory reported no growth for ethionamide by AP.
CDC MPEP MTBC DST Report for May 2013 Survey 12
Isolate B Expected Result: Resistant to rifampin at 1.0 µg/ml; streptomycin at 2.0 µg/ml and 10.0 µg/ml; and kanamycin at 5.0 µg/ml by agar proportion
Rifampin Rifampin (RMP) is a first-line antituberculosis drug for all forms of disease caused by organisms known or presumed to be susceptible to this drug. It is bactericidal for MTBC at the critical concentration of 1.0 μg/ml for AP and equivalent critical concentrations for MGIT960™ and VersaTREK of 1.0 μg/ml. The mechanism of action of RMP is to inhibit mycobacterial transcription by targeting DNA-dependent RNA polymerase[3, 4]. More than 96% of RMP-resistant isolates contain a mutation in the 81-base pair (bp) central region of the rpoB gene thatencodes the β-subunit of the bacterial DNA-dependent RNA polymerase[3, 4]. The activity of RMP in resistant isolates depends on both the mutation position and the type of amino acid change in the rpoB gene. Mutationsin codons 531, 526, and 516 are among the most frequent in RMP-resistant isolates and serve as predictors of RMP resistance. DNA sequence analysis of rpoB of Isolate B revealed a point mutation in the rpoB locus result-ing in serine being replaced by leucine at codon 531 (Ser531Leu). This mutation is associated with resistance to both RMP and rifabutin.
Of the 109 results reported for RMP for Isolate B, resistance was reported by • 100% (26/26) of the results when using AP; • 100% (81/81) of the results when using MGIT; and • 100% (2/2) of the results when using VersaTREK.
Nine (100%) laboratories using molecular methods reported this isolate as RMP resistant.
Rifabutin Five laboratories tested rifabutin at the critical concentration of 0.5 µg/ml by AP; 100% reported resistance.
Streptomycin Seventy-six results for STR were reported for Isolate B. This isolate was reported resistant to STR at the critical concentration by method, as follows • 100% (27/27) of the results when using AP; and • 100% (49/49) of the results when using MGIT.
Kanamycin Isolate B was also resistant to kanamycin (KAN) by the AP method. Mutations in the 16S rRNA gene (rrs) have been associated with resistance to the second-line injectable drugs, KAN, amikacin (AMK), and capreomycin(CAP)[5]. In addition, low-level KAN resistance, but not AMK resistance, is associated with mutations in the promoter region of the eis gene which results in the overexpression of the encoded aminoglycoside acetyltransferase[6, 7]. DNA sequence analysis of the rrs and eis of Isolate B revealed no mutations in rrs but a G-10A mutation in eis.
Twenty-one laboratories tested KAN at the critical concentrations by AP (5.0 µg/ml for 7H10 and 6.0 µg/ml for 7H11); 57% (12/21) reported resistance.
Only one laboratory reported results for molecular testing of KAN for Isolate B, but a mutation was not detected.
Complete first-line and second-line DST results submitted by all participants for Isolate B are listed in Tables 4 and 5.
CDC MPEP MTBC DST Report for May 2013 Survey 13
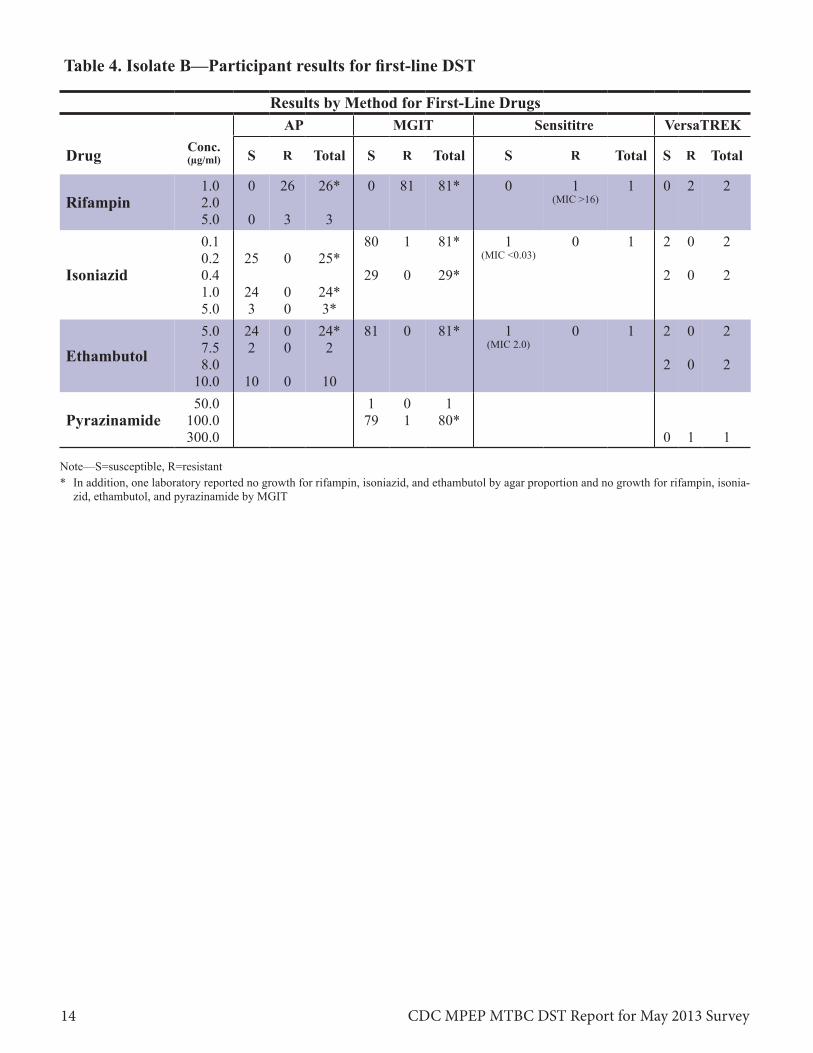
Table 4. Isolate B—Participant results for first-line DST
Results by Method for First-Line Drugs
Drug Conc. (µg/ml)
AP MGIT Sensititre VersaTREK
S R Total S R Total S R Total S R Total
Rifampin 1.0 2.0 5.0
0
0
26
3
26*
3
0 81 81* 0 1 (MIC >16)
1 0 2 2
Isoniazid
0.1 0.2 0.4 1.0 5.0
25
24 3
0
0 0
25*
24* 3*
80
29
1
0
81*
29*
1 (MIC <0.03)
0 1 2
2
0
0
2
2
Ethambutol 5.0 7.5 8.0
10.0
24 2
10
0 0
0
24* 2
10
81 0 81* 1 (MIC 2.0)
0 1 2
2
0
0
2
2
Pyrazinamide 50.0
100.0 300.0
1 79
0 1
1 80*
0 1 1
Note—S=susceptible, R=resistant * In addition, one laboratory reported no growth for rifampin, isoniazid, and ethambutol by agar proportion and no growth for rifampin, isonia
zid, ethambutol, and pyrazinamide by MGIT
CDC MPEP MTBC DST Report for May 2013 Survey 14
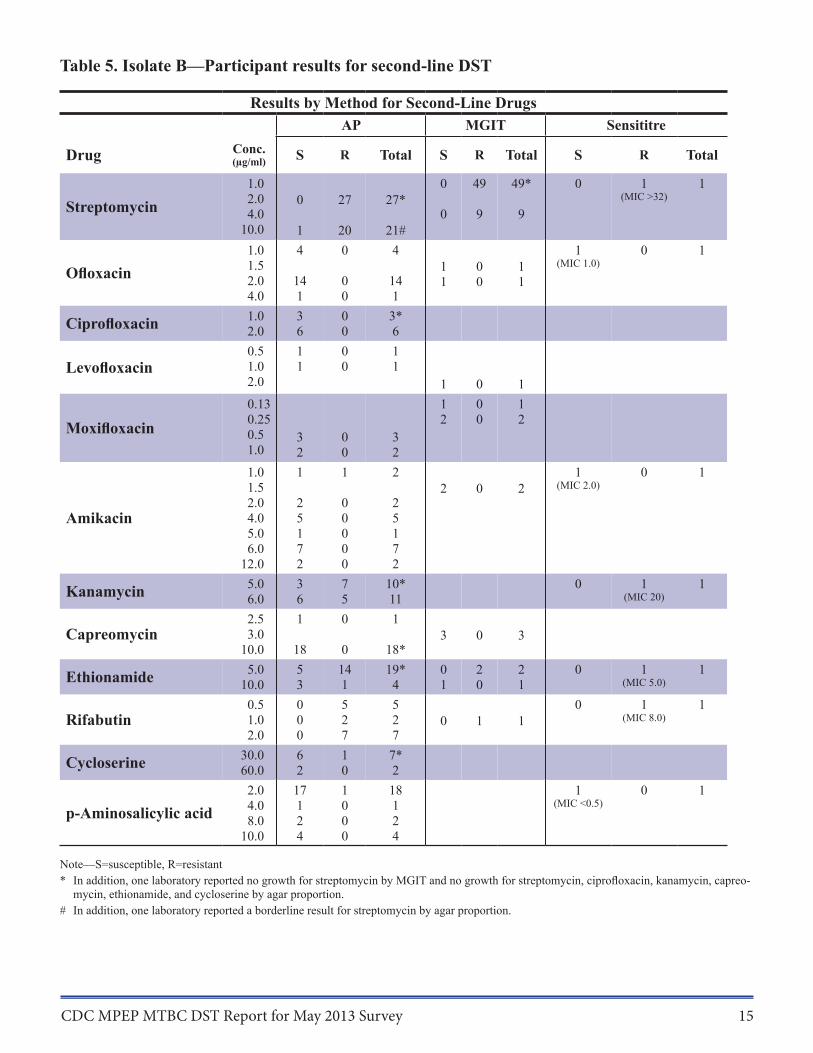
Table 5. Isolate B—Participant results for second-line DST
Results by Method for Second-Line Drugs
Drug Conc. (µg/ml)
AP MGIT Sensititre
S R Total S R Total S R Total
Streptomycin 1.0 2.0 4.0
10.0
0
1
27
20
27*
21#
0
0
49
9
49*
9
0 1 (MIC >32)
1
Ofloxacin 1.0 1.5 2.0 4.0
4
14 1
0
0 0
4
14 1
1 1
0 0
1 1
1 (MIC 1.0)
0 1
Ciprofloxacin 1.0 2.0
3 6
0 0
3* 6
Levofloxacin 0.5 1.0 2.0
1 1
0 0
1 1
1 0 1
Moxifloxacin 0.13 0.25 0.5 1.0
3 2
0 0
3 2
1 2
0 0
1 2
Amikacin
1.0 1.5 2.0 4.0 5.0 6.0
12.0
1
2 5 1 7 2
1
0 0 0 0 0
2
2 5 1 7 2
2 0 2 1
(MIC 2.0) 0 1
Kanamycin 5.0 6.0
3 6
7 5
10* 11
0 1 (MIC 20)
1
Capreomycin 2.5 3.0
10.0
1
18
0
0
1
18* 3 0 3
Ethionamide 5.0 10.0
5 3
14 1
19* 4
0 1
2 0
2 1
0 1 (MIC 5.0)
1
Rifabutin 0.5 1.0 2.0
0 0 0
5 2 7
5 2 7
0 1 1 0 1
(MIC 8.0) 1
Cycloserine 30.0 60.0
6 2
1 0
7* 2
p-Aminosalicylic acid 2.0 4.0 8.0
10.0
17 1 2 4
1 0 0 0
18 1 2 4
1 (MIC <0.5)
0 1
Note—S=susceptible, R=resistant * In addition, one laboratory reported no growth for streptomycin by MGIT and no growth for streptomycin, ciprofloxacin, kanamycin, capreo
mycin, ethionamide, and cycloserine by agar proportion.
# In addition, one laboratory reported a borderline result for streptomycin by agar proportion.
CDC MPEP MTBC DST Report for May 2013 Survey 15
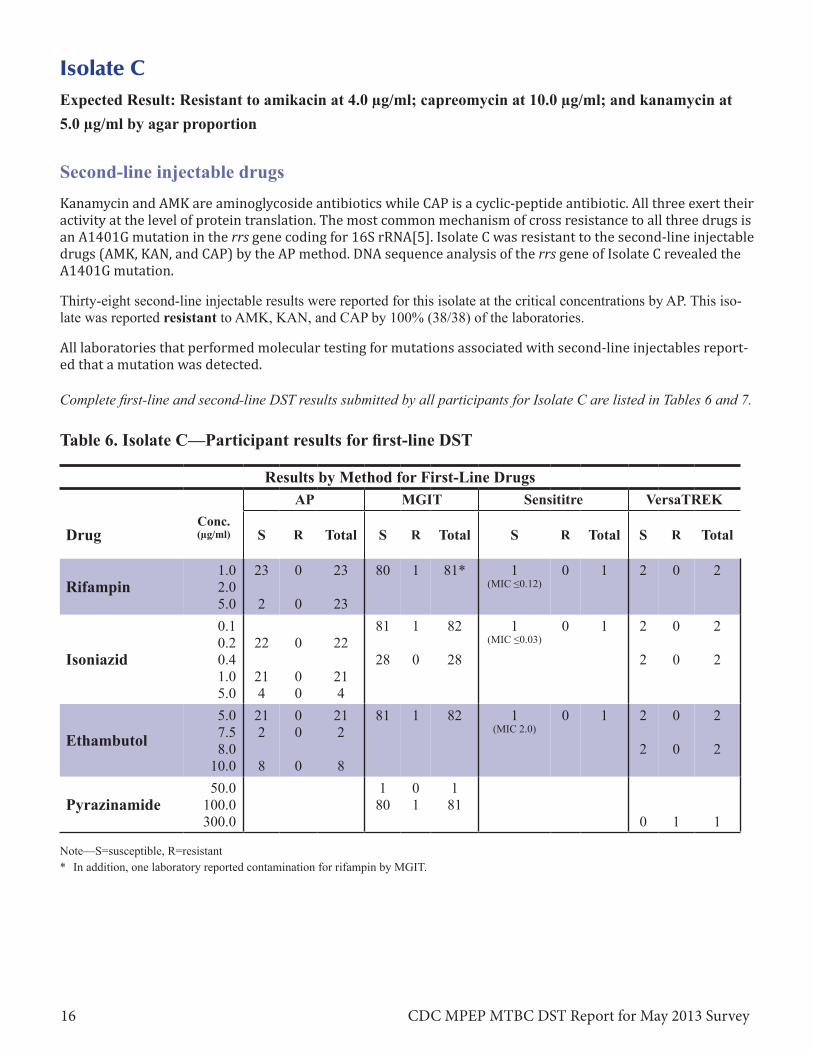
Isolate C Expected Result: Resistant to amikacin at 4.0 µg/ml; capreomycin at 10.0 µg/ml; and kanamycin at 5.0 µg/ml by agar proportion
Second-line injectable drugs Kanamycin and AMK are aminoglycoside antibiotics while CAP is a cyclic-peptide antibiotic. All three exert their activity at the level of protein translation. The most common mechanism of cross resistance to all three drugs is an A1401G mutation in the rrs gene coding for 16S rRNA[5]. Isolate C was resistant to the second-line injectable drugs (AMK, KAN, and CAP) by the AP method. DNA sequence analysis of the rrs gene of Isolate C revealed the A1401G mutation.
Thirty-eight second-line injectable results were reported for this isolate at the critical concentrations by AP. This isolate was reported resistant to AMK, KAN, and CAP by 100% (38/38) of the laboratories.
All laboratories that performed molecular testing for mutations associated with second-line injectables report-ed that a mutation was detected.
Complete first-line and second-line DST results submitted by all participants for Isolate C are listed in Tables 6 and 7.
Table 6. Isolate C—Participant results for first-line DST
Results by Method for First-Line Drugs
Drug Conc. (µg/ml)
AP MGIT Sensititre VersaTREK
S R Total S R Total S R Total S R Total
Rifampin 1.0 2.0 5.0
23
2
0
0
23
23
80 1 81* 1 (MIC ≤0.12)
0 1 2 0 2
Isoniazid
0.1 0.2 0.4 1.0 5.0
22
21 4
0
0 0
22
21 4
81
28
1
0
82
28
1 (MIC ≤0.03)
0 1 2
2
0
0
2
2
Ethambutol 5.0 7.5 8.0
10.0
21 2
8
0 0
0
21 2
8
81 1 82 1 (MIC 2.0)
0 1 2
2
0
0
2
2
Pyrazinamide 50.0
100.0 300.0
1 80
0 1
1 81
0 1 1
Note—S=susceptible, R=resistant * In addition, one laboratory reported contamination for rifampin by MGIT.
CDC MPEP MTBC DST Report for May 2013 Survey 16
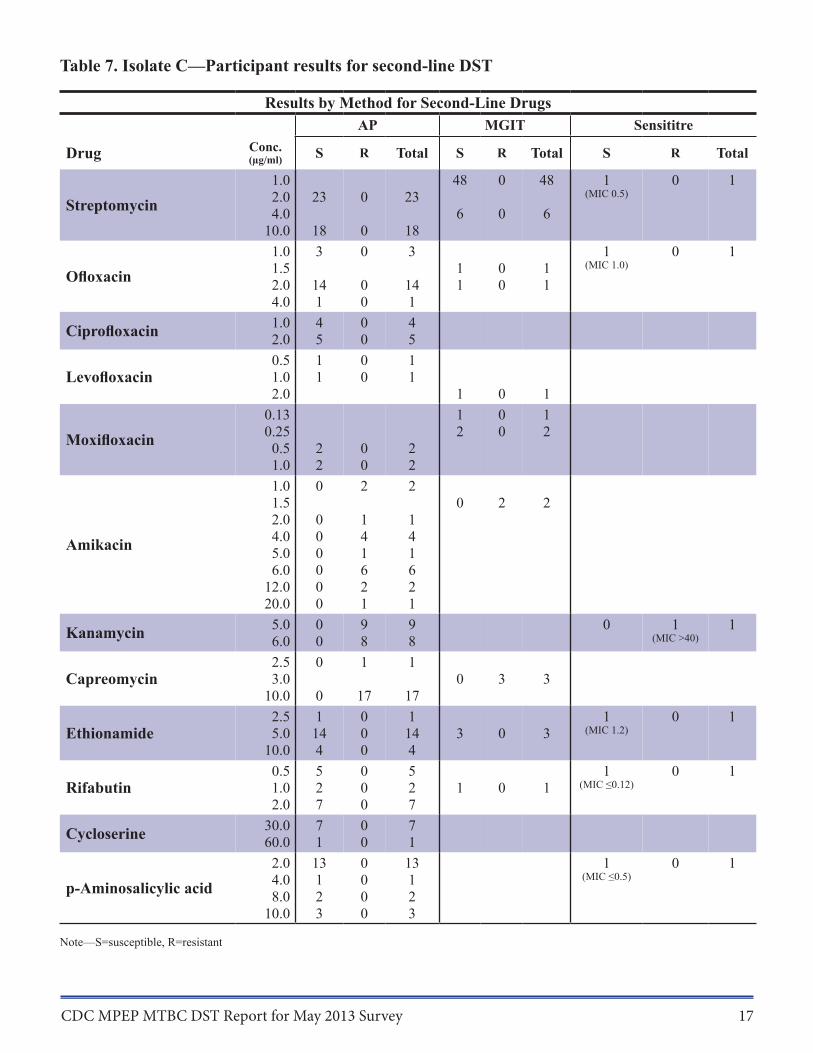
Table 7. Isolate C—Participant results for second-line DST
Results by Method for Second-Line Drugs
Drug Conc. (µg/ml)
AP MGIT Sensititre
S R Total S R Total S R Total
Streptomycin 1.0 2.0 4.0
10.0
23
18
0
0
23
18
48
6
0
0
48
6
1 (MIC 0.5)
0 1
Ofloxacin 1.0 1.5 2.0 4.0
3
14 1
0
0 0
3
14 1
1 1
0 0
1 1
1 (MIC 1.0)
0 1
Ciprofloxacin 1.0 2.0
4 5
0 0
4 5
Levofloxacin 0.5 1.0 2.0
1 1
0 0
1 1
1 0 1
Moxifloxacin 0.13 0.25 0.5 1.0
2 2
0 0
2 2
1 2
0 0
1 2
Amikacin
1.0 1.5 2.0 4.0 5.0 6.0
12.0 20.0
0
0 0 0 0 0 0
2
1 4 1 6 2 1
2
1 4 1 6 2 1
0 2 2
Kanamycin 5.0 6.0
0 0
9 8
9 8
0 1 (MIC >40)
1
Capreomycin 2.5 3.0
10.0
0
0
1
17
1
17 0 3 3
Ethionamide 2.5 5.0
10.0
1 14 4
0 0 0
1 14 4
3 0 3 1
(MIC 1.2) 0 1
Rifabutin 0.5 1.0 2.0
5 2 7
0 0 0
5 2 7
1 0 1 1
(MIC ≤0.12) 0 1
Cycloserine 30.0 60.0
7 1
0 0
7 1
p-Aminosalicylic acid 2.0 4.0 8.0
10.0
13 1 2 3
0 0 0 0
13 1 2 3
1 (MIC ≤0.5)
0 1
Note—S=susceptible, R=resistant
CDC MPEP MTBC DST Report for May 2013 Survey 17
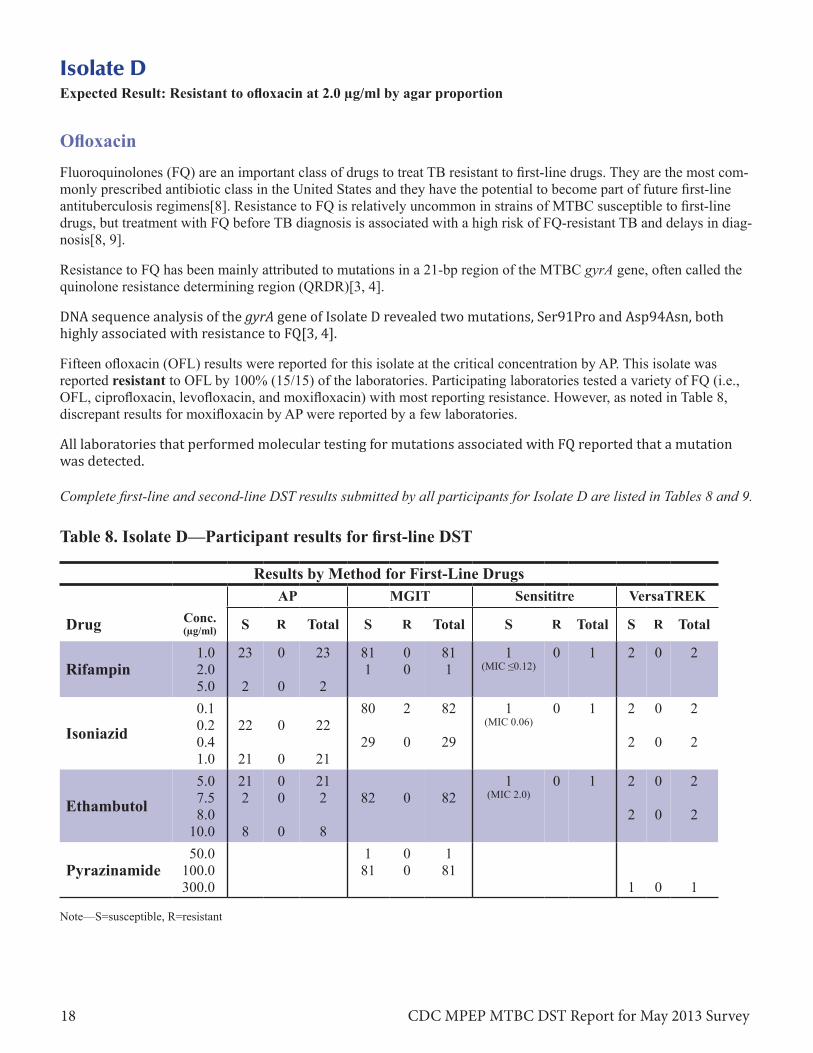
Isolate D Expected Result: Resistant to ofloxacin at 2.0 µg/ml by agar proportion
Ofloxacin Fluoroquinolones (FQ) are an important class of drugs to treat TB resistant to first-line drugs. They are the most commonly prescribed antibiotic class in the United States and they have the potential to become part of future first-line antituberculosis regimens[8]. Resistance to FQ is relatively uncommon in strains of MTBC susceptible to first-line drugs, but treatment with FQ before TB diagnosis is associated with a high risk of FQ-resistant TB and delays in diagnosis[8, 9].
Resistance to FQ has been mainly attributed to mutations in a 21-bp region of the MTBC gyrA gene, often called the quinolone resistance determining region (QRDR)[3, 4].
DNA sequence analysis of the gyrA gene of Isolate D revealed two mutations, Ser91Pro and Asp94Asn, both highly associated with resistance to FQ[3, 4].
Fifteen ofloxacin (OFL) results were reported for this isolate at the critical concentration by AP. This isolate was reported resistant to OFL by 100% (15/15) of the laboratories. Participating laboratories tested a variety of FQ (i.e., OFL, ciprofloxacin, levofloxacin, and moxifloxacin) with most reporting resistance. However, as noted in Table 8, discrepant results for moxifloxacin by AP were reported by a few laboratories.
All laboratories that performed molecular testing for mutations associated with FQ reported that a mutation was detected.
Complete first-line and second-line DST results submitted by all participants for Isolate D are listed in Tables 8 and 9.
Table 8. Isolate D—Participant results for first-line DST
Results by Method for First-Line Drugs
Drug Conc. (µg/ml)
AP MGIT Sensititre VersaTREK
S R Total S R Total S R Total S R Total
Rifampin 1.0 2.0 5.0
23
2
0
0
23
2
81 1
0 0
81 1
1 (MIC ≤0.12)
0 1 2 0 2
Isoniazid 0.1 0.2 0.4 1.0
22
21
0
0
22
21
80
29
2
0
82
29
1 (MIC 0.06)
0 1 2
2
0
0
2
2
Ethambutol 5.0 7.5 8.0
10.0
21 2
8
0 0
0
21 2
8
82 0 82 1
(MIC 2.0) 0 1 2
2
0
0
2
2
Pyrazinamide 50.0
100.0 300.0
1 81
0 0
1 81
1 0 1
Note—S=susceptible, R=resistant
CDC MPEP MTBC DST Report for May 2013 Survey 18
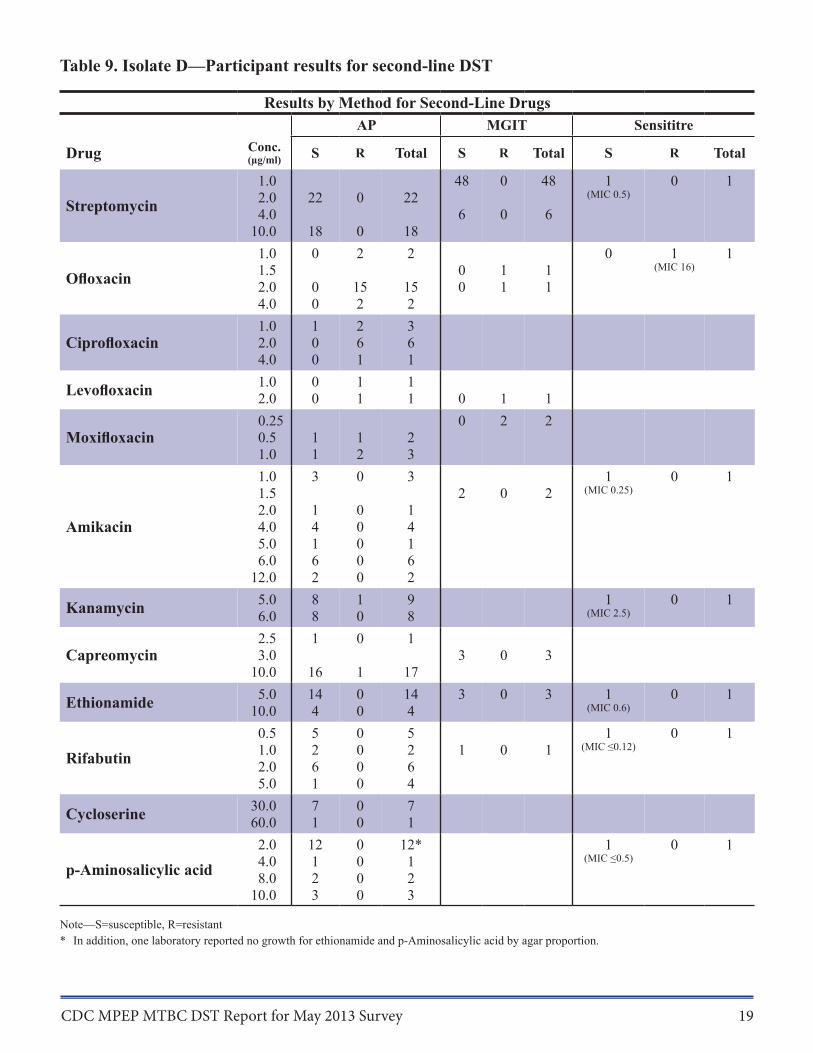
Table 9. Isolate D—Participant results for second-line DST
Results by Method for Second-Line Drugs
Drug Conc. (µg/ml)
1.0
AP MGIT Sensititre
S R Total S R Total
48 0 48
S R Total
1 0 1
Streptomycin 2.0 4.0
22 0 22 6 0 6
(MIC 0.5)
10.0 18 0 18 1.0 0 2 2 0 1 1
Ofloxacin 1.5 2.0 0 15 15
0 0
1 1
1 1
(MIC 16)
4.0 0 2 2 1.0 1 2 3
Ciprofloxacin 2.0 0 6 6 4.0 0 1 1
Levofloxacin 1.0 2.0 0.25
0 0
1 1
1 1 0 1 1
0 2 2 Moxifloxacin 0.5 1 1 2
1.0 1 2 3 1.0 1.5
3 0 3 2 0 2
1 (MIC 0.25)
0 1
2.0 1 0 1 Amikacin 4.0 4 0 4
5.0 1 0 1 6.0 6 0 6
12.0 2 0 2
Kanamycin 5.0 6.0
8 8
1 0
9 8
1 (MIC 2.5)
0 1
Capreomycin 2.5 3.0
1 0 1 3 0 3
10.0 16 1 17
Ethionamide 5.0 10.0
14 4
0 0
14 4
3 0 3 1 (MIC 0.6)
0 1
0.5 5 0 5 1 0 1
Rifabutin 1.0 2.0
2 6
0 0
2 6
1 0 1 (MIC ≤0.12)
5.0 1 0 4
Cycloserine 30.0 60.0
7 1
0 0
7 1
2.0 12 0 12* 1 0 1
p-Aminosalicylic acid 4.0 8.0
1 2
0 0
1 2
(MIC ≤0.5)
10.0 3 0 3
Note—S=susceptible, R=resistant * In addition, one laboratory reported no growth for ethionamide and p-Aminosalicylic acid by agar proportion.
CDC MPEP MTBC DST Report for May 2013 Survey 19
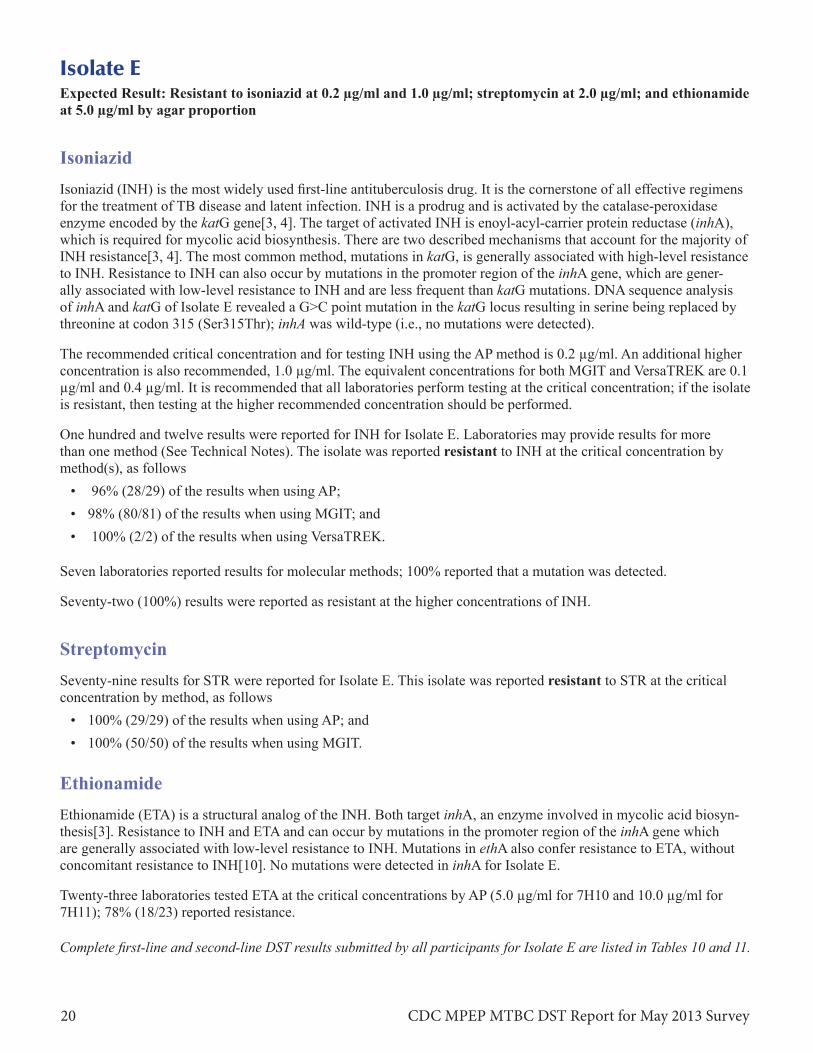
Isolate E Expected Result: Resistant to isoniazid at 0.2 µg/ml and 1.0 µg/ml; streptomycin at 2.0 µg/ml; and ethionamide at 5.0 µg/ml by agar proportion
Isoniazid Isoniazid (INH) is the most widely used first-line antituberculosis drug. It is the cornerstone of all effective regimens for the treatment of TB disease and latent infection. INH is a prodrug and is activated by the catalase-peroxidase enzyme encoded by the katG gene[3, 4]. The target of activated INH is enoyl-acyl-carrier protein reductase (inhA), which is required for mycolic acid biosynthesis. There are two described mechanisms that account for the majority of INH resistance[3, 4]. The most common method, mutations in katG, is generally associated with high-level resistance to INH. Resistance to INH can also occur by mutations in the promoter region of the inhA gene, which are generally associated with low-level resistance to INH and are less frequent than katG mutations. DNA sequence analysis of inhA and katG of Isolate E revealed a G>C point mutation in the katG locus resulting in serine being replaced by threonine at codon 315 (Ser315Thr); inhA was wild-type (i.e., no mutations were detected).
The recommended critical concentration and for testing INH using the AP method is 0.2 µg/ml. An additional higher concentration is also recommended, 1.0 µg/ml. The equivalent concentrations for both MGIT and VersaTREK are 0.1 µg/ml and 0.4 µg/ml. It is recommended that all laboratories perform testing at the critical concentration; if the isolate is resistant, then testing at the higher recommended concentration should be performed.
One hundred and twelve results were reported for INH for Isolate E. Laboratories may provide results for more than one method (See Technical Notes). The isolate was reported resistant to INH at the critical concentration by method(s), as follows • 96% (28/29) of the results when using AP; • 98% (80/81) of the results when using MGIT; and • 100% (2/2) of the results when using VersaTREK.
Seven laboratories reported results for molecular methods; 100% reported that a mutation was detected.
Seventy-two (100%) results were reported as resistant at the higher concentrations of INH.
Streptomycin Seventy-nine results for STR were reported for Isolate E. This isolate was reported resistant to STR at the critical concentration by method, as follows • 100% (29/29) of the results when using AP; and • 100% (50/50) of the results when using MGIT.
Ethionamide Ethionamide (ETA) is a structural analog of the INH. Both target inhA, an enzyme involved in mycolic acid biosynthesis[3]. Resistance to INH and ETA and can occur by mutations in the promoter region of the inhA gene which are generally associated with low-level resistance to INH. Mutations in ethA also confer resistance to ETA, without concomitant resistance to INH[10]. No mutations were detected in inhA for Isolate E.
Twenty-three laboratories tested ETA at the critical concentrations by AP (5.0 µg/ml for 7H10 and 10.0 µg/ml for 7H11); 78% (18/23) reported resistance.
Complete first-line and second-line DST results submitted by all participants for Isolate E are listed in Tables 10 and 11.
CDC MPEP MTBC DST Report for May 2013 Survey 20

Table 10. Isolate E—Participant results for first-line DST
Results by Method for First-Line Drugs
Drug Conc. (µg/ml)
AP MGIT Sensititre VersaTREK
S R Total S R Total S R Total S R Total
Rifampin 1.0 2.0 5.0
30
3
0
0
30
3
81 0 81 1 (MIC ≤0.12)
0 1 2 0 2
Isoniazid
0.1 0.2 0.4 1.0 5.0
1
0 1
28
29 3
29
29 4
1
0
80
41
81
41
0 1 (MIC 4.0)
1 0
0
2
2
2
2
Ethambutol 5.0 7.5 8.0
10.0
28 2
10
0 0
0
28 2
10
81 0 81 1 (MIC 2.0)
0 1 2
2
0
0
2
2
Pyrazinamide 50.0
100.0 300.0
1 78
0 3
1 81
1 0 1
Note—S=susceptible, R=resistant
CDC MPEP MTBC DST Report for May 2013 Survey 21
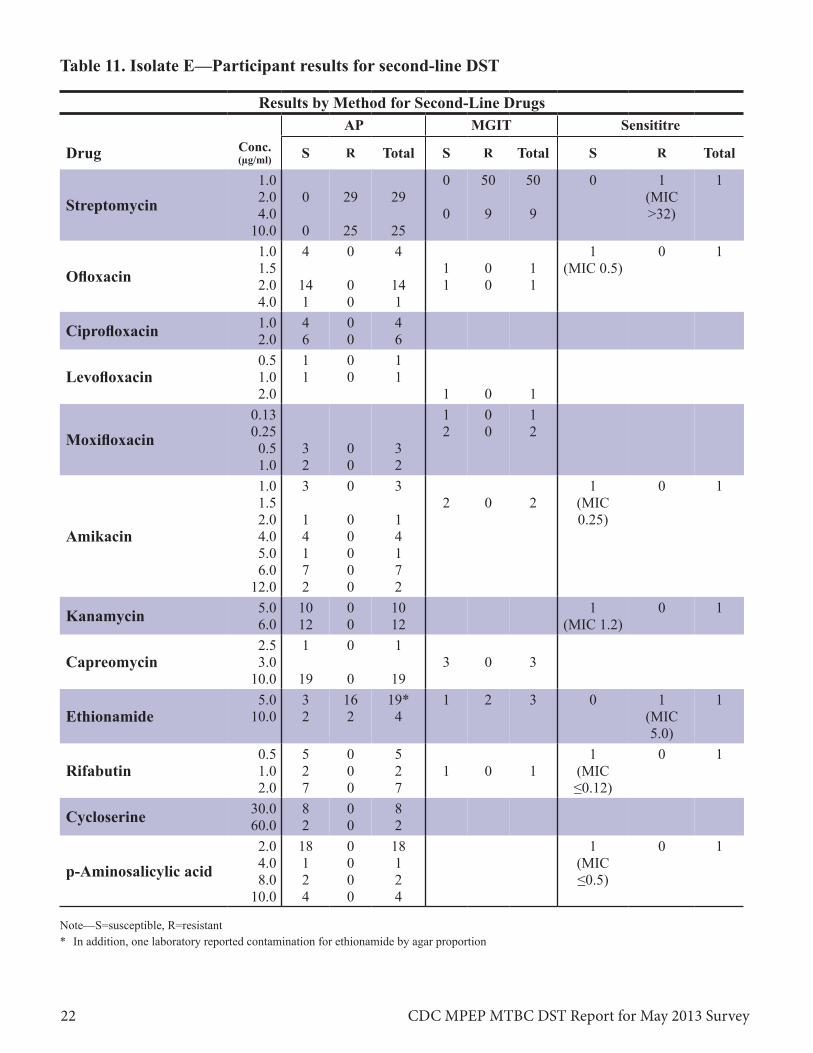
Table 11. Isolate E—Participant results for second-line DST
Results by Method for Second-Line Drugs
Drug Conc. (µg/ml)
1.0
AP MGIT Sensititre
S R Total S R Total
0 50 50
S R Total
0 1 1
Streptomycin 2.0 4.0
0 29 29 0 9 9
(MIC >32)
10.0 0 25 25 1.0 4 0 4 1 0 1
Ofloxacin 1.5 2.0 14 0 14
1 1
0 0
1 1
(MIC 0.5)
4.0 1 0 1
Ciprofloxacin 1.0 2.0
4 6
0 0
4 6
0.5 1 0 1 Levofloxacin 1.0
2.0 0.13
1 0 1 1 0 1 1 0 1
Moxifloxacin 0.25 0.5 3 0 3
2 0 2
1.0 2 0 2 1.0 1.5
3 0 3 2 0 2
1 (MIC
0 1
2.0 1 0 1 0.25) Amikacin 4.0 4 0 4
5.0 1 0 1 6.0 7 0 7
12.0 2 0 2
Kanamycin 5.0 6.0
10 12
0 0
10 12
1 (MIC 1.2)
0 1
Capreomycin 2.5 3.0
1 0 1 3 0 3
10.0 19 0 19 5.0 3 16 19* 1 2 3 0 1 1
Ethionamide 10.0 2 2 4 (MIC 5.0)
0.5 5 0 5 1 0 1 Rifabutin 1.0 2 0 2 1 0 1 (MIC
2.0 7 0 7 ≤0.12)
Cycloserine 30.0 60.0
8 2
0 0
8 2
2.0 18 0 18 1 0 1
p-Aminosalicylic acid 4.0 8.0
1 2
0 0
1 2
(MIC ≤0.5)
10.0 4 0 4
Note—S=susceptible, R=resistant * In addition, one laboratory reported contamination for ethionamide by agar proportion
CDC MPEP MTBC DST Report for May 2013 Survey 22
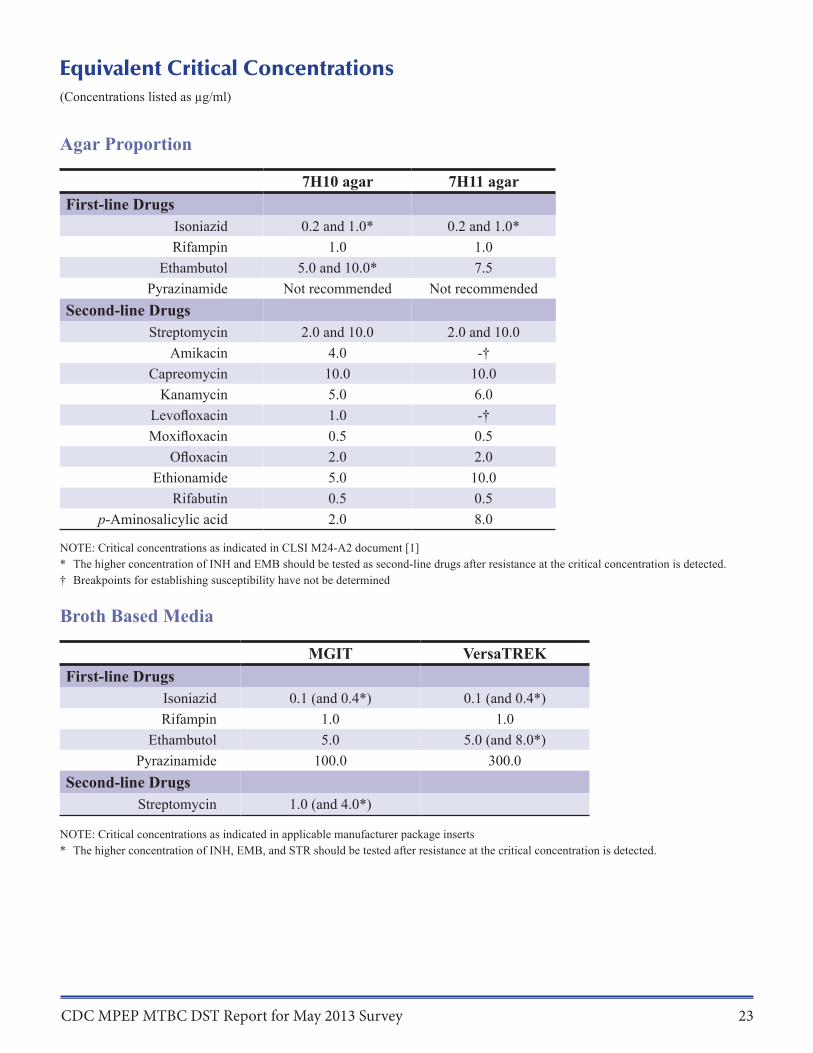
Equivalent Critical Concentrations (Concentrations listed as µg/ml)
Agar Proportion
7H10 agar 7H11 agar First-line Drugs
Isoniazid 0.2 and 1.0* 0.2 and 1.0* Rifampin 1.0 1.0
Ethambutol 5.0 and 10.0* 7.5 Pyrazinamide Not recommended Not recommended
Second-line Drugs Streptomycin 2.0 and 10.0 2.0 and 10.0
Amikacin 4.0 -† Capreomycin 10.0 10.0
Kanamycin 5.0 6.0 Levofloxacin 1.0 -† Moxifloxacin 0.5 0.5
Ofloxacin 2.0 2.0 Ethionamide 5.0 10.0
Rifabutin 0.5 0.5 p-Aminosalicylic acid 2.0 8.0
NOTE: Critical concentrations as indicated in CLSI M24-A2 document [1] * The higher concentration of INH and EMB should be tested as second-line drugs after resistance at the critical concentration is detected. † Breakpoints for establishing susceptibility have not be determined
Broth Based Media
MGIT VersaTREK First-line Drugs
Isoniazid 0.1 (and 0.4*) 0.1 (and 0.4*) Rifampin 1.0 1.0
Ethambutol 5.0 5.0 (and 8.0*) Pyrazinamide 100.0 300.0
Second-line Drugs Streptomycin 1.0 (and 4.0*)
NOTE: Critical concentrations as indicated in applicable manufacturer package inserts * The higher concentration of INH, EMB, and STR should be tested after resistance at the critical concentration is detected.
CDC MPEP MTBC DST Report for May 2013 Survey 23

References 1. CLSI, Susceptibility Testing of Mycobacteria, Nocardiae, and Other Aerobic Actinomycetes; Approved Standard - Second Edition in CLSI Document M24 A-2. 2011, Clinical and Laboratory Standards Institute: Wayne, PA.
2. APHL, TB Drug Susceptibility Testing Expert Panel Meeting Summary Report. 2007, Association of Public Health Laboratories: Washington, D.C.
3. Almeida Da Silva, P.E. and J.C. Palomino, Molecular basis and mechanisms of drug resistance in Mycobacte-rium tuberculosis: classical and new drugs. J Antimicrob Chemother, 2011. 66(7): p. 1417-30.
4. Zhang, Y. and W.W. Yew, Mechanisms of drug resistance in Mycobacterium tuberculosis. Int J Tuberc Lung Dis, 2009. 13(11): p. 1320-30.
5. Maus, C.E., B.B. Plikaytis, and T.M. Shinnick, Molecular analysis of cross-resistance to capreomycin, kana-mycin, amikacin, and viomycin in Mycobacterium tuberculosis. Antimicrob Agents Chemother, 2005. 49(8): p. 3192-7.
6. Zaunbrecher, M.A., et al., Overexpression of the chromosomally encoded aminoglycoside acetyltransferase eis confers kanamycin resistance in Mycobacterium tuberculosis. Proc Natl Acad Sci U S A, 2009. 106(47): p. 20004-9.
7. Campbell, P.J., et al., Molecular detection of mutations associated with first- and second-line drug resistance compared with conventional drug susceptibility testing of Mycobacterium tuberculosis. Antimicrob Agents Chemother, 2011. 55(5): p. 2032-41.
8. Devasia, R.A., et al., Fluoroquinolone resistance in Mycobacterium tuberculosis: the effect of duration and tim-ing of fluoroquinolone exposure. Am J Respir Crit Care Med, 2009. 180(4): p. 365-70.
9. Chen, T.C., et al., Fluoroquinolones are associated with delayed treatment and resistance in tuberculosis: a sys-tematic review and meta-analysis. Int J Infect Dis, 2011. 15(3): p. e211-6.
10. Morlock, G.P., et al., ethA, inhA, and katG loci of ethionamide-resistant clinical Mycobacterium tuberculosis isolates. Antimicrob Agents Chemother, 2003. 47(12): p. 3799-805.
CDC MPEP MTBC DST Report for May 2013 Survey 24