my story
DESCRIPTION
Universal Health Care: A Business Case for Single Payer National Health Insurance April 12, 2008 Robert Zarr, MD, MPH, FAAP [email protected]. MY STORY. Sept 22, 2007,at 1pm, I was assaulted Loss of consciousness Ambulance ride & ER visit - PowerPoint PPT PresentationTRANSCRIPT

Universal Health Care: A Business Case for Single Payer
National Health Insurance
April 12, 2008Robert Zarr, MD, MPH, FAAP
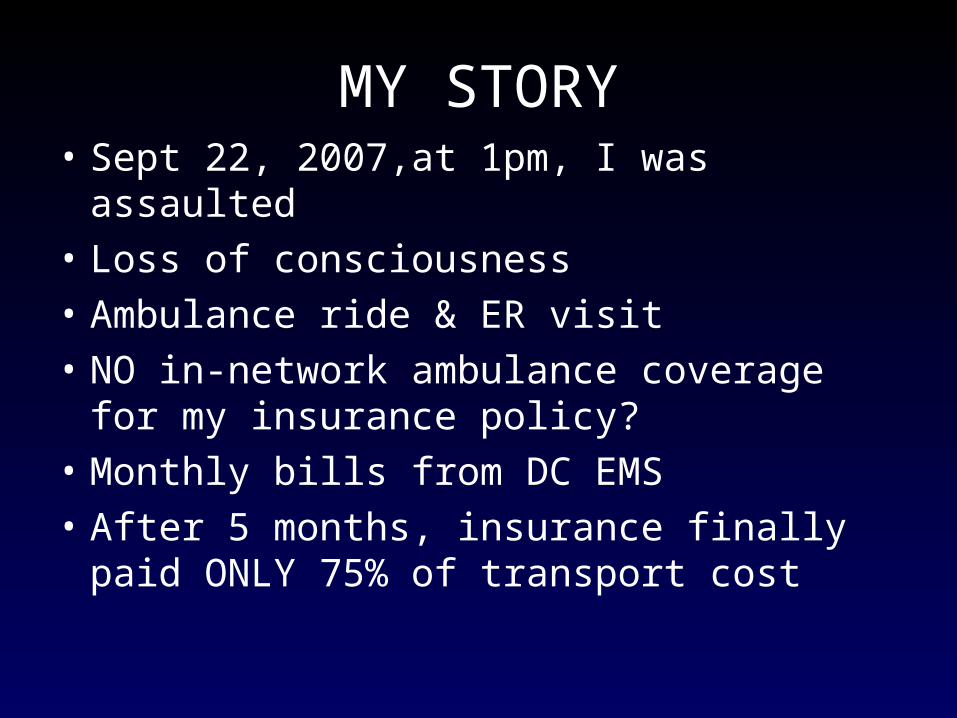
MY STORY• Sept 22, 2007,at 1pm, I was assaulted
• Loss of consciousness
• Ambulance ride & ER visit
• NO in-network ambulance coverage for my insurance policy?
• Monthly bills from DC EMS
• After 5 months, insurance finally paid ONLY 75% of transport cost

Best health care system in the world?


We are one of the Youngest Populations in the Industrialized
World
12.8
16.0 16.3
18.6 19.0
12.4
0
5
10
15
20
U.S. Canada U.K. France Germany Japan
OECD, 2006 (2003 Data)

Fewer Americans Smoke Compared with Other Nations
17.0
24.2 24.326.0
30.0
17.5
0
5
10
15
20
25
30
35
Canada U.S. Italy Germany U.K. Japan
% p
op
ula
tio
n s
mo
kin
g d
aily
OECD, 2006 (2003 Data)

We Drink Less Alcohol
7.4
10.211.2
14.0
8.47.6
0
2
4
6
8
10
12
14
16
Japan Canada U.S. Germany U.K. France
Lit
ers/
cap
ita
(15+
)
OECD, 2006 (2003 Data)

Australia Canada England N.Z. U.S.
Breast Cancer 2nd 4th worst 3rd bestColorectal Cancer 2nd 3rd worst best 4thCervical Cancer best 3rd worst 4th 2ndChildhood Leukemia worst best 3rd 4th 2ndKidney Transplant 2nd best 3rd 3rd worstLiver Transplant 2nd best worst * 3rdNon-Hodgkin’s Lymphoma
best 4th worst 2nd 3rd
AMI, ages 20-84 best worst NA 2nd NAStroke, ages 20-84 2nd best NA worst NA
Source: Health Affairs Vol 23:#3 , 2004
Our Quality is Not the Best in the world Survival Rates for 5 Countries

Continuity of Care
52%57%
65% 65%
45%
0%
20%
40%
60%
80%
100%
U.S. NewZealand
Canada Australia U.K.
% w
ith
sam
e d
oct
or
> 5
yea
rs
Commonwealth Fund Survey, 1998

How hard is it to get care?
21
15 15 15
28
0
5
10
15
20
25
30
U.S. Canada New Zealand Australia U.K.
% f
ind
ing
it
dif
ficu
lt t
o g
et c
are
Commonwealth Fund Survey, 1998
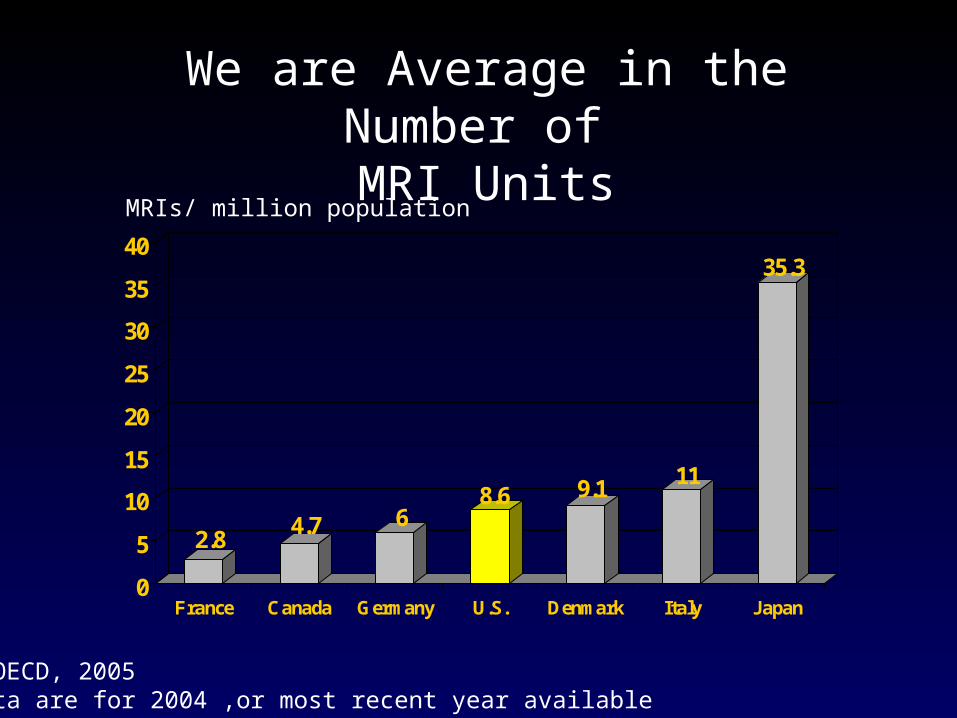
2.84.7 6
8.6 9.1 11
35.3
0
5
10
15
20
25
30
35
40
France Canada Germany U.S. Denmark Italy Japan
Source: OECD, 2005Note: data are for 2004 ,or most recent year available
MRIs/ million population
We are Average in the Number of
MRI Units

Procedures per 100,000 population
Source: OECD 2006Data are for 2004 or most recent year available
106125 126 133
146
182
0
20
40
60
80
100
120
140
160
180
200
Canada U.S. N.Z. Italy Australia U.K. Sweden
197
We Do Fewer Hip Replacements

We are the best at spending the most money to be ranked 37th in health
outcomes by WHO!


Major Concepts
We have no system coordinating access, cost containment or financing of services and care
Most health care costs are fixed Few using it at any one time but all of
us want it be there We are already paying the whole bill
which is more than enough to assure us all coverage for comprehensive care

The Basics Rising health care costs are the root
of most of the problems in health care Most costs are fixed whether health
care is used or not Other countries cover everyone, have
more services, higher quality and live longer yet spend far less than we do
We are already paying the whole bill You can’t hold down costs without a
system!
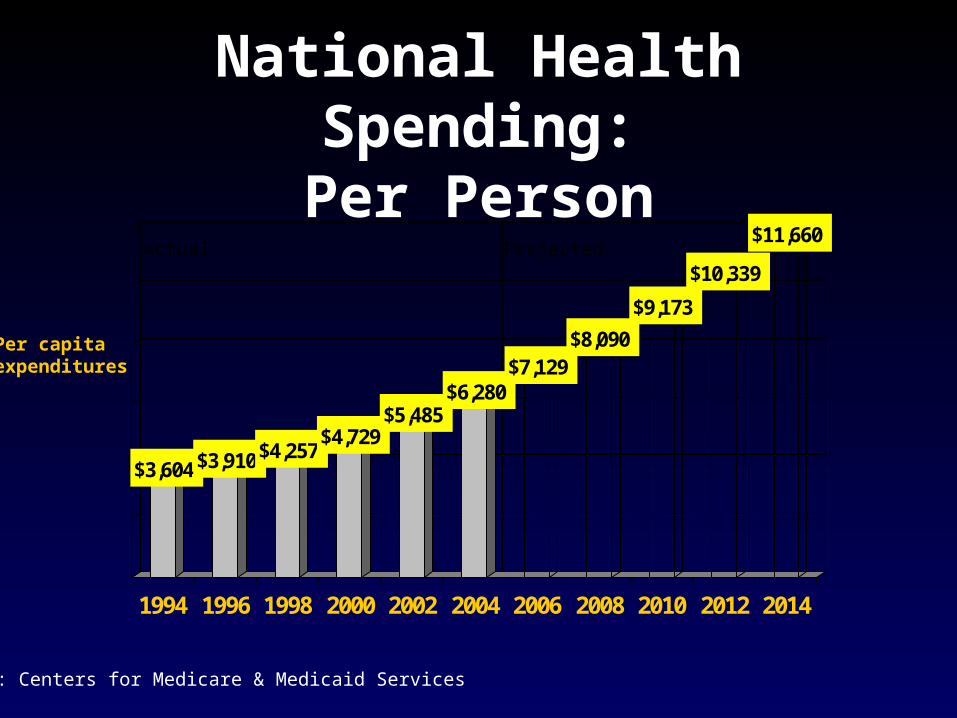
Source: Centers for Medicare & Medicaid Services
ProjectedActual
$3,604 $3,910 $4,257$4,729
$5,485$6,280
$7,129$8,090
$9,173
$10,339
$11,660
1994 1996 1998 2000 2002 2004 2006 2008 2010 2012 2014
Per capitaexpenditures
National Health Spending:Per Person
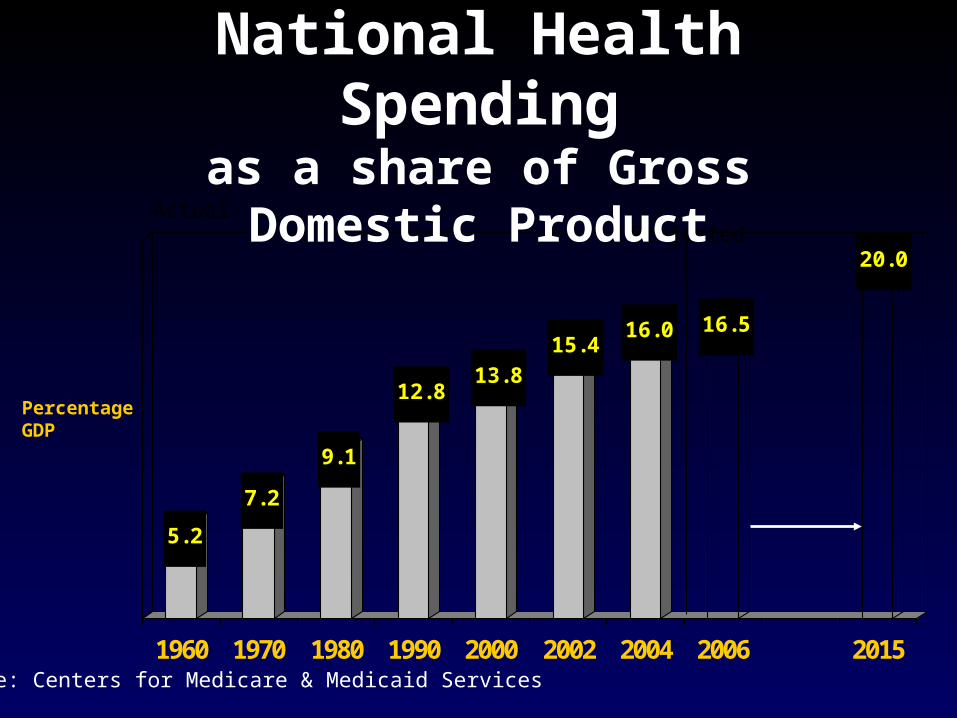
Source: Centers for Medicare & Medicaid Services
ProjectedActual
PercentageGDP
5.2
7.2
9.1
12.813.8
15.416.0 16.5
20.0
1960 1970 1980 1990 2000 2002 2004 2006 2015
National Health Spending
as a share of Gross Domestic Product

Where is the money going?

Physician21%
Dental/O ther Professional
10%
Nursing home/home health
8%
Drugs/Medical Supplies
13%
Insurance Administration
7%
Investment7%
Govt.Health Activities3%
Hospital
$1.9 trillion
Source: Centers for Medicare&Medicaid Services 30%
U.S. Health Expenditures 2004

Physician21%
Dental/O ther Professional
10%
Nursing home/home health
8%
Drugs/Medical Supplies
13%
Insurance Administration
7%
Investment7%
Govt.Health Activities3%
Hospital
Source: Centers for Medicare&Medicaid Services
70% spent on services &infrastructure
30%
U.S. Health Expenditures 2004

As of 2004, the U.S. had:
13.5 million health care jobs
7,228 hospitals with a total of 955,768 staffed beds
210,939 physician’s offices
70,589 nursing homes
19,006 home care agencies
121,172 dentist’s offices
Source: National Center for Health Statistics
Health Care Infrastructure: Enough to serve all Americans

0
10
20
30
40
50
60
70
80
10% 10% 10% 10% 10% 10% 10% 10% 10% 10%
Source:Agency for Healthcare Research and QualityMEPS, 1999
Percentof health CareExpenditures
1% 1% 2% 4% 6%
13%
73%
0% 0% 0%
20% use 86% of the care
Most of the money is spent on a few people in any one year
Important Question:
• Whose responsibility should it be to pay for the health care services we all expect to be there should we need them?


The cost of the infrastructure is there whether or not it is used (nurse, hospital)
Trying to save money by keeping patients out of the hospital is like trying to save money on schools by keeping kids home for the day
It is much more cost effective to invest in only what we need.
The Implications of Fixed costs

How do we PAY
for health care?
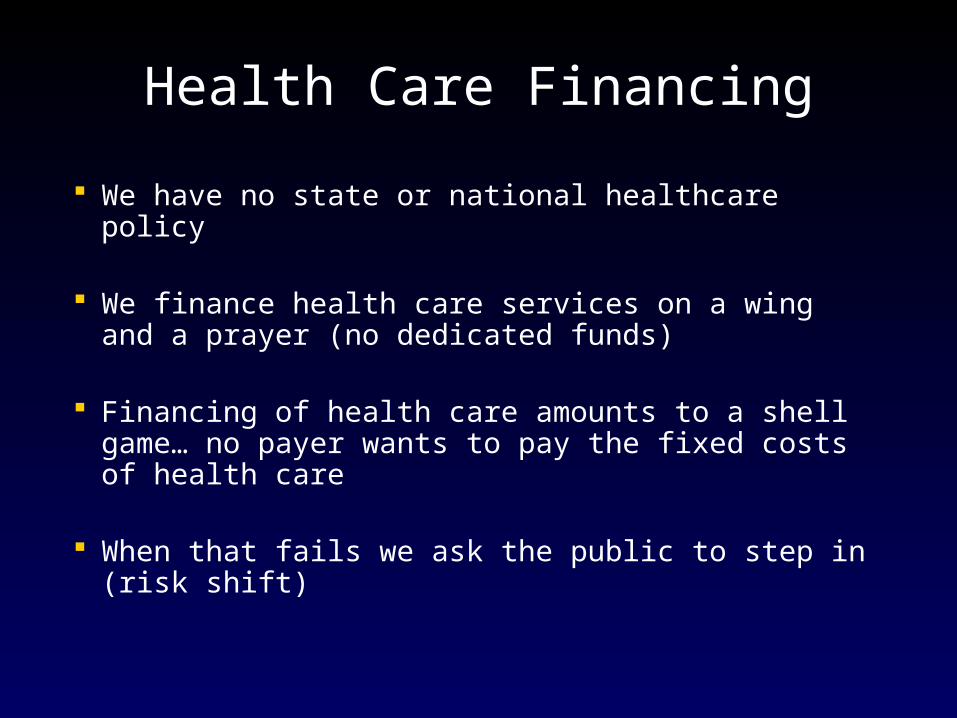
We have no state or national healthcare policy
We finance health care services on a wing and a prayer (no dedicated funds)
Financing of health care amounts to a shell game… no payer wants to pay the fixed costs of health care
When that fails we ask the public to step in (risk shift)
Health Care Financing

0
10
20
30
40
50
60
70
80
10% 10% 10% 10% 10% 10% 10% 10% 10% 10%
Source:Agency for Healthcare Research and QualityMEPS, 1999
Percentof health CareExpenditures
1% 1% 2% 4% 6%
13%
73%
0% 0% 0%
If you were in an insurance company CEO, who would you
want to insure?

0
10
20
30
40
50
60
70
80
10% 10% 10% 10% 10% 10% 10% 10% 10% 10%
Source:Agency for Healthcare Research and QualityMEPS, 1999
Percentof health CareExpenditures
1% 1% 2% 4% 6%
13%
73%
0% 0% 0%
20% use 86% of the care
Most of the money is spent on a few people in any one year

0
10
20
30
40
50
60
70
80
10% 10% 10% 10% 10% 10% 10% 10% 10% 10%
Source:Agency for Healthcare Research and QualityMEPS, 1999
Percentof health CareExpenditures
1% 1% 2% 4% 6%
13%
73%
0% 0% 0%
80% uses less than $1000 of care per year
If you were in an insurance company CEO, who would you
want to insure?

0%
500%
1000%
1500%
2000%
2500%
3000%
1970 1975 1980 1985 1990 1995 2000
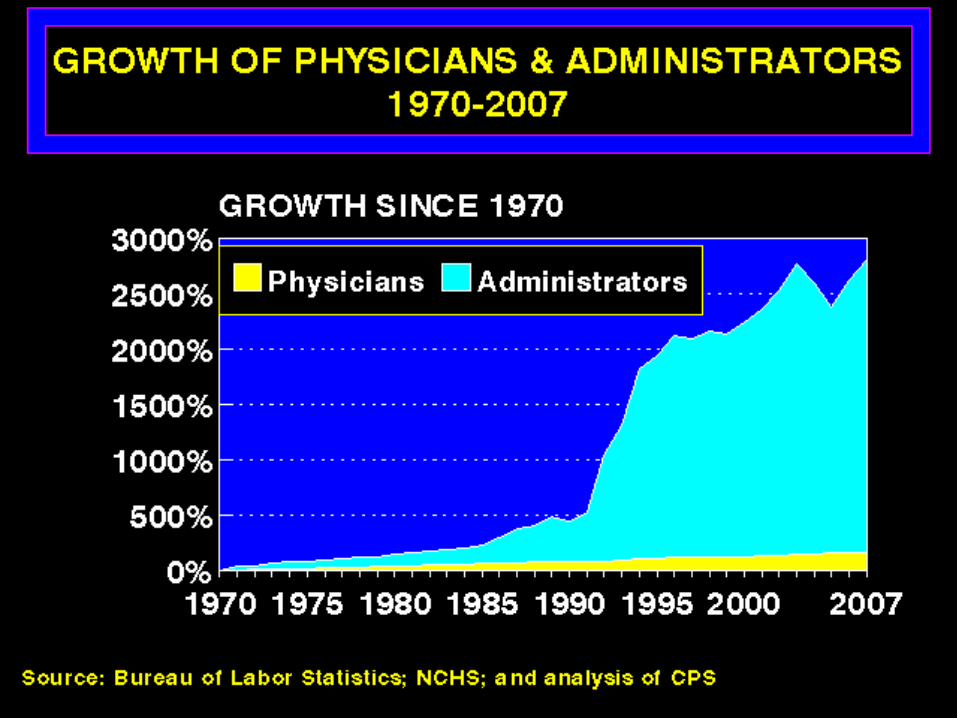
Physicians Administrators
Administration is the Fastest Growing job in Health Care
Source: Bureau of Labor Statistics and NCHS

69%
31%Clinical Care
Administrative Costs
Source: Woolhandler, et al, New England Journal of Medicine, August 2003 & Int. Jrnl. Of Hlth. Services, 2004
($2000 per person)
One-Third of Health Spending is Consumed by
Administration

Health Insurance Costs Keep Rising

Fewer Firms Are Offering Insurance…

THE COST OF CARE CREATES HEALTH PROBLEMS AS WELL AS
FINANCIAL PROBLEMS
In nearly 3 in 10 (29%) households, someone skips a medical treatment, cuts pills, or does not fill a prescription because of cost
Nearly 1 out of 4 (23%) Americans have problems paying medical bills
More than 1 in 5 (21%) Americans had an overdue medical bill at the time of a 2004 survey
1 million people experience medical bankruptcy each year
Health Care Costs Survey, USA Today/Kaiser Family Foundation/Harvard School of Public Health, August 2005; D. Himmelstein et al, Health Affairs, 2005

Source: Care Without Coverage;Institute of Medicine,2002
More than six times the number of soldiers killed in Iraq
Equal to a 747 jet crash every week
More than 6 times the number who died on September 11th
18,314 Die Every Year Due to Lack of Health Insurance

Source: NEJM 1999; 340:109; Health Affairs 2000; 19(3):150
60%20%
20%
Taxpayers
Private employers
Individuals
{Medicare, Medicaid.Public employees,tax subsidies}
Most of Healthcare is already publicly financed
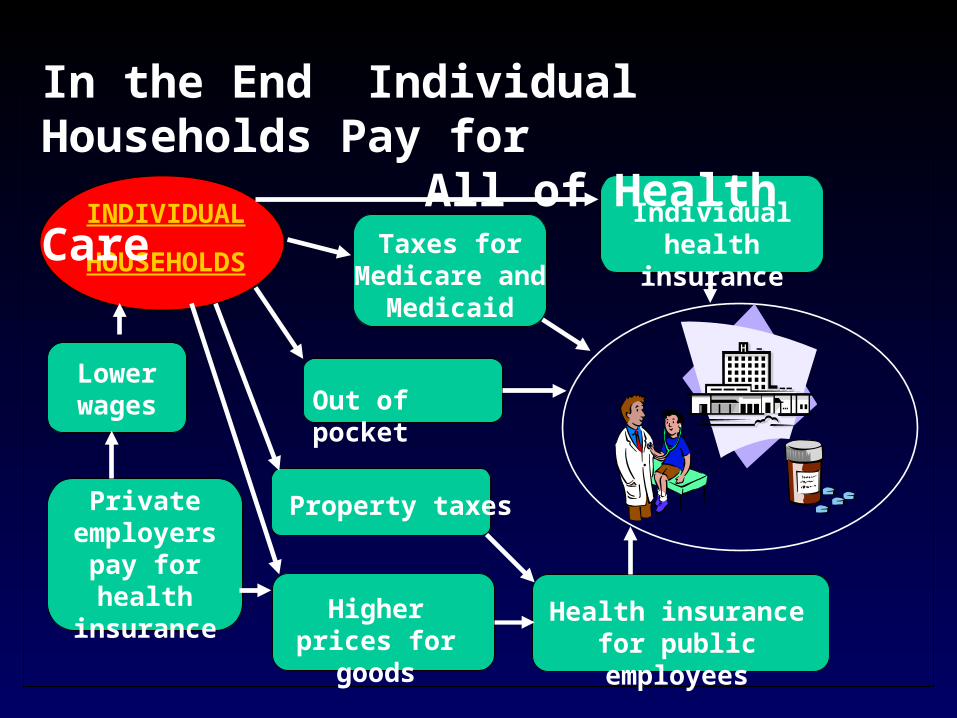
Lower wages
Private employers
pay for health insurance Higher prices
for goods
Out of pocket
Individual health insuranceTaxes for
Medicare and Medicaid
Property taxes
Health insurance for public employees
INDIVIDUAL
HOUSEHOLDS
In the End Individual Households Pay for All of Health Care

US Health Costs Rise Faster than Other Countries’ Costs
Source: Health United States 2005, Natl. Center for Health Statistics
0
2
4
6
8
10
12
14
16
18
1960 1970 1980 1990 1995 2000 2004
Hea
lth
Co
sts
as
Per
cen
t o
f G
NP US
Canada
France
Germany
Japan
UK
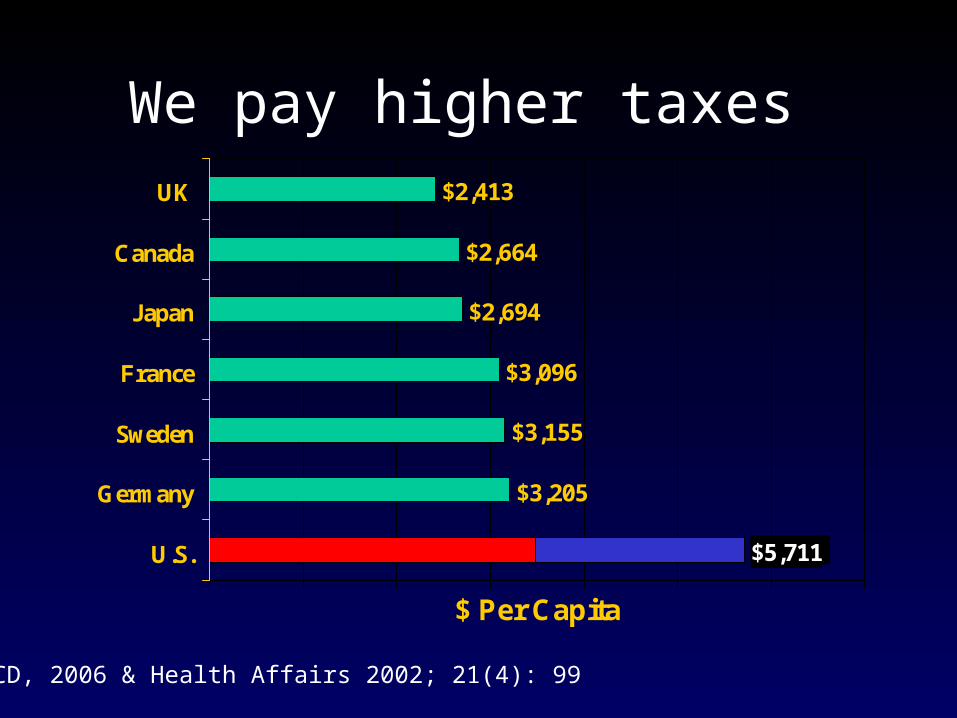
We pay higher taxes
$3,205
$3,155
$3,096
$2,694
$2,664
$2,413
$5,711U.S.
Germany
Sweden
France
Japan
Canada
UK
$ Per Capita
OECD, 2006 & Health Affairs 2002; 21(4): 99

$803
$624
$519$472
$403
$239
$0
$100
$200
$300
$400
$500
$600
$700
$800
$900
U.S. Australia Italy Canada Germany France
$/per capita
Source: OECD 2006Data are for 2004 or for most recent year availableFigures adjusted for purchasing power parity
Out of Pocket Costs are Higher
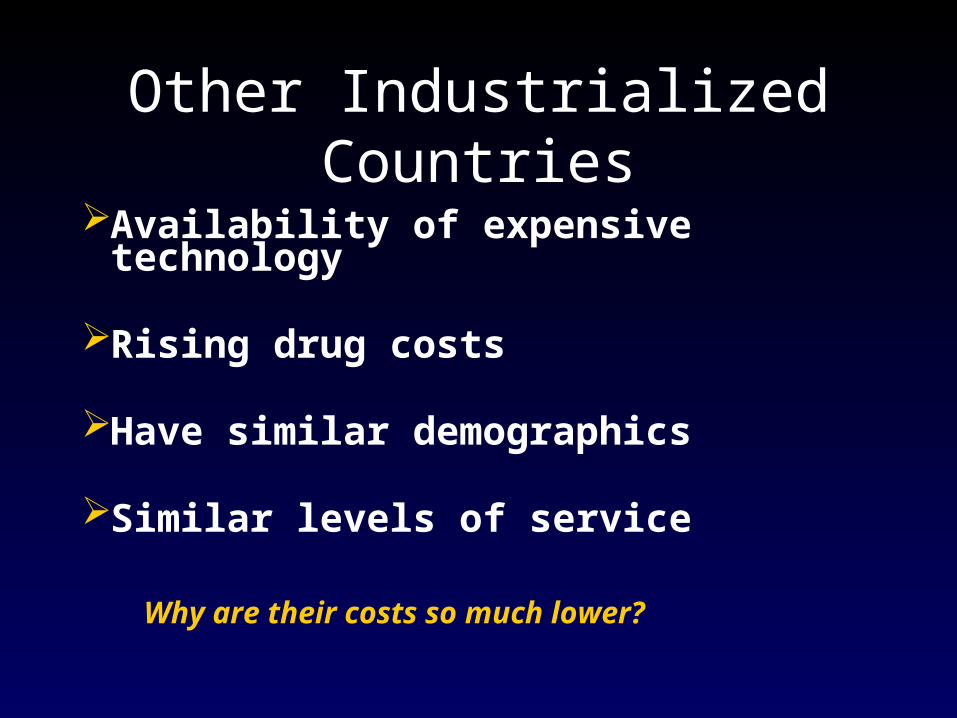
Availability of expensive technology
Rising drug costs
Have similar demographics
Similar levels of service
Why are their costs so much lower?
Other Industrialized Countries

Administrative simplicityNegotiated pricesMore primary care and
preventionHealth planningGlobal budgets They have a system
Why costs are so much lower in other countries

Everyone included
Clear accountabilityPublic StewardshipBudget Process
Public Financing
Fundamental Features of a True Health Care System

Healthcare is regarded as a public good with investment in needed services for the whole population
The costs of these shared services are spread across the whole population
Pools money and pays for health care directly
Investment Model

Sweden, Norway, Denmark, Canada, Finland, Iceland, Australia, and Taiwan all have single payer financing
Single publicly financed risk pool that pays for health care directly from a fund ear-marked for health care
Everyone has access to privately delivered, publicly financed health care services
Public can buy health insurance for services not covered by public plan.
Single Payer Health Care Systems
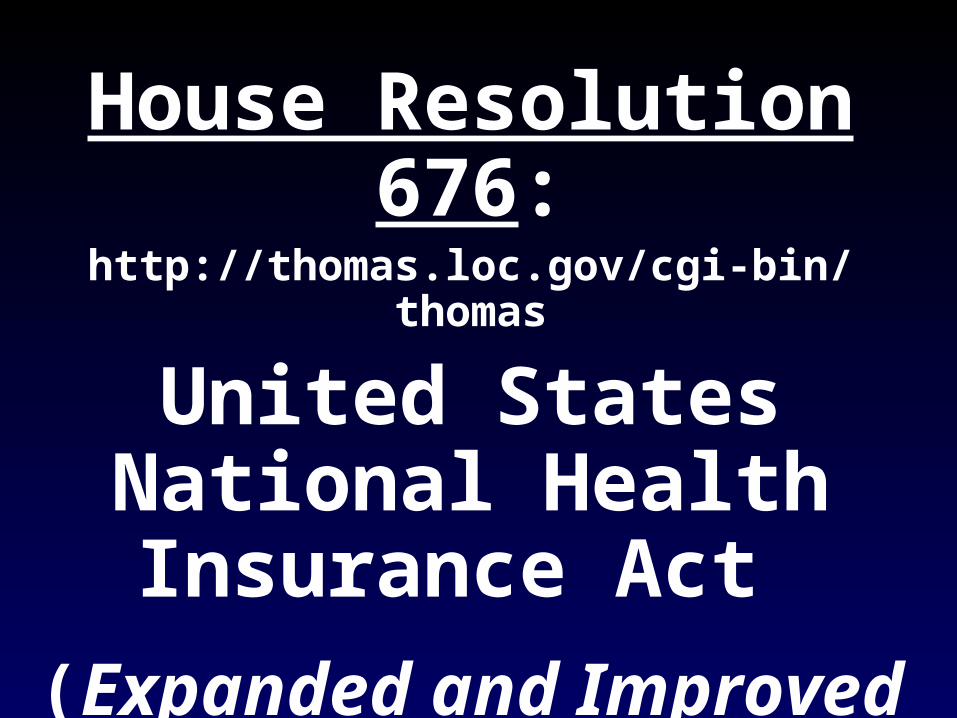
House Resolution 676:http://thomas.loc.gov/cgi-bin/thomas
United States National Health Insurance Act
(Expanded and Improved Medicare for All Act)

The 4 principles of single payer:
1. Access to comprehensive health care is a human right.
2. The right to choose and change one's physician is fundamental to patient autonomy.
3. No corporate profit and personal fortune.
4. In a democracy, the public should set overall health policies.
Single Payer NHI guarantees:
• Comprehensive Care
• Quality
• Choice
• Affordability

Single payer NHI would cover every American for all lifetime medically-
necessary services:
acute, rehabilitative, long term and home care, mental health, dental services, occupational health care, prescription drugs and supplies, and preventive and public health measures
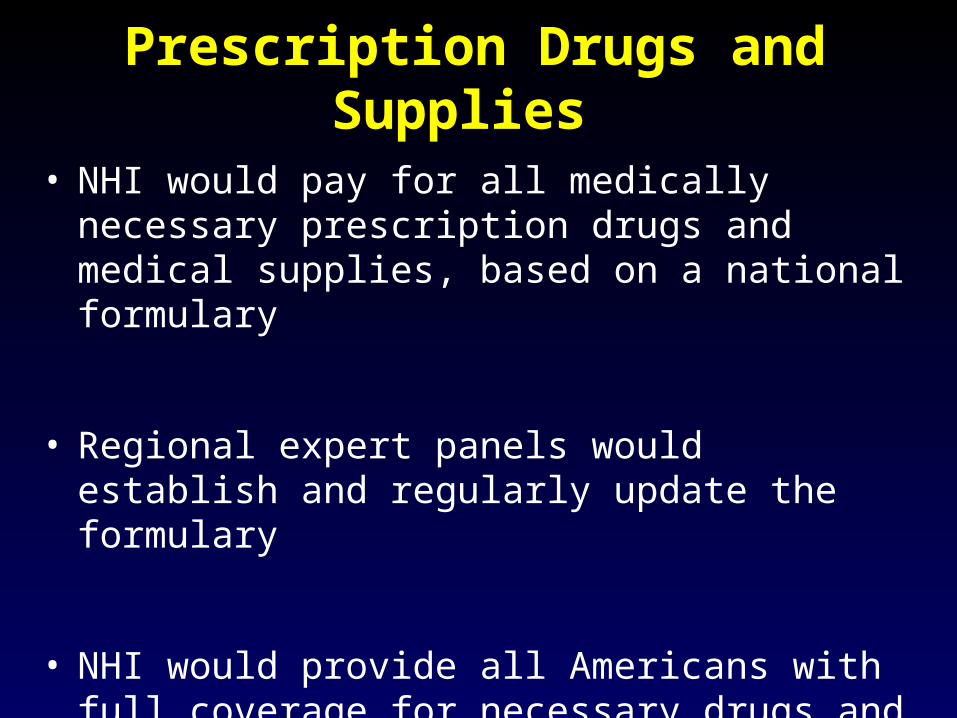
Prescription Drugs and Supplies
• NHI would pay for all medically necessary prescription drugs and medical supplies, based on a national formulary
• Regional expert panels would establish and regularly update the formulary
• NHI would provide all Americans with full coverage for necessary drugs and supplies

Payment for Physicians and Outpatient Care: 3 Options
1. fee-for-service, or
2. salaried positions in institutions receiving global budgets, or
3. salaried positions within group practices or HMOs receiving capitation payments

NHI will save $5000 per capita by 2024
Per Capita Health Expenditures
0
5000
10000
15000
20000
25000
Dolla
rs
current system single payerSource: Lewin Group 2002 and Dean Baker, Center
$12114 vs 10405
$8828 vs 8059
$16623 vs 13434
$21411 vs 16480
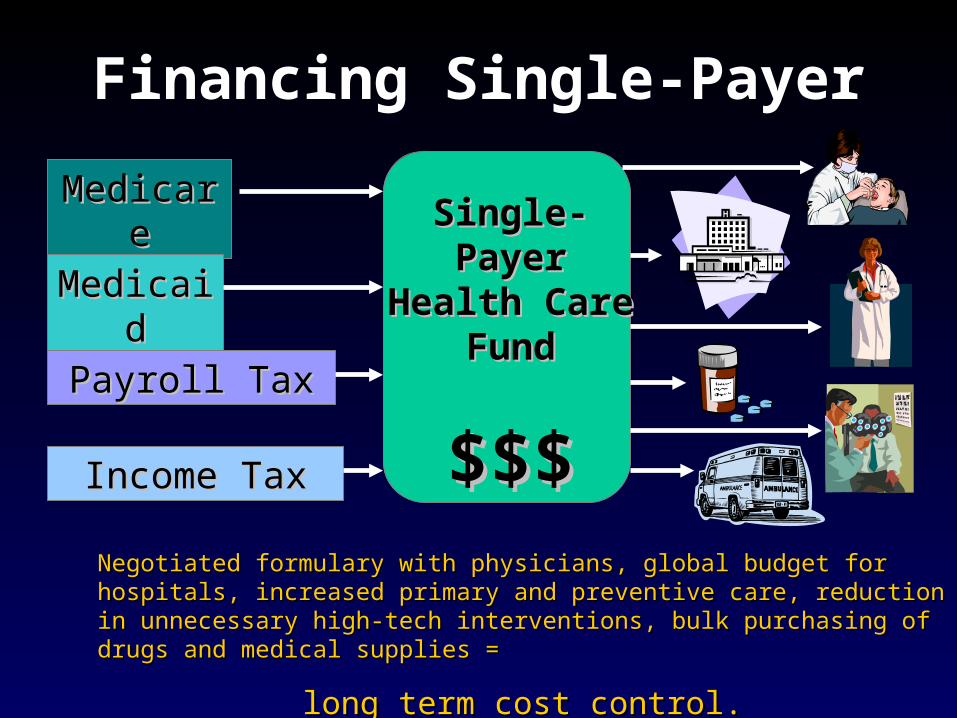
MedicareMedicare
MedicaidMedicaid
Payroll TaxPayroll Tax
Income TaxIncome Tax
Single-Payer Single-Payer Health Care Health Care
FundFund
$$$$$$
Financing Single-Payer
Negotiated formulary with physicians, global budget for hospitals, Negotiated formulary with physicians, global budget for hospitals, increased primary and preventive care, reduction in unnecessary increased primary and preventive care, reduction in unnecessary high-tech interventions, bulk purchasing of drugs and medical high-tech interventions, bulk purchasing of drugs and medical supplies = supplies =
long term cost control.long term cost control.

How Might It Be Paid For?One Example:
Revenue Sources for Single Payer Program
Employer Payroll Tax (8.17%)
33%
Federal Government
(existing)34%
Other8%
State and Local Govt (existing)
10%
Employee Payroll Tax (3.78%)
15%
Note: Payroll tax on incomes above $7,000 and below $200,000 only. Source: Health Care for All Californians Act: Cost and Economic Impacts Analysis, The Lewis Group, January 19, 2005

Projected 2010 Health Care Expenditure Comparison of:Current Health Care System to those of National Health Insurance (NHI, Improved and Expanded Medicare for All, HR 676)
Status Quo($ billions)
NHI($ billions)
Spending Federal spending (Medicare, Medicaid, DSH, etc.) 957 957
Spending State and Local spending 348 348
Spending Private Insurance spending (premiums) 950 0
Spending Out of pocket spending (co-pays, deductibles, over the counter drugs, etc.)
317 80
Spending Other private funds spending (foundations, etc.) 204 0
Savings Savings from reduced administrative cost (paperwork) 0 278
Savings Savings from bulk purchase of Rx DRUGS 0 87
Savings Savings from non-durable medical supplies 0 13
Savings Savings from durable medical supplies 0 9
Additional Revenue
Additional Payroll Tax 0 538 (3.3% increase over current 1.4%)
Additional Revenue
Stock transfer tax (0.25% on seller and buyer) 0 150
Additional Revenue
Corporate Welfare Reduction 0 100
Additional Revenue
Reversal of 2001 and 2002 Tax Cuts 0 251
Additional Revenue
Tax surcharge (5% on highest top 5% earners and 10% on top 1% earners)
0 200
Total ($billions) 2,776 3,011Surplus 0 235 (3,011-2,776)

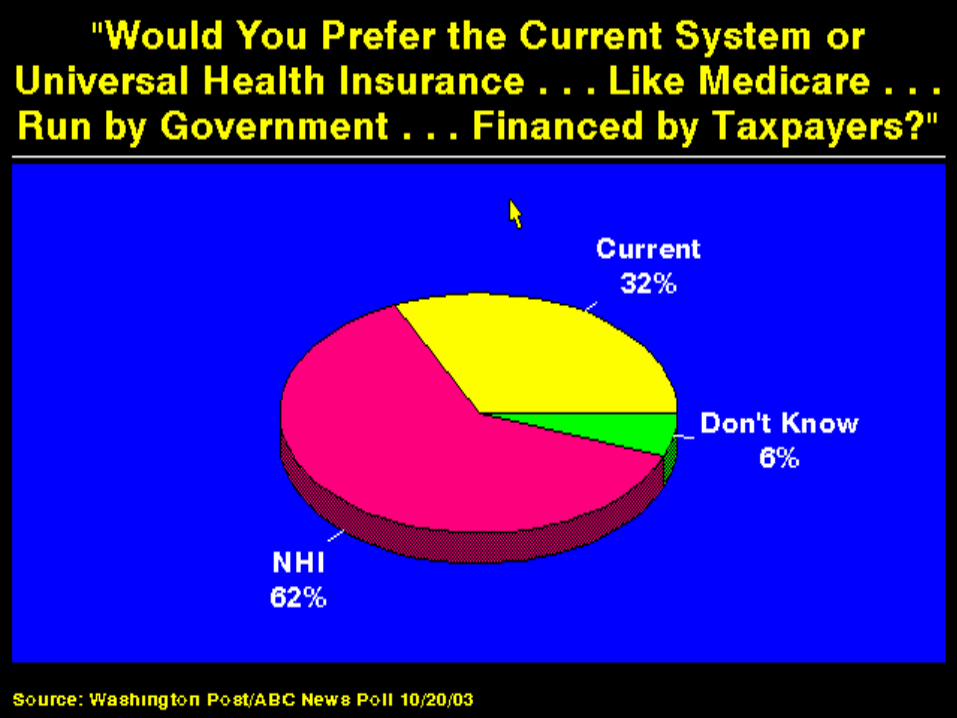
“Would you prefer the current system or Universal Health
Insurance…”
62%
32%
6%
Washington Post/ABC News Poll, 10/20/03

How Do We Know It Can Be Done?
• Every other industrialized nation has a healthcare system that assures health care for all
• All spend less than we do; most spend less than half
• Most have lower death rates, more accountability, and higher satisfaction
• No country has ever adopted single payer, found it to be worse, and switched back
Can we afford NHI?
We can't afford NOT to have NHI!

Is this politically feasible?
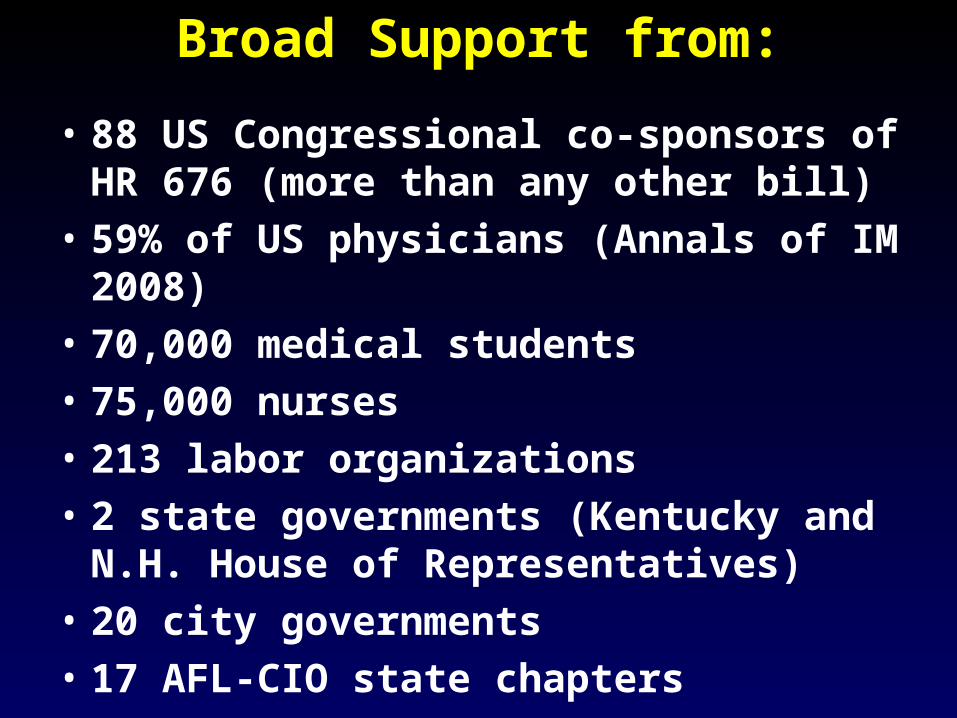
Broad Support from:
• 88 US Congressional co-sponsors of HR 676 (more than any other bill)
• 59% of US physicians (Annals of IM 2008)
• 70,000 medical students
• 75,000 nurses
• 213 labor organizations
• 2 state governments (Kentucky and N.H. House of Representatives)
• 20 city governments
• 17 AFL-CIO state chapters
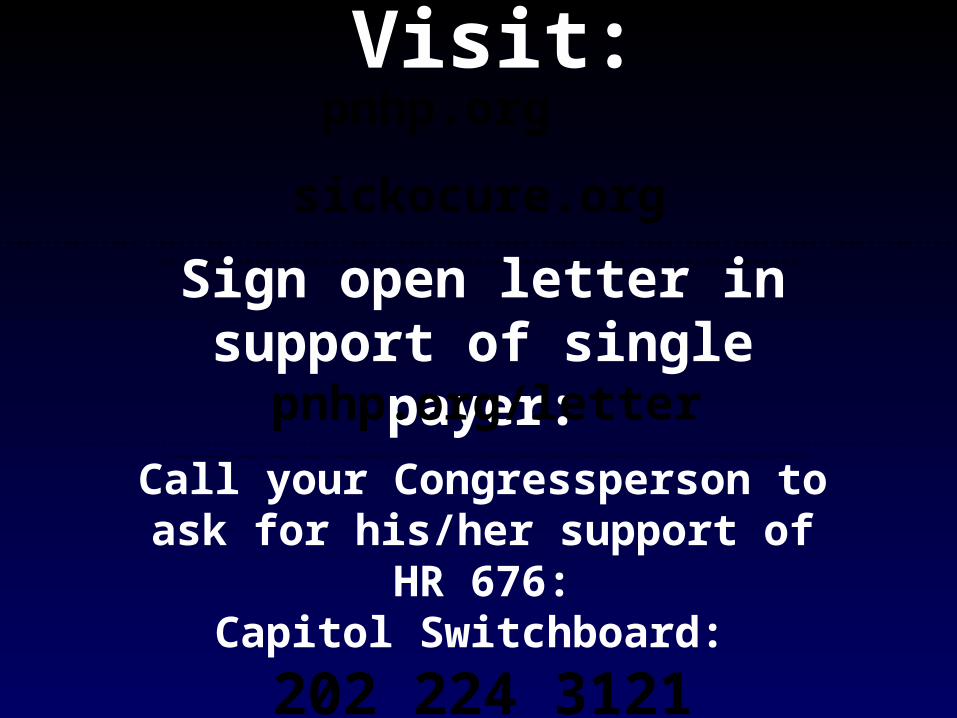
Visit:pnhp.org
sickocure.org--------------------------------------------------------------------------------------------------------------------------------------------------------------------------
Sign open letter in support of single payer:
pnhp.org/letter----------------------------------------------------------------------------------------------------------------------------------------------------------------------------------------------------------------------------------------
Call your Congressperson to ask for his/her support of HR 676:
Capitol Switchboard:
202 224 3121