my seven tools
TRANSCRIPT

7/28/2019 My Seven Tools
http://slidepdf.com/reader/full/my-seven-tools 1/223
Input of Data
Category Category Category Category4Category Name Level 1 Level 2 Level 3
Sample Size 50 50 50 0
The Largest Value 48.4 47.5 46.1
The Smallest Valu 34.9 34.5 33.1
1 39.6 40.3 37.3
2 37.2 37.3 41.63 41.1 36.9 34.94 38.5 36.8 33.15 35.6 38.6 40.56 41.4 42.7 42.7
7 38.1 35.5 39.28 37.5 36.1 38.29 38.3 40.2 38.1
10 37.4 37.1 37.3
11 36 36.1 39.412 38.8 40.7 42.113 36 39.6 36.814 39.4 34.7 37.915 39.6 35.8 38.916 40.5 41.1 40.117 36.3 37.7 41.518 35.7 34.5 41.419 38.1 37.7 34.120 34.9 39.2 36.2
21 41.7 36.9 39.1
22 37.1 40.4 39.723 37.5 39.5 40.1
24 39.8 36.6 39.725 39.4 41.5 41.626 47.2 46 41.8
27 44.9 40.3 39.628 40.7 37.5 38.529 40 36.6 3930 39.6 42.9 4231 48.4 43.6 45.632 40.6 42.6 42.733 39.5 42.6 44.7
34 41.5 40.1 45.6
35 40.7 41.7 41.936 46.9 47.5 43.937 40.9 43.4 3938 40.5 40 44.639 39.7 43.5 39.6
40 44.6 40.3 46.141 44.1 43 42.942 42.9 40.8 41.443 41.2 41.2 42.244 43.9 44.1 40.6

7/28/2019 My Seven Tools
http://slidepdf.com/reader/full/my-seven-tools 2/223
45 40.4 39.6 41.8
46 44.6 44.1 44.8
47 40.8 43.2 43.248 42.3 38 40.549 41 42 41.950 45.1 40.3 42.7
51525354555657
58
5960616263
64656667686970717273
74
7576
77787980818283848586878889
9091929394959697

7/28/2019 My Seven Tools
http://slidepdf.com/reader/full/my-seven-tools 3/223
9899
100101102103
104105106107108109110111112113114115116117118119120121122123124125126127128129130131132133134135136137138139140141142143
144145146147148149150151

7/28/2019 My Seven Tools
http://slidepdf.com/reader/full/my-seven-tools 4/223
152153154155156157
158159160161162163164165166167168169170171172173174175176177178179180181182183184185186187188189190191192193194195196197
198199200201202203204205

7/28/2019 My Seven Tools
http://slidepdf.com/reader/full/my-seven-tools 5/223
206207208209210211
212213214215216217218219220221222223224225226227228229230231232233234235236237238239240241242243244245246247248249250251
252253254255256257258259

7/28/2019 My Seven Tools
http://slidepdf.com/reader/full/my-seven-tools 6/223
260261262263264265
266267268269270271272273274275276277278279280281282283284285286287288289290291292293294295296297298299300

7/28/2019 My Seven Tools
http://slidepdf.com/reader/full/my-seven-tools 7/223

7/28/2019 My Seven Tools
http://slidepdf.com/reader/full/my-seven-tools 8/223

7/28/2019 My Seven Tools
http://slidepdf.com/reader/full/my-seven-tools 9/223
Determination of the Class Interval
Sample Size(Overall) 150
The Largest Value(Overall) 48.4
The Smallest Value(Overall) 33.1
Determine the Class IntervalInput Sample Size 50Input The Largest Value 48.4 -4 ~ 26.45Input The Smallest Value 33.1 -3 26.45 ~ 28.65 27.55The Rough Number of Classes 7.1 -2 28.65 ~ 30.85 29.75
Input the Rough Number of Classes 7 -1 30.85 ~ 33.05 31.95The Rough Standard of the Class Inter 2.18571 1 33.05 ~ 35.25 34.15Input the Unit of Measurement 0.1 2 35.25 ~ 37.45 36.35Input the Class Interval 2.2 3 37.45 ~ 39.65 38.55
4 39.65 ~ 41.85 40.75Input the Lower Specification Limit SL 31 5 41.85 ~ 44.05 42.95Input the Upper Specification Limit SU 45 6 44.05 ~ 46.25 45.15
7 46.25 ~ 48.45 47.358 48.45 ~ 50.65 49.559 50.65 ~ 52.85 51.75
10 52.85 ~ 55.05 53.9511 55.05 ~ 57.25 56.1512 57.25 ~ 59.45 58.3513 59.45 ~ 61.65 60.55
14 61.65 ~ 63.85 62.75
15 63.85 ~ 66.05 64.9516 66.05 ~ 68.25 67.15
17 68.25 ~ 70.45 69.3518 70.45 ~ 72.65 71.5519 72.65 ~ 74.85 73.75
20 74.85 ~
No Class
requency Tabl
Mid-
Point of
Class
Total

7/28/2019 My Seven Tools
http://slidepdf.com/reader/full/my-seven-tools 10/223

7/28/2019 My Seven Tools
http://slidepdf.com/reader/full/my-seven-tools 11/223

7/28/2019 My Seven Tools
http://slidepdf.com/reader/full/my-seven-tools 12/223

7/28/2019 My Seven Tools
http://slidepdf.com/reader/full/my-seven-tools 13/223

7/28/2019 My Seven Tools
http://slidepdf.com/reader/full/my-seven-tools 14/223
26.45-3 26.45
28.6528.65
-2 28.6530.8530.85
Use for

7/28/2019 My Seven Tools
http://slidepdf.com/reader/full/my-seven-tools 15/223
-1 30.8533.0533.05
1 33.0535.2535.25
2 35.2537.4537.45
3 37.4539.6539.65
4 39.6541.8541.85
5 41.8544.0544.05
6 44.0546.2546.25
7 46.2548.4548.45
8 48.4550.6550.65
9 50.6552.8552.85
10 52.8555.0555.05
11 55.0557.2557.25
12 57.2559.4559.45
13 59.4561.6561.65
14 61.6563.8563.85
15 63.85
66.0566.05
16 66.0568.2568.25
17 68.2570.4570.45

7/28/2019 My Seven Tools
http://slidepdf.com/reader/full/my-seven-tools 16/223
18 70.4572.6572.65
19 72.6574.8574.85
20 74.85
Overall 40.2513 Average 40.2513
Category 40.31 Average 40.31
Category 39.958 Average 39.958
Category 40.486 Average 40.486
Category #DIV/0! Average #DIV/0!
SL 3131
SU 4545
x axis 33.148.4
7/28/2019 My Seven Tools
http://slidepdf.com/reader/full/my-seven-tools 17/223
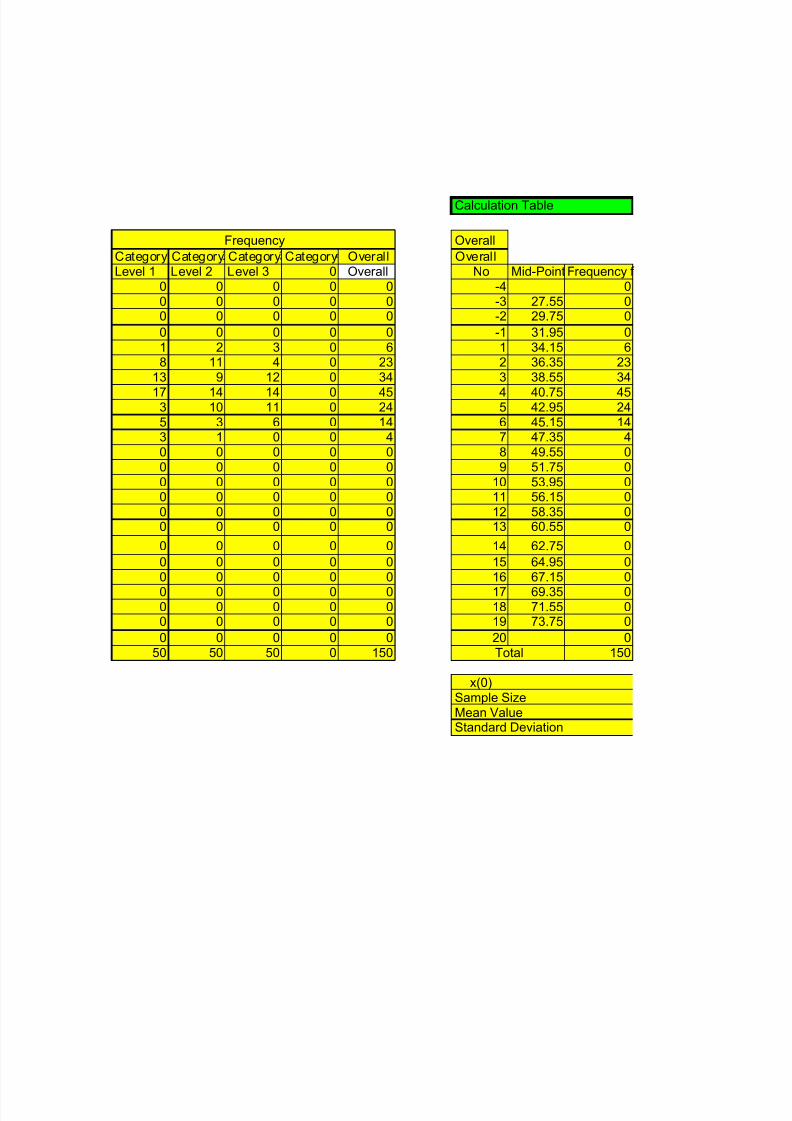
Overall
Category Category Category Category Overall OverallLevel 1 Level 2 Level 3 0 Overall No Mid-Point Frequency f
0 0 0 0 0 -4 00 0 0 0 0 -3 27.55 00 0 0 0 0 -2 29.75 0
0 0 0 0 0 -1 31.95 01 2 3 0 6 1 34.15 68 11 4 0 23 2 36.35 23
13 9 12 0 34 3 38.55 34
17 14 14 0 45 4 40.75 453 10 11 0 24 5 42.95 245 3 6 0 14 6 45.15 143 1 0 0 4 7 47.35 40 0 0 0 0 8 49.55 00 0 0 0 0 9 51.75 00 0 0 0 0 10 53.95 00 0 0 0 0 11 56.15 00 0 0 0 0 12 58.35 00 0 0 0 0 13 60.55 0
0 0 0 0 0 14 62.75 0
0 0 0 0 0 15 64.95 00 0 0 0 0 16 67.15 0
0 0 0 0 0 17 69.35 00 0 0 0 0 18 71.55 00 0 0 0 0 19 73.75 0
0 0 0 0 0 20 050 50 50 0 150 150
x(0)Sample SizeMean ValueStandard Deviation
Frequency
Total
Calculation Table

7/28/2019 My Seven Tools
http://slidepdf.com/reader/full/my-seven-tools 18/223

7/28/2019 My Seven Tools
http://slidepdf.com/reader/full/my-seven-tools 19/223

7/28/2019 My Seven Tools
http://slidepdf.com/reader/full/my-seven-tools 20/223

7/28/2019 My Seven Tools
http://slidepdf.com/reader/full/my-seven-tools 21/223

7/28/2019 My Seven Tools
http://slidepdf.com/reader/full/my-seven-tools 22/223
Category Category Category Category Overall0 0 0 0 00 0 0 0 00 0 0 0 00 0 0 0 00 0 0 0 00 0 0 0 00 0 0 0 0
Figure

7/28/2019 My Seven Tools
http://slidepdf.com/reader/full/my-seven-tools 23/223
0 0 0 0 00 0 0 0 00 0 0 0 01 2 3 0 61 2 3 0 60 0 0 0 0
8 11 4 0 238 11 4 0 230 0 0 0 0
13 9 12 0 3413 9 12 0 34
0 0 0 0 017 14 14 0 4517 14 14 0 45
0 0 0 0 03 10 11 0 243 10 11 0 240 0 0 0 05 3 6 0 145 3 6 0 140 0 0 0 03 1 0 0 43 1 0 0 40 0 0 0 00 0 0 0 00 0 0 0 00 0 0 0 00 0 0 0 00 0 0 0 00 0 0 0 00 0 0 0 00 0 0 0 00 0 0 0 00 0 0 0 00 0 0 0 00 0 0 0 00 0 0 0 00 0 0 0 00 0 0 0 00 0 0 0 00 0 0 0 00 0 0 0 00 0 0 0 00 0 0 0 00 0 0 0 00 0 0 0 0
0 0 0 0 00 0 0 0 00 0 0 0 00 0 0 0 00 0 0 0 00 0 0 0 00 0 0 0 00 0 0 0 0

7/28/2019 My Seven Tools
http://slidepdf.com/reader/full/my-seven-tools 24/223
0 0 0 0 00 0 0 0 00 0 0 0 00 0 0 0 00 0 0 0 00 0 0 0 0
0 0 0 0 0
048
020
020
020
020
0 0 0 0 020 20 20 20 40
0 0 0 0 020 20 20 20 40

7/28/2019 My Seven Tools
http://slidepdf.com/reader/full/my-seven-tools 25/223
Category1
Level 1X fX fX2 No Mid-PointFrequency f X fX fX2
0 0 -4 0 0 0-2 0 0 -3 27.55 0 -2 0 0-1 0 0 -2 29.75 0 -1 0 0
0 0 0 -1 31.95 0 0 0 01 6 6 1 34.15 1 1 1 12 46 92 2 36.35 8 2 16 323 102 306 3 38.55 13 3 39 117
4 180 720 4 40.75 17 4 68 2725 120 600 5 42.95 3 5 15 756 84 504 6 45.15 5 6 30 1807 28 196 7 47.35 3 7 21 1478 0 0 8 49.55 0 8 0 09 0 0 9 51.75 0 9 0 0
10 0 0 10 53.95 0 10 0 011 0 0 11 56.15 0 11 0 012 0 0 12 58.35 0 12 0 013 0 0 13 60.55 0 13 0 0
14 0 0 14 62.75 0 14 0 0
15 0 0 15 64.95 0 15 0 016 0 0 16 67.15 0 16 0 0
17 0 0 17 69.35 0 17 0 018 0 0 18 71.55 0 18 0 019 0 0 19 73.75 0 19 0 0
20 0566 2424 50 190 824
31.95 x(0) 31.95150 Sample Size 50
40.2513 Mean Value 40.313.06018 Standard Deviation 3.1741
合計

7/28/2019 My Seven Tools
http://slidepdf.com/reader/full/my-seven-tools 26/223

7/28/2019 My Seven Tools
http://slidepdf.com/reader/full/my-seven-tools 27/223

7/28/2019 My Seven Tools
http://slidepdf.com/reader/full/my-seven-tools 28/223

7/28/2019 My Seven Tools
http://slidepdf.com/reader/full/my-seven-tools 29/223

7/28/2019 My Seven Tools
http://slidepdf.com/reader/full/my-seven-tools 30/223

7/28/2019 My Seven Tools
http://slidepdf.com/reader/full/my-seven-tools 31/223

7/28/2019 My Seven Tools
http://slidepdf.com/reader/full/my-seven-tools 32/223

7/28/2019 My Seven Tools
http://slidepdf.com/reader/full/my-seven-tools 33/223
Category2 Category3
Level 2 Level 3No Mid-PointFrequency f X fX fX2 No Mid-Point
-4 0 0 0 -4-3 27.55 0 -2 0 0 -3 27.55-2 29.75 0 -1 0 0 -2 29.75
-1 31.95 0 0 0 0 -1 31.951 34.15 2 1 2 2 1 34.152 36.35 11 2 22 44 2 36.353 38.55 9 3 27 81 3 38.55
4 40.75 14 4 56 224 4 40.755 42.95 10 5 50 250 5 42.956 45.15 3 6 18 108 6 45.157 47.35 1 7 7 49 7 47.358 49.55 0 8 0 0 8 49.559 51.75 0 9 0 0 9 51.75
10 53.95 0 10 0 0 10 53.9511 56.15 0 11 0 0 11 56.1512 58.35 0 12 0 0 12 58.3513 60.55 0 13 0 0 13 60.55
14 62.75 0 14 0 0 14 62.75
15 64.95 0 15 0 0 15 64.9516 67.15 0 16 0 0 16 67.15
17 69.35 0 17 0 0 17 69.3518 71.55 0 18 0 0 18 71.5519 73.75 0 19 0 0 19 73.75
20 0 2050 182 758
x(0) 31.95 x(0)Sample Size 50 Sample SizeMean Value 39.958 Mean ValueStandard Deviation 3.07165 Standard Deviation
合計 合計

7/28/2019 My Seven Tools
http://slidepdf.com/reader/full/my-seven-tools 34/223

7/28/2019 My Seven Tools
http://slidepdf.com/reader/full/my-seven-tools 35/223

7/28/2019 My Seven Tools
http://slidepdf.com/reader/full/my-seven-tools 36/223

7/28/2019 My Seven Tools
http://slidepdf.com/reader/full/my-seven-tools 37/223

7/28/2019 My Seven Tools
http://slidepdf.com/reader/full/my-seven-tools 38/223

7/28/2019 My Seven Tools
http://slidepdf.com/reader/full/my-seven-tools 39/223

7/28/2019 My Seven Tools
http://slidepdf.com/reader/full/my-seven-tools 40/223

7/28/2019 My Seven Tools
http://slidepdf.com/reader/full/my-seven-tools 41/223
Category4
0requency X fX fX2 No Mid-Point requency X fX
0 0 0 -4 0 00 -2 0 0 -3 27.55 0 -2 00 -1 0 0 -2 29.75 0 -1 0
0 0 0 0 -1 31.95 0 0 03 1 3 3 1 34.15 0 1 04 2 8 16 2 36.35 0 2 0
12 3 36 108 3 38.55 0 3 0
14 4 56 224 4 40.75 0 4 011 5 55 275 5 42.95 0 5 0
6 6 36 216 6 45.15 0 6 00 7 0 0 7 47.35 0 7 00 8 0 0 8 49.55 0 8 00 9 0 0 9 51.75 0 9 00 10 0 0 10 53.95 0 10 00 11 0 0 11 56.15 0 11 00 12 0 0 12 58.35 0 12 00 13 0 0 13 60.55 0 13 0
0 14 0 0 14 62.75 0 14 0
0 15 0 0 15 64.95 0 15 00 16 0 0 16 67.15 0 16 0
0 17 0 0 17 69.35 0 17 00 18 0 0 18 71.55 0 18 00 19 0 0 19 73.75 0 19 0
0 20 050 194 842 0 0
31.95 x(0) 31.9550 Sample Size 0
40.486 Mean Value #DIV/0!2.96963 Standard Deviation #DIV/0!
合計

7/28/2019 My Seven Tools
http://slidepdf.com/reader/full/my-seven-tools 42/223

7/28/2019 My Seven Tools
http://slidepdf.com/reader/full/my-seven-tools 43/223

7/28/2019 My Seven Tools
http://slidepdf.com/reader/full/my-seven-tools 44/223

7/28/2019 My Seven Tools
http://slidepdf.com/reader/full/my-seven-tools 45/223

7/28/2019 My Seven Tools
http://slidepdf.com/reader/full/my-seven-tools 46/223

7/28/2019 My Seven Tools
http://slidepdf.com/reader/full/my-seven-tools 47/223

7/28/2019 My Seven Tools
http://slidepdf.com/reader/full/my-seven-tools 48/223

7/28/2019 My Seven Tools
http://slidepdf.com/reader/full/my-seven-tools 49/223
fX2000
0000
0000000000
0
00
000
0
Overall Histogram
0
5
10
15
20
25
F r e q u e n c y
SL SU
0
5
10
15
20
25
F r e q u e n c y
SL SU
0
10
20
30
40
50
25 30 35 40 45 50 55 60
F r e q u e n c y
Characteristic
Figure Overall Histogram
SL SU Overall
n = 150
Xbar 40.25
s = 3.06
0
n = 0
Xbar #####
s = #####
Level 3
n = 50
Xbar 40.49
s = 2.97

7/28/2019 My Seven Tools
http://slidepdf.com/reader/full/my-seven-tools 50/223
Stratified Histogram
0
5
10
15
20
25
F r e q u
e n c y
SL SU
0
5
10
15
20
25
25 30 35 40 45 50 55 60
F r e q
u e n c y
Characteristic
Figure Stratified Histogram
SL SU
Level 2
n = 50
Xbar 39.96
s = 3.07
Level 1
n = 50
Xbar 40.31
s = 3.17

7/28/2019 My Seven Tools
http://slidepdf.com/reader/full/my-seven-tools 51/223

7/28/2019 My Seven Tools
http://slidepdf.com/reader/full/my-seven-tools 52/223

7/28/2019 My Seven Tools
http://slidepdf.com/reader/full/my-seven-tools 53/223

7/28/2019 My Seven Tools
http://slidepdf.com/reader/full/my-seven-tools 54/223

7/28/2019 My Seven Tools
http://slidepdf.com/reader/full/my-seven-tools 55/223

7/28/2019 My Seven Tools
http://slidepdf.com/reader/full/my-seven-tools 56/223

7/28/2019 My Seven Tools
http://slidepdf.com/reader/full/my-seven-tools 57/223
OverallHeight of Xbar 48 n 150Height of SL 40 Xbar 40.25Height of SU 40 s 3.06Xbar : Number of Decim 2s : Number of Decimals 2
0Height of Xbar 20 n 0Height of SL 20 Xbar #####
Height of SU 20 s #####Xbar : Number of Decim 2s : Number of Decimals 2
Level 3Height of Xbar 20 n 50Height of SL 20 Xbar 40.49Height of SU 20 s 2.97Xbar : Number of Decim 2s : Number of Decimals 2
Ajust Figure
Ajust Figure
Ajust Figure

7/28/2019 My Seven Tools
http://slidepdf.com/reader/full/my-seven-tools 58/223
Level 2Height of Xbar 20 n 50Height of SL 20 Xbar 39.96Height of SU 20 s 3.07Xbar : Number of Decim 2
s : Number of Decimals 2
Level 1Height of Xbar 20 n 50Height of SL 20 Xbar 40.31Height of SU 20 s 3.17Xbar : Number of Decim 2s : Number of Decimals 2
Ajust Figure
Ajust Figure

7/28/2019 My Seven Tools
http://slidepdf.com/reader/full/my-seven-tools 59/223
Size of Subgroup 3
Number of Subgro 50
NoSample
NameX1 X2 X3 X4 X5 X6
1 1 39.6 40.3 37.32 2 37.2 37.3 41.63 3 41.1 36.9 34.94 4 38.5 36.8 33.15 5 35.6 38.6 40.56 6 41.4 42.7 42.77 7 38.1 35.5 39.28 8 37.5 36.1 38.29 9 38.3 40.2 38.1
10 10 37.4 37.1 37.311 11 36 36.1 39.412 12 38.8 40.7 42.113 13 36 39.6 36.814 14 39.4 34.7 37.915 15 39.6 35.8 38.916 16 40.5 41.1 40.117 17 36.3 37.7 41.518 18 35.7 34.5 41.419 19 38.1 37.7 34.120 20 34.9 39.2 36.221 21 41.7 36.9 39.122 22 37.1 40.4 39.723 23 37.5 39.5 40.124 24 39.8 36.6 39.725 25 39.4 41.5 41.626 26 47.2 46 41.827 27 44.9 40.3 39.628 28 40.7 37.5 38.529 29 40 36.6 3930 30 39.6 42.9 4231 31 48.4 43.6 45.632 32 40.6 42.6 42.733 33 39.5 42.6 44.734 34 41.5 40.1 45.635 35 40.7 41.7 41.936 36 46.9 47.5 43.9
Input of Data

7/28/2019 My Seven Tools
http://slidepdf.com/reader/full/my-seven-tools 60/223
37 37 40.9 43.4 3938 38 40.5 40 44.639 39 39.7 43.5 39.640 40 44.6 40.3 46.141 41 44.1 43 42.942 42 42.9 40.8 41.4
43 43 41.2 41.2 42.244 44 43.9 44.1 40.645 45 40.4 39.6 41.846 46 44.6 44.1 44.847 47 40.8 43.2 43.248 48 42.3 38 40.549 49 41 42 41.950 50 45.1 40.3 42.7515253545556575859606162636465666768697071727374757677787980818283848586

7/28/2019 My Seven Tools
http://slidepdf.com/reader/full/my-seven-tools 61/223
878889909192
93949596979899
100
n = 3
UCL= 43.86565
CL= 40.29333
LCL= 36.72102
UCL= 8.9919
CL= 3.492
LCL= Not Considere
Xbar-R Control Chart
30
35
40
45
50
X
0
5
10
15
1 8 1 5
2 2
2 9
3 6
4 3
5 0
5 7
6 4
7 1
7 8
8 5
9 2
9 9
R
Subgroup No.Figure Xbar-R Control Chart
7/28/2019 My Seven Tools
http://slidepdf.com/reader/full/my-seven-tools 62/223
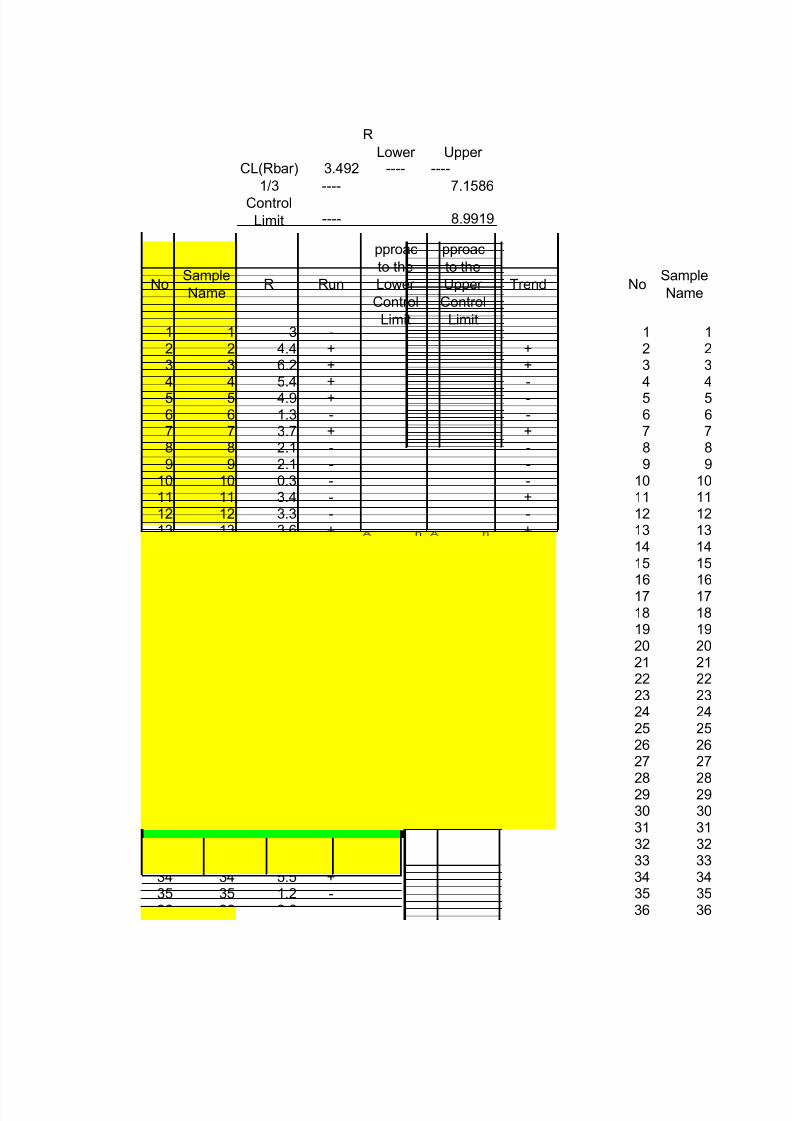
Lower Upper CL(Rbar) 3.492 ---- ----
1/3 ---- 7.1586
Control
Limit ---- 8.9919
NoSample
NameR Run
pproac
to the
Lower
Control
Limit
pproac
to the
Upper
Control
Limit
Trend NoSample
Name
1 1 3 - 1 12 2 4.4 + + 2 23 3 6.2 + + 3 34 4 5.4 + - 4 45 5 4.9 + - 5 56 6 1.3 - - 6 67 7 3.7 + + 7 78 8 2.1 - - 8 89 9 2.1 - - 9 9
10 10 0.3 - - 10 1011 11 3.4 - + 11 1112 12 3.3 - - 12 1213 13 3.6 + + 13 1314 14 4.7 + + 14 1415 15 3.8 + - 15 1516 16 1 - - 16 1617 17 5.2 + + 17 1718 18 6.9 + + 18 1819 19 4 + - 19 1920 20 4.3 + + 20 2021 21 4.8 + + 21 2122 22 3.3 - - 22 2223 23 2.6 - - 23 2324 24 3.2 - + 24 2425 25 2.2 - - 25 2526 26 5.4 + + 26 2627 27 5.3 + - 27 2728 28 3.2 - - 28 2829 29 3.4 - + 29 2930 30 3.3 - - 30 3031 31 4.8 + + 31 3132 32 2.1 - - 32 3233 33 5.2 + + 33 3334 34 5.5 + + 34 3435 35 1.2 - - 35 3536 36 3.6 + + 36 36
R

7/28/2019 My Seven Tools
http://slidepdf.com/reader/full/my-seven-tools 63/223
37 37 4.4 + + 37 3738 38 4.6 + + 38 3839 39 3.9 + - 39 3940 40 5.8 + + 40 4041 41 1.2 - - 41 4142 42 2.1 - + 42 42
43 43 1 - - 43 4344 44 3.5 + + 44 4445 45 2.2 - - 45 4546 46 0.7 - - 46 4647 47 2.4 - + 47 4748 48 4.3 + + 48 4849 49 1 - - 49 4950 50 4.8 + + 50 5051 5152 5253 5354 5455 5556 5657 5758 5859 5960 6061 6162 6263 6364 6465 6566 6667 6768 6869 6970 7071 7172 7273 7374 7475 7576 7677 7778 7879 7980 8081 8182 8283 8384 8485 8586 86

7/28/2019 My Seven Tools
http://slidepdf.com/reader/full/my-seven-tools 64/223
87 8788 8889 8990 9091 9192 92
93 9394 9495 9596 9697 9798 9899 99
100 100

7/28/2019 My Seven Tools
http://slidepdf.com/reader/full/my-seven-tools 65/223
Lower Upper k 3CL(Xbar) 40.2933 ---- ---- D4 2.575
1/3 ---- 37.9118 42.6749 D3 0
Control
Limit ---- 36.721 43.8656 A2 1.023
Xbar Run
pproac
to the
Lower
Control
Limit
Approac
h to the
Control
Limit
Trend R-LCL R-CL R-UCL X-LCL
39.066667 - 3.492 8.9919 36.72138.7 - - 3.492 8.9919 36.721
37.633333 - - - 3.492 8.9919 36.72136.133333 - - - - 3.492 8.9919 36.72138.233333 - + 3.492 8.9919 36.72142.266667 + + 3.492 8.9919 36.721
37.6 - - - 3.492 8.9919 36.72137.266667 - - - 3.492 8.9919 36.72138.866667 - + 3.492 8.9919 36.72137.266667 - - - 3.492 8.9919 36.72137.166667 - - - 3.492 8.9919 36.72140.533333 + + 3.492 8.9919 36.72137.466667 - - - 3.492 8.9919 36.72137.333333 - - - 3.492 8.9919 36.721
38.1 - + 3.492 8.9919 36.72140.566667 + + 3.492 8.9919 36.721
38.5 - - 3.492 8.9919 36.72137.2 - - - 3.492 8.9919 36.721
36.633333 - - - - 3.492 8.9919 36.72136.766667 - - + 3.492 8.9919 36.72139.233333 - + 3.492 8.9919 36.72139.066667 - - 3.492 8.9919 36.72139.033333 - - 3.492 8.9919 36.721
38.7 - - 3.492 8.9919 36.72140.833333 + + 3.492 8.9919 36.721
45 + + + + 3.492 8.9919 36.72141.6 + - 3.492 8.9919 36.72138.9 - - 3.492 8.9919 36.721
38.533333 - - 3.492 8.9919 36.72141.5 + + 3.492 8.9919 36.721
45.866667 + + + + 3.492 8.9919 36.72141.966667 + - 3.492 8.9919 36.72142.266667 + + 3.492 8.9919 36.721
42.4 + + 3.492 8.9919 36.72141.433333 + - 3.492 8.9919 36.721
46.1 + + + + 3.492 8.9919 36.721
Xbar Calculation Table

7/28/2019 My Seven Tools
http://slidepdf.com/reader/full/my-seven-tools 66/223
41.1 + - 3.492 8.9919 36.72141.7 + + 3.492 8.9919 36.721
40.933333 + - 3.492 8.9919 36.72143.666667 + + + 3.492 8.9919 36.72143.333333 + + - 3.492 8.9919 36.721
41.7 + - 3.492 8.9919 36.721
41.533333 + - 3.492 8.9919 36.72142.866667 + + + 3.492 8.9919 36.721
40.6 + - 3.492 8.9919 36.72144.5 + + + + 3.492 8.9919 36.72142.4 + - 3.492 8.9919 36.721
40.266667 - - 3.492 8.9919 36.72141.633333 + + 3.492 8.9919 36.721
42.7 + + + 3.492 8.9919 36.7213.492 8.9919 36.7213.492 8.9919 36.7213.492 8.9919 36.7213.492 8.9919 36.7213.492 8.9919 36.7213.492 8.9919 36.7213.492 8.9919 36.7213.492 8.9919 36.7213.492 8.9919 36.7213.492 8.9919 36.7213.492 8.9919 36.7213.492 8.9919 36.7213.492 8.9919 36.7213.492 8.9919 36.7213.492 8.9919 36.7213.492 8.9919 36.7213.492 8.9919 36.7213.492 8.9919 36.7213.492 8.9919 36.7213.492 8.9919 36.7213.492 8.9919 36.7213.492 8.9919 36.7213.492 8.9919 36.7213.492 8.9919 36.7213.492 8.9919 36.7213.492 8.9919 36.7213.492 8.9919 36.7213.492 8.9919 36.7213.492 8.9919 36.7213.492 8.9919 36.7213.492 8.9919 36.7213.492 8.9919 36.7213.492 8.9919 36.7213.492 8.9919 36.7213.492 8.9919 36.7213.492 8.9919 36.721

7/28/2019 My Seven Tools
http://slidepdf.com/reader/full/my-seven-tools 67/223
3.492 8.9919 36.7213.492 8.9919 36.7213.492 8.9919 36.7213.492 8.9919 36.7213.492 8.9919 36.7213.492 8.9919 36.721
3.492 8.9919 36.7213.492 8.9919 36.7213.492 8.9919 36.7213.492 8.9919 36.7213.492 8.9919 36.7213.492 8.9919 36.7213.492 8.9919 36.7213.492 8.9919 36.721

7/28/2019 My Seven Tools
http://slidepdf.com/reader/full/my-seven-tools 68/223
Value Table
X-CL X-UCL n A2 D4 D3
40.2933 43.8656 2 1.88 3.26740.2933 43.8656 3 1.023 2.57540.2933 43.8656 4 0.729 2.28240.2933 43.8656 5 0.577 2.11540.2933 43.8656 6 0.483 5.07840.2933 43.865640.2933 43.865640.2933 43.865640.2933 43.865640.2933 43.865640.2933 43.865640.2933 43.865640.2933 43.865640.2933 43.865640.2933 43.865640.2933 43.865640.2933 43.865640.2933 43.865640.2933 43.865640.2933 43.865640.2933 43.865640.2933 43.865640.2933 43.865640.2933 43.865640.2933 43.865640.2933 43.865640.2933 43.865640.2933 43.865640.2933 43.865640.2933 43.865640.2933 43.865640.2933 43.865640.2933 43.865640.2933 43.865640.2933 43.865640.2933 43.8656

7/28/2019 My Seven Tools
http://slidepdf.com/reader/full/my-seven-tools 69/223
40.2933 43.865640.2933 43.865640.2933 43.865640.2933 43.865640.2933 43.865640.2933 43.8656
40.2933 43.865640.2933 43.865640.2933 43.865640.2933 43.865640.2933 43.865640.2933 43.865640.2933 43.865640.2933 43.865640.2933 43.865640.2933 43.865640.2933 43.865640.2933 43.865640.2933 43.865640.2933 43.865640.2933 43.865640.2933 43.865640.2933 43.865640.2933 43.865640.2933 43.865640.2933 43.865640.2933 43.865640.2933 43.865640.2933 43.865640.2933 43.865640.2933 43.865640.2933 43.865640.2933 43.865640.2933 43.865640.2933 43.865640.2933 43.865640.2933 43.865640.2933 43.865640.2933 43.865640.2933 43.865640.2933 43.865640.2933 43.865640.2933 43.865640.2933 43.865640.2933 43.865640.2933 43.865640.2933 43.865640.2933 43.865640.2933 43.865640.2933 43.8656

7/28/2019 My Seven Tools
http://slidepdf.com/reader/full/my-seven-tools 70/223
40.2933 43.865640.2933 43.865640.2933 43.865640.2933 43.865640.2933 43.865640.2933 43.8656
40.2933 43.865640.2933 43.865640.2933 43.865640.2933 43.865640.2933 43.865640.2933 43.865640.2933 43.865640.2933 43.8656

7/28/2019 My Seven Tools
http://slidepdf.com/reader/full/my-seven-tools 71/223
CL 0.64828Size of Subgroup 1 1/3 ----
Number of Subgro 30Control
Limit ----
No.
Sample
Name X1No.
Sample
Name RsRun
1 1 24.2 1 1 --- ---2 2 23.3 2 2 0.9 +3 3 23.5 3 3 0.2 -4 4 23.2 4 4 0.3 -5 5 23.6 5 5 0.4 -6 6 23.1 6 6 0.5 -
7 7 22.2 7 7 0.9 +8 8 22.9 8 8 0.7 +9 9 22.8 9 9 0.1 -
10 10 23.9 10 10 1.1 +11 11 23.7 11 11 0.2 -12 12 22.9 12 12 0.8 +13 13 22.4 13 13 0.5 -14 14 24 14 14 1.6 +15 15 24.1 15 15 0.1 -16 16 23.3 16 16 0.8 +17 17 22.9 17 17 0.4 -18 18 22.1 18 18 0.8 +
19 19 22.8 19 19 0.7 +20 20 22.7 20 20 0.1 -21 21 21.5 21 21 1.2 +22 22 21.4 22 22 0.1 -23 23 22.7 23 23 1.3 +24 24 23.9 24 24 1.2 +25 25 23.1 25 25 0.8 +26 26 23.3 26 26 0.2 -27 27 22.6 27 27 0.7 +28 28 22.3 28 28 0.3 -29 29 23.8 29 29 1.5 +30 30 23.4 30 30 0.4 -31 3132 3233 3334 3435 3536 3637 3738 38
Input of Data Rs

7/28/2019 My Seven Tools
http://slidepdf.com/reader/full/my-seven-tools 72/223
39 3940 4041 4142 4243 4344 44
45 4546 4647 4748 4849 4950 5051 5152 5253 5354 5455 5556 5657 5758 5859 5960 6061 6162 6263 6364 6465 6566 6667 6768 6869 6970 7071 7172 7273 7374 7475 7576 7677 7778 7879 7980 8081 8182 8283 8384 8485 8586 8687 8788 88

7/28/2019 My Seven Tools
http://slidepdf.com/reader/full/my-seven-tools 73/223
89 8990 9091 9192 9293 9394 94
95 9596 9697 9798 9899 99
100 100101 101102 102103 103104 104105 105106 106107 107108 108109 109110 110111 111112 112113 113114 114115 115116 116117 117118 118119 119120 120121 121122 122123 123124 124125 125126 126127 127128 128129 129130 130131 131132 132133 133134 134135 135136 136137 137138 138

7/28/2019 My Seven Tools
http://slidepdf.com/reader/full/my-seven-tools 74/223
139 139140 140141 141142 142143 143144 144
145 145146 146147 147148 148149 149150 150151 151152 152153 153154 154155 155156 156157 157158 158159 159160 160161 161162 162163 163164 164165 165166 166167 167168 168169 169170 170171 171172 172173 173174 174175 175176 176177 177178 178179 179180 180181 181182 182183 183184 184185 185186 186187 187188 188

7/28/2019 My Seven Tools
http://slidepdf.com/reader/full/my-seven-tools 75/223
189 189190 190191 191192 192193 193194 194
195 195196 196197 197198 198199 199200 200
n = 1
UCL= 24.7777
CL= 23.0533
LCL= 21.3289
UCL= 2.11986
CL= 0.64828
LCL= Not Consi
X-Rs Control Chart
20
22
24
26
X
0
0.5
1
1.5
2
2.5
2 1 5
2 8
4 1
5 4
6 7
8 0
9 3
1 0 6
1 1 9
1 3 2
1 4 5
1 5 8
1 7 1
1 8 4
1 9 7
Rs
Subgroup No.Figure X-Rs Control Chart

7/28/2019 My Seven Tools
http://slidepdf.com/reader/full/my-seven-tools 76/223
Upper Lower Upper ---- CL 23.0533 ---- ----1.629333 1/3 ---- 21.9037 24.20294
2.119862Control
Limit ---- 21.3289 24.77775
Approach
to the
U er
Trend No.Sample
NameXbar Run
Approac
h to the
Lower
Approach
to the
Control--- --- 1 1 --- --- --- ---
- 2 2 23.3 +- 3 3 23.5 ++ 4 4 23.2 ++ 5 5 23.6 ++ 6 6 23.1 +
+ 7 7 22.2 -- 8 8 22.9 -- 9 9 22.8 -+ 10 10 23.9 +- 11 11 23.7 ++ 12 12 22.9 -- 13 13 22.4 -+ 14 14 24 +- 15 15 24.1 ++ 16 16 23.3 +- 17 17 22.9 -+ 18 18 22.1 -
- 19 19 22.8 -- 20 20 22.7 -+ 21 21 21.5 - -- 22 22 21.4 - -+ 23 23 22.7 -- 24 24 23.9 +- 25 25 23.1 +- 26 26 23.3 ++ 27 27 22.6 -- 28 28 22.3 -+ 29 29 23.8 +- 30 30 23.4 +
3132333435363738
X

7/28/2019 My Seven Tools
http://slidepdf.com/reader/full/my-seven-tools 77/223
394041424344
4546474849505152535455565758596061626364656667686970717273747576777879808182838485868788

7/28/2019 My Seven Tools
http://slidepdf.com/reader/full/my-seven-tools 78/223
899091929394
9596979899
100101102103104105106107108109110111112113114115116117118119120121122123124125126127128129130131132133134135136137138
7/28/2019 My Seven Tools
http://slidepdf.com/reader/full/my-seven-tools 79/223
139140141142143144
145146147148149150151152153154155156157158159160161162163164165166167168169170171172173174175176177178179180181182183184185186187188

7/28/2019 My Seven Tools
http://slidepdf.com/reader/full/my-seven-tools 80/223

7/28/2019 My Seven Tools
http://slidepdf.com/reader/full/my-seven-tools 81/223
TrendRs-CL Rs-UCL X-LCL X-Cl X-UCL
--- 0.64828 2.11986 21.3289 23.0533 24.7777- 0.64828 2.11986 21.3289 23.0533 24.7777+ 0.64828 2.11986 21.3289 23.0533 24.7777- 0.64828 2.11986 21.3289 23.0533 24.7777+ 0.64828 2.11986 21.3289 23.0533 24.7777- 0.64828 2.11986 21.3289 23.0533 24.7777
- 0.64828 2.11986 21.3289 23.0533 24.7777+ 0.64828 2.11986 21.3289 23.0533 24.7777- 0.64828 2.11986 21.3289 23.0533 24.7777+ 0.64828 2.11986 21.3289 23.0533 24.7777- 0.64828 2.11986 21.3289 23.0533 24.7777- 0.64828 2.11986 21.3289 23.0533 24.7777- 0.64828 2.11986 21.3289 23.0533 24.7777+ 0.64828 2.11986 21.3289 23.0533 24.7777+ 0.64828 2.11986 21.3289 23.0533 24.7777- 0.64828 2.11986 21.3289 23.0533 24.7777- 0.64828 2.11986 21.3289 23.0533 24.7777- 0.64828 2.11986 21.3289 23.0533 24.7777
+ 0.64828 2.11986 21.3289 23.0533 24.7777- 0.64828 2.11986 21.3289 23.0533 24.7777- 0.64828 2.11986 21.3289 23.0533 24.7777- 0.64828 2.11986 21.3289 23.0533 24.7777+ 0.64828 2.11986 21.3289 23.0533 24.7777+ 0.64828 2.11986 21.3289 23.0533 24.7777- 0.64828 2.11986 21.3289 23.0533 24.7777+ 0.64828 2.11986 21.3289 23.0533 24.7777- 0.64828 2.11986 21.3289 23.0533 24.7777- 0.64828 2.11986 21.3289 23.0533 24.7777+ 0.64828 2.11986 21.3289 23.0533 24.7777- 0.64828 2.11986 21.3289 23.0533 24.7777
0.64828 2.11986 21.3289 23.0533 24.77770.64828 2.11986 21.3289 23.0533 24.77770.64828 2.11986 21.3289 23.0533 24.77770.64828 2.11986 21.3289 23.0533 24.77770.64828 2.11986 21.3289 23.0533 24.77770.64828 2.11986 21.3289 23.0533 24.77770.64828 2.11986 21.3289 23.0533 24.77770.64828 2.11986 21.3289 23.0533 24.7777
Calculation Table

7/28/2019 My Seven Tools
http://slidepdf.com/reader/full/my-seven-tools 82/223
0.64828 2.11986 21.3289 23.0533 24.77770.64828 2.11986 21.3289 23.0533 24.77770.64828 2.11986 21.3289 23.0533 24.77770.64828 2.11986 21.3289 23.0533 24.77770.64828 2.11986 21.3289 23.0533 24.77770.64828 2.11986 21.3289 23.0533 24.7777
0.64828 2.11986 21.3289 23.0533 24.77770.64828 2.11986 21.3289 23.0533 24.77770.64828 2.11986 21.3289 23.0533 24.77770.64828 2.11986 21.3289 23.0533 24.77770.64828 2.11986 21.3289 23.0533 24.77770.64828 2.11986 21.3289 23.0533 24.77770.64828 2.11986 21.3289 23.0533 24.77770.64828 2.11986 21.3289 23.0533 24.77770.64828 2.11986 21.3289 23.0533 24.77770.64828 2.11986 21.3289 23.0533 24.77770.64828 2.11986 21.3289 23.0533 24.77770.64828 2.11986 21.3289 23.0533 24.77770.64828 2.11986 21.3289 23.0533 24.77770.64828 2.11986 21.3289 23.0533 24.77770.64828 2.11986 21.3289 23.0533 24.77770.64828 2.11986 21.3289 23.0533 24.77770.64828 2.11986 21.3289 23.0533 24.77770.64828 2.11986 21.3289 23.0533 24.77770.64828 2.11986 21.3289 23.0533 24.77770.64828 2.11986 21.3289 23.0533 24.77770.64828 2.11986 21.3289 23.0533 24.77770.64828 2.11986 21.3289 23.0533 24.77770.64828 2.11986 21.3289 23.0533 24.77770.64828 2.11986 21.3289 23.0533 24.77770.64828 2.11986 21.3289 23.0533 24.77770.64828 2.11986 21.3289 23.0533 24.77770.64828 2.11986 21.3289 23.0533 24.77770.64828 2.11986 21.3289 23.0533 24.77770.64828 2.11986 21.3289 23.0533 24.77770.64828 2.11986 21.3289 23.0533 24.77770.64828 2.11986 21.3289 23.0533 24.77770.64828 2.11986 21.3289 23.0533 24.77770.64828 2.11986 21.3289 23.0533 24.77770.64828 2.11986 21.3289 23.0533 24.77770.64828 2.11986 21.3289 23.0533 24.77770.64828 2.11986 21.3289 23.0533 24.77770.64828 2.11986 21.3289 23.0533 24.77770.64828 2.11986 21.3289 23.0533 24.77770.64828 2.11986 21.3289 23.0533 24.77770.64828 2.11986 21.3289 23.0533 24.77770.64828 2.11986 21.3289 23.0533 24.77770.64828 2.11986 21.3289 23.0533 24.77770.64828 2.11986 21.3289 23.0533 24.77770.64828 2.11986 21.3289 23.0533 24.7777

7/28/2019 My Seven Tools
http://slidepdf.com/reader/full/my-seven-tools 83/223
0.64828 2.11986 21.3289 23.0533 24.77770.64828 2.11986 21.3289 23.0533 24.77770.64828 2.11986 21.3289 23.0533 24.77770.64828 2.11986 21.3289 23.0533 24.77770.64828 2.11986 21.3289 23.0533 24.77770.64828 2.11986 21.3289 23.0533 24.7777
0.64828 2.11986 21.3289 23.0533 24.77770.64828 2.11986 21.3289 23.0533 24.77770.64828 2.11986 21.3289 23.0533 24.77770.64828 2.11986 21.3289 23.0533 24.77770.64828 2.11986 21.3289 23.0533 24.77770.64828 2.11986 21.3289 23.0533 24.77770.64828 2.11986 21.3289 23.0533 24.77770.64828 2.11986 21.3289 23.0533 24.77770.64828 2.11986 21.3289 23.0533 24.77770.64828 2.11986 21.3289 23.0533 24.77770.64828 2.11986 21.3289 23.0533 24.77770.64828 2.11986 21.3289 23.0533 24.77770.64828 2.11986 21.3289 23.0533 24.77770.64828 2.11986 21.3289 23.0533 24.77770.64828 2.11986 21.3289 23.0533 24.77770.64828 2.11986 21.3289 23.0533 24.77770.64828 2.11986 21.3289 23.0533 24.77770.64828 2.11986 21.3289 23.0533 24.77770.64828 2.11986 21.3289 23.0533 24.77770.64828 2.11986 21.3289 23.0533 24.77770.64828 2.11986 21.3289 23.0533 24.77770.64828 2.11986 21.3289 23.0533 24.77770.64828 2.11986 21.3289 23.0533 24.77770.64828 2.11986 21.3289 23.0533 24.77770.64828 2.11986 21.3289 23.0533 24.77770.64828 2.11986 21.3289 23.0533 24.77770.64828 2.11986 21.3289 23.0533 24.77770.64828 2.11986 21.3289 23.0533 24.77770.64828 2.11986 21.3289 23.0533 24.77770.64828 2.11986 21.3289 23.0533 24.77770.64828 2.11986 21.3289 23.0533 24.77770.64828 2.11986 21.3289 23.0533 24.77770.64828 2.11986 21.3289 23.0533 24.77770.64828 2.11986 21.3289 23.0533 24.77770.64828 2.11986 21.3289 23.0533 24.77770.64828 2.11986 21.3289 23.0533 24.77770.64828 2.11986 21.3289 23.0533 24.77770.64828 2.11986 21.3289 23.0533 24.77770.64828 2.11986 21.3289 23.0533 24.77770.64828 2.11986 21.3289 23.0533 24.77770.64828 2.11986 21.3289 23.0533 24.77770.64828 2.11986 21.3289 23.0533 24.77770.64828 2.11986 21.3289 23.0533 24.77770.64828 2.11986 21.3289 23.0533 24.7777

7/28/2019 My Seven Tools
http://slidepdf.com/reader/full/my-seven-tools 84/223
0.64828 2.11986 21.3289 23.0533 24.77770.64828 2.11986 21.3289 23.0533 24.77770.64828 2.11986 21.3289 23.0533 24.77770.64828 2.11986 21.3289 23.0533 24.77770.64828 2.11986 21.3289 23.0533 24.77770.64828 2.11986 21.3289 23.0533 24.7777
0.64828 2.11986 21.3289 23.0533 24.77770.64828 2.11986 21.3289 23.0533 24.77770.64828 2.11986 21.3289 23.0533 24.77770.64828 2.11986 21.3289 23.0533 24.77770.64828 2.11986 21.3289 23.0533 24.77770.64828 2.11986 21.3289 23.0533 24.77770.64828 2.11986 21.3289 23.0533 24.77770.64828 2.11986 21.3289 23.0533 24.77770.64828 2.11986 21.3289 23.0533 24.77770.64828 2.11986 21.3289 23.0533 24.77770.64828 2.11986 21.3289 23.0533 24.77770.64828 2.11986 21.3289 23.0533 24.77770.64828 2.11986 21.3289 23.0533 24.77770.64828 2.11986 21.3289 23.0533 24.77770.64828 2.11986 21.3289 23.0533 24.77770.64828 2.11986 21.3289 23.0533 24.77770.64828 2.11986 21.3289 23.0533 24.77770.64828 2.11986 21.3289 23.0533 24.77770.64828 2.11986 21.3289 23.0533 24.77770.64828 2.11986 21.3289 23.0533 24.77770.64828 2.11986 21.3289 23.0533 24.77770.64828 2.11986 21.3289 23.0533 24.77770.64828 2.11986 21.3289 23.0533 24.77770.64828 2.11986 21.3289 23.0533 24.77770.64828 2.11986 21.3289 23.0533 24.77770.64828 2.11986 21.3289 23.0533 24.77770.64828 2.11986 21.3289 23.0533 24.77770.64828 2.11986 21.3289 23.0533 24.77770.64828 2.11986 21.3289 23.0533 24.77770.64828 2.11986 21.3289 23.0533 24.77770.64828 2.11986 21.3289 23.0533 24.77770.64828 2.11986 21.3289 23.0533 24.77770.64828 2.11986 21.3289 23.0533 24.77770.64828 2.11986 21.3289 23.0533 24.77770.64828 2.11986 21.3289 23.0533 24.77770.64828 2.11986 21.3289 23.0533 24.77770.64828 2.11986 21.3289 23.0533 24.77770.64828 2.11986 21.3289 23.0533 24.77770.64828 2.11986 21.3289 23.0533 24.77770.64828 2.11986 21.3289 23.0533 24.77770.64828 2.11986 21.3289 23.0533 24.77770.64828 2.11986 21.3289 23.0533 24.77770.64828 2.11986 21.3289 23.0533 24.77770.64828 2.11986 21.3289 23.0533 24.7777

7/28/2019 My Seven Tools
http://slidepdf.com/reader/full/my-seven-tools 85/223
0.64828 2.11986 21.3289 23.0533 24.77770.64828 2.11986 21.3289 23.0533 24.77770.64828 2.11986 21.3289 23.0533 24.77770.64828 2.11986 21.3289 23.0533 24.77770.64828 2.11986 21.3289 23.0533 24.77770.64828 2.11986 21.3289 23.0533 24.7777
0.64828 2.11986 21.3289 23.0533 24.77770.64828 2.11986 21.3289 23.0533 24.77770.64828 2.11986 21.3289 23.0533 24.77770.64828 2.11986 21.3289 23.0533 24.77770.64828 2.11986 21.3289 23.0533 24.77770.64828 2.11986 21.3289 23.0533 24.7777

7/28/2019 My Seven Tools
http://slidepdf.com/reader/full/my-seven-tools 86/223
Input of Data
Category Category Category Category4Category Name X1 X2 X3 X4
Sample Size 50 50 50 50
The Largest Value 112 109 112 110
The Smallest Valu 95 93 93 94
1 101 101 101 105
2 99 103 106 1063 102 104 103 1014 110 107 104 1035 106 100 103 1046 101 101 104 1057 107 106 107 1038 102 109 103 1059 99 104 102 104
10 100 98 106 101
11 104 101 100 10212 106 106 103 10513 100 106 103 10514 108 100 104 10215 98 98 104 10216 105 107 104 10317 102 99 100 10218 105 101 105 10819 109 107 102 9920 105 104 101 103
21 105 96 104 103
22 104 100 97 9923 103 102 100 99
24 100 108 102 10625 102 103 108 10226 100 98 98 9827 99 95 106 9728 95 102 104 10629 104 99 104 10130 102 93 103 10031 101 98 104 9732 101 97 96 10033 112 97 111 110
34 95 105 103 98
35 101 96 101 10436 99 98 99 10437 110 99 99 10738 103 96 103 10039 96 101 93 9940 105 103 100 10341 103 97 105 10642 102 106 101 10343 99 95 112 10944 102 103 100 102

7/28/2019 My Seven Tools
http://slidepdf.com/reader/full/my-seven-tools 87/223
45 108 102 103 96
46 101 95 102 100
47 97 97 97 10248 97 101 106 9849 100 96 94 9450 99 101 100 100

7/28/2019 My Seven Tools
http://slidepdf.com/reader/full/my-seven-tools 88/223

7/28/2019 My Seven Tools
http://slidepdf.com/reader/full/my-seven-tools 89/223

7/28/2019 My Seven Tools
http://slidepdf.com/reader/full/my-seven-tools 90/223

7/28/2019 My Seven Tools
http://slidepdf.com/reader/full/my-seven-tools 91/223

7/28/2019 My Seven Tools
http://slidepdf.com/reader/full/my-seven-tools 92/223

7/28/2019 My Seven Tools
http://slidepdf.com/reader/full/my-seven-tools 93/223

7/28/2019 My Seven Tools
http://slidepdf.com/reader/full/my-seven-tools 94/223
Determination of the Class Interval
Sample Size(Overall) 200
The Largest Value(Overall) 112
The Smallest Value(Overall) 93
Determine the Class IntervalInput Sample Size 200Input The Largest Value 112 -4 ~ 86.5Input The Smallest Value 93 -3 86.5 ~ 88.5 87.5The Rough Number of Classes 14.1 -2 88.5 ~ 90.5 89.5
Input the Rough Number of Classes 14 -1 90.5 ~ 92.5 91.5The Rough Standard of the Class Inter 1.35714 1 92.5 ~ 94.5 93.5Input the Unit of Measurement 1 2 94.5 ~ 96.5 95.5Input the Class Interval 2 3 96.5 ~ 98.5 97.5
4 98.5 ~ 100.5 99.5Input the Lower Specification Limit SL 90 5 100.5 ~ 102.5 101.5Input the Upper Specification Limit SU 110 6 102.5 ~ 104.5 103.5
7 104.5 ~ 106.5 105.58 106.5 ~ 108.5 107.59 108.5 ~ 110.5 109.5
10 110.5 ~ 112.5 111.511 112.5 ~ 114.5 113.512 114.5 ~ 116.5 115.513 116.5 ~ 118.5 117.5
14 118.5 ~ 120.5 119.5
15 120.5 ~ 122.5 121.516 122.5 ~ 124.5 123.5
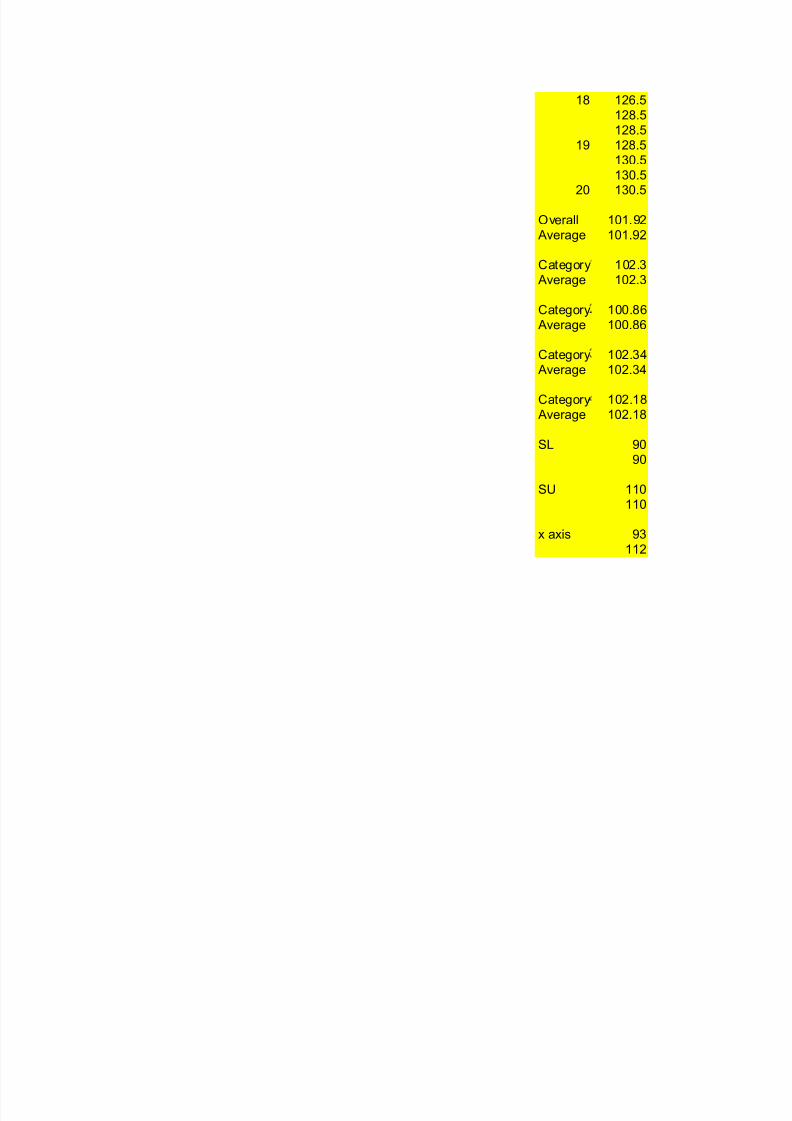
17 124.5 ~ 126.5 125.518 126.5 ~ 128.5 127.519 128.5 ~ 130.5 129.5
20 130.5 ~
No Class
requency Tabl
Mid-
Point of
Class
Total

7/28/2019 My Seven Tools
http://slidepdf.com/reader/full/my-seven-tools 95/223

7/28/2019 My Seven Tools
http://slidepdf.com/reader/full/my-seven-tools 96/223

7/28/2019 My Seven Tools
http://slidepdf.com/reader/full/my-seven-tools 97/223

7/28/2019 My Seven Tools
http://slidepdf.com/reader/full/my-seven-tools 98/223

7/28/2019 My Seven Tools
http://slidepdf.com/reader/full/my-seven-tools 99/223
86.5-3 86.5
88.588.5
-2 88.590.590.5
Use for

7/28/2019 My Seven Tools
http://slidepdf.com/reader/full/my-seven-tools 100/223
-1 90.592.592.5
1 92.594.594.5
2 94.596.596.5
3 96.598.598.5
4 98.5100.5100.5
5 100.5102.5102.5
6 102.5104.5104.5
7 104.5106.5106.5
8 106.5108.5108.5
9 108.5110.5110.5
10 110.5112.5112.5
11 112.5114.5114.5
12 114.5116.5116.5
13 116.5118.5118.5
14 118.5120.5120.5
15 120.5
122.5122.5
16 122.5124.5124.5
17 124.5126.5126.5
7/28/2019 My Seven Tools
http://slidepdf.com/reader/full/my-seven-tools 101/223
18 126.5128.5128.5
19 128.5130.5130.5
20 130.5
Overall 101.92 Average 101.92
Category 102.3 Average 102.3
Category 100.86 Average 100.86
Category 102.34 Average 102.34
Category 102.18 Average 102.18
SL 9090
SU 110110
x axis 93112

7/28/2019 My Seven Tools
http://slidepdf.com/reader/full/my-seven-tools 102/223
Overall
Category Category Category Category Overall OverallX1 X2 X3 X4 Overall No Mid-PointFrequency f
0 0 0 0 0 -4 00 0 0 0 0 -3 87.5 00 0 0 0 0 -2 89.5 0
0 0 0 0 0 -1 91.5 00 1 2 1 4 1 93.5 43 7 1 1 12 2 95.5 123 9 3 5 20 3 97.5 20
11 6 8 9 34 4 99.5 3413 10 8 10 41 5 101.5 41
6 7 18 11 42 6 103.5 427 5 6 9 27 7 105.5 273 4 2 2 11 8 107.5 113 1 0 2 6 9 109.5 61 0 2 0 3 10 111.5 30 0 0 0 0 11 113.5 00 0 0 0 0 12 115.5 00 0 0 0 0 13 117.5 0
0 0 0 0 0 14 119.5 0
0 0 0 0 0 15 121.5 00 0 0 0 0 16 123.5 0
0 0 0 0 0 17 125.5 00 0 0 0 0 18 127.5 00 0 0 0 0 19 129.5 0
0 0 0 0 0 20 050 50 50 50 200 200
x(0)Sample SizeMean ValueStandard Deviation
Calculation Table
Frequency
Total

7/28/2019 My Seven Tools
http://slidepdf.com/reader/full/my-seven-tools 103/223

7/28/2019 My Seven Tools
http://slidepdf.com/reader/full/my-seven-tools 104/223

7/28/2019 My Seven Tools
http://slidepdf.com/reader/full/my-seven-tools 105/223

7/28/2019 My Seven Tools
http://slidepdf.com/reader/full/my-seven-tools 106/223

7/28/2019 My Seven Tools
http://slidepdf.com/reader/full/my-seven-tools 107/223
Category Category Category Category Overall0 0 0 0 00 0 0 0 00 0 0 0 00 0 0 0 00 0 0 0 00 0 0 0 00 0 0 0 0
Figure

7/28/2019 My Seven Tools
http://slidepdf.com/reader/full/my-seven-tools 108/223
0 0 0 0 00 0 0 0 00 0 0 0 00 1 2 1 40 1 2 1 40 0 0 0 0
3 7 1 1 123 7 1 1 120 0 0 0 03 9 3 5 203 9 3 5 200 0 0 0 0
11 6 8 9 3411 6 8 9 34
0 0 0 0 013 10 8 10 4113 10 8 10 41
0 0 0 0 06 7 18 11 426 7 18 11 420 0 0 0 07 5 6 9 277 5 6 9 270 0 0 0 03 4 2 2 113 4 2 2 110 0 0 0 03 1 0 2 63 1 0 2 60 0 0 0 01 0 2 0 31 0 2 0 30 0 0 0 00 0 0 0 00 0 0 0 00 0 0 0 00 0 0 0 00 0 0 0 00 0 0 0 00 0 0 0 00 0 0 0 00 0 0 0 00 0 0 0 00 0 0 0 00 0 0 0 00 0 0 0 0
0 0 0 0 00 0 0 0 00 0 0 0 00 0 0 0 00 0 0 0 00 0 0 0 00 0 0 0 00 0 0 0 0

7/28/2019 My Seven Tools
http://slidepdf.com/reader/full/my-seven-tools 109/223
0 0 0 0 00 0 0 0 00 0 0 0 00 0 0 0 00 0 0 0 00 0 0 0 0
0 0 0 0 0
048
020
020
020
020
0 0 0 0 020 20 20 20 40
0 0 0 0 020 20 20 20 40

7/28/2019 My Seven Tools
http://slidepdf.com/reader/full/my-seven-tools 110/223
Category1
X1X fX fX2 No Mid-PointFrequency f X fX fX2
0 0 -4 0 0 0-2 0 0 -3 87.5 0 -2 0 0-1 0 0 -2 89.5 0 -1 0 0
0 0 0 -1 91.5 0 0 0 01 4 4 1 93.5 0 1 0 02 24 48 2 95.5 3 2 6 123 60 180 3 97.5 3 3 9 27
4 136 544 4 99.5 11 4 44 1765 205 1025 5 101.5 13 5 65 3256 252 1512 6 103.5 6 6 36 2167 189 1323 7 105.5 7 7 49 3438 88 704 8 107.5 3 8 24 1929 54 486 9 109.5 3 9 27 243
10 30 300 10 111.5 1 10 10 10011 0 0 11 113.5 0 11 0 012 0 0 12 115.5 0 12 0 013 0 0 13 117.5 0 13 0 0
14 0 0 14 119.5 0 14 0 0
15 0 0 15 121.5 0 15 0 016 0 0 16 123.5 0 16 0 0
17 0 0 17 125.5 0 17 0 018 0 0 18 127.5 0 18 0 019 0 0 19 129.5 0 19 0 0
20 01042 6126 50 270 1634
91.5 x(0) 91.5200 Sample Size 50
101.92 Mean Value 102.33.74348 Standard Deviation 3.7904
合計

7/28/2019 My Seven Tools
http://slidepdf.com/reader/full/my-seven-tools 111/223

7/28/2019 My Seven Tools
http://slidepdf.com/reader/full/my-seven-tools 112/223

7/28/2019 My Seven Tools
http://slidepdf.com/reader/full/my-seven-tools 113/223

7/28/2019 My Seven Tools
http://slidepdf.com/reader/full/my-seven-tools 114/223

7/28/2019 My Seven Tools
http://slidepdf.com/reader/full/my-seven-tools 115/223

7/28/2019 My Seven Tools
http://slidepdf.com/reader/full/my-seven-tools 116/223

7/28/2019 My Seven Tools
http://slidepdf.com/reader/full/my-seven-tools 117/223

7/28/2019 My Seven Tools
http://slidepdf.com/reader/full/my-seven-tools 118/223
Category2 Category3
X2 X3No Mid-PointFrequency f X fX fX2 No Mid-Point
-4 0 0 0 -4-3 87.5 0 -2 0 0 -3 87.5-2 89.5 0 -1 0 0 -2 89.5
-1 91.5 0 0 0 0 -1 91.51 93.5 1 1 1 1 1 93.52 95.5 7 2 14 28 2 95.53 97.5 9 3 27 81 3 97.5
4 99.5 6 4 24 96 4 99.55 101.5 10 5 50 250 5 101.56 103.5 7 6 42 252 6 103.57 105.5 5 7 35 245 7 105.58 107.5 4 8 32 256 8 107.59 109.5 1 9 9 81 9 109.5
10 111.5 0 10 0 0 10 111.511 113.5 0 11 0 0 11 113.512 115.5 0 12 0 0 12 115.513 117.5 0 13 0 0 13 117.5
14 119.5 0 14 0 0 14 119.5
15 121.5 0 15 0 0 15 121.516 123.5 0 16 0 0 16 123.5
17 125.5 0 17 0 0 17 125.518 127.5 0 18 0 0 18 127.519 129.5 0 19 0 0 19 129.5
20 0 2050 234 1290
x(0) 91.5 x(0)Sample Size 50 Sample SizeMean Value 100.86 Mean ValueStandard Deviation 3.98856 Standard Deviation
合計 合計

7/28/2019 My Seven Tools
http://slidepdf.com/reader/full/my-seven-tools 119/223

7/28/2019 My Seven Tools
http://slidepdf.com/reader/full/my-seven-tools 120/223

7/28/2019 My Seven Tools
http://slidepdf.com/reader/full/my-seven-tools 121/223

7/28/2019 My Seven Tools
http://slidepdf.com/reader/full/my-seven-tools 122/223

7/28/2019 My Seven Tools
http://slidepdf.com/reader/full/my-seven-tools 123/223

7/28/2019 My Seven Tools
http://slidepdf.com/reader/full/my-seven-tools 124/223

7/28/2019 My Seven Tools
http://slidepdf.com/reader/full/my-seven-tools 125/223

7/28/2019 My Seven Tools
http://slidepdf.com/reader/full/my-seven-tools 126/223
Category4
X4requency X fX fX2 No Mid-Point requency X fX
0 0 0 -4 0 00 -2 0 0 -3 87.5 0 -2 00 -1 0 0 -2 89.5 0 -1 0
0 0 0 0 -1 91.5 0 0 02 1 2 2 1 93.5 1 1 11 2 2 4 2 95.5 1 2 23 3 9 27 3 97.5 5 3 15
8 4 32 128 4 99.5 9 4 368 5 40 200 5 101.5 10 5 50
18 6 108 648 6 103.5 11 6 666 7 42 294 7 105.5 9 7 632 8 16 128 8 107.5 2 8 160 9 0 0 9 109.5 2 9 182 10 20 200 10 111.5 0 10 00 11 0 0 11 113.5 0 11 00 12 0 0 12 115.5 0 12 00 13 0 0 13 117.5 0 13 0
0 14 0 0 14 119.5 0 14 0
0 15 0 0 15 121.5 0 15 00 16 0 0 16 123.5 0 16 0
0 17 0 0 17 125.5 0 17 00 18 0 0 18 127.5 0 18 00 19 0 0 19 129.5 0 19 0
0 20 050 271 1631 50 267
91.5 x(0) 91.550 Sample Size 50
102.34 Mean Value 102.183.63857 Standard Deviation 3.44306
合計

7/28/2019 My Seven Tools
http://slidepdf.com/reader/full/my-seven-tools 127/223

7/28/2019 My Seven Tools
http://slidepdf.com/reader/full/my-seven-tools 128/223

7/28/2019 My Seven Tools
http://slidepdf.com/reader/full/my-seven-tools 129/223

7/28/2019 My Seven Tools
http://slidepdf.com/reader/full/my-seven-tools 130/223

7/28/2019 My Seven Tools
http://slidepdf.com/reader/full/my-seven-tools 131/223

7/28/2019 My Seven Tools
http://slidepdf.com/reader/full/my-seven-tools 132/223

7/28/2019 My Seven Tools
http://slidepdf.com/reader/full/my-seven-tools 133/223

7/28/2019 My Seven Tools
http://slidepdf.com/reader/full/my-seven-tools 134/223
fX2000
014
45
144250396441128162
0000
0
00
000
1571
Overall Histogram
0
5
10
15
20
25
80 90 100 110 120
SL
SU
0
5
10
15
20
25
80 90 100 110 120
SL SU
0
10
20
30
40
50
80 100 120
Figure Overall Histogram
SL
SU
Overall
n = 200
Xbar 101.9
s = 3.74
X4
n = 50
Xbar 102.2
s = 3.44
X3
n = 50
Xbar 102.3
s = 3.639

7/28/2019 My Seven Tools
http://slidepdf.com/reader/full/my-seven-tools 135/223
Stratified Histogram
0
510
15
20
25
80 100 120
SL SU
0
5
10
15
20
25
80 100 120
Figure Stratified Histogram
SL SU
X2
n = 50
Xbar 100.9
s = 3.99
X1
n = 50
Xbar 102.3
s = 3.79

7/28/2019 My Seven Tools
http://slidepdf.com/reader/full/my-seven-tools 136/223

7/28/2019 My Seven Tools
http://slidepdf.com/reader/full/my-seven-tools 137/223

7/28/2019 My Seven Tools
http://slidepdf.com/reader/full/my-seven-tools 138/223

7/28/2019 My Seven Tools
http://slidepdf.com/reader/full/my-seven-tools 139/223

7/28/2019 My Seven Tools
http://slidepdf.com/reader/full/my-seven-tools 140/223

7/28/2019 My Seven Tools
http://slidepdf.com/reader/full/my-seven-tools 141/223

7/28/2019 My Seven Tools
http://slidepdf.com/reader/full/my-seven-tools 142/223
OverallHeight of Xbar 48 n 200Height of SL 40 Xbar 101.9Height of SU 40 s 3.74Xbar : Number of Decim 2s : Number of Decimals 2
X4Height of Xbar 20 n 50Height of SL 20 Xbar 102.2
Height of SU 20 s 3.44Xbar : Number of Decim 2s : Number of Decimals 2
X3Height of Xbar 20 n 50Height of SL 20 Xbar 102.3Height of SU 20 s 3.639Xbar : Number of Decim 2s : Number of Decimals 2
Ajust Figure
Ajust Figure
Ajust Figure

7/28/2019 My Seven Tools
http://slidepdf.com/reader/full/my-seven-tools 143/223
X2Height of Xbar 20 n 50Height of SL 20 Xbar 100.9Height of SU 20 s 3.99Xbar : Number of Decim 2
s : Number of Decimals 2
X1Height of Xbar 20 n 50Height of SL 20 Xbar 102.3Height of SU 20 s 3.79Xbar : Number of Decim 2s : Number of Decimals 2
Ajust Figure
Ajust Figure

7/28/2019 My Seven Tools
http://slidepdf.com/reader/full/my-seven-tools 144/223
Size of Subgroup 4
Number of Subgro 50
NoSample
NameX1 X2 X3 X4 X5 X6
1 1 101 101 101 1052 2 99 103 106 1063 3 102 104 103 1014 4 110 107 104 1035 5 106 100 103 1046 6 101 101 104 1057 7 107 106 107 1038 8 102 109 103 1059 9 99 104 102 104
10 10 100 98 106 10111 11 104 101 100 10212 12 106 106 103 10513 13 100 106 103 10514 14 108 100 104 10215 15 98 98 104 10216 16 105 107 104 10317 17 102 99 100 10218 18 105 101 105 10819 19 109 107 102 9920 20 105 104 101 10321 21 105 96 104 10322 22 104 100 97 9923 23 103 102 100 9924 24 100 108 102 10625 25 102 103 108 10226 26 100 98 98 9827 27 99 95 106 9728 28
95 102 104 10629 29 104 99 104 10130 30 102 93 103 10031 31 101 98 104 9732 32 101 97 96 10033 33 112 97 111 11034 34 95 105 103 9835 35 101 96 101 10436 36 99 98 99 104
Input of Data

7/28/2019 My Seven Tools
http://slidepdf.com/reader/full/my-seven-tools 145/223
37 37 110 99 99 10738 38 103 96 103 10039 39 96 101 93 9940 40 105 103 100 10341 41 103 97 105 10642 42 102 106 101 103
43 43 99 95 112 10944 44 102 103 100 10245 45 108 102 103 9646 46 101 95 102 10047 47 97 97 97 10248 48 97 101 106 9849 49 100 96 94 9450 50 99 101 100 100
n = 4
UCL= 106.8872
CL= 101.93
LCL= 96.9728
UCL= 15.5176
CL= 6.8
LCL= Not Considere
Xbar-R Control Chart
90
95
100
105
110
X
0
5
10
15
20
1 5 9 1 3
1 7
2 1
2 5
2 9
3 3
3 7
4 1
4 5
4 9
R
Subgroup No.Figure Xbar-R Control Chart

7/28/2019 My Seven Tools
http://slidepdf.com/reader/full/my-seven-tools 146/223
Lower Upper CL(Rbar) 6.8 ---- ----
1/3 ---- 12.61173
Control
Limit ---- 15.5176
NoSample
NameR Run
pproac
to the
Lower
Control
Limit
pproac
to the
Upper
Control
Limit
Trend NoSample
Name
1 1 4 - 1 12 2 7 + + 2 23 3 3 - - 3 34 4 7 + + 4 45 5 6 - - 5 56 6 4 - - 6 67 7 4 - - 7 78 8 7 + + 8 89 9 5 - - 9 9
10 10 8 + + 10 1011 11 4 - - 11 1112 12 3 - - 12 1213 13 6 - + 13 1314 14 8 + + 14 1415 15 6 - - 15 1516 16 4 - - 16 1617 17 3 - - 17 1718 18 7 + + 18 1819 19 10 + + 19 1920 20 4 - - 20 2021 21 9 + + 21 2122 22 7 + - 22 2223 23 4 - - 23 2324 24 8 + + 24 2425 25 6 - - 25 2526 26 2 - - 26 2627 27 11 + + 27 2728 28 11 + - 28 2829 29 5 - - 29 2930 30 10 + + 30 3031 31 7 + - 31 3132 32 5 - - 32 3233 33 15 + + + 33 3334 34 10 + - 34 3435 35 8 + - 35 3536 36 6 - - 36 36
R

7/28/2019 My Seven Tools
http://slidepdf.com/reader/full/my-seven-tools 147/223
37 37 11 + + 37 3738 38 7 + - 38 3839 39 8 + + 39 3940 40 5 - - 40 4041 41 9 + + 41 4142 42 5 - - 42 42
43 43 17 + + + + 43 4344 44 3 - - 44 4445 45 12 + + 45 4546 46 7 + - 46 4647 47 5 - - 47 4748 48 9 + + 48 4849 49 6 - - 49 4950 50 2 - - 50 50

7/28/2019 My Seven Tools
http://slidepdf.com/reader/full/my-seven-tools 148/223
7/28/2019 My Seven Tools
http://slidepdf.com/reader/full/my-seven-tools 149/223
103.75 + + 6.8 15.5176 96.9728100.5 - - 6.8 15.5176 96.972897.25 - - - 6.8 15.5176 96.9728
102.75 + + 6.8 15.5176 96.9728102.75 + - 6.8 15.5176 96.9728
103 + + 6.8 15.5176 96.9728
103.75 + + 6.8 15.5176 96.9728101.75 - - 6.8 15.5176 96.9728102.25 + + 6.8 15.5176 96.9728
99.5 - - 6.8 15.5176 96.972898.25 - - - 6.8 15.5176 96.9728100.5 - + 6.8 15.5176 96.9728
96 - - - - 6.8 15.5176 96.9728100 - + 6.8 15.5176 96.9728

7/28/2019 My Seven Tools
http://slidepdf.com/reader/full/my-seven-tools 150/223
Value Table
X-CL X-UCL n A2 D4 D3
101.93 106.887 2 1.88 3.267101.93 106.887 3 1.023 2.575101.93 106.887 4 0.729 2.282101.93 106.887 5 0.577 2.115101.93 106.887 6 0.483 5.078101.93 106.887101.93 106.887101.93 106.887101.93 106.887101.93 106.887101.93 106.887101.93 106.887101.93 106.887101.93 106.887101.93 106.887101.93 106.887101.93 106.887101.93 106.887101.93 106.887101.93 106.887101.93 106.887101.93 106.887101.93 106.887101.93 106.887101.93 106.887101.93 106.887101.93 106.887101.93 106.887101.93 106.887101.93 106.887101.93 106.887101.93 106.887101.93 106.887101.93 106.887101.93 106.887101.93 106.887

7/28/2019 My Seven Tools
http://slidepdf.com/reader/full/my-seven-tools 151/223
101.93 106.887101.93 106.887101.93 106.887101.93 106.887101.93 106.887101.93 106.887
101.93 106.887101.93 106.887101.93 106.887101.93 106.887101.93 106.887101.93 106.887101.93 106.887101.93 106.887

7/28/2019 My Seven Tools
http://slidepdf.com/reader/full/my-seven-tools 152/223
Input of Data
Category Category Category Category4Category Name A1 A2
Sample Size 100 100 0 0
The Largest Value 110 112
The Smallest Valu 96 93
1 101 100
2 99 993 102 954 110 1045 106 1026 101 101
7 107 1018 102 1129 99 95
10 100 101
11 104 9912 106 11013 100 10314 108 9615 98 10516 105 10317 102 10218 105 9919 109 10220 105 108
21 105 101
22 104 9723 103 97
24 100 10025 102 9926 101 98
27 103 9528 104 10229 107 9930 100 9331 101 9832 106 9733 109 97
34 104 105
35 98 9636 101 9837 106 9938 106 9639 100 101
40 98 10341 107 9742 99 10643 101 9544 107 103

7/28/2019 My Seven Tools
http://slidepdf.com/reader/full/my-seven-tools 153/223
45 104 102
46 96 95
47 100 9748 102 10149 108 9650 103 101
51 101 9852 106 10653 103 10454 104 10455 103 10356 104 10457 107 96
58 103 111
59 102 10360 106 10161 100 9962 103 9963 103 103
64 104 9365 104 10066 104 10567 100 10168 105 11269 102 10070 101 10371 104 10272 97 9773 100 106
74 102 94
75 108 10076 105 98
77 106 9778 101 10679 103 10180 104 10081 105 9782 103 10083 105 11084 104 9885 101 10486 102 10487 105 10788 105 10089 102 99
90 102 10391 103 10692 102 10393 108 10994 99 10295 103 9696 103 10097 99 102

7/28/2019 My Seven Tools
http://slidepdf.com/reader/full/my-seven-tools 154/223
98 99 9899 106 94
100 102 100101102103
104105106107108109110111112113114115116117118119120121122123124125126127128129130131132133134135136137138139140141142143
144145146147148149150151

7/28/2019 My Seven Tools
http://slidepdf.com/reader/full/my-seven-tools 155/223
152153154155156157
158159160161162163164165166167168169170171172173174175176177178179180181182183184185186187188189190191192193194195196197
198199200201202203204205

7/28/2019 My Seven Tools
http://slidepdf.com/reader/full/my-seven-tools 156/223
206207208209210211
212213214215216217218219220221222223224225226227228229230231232233234235236237238239240241242243244245246247248249250251
252253254255256257258259

7/28/2019 My Seven Tools
http://slidepdf.com/reader/full/my-seven-tools 157/223
260261262263264265
266267268269270271272273274275276277278279280281282283284285286287288289290291292293294295296297298299300

7/28/2019 My Seven Tools
http://slidepdf.com/reader/full/my-seven-tools 158/223

7/28/2019 My Seven Tools
http://slidepdf.com/reader/full/my-seven-tools 159/223

7/28/2019 My Seven Tools
http://slidepdf.com/reader/full/my-seven-tools 160/223
Determination of the Class Interval
Sample Size(Overall) 200
The Largest Value(Overall) 112
The Smallest Value(Overall) 93
Determine the Class IntervalInput Sample Size 100Input The Largest Value 112 -4 ~ 86.5Input The Smallest Value 93 -3 86.5 ~ 88.5 87.5The Rough Number of Classes 10.0 -2 88.5 ~ 90.5 89.5
Input the Rough Number of Classes 10 -1 90.5 ~ 92.5 91.5The Rough Standard of the Class Inter 1.9 1 92.5 ~ 94.5 93.5Input the Unit of Measurement 1 2 94.5 ~ 96.5 95.5Input the Class Interval 2 3 96.5 ~ 98.5 97.5
4 98.5 ~ 100.5 99.5Input the Lower Specification Limit SL 90 5 100.5 ~ 102.5 101.5Input the Upper Specification Limit SU 110 6 102.5 ~ 104.5 103.5
7 104.5 ~ 106.5 105.58 106.5 ~ 108.5 107.59 108.5 ~ 110.5 109.5
10 110.5 ~ 112.5 111.511 112.5 ~ 114.5 113.512 114.5 ~ 116.5 115.513 116.5 ~ 118.5 117.5
14 118.5 ~ 120.5 119.5
15 120.5 ~ 122.5 121.516 122.5 ~ 124.5 123.5
17 124.5 ~ 126.5 125.518 126.5 ~ 128.5 127.519 128.5 ~ 130.5 129.5
20 130.5 ~
No Class
requency Tabl
Mid-
Point of
Class
Total

7/28/2019 My Seven Tools
http://slidepdf.com/reader/full/my-seven-tools 161/223

7/28/2019 My Seven Tools
http://slidepdf.com/reader/full/my-seven-tools 162/223

7/28/2019 My Seven Tools
http://slidepdf.com/reader/full/my-seven-tools 163/223

7/28/2019 My Seven Tools
http://slidepdf.com/reader/full/my-seven-tools 164/223

7/28/2019 My Seven Tools
http://slidepdf.com/reader/full/my-seven-tools 165/223
86.5-3 86.5
88.588.5
-2 88.590.590.5
Use for

7/28/2019 My Seven Tools
http://slidepdf.com/reader/full/my-seven-tools 166/223
-1 90.592.592.5
1 92.594.594.5
2 94.596.596.5
3 96.598.598.5
4 98.5100.5100.5
5 100.5102.5102.5
6 102.5104.5104.5
7 104.5106.5106.5
8 106.5108.5108.5
9 108.5110.5110.5
10 110.5112.5112.5
11 112.5114.5114.5
12 114.5116.5116.5
13 116.5118.5118.5
14 118.5120.5120.5
15 120.5
122.5122.5
16 122.5124.5124.5
17 124.5126.5126.5

7/28/2019 My Seven Tools
http://slidepdf.com/reader/full/my-seven-tools 167/223
18 126.5128.5128.5
19 128.5130.5130.5
20 130.5
Overall 101.92 Average 101.92
Category 103.04 Average 103.04
Category 100.8 Average 100.8
Category #DIV/0! Average #DIV/0!
Category #DIV/0! Average #DIV/0!
SL 9090
SU 110110
x axis 93112

7/28/2019 My Seven Tools
http://slidepdf.com/reader/full/my-seven-tools 168/223
Overall
Category Category Category Category Overall Overall A1 A2 0 0 Overall No Mid-PointFrequency f
0 0 0 0 0 -4 00 0 0 0 0 -3 87.5 00 0 0 0 0 -2 89.5 0
0 0 0 0 0 -1 91.5 00 4 0 0 4 1 93.5 41 11 0 0 12 2 95.5 124 16 0 0 20 3 97.5 20
15 19 0 0 34 4 99.5 3423 18 0 0 41 5 101.5 4126 16 0 0 42 6 103.5 4219 8 0 0 27 7 105.5 27
9 2 0 0 11 8 107.5 113 3 0 0 6 9 109.5 60 3 0 0 3 10 111.5 30 0 0 0 0 11 113.5 00 0 0 0 0 12 115.5 00 0 0 0 0 13 117.5 0
0 0 0 0 0 14 119.5 0
0 0 0 0 0 15 121.5 00 0 0 0 0 16 123.5 0
0 0 0 0 0 17 125.5 00 0 0 0 0 18 127.5 00 0 0 0 0 19 129.5 0
0 0 0 0 0 20 0100 100 0 0 200 200
x(0)Sample SizeMean ValueStandard Deviation
Calculation Table
Frequency
Total

7/28/2019 My Seven Tools
http://slidepdf.com/reader/full/my-seven-tools 169/223

7/28/2019 My Seven Tools
http://slidepdf.com/reader/full/my-seven-tools 170/223

7/28/2019 My Seven Tools
http://slidepdf.com/reader/full/my-seven-tools 171/223

7/28/2019 My Seven Tools
http://slidepdf.com/reader/full/my-seven-tools 172/223

7/28/2019 My Seven Tools
http://slidepdf.com/reader/full/my-seven-tools 173/223
Category Category Category Category Overall0 0 0 0 00 0 0 0 00 0 0 0 00 0 0 0 00 0 0 0 00 0 0 0 00 0 0 0 0
Figure

7/28/2019 My Seven Tools
http://slidepdf.com/reader/full/my-seven-tools 174/223
0 0 0 0 00 0 0 0 00 0 0 0 00 4 0 0 40 4 0 0 40 0 0 0 0
1 11 0 0 121 11 0 0 120 0 0 0 04 16 0 0 204 16 0 0 200 0 0 0 0
15 19 0 0 3415 19 0 0 34
0 0 0 0 023 18 0 0 4123 18 0 0 41
0 0 0 0 026 16 0 0 4226 16 0 0 42
0 0 0 0 019 8 0 0 2719 8 0 0 27
0 0 0 0 09 2 0 0 119 2 0 0 110 0 0 0 03 3 0 0 63 3 0 0 60 0 0 0 00 3 0 0 30 3 0 0 30 0 0 0 00 0 0 0 00 0 0 0 00 0 0 0 00 0 0 0 00 0 0 0 00 0 0 0 00 0 0 0 00 0 0 0 00 0 0 0 00 0 0 0 00 0 0 0 00 0 0 0 00 0 0 0 0
0 0 0 0 00 0 0 0 00 0 0 0 00 0 0 0 00 0 0 0 00 0 0 0 00 0 0 0 00 0 0 0 0

7/28/2019 My Seven Tools
http://slidepdf.com/reader/full/my-seven-tools 175/223
0 0 0 0 00 0 0 0 00 0 0 0 00 0 0 0 00 0 0 0 00 0 0 0 0
0 0 0 0 0
048
020
020
020
020
0 0 0 0 020 20 20 20 40
0 0 0 0 020 20 20 20 40

7/28/2019 My Seven Tools
http://slidepdf.com/reader/full/my-seven-tools 176/223
Category1
A1X fX fX2 No Mid-PointFrequency f X fX fX2
0 0 -4 0 0 0-2 0 0 -3 87.5 0 -2 0 0-1 0 0 -2 89.5 0 -1 0 0
0 0 0 -1 91.5 0 0 0 01 4 4 1 93.5 0 1 0 02 24 48 2 95.5 1 2 2 43 60 180 3 97.5 4 3 12 36
4 136 544 4 99.5 15 4 60 2405 205 1025 5 101.5 23 5 115 5756 252 1512 6 103.5 26 6 156 9367 189 1323 7 105.5 19 7 133 9318 88 704 8 107.5 9 8 72 5769 54 486 9 109.5 3 9 27 243
10 30 300 10 111.5 0 10 0 011 0 0 11 113.5 0 11 0 012 0 0 12 115.5 0 12 0 013 0 0 13 117.5 0 13 0 0
14 0 0 14 119.5 0 14 0 0
15 0 0 15 121.5 0 15 0 016 0 0 16 123.5 0 16 0 0
17 0 0 17 125.5 0 17 0 018 0 0 18 127.5 0 18 0 019 0 0 19 129.5 0 19 0 0
20 01042 6126 100 577 3541
91.5 x(0) 91.5200 Sample Size 100
101.92 Mean Value 103.043.74348 Standard Deviation 2.9247
合計

7/28/2019 My Seven Tools
http://slidepdf.com/reader/full/my-seven-tools 177/223

7/28/2019 My Seven Tools
http://slidepdf.com/reader/full/my-seven-tools 178/223

7/28/2019 My Seven Tools
http://slidepdf.com/reader/full/my-seven-tools 179/223

7/28/2019 My Seven Tools
http://slidepdf.com/reader/full/my-seven-tools 180/223

7/28/2019 My Seven Tools
http://slidepdf.com/reader/full/my-seven-tools 181/223

7/28/2019 My Seven Tools
http://slidepdf.com/reader/full/my-seven-tools 182/223

7/28/2019 My Seven Tools
http://slidepdf.com/reader/full/my-seven-tools 183/223

7/28/2019 My Seven Tools
http://slidepdf.com/reader/full/my-seven-tools 184/223
Category2 Category3
A2 0No Mid-PointFrequency f X fX fX2 No Mid-Point
-4 0 0 0 -4-3 87.5 0 -2 0 0 -3 87.5-2 89.5 0 -1 0 0 -2 89.5
-1 91.5 0 0 0 0 -1 91.51 93.5 4 1 4 4 1 93.52 95.5 11 2 22 44 2 95.53 97.5 16 3 48 144 3 97.5
4 99.5 19 4 76 304 4 99.55 101.5 18 5 90 450 5 101.56 103.5 16 6 96 576 6 103.57 105.5 8 7 56 392 7 105.58 107.5 2 8 16 128 8 107.59 109.5 3 9 27 243 9 109.5
10 111.5 3 10 30 300 10 111.511 113.5 0 11 0 0 11 113.512 115.5 0 12 0 0 12 115.513 117.5 0 13 0 0 13 117.5
14 119.5 0 14 0 0 14 119.5
15 121.5 0 15 0 0 15 121.516 123.5 0 16 0 0 16 123.5
17 125.5 0 17 0 0 17 125.518 127.5 0 18 0 0 18 127.519 129.5 0 19 0 0 19 129.5
20 0 20100 465 2585
x(0) 91.5 x(0)Sample Size 100 Sample SizeMean Value 100.8 Mean ValueStandard Deviation 4.13289 Standard Deviation
合計 合計

7/28/2019 My Seven Tools
http://slidepdf.com/reader/full/my-seven-tools 185/223

7/28/2019 My Seven Tools
http://slidepdf.com/reader/full/my-seven-tools 186/223

7/28/2019 My Seven Tools
http://slidepdf.com/reader/full/my-seven-tools 187/223

7/28/2019 My Seven Tools
http://slidepdf.com/reader/full/my-seven-tools 188/223

7/28/2019 My Seven Tools
http://slidepdf.com/reader/full/my-seven-tools 189/223

7/28/2019 My Seven Tools
http://slidepdf.com/reader/full/my-seven-tools 190/223

7/28/2019 My Seven Tools
http://slidepdf.com/reader/full/my-seven-tools 191/223

7/28/2019 My Seven Tools
http://slidepdf.com/reader/full/my-seven-tools 192/223
Category4
0requency X fX fX2 No Mid-Point requency X fX
0 0 0 -4 0 00 -2 0 0 -3 87.5 0 -2 00 -1 0 0 -2 89.5 0 -1 0
0 0 0 0 -1 91.5 0 0 00 1 0 0 1 93.5 0 1 00 2 0 0 2 95.5 0 2 00 3 0 0 3 97.5 0 3 0
0 4 0 0 4 99.5 0 4 00 5 0 0 5 101.5 0 5 00 6 0 0 6 103.5 0 6 00 7 0 0 7 105.5 0 7 00 8 0 0 8 107.5 0 8 00 9 0 0 9 109.5 0 9 00 10 0 0 10 111.5 0 10 00 11 0 0 11 113.5 0 11 00 12 0 0 12 115.5 0 12 00 13 0 0 13 117.5 0 13 0
0 14 0 0 14 119.5 0 14 0
0 15 0 0 15 121.5 0 15 00 16 0 0 16 123.5 0 16 0
0 17 0 0 17 125.5 0 17 00 18 0 0 18 127.5 0 18 00 19 0 0 19 129.5 0 19 0
0 20 00 0 0 0 0
91.5 x(0) 91.50 Sample Size 0
#DIV/0! Mean Value #DIV/0!#DIV/0! Standard Deviation #DIV/0!
合計

7/28/2019 My Seven Tools
http://slidepdf.com/reader/full/my-seven-tools 193/223

7/28/2019 My Seven Tools
http://slidepdf.com/reader/full/my-seven-tools 194/223

7/28/2019 My Seven Tools
http://slidepdf.com/reader/full/my-seven-tools 195/223

7/28/2019 My Seven Tools
http://slidepdf.com/reader/full/my-seven-tools 196/223

7/28/2019 My Seven Tools
http://slidepdf.com/reader/full/my-seven-tools 197/223

7/28/2019 My Seven Tools
http://slidepdf.com/reader/full/my-seven-tools 198/223

7/28/2019 My Seven Tools
http://slidepdf.com/reader/full/my-seven-tools 199/223

7/28/2019 My Seven Tools
http://slidepdf.com/reader/full/my-seven-tools 200/223
fX2000
0000
0000000000
0
00
000
0
Overall Histogram
0
5
10
15
20
25
F r e q u e n c y
SL SU
0
5
10
15
20
25
F r e q u e n c y
SL SU
0
10
20
30
40
50
60
80 100 120
F r e q u e n c y
Characteristic
Figure Overall Histogram
SL
SU
Overall
n = 200
Xbar 101.9
s = 3.74
0
n = 0
Xbar #####
s = #####
0
n = 0
Xbar #####
s = #####

7/28/2019 My Seven Tools
http://slidepdf.com/reader/full/my-seven-tools 201/223
Stratified Histogram
0
510
15
20
25
80 90 100 110 120
F r e q u e n c y
SL
SU
0
5
10
15
20
25
30
80 100 120
F r e q
u e n c y
Characteristic
Figure Stratified Histogram
SL
SU
A2
n = 100
Xbar 100.8
s = 4.13
A1
n = 100
Xbar 103
s = 2.92

7/28/2019 My Seven Tools
http://slidepdf.com/reader/full/my-seven-tools 202/223

7/28/2019 My Seven Tools
http://slidepdf.com/reader/full/my-seven-tools 203/223

7/28/2019 My Seven Tools
http://slidepdf.com/reader/full/my-seven-tools 204/223

7/28/2019 My Seven Tools
http://slidepdf.com/reader/full/my-seven-tools 205/223

7/28/2019 My Seven Tools
http://slidepdf.com/reader/full/my-seven-tools 206/223

7/28/2019 My Seven Tools
http://slidepdf.com/reader/full/my-seven-tools 207/223

7/28/2019 My Seven Tools
http://slidepdf.com/reader/full/my-seven-tools 208/223
OverallHeight of Xbar 48 n 200Height of SL 40 Xbar 101.9Height of SU 40 s 3.74Xbar : Number of Decim 2s : Number of Decimals 2
0Height of Xbar 20 n 0Height of SL 20 Xbar #####
Height of SU 20 s #####Xbar : Number of Decim 2s : Number of Decimals 2
0Height of Xbar 20 n 0Height of SL 20 Xbar #####Height of SU 20 s #####Xbar : Number of Decim 2s : Number of Decimals 2
Ajust Figure
Ajust Figure
Ajust Figure

7/28/2019 My Seven Tools
http://slidepdf.com/reader/full/my-seven-tools 209/223
A2Height of Xbar 20 n 100Height of SL 20 Xbar 100.8Height of SU 20 s 4.13Xbar : Number of Decim 2
s : Number of Decimals 2
A1Height of Xbar 20 n 100Height of SL 20 Xbar 103Height of SU 20 s 2.92Xbar : Number of Decim 2s : Number of Decimals 2
Ajust Figure
Ajust Figure

7/28/2019 My Seven Tools
http://slidepdf.com/reader/full/my-seven-tools 210/223
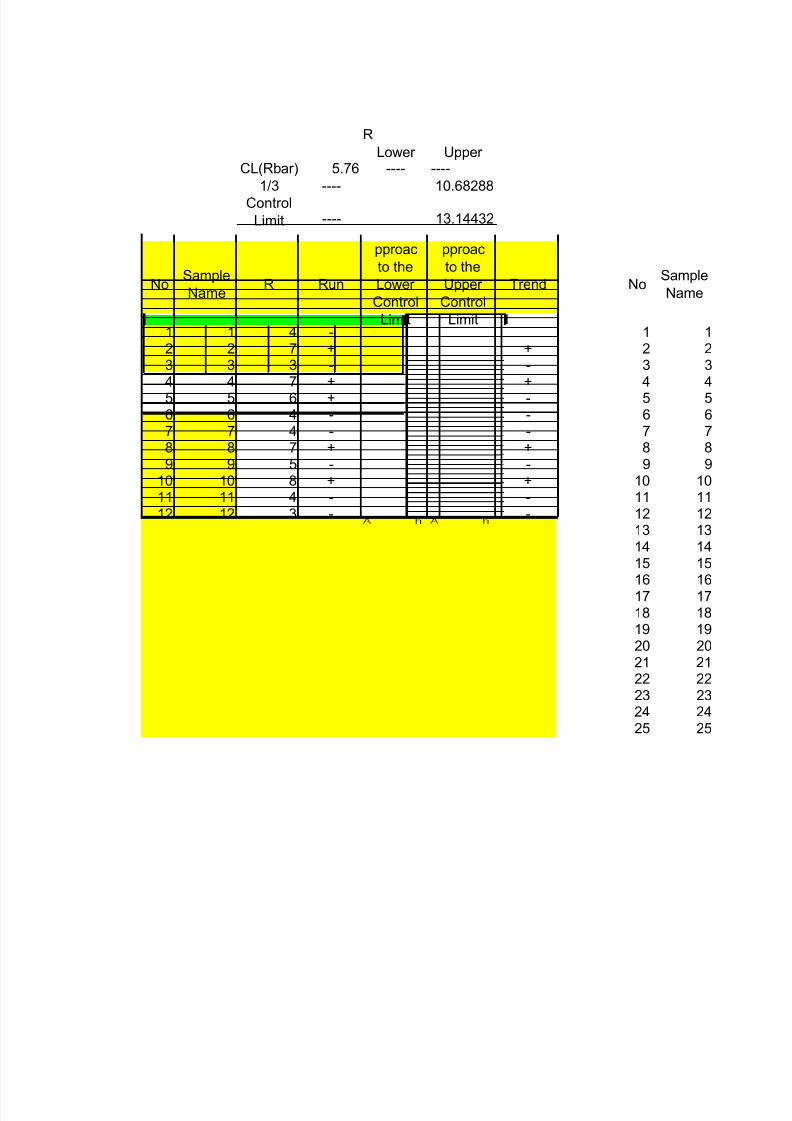
Size of Subgroup 4
Number of Subgro 25
NoSample
NameX1 X2 X3 X4 X5 X6
1 1 101 101 101 1052 2 99 103 106 1063 3 102 104 103 1014 4 110 107 104 1035 5 106 100 103 1046 6 101 101 104 1057 7 107 106 107 1038 8 102 109 103 1059 9 99 104 102 104
10 10 100 98 106 10111 11 104 101 100 10212 12 106 106 103 10513 13 100 106 103 10514 14 108 100 104 10215 15 98 98 104 10216 16 105 107 104 10317 17 102 99 100 10218 18 105 101 105 10819 19 109 107 102 9920 20 105 104 101 10321 21 105 96 104 10322 22 104 100 97 9923 23 103 102 100 9924 24 100 108 102 10625 25 102 103 108 102
n = 4
UCL= 107.269
Input of Data
105
110
X

7/28/2019 My Seven Tools
http://slidepdf.com/reader/full/my-seven-tools 211/223
CL= 103.07
LCL= 98.87096
UCL= 13.14432
CL= 5.76
LCL= Not Considere
Xbar-R Control Chart
90
95
100X
0
5
10
15
20
1 3 5 7 9 1 1
1 3
1 5
1 7
1 9
2 1
2 3
2 5
R
Subgroup No.
Figure Xbar-R Control Chart
7/28/2019 My Seven Tools
http://slidepdf.com/reader/full/my-seven-tools 212/223
Lower Upper CL(Rbar) 5.76 ---- ----
1/3 ---- 10.68288
Control
Limit ---- 13.14432
NoSample
NameR Run
pproac
to the
Lower
Control
Limit
pproac
to the
Upper
Control
Limit
Trend NoSample
Name
1 1 4 - 1 12 2 7 + + 2 23 3 3 - - 3 34 4 7 + + 4 45 5 6 + - 5 56 6 4 - - 6 67 7 4 - - 7 78 8 7 + + 8 89 9 5 - - 9 9
10 10 8 + + 10 1011 11 4 - - 11 1112 12 3 - - 12 1213 13 6 + + 13 1314 14 8 + + 14 1415 15 6 + - 15 1516 16 4 - - 16 1617 17 3 - - 17 1718 18 7 + + 18 1819 19 10 + + 19 1920 20 4 - - 20 2021 21 9 + + 21 2122 22 7 + - 22 2223 23 4 - - 23 2324 24 8 + + 24 2425 25 6 + - 25 25
R

7/28/2019 My Seven Tools
http://slidepdf.com/reader/full/my-seven-tools 213/223

7/28/2019 My Seven Tools
http://slidepdf.com/reader/full/my-seven-tools 214/223
Lower Upper k 4CL(Xbar) 103.07 ---- ---- D4 2.282
1/3 ---- 100.271 105.869 D3 0
Control
Limit ---- 98.871 107.269 A2 0.729
Xbar Run
pproac
to the
Lower
Control
Limit
Approac
h to the
Control
Limit
Trend R-LCL R-CL R-UCL X-LCL
102 - 5.76 13.1443 98.871103.5 + + 5.76 13.1443 98.871102.5 - - 5.76 13.1443 98.871
106 + + + 5.76 13.1443 98.871103.25 + - 5.76 13.1443 98.871102.75 - - 5.76 13.1443 98.871105.75 + + 5.76 13.1443 98.871104.75 + - 5.76 13.1443 98.871102.25 - - 5.76 13.1443 98.871101.25 - - 5.76 13.1443 98.871101.75 - + 5.76 13.1443 98.871
105 + + 5.76 13.1443 98.871103.5 + - 5.76 13.1443 98.871103.5 + - 5.76 13.1443 98.871100.5 - - 5.76 13.1443 98.871
104.75 + + 5.76 13.1443 98.871100.75 - - 5.76 13.1443 98.871104.75 + + 5.76 13.1443 98.871104.25 + - 5.76 13.1443 98.871103.25 + - 5.76 13.1443 98.871
102 - - 5.76 13.1443 98.871100 - - - 5.76 13.1443 98.871101 - + 5.76 13.1443 98.871104 + + 5.76 13.1443 98.871
103.75 + - 5.76 13.1443 98.871
Xbar Calculation Table

7/28/2019 My Seven Tools
http://slidepdf.com/reader/full/my-seven-tools 215/223

7/28/2019 My Seven Tools
http://slidepdf.com/reader/full/my-seven-tools 216/223
Value Table
X-CL X-UCL n A2 D4 D3
103.07 107.269 2 1.88 3.267103.07 107.269 3 1.023 2.575103.07 107.269 4 0.729 2.282103.07 107.269 5 0.577 2.115103.07 107.269 6 0.483 5.078103.07 107.269103.07 107.269103.07 107.269103.07 107.269103.07 107.269103.07 107.269103.07 107.269103.07 107.269103.07 107.269103.07 107.269103.07 107.269103.07 107.269103.07 107.269103.07 107.269103.07 107.269103.07 107.269103.07 107.269103.07 107.269103.07 107.269103.07 107.269

7/28/2019 My Seven Tools
http://slidepdf.com/reader/full/my-seven-tools 217/223
Size of Subgroup 4
Number of Subgro 25
NoSample
NameX1 X2 X3 X4 X5 X6
1 1 100 98 98 982 2 99 95 106 973 3 95 102 104 1064 4 104 99 104 1015 5 102 93 103 1006 6 101 98 104 977 7 101 97 96 1008 8 112 97 111 1109 9 95 105 103 98
10 10 101 96 101 10411 11 99 98 99 10412 12 110 99 99 10713 13 103 96 103 10014 14 96 101 93 9915 15 105 103 100 10316 16 103 97 105 10617 17 102 106 101 10318 18 99 95 112 10919 19 102 103 100 10220 20 108 102 103 9621 21 101 95 102 10022 22 97 97 97 10223 23 97 101 106 9824 24 100 96 94 9425 25 99 101 100 100
n = 4
UCL= 106.5054
Input of Data
105
110
X

7/28/2019 My Seven Tools
http://slidepdf.com/reader/full/my-seven-tools 218/223
CL= 100.79
LCL= 95.07464
UCL= 17.89088
CL= 7.84
LCL= Not Considere
Xbar-R Control Chart
90
95
100X
0
5
10
15
20
1 3 5 7 9 1 1
1 3
1 5
1 7
1 9
2 1
2 3
2 5
R
Subgroup No.
Figure Xbar-R Control Chart

7/28/2019 My Seven Tools
http://slidepdf.com/reader/full/my-seven-tools 219/223
Lower Upper CL(Rbar) 7.84 ---- ----
1/3 ---- 14.54059
Control
Limit ---- 17.89088
NoSample
NameR Run
pproac
to the
Lower
Control
Limit
pproac
to the
Upper
Control
Limit
Tre
ndNo
Sample
Name
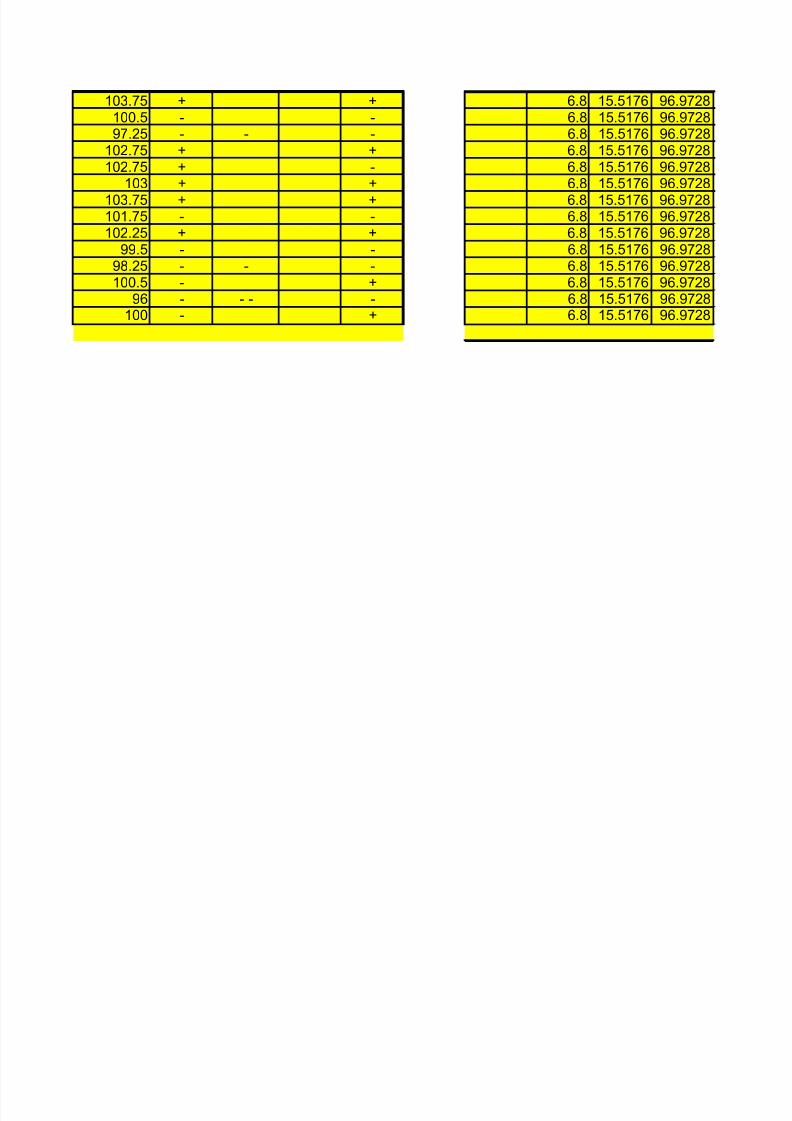
1 1 2 - 1 12 2 11 + + 2 23 3 11 + - 3 34 4 5 - - 4 45 5 10 + + 5 56 6 7 - - 6 67 7 5 - - 7 78 8 15 + + + 8 89 9 10 + - 9 9
10 10 8 + - 10 1011 11 6 - - 11 1112 12 11 + + 12 1213 13 7 - - 13 1314 14 8 + + 14 1415 15 5 - - 15 1516 16 9 + + 16 1617 17 5 - - 17 1718 18 17 + + + 18 1819 19 3 - - 19 1920 20 12 + + 20 2021 21 7 - - 21 2122 22 5 - - 22 2223 23 9 + + 23 2324 24 6 - - 24 2425 25 2 - - 25 25
R

7/28/2019 My Seven Tools
http://slidepdf.com/reader/full/my-seven-tools 220/223
d

7/28/2019 My Seven Tools
http://slidepdf.com/reader/full/my-seven-tools 221/223
Lower Upper k 4CL(Xbar) 100.79 ---- ---- D4 2.282
1/3 ---- 96.9798 104.6 D3 0
Control
Limit ---- 95.0746 106.505 A2 0.729
Xbar Run
pproac
to the
Lower
Control
Limit
Approac
h to the
Control
Limit
Trend R-LCL R-CL R-UCL X-LCL
98.5 - 7.84 17.8909 95.074699.25 - + 7.84 17.8909 95.0746
101.75 + + 7.84 17.8909 95.0746102 + + 7.84 17.8909 95.0746
99.5 - - 7.84 17.8909 95.0746100 - + 7.84 17.8909 95.0746
98.5 - - 7.84 17.8909 95.0746107.5 + + + + 7.84 17.8909 95.0746
100.25 - - 7.84 17.8909 95.0746100.5 - + 7.84 17.8909 95.0746
100 - - 7.84 17.8909 95.0746103.75 + + 7.84 17.8909 95.0746100.5 - - 7.84 17.8909 95.074697.25 - - 7.84 17.8909 95.0746
102.75 + + 7.84 17.8909 95.0746102.75 + - 7.84 17.8909 95.0746
103 + + 7.84 17.8909 95.0746103.75 + + 7.84 17.8909 95.0746101.75 + - 7.84 17.8909 95.0746102.25 + + 7.84 17.8909 95.0746
99.5 - - 7.84 17.8909 95.074698.25 - - 7.84 17.8909 95.0746100.5 - + 7.84 17.8909 95.0746
96 - - - 7.84 17.8909 95.0746100 - + 7.84 17.8909 95.0746
Xbar Calculation Table

7/28/2019 My Seven Tools
http://slidepdf.com/reader/full/my-seven-tools 222/223

7/28/2019 My Seven Tools
http://slidepdf.com/reader/full/my-seven-tools 223/223
Value Table
X-CL X-UCL n A2 D4 D3