my only goal today is to make you a successful trader! · pdf file• my only goal today is...
TRANSCRIPT

1

2
My Only Goal Today Is to Make You a Successful Trader!
• My only goal today is to make you a successful trader!
• I will teach you all of the strategies and methodologies that I use to profit in the current market conditions
• We will cover new material so feel free to ask questions
• You will learn the ideal strategy for profiting in volatile and non-trending markets
• I am the only trader that I know of that uses this strategy
• The option income strategy is also a good strategy for volatile markets
• Any questions?

3
Program Overview● Trade Selection Process
● A Great Timing Indicator
● Short Positions
● Option Income Strategy
● The Ideal Strategy for Volatile Markets
● High Accuracy Option Trading
● The Wealth Building Formula

4
Trade
Selection
Process

5
Trade Selection Process
• Use trend following systems to determine price trend
• Use trend confirmation indicators to confirm trend
• Use Keltner Channels to select entry point

6
Trend Following Systems
• I tried many different trading approaches but I quickly learned that following the trend was the simplest and most effective way to produce consistent profits
• I have been using trend following strategies for more than 25 years
• When the price trend is up I buy and when the price trend is down I sell short
• This concept sounds simplistic but it really works. It is much better to follow the trend than trying to predict it

7
• In my experience trading based on predicting the future is the biggest mistake beginning traders make
• The truth is that no one can consistently predict the future
• It is better to let the price trend of the market tell you when you should buy or sell
• Trend following systems give you a rule-based systematic approach to trading
• I also developed money management systems used in conjunction with trend following that allowed me to control risk and manage losses and profits

8
• A trend following system is your road map to trading success
• Trend following combined with money management discipline is a powerful, systematic approach that allows you to manage risk andproduce consistent returns
• To make real money in the market you don’t need to know why a stock price rises or falls, you just need to know in advance which way it’s most likely to go
• If you can quantitatively measure the price trend of a stock then you will know in advance whether the price is likely to rally or decline.
• The price of a stock reflects all of the known information about a company

9
• Moving averages are a simple method for tracking the current price trend of a stock and allow us to ‘trade with the price trend’ instead of trying to predict the future price movement of a stock
• I use two different moving average trend following systems depending on trade length
• For short to intermediate term trades of one to six months I use the cross over of the 50-Day and 100-Day Exponential Moving Averages (EMA)
• For longer term trades of greater than six months I use the cross over of the 1-Month price and 20-Month Exponential Moving Average which I call the Major Trend System
• The Major Trend System is particularly useful when taking short positions

10
50/100-Day EMA Trend System ‘Buy’ Signal50-Day EMA is Above 100-Day EMA
50/100-Day EMA Trend System ‘Sell’ Signal50-Day EMA is Below 100-Day EMA

11
50/100 Day EMA System
Sell
Buy
Coach Inc
12
Major Trend System ‘Buy’ Signal1-Month Price is Above 20-Month EMA
Major Trend System ‘Sell’ Signal1-Month Price is Below 20-Month EMA

13
20-Month EMA
1-Month Price
Sell
Rely on Price Trend Instead of Predictions
Very few market analysts predicted such a sharp and persistent decline in the index during the 2007 – 2009 bear market This Major Trend System ‘sell’signal is a good example of how important it is to let the price trend of a stock determine when you should buy and sell instead of trying to predict future price movement

14
The Major Trend System has a long history of being very effective in identifying major price trends
The Major Trend System indicated a bullish price trend for most of the 1990s and the 2003 through 2007 bull market
And the system indicated a bearish price trend during the 2000 - 2003 and the 2008 -2009 bear markets
20-Month EMA
1-Month Price

15
Major Trend System Historical Results
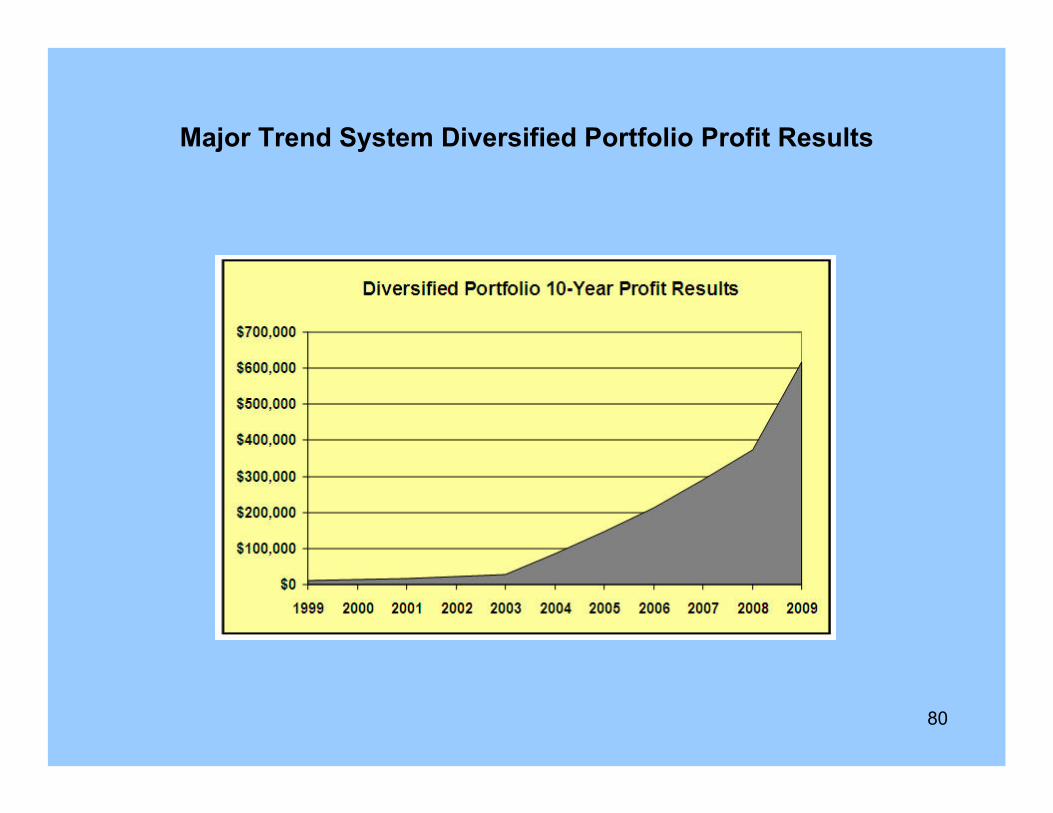
• The Major Trend 1-Month/20-Month EMA system has clearly defined ‘buy’ and ‘sell’ rules which allow for historical profit testing
• Historical profit results are based on buying stocks when the 1-Month price crosses above the 20-Month EMA and shorting stocks when the 1-Month price crosses below the 20-Month EMA
• I conducted 10 years of historical testing on a broadly diversified portfolio of eight stocks in a broad cross section of industries

16
Diversified Portfolio Historical Results

17
Major Trend System Diversified Portfolio Profit Results

18
Major Trend System AAPL 10-Year Profit Results
$0
$100,000
$200,000
$300,000
$400,000
$500,000
$600,000
$700,000
$800,000
$900,000
$1,000,000
1999 2000 2001 2002 2003 2004 2005 2006 2007 2008 2009
Apple

19
Cliffs Natural
Major Trend System CLF 10-Year Profit Results
$0
$100,000
$200,000
$300,000
$400,000
$500,000
$600,000
$700,000
$800,000
$900,000
1999 2000 2001 2002 2003 2004 2005 2006 2007 2008 2009

20
Foster WheelerMajor Trend System FWLT 10-Year Profit Results
$0
$50,000
$100,000
$150,000
$200,000
$250,000
$300,000
$350,000
$400,000
$450,000
1999 2000 2001 2002 2003 2004 2005 2006 2007 2008 2009

21
Precision Castparts
Major Trend System PCP 10-Year Profit Results
$0
$50,000
$100,000
$150,000
$200,000
$250,000
$300,000
$350,000
1999 2000 2001 2002 2003 2004 2005 2006 2007 2008 2009

22
Current Example 50/100-Day EMA Buy for CREE
Cree Inc

23
Current Example 1-Month 20-Month EMA Buy for CREE
Cree Inc

24
Trend ConfirmationAt any given time period there can be hundreds of stocks in a price up trend
Trend confirmation indicators can help us narrow down the list of eligible buys
• Volume
• New 52-Week High/Low
• Industry Grouping
• Price Level Confirmation

25
Using Volume to Confirm Price Trend
• Volume is a valuable trading tool that can be used to confirm the price trend of a stock or ETF
• Volume flow precedes price and is the key to measuring the validity and sustainability of a price trend
• My favorite volume indicator is On Balance Volume which measuresvolume flow
• When a stock or ETF closes up, volume is added to the line and when a stock closes down volume is subtracted from the line
• A cumulative total of the volume additions and subtractions form the On Balance Volume line

26
On Balance Volume Indicator When Close is Up Volume is Added
When Close is Down Volume is Subtracted
A Cumulative Total of Additions and Subtractions Form the OBV Line

27
• The numerical value of the On Balance Volume line is not important
• We simply want to see an up sloping line to confirm a price up trend
On Balance Volume Line

28
• An up sloping line indicates that the volume is heavier on up days and buying pressure is exceeding selling pressure
• Buying pressure must continue to exceed selling pressure in order to sustain a price up trend. So this is a simple indicator to use that instantly tells us if we should be buying a stock or ETF.

29
Confirmed Up Trend for CREE
● Stock price is trending up● Volume is increasing on days a stock closes up● Volume is decreasing on days a stock closes down

30
52-Week High Confirmation
• In my trading experience I have discovered that stocks that are making a new 52-week high tend to continue their price up trend
• A stock that makes a new 52-week high ‘confirms’ the price up trend and allows you to narrow down your buy list to stocks with the greatest profit potential

31
CREE Making New 52-Week HighsConfirming Price Up Trend

32
Down Loading the New 52-Week New High List
– The new 52-week high list can be easily downloaded from www.msn.com.
– Log on to MSN.com and click ‘Money’
– Under Investing click ‘Stock Research’
– Under Find Stocks click ‘Stock Power Searches’
– Under Power Searches click ’52 Week Highs’

33

34
Industry Grouping
• I check the new 52-week high list almost every trading day
• I discovered that when you check this list daily you start to notice stocks in certain industry groups that make new highs almost daily. These are the industry groups I like to focus on to narrow down my list to the stocks with the greatest profit potential.
• I will then normally buy one stock or option from each top performing industry group
• Quantitative research suggests that approximately one half of a stock’s price appreciation is due to the industry grouping of a stock
• Focusing on the top performing industry groups provides a constant ‘tail wind’ (in pilot’s terms) to your trading success. It allows you to not only narrow down your list of stocks to buy but also provides you stocks with the best profit potential
• IBD is a good source for industry rankings

35

36
Price Level Confirmation
• In addition to using the new 52-Week high list I have also discovered that a stock’s price level is another reliable indicator that confirms a stock’s price up trend
• Stocks that trade up to the 70 – 80 point range usually continue their upward price movement until they reach 100
• And stocks that reach 100 usually continue upward until they reach the 120 – 130 point range
• This concept may sound overly simplistic but I have found a stock’s price level to be a good forecaster of further price increases and confirms a stock’s price up trend
• To me it is very logical that the stocks that are growing their earnings and net worth the fastest are the ones whose price willreach the 70 – 80 point range
• Very few stocks ever trade at these higher price levels so a high price level acts as a good indicator of a successful company with a strong chance of future price appreciation

37

38
Precision Castparts
Aerospace Group
Trend ConfirmationsNew 52-Week High
Leading Industry Group
Price Level Confirmation

39
National Oilwell
Oil Service Group

40
Fluor Corp
Infrastructure Group

41
Freeport McMoRan
Basic Materials Group

42
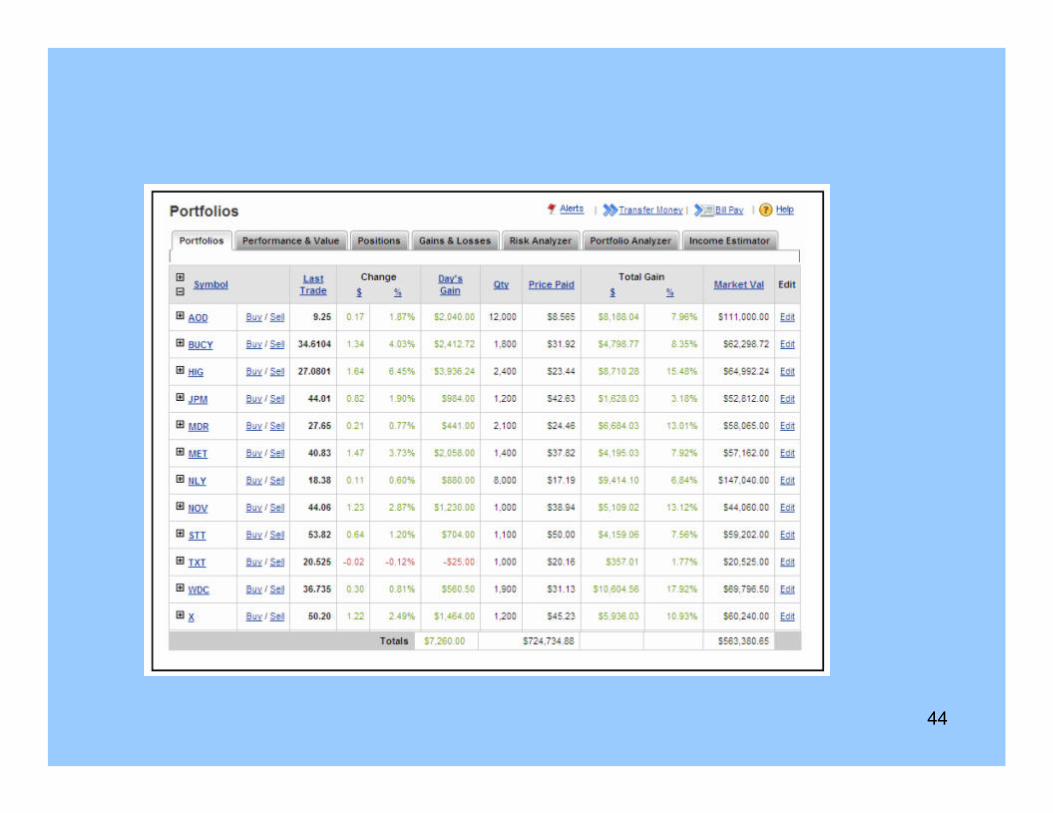
Recent Profit ResultsMy two online brokerage account portfolio Profit/Loss Reports that follow show recent profit results of $472,065.39.

43
44

45

46
47
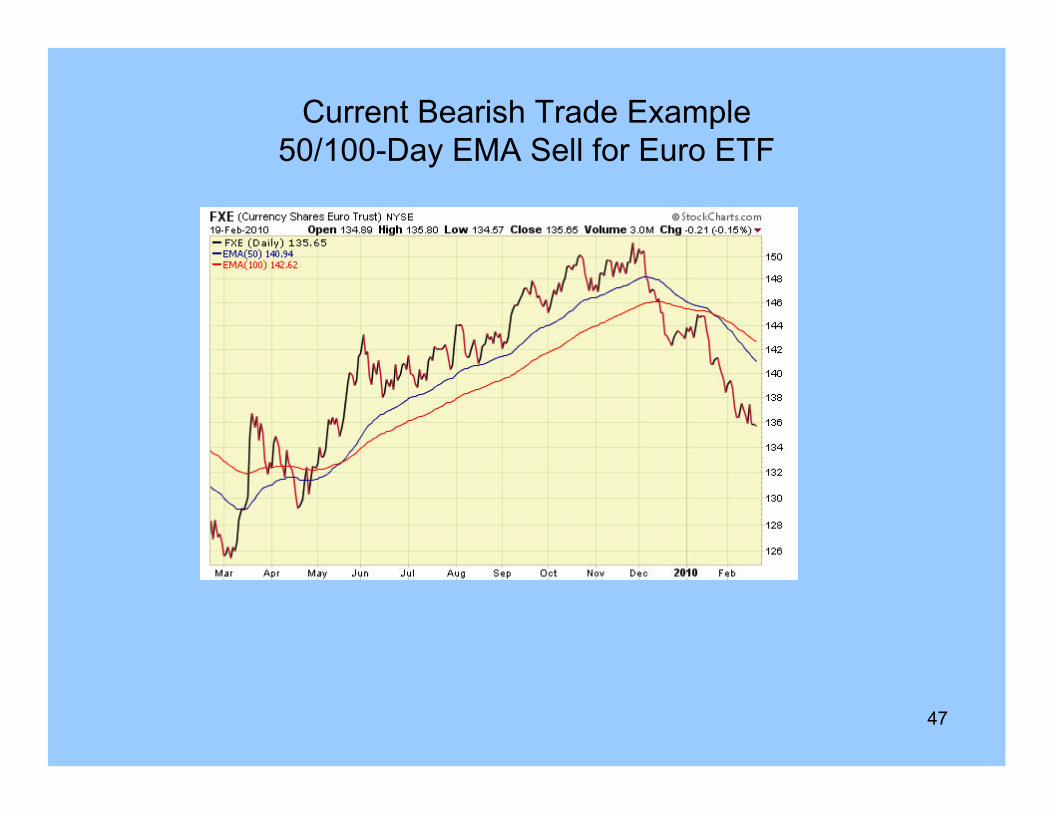
Current Bearish Trade Example50/100-Day EMA Sell for Euro ETF

48
Current Example 1-Month 20-Month EMA Sell for FXE
Euro ETF

49
Confirmed Down Trend for Euro
● Stock price is trending down● Volume is increasing on days a stock closes down● Volume is decreasing on days a stock closes up

50
Down Loading the New 52-Week New Low List
– The new 52-week low list can be easily downloaded from www.msn.com.
– Log on to MSN.com and click ‘Money’
– Under Investing click ‘Stock Research’
– Under Find Stocks click ‘Stock Power Searches’
– Under Power Searches click ’52 Week Lows’

51
New 52-Week Low List
52
A Great
Timing
Indicator

53
Keltner Channels
• One of the simplest but most effective timing indicators are theKeltner Channels originally developed by Chester Keltner and updated by Linda Raschke in the 1980s
• Can be used to help time trade entry and exit points
• Provides high probability buy and sell signals
• Can also be used to help select option strike prices
• Allows you to select stocks with repetitive and predictive pricepatterns

54
• The central line (dotted) is the 20-Day Exponential Moving Average
• The upper and lower bands are 2X the Average True Range of the past 10 days drawn at an equal distance from the central line

55
Timing Trade Entry and Exit Points- Buy when price drops near lower band
- Sell or don’t buy when price increases to upper band
US Steel

56
VISA Inc

57
Merck

58
Bucyrus

59
Exxon Mobil

60
Goldman Sachs

61
High Probability Buy and Sell Signals
US Steel

62
Merck

63
Exxon Mobil

64
United Health

65
Help Select Option Strike PricesFor Shorter Term Trading

66
Allows You to Select Stocks with Repetitive and Predictive Price Patterns

67

68
ShortPositions

69

70
193% Profit versus 43% Loss
Major Trend System S&P 500 Index 10-Year Profit Results
$10,000
$15,000
$20,000
$25,000
$30,000
$35,000
1999 2000 2001 2002 2003 2004 2005 2006 2007 2008 2009

71
Short Trades Reduce Risk and Increase Profit Opportunities
• We don’t often think of short trades as a way of reducing portfolio risk
• Normally short trades are considered high risk but short trades cannot only reduce portfolio risk but can also increase the profit potential of your portfolio
Three keys to a successful short program
1) Only take short positions in stocks or ETFs when the major price trend is down
2) Only take limited risk short trades
3) Confirm down trend with On Balance Volume

72
Only Take Limited Risk Short Trades
Limited Risk Short Trades
• Purchase put options
• Buy put option spreads
• Buy bearish or inverse ETFs
• Buy writes on bearish ETFs

73
Not Limited Risk
• Futures Trading• Forex Trading• Shorting Stocks• Selling Naked Options
The # 1 Rule of Trading
Never Put Yourself in a Position to Lose More Money Than You Invest

74
Only Take Short Positions in Stocks or ETFs When the Major Price Trend Is Down
Major Trend Sell Signal1-Month Price Below 20-Month EMA

75
Avoiding Whipsaw Trades
• The 1-Month/20-Month EMA can be used as a filter that only allows trades in the direction of the major trend
• This helps prevent “whipsaw” trades when counter-trend rallies or sell offs occur
• Preventing whipsaw trades can increase profits, reduce losses and increase the percentage of winning trades

76

77

78
Confirm Price Down Trend with On Balance Volume
● Stock price is trending down● Volume is increasing on days a stock closes down● Volume is decreasing on days a stock closes up

79
Diversified Portfolio Historical Results
80
Major Trend System Diversified Portfolio Profit Results

81
Major Trend System AAPL 10-Year Profit Results
$0
$100,000
$200,000
$300,000
$400,000
$500,000
$600,000
$700,000
$800,000
$900,000
$1,000,000
1999 2000 2001 2002 2003 2004 2005 2006 2007 2008 2009
Apple

82
Foster WheelerMajor Trend System FWLT 10-Year Profit Results
$0
$50,000
$100,000
$150,000
$200,000
$250,000
$300,000
$350,000
$400,000
$450,000
1999 2000 2001 2002 2003 2004 2005 2006 2007 2008 2009

83
Short Positions Give Your Portfolio an Added Dimension
• Short positions profit when a stock or index declines in price
• Most trading programs only trade from the long side because of the high risk associated with shorting a stock
• With the short strategy just presented we know it is possible to take short positions with limited risk which adds a whole new dimension to profit opportunities
• The historical profit results for the Major Trend System demonstrate that trading from the short side increases your profit opportunities

84
Surviving the Financial Armageddon

85
Option
Income
Strategy

86
Selling Option Premium to Generate Cash Income
• Many investors are not familiar with the concept of selling option premium to generate cash income
• Selling option premium is a very simple but lucrative income strategy
• When you sell an option, cash equal to the option price or premium is immediately credited to your brokerage account
• Unlike a traditional stock dividend you don’t have to own the stock on the dividend date to receive the quarterly dividend and you don’t have to wait a year to receive a 3% or 4% dividend yield
• When you sell option premium, you can get paid up to a 20% to 30% cash payment up front when the option is sold
• You get to keep this cash payment regardless of the price movement of the underlying stock

87
Ideal Strategy for Today’s Volatile Markets• Selling option premium to generate immediate cash income is the
ideal strategy for today’s volatile markets and uncertain economy
• We will look at an actual trade example shortly that allowed me to purchase Morgan Stanley stock at a 30% discount to its current price
• When you buy stock at a 30% discount you can profit if the stockprice increases, remains flat or even declines 20% to 25% resulting in a much higher probability that the trade will be profitable
• This gives the option income strategy a huge advantage over a stock purchase strategy and allows you to profit in any type of market condition
• The option income strategy works just as well with bearish trades which allow you to profit in bear markets when stocks and ETFs are declining in price
• Bearish income trades not only reduce portfolio risk but can increase profit opportunities and provide a whole new dimension to incomeinvesting.

88
• The key to selling option premium to generate cash income is to make sure the option you sell is ‘covered’
• There are two ways to implement the option income strategy with limited risk:

89
• For bullish trades the short option is ‘covered’ by owning the stock or owning a call option
• And for bearish trades the short option is ‘covered’ by owning the bearish ETF or owning a put option
• Because the short option is ‘covered’ this is a limited risk strategy
• Selling ‘covered’ option premium incurs considerably less risk than investing in stocks
• Selling option premium enables me to profit if the market goes up, down or remains flat and has given me the edge in producing consistent returns during any type of market condition

90

91
First Type of Income Trade

92
• When this option expires in 4 months I can sell another option and collect another cash payment
• This is called a ‘rollover’• If I rollover this option a second time I would receive a total of 3 cash
payment over the course of one year• This has the potential of producing up to a 90% cash payment over
the course of one year which could almost pay for the initial cost of the stock and dramatically lower risk

93
• Buying Morgan Stanley stock at a 30% discount reduces risk considerably
• This trade will profit if Morgan Stanley stock increases, remains flat or even declines 20% to 25% resulting in a much higher probability that the trade will be profitable
• This can result in a high percentage of winning trades even if your market timing is not very accurate
• This gives the option income strategy a big advantage over a stock purchase strategy which requires a stock price increase to be profitable.

94
• Portfolio of option income trades - $311,800 starting balance - $118,546.86 in profits

95
49% Cash Income by Rolling Over Trades
• I normally reinvest the cash income I receive from option incometrades in additional option income trades allowing me to compound my trading results
• I received a total of $152,900 in cash income for the current trades resulting in an average cash payment of 49% for the portfolio
• This portfolio is diversified across different industry groups and all of the trades in this portfolio are currently showing a net profit for the spread demonstrating the ability of the option income strategy to produce a high percentage of winning trades
• I normally take profits when an option income trade reaches 90% of its profit potential
• This enabled me to take profits on trades well before option expiration and initiate new option income trades allowing me to compound the cash income I receive

96
Bearish Option Income Trade Example• Bearish option income trades can also established by purchasing a bearish ETF and
selling the related call option• My brokerage confirmation below shows that I purchased 300 shares of the bearish
Emerging Market ETF symbol EEV at 96.80 and sold to open 3 of the EEV December 120-Strike call options symbol EEVLD at 20.00 points resulting in $6,000 being credited to my brokerage account

97
Profiting in Down Markets• The Buy Write Analysis reveals that if the EEV ETF price remains flat at 96.80 at
option expiration a 26% return will be realized (circled)• A 25% increase in price for the EEV ETF to 121.00 results in a 56.3% return and a
10% decrease in price to 87.12 results in a 13.4% return (circled)• The return calculations for this bearish option income trade demonstrate the ability of
the option income strategy to provide excellent profit opportunities during down markets.

98
$1633 Stock Loss = $3,553 Buy Write Profit
• Let’s take a look at an example of how a buy write trade can be profitable even if the underlying stock declines in price
• Stock declined after initiating buy write trade
Buy 1,500 shares of MOS at 42.0, sell 15 40-Strike calls at 7.90

99
Option Spread Income Trade
• Second type of option income trade that is implemented using only options by purchasing a call option and selling a call option with a higher strike price
• Because the short option is ‘covered’ with the option purchase this would be a limited risk trade

100
• Selling to open the 95-strike call at 27.93 points resulted in a $2,793 cash payment per contract being credited to my brokerage accountor a total of $16,750 for 6 contracts
• Purchasing the 65-strike call at 50.63 points and receiving 27.93 points in cash for the sale of the 95-strike call resulted in a 55% cash payment I received up front when I initiated the trade
• I get to keep this 55% cash payment regardless of the price movement of Goldman Sachs stock

101
• When this option spread expires in 4 months I can rollover to another option spread and collect another cash payment
• If I rollover this option spread a second time I would receive a total of 3 cash payments over the course of one year
• This has the potential of producing up to a 165% cash dividend over the course of one year.

102
• Receiving a 55% cash payment for the option premium reduces risk considerably and provides considerable downside protection in the event Goldman Sachs stock declines in price
• Goldman Sachs stock is currently trading at 140.32. We can see from the Call Option Spread Analysis below that Goldman Sachs stock could drop 30% to 98.22 and I would still realize a 32.2% return for this spread trade (circled)
• This spread trade profits if Goldman Sachs stock increases in price, remains flat or decreases 30% in price demonstrating the versatility of the option income spread strategy in producing profits under various market conditions

103
Bearish Income Trade

104

105
Monthly Option Income Strategy• The Monthly Option Income Strategy is initiated by purchasing a stock and
selling a monthly call option to generate monthly income• When the option expires it can be rolled over by selling another monthly
option• The strategy does not require a large price move in the underlying stock to
produce good returns and does well in flat or even down markets• Selling monthly options allows you to take full advantage of the time decay
characteristics of options• Options lose time value very quickly in the month prior to expiration. This
allows monthly option sellers to profit from the rapid time decay in the month prior to expiration.

106
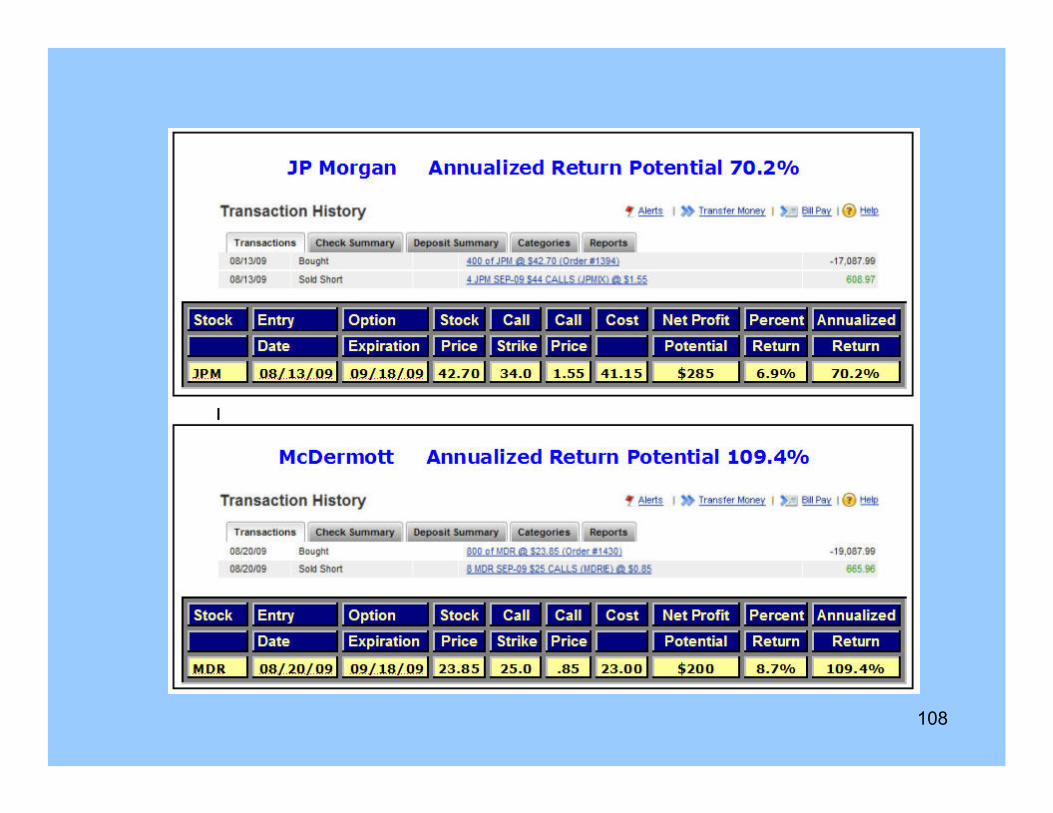
• Buying US Steel stock at 43.72 and selling the 45-Strike call option has a $360 and 8.7% profit potential over the next month if US Steel stock close at or above 45 at option expiration
• If the option is rolled over at expiration with a similar premium (and US Steel closes at or above the strike price of the short call), this monthly income strategy has the potential to return approximately 109% over the next twelve months.

107
108

109
$5,776,807.63 in Cash Income Over the Past Three Years
• Copies of my brokerage account trade confirmations posted on www.chuckhughes.com show that I collected $5,776,807.63 in cash payments over the past three years
• This averages out to more than $160,000 in cash income per month
• Brokerage confirmations list the call and put options I sold and the amount of cash that was credited to my brokerage account for each option sale
• The actual trade examples just presented demonstrate the ability of the option income strategies to produce consistent returns during very difficult market conditions over the past 3 years
• Selling option premium to generate cash income is the ideal strategy for today’s volatile markets and uncertain economy

110
Advantages of Option Income Strategy• When you sell an option, cash equal to the option price or premium is immediately
credited to your brokerage account
• Unlike a traditional stock dividend you don’t have to own the stock on the dividend date to receive the quarterly dividend and you don’t have to wait a year to receive a 3% or 4% dividend yield
• When you sell option premium, you can get paid up to a 20% to 30% cash payment up front when the option is sold
• When you buy stock at a 30% discount you can profit if the stock price increases, remains flat or even declines 20% to 25% resulting in lower risk and a much higher probability that the trade will be profitable
• Option income strategy works just as well in down markets
• Bearish income trades not only reduce portfolio risk but can dramatically increase profit opportunities and provide a whole new dimension to income investing
• Rolling over option allows you to collect up to a 90% cash return over a one year period
• Selling option premium can result in a high percentage of winning trades even if your market timing is not very accurate

111
The Ideal StrategyFor Volatile
Markets

112
A Great Strategy for Volatile Markets
• Despite daily volatility the broad market is virtually unchanged over the past 5 months
• It is difficult to profit from long or short trades • If you use money management rules many times you will be stopped out of
a trade even though you were ultimately correct about the market direction

113
• Depending on your entry timing a one day 10% price move can result in a stop out of your stock position
• A 10% price move in a stock can easily translate to a 40% or 50% move for an option resulting in a stop out
One Day Price Moves

114
A Great Strategy for Volatile Markets• In non-trending markets there are always sectors and individual stocks that
are trending• The best strategy to profit in a volatile market is to initiate in-the-money
option spreads with lots of downside protection• In-the-money spreads can provide good returns with lots of downside
protection that can help prevent a premature stop out of your trade
• Advisory service recent trade examples
In-the-Money Option Spread Example
115
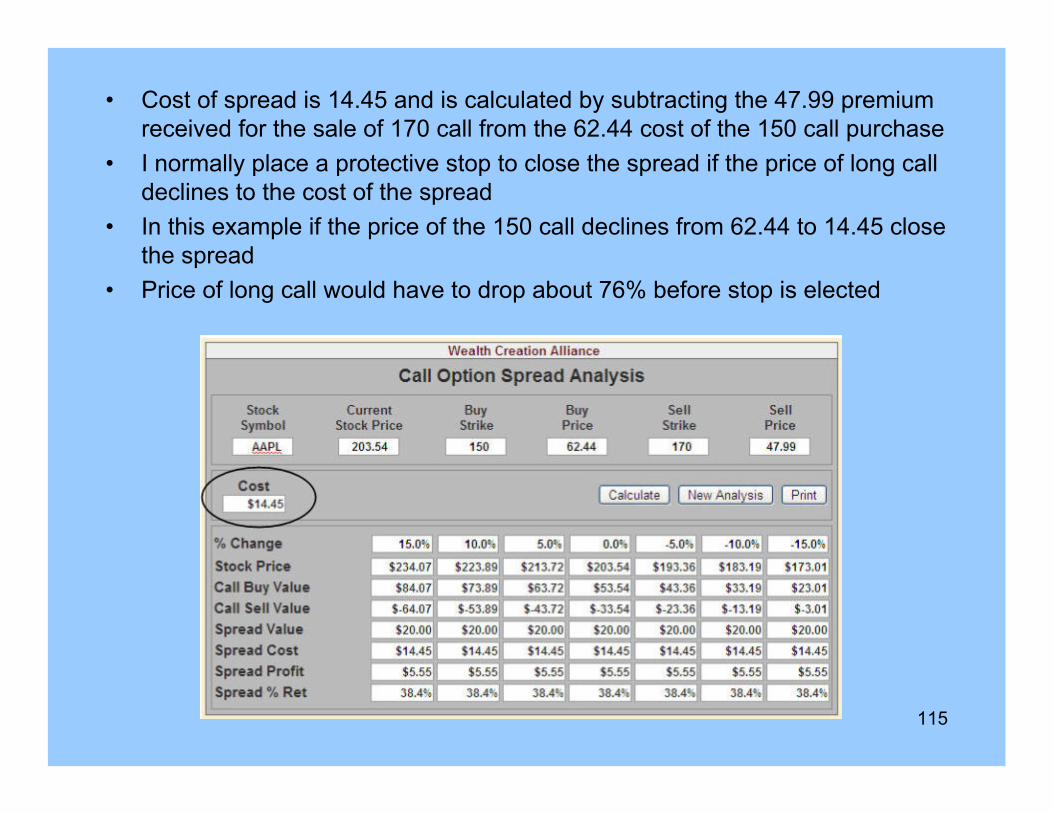
• Cost of spread is 14.45 and is calculated by subtracting the 47.99 premium received for the sale of 170 call from the 62.44 cost of the 150 call purchase
• I normally place a protective stop to close the spread if the price of long call declines to the cost of the spread
• In this example if the price of the 150 call declines from 62.44 to 14.45 close the spread
• Price of long call would have to drop about 76% before stop is elected

116
Money Management Rules
• Sell stock if price drops 7 to 10% below entry price
• Sell options if price drops 20 to 30% below entry price
• A 10% drop in the underlying stock can result in a 40 to 50% loss for an option
• Placing a stop 76% below entry price would allow you to hold this trade through volatile price moves and you would not be forced to close out trade
• Apple stock would have to drop below 165 at option expiration before this trade would incur a loss
• Apple stock dropped 7 points after initiating this spread but the spread only incurred a .20 or $20 loss allowing me to comfortably hold the spread during volatile price moves

117
Apple Stock Increases in Price = 38% Profit
Apple Stock Remains Flat = 38% Profit
Apple Stock Declines 15% = 38% Profit

118

119
• Cost of CREE spread is 6.95 and is calculated by subtracting the 16.00 premium received for the sale of 55 call from the 22.95 cost of the 45 call purchase
• I normally place a protective stop to close the spread if the price of long call declines to the cost of the spread
• In this example If the price of the 45 call declines from 22.95 to 6.95 close the spread
• Price of long call would have to drop about 70% before stop is elected
• Placing a stop 70% below entry price would allow you to hold this trade through volatile price moves and you would not be forced to close out trade

120
CREE Stock Increases in Price = 43% Profit
CREE Stock Remains Flat = 43% Profit
CREE Stock Declines 15% = 43% Profit

121

122
• Cost of VISA spread is 11.15 and is calculated by subtracting the 12.63 premium received for the sale of 80 call from the 23.78 cost of the 65 call purchase
• I normally place a protective stop to close the spread if the price of long call declines to the cost of the spread
• In this example if the price of the 65 call declines from 23.78 to 11.15 close the spread
• Price of long call would have to drop about 53% before stop is elected
• Placing a stop 53% below entry price would allow you to hold this trade through volatile price moves and you would not be forced to close out trade

123
VISA Stock Increases in Price = 34% Profit
VISA Stock Remains Flat = 34% Profit
VISA Stock Declines 10% = 24% Profit

124
High AccuracyOption Trading

125
High Accuracy Option Trading• I use the trend 50/100-Day EMA and the Major Trend following systems along with
trend confirmation to select options with the best profit potential
• My Option Cycle Strategy when used in conjunction with trend following takes option trading to a whole new level by increasing the accuracy and profitability of option trading
• The Option Cycle Strategy utilizes historical price data to help select an option’s time length (expiration date) and strike price with up to 90%+ accuracy
• When I discover a stock that is in a confirmed up trend and decide to purchase a call option, I must then decide on an option time length (expiration date) and strike price
• For many stocks there are literally hundreds of options to choose from with different expiration dates and strike prices
• How does an investor effectively chose an option with the best profit potential from several hundred choices?
• While stock selection is important for successful option trading, in my experience selecting an option’s time length and strike price is just as important as selecting the stock itself!
126
• I like to use historical price data to help select the time length of the option
• Historical price data allows me to know the percentage of times a stock increased in price between option expiration dates
• This helps me select an option time length (expiration date) that has a high probability of success.
• I also select an option with an in-the-money strike price
• In-the-money options have less time value and more intrinsic value thanout-of-the-money options
• Purchasing an in-the-money option has a much higher probability of success than purchasing an out-of-the-money option
• The goal of the Option Cycle Strategy is to enable you to become a successful options trader by helping you understand the time length and strike price selection process that results in high accuracy and more profitable option trading

127
• If the price trend is up then I look at bullish strategies such as purchasing call options, call option spreads and buy writes
• If the price trend is down I look at bearish strategies such as purchasing put options or put option spreads.

128
• Based on this data if Apple was in a price up trend and I wanted to purchase an Apple call option, I would trade the 3 or 6 month options for Apple which resulted in a stock price increase 76% of the time for the 3 month and 91% of the time for the 6 month. The 1 month option with 70% accuracy is too low. Longer term investors may consider purchasing Apple LEAPS options which historically is 100% accurate.

129
Selecting an Option Strike Price
• Once we decide on the time length of an option the next important decision is to select a strike price
• Selecting a strike price can be difficult as there are so many strike prices available
• For example, currently the Apple July options have 55 different strike price choices
• The value of an option consists of time value and intrinsic value
• At option expiration options lose all time value and consist of only intrinsic value
• The deeper an option is ‘in-the-money’ the more intrinsic value it will have
• ‘Out-of-the-money’ and ‘at-the-money’ options consist of only time value
• The time value portion of an option is a decaying asset
• You therefore want to maximize intrinsic value and minimize time value when you purchase an option

130
Out-of-the-Money Call Purchase

131
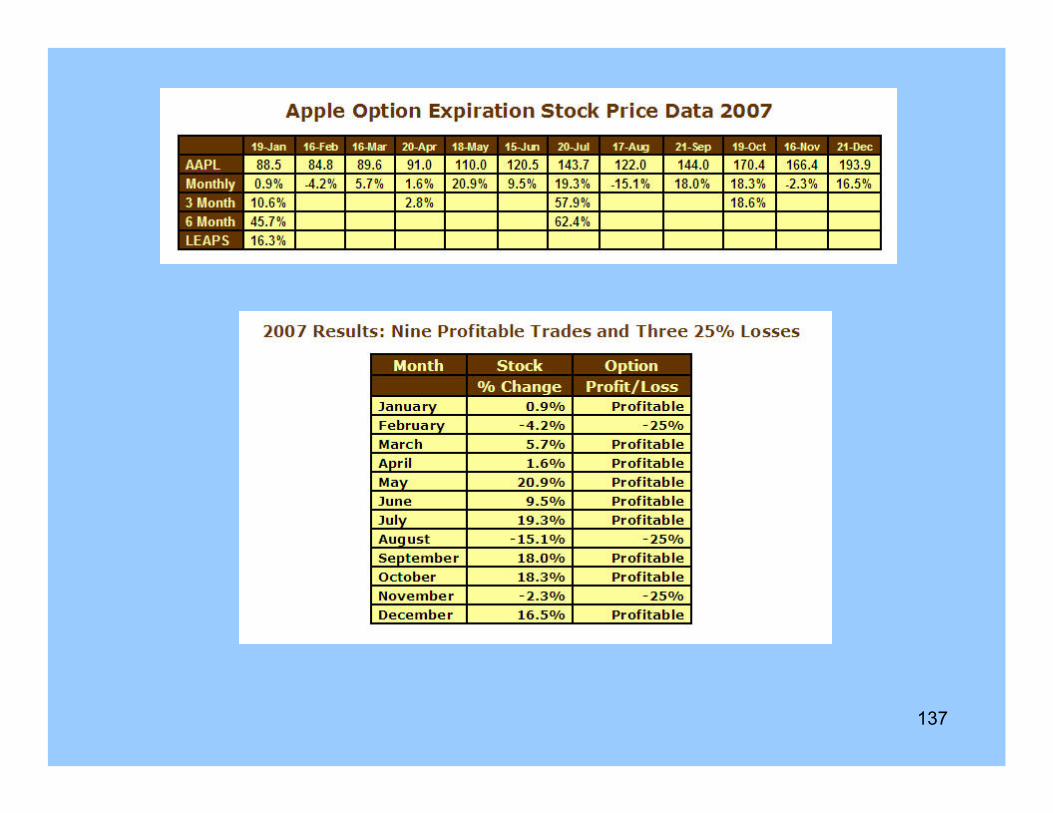
• Let’s assume we purchase a one month out-of-the-money call option each month on option expiration day similar to the Apple 185-Strike out-of-the-money call option just presented
• This one month call option would be purchased on option expiration day each month, held for one month and then sold on option expiration day the following month
• The Apple 185-Strike out-of-the-money call required an 8.6% increase in Apple stock price at option expiration in order to break even
• The 2007 option expiration price data table below allows us to project how many months in 2007 would be profitable based on a 8.6% increase in Apple stock price to break even

132
133
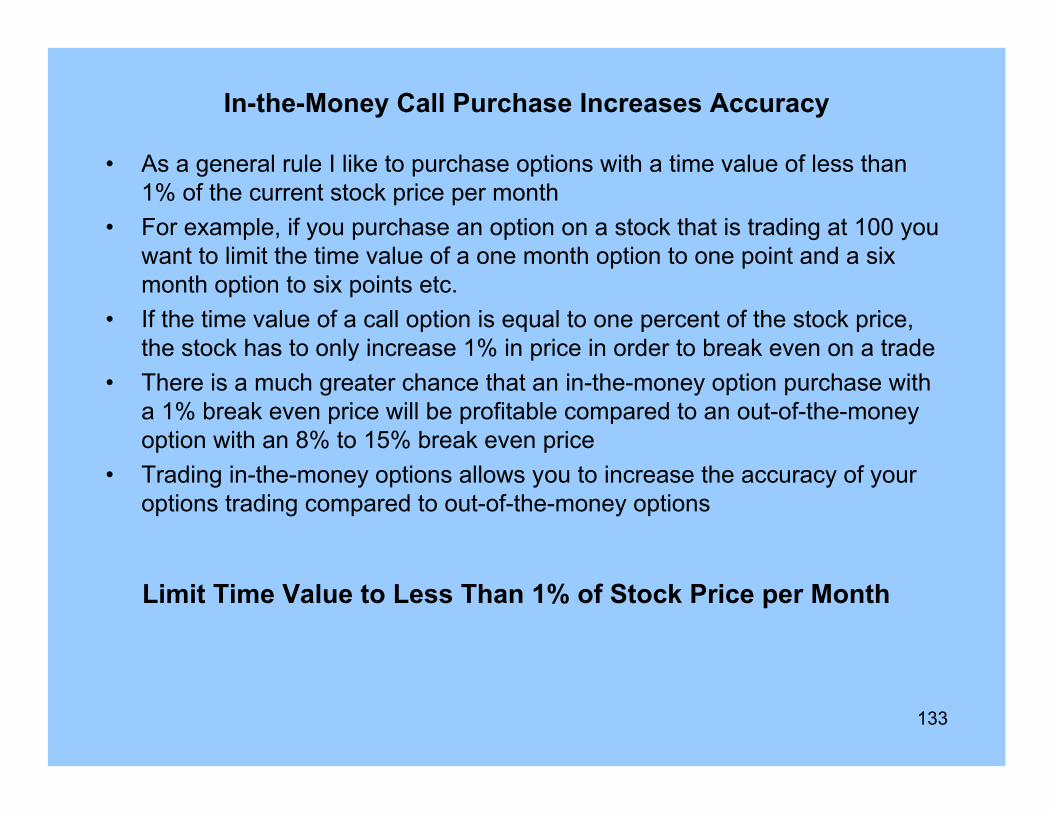
In-the-Money Call Purchase Increases Accuracy
• As a general rule I like to purchase options with a time value of less than 1% of the current stock price per month
• For example, if you purchase an option on a stock that is trading at 100 you want to limit the time value of a one month option to one point and a six month option to six points etc.
• If the time value of a call option is equal to one percent of the stock price, the stock has to only increase 1% in price in order to break even on a trade
• There is a much greater chance that an in-the-money option purchase with a 1% break even price will be profitable compared to an out-of-the-money option with an 8% to 15% break even price
• Trading in-the-money options allows you to increase the accuracy of your options trading compared to out-of-the-money options
Limit Time Value to Less Than 1% of Stock Price per Month

134
In-the-Money Call Purchase Example
• Current Stock Price of 173.25 Minus Strike Price of 150.00 = 23.25 Intrinsic Value
• Option Price of 24.60 Minus Intrinsic Value of 23.25 = Time Value of 1.35

135
• Apple stock would only have to increase 1.35 points or 0.7% for this trade to break even
• This in-the-money call option trade with a 0.7% break even would have a much higher probability of being profitable than the out-of-the-money trade example with an 8.6% break even
• The in-the-money trade would also allow us to employ the money management technique of limiting losses to 20% to 30% and would help prevent the total loss of our trading capital
0.7% Break Even = Higher Probability of Being Profitable

136
• Notice that a substantial stock price move is not required to produce a large option profit
• A 15% stock price increase would result in a 100% option return and a 10% stock price increase would result in a 64% option return (circled).
• We can see from this Call Option Purchase Analysis that the time value for this option is 1.35 points and the intrinsic value is 23.25
• Apple stock only has to increase 1.35 points or less than 1% for this trade to become profitable.
In-the-Money Options Allow us to Minimize Time Value and Maximize Intrinsic Value
137

138
Increasing Option Cycle Accuracy with Option Spreads
• In addition to option purchases I use the option cycle data to help select strike prices for option spreads
• Trading in-the-money option spreads can increase the accuracy of option cycle trades as in-the-money spread trades can be profitable even if the underlying stock declines in price
• Let’s look at a recent example of a trade I took to illustrate the profit/loss potential for an in-the-money spread trade
• My brokerage confirmation below shows that on March 25th I purchased 10 of the ISRG April 250-Strike calls for 78.96 points and sold 10 of the ISRG April 280-Strike calls for 53.76 points. The April calls expire in less than one month.
Buy ISRG Apr 250 calls at 78.96, Sell 280 calls at 53.76

139
ISRG stock was trading at 327.22 so both the 250-Strike and 280-Strike calls were in-the-money
The spread order debit price of 25.20 I entered was midway between the bid and ask price for the 250-Strike option purchased and the 280-Strike sold
Option Spread Order: “Buy to open 10 of the ISRG April 250-Strike calls and sell to open 10 of the ISRG April 280-Strike calls at a net debit of 25.20.”I was filled on this order and the Spread Analysis table below displays the reward/risk profile for this trade. The first row of the table is labeled ‘% Change’ and assumes

140
• The largest monthly loss for ISRG stock in 2007 was a -10.1% loss on January 19th option expiration
• Implementing a monthly ISRG spread trade in 2007 similar to the example trade just presented would result in all winning trades in 2007 as the monthly data does not show any ISRG stock losses greater than 15%
• Implementing in-the-money option spreads allows us to increase the accuracy of monthly option cycle trading compared to an option purchase strategy as in-the-money spread trades can be profitable even if the underlying stock declines in price

141
• Advantages of ‘In-the-Money’ Call Purchases versus ‘Out-of-the-Money’
• ‘In-the-Money’ calls allow us to employ money management to limit losses
• ‘In-the-Money’ calls contain less time value and more intrinsic value• Does not require large stock price increase to break even or profit• Prevents ‘total loss’ of investment• Less overall risk• Higher percentage of winning trades
• Disadvantages of ‘In-the-Money’ Call Purchases versus ‘Out-of-the-Money’
• ‘In-the-Money’ calls have a higher premium cost which requires a bigger investment
• ‘In-the-Money’ calls realize lower returns if the underlying stock experiences a substantial price increase

142
High Accuracy Real Time Results$2,572,413.71 Profit with 94% Accuracy

143

144

145

146

147

148

149

150

151

152

153
Option Spread Trades

154

155

156

157

158

159
The Wealth
Building
Formula

160
The Wealth Building Formula• The Wealth Building Formula is a simple but effective method for identifying stocks with the
greatest growth potential
• There are many ways to select profitable companies such as earnings growth, sales growth, cash flow, return on equity and low debt-to-equity ratios
• The Wealth Building Formula takes all of these methods into account with one simple measurement
• Once you purchase a stock you become a partial owner of the company and own a percentage of the company
• The value of your percentage of ownership is known as ‘stockholder’s equity’. Stockholder’s equity is essentially the net worth of a company and is calculated by subtracting the debt of a company from its assets
• If a company is liquidated then stockholder’s equity would equate to the break up or liquidated value of a company after all debt is paid
• For example, the current stockholder’s equity for United Healthcare stock is $15.06 per share. If we own 100 shares of UNH then our stockholder’s equity is worth $1,506
• If United Healthcare was liquidated then the value of our stockholder’s equity would be approximately $1,506 after all of the company’s debt was paid
• I like to refer to stockholder’s equity as a stock’s ‘intrinsic’ value as it represents the true worth of our shares of stock.

161
True Worth of Company Growing at a 31% Annual Compounded Growth Rate
• United Health is a very profitable company with strong earnings growth and a low debt-to-equity ratio
• Because United Health has no large capital expenditures and a low level of debt, it is able to retain a relatively high percentage of its earnings
• Only a small portion of its earnings is required to service its debt
• Normally a company’s retained earnings are the biggest component of stockholder’s equity
• Because United Health has a high rate of earnings growth and the ability to retain earnings it has been able to grow its stockholder’s equity at a fast rate
• Since 1990 United Health has maintained an annual compound growth rate in stock holder’s equity of 31.1%

162
$1,506 Investment Grows to $151,202
• In the example just presented an investor who purchases 100 shares of United Health at today’s prices receives $1,506 in stockholder’s equity
• If we were to make that same $1,506 investment in stockholder’s equity in 1990 our $1,506 investment would grow to $151,202
• Our original investment would double more than 100 times
• Regardless of stock market conditions our $1,506 investment in United Health stockholder’s equity in 1990 would have a ‘true value’ of more than $150,000

163
Market Price versus Intrinsic Value
• The market price of United Health’s stock has closely followed the growth of its intrinsic value
• Since 1990 UNH stock price has appreciated at an annual compounded growth rate of 35.7%
• My actual trading experience and historical research demonstrates that there is a strong correlation between the movement of the intrinsic value of a stock and its market value
• Historically with few exceptions the market price of a stock follows the increase or decrease in the intrinsic value of a stock
• If a stock’s intrinsic value is increasing then normally its market price is also increasing and if intrinsic value is decreasing then the market price is decreasing

164
Ultimate Goal of Stock Investing
• United Health’s ability to grow and retain its earnings produced more than a 10,000% increase in the intrinsic value of its stock since 1990
• This example demonstrates that a company’s growth in intrinsic value creates economic value for its shareholders
• As a company’s intrinsic value grows the true value of your stock investment grows
• Ultimately this is the reason why we invest in stocks and what separates stock investing from all other types of investments
• Growth in company intrinsic value has created trillions of dollars of economic value to shareholders and is the foundation of a capitalist economy
• Stockholder’s equity provides the capital that creates companies and allows them to grow
• As the intrinsic value of a company grows, the company can increase its production or services, an insurance company can write more policies and a bank can create more loans
• An increase in production or services can in turn create more income for a company.

165
• I consider investing in a company that is growing its intrinsic value as a real investment
• This is different than buying real estate, precious metals or commodities hoping that someone will pay you more than what you paid
• This is price speculation
• Real estate, commodities and precious metals do not have the potential for intrinsic value growth as stocks do

166
Historical Results for Diversified Portfolio of Wealth Building Stocks
• My Wealth Building Formula System invests in stocks that grow their intrinsic value at a 10% or higher annual rate
• Investing $1,000 in 1990 in each of the 10 Wealth Building stocks listed below grew to an incredible $6,018,045 by January 1st 2007
• Results include dividends but not commissions
• These 10 stocks represent a broad cross section of different industries from biotechnology to coffee houses

167
$10,000 Investment in Wealth Building Stocksin 1990 Grows to Over 6 Million Dollars
$0
$1,000,000
$2,000,000
$3,000,000
$4,000,000
$5,000,000
$6,000,000
$7,000,00019
90
1991
1992
1993
1994
1995
1996
1997
1998
1999
2000
2001
2002
2003
2004
2005
2006

168
Investment Return Comparisons
$0 $1 $2 $3 $4 $5 $6 $7
Gold
Home Prices
Crude Oil
Government Bonds
Wealth Building Stocks
Growth of $10,000 Investment 1990 - 2006
Scale is in Millions of Dollars
$6,018,045
Data Sources: Center for Research in Security Prices at the University of Chicago, US Census Bureau, Nat'l Assoc. of Realtors

169
It is far more profitable to own the Wealth Building stocks of companies that produce commodities than the commodities they produce

170

171
Wealth Building Formula Stock Examples

172

173

174

175
176