my masters thesis
TRANSCRIPT
i
SHAREHOLDER WEALTH EFFECTS OF DIVIDEND POLICY
CHANGES IN AN EMERGING STOCK MARKET (THE CASE OF
PAKISTAN)
by
Muhammad Waqas
A thesis submitted in partial fulfillment of the requirements for
the degree of
M.Com (Accounting & Finance)
University of Central Punjab
2004-2006
Approved by ___________________________________________________ Thesis Co-ordinator: Mr. Syed Amir Ali Shah
__________________________________________________
__________________________________________________
__________________________________________________
Principal _______________________________________________________
Date __________________________________________________________

TABLE OF CONTENTS
Title Page No.
I Abstract…………………….…………………………………………….i
II Acknowledgement ……………………………………………………….ii
III List of Abbreviations……………………………………………………..iii
1. Introduction……………………………………………………………..1
1.1 Dividend………………………………………………………….1
1.2 Cash……………………………………………………………....1
1.3 Stock……………………………………………………………...2
1.4 Dividend Policy…………………………………………………..2
1.5 Karachi Stock Exchange………………………………………....2-5
1.6 The Badla or Traditional Carry Forward System…………………5
1.7 The Pakistan Experience………………………………………....5-8
1.8 Growth and Progress……………………………………………..9
2. Literature Review……………………………………………………….10-31
3. Hypothesis and Data Methodology……………………………………..32-36
4. Data Analysis……………………………………………………………37
4.1 Presentation and Discussion on Results…………………………..37-38
ii
5. Conclusion……………………………………………………………....39
Appendices
Appendix 1 Announcement History and Share Prices…………………41-44
Appendix 2 Market Indexes…………………………………………..45-48
Appendix 3 Returns of Market……………………………………..…49-52
Appendix 4 Abnormal Returns of Individual Security………………..53-56
Bibliography…………………………………………………………….57-60

i
UNIVERSITY OF THE CENTRAL PUNJAB
ABSTRACT
SHAREHOLDER WEALTH EFFECTS OF DIVIDEND
POLICY CHANGES IN AN EMERGING STOCK MARKET
(THE CASE OF PAKISTAN)
by Muhammad Waqas
Thesis Co-coordinator: Mr. Syed Amir Ali Shah Department of Finance
This dissertation examines the stock market reaction to announcements of
cash dividend increases and bonus issues (stock dividends) in the
emerging stock market of Karachi Stock Exchange. Both events elicit
significantly negative abnormal returns, in line with evidence from
developed stock markets. This study contends that special characteristics
of the Karachi stock market delimit applicability of most traditional
explanations for cash and stock dividends in favor of an information-
signaling explanation. The empirical results are generally in agreement
with these contentions.

ii
ACKNOWLEDGMENTS
All praises to Almighty Allah who is “THE CREATOR” of whole of the
universe and admires to our Holy Prophet Muhammad (Peace Be upon
Him) who taught us every thing of this life and the life thereafter.
Now it is our responsibility to convey the “WORDING OF SUCCESS” to
whole of the Ummah. As it was indicated in the last Address of our Holy
Prophet (Peace Be upon Him). And the graves of “FELLOW BEINGS” are
the proof of the completion of this responsibility.
And I am also thankful to my respected Facilitator and Thesis Co-ordinator
Mr. Syed Amir Ali Shah. He delivered knowledge to us in such a way that
it would help me through out my practical life.

1
C h a p t e r 1
INTRODUCTION
1.1 Dividend
Dividends are payments made by a company to its shareholders. When a
company earns a profit, that money can be put to two uses. It can either be re-
invested in the business (called retained earnings) or it can be paid to the
shareholders of the company as a dividend. Many companies retain a portion
of their earnings and pay the remainder to their shareholders. Publicly-traded
companies usually pay dividends on a fixed schedule, commonly annually,
semi-annually or quarterly however, they may declare a dividend at any time.
Dividends are usually paid in cash. Sometimes dividends instead take the
form of shares in the company (either newly-created shares or existing shares
bought in the market). Exceptionally, dividends might take the form of shares
in other companies or other assets.
The profits of a company can either be reinvested in the business or paid to its
shareholders as a dividend. The frequency of these varies by country. In the
United States dividends of publicly-traded companies are usually declared
quarterly by the board of directors. In some other countries dividends are paid
biannually, as an interim dividend shortly after the company announces its
interim results and a final dividend typically following its annual general
meeting. In other countries, the board of directors will propose the payment of
a dividend to shareholders at the annual meeting who will then vote on the
proposal.
1.2 Cash
Cash and dividends (most common) are those paid out in form of real cash.
Such dividends are a form of investment income and are usually taxable to the
recipient in the year they are paid. This is the most common method of
sharing corporate profits with the shareholders of the company.

2
1.3 Stock
Stock or scrip dividends are those paid out in form of additional stock shares
of the issuing corporation, or other corporation (e.g., its subsidiary
corporation). They are usually issued in proportion to shares owned (e.g., for
every 100 shares of stock owned, 5% stock dividend will yield 5 extra
shares). This is very similar to a stock split in that it increases the total
number of shares while lowering the price of each share and does not change
the market capitalization or the total value of the shares held.
1.4 Dividend Policy
Once a company makes a profit, they must decide on what to do with those
profits. They could continue to retain the profits within the company, or they
could pay out the profits to the owners of the firm in the form of dividends.
Once the company decides on whether to pay dividends, they may establish a
somewhat permanent dividend policy, which may in turn impact on investors
and perceptions of the company in the financial markets. What they decide
depends on the situation of the company now and in the future. It also
depends on the preferences of investors and potential investors.
In the United States, a decision regarding the amount and frequency of
dividends is solely at the discretion of the board of directors. Shareholders are
explicitly forbidden from introducing shareholder resolutions involving
specific amounts of dividends. Where a company makes a loss during a year,
it may opt to continue paying dividends from the retained earnings from
previous years or to suspend the dividend. Where a company receives a non-
recurring gain, e.g. from the sale of some assets, and has no plans to reinvest
the proceeds, the money is often returned to shareholders in the form of a
special dividend.
1.5 Karachi Stock Exchange (KSE)
Karachi Stock Exchange (KSE), established in 1947, is the oldest and the
most active of the three stock exchanges in Pakistan, and currently lists 662
companies with a total market capitalization of about $52 billion. The
KSE100 represents major blue chips companies and is fairly good
3
representative of the market. Besides the KSE there are two regional stock
exchanges in Lahore and Islamabad. The other two exchanges are however
relatively inactive. For example, during July 2005-March 2006 period the
average daily turnover at the KSE was 462.4 million share, while at LSE
and ISE it was 65.4 and 1.7 million shares, representing 12% and 3% of the
total market activity respectively.
Similar to other emerging markets, KSE has a limited role in raising new
capital; e.g., there were only five new listings in the market in 2005. Despite
the small size of the market, it experiences a high turnover and high price
volatility. From the plot of the KSE100 index over the five year period
2001-2005, we can see that the market experienced significant fluctuations
over shorter time intervals. Finally, a skewed size distribution of stocks
traded is observed for the KSE, i.e., skewed in terms of size, trading
patterns, volume of brokers’ trading and weighted value of stocks in the
index. This is particularly true for top 20 stocks accounting for 85% of the
overall turnover.
Here I have provides salient features of Bombay Stock Exchange (BSE) and
KSE for comparison. The KSE is relatively a much smaller market compared
to the BSE, both in terms of the listed companies as well as market
capitalization. Reflecting its smaller size the KSE represents only 0.7% of the
total capitalization of the emerging markets, compared to BSE’s 7.9%share. It
is interesting to note the sharp contrast between Pakistan’s capitalization ratio
(which is low) and relatively high turnover ratio. This characteristic probably
reflects noise trading and speculative element in the market. The spectacular
rise in the KSE of 410% over the 2001-05 periods is remarkable, though
260% appreciation of the BSE also stands in sharp contrast with the
performance elsewhere in the world. The appreciation in the KSE100 index
and BSE30 index was 534% and 137% respectively for the same period. The
Pakistani stock market appreciation was four times higher than the Indian
market despite a higher rate of growth in the Indian GDP for the same period.
This also shows that the PE ratio and Price to Book value of Pakistani
4
companies included in the S&P/IFC Global Index is nearly 2/3, and the
dividends yield nearly half of that of the Indian companies. These statistics
suggest that the cost of capital for the Indian companies would be much lower
than for the Pakistani companies. Another important difference is the higher
degree of correlation of the BSE (0.69) with the S&P Composite Index,
compared with correlation coefficient of 0.32 in case of KSE, which reflects a
higher degree of integration of the BSE with the international capital markets.
Besides, the differences between the two markets in size, activity and other
characteristics noted above, there are two aspects of these markets which may
have a direct bearing on the regulatory response and its effectiveness in
dealing with market manipulation and volatility. First is the difference in the
industry structure and competition among the stock exchanges. As already
noted above, in case of India, NSE has emerged as the leading stock exchange
in the country, with 45% market share, thus eliminating BSE’s monopolistic
position that it had enjoyed ever since its inception. NSE along with 22 other
active regional exchanges creates a more competitive environment. In
Pakistan, KSE is still the dominant player with 85% share of the trading
activity.
Secondly, there seems to be a significant difference between the regulatory
enforcement and effectiveness of public policy. Nageswaran and Krithivasan
(2006), for example, claim that only Singapore, Hong Kong and India are
effective in enforcement among Asian countries. According to data compiled
by Goyal (2004), SEBI had taken up 657 cases for investigation in the period
1992-2003, and had completed 424 cases. 250 prosecutions were launched
against collective investment schemes over 2001-03. During the same year
there were 257 actions taken against brokers and others out of which there
were 42 suspensions. SEBI’s record in redressing grievances also appears to
be effective; the redress rate is about 95%. In contrast, according to a survey
conducted by La Porta et al. (2006) Pakistan scores rather low on the indices
of (i) orders to issuers, distributors and accountants (ii) criminal sanctions and
(iii) public enforcement which capture the extent to which a public regulator
5
exercises investigative power and its ability to impose penalties. Pakistan’s
score on these three indices is 0.17, 0.08 and 0.58, compared to India’s 0.67,
0.83 and 0.67 respectively. Khwaja and Mian (2005) remark with respect to
Pakistan that, “Thus, it is not surprising that to date there has hardly been any
case in which a broker was prosecuted for improper activity.”
1.6 The Badla or Traditional Carry Forward System
An old and traditional informal institution common to both India and Pakistan
is that of Badla, meaning something in return. It is a local term for a forward
trading facility, and essentially is a repo transaction carried out in a separate
after-hours market where the borrower who takes the badla from a badla
broker, carries forward his security exposure from the current settlement
period to the next one, by sale of his position in the present period and its
repurchase in the subsequent settlement period at a predetermined price
differential. In the event of a purchase, the investor may want to carry forward
the transaction to the next settlement cycle and for doing so, he has to
compensate the seller who sold it with an intention of getting cash.
1.7 The Pakistan Experience
The KSE experienced a steady bull run as reflected in both the KSE 100
index and trading volumes, starting just after the last stock market crisis in
May 2002, which accelerated towards the end of 2004. The KSE 100 saw an
unprecedented rise of 65%, from 6,218 on December 31, 2004 to 10,303 on
March 15, 2005, along with an increase in the value traded from around
$300-400 million to $1-2 billion per day. The market turned negative in the
second half of March, 2005 and index dropped to as low as 6,939 on April
12, 2005, a decline of 32.7 percent from its peak. The sharp rise in the index
could not be explained by any change in the fundamentals. The following
precipitous fall is also somewhat of a puzzle. Such a meteoric rise in index
and a subsequent crash is indicative of a classical speculative bubble in the
equity market.
Badla has been blamed as one of the reasons for the March 2005 crisis.
Pakistan’s influential financial newspaper Business Recorder stated that

6
there were two problems. First, badla financing was only open to a small
number of market players, which also includes financial institutions, as
opposed to share trading. Second, badla financing was provided by short-
term investors and the hot money can disappear overnight. During 2004-05,
KSE investors were willing to borrow at exorbitant Badla rates (which were
capped at 18% in KSE but rose in the uncapped Lahore Stock Exchange to
over 100%) because the accelerated rise in stock prices made even
expensive borrowing feasible. The COT (badla) financing ranged from 33%
to 45% of investment at KSE throughout 2004. The higher demand for badla
investment pushed the average badla rates from 9.4 % in 2003, to 11.4% in
2004, ranging from 12 to 19 percent, even though market interest rates
remained stable at a relatively low level through most of 2004.
The growing availability of badla financing brokers and institutions added to
the buying frenzy, though some of the major badla providers were
simultaneously selling in the futures market. In other words, “there was a
strong nexus between lenders and brokers/investors who could influence
market sentiment to their own advantage” (Task Force Report, 2005). The
chairman of SECP stated on July 16, 2005 that badla was the root cause of
almost all previous crises at the bourses, and was to be rooted out, and that
the badla and margin financing could not co-exist.
After the March 2005 crisis, a task force was set up by the Chairman of
Securities and Exchange Commission of Pakistan (SECP) to identify the
causes for the situation arising at the country’s three stock exchanges in
March 2005 and to propose measures for strengthening and consolidating the
regulatory regime, particularly with a view to enabling emergency
intervention, preventing systematic risk and promoting market stability. The
task force completed its report in July 2005 identifying a few areas that
contributed to the instability in the stock prices. The Task Force
recommended that there was a need for structural reforms and steps were
needed to protect public interest by ensuring that the financial might that has
been accumulated by the stock brokerage and badla financing institutions

7
should be effectively checked and brought to a reasonable size to ensure that
they are unable to manipulate the market.
Besides badla financing, other factors which contributed to this bull-run
included, increased liquidity due to higher foreign remittances, a regime of
low interest rates, IPO’s of public sector enterprises marked for divestment
and floatation of more mutual funds. During this period, especially since mid
October, 2004, there was an unusual build-up in the media about the
prospects of a rise in the KSE index. Statements from government officials
linked the rise in the KSE index to good economic management, indicated
that the market was destined to rise further, and announcement of the
impending accelerated program for the privatization of prominent and
profitable public sector corporations fuelled the bullish sentiment. Conduct of
corporate officials contributed to the market speculation; for example, rumors
of new oil and gas discoveries which would raise stock value manifold went
un-refuted or clarified by the management. There were also allegations of
“wash trades” and “pump and dump” plays by brokers.
The main thrust of the Pakistani regulators was to replace badla with formal
financing arrangements. The State Bank of Pakistan (SBP) in collaboration
with SECP, came out with rules governing margin financing issued to stock
brokers by banks. The SBP rules specified the conditions of extending such
loans to stock market brokers with proper risk management and internal
controls. It has also specified the minimum margin requirement of 30 percent
and reminded banks of the per party limit, in case of such lending to brokers.
The SECP intended to completely eliminate the carryover market (the badla
market) by the end of December 2004. Initially, the plan was to replace
margin financing with badla in 2003 but slow progress by the regulators has
resulted in the delay.
Regarding the replacement of badla financing the regulatory bodies were seen
as vacillating. For example, we quote a newspaper op-ed, Badla is back. “But
firmness doesn’t appear to be the strong point of the Securities and Exchange
Commission of Pakistan. … What went wrong? Or, rather, how heavy was
8
the pressure from vested interests? Were the members of the Karachi Stock
Exchange so powerful that they managed to force the regulator to work in
their interest? The SECP has not only proved to be a weak regulator but also
exposed itself to the criticism that it acts first and thinks later”.
There were other factors which lessened the effectiveness of the regulators’
actions. First, the composition of the Task Force was not without conflicts of
interest as its members also were on the Policy Board investigating matters
which should have been the subject matter of the Board itself when
formulating capital markets policies. Second, the mostly held view is that the
March debacle was due to excessive institutional selling and the withdrawal
of Badla financing simultaneously from the market. In the past, SECP had
been criticized for allowing the brokerage houses to own commercial and
investment banks which provided them additional resources to enter into
Badla financing and use it to manipulate market. Third, the Task Force, a
creation of SECP, could not look into the question of inadequate surveillance
and weak implementation by SECP.
The Task Force also did not look into the role of KSE management, in
possibly precipitating the withdrawal of the badla facility by calling upon the
various brokers and institutions to reconfirm that they would be able to honor
their obligations in the future contracts, and sending alarming signals to
market players. As there were four SECP nominated directors on the KSE
board, there is a possibility of conflict of interest. However, while the KSE
does receive some oversight from the SECP, it is predominantly broker-
managed, i.e., a majority of the exchange’s board of directors including the
chairman is brokers. The Task force also did not investigate the allegation of
market manipulation by certain mutual funds through withdrawing the badla
financing and to take advantage of the pursuing crash.
1.8 GROWTH AND PROGRESS

9
Today KSE has emerged as the key institution of the capital formation in
Pakistan with:
• Listed companies 654, securities listed on the exchange 694:
ordinary share 654, Preference shares 15 and debt securities
(TFC's) 25.
• Listed capital Rs.516,938.51 million (US$ 8,516.29 million).
• Market capitalization Rs.3,077,401.41 million (US$ 50,698.54
million).
• Average daily turnover 168.87 million shares with average daily
trade value Rs. 20,194.29 million (US$ 332.69 million).
• Membership strength at 200.
• Corporate Members are 158 out of which 9 are public listed
companies.
• Active Members are 163.
• Fully automated trading system with T+3 settlement cycle.
• Deliveries through central depository company.
• National Clearing and Settlement System in place.
10
C h a p t e r 2
LITERATURE REVIEW
Dividend policy remains a source of controversy despite years of theoretical
and empirical research, including one aspect of dividend policy: the linkage
between dividend policy and stock price risk (Allen and Rachim, 1996).
Paying large dividends reduces risk and thus influence stock price (Gordon,
1963) and is a proxy for the future earnings (Baskin, 1989). A number of
theoretical mechanisms have been suggested that cause dividend yield and
payout ratios to vary inversely with common stock volatility. These are
duration effect, rate of return effect, arbitrage pricing effect and information
effect. Duration effect implies that high dividend yield provides more near
term cash flow. If dividend policy is stable high dividend stocks will have a
shorter duration. Gordon Growth Model can be used to predict that high-
dividend will be less sensitive to fluctuations in discount rates and thus ought
to display lower price volatility.
Agency cost argument, as developed by Jensen and Meckling (1976)
proposed that dividend payments reduce costs and increase cash flow, that is
payment of dividends motivates managers to disgorge cash rather than
investing at below the cost of capital or wasting it on organizational
inefficiencies (Rozeff, 1982 and Easterbrook 1984). Some authors have
stressed the importance of information content of dividend (Asquith and
Mullin, 1983; Born, Moser and officer 1983). Miller and Rock (1985)
suggested that dividend announcements provide the missing pieces of
information about the firm and allows the market to estimate the firm’s
current earnings. Investors may have greater confidence that reported
earnings reflect economic profits when announcements are accompanied by
ample dividends. If investors are more certain in their opinions, they may

11
react less to questionable sources of information and their expectation of
value may be insulated from irrational influence.
Rate of return effect, as discussed by Gordon (1963), is that a firm with low
payout and low dividend yield may tend to be valued more in terms of future
investment opportunities (Donaldson, 1961). Consequently, its stock price
may be more sensitive to changing estimates of rates of return over distant
time periods. Thus expanding firms although may have lower payout ratio
and dividend yield, exhibit price stability. This may be because dividend
yields and payout ratio serves as proxies for the amount of projected growth
opportunities. If forecasts of profits from growth opportunities are less
reliable than forecasts of returns on assets in place, firms with low payout and
low dividend yield may have greater price volatility. According to duration
effect and arbitrage effect, the dividend yield and not the payout ratio is the
relevant measure. The rate of return effect implies that both dividend yield
and payout ratio matters. Dividend policy may serve as a proxy for growth
and investment opportunities. Both the duration effect and the rate of return
effect assume differentials in the timing of the underlying cash flow of the
business. If the relationship between risk and dividend policy remains after
controlling for growth, this would suggest evidence of either the arbitrage or
information effect.
Empirical studies have examined cross-sectional variation in dividend payout
ratios and CAPM beta coefficients. Beaver et. al. (1970) estimated CAPM
betas for 307 US firms and obtained significant correlation between beta and
dividend payout. Rozeff (1982) found a high correlation between value line
CAPM and betas and dividend payout for 1000 US firms. Fama (1991) and
Fama and French (1992) focus on dividends and other cash flow variables
such as accounting earnings, investment, industrial production etc to explain
stock returns. Baskin (1989) takes a slightly different approach and examines
the influence of dividend policy on stock price volatility, as opposed to

12
returns. The difficulty in any empirical work examining the linkage between
dividend policy and stock volatility or returns lies in the setting up of
adequate controls for the other factors. For example, the accounting system
generates information on several relationships that are considered by many to
be measures of risk. Baskin (1989) suggests the use of the following control
variables in testing the significance of the relationship between dividend yield
and price volatility: operating earnings, size of the firm, level of debt
financing, payout ratio and level of growth. These variables have a clear
impact on stock returns but also impact on dividend yield.
Karachi Stock Exchange (KSE) is an important emerging market of the
region among the developing countries. KSE is termed as high-risk high
return market where investors seek high-risk premium (Nishat, 1999). Few
studies have attempted to analyze the long run behavior of the market and
related issues (Nishat, 1991, 1992 1995, 1999, 2001; Nishat and Bilgrami,
1994) but no work has been done to explore role of dividend yield and payout
ratio in affecting the share prices. It is also important to study its role in the
Pakistani context after the introduction of reforms during 1990s, which
emphasized more towards openness to foreign investor, and competition,
which led to, increased volatility in the market (Nishat, 1999) and has reduced
the responsiveness of share price volatility to fundamental factors (Irfan and
Nishat. 2003). Reforms in Pakistan in general and specific to dividend policy
are; tax sealing on cash dividend, exemption of right and bonus shares from
tax, pattern shifting from cash to share dividend and government policy of
easing restrictions on transfer of market profits etc. The objective of this study
is to find the role of dividend policy measures i.e. dividend yield and payout
ratio on share price changes in the long run. It also attempts to assess the
pattern of relationship during pre reform (1981-1990) and reform (1991-2000)
periods.
13
A significant stream of prior research in the United States has empirically
documented that unexpected increases (decreases) in regular cash dividends
generally elicit a significantly positive (negative) stock market reaction (see,
for example, Fama et al. [1969] and Petit [1972]). Moreover, this finding
persists even after controlling for contemporaneous earnings announcements
(Aharony and Swary [1980]). In the same vein, Asquith and Mullins [1983]
find that, like dividend increases, dividend initiations have a significant
positive impact on shareholder wealth. Much subsequent research has focused
on explaining the dividend-increase induced positive stock market reaction.
The predominant explanation, by far, has been the information-signaling
hypothesis. Since managers have information that outside investors do not
have, dividend policy is a costly-to-replicate vehicle for conveying positive
private information to market participants. In line with these arguments,
signaling models by Bhattacharya [1979] and Miller and Rock [1985], among
others, find that dividend increases convey information about the firm's
current and future cash flows. In addition to supportive event-study results,
empirical studies by Ofer and Siegel [1987] and Healy and Palepu [1988]
examine changes in dividend policy in relation to future earnings and related
analysts forecasts, also consistent with the information-signaling hypothesis.
Bernartzi, Michaely, and
Thaler (1997) find that earnings are less likely to drop after a dividend
increase; however, they do not find that dividend increases are followed by
unexpected earnings increases. Their evidence is only weakly consistent with
an information-signaling hypothesis. DeAngelo, DeAngelo and Skinner
(1992) find that a loss is a necessary but not a sufficient condition for a
dividend cut, and that dividend cuts improve the ability of current earnings to
predict future earnings. Moreover, DeAngelo, DeAngelo, and Skinner (1992),
Bernartzi, Michaely, and Thaler (1997), and Jensen and Johnson (1995)
document that dividend cuts are followed by earnings increases, consistent
with dividend cuts marking the end of a firm’s financial decline and the
beginning of its restructuring. In sum, the empirical evidence by prior
14
research on the signaling value of dividend changes has been mixed. An
alternative explanation for changes in corporate dividend policy stems from
agency theory. Jensen (1986) suggests that managers, motivated by
compensation and human capital considerations, have incentives to over
invest free cash flows even in the absence of profitable growth opportunities
(the free cash flow hypothesis). Dividend payout policy in this case becomes
a vehicle for monitoring the managers' potential to misuse excess funds. Thus,
the observed positive stock market reaction following dividend increases is
consistent, in addition to information-signaling, with a reduction in agency
costs.
Lang and Litzenberger [1989] attempt to disentangle between signaling and
agency explanations by separating firms that are presumably over investing
(with q ratios less than one) from all other value-maximizing firms. They find
higher abnormal returns for over investing firms for which the agency-related
benefits of a dividend payout increase are higher compared to value-
maximizing firms. Consistent with the free cash flow hypothesis, the market
reaction to dividend increases by value-maximizing firms, albeit positive, is
significantly lower than the market reaction for over investors. By contrast,
Denis, Denis, and Sarin [1994], after controlling for dividend yield, find no
support for the free cash flow hypothesis for a large sample of dividend
changes. Furthermore, Yoon and Starks (1995) do not detect the release of
new information about managers’ investment policies following a change in
dividend policy. They find a positive relation between dividend policy
changes and capital expenditure changes, interpreting their evidence as being
supportive of an information-signaling over a free cash flow explanation of
dividend policy. Also consistent with the free cash flow hypothesis,
DeAngelo and DeAngelo [2000] find evidence that the market penalized
Times Mirror for intending to poorly reinvest free cash flow and applauded
later dividend redistributions of that cash flow. Finally, in a major
international study, La Porta et al. [2000] find that dividends are paid because
minority shareholders pressure corporate insiders to disgorge cash. Additional
15
studies on the relevance of the free cash flow hypothesis for alternative
payout methods such as share repurchase and special dividends have provided
mixed results (e.g., Howe, He, and Kao [1992], Vafeas [1997], and Nohel and
Tarhan [1998]). Despite mixed overall evidence on the free cash flow
hypothesis, most researchers attribute the conflicting results to imperfect
empirical constructs rather than theoretical flaws. A third explanation is the
tax hypothesis. Given the differential tax treatment between dividend income
and capital gains, dividend policy changes also have tax implications that are
reflected in stock market prices. In the United States, capital gains have
historically been taxed more favorably than dividends. In Cyprus capital gains
on stock investments have not been taxed at all while dividends received
(beyond an exempt amount) are taxed at an individual’s personal income tax
rate. Therefore, capital gains would be preferable to most individual investors
and dividend increases should elicit a negative stock price reaction.1 the
observed positive stock market reaction of dividend increases for U.S. firms
appears to be inconsistent with the unfavorable tax treatment of dividend
income. Conceivably, any negative tax effect may be dominated by stronger
positive signaling and/or free cash flow effects. Examination of the market
reaction to dividend changes in an emerging market such as Cyprus can be a
fruitful empirical exercise in that the relative import of alternative
explanations of dividend policy may likely differ compared to a developed
market. First, a clear implication of the standard free cash flow hypothesis as
advanced by Jensen [1986] is the separation of ownership and control since
wider ownership dispersion intensifies the conflict of interests between
managers and shareholders. This conflict of interests generally motivates
higher dividend payouts to limit the managerial tendency to misuse
shareholder funds. In Cyprus firms are, for the most part, closely held, with
ownership concentrated in the form of large equity blocks in the hands of
management and family members. This may suggest that managers in Cyprus
have a disincentive to misuse funds through over investing since the relative
benefit of managing a larger firm is likely to be outweighed by the direct cost
16
of over investing on the managers' substantial personal holdings in the firm.
The point is, as ownership becomes more concentrated, the likelihood of over
investment is reduced. Further, firm sizes are quite small in Cyprus so that the
managerial "hubris" effect of inflating firm size is likely negligible.
However, in many of these family businesses there may be conflict of
interests between the larger and the smaller shareholders. The problem may
be more pronounced in many emerging markets when lack of transparency,
both at the company level and in the stock market, allows alternative forms of
exploitation of the smaller shareholders by the larger shareholders and
management (see Holderness and Sheehan [1988]). Since monitoring is
difficult in such cases, it may be substituted by higher dividends that may
serve to mitigate this form of exploitation. Thus, although over investing free
cash flow in the Cyprus market is likely to be limited due to concentrated
corporate ownership structures, other forms of exploitation of smaller
shareholders by larger shareholders and management may partly justify
dividend increases, in addition to information signaling reasons. That is, small
stockholders purchasing equity against large block holders expect to suffer a
certain degree of exploitation. An unexpected increase in cash dividends
reduces the market’s assessment of future exploitation by large block holders,
causing an upward revision in the stock price.
In this study Rongrong Zhang [2005] examines the effects of firm and
country-level corporate governance mechanisms on dividend and cash
holding policies and their joint impact on firm value. He found that at the
firm-level, the excess control held by the largest owner is negatively related to
dividend payment; positively related to cash holdings and negatively related
to Tobin’s Q(The ratio of the stock market value of a firm to the price of the
firm’s capital assets); furthermore, he found positive valuation effects of
dividends and cash holdings. However, these effects depend on the ownership
structure of the firm. Dividend payments have incremental positive valuation
effect for firms with entrenched owners while cash holdings have negative
valuation effect for this type of firms. Considering the endogenous nature of
17
firm policies, he found that firms operating in countries with poor investor
protections make low dividend payments, have high cash holdings, and have
low firm value, supporting the findings of La Porta, Lopez-de-Silanes,
Shleifer, and Vishny (2000a, 2002) and Dittmar et al. (2003). In addition, he
explained that investor protection mitigates the adverse effect of excess
control by forcing controlling shareholders to eject cash. High cash holding is
beneficial only if outside investor’s rights are well protected.
According to the dividend signaling, dividend change announcements activate
share returns because they convey information about management’s
assessment on firms’ future prospects. The evidence gives no support for a
positive relation between dividend change announcements and the market
reaction for French firms, and only a weak support for the Portuguese and the
UK firms(see Elisabete Vieira). The global results do not give support to the
assumption that dividend change announcements are positively related with
future earnings changes.
The role of expected cash flow volatility as a determinant of dividend policy
both theoretically and empirically was explored. It was exposed that, given
the existence of a stock-price penalty associated with dividend cuts, managers
rationally pay out lower levels of dividends when future cash flows are less
certain (see Michael Bradley). He confirmed that payout ratios are lower for
firms with higher expected cash flow volatility as measured by leverage, size
and property level diversification. Findings were reliable with information-
based explanations of dividend policy but not with agency cost theories.
The cross-sectional stock returns behavior on the A-share market of the
Shanghai Stock Exchange (SSE), which is segmented from world’s other
equity markets was explored. We estimate the effects of beta, firm size, book-
to-market equity ratio and a variable unique to the Chinese stock markets, the
proportion of firm’s floating (tradable) equity over total equity on SSE stocks
over the period 1993–2002. We find that smaller firms and value stocks
perform better (see Kie Ann Wong [2006]). Systematic risk is negatively
18
significant in down markets. The proportion of floating equity has no direct
effect on stock returns.
Jamshed Y.Uppal has attempt to analyzed episodes of market manipulation
and volatility and the ensuing regulatory intervention in two emerging South
Asian markets, India and Pakistan. These episodes conform well to the
Kane’s theoretical framework of regulatory dialectics representing the
interaction of financial and regulatory innovation. He observed a common
pattern of avoidance-reregulation-avoidance, triggered by changes in the
market and technological environment. Markets adapt to such changes in the
form of innovation, avoidance and circumvention of regulation. The resulting
conflict calls for a re-regulation response, which, however, is followed by
another round of avoidance.
Spin-off announcements affect bondholders in two possible ways.
Bondholders may profit from the increase in the total firm value that is caused
by a spin-off. On the other hand, they may also suffer from a wealth transfer
from bondholders to shareholders, because they lose part of the coinsurance
effect that occurs in diversified firms. This problem is studied by analyzing
daily stock and bond abnormal returns around spin-off announcements. Over
a three-day event window, they found statistically significant abnormal
returns of 3.07 percent for shareholders and 0.11 percent for holders of
straight bonds (see Chris Veld and Yulia Veld ). Both stock and bond
abnormal returns are higher for firms with lower interest and dividend
payouts. Stock abnormal returns are also higher for firms with higher pre-
spin-off leverage. Overall, we find that the firm value increase compensates
for the wealth transfer effect and that bondholders’ wealth is not reduced as a
result of spin-off.
Prof. Varadraj B. Bapat explains corporate bond market is an important
segment of financial market in terms of funds raised as well as potential for
future growth though is lightly researched. One of the two propositions on
impact of dividend changes is signaling hypothesis (Bhattacharya, 1979)
which suggests a positive effect on bond prices, on an announcement of
19
dividend increase; whereas the other one is wealth transfer hypothesis
(Handjinicolaou and Kalay, 1984) which proposes a negative impact on bond
prices due to extortion of wealth from bond holders. By studying the impact
of dividend policy decisions on Indian corporate bond prices, the paper
examines these hypotheses and contributes to the literature on payout policy.
Dividend increase and decrease announcements of 5% or more during a
period of 5 years from year 1997-98 to 2001-02 have been identified and
abnormal returns for bonds and stocks are computed. The analysis shows that
abnormal bond and stock returns are positive and are statistically significant
in the event-month in case of dividend increase. Prof. Varadraj B. Bapat
concluded that signaling hypothesis is found to hold in Indian corporate bond
market.
Wolfgang Bessler (1999) In an environment of asymmetric information,
banks face information externalities due to their role as intermediaries of
information. In particular, bank insiders will possess private information from
monitoring loan customers. Accordingly, outsiders may interpret changes in a
bank's financial policy as signals about the quality of its loan portfolio and to
the extent that the assets (loans) of different banks are viewed as similar, they
will interpret such signals as pertaining to non-announcing banks as well
leading to contagion effects. We test for the presence of contagion effects in
stock returns associated with announcements of dividend cuts by money-
center banks. We find that dividend cuts induce negative abnormal returns in
the stocks of non-announcing money-center banks and to a lesser extent in the
stocks of large regional banks. The observed contagion effects appear
consistent with informed rather than contagious panic behavior because these
effects are systematically related to risks that are common to all affected
banks.
Melanie Cao in this paper studies the valuation and incentive effects of non-
traded stocks and stock options in a continuous-time, intertemporal,
consumption-investment framework. In addition to the market portfolio and
the risk free asset, we introduce an industry index into the agent’s portfolio

20
choice set. This industry index is assumed to be highly correlated with the
stock to partly undo the trading restrictions. We find that the industry index
can help align the employee’s private valuation of the stock and options with
that of the market’s. Although the private valuation is still below the market’s,
it is higher than that when the index is not available. When the partial
correlation between the stock and the index is perfect, the impact of the
trading restriction can be completely nullified and the employee’s private
valuation of the stock and options coincides with the market’s. The
introduction of the hedging index also enriches the implications concerning
incentives and risk taking behavior.
Guglielmo Maria Caporale 2003 in her paper uses the tests of Robinson
(1994a) to analyze the degree of dependence in the intertemporal structure of
daily stock returns (defined as the first difference of the logarithm of stock
prices, where the series being considered is the S&P500 index). These tests
have several distinguishing features compared with other procedures for
testing unit (or fractional) roots. In particular, they have a standard null limit
distribution and they are the most efficient ones when carried out against the
appropriate alternatives. In addition, they allow one to incorporate the
Bloomfield (1973) exponential spectral model for the underlying I (0)
disturbances. The full sample, which comprises 17,000 observations, is first
divided in 10 subsamples of 1700 observations each. These are then grouped
two by two, and five by five; finally, the whole sample is considered. The
results indicate that the degree of dependence remains relatively constant over
time, with the order of integration of stock returns fluctuating slightly above
or below zero. On the whole, there is very little evidence of fractional
integration, despite the length of the series. Therefore, it appears that the
standard practice of taking first differences when modeling stock returns
might be adequate.
Andreas Oehler 2002 prior research documents that many investors
disproportionately hold on to losing stocks while selling stocks which have
gained in value. This systematic behavior is labeled the “disposition effect”.

21
The phenomenon can be explained by prospect theory’s idea that subjects
value gains and losses relative to a reference point like the purchase price, and
that they are risk-seeking in the domain of possible losses and risk-averse
when a certain gain is obtainable. Our experiments were designed to test
whether individual- level disposition effects attenuate or survive in a dynamic
market setting. We analyze a series of 36 stock markets with 490 subjects.
The majority of our investors demonstrate a strong preference for realizing
winners (paper gains) rather than losers (paper losses). We adopt different
reference points and compare the behavioral patterns across three main
trading mechanisms, i.e. rules of price formation. The disposition effect is
greatly reduced only within high pressure mechanisms like a dealer market
when the last price is assumed as a reference point which is a more market
driven (external) benchmark. If disposition investors use the purchase price as
a reference point which is a more mental-accounting driven (internal)
benchmark they die hard in all market settings. Interestingly, our markets do
not collapse or become illiquid by disposition investors’ reluctance to trade. A
main reason for this is the coexistence of two or more groups of investors, e.g.
momentum traders and disposition investors.
Samy Ben Naceur 2003 study the dividend policy of 48 firms listed on the
Tunisian Stock Exchange during 1996-2002 periods. The study tests whether
managers of Tunisian listed firms smooth their dividends or not. Beside, the
study outlines the main determinants that may drive the dividend policy of
Tunisian quoted firms. To answer the first question, we use Lintner’s model
in a dynamic setting. The results clearly demonstrate that Tunisian firms rely
on both current earnings and past dividends to fix their dividend payment.
However, the study shows that dividends tend to be more sensitive to current
earnings than prior dividends. To find out the determinants of dividend
policy, dynamic panel regressions have been performed. First, profitable
firms with more stable earnings can afford larger free cash flows and thus,
pay larger dividends. Furthermore, they distribute larger dividends whenever
they are growing fast. However, neither the ownership concentration nor the

22
financial leverage seems to have any impact on dividend policy in Tunisia.
Besides, the liquidity of stock market and size negatively impacts the
dividend payment. The results are somewhat robust to different specifications.
Samy Ben Naceur 2003 since few decades, a wide theoretical debate is
concerned with the fundamental relationship between financial development
and economic growth. An efficient financial system leads to a sustainable
economic growth. In this study, we are interested especially with stock
markets as a main component of the financial system according to the
increasing role of financial markets in economies. So, their evolution plays an
important role in economic growth. We shed some light on the
macroeconomic determinants which must have an important influence on
stock markets development. It is recognized that real or financial variables
such as real income, saving rate, credit to private sector, M3, value traded,
turnover, etc. could have a significant impact on market capitalization. The
empirical study is conducted using an unbalanced panel data from twelve
MENA region countries. Econometric issues are based on estimation of some
fixed and random effects specifications. With such specifications in mind,
peculiarities of MENA region countries are detected as well as
differentiations among them. Thus, differences in market capitalization are
explained. The empirical expected results must reinforce the idea which
suggests the important role of economic development in promoting stock
market development. Explaining power of variables such as real income,
saving rate, inflation, financial intermediary development and stock market
liquidity is confirmed. Banks and stock markets seem to be complements
instead of substitutes.
Samy Ben Naceur 2005 since few decades, a wide theoretical debate is
concerned with the fundamental relationship between financial development
and economic growth as well as the separate impact of banks on growth and
financial markets on growth. Recent studies shed some light on the
simultaneous effect of banks and financial development on growth. The
empirical study is conducted using an unbalanced panel data from ten MENA

23
region countries. Econometric issues will be based on estimation of a
dynamic panel model with GMM estimators. Thus, peculiarities of MENA
region countries will be detected. The empirical results reinforce the idea of
no significant relationship between banking and stock market development,
and growth. The association between stock markets and growth is even
negative after controlling for bank development. This lack of relationship
must be linked either to underdeveloped financial systems in the MENA
region that hamper economic growth or to unstable growth rates in the region
that affect the quality of the association between finance and growth.
Moreover, in most transition economies the stock markets are very thin. This
may lead to excessively volatile share prices. According to Singh (1997),
stock price volatility may seriously hamper economic development.
Putu Anom Mahadwartha’s examines the relationship of financial policy
(dividend and leverage) influenced managerial ownership. Managerial
ownership as dependent variable regressed with dividend and leverage policy
that already separate the effect of agents and insiders wealth. Logit Model is
use to examine the relationship because managerial ownership proxy by
dummy variable. Hosmer-Lemeshow and Andrews Goodness-Of-Fit test used
to conclude the model fitted. Result showed a significant relationship that
financial policy influenced probability firm engages in managerial ownership
program. Dividend policy is a substitute for managerial ownership. The lower
dividend level will increase the probability of the firm engage in managerial
ownership program and still maintain the effectiveness of reducing agency
cost of equity. The lower leverage level will increase the probability of the
firm engage in managerial ownership program to multiply the effect of
reduced agency cost of debt with the reduction in agency cost of equity.
The paper is expansion from Mahadwartha (2002b) that is use Logit model to
test the predictability power of leverage policy and dividend policy to
managerial ownership policy. Leverage and dividend variable used already
divided the interest of inside shareholders and outside shareholders. The paper
also uses a modification on managerial ownership variable with lead one year

24
after (t+1), an addition of control variable (current assets) to increase
predictability model. The research period is from 1993 until 2001. The
research argues that leverage policy and dividend policy have higher effect on
managerial ownership in t+1 than t. The result shows consistency regarding
predictability power of leverage policy and dividend policy to managerial
ownership. Also shows that the predictability power is higher than
Mahadwartha (2002b). The relationship between leverage and dividend to
managerial ownership is negative with higher magnitude than Mahadwartha
(2002b). The results consistent with Agency Theory prediction, that there is
substitution between policies in bonding and monitoring mechanism to
control agency conflict.
The paper analyzes the relationship between managerial ownership with
leverage policy and dividend policy (balancing model of agency theory) and
interdependency of dividend and leverage (contracting model of agency
theory). The research also test collateral and growth hypothesis. Leverage and
dividend policy variables used in this study are already excluded outside
shareholders interest. Results show that managerial ownership as self bonding
and self monitoring in controlling agency conflict concern on the balancing
model of agency cost. Agency theory variables (dividend and leverage)
partially explain interdependency between leverage and dividend policies.
Relationships between dividend influenced leverage significantly explained
by contracting model of dividend but relationship between leverage
influenced dividend fail explained by balancing model of agency cost. The
results also support collateral and perquisites hypotheses. In general agency
costs that occurred in Indonesia are agency costs of debt.
Jeffrey Eugene Nisbett 2003 in this study has attempted to look at the
dividend policies of six public companies in St Kitts and Nevis guided by the
finance literature produced by Lintner, Lease, Glen and others. Our study has
shown that the St Kitts and Nevis companies display dividend payout ratios
which are not as low as those reported by Glen et al [3] for emerging markets
but which are not as high as those which Lease et al [14] reported in respect

25
of firms in the United States. Payout rates for St Kitts and Nevis public
companies averaged 52.88 per cent. This, it is felt, is due to two significant
factors which are perhaps interrelated. In the first place, during most of the
period studied, there was no market for trading shares until the ECSE was
established in 2001. Secondly, and somewhat related to the first factor, there
is the preference by companies to use retained earnings as a source of finance,
consistent with the theories of corporate finance that suggest that firms tend to
utilize the cheapest sources of finance first.
It has also been noted that the dividend versus earnings patterns for the
companies show greater variability in earnings. This is consistent with the
trends in other markets as has been observed in the finance literature on
emerging markets by Glen et al. and in developed markets by Lease et al.
Kai Li in this paper examines how informational asymmetries affect firms’
dividend policies. We find that, controlling for other factors that determine
dividend policy, firms more subject to information asymmetry are less likely
to pay, to initiate, or to increase dividends, and pay a lower amount of
dividends. We show that our main inferences are not driven by the sample
used in our study and remain the same after accounting for the changing
composition of payout over the sample period, the increasing importance of
institutional shareholdings, and the catering incentives. We conclude that our
evidence does not support the signaling view of dividends, but is strongly
consistent with the pecking order view of dividends.
In this paper, Deniz lgan 2004 develop a model involving both
corporatenance and market microstructure elements to analyze the impact of
shareholder need for liquidity on the rm™s decision to pay dividends.
Shareholders face a trade-o¤ between expected returns and adverse selection
costs. In equilibrium, some rms pays dividends and has lower growth
prospects but a more liquid market. Other rms option is to have a better
growth outlook by keeping the free cash-flow in order to invest if an
opportunity presents itself. The decision to pay dividends depends directly on

26
how much importance the rm™s manager attaches to
shareholders™objectives and on the liquidity of dividend paying –rms. We
then test the implications of our model closely following Fama & French
(2001), with the exception that we add measures for liquidity and shareholder
power to the list of explanatory variables as suggested by our theory. Firms
are more likely to pay dividends if they have more liquid stocks and if their
shareholders enjoy more power.
H. Kent Baker 2005 reports the results of a 2004 survey from managers of
dividend-paying Norwegian firms listed on the Oslo Stock Exchange about
their views on dividend policy. Specifically, we identify the most important
factors in making dividend policy decisions and managers’ views about
various dividend-related issues. The most important determinants of a firm’s
dividend policy are the level of current and expected future earnings, stability
of earnings, current degree of financial leverage, and liquidity constraints. No
significant correlation exists between the overall rankings of factors
influencing dividend policy between Norwegian and U.S. managers.
Norwegian managers express mixed views about whether a firm’s dividend
policy affects firm value. Respondents point to the possible role of dividend
policy as a signaling mechanism. No support exists for the tax-preference
explanation for paying dividends.
An empirical research has been made about managers of firms that
consistently pay cash dividends to determine their views about dividend
policy, the relationship between dividend policy and value, and four common
explanations for paying dividends. The evidence shows that managers stress
the importance of maintaining dividend continuity and widely agree that
changes in dividends affect firm value. Managers give the strongest Support
to a signaling explanation for paying dividends, weak to little support for the
tax-preference and agency cost explanations, and no support to the bird-in-
the-hand explanation (see H.Kent Baker [2002]). This study provides
evidence about how managers view dividend life cycles and residual dividend
policy.

27
Jennifer L. Blouin 2003 the Jobs and Growth Tax Relief Reconciliation Act
of 2003 reduces the maximum statutory tax rate on dividends from 38.1
percent to 15 percent. The purpose of this paper is to analyze dividend
distributions in the quarter immediately following passage of the Act to assess
the extent to which companies increased their dividend payments in response
to the lower tax rate. We find an overall increase in dividend payments
following enactment. In addition, we find that a firm’s dividend increases are
positively correlated with the percentage of its shares held by individuals.
However, the association only exists only for non-financial firms and is
concentrated among a few firms that made large, special dividends.
Alon Bray 2004 surveys 384 financial executives and conduct in depth
interviews with an additional 23 to determine the factors that drive dividend
and share repurchase decisions. Our findings indicate that maintaining the
dividend level is on par with investment decisions, while repurchases are
made out of the residual cash flow after investment spending. Perceived
stability of future earnings still affects dividend policy as in Lintner (1956).
However, fifty years later, we find that the link between dividends and
earnings has weakened. Many managers now favor repurchases because they
are viewed as being more flexible than dividends and can be used in an
attempt to time the equity market or to increase EPS. Executives believe that
institutions are indifferent between dividends and repurchases and that payout
policies have little impact on their investor clientele. In general, management
views provide little support for agency, signaling, and clientele hypotheses of
payout policy. Tax considerations play a secondary role.
Using data on corporate profits forecasts from the Survey of Professional
Forecasters, Sean D. Campbell 2005 decompose real stock returns into a
fundamental news component and a return news component and analyze the
effects of the Great Moderation on each. Empirically, the response of each
component of real stock returns to the Great Moderation has been quite
different. The volatility of fundamental news shocks has declined by 50%
since the onset of the Great Moderation, suggesting a strong link between

28
underlying fundamentals and the broader macro economy. Alternatively, the
volatility of return news shocks has remained stable over the Great
Moderation period. Since the bulk of stock market volatility is attributable to
return shocks, the Great Moderation has not had a significant effect on stock
return volatility. These empirical findings are shown to be consistent with
Campbell and Cochrane’s (1999) habit formation asset pricing model. In the
face of a large decline in consumption volatility, the volatility of fundamental
news shocks declines while the volatility of return shocks stagnates.
Ultimately, the effect of a Great Moderation in consumption volatility on
overall stock return volatility in the habit formation model is slight.
Michael Bradley 1998 explores the role of expected cash flow volatility as a
determinant of dividend policy both theoretically and empirically. Our simple
one period model demonstrates that, given the existence of a stock-price
penalty associated with dividend cuts, managers rationally pay out lower
levels of dividends when future cash flows are less certain. The empirical
results use a sample of REITS from 1985-1992 and confirm that payout ratios
are lower for firms with higher expected cash flow volatility as measured by
leverage, size and property level diversification. These results are consistent
with information-based explanations of dividend policy but not with agency
cost theories.
Larry R. Gorman investigate whether the changes in profitability and risk for
firms that resume dividend payments are more like the changes observed
around dividend initiations or dividend increases. We find that firms that
resume paying dividends are in the midst of a long-term trend of positive
stock price performance. The return on assets of firms that resume paying
cash dividends increases leading up to the event and for one to two years
thereafter. We also find a significant and apparently permanent reduction in
stock return volatility following the resumption of regular cash dividends. Our
results indicate that the changes in profitability and risk around dividend
resumption are most similar to those observed around dividend initiation.

29
In this paper Edith S. Hotchkiss 2003 provides new evidence the existence of
dividend clienteles. Our approach is to directly examine individual
institutional shareholders’ preferences for dividend paying stocks based on
the characteristics of stocks held in their portfolio. Many institutions follow
persistent investment styles, maintaining relatively high or low dividend yield
portfolios over time. Higher dividend yield firms tend to attract “high yield”
investors, which we define as institutions that hold portfolios of higher
dividend yield stocks. Stock price reactions to announcements of dividend
increases are related to characteristics of the institutions holding the stock and
are generally consistent with predictions of the clientele hypothesis. We also
observe significant changes in characteristics of institutions holding the stock
around dividend changes; dividend increases (decreases) are associated with
increased (decreased) holdings by institutions that appear to prefer dividends
based on their prior portfolio choices. Finally, we examine the trading
behavior of individual institutions and find that institutions that prefer
dividends have a significantly greater probability of increasing (decreasing)
their holdings in response to a dividend increase (decrease). However, we find
little evidence to support the idea that it is the tax status of the investor that
drives clientele behavior.
J. Bradfor De Long 1993 studies “excess volatility” in long-run British stock
prices over the period from 1870–1990. We find that the British stock market
does exhibit “excess volatility” if the pre-WWI period is included in the
sample. British price/dividend ratios before World War I were low relative to
those of other nations or to post-WWI Britain, suggesting that pre-war
investors were extraordinarily suspicious of those equities quoted on the
market. This fear of equities may have caused the British stock market to
perform poorly as a social capital allocation mechanism before World War I,
and may have played a role in British industrial decline.
Shamila Jayasuriya 2002 uses an asymmetric GARCH methodology to
examine the effect of stock market liberalization on stock return volatility for
fifteen emerging markets for the period December 1984 – March 2000. We

30
construct a long period of liberalization that captures all identified market
openings for each emerging market, and study the change in volatility both in
and after the liberalization period. We find that volatility may decrease,
increase, or remain unchanged due to liberalization. In addition, countries that
experienced higher post- liberalization volatility can be differentiated by
market characteristic s such as lower market transparency, lower investor
protection, and higher market exit restrictions.
Martin D. D. Evans 2005 in this paper examines the extent to which swings in
stock prices can be related to variations in the discounted value of expected
future dividends when investors face uncertainty about their future behavior. I
develop an econometric model that accounts for the instability of U.S.
dividend growth and discount rates during the past 120 years. Estimates of the
model reveal that changing forecasts of future dividend growth account for
more than 90% of the predictable variations in dividend-prices. The estimates
also imply that instability in the dividend and discount rate processes
contribute significantly to the predictability of long-horizon stock returns.
Data on corporate announcements of Chinese firms over 1991-2003 allow us
to examine the preference for and determinants of cash and stock dividends.
The results indicate that Chinese public investors prefer stock dividends over
cash dividends, while cash dividends are preferred by large non-tradable
shareholders, but not by public investors generally Louis T. W. Cheng 2006.
Stock dividends, which do not require explicit cash outflow from the firm, are
positively related to higher earnings and higher return on assets, supporting
the signaling hypothesis of dividend policy. Our results provide strong
evidence for the hypothesis that stock and cash dividends are substitutes. In
an imperfect market, these results have some implications for government
regulation of financial markets.
Michael Bremman 1997 the determination of stock prices and equilibrium
expected rates of return in a general equilibrium setting is still imperfectly
understood. In particular, as Grossman and Shiller (1981) and others have
argued, stock returns appear to be too volatile given the smooth process for

31
dividends and consumption growth. Mehra and Prescott (1985) claim that this
smoothness in consumption and dividend growth gives rise to an “equity
premium paradox” since it makes it impossible to explain the equity risk
premium with a risk aversion parameter of less than an implausible 35. This
paper reconciles the apparent smoothness of aggregate dividends and the
volatility of observed stock prices by developing a model of stock prices in a
dynamic general equilibrium setting in which learning is important.
Dividends, which are one component of the aggregate consumption
endowment, are assumed to follow a stochastic process with a mean-reverting
drift that is not directly observable by the representative agent but must be
estimated from the realized growth rates of dividends and aggregate
consumption. The stock price-dividend ratio is shown to depend on the
current estimate of the dividend growth rate as well as on the level of un-
certainty about the true growth rate. This non observability of the growth rate
of dividends introduces an element of learning into the stock valuation
process which is shown to increase the volatility of the stock price and
therefore reduce the level of risk aversion required to explain the equity
premium. The model is calibrated to the observed joint dividend and
consumption process for the US, and is shown to yield an interest rate and
stock price process that conform closely to the stylized facts for US capital
markets.

32
C h a p t e r 3
HYPOTHESIS AND DATA METHODOLOGY
Hypothesis
H1: There is a positive and significant abnormal return at the announcement of
a dividend.
H2: There is a negative and significant abnormal return at the announcement
of a dividend.
Data and Methodology
Event announcement dates for both cash and stock dividends (bonus issues)
were collected from web site of Karachi Stock Exchange which managed the
stock market officially during the period when daily stock returns were
available. Firms that were listed in the stock exchange during this period had
to officially inform the management of their dividend payouts both in cash
and in stock. The date of that communication constituted the event date. In
general, that date coincided with a board of directors’ meeting since the
decision presupposed approval by the board.
Cash dividend payouts are usually announced semi-annually by the larger
public firms and annually by the smaller firms in the Karachi Stock Exchange
(few quarterly dividend announcements were observed during the sample
period). Other types of announcements coinciding with confounding dividend
announcements were very rare during the sample period. For example, the
takeover of a public firm, stock split and share repurchases. These are
restricted by the regulatory bodies. Infrequently, dividend announcements
were accompanied by real-time earnings announcements. However, no
separate record of these announcements was kept and given the fairly limited
number of usable observations in my analysis I have decide on not to discard
any observations on the basis of other contemporary new releases. In any
case, the statistical significance of the market reaction to the events under
consideration is similar using both the parametric and non-parametric tests,

33
providing reasonable assurance that the documented market reactions are not
the result of a few outliers that are potentially confounded by coincident
earnings announcements.
A total of 161 announcements by 37 different firms took place during the
period under study. Of these, a large number of cash dividends represented an
increase over prior period cash dividends and comprise the dividends sample
employed period. Further announcements of stock dividend by different firms
took place in the sample period and comprise the stock dividend samples.
It should be noted that all firs in the Karachi Stock Exchange have highly
concentrated ownership structures. As discussed earlier, few top firms out of
100 index listed at the Karachi Stock Exchange over the sample period are
included in samples of dividends (37 firms out of 100 indexes). Therefore,
our sample firm’s ownership structure is substitutes well by the wider
ownership characteristics of the population. KSE regulations mandate that a
single ownership interest may not own more than 70% of the voting class of
securities of any public firm. Further, the four largest shareholders
collectively may not own more than 75% of the shares, ensuring that at least
25% of the voting stock is dispersed among the public. Importantly, in all
firms that are traded in the KSE the four largest investors own at least 50% or
more of the outstanding stock; that percentage routinely fluctuates between
65% and 75%. This suggests very little cross-sectional variation in ownership
concentration in the KSE. Unfortunately, such uniformity forbids us from
performing any meaningful statistical tests using differences in ownership
structure to differentiate between alternative explanations for dividend
changes across firms.
For completion of this study I used an electronic database with daily stock
returns of all firms traded in the Karachi Stock Exchange during the period
developed by one of the author. Given the lack of liquidity for the period
examined, in certain days no trading took place for some of the stocks. In
such cases I assumed that the closing price was the mid-point between the
bids and ask prices for that day. The shareholder wealth effect for the

34
dividend announcements was determined using standard event-study
methodology based on the single-factor market model (using risk adjusted
returns), as well as the market-adjusted model (assuming a beta of 1 for all
firms). Specifically, the assessment of announcement-related abnormal
returns follows standard event-study methods (e.g., Dennis and McConnell,
(1986) and was carried out as follows. First, each firm’s returns were assumed
to follow the single-factor market model,
Rj, t = aj + bjRm, t + ej, t ,
where Rj,t is the rate of return of the common stock for the jth firm on day t,
Rm, t is the rate of return for the (equally-weighted) market index (m) on day
t, and ej, t is a random variable that is expected to have a value of zero. The
abnormal return (AR) for the jth common stock on day t is given by
ARj, t = Rj, t – (aj + bjRm, t),
where the coefficients a and b are Ordinary Least Squares estimates of aj and
bj, estimated from a regression of daily security returns on daily market
returns from t = –200 to t = –51 (where t = 0 is the event date). In thin
markets such as the Cyprus Stock Exchange, autocorrelation in daily returns
may lead to shifts in the betas. To address this concern, the betas for all firms
that were traded in the CSE were re-estimated to account for beta shifts in
time. Autocorrelation-adjusted betas were estimated using daily, weekly, and
monthly returns over this period. Two adjustment techniques were used: The
Scholes and Williams (1988) technique, where one lead and one lag beta
factor are added to the standard market model, and the Dimson (1988)
technique where three lagged or three lead beta factors are added to the
standard market model. With a few negligible exceptions, these checks
suggest that the betas under these two methods are not substantially different
from the betas provided by a standard OLS market model regression,

35
suggesting that autocorrelation does not meaningfully affect our results. Beta
comparisons under the three methods are available from the authors upon
request.4 Another method we used to estimate abnormal returns to further
check the sensitivity of our results was simply to subtract the market return
(using the equally-weighted market index), Rm,t, from the corresponding firm
return over a given period t.5 That is,
ARj, t = Rj, t – Rm, t.
This approach makes the assumption that the beta for all firms is 1 (and aj =
0), thus providing an extreme test of the sensitivity of the results to beta
estimation or shifts. Cross-sectional average daily risk-adjusted and market-
adjusted returns are then computed for each class of securities as
where N is the number of events in the sample. Additionally, cross-sectional
average risk-adjusted returns are summed to yield a cumulative risk-adjusted
return for event day t as
where T is a specified number of event days prior to the event day t. To test
the null hypothesis that the average daily risk-adjusted return on event day t is
equal to zero, we computed the t-statistic

36
where
is the cross-sectional standard deviation of risk-adjusted returns on event day
t. Under the null hypothesis of no abnormal security performance, t is
distributed according to the t-distribution with N–1 degrees of freedom.
To test the null hypothesis that the CAR over an interval of I days is equal to
zero, a t-statistic is computed as:
Where
where I is the interval length prior to event day t and CARI is the cumulative
risk-adjusted and market-adjusted return over the I – day interval beginning
with event day t – I and ending with event day t. Under the null hypothesis of
no abnormal performance tI is distributed unit normal with I degrees of
freedom.
It is important to emphasize that our market-adjusted results abstract from
beta estimation or beta shift issues. As it turns out, these results are very
similar to the results using the market model adjustments. Therefore, the
estimation and stability of the betas is unlikely to be a major determinant of
the results that are reported in this paper.

37
C h a p t e r 4
DATA ANALYSIS
4.1 Presentation and Discussion of Results
Table 1, panel A presents the event days before, on event and after the event
(announcement) of cash or stock dividend. Panel B shows daily abnormal
returns (AR) for days –4 to +4 and panel C shows the cumulative abnormal
return (CAR) results for the samples cash dividend increases and stock
dividend (bonus) announcements over alternative event-period windows.
Focusing on the average daily abnormal return on panel B, we observe that 3
of the eight returns are positive and days 0 and -1 are statistically significant.
Average daily abnormal returns on days -3, -2, 2, 3 and 4 are negative and
days -3 and +2 are statistically significant.
Event Days AVEG(ARjt) STDV(ARjt) -4 0 0 -3 -0.05564 0.73175 -2 -0.00132 0.02598 -1 0.00327 0.02675 0 0.00542 0.03403 1 0.00064 0.02982 2 -0.00301 0.03782 3 -0.00397 0.0232 4 -0.00063 0.02414
Total -0.0069 0.0915
Table 1 Moving to cumulative abnormal returns in panel B, a conventional day
window (sum of average abnormal returns) reveals a marginally insignificant
negative wealth effect surrounding the cash and stock dividend increase
announcements (marginally insignificant using market-adjusted returns).
38
When the event take places Panel C of the table measures the change in
abnormal returns of the “j” security on “t” time which is statistically
significant on days -3 and +2. The change in CAR is measured as 0.9335.
Interestingly, abnormal returns are statistically significant and insignificant on
different days prior to the announcement that is positive on -1 and 0 and
negative on -3 and -2. However after the announcement results are negatively
significant on days 2, 3 and 4 on only positive at on day +1. The sum of
average abnormal returns is -0.0069. Overall, the results in table are
supportive of hypothesis H2. The negative stock market reaction to dividend
increases is at odds with a tax-motivated shareholder preference for (non-
taxable) capital gains over dividend income, but is inconsistent with an
information-signaling role for cash dividend increases. Although a standard
free-cash-flow/ over investment explanation is less likely to directly apply in
the KSE setting due to concentrated ownership structures, the negative
reaction is also inconsistent with a reduction in potential exploitation of
smaller shareholders by larger ones. Panel B shows significant negative daily
abnormal returns on four days surrounding the announcement. In fact the
results are in agreement with the result of developed markets.

39
C h a p t e r 5
CONCLUSION
The research has naked a very dynamic and rapidly evolving industry of stock
exchanges. Volatility among stock exchanges is an interesting phenomenon.
This paper is an attempt to determine the effect of dividend announcement on
the shareholders wealth. The dissertation examines the stock market reaction
to announcements of cash dividend increases and bonus issues (stock
dividends) in the emerging stock market of Karachi Stock Exchange. Both
events elicit significantly negative abnormal returns, in line with evidence
from developed stock markets. This study contends that special
characteristics of the Karachi stock market delimit applicability of most
traditional explanations for cash and stock dividends in favor of an
information-signaling explanation. The findings have several implications.
The empirical results are generally in agreement with these contentions. A
sample of 162 listed companies in Karachi Stock Exchange is examined for a
period from Aug-2004 to Oct-2006. The empirical estimation is based on a
cross-sectional regression analysis of the relationship between stock price
volatility and dividend announcement Dividend policy have significant
impact on the share price volatility. This suggests that dividend policy affects
stock price volatility and it provides evidence supporting the arbitrage
realization effect, duration effect and information effect in Pakistan. In
general corporate payout policy in emerging markets should be interpreted in
backdrop of different market microstructures, tax regimes and control
environments. In many emerging markets, the issue of corporate credibility is
on of the most significant challenges faced by public firms in raising capital.
The problem springs, in par, from the investing public’s unfamiliarity with the
market mechanisms, the lack of transparency and, in some cases, with a
culturally-based suspicion against big businesses, managerial intentions and
side-activities.

40
APPENDICES

41
APPENDIX 1
KARACHI STOCK EXCHANGE PUBLICATIONS
ANNOUNCEMENTS HISTORY FOR THE PERIOD OF 02AUG-2004 TO 19OCT-2006 SHARES PRICES
COMPANY NAME
EVENT DATE DIVIDEND T= -4 T= -3 T= -2 T= -1 T= 0 T = 1 T = 2 T = 3 T = 4
Shell Pakistan 19-Aug-04 285.00% 440 425 422 427 425 427 426 436 430
GlaxoSmith 20-Aug-04 20.00% 211 211 212 212 220 233 229 228 228 National Refinery 30-Aug-04 100.00% 233.5 224 216 224.85 217.5 221.5 221.5 223 233.9
Lakson Tobacco 7-Sep-04 105.00% 259.5 260 260 247 235.05 223.3 229.9 220 219
Fauji Cement 8-Sep-04 0.00% 15.75 15.65 15.35 14.25 14.35 13.95 14.1 13.75 13.45
Attock Refinery 13-Sep-04 40.00% 78.2 78.5 80.25 79.9 83 83.5 87 87.4 87.35
Gatron Ind. 13-Sep-04 50.00% 166.25 166 170 174 165.3 162 158.6 159 170.9
Pak Oilfields 13-Sep-04 125.00% 203 203.7 205.25 204.7 201 201 200.2 197.5 199.55
Pak Refinery 14-Sep-04 25.00% 163 163 161.25 158 150.1 142.6 136.55 134.9 135
Indus MotorXD 16-Sep-04 50.00% 94.5 94.45 94.5 94 96 92 91.8 89.05 89.75
Nishat Mills 18-Sep-04 20.00% 75 73.95 75.25 77.25 76 78 80.75 79.55 80
Millat Tractors 21-Sep-04 50.00% 292 292 290 300 322.5 340 340.95 340 343
Millat Tractors 21-Sep-04 50.00% 292 292 290 300 322.5 340 340.95 340 343
Oil & Gas Dev. 22-Sep-04 12.50% 60.65 59.8 59.9 59.15 58.4 59.15 60.3 60.6 61.8
Sui North Gas 25-Sep-04 25.00% 54.2 54.1 53.1 53.15 52.55 54.3 55.35 56.65 56.25
P.T.C.L.A 29-Sep-04 50.00% 40.2 42.3 42.15 41.85 43.7 43.7 43.7 43.75 43.25
Sui South Gas 30-Sep-04 15.00% 56.25 56.45 56.05 55.95 55.7 54.75 54.85 54.5 56.05 Dawood Hercules 18-Oct-04 166.8 167 165 166 161.3 161 170 167 167.95
Engro Chemical 20-Oct-04 98 97 96.5 99.2 99.6 100.05 100.1 99 96.65
Pak Tobacco 20-Oct-04 10.00% 48.95 48.5 46.2 49.65 49.75 48.15 49.5 48.05 48
Fauji FertilizerX 27-Oct-04 112.5 112.2 112 112.25 115.75 115 115.7 114.9 115.6
Oil & Gas Dev. 27-Oct-04 66.15 66.35 67.2 66.55 66.65 66.35 65.75 66.75 66.35
MCB Bank 1-Nov-04 50 50.1 49.35 48.7 47.15 48.65 48.55 48.75 48.8 Siemens Engineeri 23-Nov-04 300.00% 550 525 525 525 564.35 585 585 561 561
Gadoon Textile 7-Dec-04 25.00% 71 71 70.3 70.05 69 69.5 73 73.5 74.5
Shell Pakistan 19-Jan-05 80.00% 549.35 562 579 580 564.9 563.5 551.3 560 550
Clariant Pak 25-Jan-05 75.00% 220 231.95 231.8 239 228 218.05 210.1 201.4 202
International Ind 26-Jan-05 285 287 297.95 283.5 304.75 326 319 321 323.4
Lakson Tobacco 26-Jan-05 20.00% 280.05 286.2 286.2 288 305 310 308 300 300
Fauji FertilizerX 31-Jan-05 15.00% 147 146.75 143 149.2 151.2 153.9 156 156.6 156.4
Fauji FertilizerX 31-Jan-05 30.00% 147 146.75 143 149.2 151.2 153.9 156 156.6 156.4 Pak PetroleumXD 31-Jan-05 25.00% 253 250.45 247.75 241 240.9 248.75 253.55 253.25 252
Engro Chemical 10-Feb-05 40.00% 129 129.5 127.8 126.75 125.25 125.8 129.15 130.4 129.45
MCB Bank 15-Feb-05 10.00% 75.45 75.2 75.65 75.25 75 76.55 82 81.75 84.85
Rafhan Maize 15-Feb-05 200.00% 650 650 650 650 617.5 634.95 605 620 645
P.S.O. 21-Feb-05 359.75 362.8 366.75 385.8 391 394.2 402.5 402 401

42
COMPANY NAME
EVENT DATE DIVIDEND T= -4 T= -3 T= -2 T= -1 T= 0 T = 1 T = 2 T = 3 T = 4
Pak Refinery 21-Feb-05 25.00% 213 208 212.5 228.4 238 250 258.1 263 260
Indus MotorXD 22-Feb-05 40.00% 119.5 118 119 123 124 124 122 117.25 116 National Refinery 23-Feb-05 50.00% 347 350 355 381.5 409 435 450 442 430
P.T.C.L.A 24-Feb-05 20.00% 68.2 68.65 67.8 69.35 68.5 68.2 68.1 68.95 68.4
ICI Pakistan 25-Feb-05 40.00% 104 106.4 109.9 105.75 109.25 110.7 116.75 110.95 115.25
Pak Tobacco 1-Mar-05 12.00% 64 64 63.8 62.5 62.5 59.5 61.5 61.5 61.5
Hub Power 3-Mar-05 13.00% 33.35 33.5 33.3 32.8 31.85 30.8 30.45 31.8 31.25
Nestle Pakistan 8-Mar-05 50.00% 524.95 491 491 491 490.05 490.05 490 490 490
National Bank 18-Mar-05 20.00% 159.5 161.75 161 152.95 145.35 138.1 131.2 124.65 118.45
National Bank 18-Mar-05 15.00% 159.5 161.75 161 152.95 145.35 138.1 131.2 124.65 118.45
GlaxoSmith 21-Mar-05 70.00% 199 190.05 183 195 200 190 180.9 173 173 Dawood Hercules 22-Mar-05 45.00% 201 190.95 193 186 176.7 168.05 179 170.05 178
Pak Suzuki 25-Mar-05 10.00% 165 158 152 144.4 137.2 130.35 139 149.4 148
Rafhan Maize 18-Apr-05 70.00% 680 680 680 680 680 680 680 680 680
Attock Refinery 19-Apr-05 20.00% 207 208 195.65 182 186 190 187 187.25 174.2 Dawood Hercules 25-Apr-05 25.00% 183 180 175.5 171 177 176 184.8 190 190.25
Oil & Gas Dev. 25-Apr-05 97.55 92.7 93.25 95.15 92.7 97.3 100 96.75 95.6
Fauji FertilizerX 26-Apr-05 15.00% 135.9 137.25 138 135 141.75 148.5 144.15 145 141
Fauji FertilizerX 26-Apr-05 25.00% 135.9 137.25 138 135 141.75 148.5 144.15 145 141 Siemens Engineeri 28-Apr-05 595 595 595 595 580 580 580 580 580
MCB Bank 29-Apr-05 17.50% 69.8 70.5 74 76 75.35 71.6 73 72.2 75.5
Honda Atlas Cars 5-May-05 22.50% 75 73.85 73.85 74 77.5 73.65 70 66.5 63.2
Rafhan Maize 20-Jul-05 80.00% 601 601 601 601 601 601 601 601 601
Clariant Pak 25-Jul-05 65.00% 161 161 167.5 169 172 169 169 166.15 169
Engro Chemical 27-Jul-05 30.00% 122.5 122.95 120.7 119.75 116.25 117.85 116 115.05 116.3
Fauji FertilizerX 28-Jul-05 15.00% 132.5 131.5 133.5 132.5 134.1 134.15 134.8 135 134.3
International Ind 28-Jul-05 37.50% 98.5 95.6 98.95 98.75 100 100 91.5 91 94.35
P.S.O. 28-Jul-05 100.00% 378 383 381.8 378.25 371.9 373.35 370.65 374.25 377
Shell Pakistan 4-Aug-05 25.00% 561 579 575 583 612 615 599 599.8 598.4
Shell Pakistan 4-Aug-05 270.00% 561 579 575 583 612 615 599 599.8 598.4
Pak Tobacco 9-Aug-05 25.00% 55.6 56 55 55 54.5 54.25 52 54.6 57.3
Adamjee Ins. 11-Aug-05 15.00% 82 82.45 80 76 75 78.7 76.9 76.6 76.15
Lakson Tobacco 15-Aug-05 145.00% 239 235 235 244 245 244 235 235 239
ICI Pakistan 24-Aug-05 20.00% 79.7 80 78.1 80 81.7 85.5 83.5 83.55 86.6
Pak Refinery 25-Aug-05 25.00% 223.3 221 220.95 226.4 221.85 220.4 229 233.5 245
GlaxoSmith 26-Aug-05 187.5 196.85 201.25 207 207.05 204.05 203.5 202.1 203 Pak PetroleumXD 29-Aug-05 30.00% 331 335.5 336 339.05 348.75 349.7 351.5 347 364.35
Attock Refinery 2-Sep-05 30.00% 170 178.5 187.4 187.4 193.75 185.5 191.5 189.8 195.05
Hub Power 2-Sep-05 26.00% 26.5 26.7 27.6 27.2 27.8 28 28 28 28.15
Hub Power 3-Sep-05 16.00% 30.95 31.05 31 31.05 31.05 30.5 30.65 31.05 30.9 National Refinery 5-Sep-05 75.00% 337 353.85 363.5 362 343.9 326.75 321 337 350
Fauji Cement 7-Sep-05 0.00% 14.15 13.75 13.7 13.9 14.45 14.5 14.6 15.05 14.8

43
COMPANY NAME
EVENT DATE DIVIDEND T= -4 T= -3 T= -2 T= -1 T= 0 T = 1 T = 2 T = 3 T = 4
Pak Oilfields 12-Sep-05 125.00% 359.95 349.4 354.9 355.5 352.25 340.6 352.85 354 352.75
Indus MotorXD 16-Sep-05 60.00% 113 118.6 117.5 115.05 117.45 117.35 123 123.85 122.75
Nishat Mills 19-Sep-05 25.00% 104 102.6 106 105.5 102 107.1 111.4 112.3 111
Oil & Gas Dev. 19-Sep-05 27.50% 109.5 110.15 110.25 109.25 110.5 112.25 113.7 113.5 113.35
Millat Tractors 20-Sep-05 150.00% 263 274.75 282 296.1 303.1 314 324.5 334 341
Millat Tractors 20-Sep-05 30.00% 263 274.75 282 296.1 303.1 314 324.5 334 341
Gatron Ind. 22-Sep-05 30.00% 153.95 152 151 152 149 142 135 140 133.05
P.T.C.L.A 27-Sep-05 0.00% 66.1 64.55 64.65 66.05 64 63.1 60 61.5 61.95
Sui South Gas 29-Sep-05 15.00% 66 66.35 65.25 64 62.9 64.4 64.5 64.2 64.75
Sui North Gas 30-Sep-05 30.00% 66.35 65.25 64 62.9 64.4 62.2 60.55 57.7 59.7
Fauji Cement 3-Oct-05 5.00% 20.75 21.2 21.3 21.5 21.1 20.8 21 21.15 21.1 Dawood Hercules 24-Oct-05 20.00% 207 208 209.5 208 208 207 203 207 208
Fauji FertilizerX 26-Oct-05 32.50% 133 135 137 134 138.75 137.3 135.3 136.85 139.5
Fauji FertilizerX 26-Oct-05 10.00% 133 135 137 134 138.75 137.3 135.3 136.85 139.5
Pak Refinery 26-Oct-05 25.00% 340 345.5 350 346 363.3 381.45 400.5 413 417
Oil & Gas Dev. 29-Oct-05 12.50% 108.95 107.4 104.7 105.7 106.6 104.7 107.4 111.6 110.75
MCB Bank 31-Oct-05 15.00% 142.8 145.35 144 149.8 146.8 151.9 150.8 148.4 152.5
P.S.O. 31-Oct-05 60.00% 402.2 413.55 403.25 411 410 411 415.25 419.75 421.5 Siemens Engineeri 22-Nov-05 240.00% 739 740 764.9 730 760 784 805 845.25 865
International Ind 23-Jan-06 20.00% 156.8 156.5 156 154.5 146.8 139.5 127.25 133.45 129.35 Pak PetroleumXD 27-Jan-06 35.00% 453.25 444 444.1 459 458 459.8 457.75 460.75 455.5
Siemens Engineeri 27-Jan-06 60.00% 1055 1055 1055 1055 1060 1055 1055 1055 1055
Clariant Pak 30-Jan-06 35.00% 222.45 227.25 225 236.25 248.05 260.45 205.15 194.9 190
Clariant Pak 30-Jan-06 40.00% 222.45 227.25 225 236.25 248.05 260.45 205.15 194.9 190
Indus MotorXD 30-Jan-06 50.00% 215.05 214 214 215 223 222 210.9 215 217 Dawood Hercules 31-Jan-06 25.00% 420 425 425 426 447.3 426 443.9 450 450
Dawood Hercules 31-Jan-06 15.00% 420 425 425 426 447.3 426 443.9 450 450
Engro Chemical 31-Jan-06 50.00% 189.5 190 188.5 197.9 190.95 196.6 206.4 216.7 213
Fauji FertilizerX 31-Jan-06 22.50% 112.7 114.2 113.7 111 112.1 112.85 113.45 115.05 114.9
Fauji Cement 3-Feb-06 10.00% 24.25 24 24.25 24.65 25.85 27.1 27.4 26.65 26.65 National Refinery 3-Feb-06 35.00% 385 381 384 385 392 398 397.5 386.45 383.15
Pak Oilfields 3-Feb-06 75.00% 459.8 457.75 460.75 455.5 456.5 465 462 473.5 477
P.S.O. 7-Feb-06 401.5 405 405.95 405.8 407 412.45 413.5 416.1 426.7
Shell Pakistan 14-Feb-06 80.00% 726 726.1 740 736 707.9 716 696.6 699 695
Rafhan Maize 15-Feb-06 300.00% 785 790 790 775.1 815.8 777 740 740 740
Hub Power 16-Feb-06 26.6 26.65 26.45 27 26 25.25 25.75 25.15 25.25 United Bank Ltd.S 22-Feb-06 25.00% 125 128 134.4 141.1 148.15 154 151.75 148.5 155
United Bank Ltd.S 22-Feb-06 25.00% 125 128 134.4 141.1 148.15 154 151.75 148.5 155
Millat Tractors 23-Feb-06 295 302 307 310 325.5 324 311 319.95 300
MCB Bank 24-Feb-06 10.00% 251 248.95 256.1 254.25 253.5 250 261 254.7 250.2
MCB Bank 24-Feb-06 20.00% 251 248.95 256.1 254.25 253.5 250 261 254.7 250.2

44
COMPANY NAME
EVENT DATE DIVIDEND T= -4 T= -3 T= -2 T= -1 T= 0 T = 1 T = 2 T = 3 T = 4
Adamjee Ins. 28-Feb-06 15.00% 170 174.25 176 167.2 171.5 165.2 162.6 163.4 155.25
Adamjee Ins. 28-Feb-06 10.00% 170 174.25 176 167.2 171.5 165.2 162.6 163.4 155.25
GlaxoSmith 28-Feb-06 80.00% 199 202.5 205 202.5 197 197.8 196.3 195.75 186
ICI Pakistan 2-Mar-06 30.00% 175.7 181.8 181 172.95 164.35 164.25 156.05 155 147.25
Nestle Pakistan 6-Mar-06 150.00% 800 820 815 815 820 830 800 800 800
Pak Tobacco 8-Mar-06 25.00% 67 67 65 64 60.8 61.75 64.8 61.6 62.4
National Bank 20-Mar-06 25.00% 273 263 266.6 264.6 277.8 284.45 280.5 276.5 280.35
National Bank 20-Mar-06 20.00% 273 263 266.6 264.6 277.8 284.45 280.5 276.5 280.35
Pak Suzuki 27-Mar-06 50.00% 250 254 253 265.55 252.3 247 250 256 258
Lakson Tobacco 19-Apr-06 20.00% 299 299 299 304 306 321 335 347 345
Pak Oilfields 19-Apr-06 50.00% 670.15 703.65 710.7 696 700.15 684 683 678.5 683.8
Rafhan Maize 20-Apr-06 200.00% 777.1 740.1 740.1 740.1 740.1 740.1 777 777 800
Honda Atlas Cars 2-May-06 70.00% 128.95 128.5 127 123 129.15 135.6 142.35 149.45 156.9
P.T.C.L.A 19-May-06 30.00% 54.55 51.85 52.8 50.5 51.25 51.15 51.05 51.25 50.5
Clariant Pak 24-Jul-06 50.00% 184.2 193 202.65 199 192 188 188.25 191.5 188
International Ind 27-Jul-06 30.00% 126.75 133.05 139.7 144.9 152.1 159.7 161 153.35 150.7
International Ind 27-Jul-06 33.00% 126.75 133.05 139.7 144.9 152.1 159.7 161 153.35 150.7
Lakson Tobacco 31-Jul-06 125.00% 299 289 291 292 290 290 289 293 298.4
P.S.O. 3-Aug-06 180.00% 347.3 364.65 378 375 372 370.2 369.65 368.9 360.5
Shell Pakistan 7-Aug-06 220.00% 540 567 595.35 625 650 643 626.1 620 610
Shell Pakistan 7-Aug-06 25.00% 540 567 595.35 625 650 643 626.1 620 610
Hub Power 10-Aug-06 18.50% 25 25 24.95 24.35 24.45 24.2 24.25 24.4 24.65
Oil & Gas Dev. 15-Aug-06 37.50% 145.45 142.3 138.7 134.9 133.25 137.35 137.15 136.75 135.6 National Refinery 17-Aug-06 125.00% 303.8 303 299.9 314.85 318 317.85 309.9 295.25 298
Pak PetroleumXD 17-Aug-06 55.00% 359.45 363 356.25 374.05 382.95 383.25 380.8 370.5 361
Adamjee Ins. 23-Aug-06 12.50% 162.95 167.45 161.5 153.45 160.85 152.85 145.25 152.5 155.05
GlaxoSmith 23-Aug-06 25.00% 195.5 195 196.45 195 196 195 192.95 195.95 194.5
Attock Refinery 28-Aug-06 25.00% 105.95 100.7 99.8 95.9 91.15 106.9 106 103.4 100.35
Pak Oilfields 29-Aug-06 75.00% 361 342.95 325.85 340.4 337.25 342.25 336.5 347 347
Indus MotorXD 31-Aug-06 70.00% 217.5 220 222 227.7 218.25 219.75 216 213.9 214
Gadoon Textile 5-Sep-06 25.00% 81 82 72.65 74.8 74.8 74.8 71.5 72.75 75.5
P.T.C.L.A 14-Sep-06 20.00% 41.55 39.8 41.45 39.8 41.15 40.6 39.85 40 40.25
Nishat Mills 18-Sep-06 10.00% 48.4 48.5 48.5 49.2 48.5 47.6 47.85 50.2 52.7
Nishat Mills 18-Sep-06 15.00% 48.4 48.5 48.5 49.2 48.5 47.6 47.85 50.2 52.7
Millat Tractors 21-Sep-06 20.00% 366 378 375 360.5 362 355 342 339 343
Millat Tractors 21-Sep-06 100.00% 366 378 375 360.5 362 355 342 339 343
Pak Refinery 22-Sep-06 20.00% 320 325 325.5 324.9 308.7 324.1 331 317.9 328.95
Gatron Ind. 25-Sep-06 15.00% 180 179.4 178.45 175 170 169.9 168 170 163
Sui North Gas 2-Oct-06 30.00% 89.1 88.05 88 87.05 88.75 87.7 88.5 88.7 89.1
Sui North Gas 2-Oct-06 10.00% 89.1 88.05 88 87.05 88.75 87.7 88.5 88.7 89.1
Sui South Gas 2-Oct-06 13.00% 89.1 88.05 88 87.05 88.75 87.7 88.5 88.7 89.1
Gadoon Textile 4-Oct-06 25.00% 65.65 66.5 66.5 67.5 67 67.65 64.8 65 65.1 Dawood Hercules 17-Oct-06 20.00% 324 324 324 324 311 319 324 316 311.3

45
APPENDIX 2
MARKET INDEXES
I = -4 I = -3 I = -2 I = -1 I = 0 I = 1 I = 2 I = 3 I = 4
5335.82 5329.67 5377.75 5417.44 5377.71 5409.05 5401.38 5368.23 5355.22
5329.67 5377.75 5417.44 5377.71 5409.05 5401.38 5368.23 5355.22 5381.09
5368.23 5355.22 5381.09 5393.99 5329.86 5346.15 5320.38 5327.53 5318.73
5320.38 5327.53 5318.73 5195.42 5168.77 5199.39 5184.12 5172.21 5118.39
5320.38 5327.53 5318.73 5195.42 5168.77 5199.39 5184.12 5172.21 5118.39
5168.77 5199.39 5184.12 5172.21 5118.39 5087.37 4997.35 5055.03 5045.91
5168.77 5199.39 5184.12 5172.21 5118.39 5087.37 4997.35 5055.03 5045.91
5168.77 5199.39 5184.12 5172.21 5118.39 5087.37 4997.35 5055.03 5045.91
5199.39 5184.12 5172.21 5118.39 5087.37 4997.35 5055.03 5045.91 5044.77
5172.21 5118.39 5087.37 4997.35 5055.03 5045.91 5044.77 4958.41 4890.22
5118.39 5087.37 4997.35 5055.03 5045.91 5044.77 4958.41 4890.22 4970.57
4997.35 5055.03 5045.91 5044.77 4958.41 4890.22 4970.57 5080.67 5125.04
4997.35 5055.03 5045.91 5044.77 4958.41 4890.22 4970.57 5080.67 5125.04
5055.03 5045.91 5044.77 4958.41 4890.22 4970.57 5080.67 5125.04 5128.13
5044.77 4958.41 4890.22 4970.57 5080.67 5125.04 5128.13 5196.28 5217.65
4970.57 5080.67 5125.04 5128.13 5196.28 5217.65 5245.82 5267.92 5233.28
5080.67 5125.04 5128.13 5196.28 5217.65 5245.82 5267.92 5233.28 5299.53
5421.07 5445.5 5469.62 5433.48 5380.72 5467.06 5465.36 5452.87 5458.32
5469.62 5433.48 5380.72 5467.06 5465.36 5452.87 5458.32 5468.12 5390.35
5469.62 5433.48 5380.72 5467.06 5465.36 5452.87 5458.32 5468.12 5390.35
5452.87 5458.32 5468.12 5390.35 5383.42 5367.68 5332.24 5246.91 5329.88
5452.87 5458.32 5468.12 5390.35 5383.42 5367.68 5332.24 5246.91 5329.88
5390.35 5383.42 5367.68 5332.24 5246.91 5329.88 5351.51 5347.72 5352.3
5483.88 5515.43 5520.17 5502.56 5514.49 5533.22 5523.27 5556.87 5571.88
5560.5 5552.5 5575.96 5633.13 5675.79 5698.64 5738.49 5700.82 5758.28
6424.8 6559.83 6633.01 6603.55 6746.4 6861.97 6887.58 6904.56 6952.82
6633.01 6603.55 6746.4 6861.97 6887.58 6904.56 6952.82 6798.01 6747.39
6603.55 6746.4 6861.97 6887.58 6904.56 6952.82 6798.01 6747.39 6869.28
6603.55 6746.4 6861.97 6887.58 6904.56 6952.82 6798.01 6747.39 6869.28
6887.58 6904.56 6952.82 6798.01 6747.39 6869.28 6949.88 7014.71 6968.46
6887.58 6904.56 6952.82 6798.01 6747.39 6869.28 6949.88 7014.71 6968.46
6887.58 6904.56 6952.82 6798.01 6747.39 6869.28 6949.88 7014.71 6968.46
6968.46 7091.14 7158.83 7156.55 7196.63 7238.76 7341.69 7402.8 7508.8
7156.55 7196.63 7238.76 7341.69 7402.8 7508.8 7579.98 7734.03 7865.94
7156.55 7196.63 7238.76 7341.69 7402.8 7508.8 7579.98 7734.03 7865.94
7402.8 7508.8 7579.98 7734.03 7865.94 7925.7 8180.79 8253.12 8285.4
7402.8 7508.8 7579.98 7734.03 7865.94 7925.7 8180.79 8253.12 8285.4
7508.8 7579.98 7734.03 7865.94 7925.7 8180.79 8253.12 8285.4 8260.06
7579.98 7734.03 7865.94 7925.7 8180.79 8253.12 8285.4 8260.06 8404.52
7734.03 7865.94 7925.7 8180.79 8253.12 8285.4 8260.06 8404.52 8206.14
7865.94 7925.7 8180.79 8253.12 8285.4 8260.06 8404.52 8206.14 8496.73
8180.79 8253.12 8285.4 8260.06 8404.52 8206.14 8496.73 8793.69 8863.48
8285.4 8260.06 8404.52 8206.14 8496.73 8793.69 8863.48 9218.68 9588.47
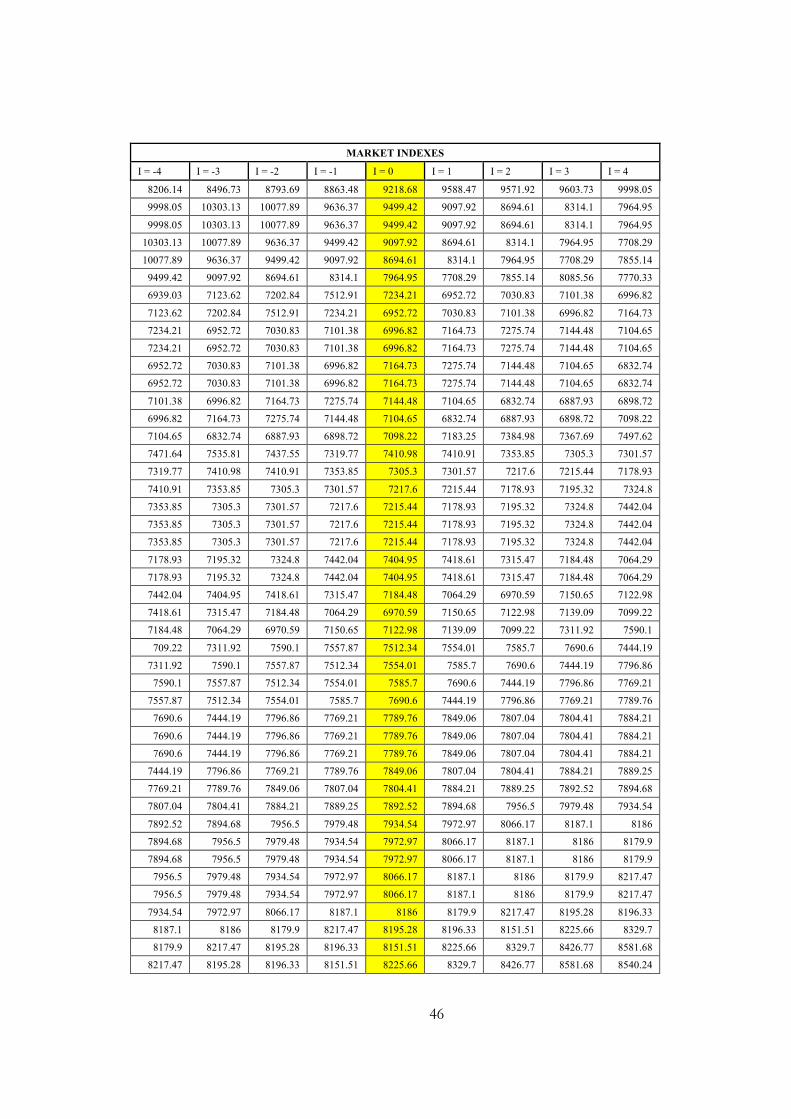
46
MARKET INDEXES
I = -4 I = -3 I = -2 I = -1 I = 0 I = 1 I = 2 I = 3 I = 4
8206.14 8496.73 8793.69 8863.48 9218.68 9588.47 9571.92 9603.73 9998.05
9998.05 10303.13 10077.89 9636.37 9499.42 9097.92 8694.61 8314.1 7964.95
9998.05 10303.13 10077.89 9636.37 9499.42 9097.92 8694.61 8314.1 7964.95
10303.13 10077.89 9636.37 9499.42 9097.92 8694.61 8314.1 7964.95 7708.29
10077.89 9636.37 9499.42 9097.92 8694.61 8314.1 7964.95 7708.29 7855.14
9499.42 9097.92 8694.61 8314.1 7964.95 7708.29 7855.14 8085.56 7770.33
6939.03 7123.62 7202.84 7512.91 7234.21 6952.72 7030.83 7101.38 6996.82
7123.62 7202.84 7512.91 7234.21 6952.72 7030.83 7101.38 6996.82 7164.73
7234.21 6952.72 7030.83 7101.38 6996.82 7164.73 7275.74 7144.48 7104.65
7234.21 6952.72 7030.83 7101.38 6996.82 7164.73 7275.74 7144.48 7104.65
6952.72 7030.83 7101.38 6996.82 7164.73 7275.74 7144.48 7104.65 6832.74
6952.72 7030.83 7101.38 6996.82 7164.73 7275.74 7144.48 7104.65 6832.74
7101.38 6996.82 7164.73 7275.74 7144.48 7104.65 6832.74 6887.93 6898.72
6996.82 7164.73 7275.74 7144.48 7104.65 6832.74 6887.93 6898.72 7098.22
7104.65 6832.74 6887.93 6898.72 7098.22 7183.25 7384.98 7367.69 7497.62
7471.64 7535.81 7437.55 7319.77 7410.98 7410.91 7353.85 7305.3 7301.57
7319.77 7410.98 7410.91 7353.85 7305.3 7301.57 7217.6 7215.44 7178.93
7410.91 7353.85 7305.3 7301.57 7217.6 7215.44 7178.93 7195.32 7324.8
7353.85 7305.3 7301.57 7217.6 7215.44 7178.93 7195.32 7324.8 7442.04
7353.85 7305.3 7301.57 7217.6 7215.44 7178.93 7195.32 7324.8 7442.04
7353.85 7305.3 7301.57 7217.6 7215.44 7178.93 7195.32 7324.8 7442.04
7178.93 7195.32 7324.8 7442.04 7404.95 7418.61 7315.47 7184.48 7064.29
7178.93 7195.32 7324.8 7442.04 7404.95 7418.61 7315.47 7184.48 7064.29
7442.04 7404.95 7418.61 7315.47 7184.48 7064.29 6970.59 7150.65 7122.98
7418.61 7315.47 7184.48 7064.29 6970.59 7150.65 7122.98 7139.09 7099.22
7184.48 7064.29 6970.59 7150.65 7122.98 7139.09 7099.22 7311.92 7590.1
709.22 7311.92 7590.1 7557.87 7512.34 7554.01 7585.7 7690.6 7444.19
7311.92 7590.1 7557.87 7512.34 7554.01 7585.7 7690.6 7444.19 7796.86
7590.1 7557.87 7512.34 7554.01 7585.7 7690.6 7444.19 7796.86 7769.21
7557.87 7512.34 7554.01 7585.7 7690.6 7444.19 7796.86 7769.21 7789.76
7690.6 7444.19 7796.86 7769.21 7789.76 7849.06 7807.04 7804.41 7884.21
7690.6 7444.19 7796.86 7769.21 7789.76 7849.06 7807.04 7804.41 7884.21
7690.6 7444.19 7796.86 7769.21 7789.76 7849.06 7807.04 7804.41 7884.21
7444.19 7796.86 7769.21 7789.76 7849.06 7807.04 7804.41 7884.21 7889.25
7769.21 7789.76 7849.06 7807.04 7804.41 7884.21 7889.25 7892.52 7894.68
7807.04 7804.41 7884.21 7889.25 7892.52 7894.68 7956.5 7979.48 7934.54
7892.52 7894.68 7956.5 7979.48 7934.54 7972.97 8066.17 8187.1 8186
7894.68 7956.5 7979.48 7934.54 7972.97 8066.17 8187.1 8186 8179.9
7894.68 7956.5 7979.48 7934.54 7972.97 8066.17 8187.1 8186 8179.9
7956.5 7979.48 7934.54 7972.97 8066.17 8187.1 8186 8179.9 8217.47
7956.5 7979.48 7934.54 7972.97 8066.17 8187.1 8186 8179.9 8217.47
7934.54 7972.97 8066.17 8187.1 8186 8179.9 8217.47 8195.28 8196.33
8187.1 8186 8179.9 8217.47 8195.28 8196.33 8151.51 8225.66 8329.7
8179.9 8217.47 8195.28 8196.33 8151.51 8225.66 8329.7 8426.77 8581.68
8217.47 8195.28 8196.33 8151.51 8225.66 8329.7 8426.77 8581.68 8540.24

47
MARKET INDEXES
I = -4 I = -3 I = -2 I = -1 I = 0 I = 1 I = 2 I = 3 I = 4
8195.28 8196.33 8151.51 8225.66 8329.7 8426.77 8581.68 8540.24 8542.38
8669.39 8872.96 8557.96 8289.91 8409.16 8316.67 8235.12 8317.36 8247.34
8557.96 8289.91 8409.16 8316.67 8235.12 8317.36 8247.34 8436.62 8664.02
8557.96 8289.91 8409.16 8316.67 8235.12 8317.36 8247.34 8436.62 8664.02
8557.96 8289.91 8409.16 8316.67 8235.12 8317.36 8247.34 8436.62 8664.02
8289.91 8409.16 8316.67 8235.12 8317.36 8247.34 8436.62 8664.02 8693.54
8409.16 8316.67 8235.12 8317.36 8247.34 8436.62 8664.02 8693.54 8794.93
8409.16 8316.67 8235.12 8317.36 8247.34 8436.62 8664.02 8693.54 8794.93
8895.68 8864.02 8933.51 8960.88 9006.26 9016.34 9072.82 9064.39 9147.02
10165.91 10235.17 10259.86 10227.87 10346.47 10170.4 10214.01 10304.8 10447.56
10346.47 10170.4 10214.01 10304.8 10447.56 10527.85 10524.16 10496.95 10466.4
10346.47 10170.4 10214.01 10304.8 10447.56 10527.85 10524.16 10496.95 10466.4
10170.4 10214.01 10304.8 10447.56 10527.85 10524.16 10496.95 10466.4 10726.46
10170.4 10214.01 10304.8 10447.56 10527.85 10524.16 10496.95 10466.4 10726.46
10170.4 10214.01 10304.8 10447.56 10527.85 10524.16 10496.95 10466.4 10726.46
10214.01 10304.8 10447.56 10527.85 10524.16 10496.95 10466.4 10726.46 10802.32
10214.01 10304.8 10447.56 10527.85 10524.16 10496.95 10466.4 10726.46 10802.32
10214.01 10304.8 10447.56 10527.85 10524.16 10496.95 10466.4 10726.46 10802.32
10214.01 10304.8 10447.56 10527.85 10524.16 10496.95 10466.4 10726.46 10802.32
10527.85 10524.16 10496.95 10466.4 10726.46 10802.32 10913.78 11052.86 11218.03
10527.85 10524.16 10496.95 10466.4 10726.46 10802.32 10913.78 11052.86 11218.03
10527.85 10524.16 10496.95 10466.4 10726.46 10802.32 10913.78 11052.86 11218.03
10496.95 10466.4 10726.46 10802.32 10913.78 11052.86 11218.03 10920.09 11259.29
10802.32 10913.78 11052.86 11218.03 10920.09 11259.29 11176.81 11352.63 11441.85
10913.78 11052.86 11218.03 10920.09 11259.29 11176.81 11352.63 11441.85 11537.02
11052.86 11218.03 10920.09 11259.29 11176.81 11352.63 11441.85 11537.02 11444.12
11176.81 11352.63 11441.85 11537.02 11444.12 11609.37 11546.79 11191.75 11456.27
11176.81 11352.63 11441.85 11537.02 11444.12 11609.37 11546.79 11191.75 11456.27
11352.63 11441.85 11537.02 11444.12 11609.37 11546.79 11191.75 11456.27 11473.99
11441.85 11537.02 11444.12 11609.37 11546.79 11191.75 11456.27 11473.99 11381.61
11441.85 11537.02 11444.12 11609.37 11546.79 11191.75 11456.27 11473.99 11381.61
11444.12 11609.37 11546.79 11191.75 11456.27 11473.99 11381.61 11415.29 10947.09
11444.12 11609.37 11546.79 11191.75 11456.27 11473.99 11381.61 11415.29 10947.09
11444.12 11609.37 11546.79 11191.75 11456.27 11473.99 11381.61 11415.29 10947.09
11546.79 11191.75 11456.27 11473.99 11381.61 11415.29 10947.09 11085.03 10594.01
11456.27 11473.99 11381.61 11415.29 10947.09 11085.03 10594.01 10803.99 10474.2
11381.61 11415.29 10947.09 11085.03 10594.01 10803.99 10474.2 10093.24 10443.17
10443.17 10392.91 10689.2 10951.08 11032.31 11129.77 11278.48 11459.58 11402.11
10443.17 10392.91 10689.2 10951.08 11032.31 11129.77 11278.48 11459.58 11402.11
11032.31 11129.77 11278.48 11459.58 11402.11 11449.44 11414.37 11568.64 11485.9
12060.73 12136.83 12273.77 12115.46 12048.11 12075.75 12007.6 11802.68 11941.82
12060.73 12136.83 12273.77 12115.46 12048.11 12075.75 12007.6 11802.68 11941.82
12136.83 12273.77 12115.46 12048.11 12075.75 12007.6 11802.68 11941.82 11910.09
11941.82 11910.09 11683.72 11342.17 11572.58 11728.14 11690.25 11686.44 11775.52
11096.86 10706.96 11094.41 10687.88 10861.31 10930.55 10932.58 11116.88 11018.85

48
MARKET INDEXES
I = -4 I = -3 I = -2 I = -1 I = 0 I = 1 I = 2 I = 3 I = 4
9943.83 10105.17 10103.31 10171 9807.53 9404.7 9041.62 9434.15 9841.43
10103.31 10171 9807.53 9404.7 9041.62 9434.15 9841.43 9989.41 9603.65
10103.31 10171 9807.53 9404.7 9041.62 9434.15 9841.43 9989.41 9603.65
9404.7 9041.62 9434.15 9841.43 9989.41 9603.65 9829.4 9936.33 9916.08
10353.52 10497.63 10507.09 10558.32 10667.49 10772.58 10846.74 10828.39 10655.54
10507.09 10558.32 10667.49 10772.58 10846.74 10828.39 10655.54 10525.09 10406.4
10507.09 10558.32 10667.49 10772.58 10846.74 10828.39 10655.54 10525.09 10406.4
10772.58 10846.74 10828.39 10655.54 10525.09 10406.4 10317.41 10576.71 10557.25
10828.39 10655.54 10525.09 10406.4 10317.41 10576.71 10557.25 10562.88 10481.64
10525.09 10406.4 10317.41 10576.71 10557.25 10562.88 10481.64 10220.71 10244.69
10525.09 10406.4 10317.41 10576.71 10557.25 10562.88 10481.64 10220.71 10244.69
10557.25 10562.88 10481.64 10220.71 10244.69 9925.23 9584.79 9876.51 9942.87
10557.25 10562.88 10481.64 10220.71 10244.69 9925.23 9584.79 9876.51 9942.87
10220.71 10244.69 9925.23 9584.79 9876.51 9942.87 10086.15 10064.13 10170.97
10244.69 9925.23 9584.79 9876.51 9942.87 10086.15 10064.13 10170.97 10125.91
9584.79 9876.51 9942.87 10086.15 10064.13 10170.97 10125.91 10001.79 10068.7
10086.15 10064.13 10170.97 10125.91 10001.79 10068.7 9927.1 9965.21 9892.77
9892.77 10157.17 9988.63 10028.5 9984.57 9876.4 9908.85 10032.57 10155.1
10157.17 9988.63 10028.5 9984.57 9876.4 9908.85 10032.57 10155.1 10306.75
10157.17 9988.63 10028.5 9984.57 9876.4 9908.85 10032.57 10155.1 10306.75
9984.57 9876.4 9908.85 10032.57 10155.1 10306.75 10252.15 10305.43 10386.52
9984.57 9876.4 9908.85 10032.57 10155.1 10306.75 10252.15 10305.43 10386.52
9876.4 9908.85 10032.57 10155.1 10306.75 10252.15 10305.43 10386.52 10528.69
9908.85 10032.57 10155.1 10306.75 10252.15 10305.43 10386.52 10528.69 10512.48
10305.43 10386.52 10528.69 10512.48 10616.24 10592.72 10743.55 10855.82 10926.91
10305.43 10386.52 10528.69 10512.48 10616.24 10592.72 10743.55 10855.82 10926.91
10305.43 10386.52 10528.69 10512.48 10616.24 10592.72 10743.55 10855.82 10926.91
10528.69 10512.48 10616.24 10592.72 10743.55 10855.82 10926.91 10942.75 10959.71
10886.42 10880.29 10924.55 10909.31 11167.04 11399.83 11566.8 11528.27 11327.71
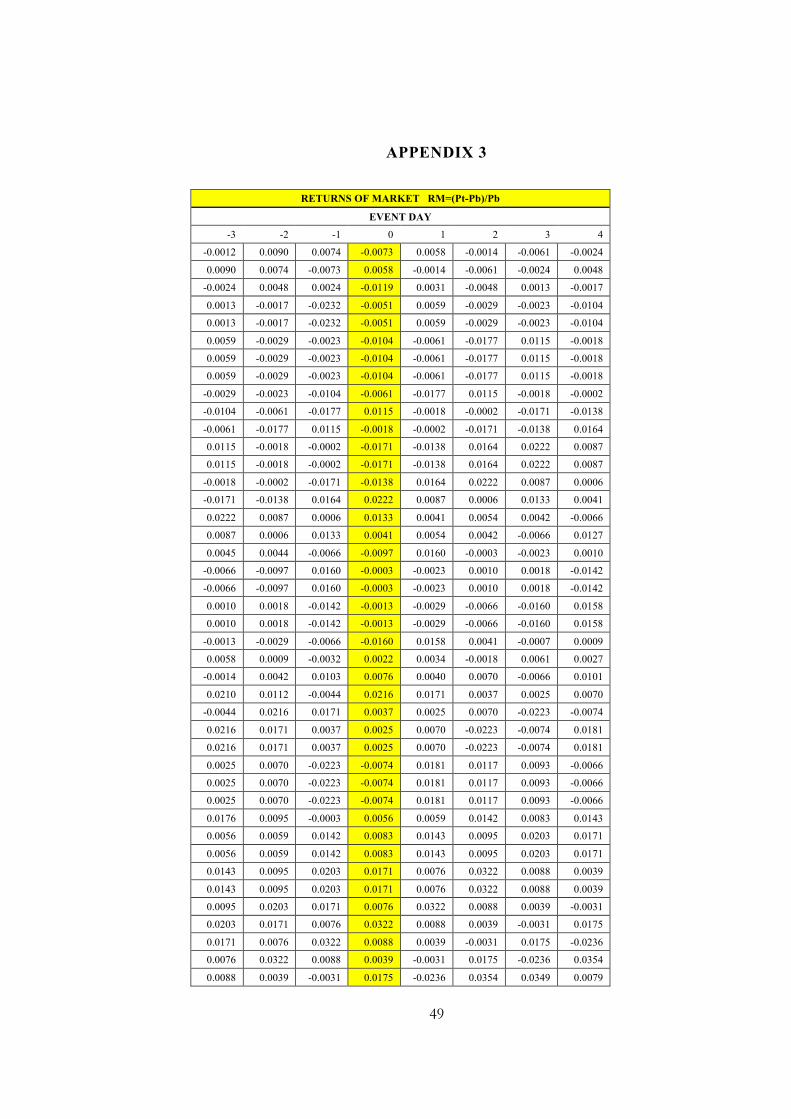
49
APPENDIX 3
RETURNS OF MARKET RM=(Pt-Pb)/Pb
EVENT DAY
-3 -2 -1 0 1 2 3 4
-0.0012 0.0090 0.0074 -0.0073 0.0058 -0.0014 -0.0061 -0.0024
0.0090 0.0074 -0.0073 0.0058 -0.0014 -0.0061 -0.0024 0.0048
-0.0024 0.0048 0.0024 -0.0119 0.0031 -0.0048 0.0013 -0.0017
0.0013 -0.0017 -0.0232 -0.0051 0.0059 -0.0029 -0.0023 -0.0104
0.0013 -0.0017 -0.0232 -0.0051 0.0059 -0.0029 -0.0023 -0.0104
0.0059 -0.0029 -0.0023 -0.0104 -0.0061 -0.0177 0.0115 -0.0018
0.0059 -0.0029 -0.0023 -0.0104 -0.0061 -0.0177 0.0115 -0.0018
0.0059 -0.0029 -0.0023 -0.0104 -0.0061 -0.0177 0.0115 -0.0018
-0.0029 -0.0023 -0.0104 -0.0061 -0.0177 0.0115 -0.0018 -0.0002
-0.0104 -0.0061 -0.0177 0.0115 -0.0018 -0.0002 -0.0171 -0.0138
-0.0061 -0.0177 0.0115 -0.0018 -0.0002 -0.0171 -0.0138 0.0164
0.0115 -0.0018 -0.0002 -0.0171 -0.0138 0.0164 0.0222 0.0087
0.0115 -0.0018 -0.0002 -0.0171 -0.0138 0.0164 0.0222 0.0087
-0.0018 -0.0002 -0.0171 -0.0138 0.0164 0.0222 0.0087 0.0006
-0.0171 -0.0138 0.0164 0.0222 0.0087 0.0006 0.0133 0.0041
0.0222 0.0087 0.0006 0.0133 0.0041 0.0054 0.0042 -0.0066
0.0087 0.0006 0.0133 0.0041 0.0054 0.0042 -0.0066 0.0127
0.0045 0.0044 -0.0066 -0.0097 0.0160 -0.0003 -0.0023 0.0010
-0.0066 -0.0097 0.0160 -0.0003 -0.0023 0.0010 0.0018 -0.0142
-0.0066 -0.0097 0.0160 -0.0003 -0.0023 0.0010 0.0018 -0.0142
0.0010 0.0018 -0.0142 -0.0013 -0.0029 -0.0066 -0.0160 0.0158
0.0010 0.0018 -0.0142 -0.0013 -0.0029 -0.0066 -0.0160 0.0158
-0.0013 -0.0029 -0.0066 -0.0160 0.0158 0.0041 -0.0007 0.0009
0.0058 0.0009 -0.0032 0.0022 0.0034 -0.0018 0.0061 0.0027
-0.0014 0.0042 0.0103 0.0076 0.0040 0.0070 -0.0066 0.0101
0.0210 0.0112 -0.0044 0.0216 0.0171 0.0037 0.0025 0.0070
-0.0044 0.0216 0.0171 0.0037 0.0025 0.0070 -0.0223 -0.0074
0.0216 0.0171 0.0037 0.0025 0.0070 -0.0223 -0.0074 0.0181
0.0216 0.0171 0.0037 0.0025 0.0070 -0.0223 -0.0074 0.0181
0.0025 0.0070 -0.0223 -0.0074 0.0181 0.0117 0.0093 -0.0066
0.0025 0.0070 -0.0223 -0.0074 0.0181 0.0117 0.0093 -0.0066
0.0025 0.0070 -0.0223 -0.0074 0.0181 0.0117 0.0093 -0.0066
0.0176 0.0095 -0.0003 0.0056 0.0059 0.0142 0.0083 0.0143
0.0056 0.0059 0.0142 0.0083 0.0143 0.0095 0.0203 0.0171
0.0056 0.0059 0.0142 0.0083 0.0143 0.0095 0.0203 0.0171
0.0143 0.0095 0.0203 0.0171 0.0076 0.0322 0.0088 0.0039
0.0143 0.0095 0.0203 0.0171 0.0076 0.0322 0.0088 0.0039
0.0095 0.0203 0.0171 0.0076 0.0322 0.0088 0.0039 -0.0031
0.0203 0.0171 0.0076 0.0322 0.0088 0.0039 -0.0031 0.0175
0.0171 0.0076 0.0322 0.0088 0.0039 -0.0031 0.0175 -0.0236
0.0076 0.0322 0.0088 0.0039 -0.0031 0.0175 -0.0236 0.0354
0.0088 0.0039 -0.0031 0.0175 -0.0236 0.0354 0.0349 0.0079
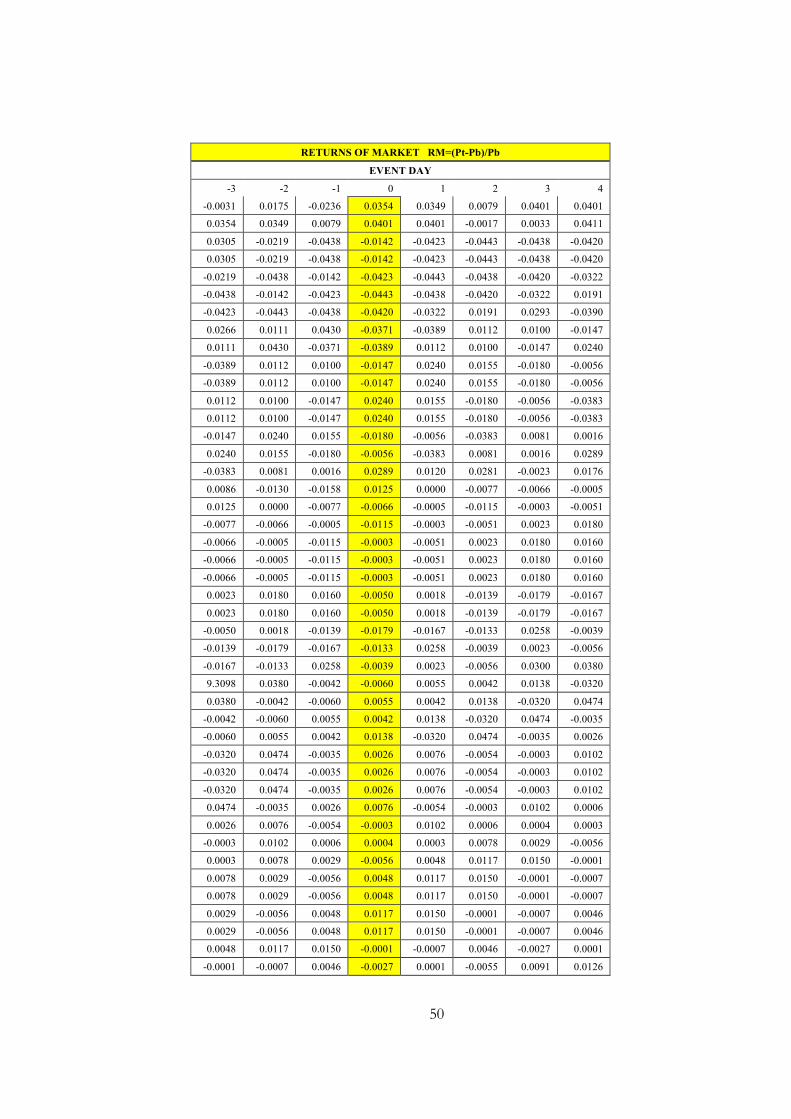
50
RETURNS OF MARKET RM=(Pt-Pb)/Pb
EVENT DAY
-3 -2 -1 0 1 2 3 4
-0.0031 0.0175 -0.0236 0.0354 0.0349 0.0079 0.0401 0.0401
0.0354 0.0349 0.0079 0.0401 0.0401 -0.0017 0.0033 0.0411
0.0305 -0.0219 -0.0438 -0.0142 -0.0423 -0.0443 -0.0438 -0.0420
0.0305 -0.0219 -0.0438 -0.0142 -0.0423 -0.0443 -0.0438 -0.0420
-0.0219 -0.0438 -0.0142 -0.0423 -0.0443 -0.0438 -0.0420 -0.0322
-0.0438 -0.0142 -0.0423 -0.0443 -0.0438 -0.0420 -0.0322 0.0191
-0.0423 -0.0443 -0.0438 -0.0420 -0.0322 0.0191 0.0293 -0.0390
0.0266 0.0111 0.0430 -0.0371 -0.0389 0.0112 0.0100 -0.0147
0.0111 0.0430 -0.0371 -0.0389 0.0112 0.0100 -0.0147 0.0240
-0.0389 0.0112 0.0100 -0.0147 0.0240 0.0155 -0.0180 -0.0056
-0.0389 0.0112 0.0100 -0.0147 0.0240 0.0155 -0.0180 -0.0056
0.0112 0.0100 -0.0147 0.0240 0.0155 -0.0180 -0.0056 -0.0383
0.0112 0.0100 -0.0147 0.0240 0.0155 -0.0180 -0.0056 -0.0383
-0.0147 0.0240 0.0155 -0.0180 -0.0056 -0.0383 0.0081 0.0016
0.0240 0.0155 -0.0180 -0.0056 -0.0383 0.0081 0.0016 0.0289
-0.0383 0.0081 0.0016 0.0289 0.0120 0.0281 -0.0023 0.0176
0.0086 -0.0130 -0.0158 0.0125 0.0000 -0.0077 -0.0066 -0.0005
0.0125 0.0000 -0.0077 -0.0066 -0.0005 -0.0115 -0.0003 -0.0051
-0.0077 -0.0066 -0.0005 -0.0115 -0.0003 -0.0051 0.0023 0.0180
-0.0066 -0.0005 -0.0115 -0.0003 -0.0051 0.0023 0.0180 0.0160
-0.0066 -0.0005 -0.0115 -0.0003 -0.0051 0.0023 0.0180 0.0160
-0.0066 -0.0005 -0.0115 -0.0003 -0.0051 0.0023 0.0180 0.0160
0.0023 0.0180 0.0160 -0.0050 0.0018 -0.0139 -0.0179 -0.0167
0.0023 0.0180 0.0160 -0.0050 0.0018 -0.0139 -0.0179 -0.0167
-0.0050 0.0018 -0.0139 -0.0179 -0.0167 -0.0133 0.0258 -0.0039
-0.0139 -0.0179 -0.0167 -0.0133 0.0258 -0.0039 0.0023 -0.0056
-0.0167 -0.0133 0.0258 -0.0039 0.0023 -0.0056 0.0300 0.0380
9.3098 0.0380 -0.0042 -0.0060 0.0055 0.0042 0.0138 -0.0320
0.0380 -0.0042 -0.0060 0.0055 0.0042 0.0138 -0.0320 0.0474
-0.0042 -0.0060 0.0055 0.0042 0.0138 -0.0320 0.0474 -0.0035
-0.0060 0.0055 0.0042 0.0138 -0.0320 0.0474 -0.0035 0.0026
-0.0320 0.0474 -0.0035 0.0026 0.0076 -0.0054 -0.0003 0.0102
-0.0320 0.0474 -0.0035 0.0026 0.0076 -0.0054 -0.0003 0.0102
-0.0320 0.0474 -0.0035 0.0026 0.0076 -0.0054 -0.0003 0.0102
0.0474 -0.0035 0.0026 0.0076 -0.0054 -0.0003 0.0102 0.0006
0.0026 0.0076 -0.0054 -0.0003 0.0102 0.0006 0.0004 0.0003
-0.0003 0.0102 0.0006 0.0004 0.0003 0.0078 0.0029 -0.0056
0.0003 0.0078 0.0029 -0.0056 0.0048 0.0117 0.0150 -0.0001
0.0078 0.0029 -0.0056 0.0048 0.0117 0.0150 -0.0001 -0.0007
0.0078 0.0029 -0.0056 0.0048 0.0117 0.0150 -0.0001 -0.0007
0.0029 -0.0056 0.0048 0.0117 0.0150 -0.0001 -0.0007 0.0046
0.0029 -0.0056 0.0048 0.0117 0.0150 -0.0001 -0.0007 0.0046
0.0048 0.0117 0.0150 -0.0001 -0.0007 0.0046 -0.0027 0.0001
-0.0001 -0.0007 0.0046 -0.0027 0.0001 -0.0055 0.0091 0.0126
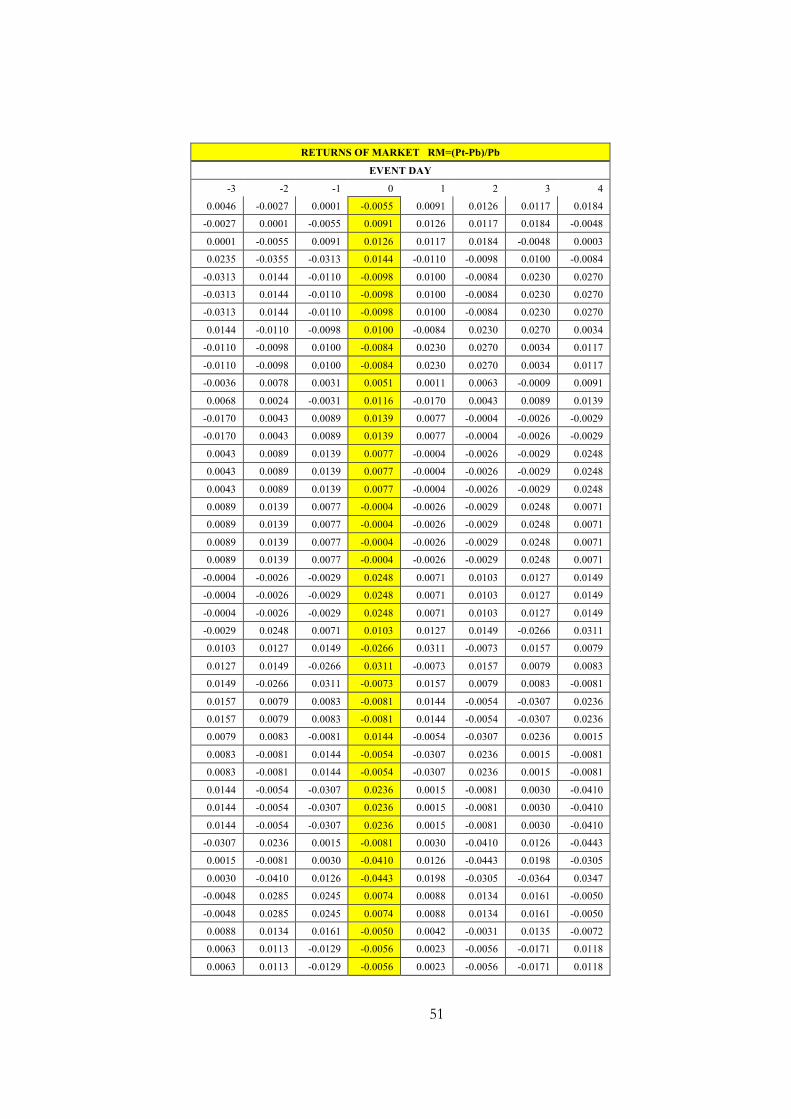
51
RETURNS OF MARKET RM=(Pt-Pb)/Pb
EVENT DAY
-3 -2 -1 0 1 2 3 4
0.0046 -0.0027 0.0001 -0.0055 0.0091 0.0126 0.0117 0.0184
-0.0027 0.0001 -0.0055 0.0091 0.0126 0.0117 0.0184 -0.0048
0.0001 -0.0055 0.0091 0.0126 0.0117 0.0184 -0.0048 0.0003
0.0235 -0.0355 -0.0313 0.0144 -0.0110 -0.0098 0.0100 -0.0084
-0.0313 0.0144 -0.0110 -0.0098 0.0100 -0.0084 0.0230 0.0270
-0.0313 0.0144 -0.0110 -0.0098 0.0100 -0.0084 0.0230 0.0270
-0.0313 0.0144 -0.0110 -0.0098 0.0100 -0.0084 0.0230 0.0270
0.0144 -0.0110 -0.0098 0.0100 -0.0084 0.0230 0.0270 0.0034
-0.0110 -0.0098 0.0100 -0.0084 0.0230 0.0270 0.0034 0.0117
-0.0110 -0.0098 0.0100 -0.0084 0.0230 0.0270 0.0034 0.0117
-0.0036 0.0078 0.0031 0.0051 0.0011 0.0063 -0.0009 0.0091
0.0068 0.0024 -0.0031 0.0116 -0.0170 0.0043 0.0089 0.0139
-0.0170 0.0043 0.0089 0.0139 0.0077 -0.0004 -0.0026 -0.0029
-0.0170 0.0043 0.0089 0.0139 0.0077 -0.0004 -0.0026 -0.0029
0.0043 0.0089 0.0139 0.0077 -0.0004 -0.0026 -0.0029 0.0248
0.0043 0.0089 0.0139 0.0077 -0.0004 -0.0026 -0.0029 0.0248
0.0043 0.0089 0.0139 0.0077 -0.0004 -0.0026 -0.0029 0.0248
0.0089 0.0139 0.0077 -0.0004 -0.0026 -0.0029 0.0248 0.0071
0.0089 0.0139 0.0077 -0.0004 -0.0026 -0.0029 0.0248 0.0071
0.0089 0.0139 0.0077 -0.0004 -0.0026 -0.0029 0.0248 0.0071
0.0089 0.0139 0.0077 -0.0004 -0.0026 -0.0029 0.0248 0.0071
-0.0004 -0.0026 -0.0029 0.0248 0.0071 0.0103 0.0127 0.0149
-0.0004 -0.0026 -0.0029 0.0248 0.0071 0.0103 0.0127 0.0149
-0.0004 -0.0026 -0.0029 0.0248 0.0071 0.0103 0.0127 0.0149
-0.0029 0.0248 0.0071 0.0103 0.0127 0.0149 -0.0266 0.0311
0.0103 0.0127 0.0149 -0.0266 0.0311 -0.0073 0.0157 0.0079
0.0127 0.0149 -0.0266 0.0311 -0.0073 0.0157 0.0079 0.0083
0.0149 -0.0266 0.0311 -0.0073 0.0157 0.0079 0.0083 -0.0081
0.0157 0.0079 0.0083 -0.0081 0.0144 -0.0054 -0.0307 0.0236
0.0157 0.0079 0.0083 -0.0081 0.0144 -0.0054 -0.0307 0.0236
0.0079 0.0083 -0.0081 0.0144 -0.0054 -0.0307 0.0236 0.0015
0.0083 -0.0081 0.0144 -0.0054 -0.0307 0.0236 0.0015 -0.0081
0.0083 -0.0081 0.0144 -0.0054 -0.0307 0.0236 0.0015 -0.0081
0.0144 -0.0054 -0.0307 0.0236 0.0015 -0.0081 0.0030 -0.0410
0.0144 -0.0054 -0.0307 0.0236 0.0015 -0.0081 0.0030 -0.0410
0.0144 -0.0054 -0.0307 0.0236 0.0015 -0.0081 0.0030 -0.0410
-0.0307 0.0236 0.0015 -0.0081 0.0030 -0.0410 0.0126 -0.0443
0.0015 -0.0081 0.0030 -0.0410 0.0126 -0.0443 0.0198 -0.0305
0.0030 -0.0410 0.0126 -0.0443 0.0198 -0.0305 -0.0364 0.0347
-0.0048 0.0285 0.0245 0.0074 0.0088 0.0134 0.0161 -0.0050
-0.0048 0.0285 0.0245 0.0074 0.0088 0.0134 0.0161 -0.0050
0.0088 0.0134 0.0161 -0.0050 0.0042 -0.0031 0.0135 -0.0072
0.0063 0.0113 -0.0129 -0.0056 0.0023 -0.0056 -0.0171 0.0118
0.0063 0.0113 -0.0129 -0.0056 0.0023 -0.0056 -0.0171 0.0118

52
RETURNS OF MARKET RM=(Pt-Pb)/Pb
EVENT DAY
-3 -2 -1 0 1 2 3 4
0.0113 -0.0129 -0.0056 0.0023 -0.0056 -0.0171 0.0118 -0.0027
-0.0027 -0.0190 -0.0292 0.0203 0.0134 -0.0032 -0.0003 0.0076
-0.0351 0.0362 -0.0366 0.0162 0.0064 0.0002 0.0169 -0.0088
0.0162 -0.0002 0.0067 -0.0357 -0.0411 -0.0386 0.0434 0.0432
0.0067 -0.0357 -0.0411 -0.0386 0.0434 0.0432 0.0150 -0.0386
0.0067 -0.0357 -0.0411 -0.0386 0.0434 0.0432 0.0150 -0.0386
-0.0386 0.0434 0.0432 0.0150 -0.0386 0.0235 0.0109 -0.0020
0.0139 0.0009 0.0049 0.0103 0.0099 0.0069 -0.0017 -0.0160
0.0049 0.0103 0.0099 0.0069 -0.0017 -0.0160 -0.0122 -0.0113
0.0049 0.0103 0.0099 0.0069 -0.0017 -0.0160 -0.0122 -0.0113
0.0069 -0.0017 -0.0160 -0.0122 -0.0113 -0.0086 0.0251 -0.0018
-0.0160 -0.0122 -0.0113 -0.0086 0.0251 -0.0018 0.0005 -0.0077
-0.0113 -0.0086 0.0251 -0.0018 0.0005 -0.0077 -0.0249 0.0023
-0.0113 -0.0086 0.0251 -0.0018 0.0005 -0.0077 -0.0249 0.0023
0.0005 -0.0077 -0.0249 0.0023 -0.0312 -0.0343 0.0304 0.0067
0.0005 -0.0077 -0.0249 0.0023 -0.0312 -0.0343 0.0304 0.0067
0.0023 -0.0312 -0.0343 0.0304 0.0067 0.0144 -0.0022 0.0106
-0.0312 -0.0343 0.0304 0.0067 0.0144 -0.0022 0.0106 -0.0044
0.0304 0.0067 0.0144 -0.0022 0.0106 -0.0044 -0.0123 0.0067
-0.0022 0.0106 -0.0044 -0.0123 0.0067 -0.0141 0.0038 -0.0073
0.0267 -0.0166 0.0040 -0.0044 -0.0108 0.0033 0.0125 0.0122
-0.0166 0.0040 -0.0044 -0.0108 0.0033 0.0125 0.0122 0.0149
-0.0166 0.0040 -0.0044 -0.0108 0.0033 0.0125 0.0122 0.0149
-0.0108 0.0033 0.0125 0.0122 0.0149 -0.0053 0.0052 0.0079
-0.0108 0.0033 0.0125 0.0122 0.0149 -0.0053 0.0052 0.0079
0.0033 0.0125 0.0122 0.0149 -0.0053 0.0052 0.0079 0.0137
0.0125 0.0122 0.0149 -0.0053 0.0052 0.0079 0.0137 -0.0015
0.0079 0.0137 -0.0015 0.0099 -0.0022 0.0142 0.0104 0.0065
0.0079 0.0137 -0.0015 0.0099 -0.0022 0.0142 0.0104 0.0065
0.0079 0.0137 -0.0015 0.0099 -0.0022 0.0142 0.0104 0.0065
-0.0015 0.0099 -0.0022 0.0142 0.0104 0.0065 0.0014 0.0015
-0.0006 0.0041 -0.0014 0.0236 0.0208 0.0146 -0.0033 -0.0174

53
APPENDIX 4
AVERAGE OF AR
ABNORMAL RETURNS OF INDIVIDUAL SECURITY ON "t" TIME ARjt = Rjt - Rmt n
EVENT DAY ARt = ∑ ARjt / N
-3 -2 -1 0 1 2 3 4 J1
-0.0329 -0.0161 0.0045 0.0026 -0.0011 -0.0009 0.0296 -0.0113 -0.0032
-0.0090 -0.0026 0.0073 0.0319 0.0605 -0.0110 -0.0019 -0.0048 0.0088
-0.0383 -0.0405 0.0386 -0.0208 0.0153 0.0048 0.0054 0.0505 0.0019
0.0006 0.0017 -0.0268 -0.0433 -0.0559 0.0325 -0.0408 0.0059 -0.0158
-0.0077 -0.0175 -0.0485 0.0121 -0.0338 0.0137 -0.0225 -0.0114 -0.0144
-0.0021 0.0252 -0.0021 0.0492 0.0121 0.0596 -0.0069 0.0012 0.0170
-0.0074 0.0270 0.0258 -0.0396 -0.0139 -0.0033 -0.0090 0.0766 0.0070
-0.0025 0.0105 -0.0004 -0.0077 0.0061 0.0137 -0.0250 0.0122 0.0009
0.0029 -0.0084 -0.0097 -0.0439 -0.0323 -0.0540 -0.0103 0.0010 -0.0193
0.0099 0.0066 0.0124 0.0097 -0.0399 -0.0019 -0.0128 0.0216 0.0007
-0.0079 0.0353 0.0150 -0.0144 0.0265 0.0524 -0.0011 -0.0108 0.0119
-0.0115 -0.0050 0.0347 0.0921 0.0680 -0.0136 -0.0249 0.0001 0.0175
-0.0115 -0.0050 0.0347 0.0921 0.0680 -0.0136 -0.0249 0.0001 0.0175
-0.0122 0.0019 0.0046 0.0011 -0.0036 -0.0027 -0.0038 0.0192 0.0006
0.0153 -0.0047 -0.0155 -0.0334 0.0246 0.0187 0.0102 -0.0112 0.0005
0.0301 -0.0123 -0.0077 0.0309 -0.0041 -0.0054 -0.0031 -0.0049 0.0029
-0.0052 -0.0077 -0.0151 -0.0086 -0.0225 -0.0024 0.0002 0.0158 -0.0057
-0.0033 -0.0164 0.0127 -0.0186 -0.0179 0.0562 -0.0154 0.0047 0.0002
-0.0036 0.0046 0.0119 0.0043 0.0068 -0.0005 -0.0128 -0.0095 0.0002
-0.0026 -0.0377 0.0586 0.0023 -0.0299 0.0270 -0.0311 0.0132 0.0000
-0.0037 -0.0036 0.0165 0.0325 -0.0036 0.0127 0.0091 -0.0097 0.0063
0.0020 0.0110 0.0045 0.0028 -0.0016 -0.0024 0.0312 -0.0218 0.0032
0.0033 -0.0120 -0.0066 -0.0158 0.0160 -0.0061 0.0048 0.0002 -0.0020
-0.0512 -0.0009 0.0032 0.0728 0.0332 0.0018 -0.0471 -0.0027 0.0011
0.0014 -0.0141 -0.0138 -0.0226 0.0032 0.0434 0.0134 0.0035 0.0018
0.0020 0.0191 0.0062 -0.0477 -0.0196 -0.0254 0.0133 -0.0248 -0.0096
0.0588 -0.0223 0.0139 -0.0498 -0.0461 -0.0434 -0.0191 0.0104 -0.0122
-0.0146 0.0210 -0.0522 0.0725 0.0627 0.0008 0.0137 -0.0106 0.0117
0.0003 -0.0171 0.0026 0.0566 0.0094 0.0158 -0.0185 -0.0181 0.0039
-0.0042 -0.0325 0.0656 0.0209 -0.0002 0.0019 -0.0055 0.0053 0.0064
-0.0042 -0.0325 0.0656 0.0209 -0.0002 0.0019 -0.0055 0.0053 0.0064
-0.0125 -0.0178 -0.0050 0.0070 0.0145 0.0076 -0.0105 0.0017 -0.0019
-0.0137 -0.0227 -0.0079 -0.0174 -0.0015 0.0124 0.0014 -0.0216 -0.0089
-0.0089 0.0001 -0.0195 -0.0116 0.0063 0.0617 -0.0234 0.0209 0.0032
-0.0056 -0.0059 -0.0142 -0.0583 0.0139 -0.0566 0.0045 0.0233 -0.0124
-0.0058 0.0014 0.0316 -0.0036 0.0006 -0.0111 -0.0101 -0.0064 -0.0004
-0.0378 0.0122 0.0545 0.0250 0.0428 0.0002 0.0101 -0.0153 0.0115
-0.0220 -0.0118 0.0166 0.0005 -0.0322 -0.0250 -0.0428 -0.0076 -0.0155
-0.0117 -0.0028 0.0671 0.0399 0.0547 0.0306 -0.0147 -0.0446 0.0148
-0.0105 -0.0200 -0.0093 -0.0211 -0.0083 0.0016 -0.0050 0.0156 -0.0071
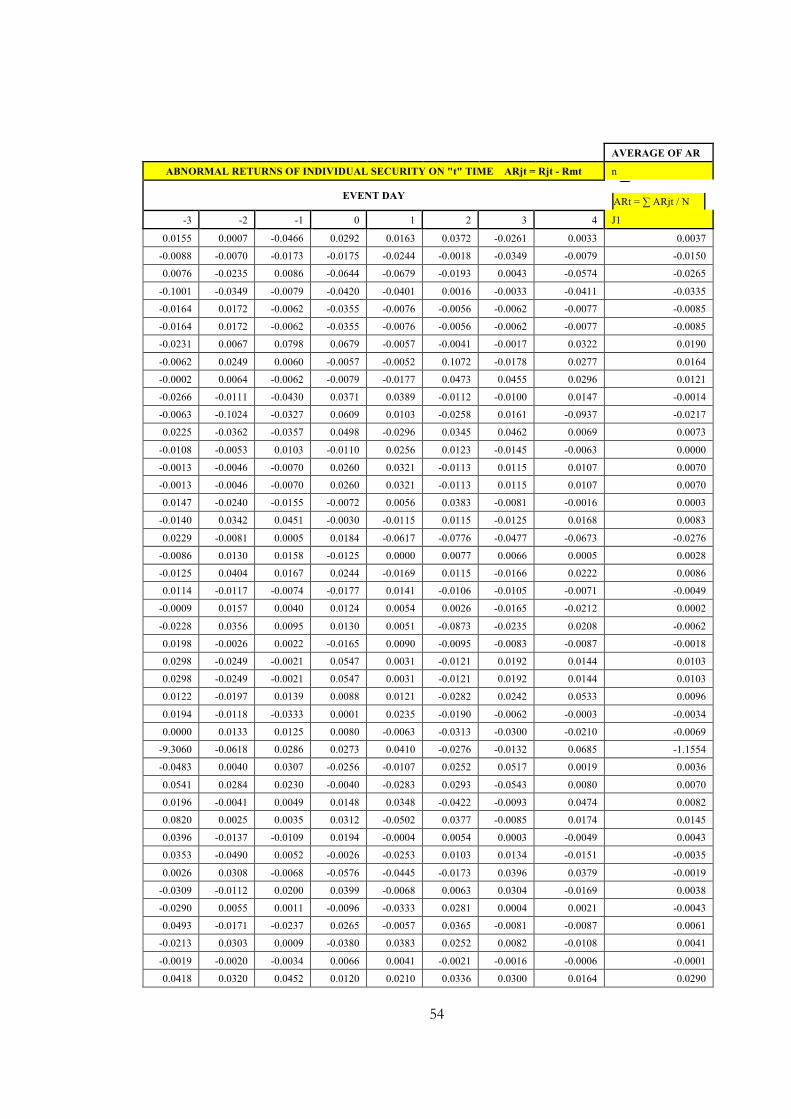
54
AVERAGE OF AR
ABNORMAL RETURNS OF INDIVIDUAL SECURITY ON "t" TIME ARjt = Rjt - Rmt n
EVENT DAY ARt = ∑ ARjt / N
-3 -2 -1 0 1 2 3 4 J1
0.0155 0.0007 -0.0466 0.0292 0.0163 0.0372 -0.0261 0.0033 0.0037
-0.0088 -0.0070 -0.0173 -0.0175 -0.0244 -0.0018 -0.0349 -0.0079 -0.0150
0.0076 -0.0235 0.0086 -0.0644 -0.0679 -0.0193 0.0043 -0.0574 -0.0265
-0.1001 -0.0349 -0.0079 -0.0420 -0.0401 0.0016 -0.0033 -0.0411 -0.0335
-0.0164 0.0172 -0.0062 -0.0355 -0.0076 -0.0056 -0.0062 -0.0077 -0.0085
-0.0164 0.0172 -0.0062 -0.0355 -0.0076 -0.0056 -0.0062 -0.0077 -0.0085
-0.0231 0.0067 0.0798 0.0679 -0.0057 -0.0041 -0.0017 0.0322 0.0190
-0.0062 0.0249 0.0060 -0.0057 -0.0052 0.1072 -0.0178 0.0277 0.0164
-0.0002 0.0064 -0.0062 -0.0079 -0.0177 0.0473 0.0455 0.0296 0.0121
-0.0266 -0.0111 -0.0430 0.0371 0.0389 -0.0112 -0.0100 0.0147 -0.0014
-0.0063 -0.1024 -0.0327 0.0609 0.0103 -0.0258 0.0161 -0.0937 -0.0217
0.0225 -0.0362 -0.0357 0.0498 -0.0296 0.0345 0.0462 0.0069 0.0073
-0.0108 -0.0053 0.0103 -0.0110 0.0256 0.0123 -0.0145 -0.0063 0.0000
-0.0013 -0.0046 -0.0070 0.0260 0.0321 -0.0113 0.0115 0.0107 0.0070
-0.0013 -0.0046 -0.0070 0.0260 0.0321 -0.0113 0.0115 0.0107 0.0070
0.0147 -0.0240 -0.0155 -0.0072 0.0056 0.0383 -0.0081 -0.0016 0.0003
-0.0140 0.0342 0.0451 -0.0030 -0.0115 0.0115 -0.0125 0.0168 0.0083
0.0229 -0.0081 0.0005 0.0184 -0.0617 -0.0776 -0.0477 -0.0673 -0.0276
-0.0086 0.0130 0.0158 -0.0125 0.0000 0.0077 0.0066 0.0005 0.0028
-0.0125 0.0404 0.0167 0.0244 -0.0169 0.0115 -0.0166 0.0222 0.0086
0.0114 -0.0117 -0.0074 -0.0177 0.0141 -0.0106 -0.0105 -0.0071 -0.0049
-0.0009 0.0157 0.0040 0.0124 0.0054 0.0026 -0.0165 -0.0212 0.0002
-0.0228 0.0356 0.0095 0.0130 0.0051 -0.0873 -0.0235 0.0208 -0.0062
0.0198 -0.0026 0.0022 -0.0165 0.0090 -0.0095 -0.0083 -0.0087 -0.0018
0.0298 -0.0249 -0.0021 0.0547 0.0031 -0.0121 0.0192 0.0144 0.0103
0.0298 -0.0249 -0.0021 0.0547 0.0031 -0.0121 0.0192 0.0144 0.0103
0.0122 -0.0197 0.0139 0.0088 0.0121 -0.0282 0.0242 0.0533 0.0096
0.0194 -0.0118 -0.0333 0.0001 0.0235 -0.0190 -0.0062 -0.0003 -0.0034
0.0000 0.0133 0.0125 0.0080 -0.0063 -0.0313 -0.0300 -0.0210 -0.0069
-9.3060 -0.0618 0.0286 0.0273 0.0410 -0.0276 -0.0132 0.0685 -1.1554
-0.0483 0.0040 0.0307 -0.0256 -0.0107 0.0252 0.0517 0.0019 0.0036
0.0541 0.0284 0.0230 -0.0040 -0.0283 0.0293 -0.0543 0.0080 0.0070
0.0196 -0.0041 0.0049 0.0148 0.0348 -0.0422 -0.0093 0.0474 0.0082
0.0820 0.0025 0.0035 0.0312 -0.0502 0.0377 -0.0085 0.0174 0.0145
0.0396 -0.0137 -0.0109 0.0194 -0.0004 0.0054 0.0003 -0.0049 0.0043
0.0353 -0.0490 0.0052 -0.0026 -0.0253 0.0103 0.0134 -0.0151 -0.0035
0.0026 0.0308 -0.0068 -0.0576 -0.0445 -0.0173 0.0396 0.0379 -0.0019
-0.0309 -0.0112 0.0200 0.0399 -0.0068 0.0063 0.0304 -0.0169 0.0038
-0.0290 0.0055 0.0011 -0.0096 -0.0333 0.0281 0.0004 0.0021 -0.0043
0.0493 -0.0171 -0.0237 0.0265 -0.0057 0.0365 -0.0081 -0.0087 0.0061
-0.0213 0.0303 0.0009 -0.0380 0.0383 0.0252 0.0082 -0.0108 0.0041
-0.0019 -0.0020 -0.0034 0.0066 0.0041 -0.0021 -0.0016 -0.0006 -0.0001
0.0418 0.0320 0.0452 0.0120 0.0210 0.0336 0.0300 0.0164 0.0290
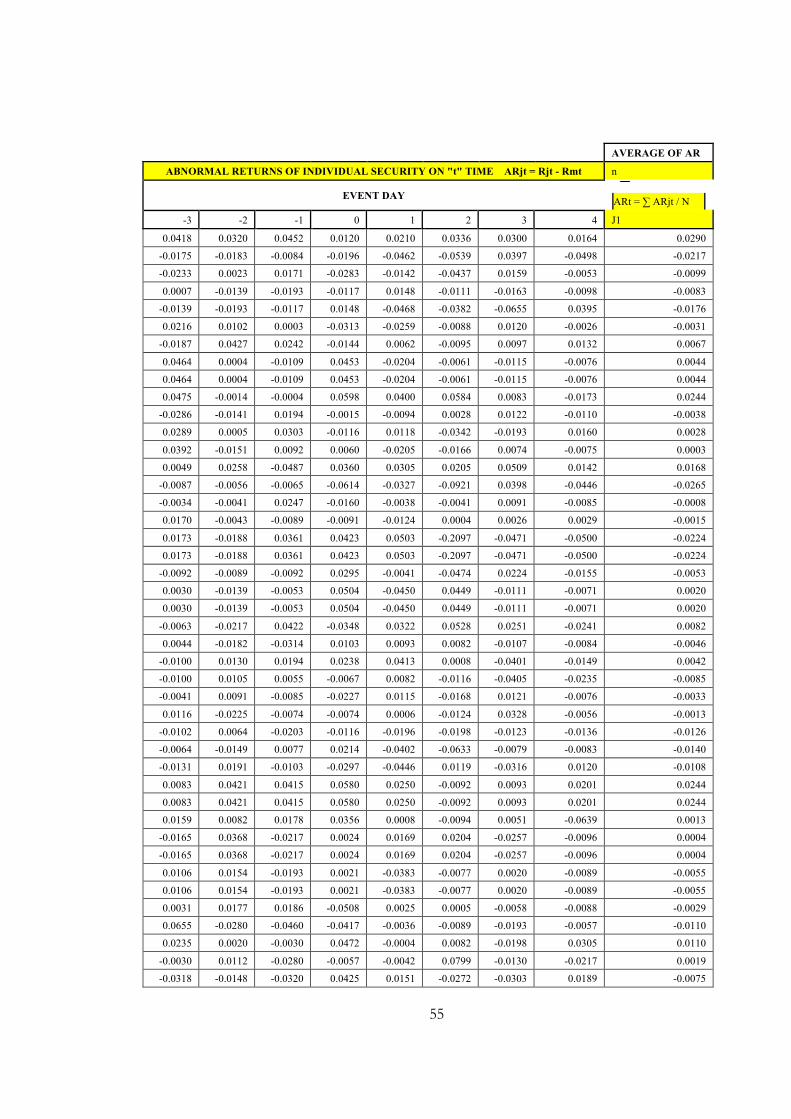
55
AVERAGE OF AR
ABNORMAL RETURNS OF INDIVIDUAL SECURITY ON "t" TIME ARjt = Rjt - Rmt n
EVENT DAY ARt = ∑ ARjt / N
-3 -2 -1 0 1 2 3 4 J1
0.0418 0.0320 0.0452 0.0120 0.0210 0.0336 0.0300 0.0164 0.0290
-0.0175 -0.0183 -0.0084 -0.0196 -0.0462 -0.0539 0.0397 -0.0498 -0.0217
-0.0233 0.0023 0.0171 -0.0283 -0.0142 -0.0437 0.0159 -0.0053 -0.0099
0.0007 -0.0139 -0.0193 -0.0117 0.0148 -0.0111 -0.0163 -0.0098 -0.0083
-0.0139 -0.0193 -0.0117 0.0148 -0.0468 -0.0382 -0.0655 0.0395 -0.0176
0.0216 0.0102 0.0003 -0.0313 -0.0259 -0.0088 0.0120 -0.0026 -0.0031
-0.0187 0.0427 0.0242 -0.0144 0.0062 -0.0095 0.0097 0.0132 0.0067
0.0464 0.0004 -0.0109 0.0453 -0.0204 -0.0061 -0.0115 -0.0076 0.0044
0.0464 0.0004 -0.0109 0.0453 -0.0204 -0.0061 -0.0115 -0.0076 0.0044
0.0475 -0.0014 -0.0004 0.0598 0.0400 0.0584 0.0083 -0.0173 0.0244
-0.0286 -0.0141 0.0194 -0.0015 -0.0094 0.0028 0.0122 -0.0110 -0.0038
0.0289 0.0005 0.0303 -0.0116 0.0118 -0.0342 -0.0193 0.0160 0.0028
0.0392 -0.0151 0.0092 0.0060 -0.0205 -0.0166 0.0074 -0.0075 0.0003
0.0049 0.0258 -0.0487 0.0360 0.0305 0.0205 0.0509 0.0142 0.0168
-0.0087 -0.0056 -0.0065 -0.0614 -0.0327 -0.0921 0.0398 -0.0446 -0.0265
-0.0034 -0.0041 0.0247 -0.0160 -0.0038 -0.0041 0.0091 -0.0085 -0.0008
0.0170 -0.0043 -0.0089 -0.0091 -0.0124 0.0004 0.0026 0.0029 -0.0015
0.0173 -0.0188 0.0361 0.0423 0.0503 -0.2097 -0.0471 -0.0500 -0.0224
0.0173 -0.0188 0.0361 0.0423 0.0503 -0.2097 -0.0471 -0.0500 -0.0224
-0.0092 -0.0089 -0.0092 0.0295 -0.0041 -0.0474 0.0224 -0.0155 -0.0053
0.0030 -0.0139 -0.0053 0.0504 -0.0450 0.0449 -0.0111 -0.0071 0.0020
0.0030 -0.0139 -0.0053 0.0504 -0.0450 0.0449 -0.0111 -0.0071 0.0020
-0.0063 -0.0217 0.0422 -0.0348 0.0322 0.0528 0.0251 -0.0241 0.0082
0.0044 -0.0182 -0.0314 0.0103 0.0093 0.0082 -0.0107 -0.0084 -0.0046
-0.0100 0.0130 0.0194 0.0238 0.0413 0.0008 -0.0401 -0.0149 0.0042
-0.0100 0.0105 0.0055 -0.0067 0.0082 -0.0116 -0.0405 -0.0235 -0.0085
-0.0041 0.0091 -0.0085 -0.0227 0.0115 -0.0168 0.0121 -0.0076 -0.0033
0.0116 -0.0225 -0.0074 -0.0074 0.0006 -0.0124 0.0328 -0.0056 -0.0013
-0.0102 0.0064 -0.0203 -0.0116 -0.0196 -0.0198 -0.0123 -0.0136 -0.0126
-0.0064 -0.0149 0.0077 0.0214 -0.0402 -0.0633 -0.0079 -0.0083 -0.0140
-0.0131 0.0191 -0.0103 -0.0297 -0.0446 0.0119 -0.0316 0.0120 -0.0108
0.0083 0.0421 0.0415 0.0580 0.0250 -0.0092 0.0093 0.0201 0.0244
0.0083 0.0421 0.0415 0.0580 0.0250 -0.0092 0.0093 0.0201 0.0244
0.0159 0.0082 0.0178 0.0356 0.0008 -0.0094 0.0051 -0.0639 0.0013
-0.0165 0.0368 -0.0217 0.0024 0.0169 0.0204 -0.0257 -0.0096 0.0004
-0.0165 0.0368 -0.0217 0.0024 0.0169 0.0204 -0.0257 -0.0096 0.0004
0.0106 0.0154 -0.0193 0.0021 -0.0383 -0.0077 0.0020 -0.0089 -0.0055
0.0106 0.0154 -0.0193 0.0021 -0.0383 -0.0077 0.0020 -0.0089 -0.0055
0.0031 0.0177 0.0186 -0.0508 0.0025 0.0005 -0.0058 -0.0088 -0.0029
0.0655 -0.0280 -0.0460 -0.0417 -0.0036 -0.0089 -0.0193 -0.0057 -0.0110
0.0235 0.0020 -0.0030 0.0472 -0.0004 0.0082 -0.0198 0.0305 0.0110
-0.0030 0.0112 -0.0280 -0.0057 -0.0042 0.0799 -0.0130 -0.0217 0.0019
-0.0318 -0.0148 -0.0320 0.0425 0.0151 -0.0272 -0.0303 0.0189 -0.0075

56
AVERAGE OF AR
ABNORMAL RETURNS OF INDIVIDUAL SECURITY ON "t" TIME ARjt = Rjt - Rmt n
EVENT DAY ARt = ∑ ARjt / N
-3 -2 -1 0 1 2 3 4 J1
-0.0318 -0.0148 -0.0320 0.0425 0.0151 -0.0272 -0.0303 0.0189 -0.0075
0.0072 -0.0173 0.0335 -0.0449 -0.0252 0.0152 0.0105 0.0150 -0.0007
-0.0063 -0.0113 0.0296 0.0121 0.0467 0.0493 0.0529 -0.0176 0.0194
0.0437 -0.0013 -0.0078 0.0115 -0.0254 0.0042 0.0105 -0.0040 0.0039
-0.0589 0.0129 0.0056 -0.0023 0.0056 0.0669 -0.0118 0.0323 0.0063
-0.0008 0.0073 -0.0023 0.0297 0.0365 0.0530 0.0502 0.0422 0.0270
-0.0144 -0.0179 -0.0069 -0.0014 -0.0083 -0.0021 -0.0129 -0.0058 -0.0087
0.0315 0.0502 -0.0247 0.0006 0.0202 0.0399 -0.0261 -0.0614 0.0038
0.0430 0.0857 0.0783 0.0883 0.0066 -0.0350 -0.0626 0.0213 0.0282
0.0430 0.0857 0.0783 0.0883 0.0066 -0.0350 -0.0626 0.0213 0.0282
0.0052 -0.0365 -0.0397 -0.0219 0.0386 -0.0270 0.0030 0.0205 -0.0072
0.0360 0.0357 -0.0128 -0.0183 -0.0147 -0.0084 -0.0003 -0.0068 0.0013
0.0451 0.0397 0.0400 0.0331 -0.0091 -0.0103 0.0025 -0.0049 0.0170
0.0451 0.0397 0.0400 0.0331 -0.0091 -0.0103 0.0025 -0.0049 0.0170
-0.0069 -0.0003 -0.0081 0.0163 0.0011 0.0106 -0.0189 0.0121 0.0007
-0.0057 -0.0131 -0.0161 -0.0037 0.0056 0.0004 -0.0034 -0.0007 -0.0046
0.0086 -0.0017 0.0247 0.0118 -0.0010 -0.0173 -0.0224 0.0070 0.0012
0.0212 -0.0100 0.0248 0.0256 0.0003 0.0013 -0.0022 -0.0280 0.0041
0.0271 -0.0278 -0.0250 0.0459 -0.0186 -0.0154 0.0195 0.0100 0.0020
-0.0031 0.0151 0.0175 0.0028 0.0261 0.0238 -0.0149 -0.0141 0.0066
-0.0519 0.0222 -0.0048 -0.0800 0.1661 -0.0228 -0.0223 -0.0401 -0.0042
-0.0188 -0.0156 0.0142 -0.0160 0.0004 -0.0146 0.0206 0.0044 -0.0032
-0.0189 0.0024 0.0113 -0.0393 -0.0037 -0.0126 0.0025 -0.0062 -0.0081
0.0145 -0.1246 0.0340 0.0123 -0.0067 -0.0301 0.0136 0.0451 -0.0052
-0.0688 0.0581 -0.0438 0.0383 -0.0025 -0.0218 -0.0087 -0.0060 -0.0069
0.0187 -0.0040 0.0188 -0.0034 -0.0218 -0.0072 0.0369 0.0349 0.0091
0.0187 -0.0040 0.0188 -0.0034 -0.0218 -0.0072 0.0369 0.0349 0.0091
0.0436 -0.0112 -0.0512 -0.0081 -0.0343 -0.0313 -0.0140 0.0039 -0.0128
0.0436 -0.0112 -0.0512 -0.0081 -0.0343 -0.0313 -0.0140 0.0039 -0.0128
0.0123 -0.0109 -0.0141 -0.0648 0.0552 0.0161 -0.0474 0.0211 -0.0041
-0.0158 -0.0175 -0.0343 -0.0233 -0.0058 -0.0191 -0.0018 -0.0396 -0.0196
-0.0197 -0.0143 -0.0093 0.0097 -0.0096 -0.0051 -0.0082 -0.0020 -0.0073
-0.0197 -0.0143 -0.0093 0.0097 -0.0096 -0.0051 -0.0082 -0.0020 -0.0073
-0.0197 -0.0143 -0.0093 0.0097 -0.0096 -0.0051 -0.0082 -0.0020 -0.0073
0.0145 -0.0099 0.0173 -0.0216 -0.0007 -0.0487 0.0016 0.0000 -0.0059
0.0006 -0.0041 0.0014 -0.0637 0.0049 0.0010 -0.0214 0.0025 -0.0098
-0.0556 -0.0013 0.0033 0.0054 0.0006 -0.0030 -0.0040 -0.0006 -0.0069
0.7317 0.0260 0.0267 0.0340 0.0298 0.0378 0.0232 0.0241 0.0915
t
CAR = ∑ ARk -0.0069
t - T
57
BIBLIOGRAPHY
Aharony, J., and Swary I. 1980. Quarterly dividend and earnings announcements and stockholders' returns: An empirical analysis. Journal of Finance 35: 1-12. Angel, J. 1998. Tick size, share prices, and stock splits. Journal of Finance 52: 655-681. Angel, J.; Brooks, R.; and Mathew, P. 1997. When-issued shares, small traders, and the variance of returns around stock splits. Working paper, Georgetown University (October). Asquith, P.; Healy, P; and Palepu, K. 1989. Earnings and stock sp lits. The Accounting Review 64: 387-403. Asquith, P., and Mullins, D. 1983. The impact of initiating dividend payments on shareholders' wealth. Journal of Business 56: 77-96. Bernartzi, S.; Michaely, R.; and Thaler, R. 1997. Do changes in dividends signal the future or the past? Journal of Finance 52: 1007-1030. Bernheim, D., and Wantz, A. 1994. A tax-based test of the dividend signaling hypothesis. W orking paper, Stanford U niversity. Bhattacharya, S. 1979. Im perfect information, dividend policy, and the 'bird in the hand' fallacy. Bell Journal of Economics 10: 259-270. Boehmer, E.; Musumeci, J.; and Poulsen, A. 1991. Event study methodology under conditions of event-induced uncertainty. Journal of Financial Economics 30: 253-272. Copeland, T. 1979. Liquidity changes following stock splits. Journal of Finance, 34: 115-141. Dann, L.; Masulis, R.; and Mayers, D. 1991. Repurchase tender offers and earnings information. Journal of Accounting and Economics 15: 217-251. DeAngelo H., and DeAngelo, L. 2000. Controlling stockholders and the disciplinary role of corporate payout policy: A study of the Times Mirror Company. Journal of Financial Economics 56: 153-207. DeAngelo H.; DeAngelo L.; and Skinner, D. 1992. Dividends and losses. Journal of Finance 47: 1837-1863.

58
Denis, D.; Denis, D.; and Sarin, A. 1994. The information content of dividend changes: Cash flow signalling, overinvestment, and dividend clienteles. Journal of Financial and Quantitative Analysis 29: 557-587. Dennis, D., and McConnell, J. 1986. Corporate mergers and security returns. Journal of Financial Economics 16: 143-187. Dimson, E. 1983. The stability of U.K. risk measures and the problem of thin trading. Journal of Finance 38: 753-783. Fama, R.; Fisher, L.; Jensen, M.; and Roll R. 1969. The adjustment of stock prices to new information. International Economic Review 10: 1-21. Grinblatt, M.; Masulis, R.; and Titman, S. 1984. The valuation effects of
stock splits and stock dividends. Journal of Financial Economics 13: 461-
490.
Howe, K.; He, J.; and Kao, W. 1992. One-time cash flow announcements
and free cash flow theory: Share repurchases and special dividends.
Journal of Finance 47: 1963-1975.
Healy, P., and Palepu, K. 1988. Earnings information conveyed by
dividend initiations and omissions. Journal of Financial Economics 21:
149-175.
Holderness, C., and Sheehan, D. 1988. The role of majority shareholders in
publically held corporations: An exploratory analysis. Journal of Financial
Economics 20: 317-346.
Jensen, M. 1986. Agency costs of free cash flow, corporate finance, and
takeovers. American Economic Review 76: 323-329.
Jensen, G., and Johnson, J. 1995. The dynamics of dividend reductions.
Financial Management 24: 31-51.
Kryzanowski, L., and Zhang, H. 1996. Trading patterns of small and large
traders around stock ex-sp lit dates. Journal of Financial Research 19: 75-
90.
Lakonishok, J., and Lev, B. 1987. Stock splits and stock dividends: Why,
who, and when. Journal of Finance 42: 913-932.

59
La Porta, R.; Lopez-De-Silanes F.; Shleifer, A.; and Vishny, R. 2000.
Agency problems and dividend policies around the world. Journal of
Finance 55: 1-33.
Lang, L., and Litzenberger, R. 1989. Dividend announcements: Cash flow
signaling vs. free cash flow hypothesis? Journal of Financial Economics
24: 181-191.
Lang, L.; Stulz, R.; and W alkling, R. 1991. A test of the free cash flow
hypothesis: The case of bidder returns. Journal of Financial Economics 29:
315-335.
McNichols, M., and Dravid, A. 1990. Stock dividends, stock splits, and
signalling. Journal of Finance 45: 857-879.
Miller, M., and M odigliani, F. 1961. D ividend policy, growth, and the
valuation of shares. Journal of Business 4: 411-433.
Miller, M.H., and Rock, K. 1985. Dividend policy under asymmetric
information. Journal of Finance 40: 1031-1051.
Nohel, T., and Tarhan, V. 1998. Share repurchases and firm performance:
New evidence on the agency costs of free cash flow. Journal of Financial
Economics 49: 187-222.
Ofer, A., and Siegel, D. 1987. T ests of rational signalling models using
expectations data: An application to dividend signalling. Journal of
Finance 42: 889-911.
Perfect, S., and Wiles, K. 1994. Alternative constructions of Tobin’s q: An
empirical comparison. Journal of Empirical Finance 1: 313-341.
Pettit, R. 1972. Dividend announcements, security performance, and
capital market efficiency. Journal of Finance 27: 993-1008.
Scholes, M., and Williams, J. 1977. Estimating beta from non-synchronous
data. Journal of Financial Economics 5: 309-327.
Schultz, P. 2000. Stock splits, tick size, and sponsorship. Journal of
Finance 55: 429-450.

60
Vafeas, N. 1997. Determinants of the choice between alternative share
repurchase methods. Journal of Accounting, Auditing, and Finance 12:
101- 124.
Yoon, P., and Starks L. 1995. Signalling, investment opportunities, and
dividend announcements. Review of Financial Studies 8: 995-1018.