mutual funds and other 4 4 - site.iugaza.edu.pssite.iugaza.edu.ps/wdaya/files/2010/02/ch04.pdf ·...
TRANSCRIPT

Confirming Pages
4 4 THE PREVIOUS CHAPTER introduced you to the mechanics of trading securities and the structure of the markets in which securities trade. Commonly, however, individual inves-tors do not trade securities directly for their own accounts. Instead, they direct their funds to investment companies that purchase secu-rities on their behalf. The most important of these financial intermediaries are open-end investment companies, more commonly known as mutual funds, to which we devote most of this chapter. We also touch briefly on other types of investment companies such as unit investment trusts, hedge funds, and closed-end funds. We begin the chap-ter by describing and comparing the various
types of investment companies available to investors. We then examine the functions of mutual funds, their investment styles and pol-icies, and the costs of investing in these funds. Next we take a first look at the investment performance of these funds. We consider the impact of expenses and turnover on net per-formance and examine the extent to which performance is consistent from one period to the next. In other words, will the mutual funds that were the best past performers be the best future performers? Finally, we dis-cuss sources of information on mutual funds, and we consider in detail the information provided in the most comprehensive guide, Morningstar’s Mutual Fund Sourcebook.
Mutual Funds and Other Investment Companies
CHAPTER FOUR PA
RT
I
4.1 Investment Companies Investment companies are financial intermediaries that collect funds from individual investors and invest those funds in a potentially wide range of securities or other assets. Pooling of assets is the key idea behind investment companies. Each investor has a claim to the portfolio established by the investment company in proportion to the amount invested. These companies thus provide a mechanism for small investors to “team up” to obtain the benefits of large-scale investing.
Investment companies perform several important functions for their investors:
1. Record keeping and administration. Investment companies issue periodic status reports, keeping track of capital gains distributions, dividends, investments, and redemptions, and they may reinvest dividend and interest income for shareholders.
bod30700_ch04_092-116.indd 92bod30700_ch04_092-116.indd 92 6/21/10 12:22 PM6/21/10 12:22 PM

Confirming Pages
C H A P T E R 4 Mutual Funds and Other Investment Companies 93
2. Diversification and divisibility. By pooling their money, investment companies enable investors to hold fractional shares of many different securities. They can act as large investors even if any individual shareholder cannot.
3. Professional management. Investment companies can support full-time staffs of security analysts and portfolio managers who attempt to achieve superior invest-ment results for their investors.
4. Lower transaction costs. Because they trade large blocks of securities, investment companies can achieve substantial savings on brokerage fees and commissions.
While all investment companies pool assets of individual investors, they also need to divide claims to those assets among those investors. Investors buy shares in investment companies, and ownership is proportional to the number of shares purchased. The value of each share is called the net asset value, or NAV. Net asset value equals assets minus liabilities expressed on a per-share basis:
Net asset value 5Market value of assets minus liabilities
Shares outstanding
Example 4.1 Net Asset Value
Consider a mutual fund that manages a portfolio of securities worth $120 million. Suppose the fund owes $4 million to its investment advisers and owes another $1 million for rent, wages due, and miscellaneous expenses. The fund has 5 million shares outstanding.
Net asset value 5$120 million 2 $5 million
5 million shares5 $23 per share
CONCEPT CHECK
1
Consider these data from the March 2009 balance sheet of Vanguard’s Global Equity Fund. What was the net asset value of the fund? Assets: $3,035.74 million Liabilities: $ 83.08 million Shares: 281.69 million
4.2 Types of Investment Companies In the United States, investment companies are classified by the Investment Company Act of 1940 as either unit investment trusts or managed investment companies. The portfolios of unit investment trusts are essentially fixed and thus are called “unmanaged.” In contrast, man-aged companies are so named because securities in their investment portfolios continually are bought and sold: The portfolios are managed. Managed companies are further classified as either closed-end or open-end. Open-end companies are what we commonly call mutual funds.
Unit Investment Trusts Unit investment trusts are pools of money invested in a portfolio that is fixed for the life of the fund. To form a unit investment trust, a sponsor, typically a brokerage firm, buys a
bod30700_ch04_092-116.indd 93bod30700_ch04_092-116.indd 93 6/21/10 12:22 PM6/21/10 12:22 PM

Confirming Pages
94 P A R T I Introduction
portfolio of securities that are deposited into a trust. It then sells shares, or “units,” in the trust, called redeemable trust certificates. All income and payments of principal from the portfolio are paid out by the fund’s trustees (a bank or trust company) to the shareholders.
There is little active management of a unit investment trust because once established, the portfolio composition is fixed; hence these trusts are referred to as unmanaged. Trusts tend to invest in relatively uniform types of assets; for example, one trust may invest in municipal bonds, another in corporate bonds. The uniformity of the portfolio is consistent with the lack of active management. The trusts provide investors a vehicle to purchase a pool of one particular type of asset that can be included in an overall portfolio as desired.
Sponsors of unit investment trusts earn their profit by selling shares in the trust at a pre-mium to the cost of acquiring the underlying assets. For example, a trust that has purchased $5 million of assets may sell 5,000 shares to the public at a price of $1,030 per share, which (assuming the trust has no liabilities) represents a 3% premium over the net asset value of the securities held by the trust. The 3% premium is the trustee’s fee for establish-ing the trust.
Investors who wish to liquidate their holdings of a unit investment trust may sell the shares back to the trustee for net asset value. The trustees can either sell enough securi-ties from the asset portfolio to obtain the cash necessary to pay the investor, or they may instead sell the shares to a new investor (again at a slight premium to net asset value). Unit investment trusts have steadily lost market share to mutual funds in recent years. Assets in such trusts declined from $105 billion in 1990 to only $29 billion in early 2009.
Managed Investment Companies There are two types of managed companies: closed-end and open-end. In both cases, the fund’s board of directors, which is elected by shareholders, hires a management company to manage the portfolio for an annual fee that typically ranges from .2% to 1.5% of assets. In many cases the management company is the firm that organized the fund. For example, Fidelity Management and Research Corporation sponsors many Fidelity mutual funds and is responsible for managing the portfolios. It assesses a management fee on each Fidelity fund. In other cases, a mutual fund will hire an outside portfolio manager. For example, Vanguard has hired Wellington Management as the investment adviser for its Wellington Fund. Most management companies have contracts to manage several funds.
Open-end funds stand ready to redeem or issue shares at their net asset value (although both purchases and redemptions may involve sales charges). When investors in open-
end funds wish to “cash out” their shares, they sell them back to the fund at NAV. In contrast, closed-end funds do not redeem or issue shares. Investors in closed-end funds who wish to cash out must sell their shares to other inves-tors. Shares of closed-end funds are traded on organized exchanges and can be purchased through brokers just like other common stock; their prices, therefore, can differ from NAV. In early 2009, about $188 billion of assets were held in closed-end funds.
Figure 4.1 is a listing of closed-end funds. The first col-umn gives the name and ticker symbol of the fund. The next two columns give the fund’s most recent net asset value and closing share price. The premium or discount in the next column is the percentage difference between price and NAV: (Price – NAV)/NAV. Notice that there are more funds
Figure 4.1 Closed-end mutual funds
Source: Data compiled from The Wall Street Journal Online, October 30, 2009.
FUND NAV MKT PRICEPREM/DISC %
52-WEEK MKTRETURN %
Gabelli Equity Trust (GAB)General Amer Investors (GAM)J Hancock Tx-Adv Div Inc (HTD)Liberty All-Star Equity (USA)Liberty All-Star Growth (ASG)Nuveen Core Equity Alpha (JCE)Nuveen Tx-Adv TR Strat (JTA)
Gabelli Div & Inc Tr (GDV)4.85
26.8513.135.083.77
12.7111.41
14.91
23.2411.904.133.13
10.9610.01
12.274.93 1.65
−13.45−9.37
−18.70−16.98−13.77−12.27
−17.7151.9438.7846.2739.3331.9626.8453.94
44.02
bod30700_ch04_092-116.indd 94bod30700_ch04_092-116.indd 94 6/21/10 12:22 PM6/21/10 12:22 PM

Confirming Pages
C H A P T E R 4 Mutual Funds and Other Investment Companies 95
selling at discounts to NAV (indicated by negative differences) than premiums. Finally, the 52-week return based on the percentage change in share price plus dividend income is presented in the last column.
The common divergence of price from net asset value, often by wide margins, is a puzzle that has yet to be fully explained. To see why this is a puzzle, consider a closed-end fund that is selling at a discount from net asset value. If the fund were to sell all the assets in the portfolio, it would realize proceeds equal to net asset value. The difference between the market price of the fund and the fund’s NAV would represent the per-share increase in the wealth of the fund’s investors. Moreover, fund premiums or discounts tend to dissipate over time, so funds selling at a discount receive a boost to their rate of return as the discount shrinks. Pontiff estimates that a fund selling at a 20% discount would have an expected 12-month return more than 6% greater than funds selling at net asset value. 1
Interestingly, while many closed-end funds sell at a discount from net asset value, the prices of these funds when originally issued are often above NAV. This is a further puzzle, as it is hard to explain why investors would purchase these newly issued funds at a pre-mium to NAV when the shares tend to fall to a discount shortly after issue.
In contrast to closed-end funds, the price of open-end funds cannot fall below NAV, because these funds stand ready to redeem shares at NAV. The offering price will exceed NAV, however, if the fund carries a load. A load is, in effect, a sales charge. Load funds are sold by securities brokers and directly by mutual fund groups.
Unlike closed-end funds, open-end mutual funds do not trade on organized exchanges. Instead, investors simply buy shares from and liquidate through the investment company at net asset value. Thus the number of outstanding shares of these funds changes daily.
Other Investment Organizations Same intermediaries are not formally organized or regulated as investment companies, but nevertheless serve similar functions. Three of the more important are commingled funds, real estate investment trusts, and hedge funds.
Commingled Funds Commingled funds are partnerships of investors that pool funds. The management firm that organizes the partnership, for example, a bank or insur-ance company, manages the funds for a fee. Typical partners in a commingled fund might be trust or retirement accounts with portfolios much larger than those of most individual investors, but still too small to warrant managing on a separate basis.
Commingled funds are similar in form to open-end mutual funds. Instead of shares, though, the fund offers units, which are bought and sold at net asset value. A bank or insur-ance company may offer an array of different commingled funds, for example, a money market fund, a bond fund, and a common stock fund.
Real Estate Investment Trusts ( REIT s) A REIT is similar to a closed-end fund. REITs invest in real estate or loans secured by real estate. Besides issuing shares, they raise capital by borrowing from banks and issuing bonds or mortgages. Most of them are highly leveraged, with a typical debt ratio of 70%.
There are two principal kinds of REITs. Equity trusts invest in real estate directly, whereas mortgage trusts invest primarily in mortgage and construction loans. REITs gen-erally are established by banks, insurance companies, or mortgage companies, which then serve as investment managers to earn a fee.
1 Jeffrey Pontiff, “Costly Arbitrage: Evidence from Closed-End Funds,” Quarterly Journal of Economics 111 (November 1996), pp. 1135–51.
bod30700_ch04_092-116.indd 95bod30700_ch04_092-116.indd 95 6/21/10 12:22 PM6/21/10 12:22 PM

Confirming Pages
96 P A R T I Introduction
Hedge Funds Like mutual funds, hedge funds are vehicles that allow private inves-tors to pool assets to be invested by a fund manager. Unlike mutual funds, however, hedge funds are commonly structured as private partnerships and thus subject to only minimal SEC regulation. They typically are open only to wealthy or institutional investors. Many require investors to agree to initial “lock-ups,” that is, periods as long as several years in which investments cannot be withdrawn. Lock-ups allow hedge funds to invest in illiquid assets without worrying about meeting demands for redemption of funds. Moreover, because hedge funds are only lightly regulated, their managers can pursue investment strategies involving, for example, heavy use of derivatives, short sales, and leverage; such s trategies typically are not open to mutual fund managers.
Hedge funds by design are empowered to invest in a wide range of investments, with various funds focusing on derivatives, distressed firms, currency speculation, convertible bonds, emerging markets, merger arbitrage, and so on. Other funds may jump from one asset class to another as perceived investment opportunities shift.
Hedge funds enjoyed great growth in the last several years, with assets under manage-ment ballooning from about $50 billion in 1990 to just under $2 trillion in mid-2008, before contracting to around $1.4 trillion in the face of the credit crisis that began in mid-2008. Because of their recent prominence, we devote all of Chapter 26 to these funds.
4.3 Mutual Funds Mutual funds are the common name for open-end investment companies. This is the domi-nant investment company today, accounting for more than 90% of investment company assets. Assets under management in the U.S. mutual fund industry were approximately $10 trillion in early 2009, and approximately another $9 trillion was held in non-U.S. funds.
Investment Policies Each mutual fund has a specified investment policy, which is described in the fund’s pro-spectus. For example, money market mutual funds hold the short-term, low-risk instru-ments of the money market (see Chapter 2 for a review of these securities), while bond funds hold fixed-income securities. Some funds have even more narrowly defined man-dates. For example, some bond funds will hold primarily Treasury bonds, others primarily mortgage-backed securities.
Management companies manage a family, or “complex,” of mutual funds. They orga-nize an entire collection of funds and then collect a management fee for operating them. By managing a collection of funds under one umbrella, these companies make it easy for investors to allocate assets across market sectors and to switch assets across funds while still benefiting from centralized record keeping. Some of the most well-known management companies are Fidelity, Vanguard, Putnam, and Dreyfus. Each offers an array of open-end mutual funds with different investment policies. In early 2009, there were nearly 9,000 mutual funds in the U.S., which were offered by fewer than 700 fund complexes.
Funds are commonly classified by investment policy into one of the following groups.
Money Market Funds These funds invest in money market securities such as com-mercial paper, repurchase agreements, or certificates of deposit. The average maturity of these assets tends to be a bit more than 1 month. Money market funds usually offer
bod30700_ch04_092-116.indd 96bod30700_ch04_092-116.indd 96 6/21/10 12:22 PM6/21/10 12:22 PM

Confirming Pages
C H A P T E R 4 Mutual Funds and Other Investment Companies 97
check-writing features, and net asset value is fixed at $1 per share, 2 so that there are no tax implications such as capital gains or losses associated with redemption of shares.
Equity Funds Equity funds invest primarily in stock, although they may, at the portfo-lio manager’s discretion, also hold fixed-income or other types of securities. Equity funds commonly will hold between 4% and 5% of total assets in money market securities to provide liquidity necessary to meet potential redemption of shares.
Stock funds are traditionally classified by their emphasis on capital appreciation versus current income. Thus, income funds tend to hold shares of firms with consistently high dividend yields. Growth funds are willing to forgo current income, focusing instead on prospects for capital gains. While the classification of these funds is couched in terms of income versus capital gains, in practice, the more relevant distinction concerns the level of risk these funds assume. Growth stocks, and therefore growth funds, are typically riskier and respond far more dramatically to changes in economic conditions than do income funds.
Sector Funds Some equity funds, called sector funds, concentrate on a particular industry. For example, Fidelity markets dozens of “select funds,” each of which invests in a specific industry such as biotechnology, utilities, precious metals, or telecommunications. Other funds specialize in securities of particular countries.
Bond Funds As the name suggests, these funds specialize in the fixed-income sec-tor. Within that sector, however, there is considerable room for further specialization. For example, various funds will concentrate on corporate bonds, Treasury bonds, mortgage-backed securities, or municipal (tax-free) bonds. Indeed, some municipal bond funds invest only in bonds of a particular state (or even city!) to satisfy the investment desires of residents of that state who wish to avoid local as well as federal taxes on interest income. Many funds also specialize by maturity, ranging from short-term to intermediate to long-term, or by the credit risk of the issuer, ranging from very safe to high-yield, or “junk,” bonds.
International Funds Many funds have international focus. Global funds invest in securities worldwide, including the United States. In contrast, international funds invest in securities of firms located outside the United States. Regional funds concentrate on a particular part of the world, and emerging market funds invest in companies of developing nations.
Balanced Funds Some funds are designed to be candidates for an individual’s entire investment portfolio. These balanced funds hold both equities and fixed-income securi-ties in relatively stable proportions. Life-cycle funds are balanced funds in which the asset mix can range from aggressive (primarily marketed to younger investors) to conservative (directed at older investors). Static allocation life-cycle funds maintain a stable mix across stocks and bonds, while targeted-maturity funds gradually become more conservative as the investor ages.
2 The box in Chapter 2 noted that money market funds are able to maintain NAV at $1.00 because they invest in short-maturity debt of the highest quality with minimal price risk. In only the rarest circumstances have any funds incurred losses large enough to drive NAV below $1.00. In September 2008, however, Reserve Primary Fund, the nation’s oldest money market fund, “broke the buck” when it suffered losses on its holding of Lehman Brothers commercial paper, and its NAV fell to $.97.
bod30700_ch04_092-116.indd 97bod30700_ch04_092-116.indd 97 6/21/10 12:22 PM6/21/10 12:22 PM

Confirming Pages
98 P A R T I Introduction
Asset Allocation and Flexible Funds These funds are similar to balanced funds in that they hold both stocks and bonds. However, asset allocation funds may dramatically vary the proportions allocated to each market in accord with the portfolio manager’s fore-cast of the relative performance of each sector. Hence these funds are engaged in market timing and are not designed to be low-risk investment vehicles.
Index Funds An index fund tries to match the performance of a broad market index. The fund buys shares in securities included in a particular index in proportion to each secu-rity’s representation in that index. For example, the Vanguard 500 Index Fund is a mutual fund that replicates the composition of the Standard & Poor’s 500 stock price index. Because the S&P 500 is a value-weighted index, the fund buys shares in each S&P 500 company in proportion to the market value of that company’s outstanding equity. Investment in an index fund is a low-cost way for small investors to pursue a passive investment strategy—that is, to invest without engaging in security analysis. Of course, index funds can be tied to nonequity indexes as well. For example, Vanguard offers a bond index fund and a real estate index fund.
Table 4.1 breaks down the number of mutual funds by investment orientation. Sometimes a fund name describes its investment policy. For example, Vanguard’s GNMA fund invests in mortgage-backed securities, the Municipal Intermediate fund invests in intermediate-term municipal bonds, and the High-Yield Corporate bond fund invests in large part in speculative grade, or “junk,” bonds with high yields. However, names of common stock funds often reflect little or nothing about their investment policies. Examples are Vanguard’s Windsor and Wellington funds.
Table 4.1
U.S. mutual funds by investment classification
Assets ($ billion)
% of Total Assets
Number of Funds
Equity funds Capital appreciation focus $1,650.1 17.2% 3,019 World/international 866.6 9.0 1,062 Total return 1,187.8 12.4 749 Total equity funds $3,704.5 38.6% 4,830
Bond funds Corporate $ 246.1 2.6% 281 High yield 111.4 1.2 195 World 86.2 0.9 131 Government 235.2 2.4 294 Strategic income 549.1 5.7 378 Single-state municipal 134.9 1.4 417 National municipal 202.9 2.1 220 Total bond funds $1,565.8 16.3% 1,916
Hybrid (bond/stock) funds $ 498.7 5.2% 492Money market funds Taxable $3,340.8 34.8% 536 Tax-exempt 491.5 5.1 248 Total money market funds $3,832.3 39.9% 784Total $9,601.3 100.0% 8,022
Note: Column sums subject to rounding error.Source: Investment Company Institute, 2009 Mutual Fund Fact Book.
bod30700_ch04_092-116.indd 98bod30700_ch04_092-116.indd 98 6/21/10 12:22 PM6/21/10 12:22 PM

Confirming Pages
C H A P T E R 4 Mutual Funds and Other Investment Companies 99
How Funds Are Sold Mutual funds are generally marketed to the public either directly by the fund underwriter or indirectly through brokers acting on behalf of the underwriter. Direct-marketed funds are sold through the mail, various offices of the fund, over the phone, or, more so, over the Internet. Investors contact the fund directly to purchase shares.
About half of fund sales today are distributed through a sales force. Brokers or financial advisers receive a commission for selling shares to investors. (Ultimately, the commission is paid by the investor. More on this shortly.) In some cases, funds use a “captive” sales force that sells only shares in funds of the mutual fund group they represent.
Investors who rely on their broker’s advice to select their mutual funds should be aware that brokers may have a conflict of interest with regard to fund selection. This arises from a practice called revenue sharing, in which fund companies pay the brokerage firm for preferential treatment when making investment recommendations.
Revenue sharing poses potential conflicts of interest if it induces brokers to recommend mutual funds on the basis of criteria other than the best interests of their clients. In addi-tion, the mutual fund may be violating its obligation to its existing investors if it uses fund assets to pay brokers for favored status in new sales. SEC rules require brokerage firms to explicitly reveal any compensation or other incentives they receive to sell a particular fund, both at the time of sale and in the trade confirmation.
Many funds also are sold through “financial supermarkets” that sell shares in funds of many complexes. Instead of charging customers a sales commission, the broker splits management fees with the mutual fund company. Another advantage is unified record keeping for all funds purchased from the supermarket, even if the funds are offered by different complexes. On the other hand, many contend that these supermarkets result in higher expense ratios because mutual funds pass along the costs of participating in these programs in the form of higher management fees.
4.4 Costs of Investing in Mutual Funds Fee Structure An individual investor choosing a mutual fund should consider not only the fund’s stated investment policy and past performance but also its management fees and other expenses. Comparative data on virtually all important aspects of mutual funds are available in the annual reports prepared by CDA Wiesenberger Investment Companies Services or in Morningstar’s Mutual Fund Sourcebook, which can be found in many academic and public libraries. You should be aware of four general classes of fees.
Operating Expenses Operating expenses are the costs incurred by the mutual fund in operating the portfolio, including administrative expenses and advisory fees paid to the investment manager. These expenses, usually expressed as a percentage of total assets under management, may range from 0.2% to 2%. Shareholders do not receive an explicit bill for these operating expenses; however, the expenses periodically are deducted from the assets of the fund. Shareholders pay for these expenses through the reduced value of the portfolio.
In addition to operating expenses, many funds assess fees to pay for marketing and distribution costs. These charges are used primarily to pay the brokers or financial advis-ers who sell the funds to the public. Investors can avoid these expenses by buying shares directly from the fund sponsor, but many investors are willing to incur these distribution fees in return for the advice they may receive from their broker.
bod30700_ch04_092-116.indd 99bod30700_ch04_092-116.indd 99 6/21/10 12:22 PM6/21/10 12:22 PM

Confirming Pages
100 P A R T I Introduction
Front-End Load A front-end load is a commission or sales charge paid when you purchase the shares. These charges, which are used primarily to pay the brokers who sell the funds, may not exceed 8.5%, but in practice they are rarely higher than 6%. Low-load funds have loads that range up to 3% of invested funds. No-load funds have no front-end sales charges. Loads effectively reduce the amount of money invested. For example, each $1,000 paid for a fund with a 6% load results in a sales charge of $60 and fund investment of only $940. You need cumulative returns of 6.4% of your net investment (60/940 � .064) just to break even.
Back-End Load A back-end load is a redemption, or “exit,” fee incurred when you sell your shares. Typically, funds that impose back-end loads start them at 5% or 6% and reduce them by 1 percentage point for every year the funds are left invested. Thus an exit fee that starts at 6% would fall to 4% by the start of your third year. These charges are known more formally as “contingent deferred sales charges.”
12b-1 Charges The Securities and Exchange Commission allows the managers of so-called 12b-1 funds to use fund assets to pay for distribution costs such as advertising, promotional literature including annual reports and prospectuses, and, most important, commissions paid to brokers who sell the fund to investors. These 12b-1 fees are named after the SEC rule that permits use of these plans. Funds may use 12b-1 charges instead of, or in addition to, front-end loads to generate the fees with which to pay brokers. As with operating expenses, investors are not explicitly billed for 12b-1 charges. Instead, the fees are deducted from the assets of the fund. Therefore, 12b-1 fees (if any) must be added to operating expenses to obtain the true annual expense ratio of the fund. The SEC requires that all funds include in the prospectus a consolidated expense table that sum-marizes all relevant fees. The 12b-1 fees are limited to 1% of a fund’s average net assets per year. 3
Many funds offer “classes” that represent ownership in the same portfolio of securities, but with different combinations of fees. For example, Class A shares might have front-end loads while Class B shares rely on 12b-1 fees.
3 The maximum 12b-1 charge for the sale of the fund is .75%. However, an additional service fee of .25% of the fund’s assets also is allowed for personal service and/or maintenance of shareholder accounts.
Example 4.2 Fees for Various Classes (Dreyfus Worldwide Growth Fund)
Here are fees for different classes of the Dreyfus Worldwide Growth Fund in 2009. Notice the trade-off between the front-end loads versus 12b-1 charges.
Class A Class B Class C
Front-end load 0–5.75%a 0 0Back-end load 0 0–4%b 0–1%b
12b-1 feesc .25% 1.0% 1.0%Expense ratio 1.09% 1.47% 1.08%
aDepending on size of investment.bDepending on years until holdings are sold.cIncluding service fee.
bod30700_ch04_092-116.indd 100bod30700_ch04_092-116.indd 100 6/21/10 12:22 PM6/21/10 12:22 PM

Confirming Pages
C H A P T E R 4 Mutual Funds and Other Investment Companies 101
Each investor must choose the best combination of fees. Obviously, pure no-load no-fee funds distributed directly by the mutual fund group are the cheapest alternative, and these will often make most sense for knowledgeable investors. However, as we have noted, many investors are willing to pay for financial advice, and the commissions paid to advisers who sell these funds are the most common form of payment. Alternatively, investors may choose to hire a fee-only financial manager who charges directly for services instead of collecting commissions. These advisers can help investors select portfolios of low- or no-load funds (as well as provide other financial advice). Independent financial planners have become increasingly important distribution channels for funds in recent years.
If you do buy a fund through a broker, the choice between paying a load and paying 12b-1 fees will depend primarily on your expected time horizon. Loads are paid only once for each purchase, whereas 12b-1 fees are paid annually. Thus, if you plan to hold your fund for a long time, a one-time load may be preferable to recurring 12b-1 charges.
Fees and Mutual Fund Returns The rate of return on an investment in a mutual fund is measured as the increase or decrease in net asset value plus income distributions such as dividends or distributions of capital gains expressed as a fraction of net asset value at the beginning of the investment period. If we denote the net asset value at the start and end of the period as NAV 0 and NAV 1 , respec-tively, then
Rate of return 5NAV1 2 NAV0 1 Income and capital gain distributions
NAV0
For example, if a fund has an initial NAV of $20 at the start of the month, makes income distributions of $.15 and capital gain distributions of $.05, and ends the month with NAV of $20.10, the monthly rate of return is computed as
Rate of return 5$20.10 2 $20.00 1 $.15 1 $.05
$20.005 .015, or 1.5%
Notice that this measure of the rate of return ignores any commissions such as front-end loads paid to purchase the fund.
On the other hand, the rate of return is affected by the fund’s expenses and 12b-1 fees. This is because such charges are periodically deducted from the portfolio, which reduces net asset value. Thus the rate of return on the fund equals the gross return on the underlying portfolio minus the total expense ratio.
Example 4.3 Fees and Net Returns
To see how expenses can affect rate of return, consider a fund with $100 million in assets at the start of the year and with 10 million shares outstanding. The fund invests in a portfolio of stocks that provides no income but increases in value by 10%. The expense ratio, includ-ing 12b-1 fees, is 1%. What is the rate of return for an investor in the fund?
The initial NAV equals $100 million/10 million shares � $10 per share. In the absence of expenses, fund assets would grow to $110 million and NAV would grow to $11 per share, for a 10% rate of return. However, the expense ratio of the fund is 1%. Therefore, $1 million will be deducted from the fund to pay these fees, leaving the portfolio worth only $109 million, and NAV equal to $10.90. The rate of return on the fund is only 9%, which equals the gross return on the underlying portfolio minus the total expense ratio.
bod30700_ch04_092-116.indd 101bod30700_ch04_092-116.indd 101 6/21/10 12:22 PM6/21/10 12:22 PM

Confirming Pages
102 P A R T I Introduction
Fees can have a big effect on performance. Table 4.2 considers an investor who starts with $10,000 and can choose among three funds that all earn an annual 12% return on invest-ment before fees but have different fee structures. The table shows the cumulative amount in each fund after several investment horizons. Fund A has total operating expenses of .5%, no load, and no 12b-1 charges. This might represent a low-cost producer like Vanguard. Fund B has no load but has 1% in management expenses and .5% in 12b-1 fees. This level of charges is fairly typical of actively managed equity funds. Finally, Fund C has 1% in management expenses, no 12b-1 charges, but assesses an 8% front-end load on purchases.
Note the substantial return advantage of low-cost Fund A. Moreover, that differential is greater for longer investment horizons.
Table 4.2
Impact of costs on investment performance
Cumulative Proceeds(All Dividends Reinvested)
Fund A Fund B Fund C
Initial investment* $10,000 $10,000 $ 9,200 5 years 17,234 16,474 15,502
10 years 29,699 27,141 26,123
15 years 51,183 44,713 44,018
20 years 88,206 73,662 74,173
* After front-end load, if any. Notes: 1. Fund A is no-load with .5% expense ratio. 2. Fund B is no-load with 1.5% expense ratio. 3. Fund C has an 8% load on purchases and a 1% expense ratio. 4. Gross return on all funds is 12% per year before expenses.
CONCEPT CHECK
2
The Equity Fund sells Class A shares with a front-end load of 4% and Class B shares with 12b-1 fees of .5% annually as well as back-end load fees that start at 5% and fall by 1% for each full year the investor holds the portfolio (until the fifth year). Assume the rate of return on the fund portfolio net of operating expenses is 10% annually. What will be the value of a $10,000 investment in Class A and Class B shares if the shares are sold after ( a ) 1 year, ( b ) 4 years, ( c ) 10 years? Which fee structure provides higher net proceeds at the end of each investment horizon?
Although expenses can have a big impact on net investment performance, it is some-times difficult for the investor in a mutual fund to measure true expenses accurately. This is because of the practice of paying for some expenses in soft dollars. A portfolio manager earns soft-dollar credits with a brokerage firm by directing the fund’s trades to that broker. On the basis of those credits, the broker will pay for some of the mutual fund’s expenses, such as databases, computer hardware, or stock-quotation systems. The soft- dollar arrangement means that the stockbroker effectively returns part of the trading commission to the fund. Purchases made with soft dollars are not included in the fund’s expenses, so funds with extensive soft dollar arrangements may report artificially low expense ratios to the public. However, the fund may have paid its broker needlessly high commissions to obtain its soft-dollar “rebate.” The impact of the higher trading commission shows up in net investment performance rather than the reported expense ratio.
bod30700_ch04_092-116.indd 102bod30700_ch04_092-116.indd 102 6/21/10 12:22 PM6/21/10 12:22 PM

Confirming Pages
C H A P T E R 4 Mutual Funds and Other Investment Companies 103
Late Trading and Market Timing Mutual funds calculate net asset value (NAV) at the end of each trading day. All buy or sell orders arriving during the day are executed at that NAV following the market close at 4:00 P.M. New York time. Allowing some favored investors to buy shares in the fund below NAV or redeem their shares for more than NAV would obviously benefit those investors, but at the expense of the remaining shareholders. Yet, that is precisely what many mutual funds did until these practices were exposed in 2003.
Late trading refers to the practice of accepting buy or sell orders after the market closes and NAV is determined. Suppose that based on market closing prices at 4:00, a fund’s NAV equals $100, but at 4:30, some positive economic news is announced. While NAV already has been fixed, it is clear that the fair market value of each share now exceeds $100. If they are able to submit a late order, investors can buy shares at the now-stale NAV and redeem them the next day after prices and NAV have adjusted to reflect the news. Late traders therefore can buy shares in the fund at a price below what NAV would be if it reflected up-to-date information. This transfers value from the other shareholders to the privileged traders and shows up as a reduction in the rate of return of the mutual fund.
Market timing also exploits stale prices. Consider the hypothetical “Pacific Basin Mutual Fund,” which specializes in Japanese stocks. Because of time-zone differences, the Japanese market closes several hours before trading ends in New York. NAV is set based on the closing price of the Japanese shares. If the U.S. market jumps significantly while the Japanese market is closed, however, it is likely that Japanese prices will rise when the market opens in Japan the next day. A market timer will buy the Pacific Basin fund in the U.S. today at its now-stale NAV, planning to redeem those shares the next day for a likely profit. While such activity often is characterized as rapid in-and-out trading, the more salient issue is that the market timer is allowed to transact at a stale price.
Why did some funds engage in practices that reduced the rate of return to most share-holders? The answer is the management fee. Market timers and late traders in essence paid for their access to such practices by investing large amounts in the funds on which the fund manager charged its management fee. Of course, the traders possibly earned far more than those fees through their trading activity, but those costs were borne by the other sharehold-ers, not the fund sponsor.
By mid-2004, mutual fund sponsors had paid more than $1.65 billion in penalties to settle allegations of improper trading. In addition, new rules were implemented to elimi-nate these illicit practices.
4.5 Taxation of Mutual Fund Income Investment returns of mutual funds are granted “pass-through status” under the U.S. tax code, meaning that taxes are paid only by the investor in the mutual fund, not by the fund itself. The income is treated as passed through to the investor as long as the fund meets sev-eral requirements, most notably that virtually all income is distributed to shareholders. A fund’s short-term capital gains, long-term capital gains, and dividends are passed through to investors as though the investor earned the income directly.
The pass-through of investment income has one important disadvantage for individual investors. If you manage your own portfolio, you decide when to realize capital gains and losses on any security; therefore, you can time those realizations to efficiently manage your tax liabilities. When you invest through a mutual fund, however, the timing of the sale
bod30700_ch04_092-116.indd 103bod30700_ch04_092-116.indd 103 6/21/10 12:22 PM6/21/10 12:22 PM

Confirming Pages
104 P A R T I Introduction
of securities from the portfolio is out of your control, which reduces your ability to engage in tax management. 4
A fund with a high portfolio turnover rate can be particularly “tax inefficient.” Turnover is the ratio of the trading activity of a portfolio to the assets of the portfolio. It measures the fraction of the portfolio that is “replaced” each year. For example, a $100 million portfolio with $50 million in sales of some securities with purchases of other securities would have a turnover rate of 50%. High turnover means that capital gains or losses are being realized constantly, and therefore that the investor cannot time the realizations to manage his or her overall tax obligation.
Turnover rates in equity funds in the last decade have typically been around 60% when weighted by assets under management. By contrast, a low-turnover fund such as an index fund may have turnover as low as 2%, which is both tax-efficient and economical with respect to trading costs.
Exchange-traded funds (ETFs), first introduced in 1993, are offshoots of mutual funds that allow investors to trade index portfolios just as they do shares of stock. The first ETF was the “spider,” a nickname for SPDR, or Standard & Poor’s Depository Receipt, which is a unit investment trust holding a portfolio matching the S&P 500 index. Unlike mutual funds, which can be bought or sold only at the end of the day when NAV is calculated, investors can trade spiders throughout the day, just like any other share of stock. Spiders gave rise to many similar products such as “diamonds” (based on the Dow Jones Industrial Average, ticker DIA), “Cubes” (based on the NASDAQ 100 index, ticker QQQQ), and “WEBS” (World Equity Benchmark Shares, which are shares in portfolios of foreign stock market indexes). By 2009, about $531 billion were invested in more than 700 U.S. ETFs. In 2010, assets under management in ETFs worldwide reached $1 trillion. Figure 4.2 shows the growth of exchange-traded funds since 1998.
Until 2008, most ETFs were required to track specified indexes, and index-based ETFs still dominate the industry. However, the range of products now includes funds that track industry indexes as well. Table 4.3 , panel A, presents some of the major sponsors of ETFs, and panel B gives a small flavor of the types of funds offered.
4 An interesting problem that an investor needs to be aware of derives from the fact that capital gains and divi-dends on mutual funds are typically paid out to shareholders once or twice a year. This means that an investor who has just purchased shares in a mutual fund can receive a capital gain distribution (and be taxed on that dis-tribution) on transactions that occurred long before he or she purchased shares in the fund. This is particularly a concern late in the year when such distributions typically are made.
CONCEPT CHECK
3
An investor’s portfolio currently is worth $1 million. During the year, the investor sells 1,000 shares of FedEx at a price of $80 per share and 4,000 shares of Cisco at a price of $20 per share. The proceeds are used to buy 1,600 shares of IBM at $100 per share.
a. What was the portfolio turnover rate?
b. If the shares in FedEx originally were purchased for $70 each and those in Cisco were purchased for $17.50, and the investor’s tax rate on capital gains income is 20%, how much extra will the investor owe on this year’s taxes as a result of these transactions?
4.6 Exchange-Traded Funds
bod30700_ch04_092-116.indd 104bod30700_ch04_092-116.indd 104 6/21/10 12:22 PM6/21/10 12:22 PM

Rev. Confirming Pages
C H A P T E R 4 Mutual Funds and Other Investment Companies 105
Figure 4.2 Growth of U.S. ETFs over time
Source: Investment Company Institute, 2009 Investment Company Fact Book.
0
100
200
300
400
500
600
700
800
1998 1999 2000 2001 2002 2003 2004 2005 2006 2007 2008
Assets undermanagement ($billion)
Number of ETFs
Table 4.3
ETF sponsors and products
A. ETF Sponsors
Sponsor Product Name
BlackRock Global Investors iSharesMerrill Lynch HOLDRS (Holding Company Depository Receipts: “Holders”)StateStreet/Merrill Lynch Select Sector SPDRs (S&P Depository Receipts: “Spiders”)Vanguard Vanguard ETF
B. Sample of ETF Products
Name Ticker Index Tracked
Broad U.S. indexesSpiders SPY S&P 500Diamonds DIA Dow Jones IndustrialsCubes QQQQ NASDAQ 100iShares Russell 2000 IWM Russell 2000Total Stock Market (Vanguard) VTI Wilshire 5000
Industry indexesEnergy Select Spider XLE S&P 500 energy companiesiShares Energy Sector IYE Dow Jones energy companiesFinancial Sector Spider XLF S&P 500 financial companiesiShares Financial Sector IYF Dow Jones financial companies
International indexesWEBS United Kingdom EWU MSCI U.K. Index
WEBS France EWQ MSCI France Index
WEBS Japan EWJ MSCI Japan Index
bod30700_ch04_092-116.indd 105bod30700_ch04_092-116.indd 105 7/29/10 3:49 PM7/29/10 3:49 PM
Confirming Pages
106 P A R T I Introduction
Barclay’s Global Investors was long the market leader in the ETF market, using the product name iShares. Since Barclay’s 2009 merger with BlackRock, iShares has operated under the BlackRock name. The firm sponsors ETFs for several dozen equity index funds, including many broad U.S. equity indexes, broad international and single-country funds, and U.S. and global industry sector funds. BlackRock also offers several bond ETFs and a few commodity funds such as ones for gold and silver. For more information on these funds, go to www.iShares.com.
More recently, commodity-based ETFs that invest in either commodities or commod-ity futures contracts have been marketed to the public. In addition, there is now a small number of actively managed ETF funds that, like actively managed mutual funds, attempt to outperform market indexes. But these account for less than 1% of assets under manage-ment in the ETF industry.
ETFs offer several advantages over conventional mutual funds. First, as we just noted, a mutual fund’s net asset value is quoted—and therefore, investors can buy or sell their shares in the fund—only once a day. In contrast, ETFs trade continuously. Moreover, like other shares, but unlike mutual funds, ETFs can be sold short or purchased on margin.
ETFs also offer a potential tax advantage over mutual funds. When large numbers of mutual fund investors redeem their shares, the fund must sell securities to meet the redemptions. This can trigger capital gains taxes, which are passed through to and must be paid by the remaining shareholders. In contrast, when small investors wish to redeem their position in an ETF, they simply sell their shares to other traders, with no need for the fund to sell any of the underlying portfolio. Large investors can exchange their ETF shares for shares in the underlying portfolio; this form of redemption also avoids a tax event.
ETFs are also cheaper than mutual funds. Investors who buy ETFs do so through bro-kers rather than buying directly from the fund. Therefore, the fund saves the cost of mar-keting itself directly to small investors. This reduction in expenses translates into lower management fees.
There are some disadvantages to ETFs, however. Because they trade as securities, there is the possibility that their prices can depart by small amounts from net asset value before arbitrage activity restores equality. Even small discrepancies can easily swamp the cost advantage of ETFs over mutual funds. Second, while mutual funds can be bought at no expense from no-load funds, ETFs must be purchased from brokers for a fee.
4.7 Mutual Fund Investment Performance: A First Look We noted earlier that one of the benefits of mutual funds for the individual investor is the ability to delegate management of the portfolio to investment professionals. The investor retains control over the broad features of the overall portfolio through the asset allocation decision: Each individual chooses the percentages of the portfolio to invest in bond funds versus equity funds versus money market funds, and so forth, but can leave the specific security selection decisions within each investment class to the managers of each fund. Shareholders hope that these portfolio managers can achieve better investment perfor-mance than they could obtain on their own.
What is the investment record of the mutual fund industry? This seemingly straightfor-ward question is deceptively difficult to answer because we need a standard against which to evaluate performance. For example, we clearly would not want to compare the invest-ment performance of an equity fund to the rate of return available in the money market. The vast differences in the risk of these two markets dictate that year-by-year as well as
bod30700_ch04_092-116.indd 106bod30700_ch04_092-116.indd 106 6/21/10 12:22 PM6/21/10 12:22 PM

Confirming Pages
C H A P T E R 4 Mutual Funds and Other Investment Companies 107
average performance will differ considerably. We would expect to find that equity funds outperform money market funds (on average) as compensation to investors for the extra risk incurred in equity markets. How then can we determine whether mutual fund portfolio managers are performing up to par given the level of risk they incur? In other words, what is the proper benchmark against which investment performance ought to be evaluated?
Measuring portfolio risk properly and using such measures to choose an appropriate benchmark is an extremely difficult task. We devote all of Parts Two and Three of the text to issues surrounding the proper measurement of portfolio risk and the trade-off between risk and return. In this chapter, therefore, we will satisfy ourselves with a first look at the question of fund performance by using only very simple performance benchmarks and ignoring the more subtle issues of risk differences across funds. However, we will return to this topic in Chapter 11, where we take a closer look at mutual fund performance after adjusting for differences in the exposure of portfolios to various sources of risk.
Here we use as a benchmark for the performance of equity fund managers the rate of return on the Wilshire 5000 index. Recall from Chapter 2 that this is a value-weighted index of essentially all actively traded U.S. stocks. The performance of the Wilshire 5000 is a useful benchmark with which to evaluate professional managers because it corresponds to a simple passive investment strategy: Buy all the shares in the index in proportion to their outstanding market value. Moreover, this is a feasible strategy for even small inves-tors, because the Vanguard Group offers an index fund (its Total Stock Market Portfolio) designed to replicate the performance of the Wilshire 5000 index. Using the Wilshire 5000 index as a benchmark, we may pose the problem of evaluating the performance of mutual fund portfolio managers this way: How does the typical performance of actively managed equity mutual funds compare to the performance of a passively managed portfolio that simply replicates the composition of a broad index of the stock market?
Casual comparisons of the performance of the Wilshire 5000 index versus that of professionally managed mutual funds reveal disappointing results for active managers. Figure 4.3 shows that the average return on diversified equity funds was below the return on the Wilshire index in 23 of the 39 years from 1971 to 2009. The average annual return on the index was 11.9%, which was 1% greater than that of the average mutual fund. 5
This result may seem surprising. After all, it would not seem unreasonable to expect that professional money managers should be able to outperform a very simple rule such as “hold an indexed portfolio.” As it turns out, however, there may be good reasons to expect such a result. We explore them in detail in Chapter 11, where we discuss the efficient mar-ket hypothesis.
Of course, one might argue that there are good managers and bad managers, and that good managers can, in fact, consistently outperform the index. To test this notion, we examine whether managers with good performance in one year are likely to repeat that per-formance in a following year. Is superior performance in any particular year due to luck, and therefore random, or due to skill, and therefore consistent from year to year?
To answer this question, we can examine the performance of a large sample of equity mutual fund portfolios, divide the funds into two groups based on total investment return, and ask: “Do funds with investment returns in the top half of the sample in one period con-tinue to perform well in a subsequent period?”
5 Of course, actual funds incur trading costs while indexes do not, so a fair comparison between the returns on actively managed funds versus those on a passive index would first reduce the return on the Wilshire 5000 by an estimate of such costs. Vanguard’s Total Stock Market Index portfolio, which tracks the Wilshire 5000, charges an expense ratio of .19%, and, because it engages in little trading, incurs low trading costs. Therefore, it would be reasonable to reduce the returns on the index by about .30%. This reduction would not erase the difference in average performance.
bod30700_ch04_092-116.indd 107bod30700_ch04_092-116.indd 107 6/21/10 12:22 PM6/21/10 12:22 PM

Confirming Pages
108 P A R T I Introduction
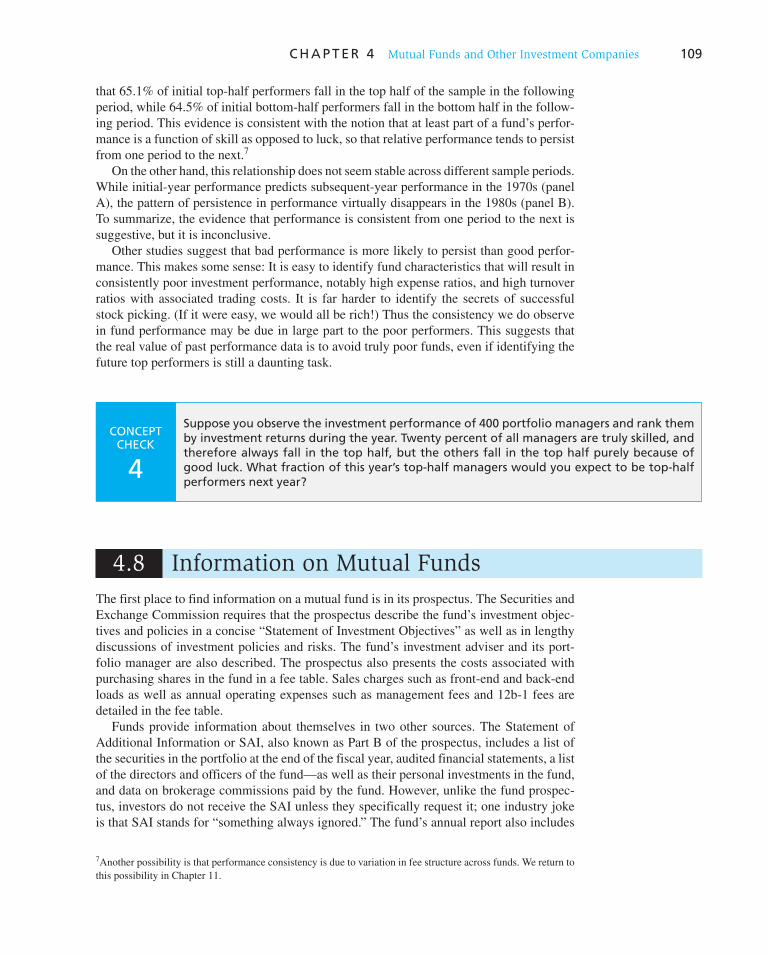
Table 4.4 presents such an analysis from a study by Malkiel. 6 The table shows the frac-tion of “winners” (i.e., top-half performers) in each year that turn out to be winners or los-ers in the following year. If performance were purely random from one period to the next, there would be entries of 50% in each cell of the table, as top- or bottom-half performers would be equally likely to perform in either the top or bottom half of the sample in the following period. On the other hand, if performance were due entirely to skill, with no randomness, we would expect to see entries of 100% on the diagonals and entries of 0% on the off-diagonals: Top-half performers would all remain in the top half while bottom- half performers similarly would all remain in the bottom half. In fact, the table shows
6 Burton G. Malkiel, “Returns from Investing in Equity Mutual Funds 1971–1991,” Journal of Finance 50 (June 1995), pp. 549–72.
Figure 4.3 Diversified equity funds versus Wilshire 5000 index, 1971–2009
−40
−50
−30
−20
−10
0
10
20
30
40
50
1970
1972
1974
1976
1978
1980
1982
1984
1986
1988
1990
1992
1994
1996
1998
2000
2002
2004
2008
2006
Rat
e of
Ret
urn
(%)
Average equity fund Wilshire return
Table 4.4
Consistency of investment results
Successive Period Performance
Initial Period Performance Top Half Bottom Half
A. Malkiel study, 1970sTop half 65.1% 34.9%
Bottom half 35.5 64.5
B. Malkiel study, 1980s
Top half 51.7 48.3
Bottom half 47.5 52.5
Source: Burton G. Malkiel, “Returns from Investing in Equity Mutual Funds 1971–1991,” Journal of Finance 50 (June 1995), pp. 549–72. Reprinted by permission of the publisher, Blackwell Publishing, Inc.
bod30700_ch04_092-116.indd 108bod30700_ch04_092-116.indd 108 6/21/10 12:22 PM6/21/10 12:22 PM
Confirming Pages
C H A P T E R 4 Mutual Funds and Other Investment Companies 109
that 65.1% of initial top-half performers fall in the top half of the sample in the following period, while 64.5% of initial bottom-half performers fall in the bottom half in the follow-ing period. This evidence is consistent with the notion that at least part of a fund’s perfor-mance is a function of skill as opposed to luck, so that relative performance tends to persist from one period to the next. 7
On the other hand, this relationship does not seem stable across different sample periods. While initial-year performance predicts subsequent-year performance in the 1970s (panel A), the pattern of persistence in performance virtually disappears in the 1980s (panel B). To summarize, the evidence that performance is consistent from one period to the next is suggestive, but it is inconclusive.
Other studies suggest that bad performance is more likely to persist than good perfor-mance. This makes some sense: It is easy to identify fund characteristics that will result in consistently poor investment performance, notably high expense ratios, and high turnover ratios with associated trading costs. It is far harder to identify the secrets of successful stock picking. (If it were easy, we would all be rich!) Thus the consistency we do observe in fund performance may be due in large part to the poor performers. This suggests that the real value of past performance data is to avoid truly poor funds, even if identifying the future top performers is still a daunting task.
The first place to find information on a mutual fund is in its prospectus. The Securities and Exchange Commission requires that the prospectus describe the fund’s investment objec-tives and policies in a concise “Statement of Investment Objectives” as well as in lengthy discussions of investment policies and risks. The fund’s investment adviser and its port-folio manager are also described. The prospectus also presents the costs associated with purchasing shares in the fund in a fee table. Sales charges such as front-end and back-end loads as well as annual operating expenses such as management fees and 12b-1 fees are detailed in the fee table.
Funds provide information about themselves in two other sources. The Statement of Additional Information or SAI, also known as Part B of the prospectus, includes a list of the securities in the portfolio at the end of the fiscal year, audited financial statements, a list of the directors and officers of the fund—as well as their personal investments in the fund, and data on brokerage commissions paid by the fund. However, unlike the fund prospec-tus, investors do not receive the SAI unless they specifically request it; one industry joke is that SAI stands for “something always ignored.” The fund’s annual report also includes
7 Another possibility is that performance consistency is due to variation in fee structure across funds. We return to this possibility in Chapter 11.
4.8 Information on Mutual Funds
CONCEPT CHECK
4
Suppose you observe the investment performance of 400 portfolio managers and rank them by investment returns during the year. Twenty percent of all managers are truly skilled, and therefore always fall in the top half, but the others fall in the top half purely because of good luck. What fraction of this year’s top-half managers would you expect to be top-half performers next year?
bod30700_ch04_092-116.indd 109bod30700_ch04_092-116.indd 109 6/21/10 12:22 PM6/21/10 12:22 PM

Confirming Pages
110 P A R T I Introduction
portfolio composition and financial statements, as well as a discussion of the factors that influenced fund performance over the last reporting period.
With more than 8,000 mutual funds to choose from, it can be difficult to find and select the fund that is best suited for a particular need. Several publications now offer “encyclo-pedias” of mutual fund information to help in the search process. Two prominent sources are Wiesenberger’s Investment Companies and Morningstar’s Mutual Fund Sourcebook. Morningstar’s Web site, www.morningstar.com , is another excellent source of informa-tion, as is Yahoo!’s site, finance.yahoo.com/funds . The Investment Company Institute ( www.ici.org ), the national association of mutual funds, closed-end funds, and unit invest-ment trusts, publishes an annual Directory of Mutual Funds that includes information on fees as well as phone numbers to contact funds. To illustrate the range of information avail-able about funds, we consider Morningstar’s report on Fidelity’s Magellan Fund, repro-duced in Figure 4.4 .
Some of Morningstar’s analysis is qualitative. The top box on the left-hand side of the page of the report reproduced in the figure provides a short description of fund strategy, in particular the types of securities in which the fund manager tends to invest. The bottom box on the left (“Morningstar’s Take”) is a more detailed discussion of the fund’s income strategy. The short statement of the fund’s investment policy is in the top right-hand corner: Magellan is a “large growth” fund, meaning that it tends to invest in large firms, with an emphasis on growth over value stocks.
The table on the left in the figure labeled “Performance” reports on the fund’s quarterly returns over the last few years and then over longer periods up to 15 years. Comparisons of returns to relevant indexes, in this case, the S&P 500 and the Russell 1000 indexes, are pro-vided to serve as benchmarks in evaluating the performance of the fund. The values under these columns give the performance of the fund relative to the index. The returns reported for the fund are calculated net of expenses, 12b-1 fees, and any other fees automatically deducted from fund assets, but they do not account for any sales charges such as front-end loads or back-end charges. Next appear the percentile ranks of the fund compared to all other funds with the same investment objective (see column headed by %Rank Cat). A rank of 1 means the fund is a top performer. A rank of 80 would mean that it was beaten by 80% of funds in the comparison group. Finally, growth of $10,000 invested in the fund over various periods ranging from the past 3 months to the past 15 years is given in the last column.
More data on the performance of the fund are provided in the graph near the top of the figure. The line graph compares the growth of $10,000 invested in the fund and the S&P 500 over the last 10 years. Below the graph are boxes for each year that depict the relative performance of the fund for that year. The shaded area on the box shows the quartile in which the fund’s performance falls relative to other funds with the same objective. If the shaded band is at the top of the box, the firm was a top quartile performer in that period, and so on. The table below the bar charts presents historical data on characteristics of the fund such as return data and expense ratios.
The table on the right entitled Portfolio Analysis presents the 20 largest holdings of the portfolio, showing the price–earnings ratio and year-to-date return of each of those securi-ties. Investors can thus get a quick look at the manager’s biggest bets.
Below the portfolio analysis table is a box labeled Current Investment Style. In this box, Morningstar evaluates style along two dimensions: One dimension is the size of the firms held in the portfolio as measured by the market value of outstanding equity; the other dimension is a value/growth measure. Morningstar defines value stocks as those with low ratios of market price per share to various measures of value. It puts stocks on a growth-value continuum based on the ratios of stock price to the firm’s earnings, book value, sales,
bod30700_ch04_092-116.indd 110bod30700_ch04_092-116.indd 110 6/21/10 12:22 PM6/21/10 12:22 PM

Confirming Pages
C H A P T E R 4 Mutual Funds and Other Investment Companies 111
Figure 4.4 Morningstar report
Source: Morningstar Mutual Funds, © 2007 Morningstar, Inc. All rights reserved. Used with permission.
bod30700_ch04_092-116.indd 111bod30700_ch04_092-116.indd 111 6/21/10 12:22 PM6/21/10 12:22 PM

Confirming Pages
Vis
it u
s at
ww
w.m
hh
e.co
m/b
km112 P A R T I Introduction
cash flow, and dividends. Value stocks are those with a low price relative to these measures of value. In contrast, growth stocks have high ratios, suggesting that investors in these firms must believe that the firm will experience rapid growth to justify the prices at which the stocks sell. The shaded box for Magellan shows that the portfolio tends to hold larger firms (top row) and growth stocks (right column). A year-by-year history of Magellan’s investment style is presented in the sequence of such boxes at the top of Figure 4.4 .
The center of the figure, labeled Rating and Risk, is one of the more complicated but interesting facets of Morningstar’s analysis. The column labeled Load-Adj Return rates a fund’s return compared to other funds with the same investment policy. Returns for periods ranging from 1 to 10 years are calculated with all loads and back-end fees applicable to that investment period subtracted from total income. The return is then compared to the average return for the comparison group of funds to obtain the Morningstar Return vs. Category. Similarly, risk measures compared to category are computed and reported in the next column.
The last column presents Morningstar’s risk-adjusted rating, ranging from one to five stars. The rating is based on the fund’s return score minus risk score compared to other funds with similar investment styles. To allow funds to be compared to other funds with similar investment styles, Morningstar assigns each fund into one of 48 separate stock and bond fund categories. Of course, we are accustomed to the disclaimer that “past perfor-mance is not a reliable measure of future results,” and this is true as well of the coveted Morningstar 5-star rating. Consistent with the conventional disclaimer, past results have little predictive power for future performance, as we saw in Table 4.4 .
The tax analysis box shown on the left in Figure 4.4 provides some evidence on the tax efficiency of the fund. The after-tax return, given in the first column, is computed based on the dividends paid to the portfolio as well as realized capital gains, assuming the investor is in the maximum federal tax bracket at the time of the distribution. State and local taxes are ignored. The tax efficiency of the fund is measured by the “Tax-Cost Ratio,” which is an estimate of the impact of taxes on the investor’s after-tax return. Morningstar ranks each fund compared to its category for both tax-adjusted return and tax-cost ratio.
The bottom of the page in Figure 4.4 provides information on the expenses and loads associated with investments in the fund, as well as information on the fund’s investment adviser. Thus, Morningstar provides a considerable amount of the information you would need to decide among several competing funds.
1. Unit investment trusts, closed-end management companies, and open-end management compa-nies are all classified and regulated as investment companies. Unit investment trusts are essen-tially unmanaged in the sense that the portfolio, once established, is fixed. Managed investment companies, in contrast, may change the composition of the portfolio as deemed fit by the port-folio manager. Closed-end funds are traded like other securities; they do not redeem shares for their investors. Open-end funds will redeem shares for net asset value at the request of the investor.
2. Net asset value equals the market value of assets held by a fund minus the liabilities of the fund divided by the shares outstanding.
3. Mutual funds free the individual from many of the administrative burdens of owning individual securities and offer professional management of the portfolio. They also offer advantages that are available only to large-scale investors, such as discounted trading costs. On the other hand,
SUMMARY
bod30700_ch04_092-116.indd 112bod30700_ch04_092-116.indd 112 6/21/10 12:23 PM6/21/10 12:23 PM

Confirming Pages
Vis
it u
s at
ww
w.m
hh
e.co
m/b
km
C H A P T E R 4 Mutual Funds and Other Investment Companies 113
funds are assessed management fees and incur other expenses, which reduce the investor’s rate of return. Funds also eliminate some of the individual’s control over the timing of capital gains realizations.
4. Mutual funds are often categorized by investment policy. Major policy groups include money market funds; equity funds, which are further grouped according to emphasis on income versus growth; fixed-income funds; balanced and income funds; asset allocation funds; index funds; and specialized sector funds.
5. Costs of investing in mutual funds include front-end loads, which are sales charges; back-end loads, which are redemption fees or, more formally, contingent-deferred sales charges; fund oper-ating expenses; and 12b-1 charges, which are recurring fees used to pay for the expenses of mar-keting the fund to the public.
6. Income earned on mutual fund portfolios is not taxed at the level of the fund. Instead, as long as the fund meets certain requirements for pass-through status, the income is treated as being earned by the investors in the fund.
7. The average rate of return of the average equity mutual fund in the last 40 years has been below that of a passive index fund holding a portfolio to replicate a broad-based index like the S&P 500 or Wilshire 5000. Some of the reasons for this disappointing record are the costs incurred by actively managed funds, such as the expense of conducting the research to guide stock-picking activities, and trading costs due to higher portfolio turnover. The record on the consistency of fund performance is mixed. In some sample periods, the better-performing funds continue to perform well in the following periods; in other sample periods they do not.
Related Web sites for this chapter are available at www.mhhe.com/bkm
investment company net asset value (NAV) unit investment trust open-end fund
closed-end fund load hedge fund 12b-1 fees
soft dollars turnover exchange-traded funds
KEY TERMS
1. Would you expect a typical open-end fixed-income mutual fund to have higher or lower operating expenses than a fixed-income unit investment trust? Why?
2. What are some comparative advantages of investing in the following:
a. Unit investment trusts. b. Open-end mutual funds. c. Individual stocks and bonds that you choose for yourself.
3. Open-end equity mutual funds find it necessary to keep a significant percentage of total invest-ments, typically around 5% of the portfolio, in very liquid money market assets. Closed-end funds do not have to maintain such a position in “cash equivalent” securities. What difference between open-end and closed-end funds might account for their differing policies?
4. Balanced funds, life-cycle funds, and asset allocation funds all invest in both the stock and bond markets. What are the differences among these types of funds?
5. Why can closed-end funds sell at prices that differ from net asset value while open-end funds do not?
6. What are the advantages and disadvantages of exchange-traded funds versus mutual funds?
7. An open-end fund has a net asset value of $10.70 per share. It is sold with a front-end load of 6%. What is the offering price?
8. If the offering price of an open-end fund is $12.30 per share and the fund is sold with a front-end load of 5%, what is its net asset value?
PROBLEM SETS
i. Basic
ii. Intermediate
bod30700_ch04_092-116.indd 113bod30700_ch04_092-116.indd 113 7/2/10 3:27 PM7/2/10 3:27 PM

Confirming Pages
Vis
it u
s at
ww
w.m
hh
e.co
m/b
km114 P A R T I Introduction
9. The composition of the Fingroup Fund portfolio is as follows:
Stock Shares Price
A 200,000 $35
B 300,000 40
C 400,000 20
D 600,000 25
The fund has not borrowed any funds, but its accrued management fee with the portfolio manager currently totals $30,000. There are 4 million shares outstanding. What is the net asset value of the fund?
10. Reconsider the Fingroup Fund in the previous problem. If during the year the portfolio manager sells all of the holdings of stock D and replaces it with 200,000 shares of stock E at $50 per share and 200,000 shares of stock F at $25 per share, what is the portfolio turnover rate?
11. The Closed Fund is a closed-end investment company with a portfolio currently worth $200 million. It has liabilities of $3 million and 5 million shares outstanding.
a. What is the NAV of the fund? b. If the fund sells for $36 per share, what is its premium or discount as a percent of net asset
value?
12. Corporate Fund started the year with a net asset value of $12.50. By year-end, its NAV equaled $12.10. The fund paid year-end distributions of income and capital gains of $1.50. What was the (pretax) rate of return to an investor in the fund?
13. A closed-end fund starts the year with a net asset value of $12.00. By year-end, NAV equals $12.10. At the beginning of the year, the fund was selling at a 2% premium to NAV. By the end of the year, the fund is selling at a 7% discount to NAV. The fund paid year-end distributions of income and capital gains of $1.50.
a. What is the rate of return to an investor in the fund during the year? b. What would have been the rate of return to an investor who held the same securities as the
fund manager during the year?
14 a. Impressive Fund had excellent investment performance last year, with portfolio returns that placed it in the top 10% of all funds with the same investment policy. Do you expect it to be a top performer next year? Why or why not?
b. Suppose instead that the fund was among the poorest performers in its comparison group. Would you be more or less likely to believe its relative performance will persist into the fol-lowing year? Why?
15. Consider a mutual fund with $200 million in assets at the start of the year and with 10 million shares outstanding. The fund invests in a portfolio of stocks that provides dividend income at the end of the year of $2 million. The stocks included in the fund’s portfolio increase in price by 8%, but no securities are sold, and there are no capital gains distributions. The fund charges 12b-1 fees of 1%, which are deducted from portfolio assets at year-end. What is net asset value at the start and end of the year? What is the rate of return for an investor in the fund?
16. The New Fund had average daily assets of $2.2 billion last year. The fund sold $400 million worth of stock and purchased $500 million during the year. What was its turnover ratio?
17. If New Fund’s expense ratio (see the previous problem) was 1.1% and the management fee was .7%, what were the total fees paid to the fund’s investment managers during the year? What were other administrative expenses?
18. You purchased 1,000 shares of the New Fund at a price of $20 per share at the beginning of the year. You paid a front-end load of 4%. The securities in which the fund invests increase in value by 12% during the year. The fund’s expense ratio is 1.2%. What is your rate of return on the fund if you sell your shares at the end of the year?
bod30700_ch04_092-116.indd 114bod30700_ch04_092-116.indd 114 6/21/10 12:23 PM6/21/10 12:23 PM

Confirming Pages
Vis
it u
s at
ww
w.m
hh
e.co
m/b
km
C H A P T E R 4 Mutual Funds and Other Investment Companies 115
19. Loaded-Up Fund charges a 12b-1 fee of 1.0% and maintains an expense ratio of .75%. Econ-omy Fund charges a front-end load of 2% but has no 12b-1 fee and an expense ratio of .25%. Assume the rate of return on both funds’ portfolios (before any fees) is 6% per year. How much will an investment in each fund grow to after:
a. 1 year. b. 3 years. c. 10 years.
20. City Street Fund has a portfolio of $450 million and liabilities of $10 million.
a. If 44 million shares are outstanding, what is net asset value? b. If a large investor redeems 1 million shares, what happens to the portfolio value, to shares
outstanding, and to NAV?
21. The Investments Fund sells Class A shares with a front-end load of 6% and Class B shares with 12b-1 fees of .5% annually as well as back-end load fees that start at 5% and fall by 1% for each full year the investor holds the portfolio (until the fifth year). Assume the portfolio rate of return net of operating expenses is 10% annually. If you plan to sell the fund after 4 years, are Class A or Class B shares the better choice for you? What if you plan to sell after 15 years?
22. You are considering an investment in a mutual fund with a 4% load and expense ratio of .5%. You can invest instead in a bank CD paying 6% interest.
a. If you plan to invest for 2 years, what annual rate of return must the fund portfolio earn for you to be better off in the fund than in the CD? Assume annual compounding of returns.
b. How does your answer change if you plan to invest for 6 years? Why does your answer change?
c. Now suppose that instead of a front-end load the fund assesses a 12b-1 fee of .75% per year. What annual rate of return must the fund portfolio earn for you to be better off in the fund than in the CD? Does your answer in this case depend on your time horizon?
23. Suppose that every time a fund manager trades stock, transaction costs such as commissions and bid–asked spreads amount to .4% of the value of the trade. If the portfolio turnover rate is 50%, by how much is the total return of the portfolio reduced by trading costs?
24. You expect a tax-free municipal bond portfolio to provide a rate of return of 4%. Management fees of the fund are .6%. What fraction of portfolio income is given up to fees? If the manage-ment fees for an equity fund also are .6%, but you expect a portfolio return of 12%, what frac-tion of portfolio income is given up to fees? Why might management fees be a bigger factor in your investment decision for bond funds than for stock funds? Can your conclusion help explain why unmanaged unit investment trusts tend to focus on the fixed-income market?
25. Suppose you observe the investment performance of 350 portfolio managers for 5 years and rank them by investment returns during each year. After 5 years, you find that 11 of the funds have investment returns that place the fund in the top half of the sample in each and every year of your sample. Such consistency of performance indicates to you that these must be the funds whose man-agers are in fact skilled, and you invest your money in these funds. Is your c onclusion warranted?
iii. Challenge
Choosing a Mutual Fund Go to finance.yahoo.com . Click on Mutual Funds under the Investing tab. Look for the Mutual Fund Screener. Use the drop-down boxes to select the criteria for mutual funds that are of interest to you. How many funds are shown in your results? If there are no funds or only a few funds that meet your criteria, try loosening your standards. If there are too many funds, try stricter standards. You can click on any column heading in the results list to sort by that criterion.
E-INVEST-MENTS EXERCISES
bod30700_ch04_092-116.indd 115bod30700_ch04_092-116.indd 115 6/21/10 12:23 PM6/21/10 12:23 PM

Confirming Pages
Vis
it u
s at
ww
w.m
hh
e.co
m/b
km116 P A R T I Introduction
SOLUTIONS TO CONCEPT CHECKS
1. NAV 5$3,035.74 2 $83.08
281.695 $10.48
2. The net investment in the Class A shares after the 4% commission is $9,600. If the fund earns a 10% return, the investment will grow after n years to $9,600 � (1.10) n . The Class B shares have no front-end load. However, the net return to the investor after 12b-1 fees will be only 9.5%. In addition, there is a back-end load that reduces the sales proceeds by a percentage equal to (5 – years until sale) until the fifth year, when the back-end load expires.
Class A Shares Class B Shares
Horizon $9,600 � (1.10)n $10,000 � (1.095)n � (1 � percentage exit fee)
1 year $10,560 $10,000 � (1.095) � (1 � .04) � $10,512
4 years $14,055 $10,000 � (1.095)4 � (1 � .01) � $14,233
10 years $24,900 $10,000 � (1.095)10 � $24,782
For a very short horizon such as 1 year, the Class A shares are the better choice. The front-end and back-end loads are equal, but the Class A shares don’t have to pay the 12b-1 fees. For moder-ate horizons such as 4 years, the Class B shares dominate because the front-end load of the Class A shares is more costly than the 12b-1 fees and the now-smaller exit fee. For long horizons of 10 years or more, Class A again dominates. In this case, the one-time front-end load is less expensive than the continuing 12b-1 fees.
3. a. Turnover � $160,000 in trades per $1 million of portfolio value � 16%.
b. Realized capital gains are $10 � 1,000 � $10,000 on FedEx and $2.50 � 4,000 � $10,000 on Cisco. The tax owed on the capital gains is therefore .20 � $20,000 � $4,000.
4. Twenty percent of the managers are skilled, which accounts for .2 � 400 � 80 of those managers who appear in the top half. There are 120 slots left in the top half, and 320 other managers, so the probability of an unskilled manager “lucking into” the top half in any year is 120/320, or .375. Therefore, of the 120 lucky managers in the first year, we would expect .375 � 120 � 45 to repeat as top-half performers next year. Thus, we should expect a total of 80 � 45 � 125, or 62.5%, of the better initial performers to repeat their top-half performance.
bod30700_ch04_092-116.indd 116bod30700_ch04_092-116.indd 116 6/21/10 12:23 PM6/21/10 12:23 PM