mutual funds and institutional investments - world bank€¦ · project. mutual funds and...
TRANSCRIPT

POLICY RESEARCH WORKING PAPER 2099
Mutual Funds and Among three options forconstructing funded social
Institutional Investments security pillars, one system -
individual accounts invested
W hat Is the Most Efficient Way in the institutional market,
with constrained choice
to Set Up Individual Accounts among investment companies
in a Social Security System? - appears to offer reduced
administrative and marketing
Estelle James costs, significant worker
Gary Ferrier choice, and more insulationfrom political interferenceJames Smaihout
Dimitri Vittas than a single centralized fundor individual investments in
the retail market would offer.
The World BankDevelopment Research GroupPoverty and Human Resourcesand
FinanceApril 1999
Pub
lic D
iscl
osur
e A
utho
rized
Pub
lic D
iscl
osur
e A
utho
rized
Pub
lic D
iscl
osur
e A
utho
rized
Pub
lic D
iscl
osur
e A
utho
rized
Pub
lic D
iscl
osur
e A
utho
rized
Pub
lic D
iscl
osur
e A
utho
rized
Pub
lic D
iscl
osur
e A
utho
rized
Pub
lic D
iscl
osur
e A
utho
rized
POLICY RESEARCH WORKING PAPER 2099
Summary findings
One of the main criticisms of the defined-contribution, Based on empirical evidence about U.S. mutual and
individual-account components of social security systems institutional funds, the authors found that the retail
is that they are too expensive. James, Ferrier, SmalihoLt, miarket (option 1) allows individual investors to benefit
and Vittas investigate the cost-effectiveness of three frorn scale economies in asset management - but at the
options for constructing funded social security pillars: cost of the high marketing expenses needed to attract
* Individual accounts invested in the retail market large pools of small investments.
with relatively open choice. By contrast, a centralized fund (option 3) can be much
* Individual accounts invested in the institutional cheaper because it achieves scale economies without high
market with constrailled choice among investment marketing costs. But it gives workers no choice and is
companies. subject to political manipulation and misallocation of
- A centralized fund without individual accounts or capital.
differentiated investments across individuals. The system of constrained choice (option 2) is much
The authors asked several questions: What is the most cheaper than the retail option and only slightly more
cost-effective way to organize a system with mandatory expensive than a single centralized fund. It allows scale
individual accounts? How does the cost of an efficient economies in asset management and record-keeping
individual account system compare with that of a single while incurring lown marketing costs and allowing
centralized fund? And are the cost differentials great significant worker choice. It is also more effectively
enough to outweigh other important considerations? insulated from political interference than a single
The authors concentrate on countries with well- centralized fund.
funlctioning financial markets, such as the United States, The authors estimate that option 2 would cost only
but make comparative references to developing 0.14 percent-0.18 percent of assets annually. Such large
countries. administrative cost savings imply a Pareto improvement
- so long as choice is not constrained "too much."
This paper - a product of Poverty and Human Resources and Finance, Development Research Group - was prepared
for a National Bureau of Economic Research Conference on Social Security held on December 4, 1998. Copies of this paper
are available free from the World Bank, 1818 H Street NW, Washington, DC 20433. Please contact Marianne Leenaerts,
room G2-030, telephone202-458-4264, fax202-676-0961, Internetaddress mleenaertsC&worldbank.org. PolicyResearch
Working Papers are also posted on the Web at http://vwww-.worldbank.org/html/dec/PublicationsfWorkpapers/home.htmil.
The authors may be contacted at [email protected] or dvittas(dwotldbank.org. April 1999. (60 pages)
The Policy Research Working Paper Series dissenminates the findings of wvork in progress to encourage the exchange of ideas aboutdevelopment issnes. An objective of the series is to get the findings out quickly, even if the presentations are iess than fully polished. The
papers carry the nanses of the authors and should be cited accordingly. The findings, interpretations, and conclusions expressed in1 this
paper are entirely those of the authors. They do not necessarily represent the view of the World Banzk, its Executive Directors, or thecountries they represent.
Produced by the Policy Research Dissemination Center

Mutual Funds and Institutional Investments
What is the Most Efficient Way to Set Up Individual Accounts in A Social Security System?
By
Estelle James, World Bank
Gary Ferrier, University of Arkansas
James Smalhout, The Hudson Institute
Dimitri Vittas, World Bank
This paper was prepared for presentation at an NBER Conference on Social Security, Dec. 4,
1998.We wish to thank Deepthi Fernando and Marianne Leenaerts of the World Bank and
Baglan Sultanbek of the University of Arkansas, for their excellent research assistance on this
project.
Mutual Funds and Institutional Investments
What is the Most Efficient Way to Set Up Individual Accounts in A Social Security System?
Prefunding is now seen as a desirable characteristic of old age security systems because it
increases national saving, makes the financial sustainability of the system less sensitive to
demographic shocks, and reduces the need to increase taxes as populations age. With prefunding
comes the need to determine how the funds will be managed. Those who fear political
manipulation of publicly managed funds see defined contribution individual accounts (IA's) as a
way to decentralize control and thereby achieve a better allocation of the funds. But IA's have
been criticized on other grounds, most important among them being high administrative costs.
Costs are especially high at the start of a new system. To illustrate why administrative costs are
important: an annual cost of 1% of assets (roughly equivalent to the up-front fee now charged in
Chile) can reduce a worker's retirement benefits by 20%, a substantial amount. Moreover, costs
are more predictable than returns, and more amenable to policy choice.
This paper investigates the cost-effectiveness of three options for constructing funded
social security pillars: 1) IA's invested in the retail market with relatively open choice, 2) IA's
invested in the institutional market with constrained choice among investment companies, and 3)
a centralized fund without individual accounts or differentiated investmnents across individuals.
Our questions: what is the most cost-effective way to organize a mandatory IA system, how does
the cost of an efficient IA system compare with that of a single centralized fund, and are the cost
differentials great enough to outweigh the other important considerations?'
To answer these questions we use data from mutual funds in the U.S. because: the best
data are available here; the U.S. mutual fund industry is an example of a relatively well run retail
financial industry; and the U.S. is currently considering how to reform its social security system.
Observing that a large institutional investment market co-exists with mutual funds in the U.S.,
and at much lower cost, we also use these data to quantify and identify the sources of economies
from operating in the wholesale money market. Costs in both the retail and wholesale markets
would be higher in developing countries, but their relative positions should be similar to those
described here. This paper concentrates on countries with well functioning financial markets
such as the U.S., although with some comparative references to developing countries. We
I
distinguish among asset management, marketing and record-keeping costs, showing how each
varies with type of system.
Empirical evidence presented in this paper and elsewhere suggests the existence of large
economies of scale and scope in asset management. All three option exploit these economies,
but in different ways. The retail market (option 1) allows individual investors to benefit from
scale economies in asset management, but at the cost of high marketing expenses-almost half
of total costs--that are needed to attract and aggregate small sums of money into large pools. In
contrast, a centralized fund (option 3) can be much cheaper because it achieves scale economies
without high marketing costs, but gives workers no choice and hence is subject to political
manipulation and misallocation of capital.
The system of constrained choice described in this paper (option 2) is much cheaper than
the retail market and only slightly more expensive than a single centralized fund. It obtains scale
economies in asset management and record-keeping while keeping marketing costs low and
allowing significant worker choice that helps to insulate it from political interference. Most of
the cost savings under constrained choice are attributable to efficiency gains, although a smaller
part stems from increased bargaining power that redistributes fixed costs away from the
mandatory system.
Part I puts this paper into international perspective, by summarizing the choices between
the three alternatives that have been made in different countries and by examining costs in the
mandatory AFP system in Chile, which uses the most common method, the retail market (option
1).
Part II draws on data from voluntary saving in mutual funds in the U.S. Both in Chile
and the U.S., individuals have diversified accounts that they can move from one company to
another in a competitive retail investment market. The American mutual fund industry is vastly
more developed and competitive than the Chilean AFP industry. Nevertheless, we find strong
similarities between Chilean AFP's and American mutual funds, in terms of annualized costs as
a percentage of assets and the composition of these costs. Average annualized costs range
between 1% and 1.5% of assets for most investors, and marketing is the largest cost component
in both cases. In Chile annual costs are less than 1% for those who start contributing early in
their careers. In the U.S. a low-cost niche of less than 1% has developed for passively managed
funds indexed to various benchmarks. In both cases costs were higher 15 years ago and have
2

declined as a result of asset growth and competition. These two cases are predictive of how an
IA system is likely to develop in the retail market.
Part III explores the cost of asset management in the institutional market, drawing on
U.S. data once again. Institutional investment costs-consisting of money management, internal
administration and brokerage fees for pension funds and other large organizations--are estimated
to be 4-8 basis points (.04-.08% of assets) for passively managed portfolios, and 35-65 basis
points (.35-.65% of assets) for actively managed domestic portfolios, depending on type of
asset-much less than the mutual fund retail market. These large cost savings are due to
economies of scale in the investment function, much smaller costs in the marketing functions, the
virtual absence of record-keeping costs, and the greater bargaining power of large investors in an
industry where average costs greatly exceed marginal cost. These would also be the costs in a
well-run centralized funded pillar with no IA's and no choice (option 3).
Part IV considers whether and how an IA system with constrained choice (option 2)
could be set up to benefit from these same economies regarding asset management. We outline
the elements of such a system-which include worker choice among a limited number of money
managers chosen through a competitive bidding process or through a fee structure that
discourages marketing expenditures, especially sales commissions. We estimate that such a
system could operate with approximately the same asset management costs as the centrralized
fund, but with slightly higher advertising expenditures.
However, additional record-keeping and communications costs will necessarily be
incurred if workers have individual accounts with differing asset managers. Part V therefore
investigates the cost of these record-keeping expenses, using data from the transfer agent
function of mutual funds and the experience of the federal employees Thrift Saving Plan. We
find that costs per account depend on level of service provided, especially the level of
personalized communications. As part of their competitive marketing strategy, most mutual
funds have provided a high service level, in which users of multiple transactions and expensive
communications are not penalized and, in fact, are subsidized by non-users. A more modest
level of service and efficient charging method, with incremental personalized service available at
a fee, would cost less than $20 per account.
Thus, the long run steady state cost in a constrained IA system in countries with well
developed financial markets is likely to be .14-.18% of assets annually for a passively managed
3
investment strategy, including all money management, brokerage and record-keeping fees (and
.49-.79% if active management options are chosen). This is only slightly higher than the cost of
a centralized scheme (.04-.65%). It is much less than the expected return to saving or the cost of
voluntary or mandatory individual accounts in retail markets (.32%-1.5%). Constrained choice
offers large administrative cost savings combined with political insulation, that imply a Pareto
improvement so long as choice is not constrained "too much."
I. How High Are Administrative Fees in Chile and How Are They Spent?
Countries with mandatory defined contribution (DC) systems have made differentiated
policy selections among the three structural alternatives listed above, but most of these are too
new to enable us to estimate their long run costs. Interestingly, they all constrain investment
choice in some way, albeit with different objectives. Chile and most other Latin American
countries use alternative 1, the retail market, to manage the funds in their mandatory DC pillars.
Pension companies (AFP's) can freely enter the market, subject to licensing requirements, and
workers are free to sign up as individuals with the company of their choice. The AFP's must
abide by detailed regulations controlling their investment portfolios, designed to avoid disastrous
investment outcomes, rather than to minimize costs. Marketing costs are high and economies of
scale not fully exploited, but mergers are slowly solving that problem.
Sweden, which has just adopted a multi-pillar system, uses alternative 2: All mutual
funds in the country are free to participate providing they negotiate a fee agreement with the
public agency that administers the system and maintains all records. Workers can select the
funds of their choice, but contributions are aggregated and moved by the agency in large blocks,
similar to omnibus accounts. Funds will not have information identifying their members-a
feature designed to discourage sales commissions (although not mass advertising). The goal is to
utilize economies of scale and scope and bulk bargaining power to reduce costs, while still
allowing considerable choice. Since the system has not yet been implemented, we do not know
how well it will succeed.
Bolivia recently used a much more wholesale approach: it auctioned off the money
management rights in its DC pillar to two investment companies, in an international bidding
process that took both past performance and future fees into account. Choice is very constrained
4

(although expected to increase in the future), and costs are lower than in Chile (although
marketing costs are incurred in a deliberate effort to increase coverage).
Singapore and Malaysia did not even offer this much choice until recently. They
required workers to put their DC contributions into publicly-managed central provident funds
which invest the money. The government unilaterally sets the rate of return it will pay on
workers' accounts (alternative 3). Administrative costs are small and marketing costs absent, but
returns to workers' accounts and therefore eventual pensions are also low. Partly for this reason,
Singapore recently allowed workers to opt out of the central fund and invest their balances above
a specified level in privately managed accounts. About 25 international asset managers were
authorized to handle these accounts. Collections and over-all administration remain centralized.
To summarize: a continuum in funded DC pillars currently exists, ranging from high choice in
the retail market (e.g. Chile) to more constrained choice through the institutional market (e.g.
Sweden, Bolivia) to practically no choice at all (Singapore and Malaysia until recently).2
In this section we examine the annualized administrative costs of Chilean AFP's, which
have been operating since 1981. These costs have been subject to great criticism by opponents
of IA systems. In Chile the worker pays a fee to the AFP, which is an administrator that sets up
the fund and runs it. All assets in the fund are owned by its worker-participants. All expenses
are paid by the AFP, not the worker or the fund directly. So fees do not necessarily represent
real costs of operating the flmd, especially in the short run. AFP's made losses in the early years
of the new system when they incurred start-up costs that exceeded their revenues. The industry
as a whole is quite profitable at this stage, due to price insensitivity among investors and entry
barriers in the form of high marketing costs needed to attract customers. System maturation,
evolving regulations and mergers seem to be changing the structure of competition, making the
average AFP larger and the industry more oligopolistic.3 These developments may alter costs
and their relationship to fees in the future. The current fees, however, are costs to investors that
reduce their net returns, so we examine them in this section.
Chile adopted an unusual method of charging fees: the fee is imposed when the
contribution first enters the system, and no management fees are charged on that contribution
thereafter. The fee started at over 20% of contributions but has fallen to an average level of
15%. (In other Latin American countries, such as Argentina, where the contribution rate is
smaller but expenses very similar, fees are still 20% of contributions or even higher). That entry
5
fee covers a lifetime of investment management by the initial AFP or any AFP to which the
funds are moved later on. This extremely front-loaded method was adopted as a way to cover
start-up costs at a point when the system had no prior assets, only new contributions. In effect,
workers "lent" some of the start-up costs to the AFP's in return for free lifetime money
management for the rest of the accumulation phase.
However, it is necessary to convert these front-loaded fees into their annual equivalents
(that will yield the same final year accumulation), in order to calculate their impact on net returns
over workers' lifetimes and to make them comparable to mutual fund or pension fees in the U.S.
or elsewhere. This requires a simulation of how long the worker will keep his or her money in
the system, which in turn depends on the age and career pattern of the worker.
We have simulated the average annual fee on assets that is equivalent to the front-loaded
15% fee on contributions, for workers of different ages at the point when the contribution was
made (Table 1). For a 25 year old worker (whose money will stay in the system for another 40
years), the 15% one-time fee is equivalent to .43% of assets annually; for a 45 year old worker it
is .87%, and for a worker who contributes monthly in his final year it is 32.1% (column 1). For a
worker who contributes every year for 40 years (e.g. age 25-65), paying a fee on each new
contribution, the annual equivalent of all these front-loaded fees is .73% (colurn 3). These
calculations assume a 5% gross rate of return. We have done the same calculation with 3% and
4% rates of return and the results are very similar.
Many workers will contribute for 20 years only, because this is the period that makes
them eligible for the minimum pension guarantee. For these workers, the equivalent annual fee
depends on whether the contributions were made early or late in their careers, which determines
how many years their money will be under management. If a worker contributes only for his
first 20 years of employment the equivalent average annual fee for all his contributions is .55%,
while if contributions are made only in the last 20 years, the equivalent average annual fee is
1.59% (column 2).
The average annual equivalent is therefore much lower for young than for older workers.
Workers with different employment histories will end up paying different costs as a subtraction
from their gross returns-probably not desirable features of mandatory systems. Front-loading of
fees may induce evasion among workers in their later years. The possible reluctance of AFP's to
6
accept transfers of funds from older workers, who will make only small contributions relative to
their assets, also represents a drawback.
We cannot calculate a true average over all workers without knowing the distribution of
contribution histories that will evolve over the next half century. But 20 years of contributions
are a likely focal point since that entitles workers to the minimum pension guarantee. Suppose
that one third of all workers contribute for 40 years, and one third each for their first and last
twenty years. The system-wide annual equivalent expense ratio would be .96%.4
These estimated lifetime fees are very similar to average mutual fund fees in the U.S.
(Part II). American mutual funds, of course, provide much greater diversification and service
than Chilean AFP's, which would make their costs higher. But they also benefit from much
greater economies of scale, which would make their costs lower. AFP costs are much lower than
costs of U.S. mutual funds that operate in emerging markets. They are much lower than mutual
fund fees for voluntary saving in Chile, which average around 6% per year for equity funds and
2% for bond funds. These mutual funds also have minimum balance requirements that make
them inaccessible to the average Chilean worker. AFP fees are also lower than those of mutual
funds in Europe, where the combination of front loads and annual fees exceeds levels in the U.S.
Chilean AFP's are therefore relatively inexpensive if the standard of comparison is fees in other
financial institutions that invest individuals' savings in competitive retail markets.
The breakdown of costs among AFP's shows that over 45% of total expenditures were
used for marketing costs, especially sales commissions (Table 2). This number (which omits
staff salaries involved in marketing), is similar to marketing expenses in the retail financial
markets in the U.S. and other countries. These similarities suggest that a study of U.S. mutual
fund data will yield insights into how costs might evolve in individual account systems and how
these costs might be reduced.
II. Costs in the Retail Market of American Mutual Funds
The mutual fund in the U.S. has been a hugely successful financial institution. Assets
have grown from less than one billion dollars in 1949 to almost $140 billion in 1980 to over $4
trillion by the end of 1997 and now exceed the combined total of savings bank deposits and life
insurance assets. The variety of fund objectives and ancillary services has also escalated, with
7

equity funds expanding much faster than bond or money market funds over the last 20 years.
Savers apparently feel that investing through mutual funds gives them advantages in terms of
convenience, liquidity and diversification which justify the fees.
Our object was to analyze the determinants of these fees and how they are spent, in order
to shed light on how costs might evolve or might be shaped in a reformed social security system
that includes individual accounts. Fees are not exactly equivalent to real social costs because
funds may run short and medium term profits or losses and for several other reasons listed
below. Nevertheless, fees indicate private costs that reduce net returns to shareholders and in the
long run they should approximate real costs. In this paper, for simplicity, the two terms are used
interchangeably, while recognizing all the reasons why this is not precisely the case.
We used regression analysis and frontier analysis based on a large data set of mutual
funds (4254 funds in 1997 and 1300-2000 each year for 1992-96) that we obtained from
Morningstar. We also culled information from annual reports, fund prospectuses, and financial
statements filed by their investment advisers, as well as surveys conducted by the association of
mutual funds and discussions with fund officials and their transfer agents. Money market funds,
which comprise about a quarter of the fund universe, were largely excluded from this study,
because they involve short term deposits, high transactions levels and related costs that would
not be applicable to IA's in social security systems. Mutual funds with missing data for
important variables were also excluded. We included only "open-end funds" whose shares are
bought and sold at net asset value-total assets divided by total shares. Table 3 summarizes the
resulting fund universe for two representative years, 1992 and 1997.
In the U.S., like Chile, mutual funds are organized by sponsors, but they are not owned
by these sponsors. Instead, the assets are owned by the shareholders who invest in them. A
board of directors (most of whom are affiliated with the sponsor) chooses the investment adviser
who, in almost all cases, is the original sponsor of the fund. Often the same sponsor starts
multiple funds in a fund complex such as Fidelity or Vanguard. The adviser makes key strategic
decisions, hires analysts and portfolio managers (who handle day-to-day investment activities)
and provides other administrative service to the fund. The fund itself has few employees and
functions. Competition takes the form of investors exiting and entering funds rather than funds
choosing and re-evaluating investment advisers (see Baumol et al, 1989). Marketing, service and
8

product differentiation have been major instruments in the competition among funds for
investors.
Unlike the situation in Chile, most fees are paid by the fund (not directly by the
shareholders)--to the investment adviser, to distributors of the fund (in the case of the so-called
12bl fees) and, in much smaller amounts, to lawyers, auditors, transfer agents and others (Table
4). These fees, as a proportion of assets, determine the fund's reported "expense ratio" that it
subtracts from its gross return to obtain the net return passed on to shareholders. Front-loaded
and back-loaded sales commissions that go directly from investors to brokers or other
distributors are not included in this expense ratio but nevertheless represent a cost to relevant
shareholders. Brokerage fees paid for securities transactions are also excluded from the expense
ratio and are simply netted out of the fund's reported gross returns.
We have constructed a "total fund expense profile" which equals the reported expense
ratio plus average brokerage costs plus annualized front loaded sales commissions (Table 4).5 In
1997 the total fund expense profile was 1.85% of assets, compared to the reported expense ratio
of 1.28%. Weighted by assets, these numbers fall to 1.43% and .91%, respectively. Asset-
weighted numbers are more relevant for our purposes because they indicate the expense incurred
by the average dollar invested. The lower asset-weighted figures are consistent with economies
of scale and/or a selection of clients into low cost funds. The variation in costs is also great. For
example, the average dollar invested in passively managed funds incurs an expense profile that is
only one-fifth the expense of a dollar invested in actively managed funds.
More than half of the reported expense ratio (one-third of the total expense profile) is
paid to the investment adviser, who then allocates the money among the factors of production.
To understand the production function of the mutual fund it would be helpful to know how this
money is spent-how much on investment research, advertising, development of new products
and technologies, etc. This information is difficult to obtain since most fund sponsors are private
companies which are not required to disclose their records.
Other problems related to measuring and understanding mutual fund costs are:
1. Disclosure of brokerage costs (for securities transactions) was not required until 1996
and they are reported for only a subset of our funds for 1996 and 1997.
9

2. Some brokerage fees cover research or other expenses of the fund or its adviser (i.e.
the "soft dollar" issue), thereby reducing the reported cost that goes into the expense
ratio and understating real expenditures on these items.
3. Some investment returns are reported net of cost, without data for the cost of
producing them.
4. Income from securities lending operations is sometimes used to offset custodial and
other expenses, which are therefore underestimated by reported fees.
5. Some funds do not report number of shareholders and the growing use of omnibus
accounts that consolidate many shareholders further complicates the use of this
explanatory variable.
6. Investment advisers temporarily waive some fees, especially fees of new funds, as a
business strategy to attract new customers, but may later reinstate them; these
temporary fees may not reflect real costs.
7. The data set includes only funds that were still operating in 1997 and it therefore
suffers from survivorship bias. Many expensive or poorly performing older funds
have terminated, which may lead to an understatement of costs or an overstatement of
expected returns.
8. Many shareholders pay a front loaded one-time sales charges directly to brokers or
other sales agents. These charges are not reported as fund expenses. To include them
we had to annualize them based on estimated holding periods on which we lack good
data, so caution is needed to interpret these estimates of marketing expenses.
9. The invisible diseconomy of scale-the impact of a fund's buying and selling
activities on security price-is not measured here. This may lead to an overstatement
of scale economies, especially in thin markets where the fund owns a large part of
total capitalization.
10. Most funds are members of a mutual fund complex (e.g. Fidelity and Vanguard).
Certain activities, such as advertising and new product development, are jointly
supplied to all members of the complex by the common investment adviser. The
allocation of these expenses among the funds may be influenced by estimates of
where the expenses can be absorbed with least loss of clients (see point #6 above).
Thus, the relative fees paid by members of a fund complex do not necessarily reflect
10
the real cost of producing them. Moreover, business strategy concerning joint cost
allocation may be different in a mandatory system.
However, except for the last point, we do not believe that these problems affect our major
results.
Specification of regressions. The main dependent variable in our regressions is the
"expense ratio"-reported expenses (excluding brokerage fees and loads) as a percentage of
assets. We did not use the "total fund expense profile" as our dependent variable because
reliable data were not available for holding periods by fund or on brokerage costs for most funds
in the data set. Brokerage fees for securities trades were also examined in a separate regression
using the smaller subset of funds for which they are available. Front-loaded sales commissions
are not part of the expense ratio but they appear as an independent variable and are discussed as a
marketing cost.
We sought to determine the extent to which cost variation is random or systematic and to
identify the determining factors for systematic variation. Our strategy was to view asset
investment and shareholder servicing as the main outputs, hence magnitude of assets and number
of shareholders as the core determinants of costs, controlling for a large number of other
variables. This was also the strategy followed by Baumol et al (1989), but we include many
additional control variables designed to throw light on how an IA system might operate and
might be shaped by business strategy and public policy. Our independent variables fall into three
main groups-a core group capturing economies of scale and scope as well as the relationship
between costs, returns and risk; an asset allocation group acknowledging that different real costs
are implied by different portfolios; and a business and marketing strategy group reflecting
decisions made by the fund's adviser (Table 5).
Core group:
Assets (in billion dollars)
Asset2
Assets in entire fund complex
Number of accounts (in thousands) or, alternatively, average assets per account
3-year gross return or, alternatively, 3-year load-adjusted net return
3-year standard deviation of returns
Asset allocation group
11

Dummy variables for funds that specialize in bonds, small cap stocks, special sector
stocks, international (industrialized country) funds, emerging market funds, with large
cap stock funds as the omitted category.
Business and marketing strategy group
Minimum investment required
Stock turnover rate
Fund age
Dummy variables for funds that sell only to institutional (very large) clients, index funds,
bank-advised funds, funds with low (.25% or less) and high (between .25% and 1%) 12bl
fees, funds with front loads and deferred loads.
We ran the OLS regressions for 1997. We also conducted a frontier (envelope) analysis
for 1992-97, which included a time trend as an additional variable. Tables 6 and 7 report results
from several OLS and MLE specifications, which yield a consistent picture of the determinants
of mutual fund costs. The OLS regressions explain 64% of the variance when all the above
variables are included. The "business and marketing strategy" group accounts for more than half
of the predictive power. Most of the variance in costs is therefore systematic rather than random.
Costs faced by investors vary in large part because of business choices made by fund managers
and these same costs could be substantially influenced by policy choices in a mandatory IA
system.
Economies of scale and scope. As expected, we found considerable evidence of
economies of scale and scope. These show up in two ways in our regressions. First, expense
ratios fall when total assets in fund and assets in the entire fund complex increase. For funds with
assets of less than $10 million the simple average expense ratio is 1.54%, while for funds with
assets of more than $1 billion it is .96%. Second, expense ratios fall when assets per shareholder
and minimum size of investment increase. We discuss each of these in turn, since they have
different explanations and implications for the operation of IA systems.
The basic reason for the first effect is that all funds need industry analysts, portfolio
managers, computers and access to electronic trading facilities. Large funds, however, can be
managed with virtually the same staff and trading access as smaller funds. Much of the scale
economies may come from marketing costs rather than from investment management: large
funds spread their advertising expenses (and less importantly, their legal, accounting and audit
12

expenses) over a larger asset base. Partly for these reasons, the largest and fastest growing
mutual funds also experienced the greatest drop in operating expenses over the last 20 years (Rea
and Reid 1998. For more on sources of scale economies see Baumol et al 1990, Sirri and Tufano
1993).
On the one hand, scale economies may be somewhat underestimated in these regressions
because fund complexes may subsidize their new smaller funds, charging them less than full
costs while they are "infants", and earning a higher profit margin on their large well established
funds where clients may be less responsive to small differences in fees. On the other hand, scale
economies may be overstated for certain types of assets such as small cap and emerging market
stocks. These regressions did not analyze the interaction between asset class and scale. Reverse
causation may also be at work: low-cost funds may have attracted large amounts of assets rather
than vice versa. We were not able to distinguish between these two effects in this paper.
These economies from asset aggregation do not continue indefinitely. The positive sign
on the coefficient of Asset' in the regressions brings to a halt the fall in expense ratio when fund
size reaches the $20-$40 billion range. Other studies have found that scale economies stemming
from the size of entire fund complex may stop at $20-40 billion in the U.S. and at 2.9 billion
francs, a much lower level, in France (Collins and Mack 1997; Dermine and Roller 1992) Price
impact, not measured here, also places brakes on scale economies, especially in illiquid markets.
The fact that many small funds co-exist with larger ones is further evidence of the limits to scale
economies and also of the gradualness of the market process in adjusting to these economies.
Most mutual funds are not yet operating at the least-cost scale, suggesting that mergers may take
place in the future, in the U.S. as in Chile.
On the second effect: the expense ratio falls if minimum investment or average assets per
shareholder grow. Along similar lines, holding aggregate assets constant, the expense ratio
increases with number of shareholders, but this effect disappears once strategy variables such as
minimum investment are controlled. The basic reason here is that funds incur a fixed cost per
account for record-keeping and shareholder service (the transfer agent function), so the larger
each account the smaller this cost will be, as a percentage of assets.
Two important implications for IA systems grow out of these sources of scale economies.
First, aggregation brings economies. The limit to these economies nevertheless leaves space for
numerous mutual funds, in the U.S. and in many other countries. IA accounts could be one part
13
of this huge financial system, employing the same investment managers and enjoying the
resulting economies of scale and scope. But even if IA funds and their managers were
completely segregated and even with a small contribution rate of 2%, a mandatory IA system in
the U.S. would generate over $60 billion of new contributions annually. Such flows are large
enough to offer options among many fund managers at a cost-effective scale.
Second, the fixed record-keeping and communications cost per account poses a potential
problem for IA systems if the accounts are small. Currently, most mutual funds have a minimum
investment of $1000 or more and the average account size exceeds $25,000. This produces a
weighted average transfer agent expense ratio of .12%. This expense ratio would be much
higher than .12% and in fact would exceed 1%, simply for the fixed cost per account of record-
keeping and communication, if mutual funds were used to serve numerous small IA accounts
(see Section V for more details). This suggests that some other method must be found to deal
with the transfer agent function if the object is to keep costs low, particularly in the early years of
an IA system.
Marketing costs. Maximizing assets under their control is, in most cases, a key
objective of investment advisers, since their income depends on it. Aggressive marketing
strategies have been developed with this object in mind. Using brokers, other sales persons and
mass advertising methods (media adds, direct mailings), the industry has successfully called to
the attention of potential shareholders the advantages of equity investing, using mutual funds as
the vehicle. This probably accounts for a large part of the industry's dramatic growth in assets.
Other studies have shown that the funds which have gained the most are those that combine
vigorous marketing with good performance (Sirri and Tufano 1997). The possibility of
spreading favorable information by marketing probably acts as a spur to good performance and
product innovation. At the same time, marketing itself leads to substantially higher costs, that
are unevenly distributed among investors.
The major marketing expense to shareholders consists of sales commissions. Over two
thirds of all funds are sold through third parties (brokers, insurance agents, financial planners)
who receive some kind of commissions (through front or deferred loads or annual 12bl fees).
However, the proportion of assets managed through direct marketing is larger than the proportion
of funds and has been increasing through time. (Tables 3 and 8).
14

How much do marketing fees add to total expenses? It is possible that sales commissions
may substitute for other costs, such as advertising or transfer agent fees (see discussion of
transfer agents in Part V)? Our regressions, however, show little trade-off. Most of the 1 2bl fee
is passed on to consumers as an additional cost. A low 12bl fee (usually .25%), which is
included in the expense ratio, raises the expense ratio .2%, a high 12b 1 fee (usually 1%) raises it
.4% and the latter is usually found together with a deferred load which raises it another .5%,
implying that most of the 12bl fee is an added cost. A front load (a one-time fee of 4-5% , not
part of the expense ratio) increased the expense ratio in some regressions but not others. The
coefficients on front and back loads may be due to the multicollinearity between loads and other
cost-raising variables such as 12bl fees, high turnover and expensive active management, rather
than to their direct effects. (See discussion of institutional funds and index funds below. For
corroboration of the cost-raising effects of 12bl fees see Ferris and Chance 1987, Trzcinka and
Zweig 1990)
The "total annual marketing cost" paid by the shareholder may be defined as the 12bl
fee + annualized front load, and the "total fund expense profile" as the expense ratio + brokerage
costs + annualized front load. (Back loads are omitted because, given holding periods under
self-selection, they are negligible for most investors). Then, marketing costs are 35% of all fund
expenses on a simple average basis or 43%% on an asset-weighted basis, most of these costs are
for sales commissions, and the total expenses of funds charging these fees increase
commensurably as a result (see endnote 5 and Table 8). For funds with front-loads, our
estimated total expense profile is almost 1 percentage point higher than for funds that pay no
sales commission. Marketing costs played an even more important role in the early years of the
mutual fund industry, before no-loads developed. The marketing share of total expenses in the
U.S. mutual fund industry is very similar to that of AFP's in Chile.
The 35%-43% average undoubtedly understates true marketing costs. It does not include
the salaries of staff who manage the marketing efforts or advertising costs that are paid for out
of the adviser's fee. To fill in this gap, we examined the annual reports of five investment
adviser companies that are publicly traded (hence required to disclose additional information).
Advertising expenses in 1997 were 14% of total adviser expenses for one such company that
deals in no-loads. Marketing costs (including sales commissions and advertising) averaged 50%
of total costs among the four public investment management companies that deal through
15

brokers and other intermediaries.6 An average investor with 5 mutual fund accounts of $20,000
each pays $1000 per year for the information he gets from marketing, if total costs of these
funds, including loads, are 2% of assets and marketing costs are 50% of the total.
Investors have the option, of course, of purchasing no-loads. This implies that, rightly or
wrongly, they believe they receive value from the third party intermediaries with whom they
deal. (For corroboration see Kihn 1996, Capon et al 1996). From a social point of view,
marketing probably provides a mixture of useful information, misleading information, an
impetus to good performance and zero-sum game raiding. The mix of these elements is
important. Most methods to keep IA costs low involve a reduction in marketing expenses, under
the assumption that it is not the most efficient way to provide useful information to new
investors. This is discussed further in Part IV.
Institutional funds. A small number of mutual funds or special classes within a large
mutual fund are limited to institutional investors (i.e. bank trust departments, corporations, small
foundations, etc.). Usually the minimum investment for these funds is $100,000 or higher. The
dummy variable for these funds has a significantly negative coefficient (-.15%) as compared
with funds for individual investors-due to their lower record-keeping and advertising costs.
Expense ratios for institutional funds are even lower, when their lower sales commissions (which
are controlled in these regressions), are taken into account. The same assets can be amassed with
much lower distribution and record-keeping expenses from large institutions than from small
individuals. Institutions are much less likely to pay 12bl (or front loaded fees) to brokers
because they have more efficient ways of getting information. On the rare occasions when they
pay these fees, they obtain lower rates. As a result, the institutional coefficient jumps to -.53%
when sales commissions are left out of the regressions. The total expense profile of institutional
funds, including loads and brokerage fees, controlling only for asset allocation, is less than half
those of retail funds. (Table 9, Panel C).
Passive v. active management. Also important is the significant negative sign (-.39 to -
.52%) on passively managed funds, also known as index funds, which do not have to pay the
high fees that popular active managers command. Passively managed funds mimic or replicate a
stated benchmark, such as the S&P 500 or the Russell 2000. The manager does not engage in
discretionary stock selection or market timning and therefore cannot claim a fee for superior
information or judgement. Index funds generally benefit from low turnover, which reduces the
16

expense ratio as well as brokerage fees. They are less likely to engage in heavy marketing; the
coefficient becomes -.52 when sales commissions are omitted from the regressions. Controlling
only for asset allocation, fees of passive funds are less than one-third those of actively managed
funds in the retail market (Table 9, panels B and C). In effect, passive investors free ride on the
infornation provided by the actions of active investors. Passive investment strategies would
have the additional advantage in a mandatory system of reducing the variance in returns among
participants.
The large negative sign on index funds should be interpreted with some caution,
however. It could mean that fund complexes view these funds as the products that are designed
to capture price-sensitive consumers, and for this reason they may allocate their joint expenses
(advertising, new product development) to the other members of their complex. (For example,
Fidelity is currently waiving part of its normal management fee on its S&P 500 index funds, in
order to make them more competitive.) Further along these lines, record-keeping and other
charges tend to be less for passively than for actively managed funds; this may be a business
strategy decision rather than a reflection of real cost differentials. The real cost savings to the
economy from index funds may therefore be overstated by our coefficient, although they remain
real cost savings to individual investors.
Asset allocation: international funds. Asset allocation has a major impact on costs.
The dummy variables for asset classes have large significant effects--although the total R2 does
not change much in comparison with the core group. Bond funds have lower costs and small cap
or specialty funds have higher costs.
Expenses are highest in international funds, especially emerging market funds-as a
result of the greater difficulty in obtaining information in these countries, their less developed
markets which result in high bid-ask spreads, high transactions and custodial costs, currency
hedging costs and the absence of passive investment opportunities in contexts where the relevant
companies and their prices fluctuate widely. These factors would also apply to local funds
operating in emerging markets, although institutions based in a country needn't hedge against
currency risk and may have an informational advantage over those that are based in a foreign
country. Chilean AFP costs appear surprisingly low in this context.
Descriptive statistics concerning the average expense ratios for funds in different asset
classes are presented in Tables 3 and 9. We see there that asset allocation matters, but regardless
17
of assets chosen, passive investment cuts costs drastically, as does investing through the
institutional market.
Brokerage fees. Brokerage fees paid for securities transactions average .26% of assets
for the subset of funds in our sample that included these data. Weighted by assets, average
annual brokerage fees fall to .12%. Recall that these fees are not included in the expense ratio
but they are deducted from gross returns. Separate regressions on this subset show that
brokerage fees exhibit economies of scale with respect to assets, especially assets in fund
complexes, as large fund families use internal trading and spread the fixed costs of electronic
trading over a larger base. Brokerage costs are higher for international funds, especially in
emerging markets, and they are, of course, strongly dependent on securities turnover rates (Table
10).
The typical brokerage fees paid by mutual funds apparently exceed "best execution fees"
charged by deep discount brokers or commissions paid by large institutional investors by a factor
of 3 or 4 (Livingston and O'Neal 1996; and Table 12). One possible reason is that brokerage
fees are not included in the expense ratio, which is the most widely reported expense figure.
They were not even disclosed until 1996. Reported expenses could be reduced by covering some
research and marketing services out of transactions fees paid to brokers-the controversial "soft
dollar" issue. It will be interesting to see if disclosure and, in fact, a glaring spotlight, will
change fund behavior in this respect.
Net returns, gross returns and risk. Of course, the investor ultimately cares about net
returns, not the expense incurred in earning them. If higher costs led to higher returns, they
would be worth incurring. However, this does not seem to be the case. In fact, some of the same
factors that increase costs actually reduce returns (Table 11).
Most important, larger assets under management increase both gross and net returns,
while decreasing costs. Funds with front loaded fees don't earn higher gross returns, so their
load-adjusted net returns are lower than for no-loads. Index funds earn significantly more than
actively managed funds, both net and gross, but other evidence indicates that this effect varies by
asset class. The advantage of index funds is greatest for large cap funds operating in very liquid
markets and is much less for small caps and international funds, especially emerging markets,
where markets are less efficient and private information plays a more important role (Muralidhar
18
and Weary 1998). Institutional funds have marginally higher net returns and funds with high
turnover have marginally lower net returns.
These results from separate equations are consistent with the negative sign on gross and
net returns as a control variable in our expense ratio equations. Cost and returns, especially net
returns, appear to be negatively correlated. Thus, strategies involving high administrative costs
do not seem to be justified on grounds that they raise returns. (For further evidence on the zero
or negative relationship between costs and returns see Cahart 1997, Elton et al 1993, Malkiel
1995, Malhotra and McLeod 1997, Washington Post, Sept. 13, 1998, B11).
Changes over time. The question of whether expense ratios have been going up or down
over time has been hotly debated (see Lipper 1994). This is an important question because it
tells us whether policy makers can rely on market forces to reduce costs. For the period in this
study, time has a small significant positive effect on the expense ratio (1-2 basis points per year),
after controlling for all our other variables. Total expenses (expense ratio times assets) have
gone up much more as a result of asset growth. But funds that have operated for the entire
period have lower expense ratios than others (the negative coefficient on Fund age). This may
be partly due to "learning by doing" and partly due to a selection process: they have survived
because they are low cost funds.
These estimates do not take into account changes in marketing costs and consumer
responses to them. Between 1992 and 1997 a shift of investors toward no-loads and a decrease
in the size of front loads led to a small fall in the total fund expense profile, despite the rise in the
reported expense ratio (Table 8). Over a longer time period (1980-97), it appears that costs to
the average investor have fallen more substantially, for the same reasons. Non-marketing
expenses have risen over the same period (Rea and Reid 1998). More recently, investors have
been shifting into cheaper passively managed funds.
However, the movement to lower cost and higher performing funds generally occurs
through the flow of new money to the funds rather than the reallocation of old money. The
process, therefore, has been very gradual and some poorly informed investors have not
participated in it (Ippolito 1992, Patel, Zeckhauser and Hendricks 1994, Sirri and Tufano 1997,
Gruber 1996). The slowness may be due, in part, to the generally robust stock market since
1980. Costs have been small relative to returns and the vast majority of investors in diversified
mutual funds have fared well, even those in high cost funds. Costs are likely to become more
19

important as a determinant of net returns and peoples' investment decisions, when gross returns
decline.
This evolution of the mutual fund industry is suggestive of how a mandatory IA system
might evolve in the retail market. Assets will increasingly be concentrated in large investment
companies which exploit scale economies. New niche firms and products will spring up,
resulting in wide consumer choice (regulations permitting). A heavy emphasis on marketing
activities and expenses will provide a mixture of useful and misleading information to clients.
Finally, we would expect a gradual movement toward high performing, low cost funds but with
considerable variance. Recently, performance-based fees have been adopted by some of the
largest funds, which may prove to be an indirect way of decreasing fees of managers who
underperform their benchmarks. The movement toward low cost funds would probably
accelerate with a mandatory IA system. However, the difficulty small investors may have in
processing cost and return information, together with the greater profitability of large investors to
funds, would retard this process. Although lower cost funds will be available, we would expect
many investors to pay more than 1% of assets annually, over long periods.
III Institutional Investments: The Cost of Bulk Asset Management Alone
The importance of the institutional dummy led us to investigate further the degree to
which costs are lower for managing large asset balances. Mutual funds are limited in their
ability to charge lower fees for large investors. Regulations require funds to charge all investors
the same expense ratio, unless they create separate classes of shares that incur different expenses.
Thus, institutional investor classes are usually not charged for shareholder services or
distribution, because it can be demonstrated that they do not incur these costs, but they are
charged for a pro rata share of the investment adviser and other fees. This treatment makes it
possible for mutual funds to compete for small institutional accounts (e.g. of $1-20 million,
owned by bank trust departments or corporations). However, it puts them at a disadvantage
when competing for larger accounts. Larger institutions (e.g. DB plans of major corporations
and public employers) can get better money management rates elsewhere.
Table 12 presents illustrative sliding scale cost data on investments up to $200 million
provided by a large manager of institutional funds operating outside the mutual fund framework.
20
It also shows median costs for 167 large and 10 of the largest U.S. pension funds (median large
fund = $1.5 billion, median assets per money manager = $113 million; median largest fund = $42
billion, median assets per money manager = $543 million). These can be considered pure money
management costs because marketing and record-keeping costs are virtually absent.
Table 12 shows clear evidence of scale economies, the cost efficiency of passive
management, and the impact of asset allocation. Fees as a percentage of assets decline over
large ranges with volume of assets managed. Marginal fees are as low as 1 basis point for
passive management of large cap stocks and 2.5 basis points for small and mid-caps, once assets
in an account reach $200 million. Passive fees cannot go much lower, and indeed are not lower
even for the largest pension funds. So there appears to be no strong cost reason for aggregating
passively invested amounts beyond a half billion dollars.
Fees for active management are higher, but still far less than the 1% fee they would pay
in the mutual fund market. For assets exceeding $25 million, investors must pay 35-50 basis
points. Median fees for active management in the largest pension funds are only 25 basis points,
suggesting that cost cuts continue past the $25 million point. The fact that even the largest
pension funds use multiple money managers (an average of 34), and allocate less than a billion
dollars on average to each active manager, is evidence that, to them, diversification benefits
eventually outweigh scale economies. (Recall that mutual funds realize scale economies until a
much higher point,$20-$40 billion, but some of their economies come from advertising and other
non-investment functions).
Money management rates for emerging market investments are much higher than for
domestic investments, but advantages to large institutional investors remain. For active
management they pay a marginal fee of .8% and for index funds only .4%. These numbers again
suggest that asset management is much more expensive in developing countries, because
transactions costs are higher, markets are less efficient and passive investment opportunities are
unlikely to be available. Moreover, investment companies in the third world have less money at
their disposal, so they are less able to benefit from scale economies. The large institutional
investor in the third world nevertheless fares much better than the small retail investor, which has
implications for how these countries might set up their IA systems.
Why do institutional investors get such a good rate? The answer lies in better
information, greater bargaining power and lower costs. In an imperfectly competitive market,
21

large investors have greater reason and resources to seek out money managers who will charge
them a fee close to marginal cost. They also have the credible threat of managing their money
in-house if they do not get good terms from an external manager. The more they have to invest,
the greater their marginal profitability to the money manager and the greater their bargaining
power. This is an arena where each agreement is slightly different and personally negotiated.
Even a small fee above marginal cost per unit invested adds up to a large contribution toward the
asset manager's fixed costs, in the case of a large institutional investor. Thus, even if a million
small investors with $1000 each, cost the same total amount as one institutional investor with $1
billion, the latter would probably end up with a smaller fee as a percentage of assets as a result of
better information and bargaining power.
Costs, however, are not the same because record-keeping, shareholder service and
marketing costs are much less for 1 investor with a billion dollars than for a million small
investors. To reach the individual retail investor, advertising expenses must be incurred, sales
commissions paid and frequent telephone inquiries answered. Numerous prospectuses and
statements must be sent to households on a continuing basis before and after they invest. All of
this increases costs. To reach an institutional investor, preparing a contract proposal and
establishing an investment program are necessary, but once the contract is secured this involves
large sums of assets for which only one shareholder need be served. Even if the billion dollar
investor gets a higher service level than the thousand dollar investor, total demands relative to
total assets are much smaller for the former. And, marginal investments by the large investor are
virtually cost-free, hence the sliding scale for fees.
These factors lead to pure asset management costs for institutional investors as low as
.01-.05% for passive domestic portfolios (often this is partially covered out of securities lending
operations by the investment manager) and .25-.55% for actively managed portfolios, plus
another .03-.1% for brokerage fees and internal administrative costs that are associated with asset
management. This brings the total cost to .04-.65%, depending on asset category and investment
strategy chosen (see Tables 12 and 19). These would be the costs in a centrally managed funded
social security pillar without IA's.
IV. Capturing the Benefits of Institutional Rates for a Mandatory IA System
22
Mandatory IA systems can also be structured to obtain scale economies in asset
management without high marketing costs. In other words, they can offer workers an
opportunity to invest at much lower cost than would be possible on a voluntary basis.
Accomplishing this requires centralized collections and constrained worker choice-- to gain the
advantages of bulk buying power and diminished impetus for marketing. Still, enough choice
could be retained to satisfy individual preferences and avoid political control. Such constrained
choice is alternative 2.
Specifically, contributions could be collected together with social security payroll taxes
or income taxes, through a public agency or private clearinghouse. These intermediaries would
then allocate the funds according to worker choice, among a limited number of money managers
chosen in a competitive bidding process.
Centralized collection "piggybacking" on existing tax agencies involves long delays, as
much as 1-2 years, before the worker's contribution is allocated to his account and money
manager. It may not be an option for countries that have weak tax collection mechanisms and
distrust of public agencies. In these countries workers may be more likely to contribute if they
can put the money directly into their own accounts. This was the case, for example, in Chile at
the time of its reform; a retail approach was the only feasible approach under those
circumstances. Piggybacking, however, can greatly reduce collection costs as well as facilitate
compliance and record-keeping (see Part V) in countries that have the capacity. Moreover,
because the contributions are aggregated, opportunities exist for reducing marketing costs
associated with asset management and increasing the bargaining power of investors.
The exact number of money managers to be used would depend on the inflow of
contributions relative to the size of the cost-minimizing assignment per manager. The strength
of the country's desire to give workers choice would be an additional factor. Initially the number
might range from 2-3 in countries with a small contribution base to 5-10 in larger countries,
chosen in a competitive bidding process. This number would gradually increase; with the
growth of assets in the system. Issues related to the bidding process include: selection criteria,
whether to hire the "best" bidder for each category or all firms that bid better than a stipulated
threshold; term of contract and frequency of re-bidding; and fee structure (performance-based,
asset-based, or otherwise). For countries with weak financial markets, an auction would provide
an incentive-a guaranteed or quasi-guaranteed market share--for international companies with
23
financial expertise to enter the industry. To produce this outcome, these countries would need to
avoid the temptation for corruption and political manipulation of the bidding process.
Initially the options might be restricted to a variety of passive investment choices indexed
to different diversified benchmarks. Again, this may not be feasible or desirable in developing
countries where such benchmarks do not exist, where the rapid entry of new firms make it
difficult to build a stable benchmark, and where inefficient markets give an edge to active
managers who can obtain private information. But where they are feasible, the bidding process
and passive investment strategies would help avoid high start-costs and large expense deductions
from small accounts.
Later, as aggregate assets increase, entry could be opened up to a larger number of money
managers, including active managers who agree to operate below a specified price ceiling. The
ceiling would be set high enough to cover marginal cost plus part of fixed costs but low enough
to discourage marketing expenses. It might vary according to benchmark chosen: higher for
small caps and emerging market portfolios than for domestic large caps. For example, the
ceiling might be set at the mean or median money management cost, by asset class, of the largest
pension funds in the country, with record-keeping and shareholder servicing provided elsewhere
(see Table 12 and Part V). Alternatively, it might be performance-based around this mean or
median.
The Swedish system of centralized collection and negotiated fees (or a variant that
replaces negotiated fees with a fee ceiling), moves directly to this second stage: it might involve
most mutual funds in the country very quickly. This could add to costs faced by worker-
investors if lower fees are traded off for greater choice and if advertising explodes. The Bolivian
system of auctioning off entry rights at the start is much more cautious-but of course Bolivia
did not have a local mutual fund industry to start with. This scheme is also consistent with the
two-tiered plan for the U.S. outlined in Goldberg and Graetz 1998. Their plan would initially
give workers a choice among six index funds (SPIFs), but would allow workers to opt out into a
broader set of qualified options (QPFs) once their accounts reached a specified size.
One intended consequence of this method, that accounts for much of the cost saving, is
reduced marketing expenditures. Initially, limited entry and price competition in the auction
process would reduce the incentive for marketing. Later, as entry increases, competition among
investors would also increase but sales commissions could be prohibited or greatly diminished
24
by low fee ceilings. Mass media advertising and direct mailing would probably still be used but
the bidding process or fee ceilings suggested above would set a narrow limit here.
Is this attempt to reduce marketing expenses efficient? The object is to avoid
expenditures on costly zero-sum game competition among investment companies, paid for by
workers, when this is not serving other socially useful purposes. It seems likely that these useful
purposes would be less in a mandatory IA system than in the voluntary market, for several
reasons. First, the total investable amount is predetermined by law; marketing is therefore not
needed to induce people to save or to invest in financial markets. Second, mandatory centralized
collections can aggregate savings into large blocs for efficient investment without marketing
expenses. Third, information is imparted by marketing, but investment companies and brokers
have a clear incentive to impart misleading information that is in their interest rather than the
consumer's interest. Broker-salesmen generally have ties to a limited number of fund families
and have little incentive to recommend no-load funds to their clients even if these are the best
buys. This would be a problem especially in a new mandatory system with many small
inexperienced investors. A mandatory IA system should include other more cost-effective ways
to impart non-biased information relevant to investment choices. Marketing does provide an
incentive for good performance and innovation. This, however, would be partially retained by
the remaining mass advertising and by the voluntary market place.
Reducing marketing expenses may be less feasible or efficient in countries with low tax
collection capacities and less public information, particularly if they wish to use marketing as a
tool to increase coverage and reduce evasion. For example, Bolivia specifically built this
mandate into its bidding process.
A second consequence of these economies is constrained choice. Constrained choice
may increase the probability of corruption or collusion and decrease the adaptability to
individual risk-return preferences--although not as much as a single centralized fund.
Individuals may have a smaller sense of "ownership" and a larger sense of being taxed if their
choice of investment manager is constrained. The risk to the government of being responsible
for a bail-out in case of investment failure may be greater when it has "endorsed" or participated
in the process of choosing a small number of asset managers. The constraint on choice and these
consequent dangers would be particularly great in countries with a small contribution base and a
tradition of inefficient government control. Greater choice could be allowed, and hence the
25

trade-off between low cost and low political risk would be less serious, in economies with larger
investable resources-from higher contribution rates or wages. As we have seen, a large country
such as the U.S. could allow considerable choice and Sweden plans to allow substantial choice,
even with a small contribution rate. This would be consistent with low cost so long as other
mechanisms, described above, were put in place to discourage marketing expenses.
Constrained choice has an additional value at the start of a new system. It facilitates
learning-by-doing, which is probably the most effective form of education, by limiting the
mistakes people can make. It makes government guarantees of benefits potentially less costly by
diminishing moral hazard problems. Constrained choice can represent a Pareto-improvement if
these advantages, together with the real cost-reduction, are valued by participants more than the
flexibility they would have had in the retail markets. This is most likely to be the case if the
constraints on choice are not too great. Since some participants may prefer the lower costs while
others may prefer greater choice, and compensatory payments may not be possible, distributional
as well as efficiency effects are almost certain to be involved.
We estimate that asset management costs in this system of constrained choice (alternative
2) would be much less than in the retail market. They would be only slightly higher than those
of a single centralized fund, due to advertising costs (Table 19). Costs of record-keeping and
communicating with multiple participants (R&C) would, however, be additional in an IA system,
since numerous individual accounts, rather than one big trust fund, would have to be tracked. We
move on now to discuss how this could be handled in a cost-effective manner.
V. Record-keeping and Communications
Money management costs to investors in an IA system can be drastically reduced by
moving money in large blocs, eliminating sales commissions and using passive investment
strategies. The total cost attributable to record-keeping and shareholder communication (R&C),
however, remains larger than if these services were provided for one large institution. In fact,
this could be the largest cost component in a new IA system that has successfully reduced
investment and marketing expenses. Most important: the magnitude of these costs and the ways
in which they are covered are, to a substantial extent, a policy choice rather than an exogenously
given variable.
26

R&C costs depend mainly on the number of accounts and secondly on the level of service
provided. The figures given below indicate that, under current circumstances, a fund that has an
annual fee of 1% of assets must have an average account size of $2500 simply in order to cover
its R&C costs with that fee; if the fund is no-load and its fee .2%, as in some of the lower cost
index funds, the average account size must exceed $16,500. This immediately suggests that
mutual funds would not be interested in small IA accounts, or would charge them an annual fee
that far exceeds 1% of assets (thereby cutting benefits comensurably), unless some new means is
developed of handling R&C costs. This section discusses how that might be accomplished.
How high are R&C costs? Record-keeping alone is cheap. To illustrate: In 1995, the
U.K. government contracted with Andersen Consulting to develop and operate a computerized
information system for its social security programs, covering 65 million participants. The new
system is just beginning to come on line, in 1998. The contract provided this system at an annual
cost of less than $.50 per account. Specifically, seven years of payments will be made, at a total
present value cost of 134 million pounds or $210 million. Of this total, 40% will be paid to
Andersen and 60% represents agency inputs. The cost would have been almost $1.00 per
account, except that Andersen contributed an estimated 100 million pounds in system
development costs, thereby underbidding other competitors commensurately. Under the
contract, Andersen will communicate only with the government, not with the 65 million
participants. (For more details see Report by the Comptroller 1997).
In contrast, competition in the U.S. mutual fund industry has resulted in a high and
expensive level of service that far exceeds mere record-keeping, in part because shareholder
service and building shareholder loyalty (a form of marketing) are closely intertwined. Service
innovations include the ability to make frequent telephone exchanges, to wire funds, to write
checks, and to speak to a representative 12 or even 24 hour per day. Not only are these services
available, their costs are hidden. They are free of charge to the individual user-although, of
course, not to users as a group. Customers with low transactions and few communications cross-
subsidize the others, thereby encouraging further use.
Technology (internet, automated phones) is ostensibly being used to reduce costs, but so
far the savings have not materialized. Instead, the greatest impact has been to increase
investment costs and improve service still further. Additional electronic options are available
while the utilization of expensive personal services has not diminished. This helps explain why,
27

in the regressions for 1992-97, a period which has seen great technological strides, expense ratios
rose slightly, and total expenses (expense ratio times assets) rose dramatically. A lower service
level with correspondingly lower costs may be appropriate in a mandatory IA system, especially
one in which accounts are small. The competitive solution aimed at larger investors may not be
socially optimal for small investors. Yet the market may not react if expensive services are
preferred by the large investors who are the most profitable ones.
How much do mutual funds spend on record-keeping and shareholder communication?
According to periodic surveys of transfer agents (i.e., the organizations which provide these
services for mutual funds), average cost per account and per open account have been quite
constant at $21 and $25 per account, respectively (Table 13). However, they are not uniform
across all funds. They tend to be lower for funds that contract out the transfer agent function
rather than performing it internally. This may result because pricing in internal arrangements is
not an arms-length competitive transaction and because internal control is designed to provide
more personalized service, to inculcate loyalty to the fund. Costs per account are 33% higher for
money market than for equity funds, because of the greater transaction volume and check-writing
facilities offered by the former. They are twice as high for direct market retail funds compared
with funds that sell through brokers ($33 versus $17). Brokers, of course, perform some of the
customer communications functions that are otherwise provided by the fund, in exchange for
their sales commissions. Transfer agent costs are 20% higher for accounts where dividends are
paid monthly as compared with annually.
Each transaction has a real cost. Processing the application for a new account costs at
least $5.00; a personal telephone call costs $6.00; check-writing costs $5.00 to set up and $1.00
per draft thereafter (Table 14). Despite these incremental costs for each transaction, the most
common method transfer agents use for charging funds is a flat fee per account. U.S. mutual
funds rarely charge shareholders special fees for checkwriting, exchanges or telephone inquiries
(Table 15). This is in part due to the cost of measuring and charging for transactions, and in part
to the strong desire of funds to avoid antagonizing high-asset consumers. The net result is the
absence of incentives for shareholders to economize on these services and the presence of a
cross-subsidy from non-users to heavy users.
How could R&C costs be reduced in a mandatory IA system? These numbers suggest
ways in which record-keeping and communications costs could be dramatically reduced in a
28

mandatory IA system. Most basically, the record-keeping and communications function could
be separated from the asset management function and centralized--either in a public agency, or
contracted out to an independent private company, or in a clearing-house run jointly by all
participating funds. In fact, the market has been moving toward out-sourcing the transfer agent
function for the mutual fund industry and concentrating it in two or three large companies. So
this would merely accelerate and standardize this process.
Centralization immediately reduces system-wide costs by avoiding the set-up and
systems integration problems that occur when a member switches his or her account from one
fund complex to another. It keeps a single record of a worker's lifetime contributions and
returns. This is particularly important in a mandatory system where such a record should be
readily available, error-free, upon retirement. The separation of R&C from the asset-
management function would actually increase the choice of asset managers available to small
account holders, since R&C costs, which are relatively expensive for such accounts, would be
covered elsewhere.7 It would facilitate a cross-subsidy to small accounts, which may be socially
desirable, without competitive pressures that might oppose this. Moreover, centralization would
allow personalized services to be reduced without generating inefficient competitive pressures to
upgrade. (But note that government capacity and trust in public agencies are necessary pre-
conditions for centralized R&C, and these are lacking in many developing countries-see earlier
comment in Part IV).
A second step concerns setting the level of basic service as well as the charges for
incremental service in an unbundled system. It is not clear that consumers would willingly pay
for the current level of service and personalized communications if charged directly. This would
be particularly true for the small investors of a mandatory IA system rather than the relatively
large investors of today's voluntary mutual fund system. The basic service level should be low
enough to pass a benefit-cost test, given the small average size of the account for the first few
years of the new system. It should focus on keeping accurate, timely records and processing
transactions efficiently. At the same time, different service levels could be chosen by those
willing to pay for more.
For example: Services such as check-writing could be ruled out; dividends and capital
gains could be credited annually; fund transfers or other transactions could be restricted or
discouraged by a fee that covers the cost. Most important because it is most expensive,
29
personalized services, especially telephone discussions with representatives, could be minimized
by encouraging members to use automated phones or the internet instead. A possible strategy
here would be to make telephone service available only for limited hours per day and build in
probable waiting time to encourage members to switch to automated techniques. Less palatable
is the use of toli calls instead of 800 numbers to pass the phone company charges on to
consumers, or the use of 900 numbers to impute the representative's time as well. Costs could
be cut further by sending statements annually instead of quarterly. The costs and performance of
each fund could be reported in a brief 1-2 page summary, rather than the lengthy and detailed
prospectus which is required of all mutual funds today. In fact, the short statement may be more
educational than the lengthy prospectus which few people read or understand. In-person
workshops provided by many 401k plans would be avoided and replaced by brochures
introducing investors to concepts such as risk-return trade-offs, diversification and indexing,
published for mass distribution. Market competition for high income investors does not allow
mutual funds to use these strategies, but centralized record-keeping in a mandatory system does.
Table 16 compares the cost composition of a typical mutual fund account and a modest-service
account proposed for an IA system
The $20 account. While money management fees depend on volume of assets, R&C
fees depend on number of participants. Based on the above information and specifications, it
appears that a functional service level could be delivered for an R&C cost of less than $20 per8account. This approximates the cost per account of the transfer agent function in mutual funds
where dividends are distributed annually. The potentially more difficult clientele of an IA
system would be offset by the lower level of personal communications offered.
This approach would be roughly consistent with the record-keeping and communications
costs of the Thrift Savings Plan (TSP) for federal employees in the U.S. The TSP began in the
late 1980's. It now has 2.3 million participants and approximately $65 billion in assets (Table
17). TSP costs for R&C have remained fairly stable at $19 per account ($22 per active account)
since 1990. Funds are invested in a variety of passively managed portfolios, so additional costs
of asset management and brokerage fees are only a few basis points. (We are reporting gross
costs although these are partially offset on TSP books by account forfeitures).
TSP R&C costs are low in part because much of the communications with participants is
done through the federal agencies where members are employed. In a mandatory IA system
30
information would have to be distributed directly from the central clearinghouse to the
individual, at some monetary cost. However, TSP provides certain expensive services that
would not be included in a mandatory IA system, such as loans and withdrawals, that are
difficult to process and are responsible for many of the phone calls.9 Moreover, an IA system
would benefit from much greater economies of scale. Foir example, the TSP numbers given
above include $2-$4 per account of fixed administrative costs that would disappear in the much
larger social security system, bringing the total to less than $20.
Table 18 converts this $20 estimated annual R&C cost into an expense ratio, based on the
assumption that the average worker contributes $500 per year. In the first year, the $20 is 4% of
the worker's assets. If the real rate of return is 5%, the R&C expense ratio falls to less than 1%
by the fourth year. (If the new system were adopted in the U.S. in 1999 and a specified portion
of payroll were put in escrow pending tax reconciliation and establishment of the new
information system, at least three years of contributions and interest would accumulate before the
IA's became operative. By that time, the $20 charge would already be close to 1% of assets for
the average worker who was there from the start). By the time the first cohort of workers retires
40 years later, it would be only 3 basis points of their assets.
Of course, each year new workers would be entering the system, beginning again with
small accounts, as current workers age and retire with larger accounts. We assume that R&C
charges will be based on assets, hence large accounts will subsidize small accounts. In a
simplified steady state with no population growth or wage growth, and with 5% real interest, the
average account size will be $21,927 and the $20 charge for record-keeping and communications
expenses is equivalent to 9 basis points, or 2% of foregone retirement benefits.
After adding these 9 basis points to the cost of asset management derived in the previous
section, the total cost for an IA system based on constrained choice is projected to be .14-.18% if
passively managed, or .49-.79% if actively managed. In constant dollars, the steady state cost for
the average size account, if passively managed, would be $31-39. This cost is much lower than
an IA system run through the retail market. It is lower than individual investors have access to in
the voluntary market, primarily due to reduced marketing costs and secondarily because of bulk
buying power and no-frills service-but at the price of less choice.10 It is slightly more than a
single centralized fund would cost, but offers much greater adaptability to individual preferences
and insulation from political risk in exchange (Table 19).
31
VI Conclusion
We started this paper by asking: what is the most efficient way to set up an IA component
of a social security system, and how do we compare the cost effectiveness of investing social
security funds through 1) the retail market with open entry and choice, 2) the institutional market
with constrained choice among investment companies and 3) a centralized fund without IA's or
choice?
The evidence in this paper demonstrates that large cost savings can be realized by
investing IA's through the institutional market with constrained choice. This would involve
centralizing collections, record-keeping and communications and moving money in large blocs
rather than as small individual investments, while still giving workers considerable choice
among asset managers. This can be accomplished initially through a competitive bidding
process in which a limited number of managers are chosen for differentiated portfolios, and
subsequently through an open entry process in which companies agree to restrict their fees in
exchange for the right to participate. The cost savings to participants come largely from
efficiency gains- exploiting economies of scale in asset management, avoiding duplicate
collection systems and fragmented record-keeping systems, reducing marketing expenses, and
providing incentives to economize on communication costs. A smaller part of the savings is due
to greater bargaining power about the distribution of fixed costs between the mandatory and
voluntary markets. Employing passive managers in the early phase would further reduce costs.
WAhile these recommendations for reducing costs hold for industrialized countries, they
may have to be modified for developing countries. On the one hand, these countries tend to have
weak tax collection mechanisms, distrust of government's ability to handle the record-keeping
and bidding processes effectively, and inefficient markets that make passive investing more
problematic. On the other hand, the low incomes and contribution bases of many of these
countries make it all the more advantageous to limit entry through an auction in order to benefit
from scale economies and avoid high start-up marketing costs. A separate paper will deal with
these issues in greater detail.
The evidence indicates that many of the same factors that reduce costs will also raise
returns. The price paid for constrained choice relative to open choice in the retail market is
32

therefore not lower expected returns, but rather other less quantifiable factors such as greater risk
of corruption, collusion and a weaker sense of worker ownership. The importance of these
factors will vary among countries and will decrease as the number of asset managers in the
system increases. A contribution base that is large enough to allow meaningful choice among
multiple asset managers will go far toward diminishing these dangers.
As to the relative cost effectiveness of a constrained IA system versus a centralized fund
with no choice, we have seen that the extra costs associated with IA are negligible, providing a
modest level of service is chosen for record-keeping and communicating with participants. At
the same time, optional services might be unbundled so that those who use them pay for them.
The most expensive service involves communication and education. It is difficult to
expect consumers to make complicated financial choices without information. Our R&C cost
estimate included an allocation for preparing and distributing published materials. However, we
would argue that, especially for workers who are saving for the first time in their lives, the best
education comes from practice-with small amounts. This is another reason for simplifying and
limiting choice, especially at the beginning of the new system. By the time greater choice is
permitted, accounts will have grown and most workers will already have learned, from
experience. No doubt the popular press (newspapers, magazines, TV talk shows) would also
play a significant role in educating the public, as they surely would face a huge demand once
everyone had an IA.
The structure of an IA system matters. Administrative costs need not make IA's
prohibitively expensive, as is sometimes claimed. The cost of managing savings in a mandatory
IA system can be significantly less than the cost of voluntary saving. An IA system that gives
workers choice can be structured to cost only slightly more than a single centrally managed fund
with no choice. Decisions about whether to fund and whether to manage the funds publicly or
privately should therefore depend on other factors, such as the economic benefits of funding and
the risks and returns associated with public and private management of funds.
33

TABLE 1
Annual Asset-based Fee equivalent to 15% Up-Front Fee in Chile(as percentage of assets)
Starting Age Contribution Made Contributions Made For 20 Contributions Made EveryFor Years Year
1 Year Only At Given Only, Starting At Given Age Until Age 65,Age
Starting At Given Age
1 ~~~~~~~2 325 0.43 0.55 0.73
35 0.58 0.82 1.01
45 0.87 1.59 1.59
55 1.79 3.37
64 32.09 32.09
Assumptions:
This table shows the annual fee based on assets that will yield the same capital accumulation at
age 65 as would a 15% front-loaded fee on in-coming contributions. In column 1 a single year of
contributions is assumed at the starting age. In column 2 worker continues contributing a fixed
percentage of wage for 20 years. In column 3 worker continues investing fixed percentage of
wage from starting age until age 65. Worker contributes in monthly payments and keeps money
invested in system until age 65. Rate of return of 5% is assumed, but results are very insensitive
to rate of return. For columns 2 and 3, annual wage growth of 2% is assumed.
34
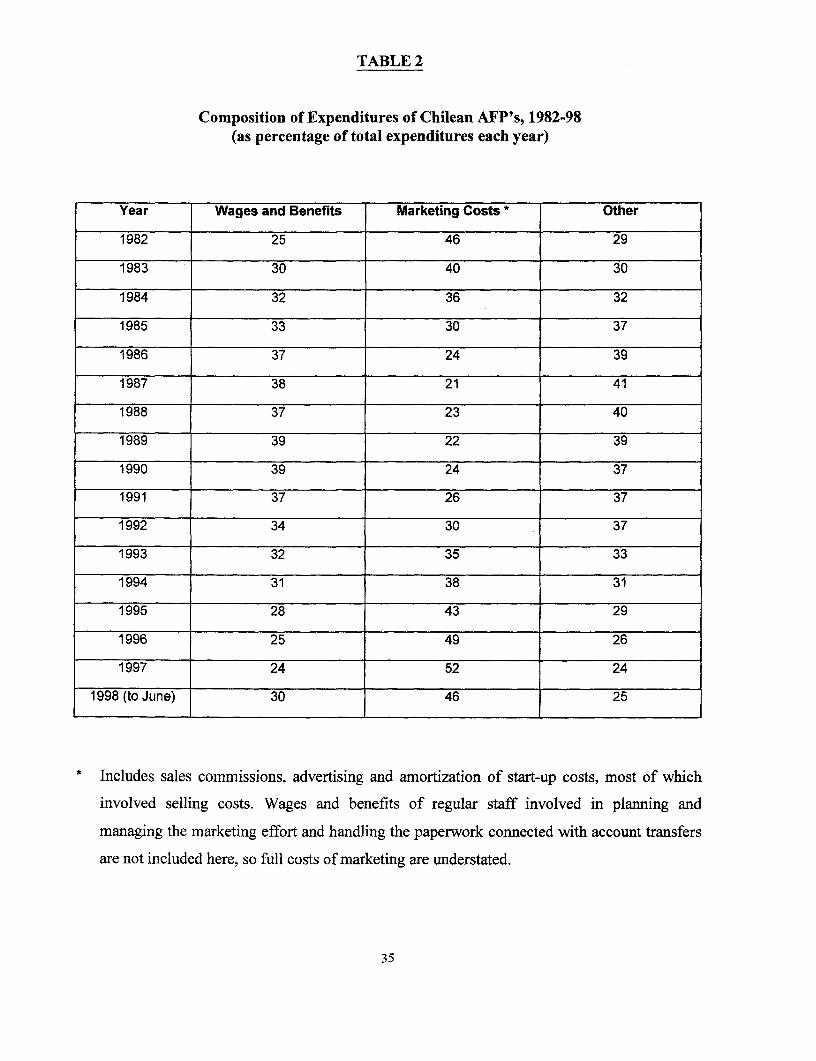
TABLE 2
Composition of Expenditures of Chilean AFP's, 1982-98(as percentage of total expenditures each year)
Year Wages and Benefits Marketing Costs * Other
1982 25 46 29
1983 30 40 30
1984 32 36 32
1985 33 30 37
1986 37 24 39
1987 38 21 41
1988 37 23 40
1989 39 22 39
1990 39 24 37
1991 37 26 37
1992 34 30 37
1993 32 35 33
1994 31 38 31
1995 28 43 29
1996 25 49 26
1997 24 52 24
1998 (to June) 30 46 25
* Includes sales commissions, advertising and amortization of start-up costs, most of which
involved selling costs. Wages and benefits of regular staff involved in planning and
managing the marketing effort and handling the paperwork connected with account transfers
are not included here, so full costs of marketing are understated.
35

TABLE 3
Characteristics of Mutual Fund Sample, 1992
1992 # of Funds % of Total Assets Total Assets % of Total AssetsStudied (Avg) For In Universe
Category StudiedType of Fund $ $
_ _ ~~~~~~~~~~~~millions billionsEquity Funds 634 49 568.4 360.4 49
Bond Funds 673 51 558.7 376.0 51
Small Cap. 76 6 224.0 17.0 2
International 75 6 454.5 34.0 5
Emerging Markets 100.7 0.8
Index Funds 215 735.2 11.0
Institutional 29 455.3 13.2
Funds with 12b1 fees 725 55 498.4 361.3 49
Funds without 12b1 fees 582 45 644.4 375.0 51
Funds with Floads 647 50 591.0 382.3 52
Funds without Floads 660 51 536.3 354.0 48
Total funds included in study 1307 736.3
1992 Expense 3 Yr Gross 3 Yr Net 3 Yr StandardRatio Return Return Deviation
Type of FundEquity Funds 1.40 10.18 8.70 18.12
Bond Funds 0.94 9.85 8.76 5.91
Small Cap. 1.48 14.58 13.37 23.00
International 1.69 0.94 -0.98 14.59
Emerging Markets 1.84 -2.14 -4.22 18.09
Index Funds 0.73 8.17 8.00 15.99
Institutional 0.55 9.18 9.38 10.76
Funds with 12b1 fees 1.32 10.62 8.21 11.47
Funds without 12b1 fees 0.96 10.72 9.38 12.28
Funds with Floads 1.11 10.65 7.97 11.37
Funds without Floads 1.21 10.67 9.47 12.28
Total funds included in study
36

TABLE 3
Characteristics of Mutual Fund Sample, 1997
1997 # of Funds % of Total Assets Total Assets % of Total AssetsStudied (Avg) For in Universe
Category StudiedType of Fund $ $
millions billions _Equity Funds 2089 49 840.2 1755.1 70
Bond Funds 2165 51 348.4 754.2 30
Small Cap. 243 6 473.4 115.0 5
International 484 11 526.6 254.9 10
Emerging Markets 127 3 164.6 20.9 1
Index Funds 103 2 1358.7 139.9 6
Institutional 311 7 409.8 127.4 5
Fundswith 12b1 fees 2613 61 438.6 1146.1 46
Funds without 12bl fees 1641 39 830.6 1363.0 54
Funds with Floads 1483 35 705.7 1046.6 42
Funds without Floads 2771 65 527.9 1462.7 58
Total funds included in study 4254 2509.4
1997 Expense 3 Yr Gross 3 Yr Net 3 Yr StandardRatio Return Return Deviation
Type of FundEquity Funds 1.48 20.55 18.47 15.03
Bond Funds 1.08 11.92 10.27 4.85
Small Cap. 1.51 24.15 22.16 18.99
International 1.64 12.19 9.95 11.02
Emerging Markets 2.12 -0.56 -3.36 19.87
Index Funds 0.66 22.62 21.74 12.76
Institutional 0.79 15.72 14.93 9.69
Funds with 12b1 fees 1.49 15.76 13.48 9.63
Funds without 12b1 fees 0.93 16.79 15.61 10.19
Funds with Floads 1.15 15.90 13.25 9.78
Funds without Floads 1.33 16.30 14.86 9.88
Total funds included in study 1.28 16.16 14.30 9.85
37

Table 4
Composition of Mutual Fund Expenses, 1997*(in basis points)
Simple Asset-WeightedAverage Average Active Passive
Expenses Included in Expense RatioInvestment Advisor 56 49 52 8Distributor for 12b1 fees* 35 21 22 2Transfer Agent 13 12 12 5Other (custodial, legal, audit, etc.) 23 9 8 13Reported expense ratio 127 91 95 28
Other ExpensesBrokerage fees paid by fund 26 12 12 3Annualized front-loaded sales chargepaid by shareholder* 31 40 43 1Total expenses as % of assets* 185 143 150 32
The 12bl fee is a fee that is paid annually by the fuid, primarily for distribution of new
shares and related service. It is financed by a charge paid by all shareholders, whether or not
they have purchased their shares through a broker. It is part of the fund's expense ratio and is
based on assets. The front-loaded sales charge is paid directly to the distributor by investors
who purchase through brokers, as a % of their new investment. It is not included in the fund's
expense ratio. The average front-loaded fee is 4.48%. It is charged by about 1/3 of all funds.
In this table, this one-time fee has been annualized according to the procedure described in
endnote 4.These numbers are averaged over all funds, ignoring the big distinction in costs to
shareholders between funds that impose sales charges and those that do not (see table 8).
38

TABLE 5
Mean, Median and Standard Deviation of Variables in Sample, 1997
Asset-Weighted Simple Simple SD
Mean Mean Median
Expense ratio (as % of assets) 0.91 1.28 1.17 0.61
Assets in $billion 9.94 0.59 0.09 2.35
# Shareholders (in thousands) 281.60 20.19 2.08 75.13
Assets in Family Funds (in $ billions) 151.15 42.06 12.30 86.00
3 Year Net Return (as %) 20.16 14.30 11.44 9.22
3 Year Gross Return (as %) 21.79 16.16 13.45 9.19
3 Year Standard Deviation 11.67 9.85 8.68 6.59
Turnover (as %) 69.40 98.00 65.00 117.00
Fundage 19.90 8.97 5.35 9.58
Percentage of Funds That Are:
Bond Funds 30 51
Small cap. 5 6
Specialty 7 7
International 10 11
Emerging Market 1 3
Institutional 5 7
Index 6 2
Low 12b1 fee (0.25% or less) 36 41
High 12b1 fee (between 0.25% and 1%) 10 21
Front load 42 35
Back Load 12 27
Bank Advised 5 16
39
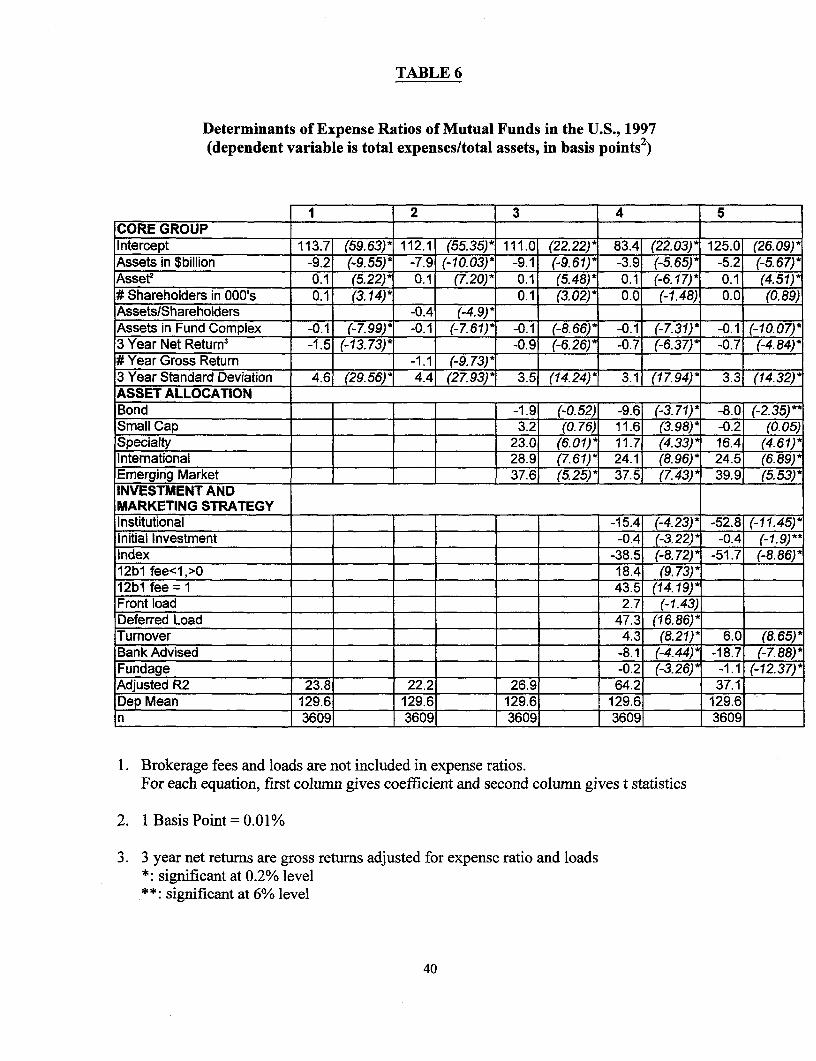
TABLE 6
Determinants of Expense Ratios of Mutual Funds in the U.S., 1997(dependent variable is total expenses/total assets, in basis points2)
1 2 3 4 5CORE GROUP . .Intercept 113.7 (59.63)- 112.1 (55 35)- 111.0 (22.22) 83.4 (22.03)' 125.0 (26.09)-Assets in $billion -9.2 (-9.55)1 -7.9 (-10.03)* -9.1 (-9.61)* -3.9 (-5.65)' -5.2 (-5.67)*Asset2 0.1 (5.22)* 0.1 (7.20)y 0.1 (5.48) 0.1 (-6.17)* 0.1 (4.51)*# Shareholders in 000's 0.1 (3.14)* 0.1 (3.02)* 0.0 (-1.48) 0.0 (0.89)Assets/Shareholders ____ -0.4 (4.9)* _
Assets in Fund Complex -0.1 ( 7.99)* -0.1 (-7.61)* -0.1 (-8.66)* -0.1 (-7.31)* -0.1 (-10.07)*3 Year Net Return3 -1.5 ( 13.73)* -0.9 (-6.26)* -0.7 (-6.37)* -0.7 (-4.84)1# Year Gross Return I_ I -1.1 (-9.73)*3 Year Standard Deviation 4.6 (29.56)* 4.4 (27. 93)* 3.5 (14.24) 3.1 (1 7.94)* 3.3 (14.32)*ASSET ALLOCATION _Bond -1.9 (-0.52) -9.6 (-3.71)* -8.0 (-2.35)**Small Cap 3.2 (0.76) 11.6 (3. 98)* -0.2 (0.05)Specialty 23.0 (6.01)* 11.7 (4.33)* 16.4 (4.61)*International 28.9 (7.61)* 24.1 (8.96)* 24.5 (6.89)*Emerging Market 37.61 (5.25)* 37.5 (7.43)* 39.9J (5.53)*INVESTMENT ANDMARKETING STRATEGYInstitutional -15.4 (-4.23) * -52.8 (-11.45)*Initial Investment -0.4 (-3.22)* -0.4 (-1.9)**Index -38.5 (-8.72)* -51.7 (-8.86)*12b1 fee<1,>0 18.4 (9.73)*12b1 fee = 1 43.5 (14.19)_Front load 2.7 (-1.43)Deferred Load 47.3 (16.86)*Tumover = 4.3 (8.21)* 6.0 (8.65)*Bank Advised _ -8.1 (-4.44)* -18.7 (-7.88)*Fundage -0.2 (-3.26)* -1.1 (-12.37)*Adjusted R2 23.8 22.2 26.9 64.2 37.1Dep Mean 129.6 129.6 129.6 129.6 129.6n 3609 3609 3609 | 36091 36091
1. Brokerage fees and loads are not included in expense ratios.For each equation, first column gives coefficient and second column gives t statistics
2. 1 Basis Point = 0.01%
3. 3 year net returns are gross returns adjusted for expense ratio and loads*: significant at 0.2% level**: significant at 6% level
40

TABLE 7
Determinants of Expense Ratios of Mutual Funds in the U.S., 1992-1997(dependent variable is total expenses/total assets, in basis points )
1 I | 2 3 4CORE GROUP l
Intercept 22.6- (12.73)- 23.0 (12.31)* 26.4 (9.17)* 65.0 (31.91)*Assets in $billion -3.5 (-5.97)- -2.2 (-5.97)* -2.7 (-7.05)* -2.3 (4.64)*Asset2 0.1 (5.77)* 1.0 (5.33)* 0.1 (6.18)* 0.1 (6.21)*# Shareholders 0.03 (2.68)** 0.0 (1.3)Assets/Shareholders -1.0 (-3.11)* -0.1 (-3.17)*Assets in Funds Complex -0.1 (-6.27)* -0.1 (-8.47)* -0.1 (-8.23)* -0.1 (-12.94)*3 Year Net Return3 -0.6 (-16.25)* -0.5 (-13.5)*# Year Gross Return -0.4 (-11.31)* -0.3 (-8.89)3 Year Standard Deviation 0.13 (16.79)* 1.5 (19.2)* 1.0 (-11.59)* 1.0 (12.82)*ASSET ALLOCATIONBond L 1 _ -12.6 (-7.57)* -23.8 (-19.25)*Small Cap i 14.9 (5.12)* 11.5 (6.25)*Specialty _ _ _ _ 15.7 (5.59) * 6.8 (3.96) *International _ _ 18.5 (7.65)* 21.7 (13.72)*Emerging Market 59.9 (12.92)* 48.2 (15.64)*INVESTMENT ANDMARKETING STRATEGY _ _ _
Institutional T I I T -15.4 (-8.09)*Initial Investment l -0.3 (-2.48)**Index _ l l _ _ -38.6 (-14.18)*12b1 fee<1,>0 _ | L I L 17.7 (13.84)*12b1 fee = 1 _ l l l 49.9 (23.16)*Front load l l I I 6.2 (4.71)*Deferred Load l l l l 49.7 (25.3)*Turnover _____ L I_l__ 2.0 (7.46)*Bank Advised I4 l I _ -4 (-1.92)**Fundage l_l __l_ -0.4 (-8.95)*Time 2.31 (11.17)*- 2.31 (10.66)* 2.3 (10.96)* 1.2 (6.41)*
1. Brokerage fees and loads are not included in expense ratios.For each equation, first column gives coefficient and second column gives t statistics
2. 1 Basis Point = 0.01%
3. 3 year net returns are gross returns adjusted for expense ratio and loads.*: significant at 0.2% level**: significant at 5% level
41
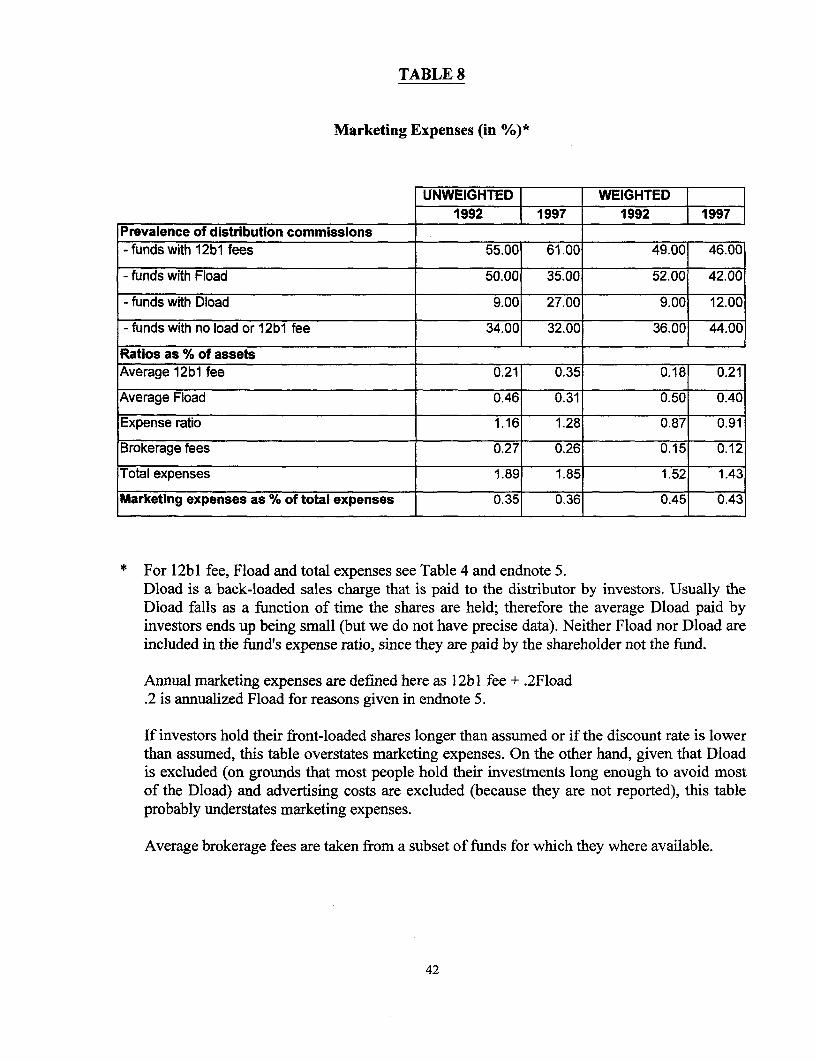
TABLE 8
Marketing Expenses (in %)*
UNWEIGHTED WEIGHTED l l1992 1997 1992 1997
Prevalence of distribution commissions-funds with 12b1 fees 55.00 61.00 49.00 46.00
- funds with Fload 50.00 35.00 52.00 42.00
- funds with Dload 9.00 27.00 9.00 12.00
- funds with no load or 12b1 fee 34.00 32.00 36.00 44.00
Ratios as % of assetsAverage 12b1 fee 0.21 0.35 0.18 0.21
Average Fload 0.46 0.31 0.50 0.40
Expense ratio 1.16 1.28 0.87 0.91
Brokerage fees 0.27 0.26 0.15 0.12
Total expenses 1.89 1.85 1.52 1.43
Marketing expenses as % of total expenses 0.35 0.36 0.45 0.43
* For 12bl fee, Fload and total expenses see Table 4 and endnote 5.Dload is a back-loaded sales charge that is paid to the distributor by investors. Usually theDload falls as a function of time the shares are held; therefore the average Dload paid byinvestors ends up being small (but we do not have precise data). Neither Fload nor Dload areincluded in the fund's expense ratio, since they are paid by the shareholder not the fund.
Annual marketing expenses are defined here as 12bl fee + .2Fload.2 is annualized Fload for reasons given in endnote 5.
If investors hold their front-loaded shares longer than assumed or if the discount rate is lowerthan assumed, this table overstates marketing expenses. On the other hand, given that Dloadis excluded (on grounds that most people hold their investments long enough to avoid mostof the Dload) and advertising costs are excluded (because they are not reported), this tableprobably understates marketing expenses.
Average brokerage fees are taken from a subset of funds for which they where available.
42

TABLE 9
Institutional v. Retail Mutual FundsAverage Expense Ratios and Total Expense Profiles as % of Assets,1997*
|A. Expense Ratio - Unweighted ALL ACTIVE PASSIVE j
ALL RETAIL INSTIT. RETAIL INSTIT. RETAIL INSTIT.Domestic Stock Funds 1.43 1.47 0.91 1.50 0.98 0.71 0.37Domestic Bond Funds 1.08 1.12 0.62 1.12 0.62 0.65 0.35international Stock Funds 1.69 1.75 1.09 1.77 1.15 0.95 0.66Emerging Market Funds 2.12 2.19 1.39 2.21 1.39 0.57All Funds in Universe 1.28 1.31 0.79 1.33 0.81 0.72 0.42
IB. Expense Ratio - Weighted by Assets ALL ACTIVE PASSIVEALL RETAIL INSTIT. RETAIL INSTIT. RETAIL INSTIT.
Domestic Stock Funds 0.93 0.94 0.51 0.99 0.85 0.31 0.19Domestic Bond Funds 0.80 0.82 0.53 0.82 0.54 0.25 0.31International Stock Funds 1.18 1.19 0.96 1.20 0.97 0.42 0.68Emerging Market Funds 1.75 1.77 1.25 1.81 1.25 0.57 0.00All Funds in Universe 0.91 0.93 0.56 0.96 0.69 0.31 0.20
C. Total Expense Profile IncludingAnnualized Floads and Brokerage ALL ACTIVE PASSIVEFees - Weighted by Assets
ALL RETAIL INSTIT. RETAIL INSTIT. RETAIL INSTIT.Domestic Stock Funds 1.44 1.47 0.63 1.55 0.97 0.35 0.22Domestic Bond Funds 1.30 1.35 0.65 1.36 0.65 0.29 0.34International Stock Funds 1.83 1.87 1.08 1.89 1.09 0.45 0.71Emerging Market Funds 2.29 2.33 1.37 2.38 1.37 0.60_All Funds in Universe 1.44 1.48 0.68 1.62 0.71 0.35 0.23
ID. Number of Funds in 1997 F ALL ACTIVE PASSIVE IALL RETAIL INSTIT. RETAIL INSTIT. RETAIL INSTIT.
Domestic Stock Funds 1720 1597 123 1540 109 57 14Domestic Bond Funds 2165 2014 151 1996 149 18 2International Stock Funds 367 331 36 323 32 8 4Emerging Market Funds 127 1151 12 114 12 1 0|AII Funds in Universe 4252 39421 310 38591 290 831 20
E. Net Assets of Funds in 1997 ALL ACTIVE PASSIVEI(% of total assets) I
| ALL I RETAIL INSTIT. RETAIL INSTIT. RETAIL INSTIT.Domestic Stock Funds 60.3 95.7 4.3 89.6 2.1 6.1 2.2Domestic Bond Funds 30.0 93.2 6.8 92.0 6.7 1.2 0.1International Stock Funds 9.6 95.6 4.5 93.9 4.2 1.7 0.2Emerging Market Funds 0.8 95.6i 4.4 92.4, 4.4 3.3, 0.0All Funds in Universe 100.0| 94.91 5.1 90.71 3.71 4.21 1.4* International Stock Funds include Emerging Market Funds in this table.
43

TABLE 10
Determinants of Brokerage Fees as % of Assets (in basis points)
l 1 | g 2
Intercept 15.0 (3.09)* 14.0 (2.85)*'
Assets in $billion -0.8 (-1.60)** -0.2 (0.34)Asset 0.0 (1.36) 0.0 (1.99)**# Shareholders in 000's -0.1 (-1.59)Assets/Shareholders -0.4 (-1.15)
Assets in Fund Complex 0.0 (-3.01)* 0.0 (-2.69)*3 Year Net Return -0.5 (-4.03) _
# Year Gross Return -0.4 (-3.70)*3 Year Standard Deviation -0.1 (-0.61) -0.1 (-0.55)Bond -13.4 (-4.50) -13.2 (-4.41)*Small Cap 2.3 (0.83) 2.6 (0.94)Specialty -2.1 (-0.69) -1.9 (-0.61)International 22.8 (7.34)* 23.6 (7.59)*Emerging Market 62.2 (11.27)| 63.5 (11.52)*Institutional 0.9 (0.18) 0.6 (0.13)Initial Investment 0.0 (-0.13) 0.0 (-0.02)Index -4.7 (-0.85) -5.2 (-0.93)12bI fee <or =25 -1.5 (-0.61) -1.2 (-0.49)12b1 fee < 1, > .25 -23.0 (-5.06) -22.3 (-4.91)*Front load -0.7 (-0.26) 0.2 (0.09)Deferred Load 20.8 (4.93)* 21.0 (4.99)*Bank Advised -2.6 (-0.73) -2.9 (-0.80)Turnover 23.3 (17.29) 0.2 (17.33)*Fundage 0.2 (1. 74)** 0.2 (-1.85)***Adjusted R2 51.0 51.0N 760.0 760.0Dep Mean 26.2 26.2
*: significant at .5% level
**: significant at 5% level
***: significant at 10% level
44
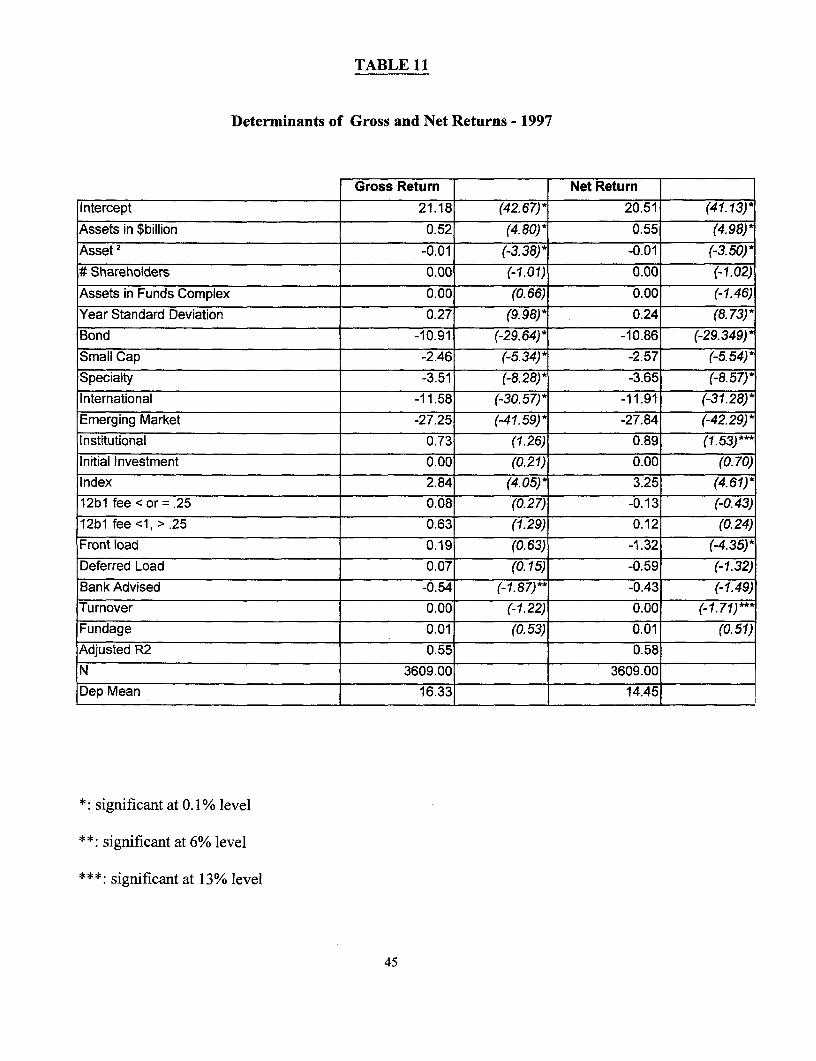
TABLE 11
Determinants of Gross and Net Returns - 1997
Gross Return Net ReturnIntercept 21.18 (42.67)* 20.51 (41.13)*Assets in $billion 0.52 (4.80)* 0.55 (4.98)*Asset 2 -0.01 (-3.38)* -0.01 (-3.50)*# Shareholders 0.00 (-1.01) 0.00 (-1.02)Assets in Funds Complex 0.00 (0.66) 0.00 (-1.46)Year Standard Deviation 0.27 (9.98)* 0.24 (8.73)*Bond -10.91 (-29.64)* -10.86 (-29.349)*Small Cap -2.46 (-5.34)* -2.57 (-5.54)*Specialty -3.51 (-8.28J* -3.65 (-8.57)*International -11.58 (_30.57)* -11.91 (-31.28)*Emerging Market -27.25 (-41.59)* -27.84 (-42.29)*Institutional 0.73 (1.26) 0.89 (1. 53)*-Initial Investment 0.00 (0.21) 0.00 (0.70)Index 2.84 (4.05) 3.25 (4.61)*12b1 fee < or = .25 0.08 (0.27) -0.13 (-0.43)12b1 fee <1,> .25 0.63 (1.29) 0.12 (0.24)Front load 0.19 (0.63) -1.32 (-4.35)*Deferred Load 0.07 (0.15) -0.59 (-1.32)Bank Advised -0.54 (-1.87)** -0.43 (-1.49)Turnover 0.00 (-1.22) 0.00 (-1.71)***Fundage 0.01 (0.53) 0.01 (0.51)Adjusted R2 0.55 0.58N 3609.00 3609.00Dep Mean 16.33 14.45
*: significant at 0. 1% level
**: significant at 6% level
***: significant at 13% level
45
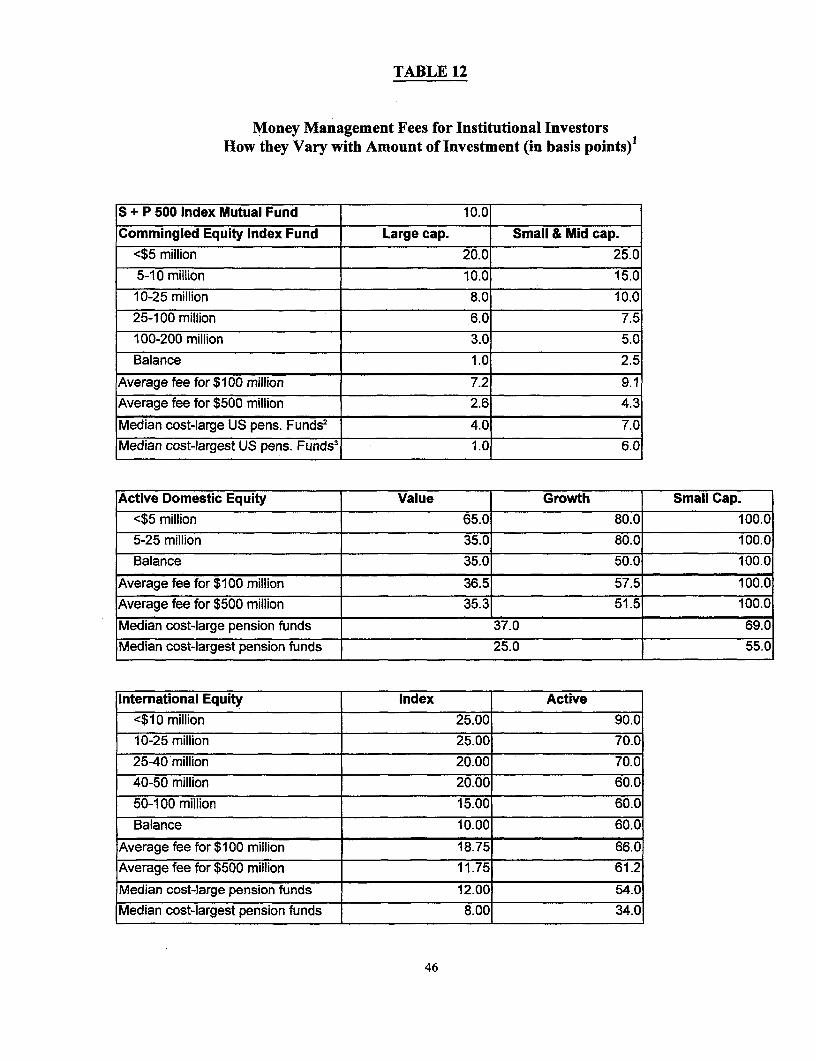
TABLE 12
Money Management Fees for Institutional InvestorsHow they Vary with Amount of Investment (in basis points)'
S + P 500 Index Mutual Fund 10.0
Commingled Equity Index Fund Large cap. Small & Mid cap.<$5 million 20.0 25.0
5-10 million 10.0 15.010-25 million 8.0 10.0
25-100 million 6.0 7.5100-200 million 3.0 5.0
Balance 1.0 2.5
Average fee for $100 million 7.2 9.1Average fee for $500 million 2.6 4.3
Median cost-large US pens. Funds2 4.0 7.0Median cost-largest US pens. Funds3 1.0 6.0
Active Domestic Equity Value Growth Small Cap.<$5 million 65.0 80.0 100.05-25 million 35.0 80.0 100.0Balance 35.0 50.0 100.0
Average fee for $1 00 million 36.5 57.5 100.0Average fee for $500 million 35.3 51.5 100.0
Median cost-large pension funds 37.0 69.0Median cost-largest pension funds 25.0 55.0
International Equity Index Active<$10 million 25.00 90.010-25 million 25.00 70.0
25-40 million 20.00 70.040-50 million 20.00 60.0
50-100 million 15.00 60.0
Balance 10.00 60.0
Average fee for $100 million 18.75 66.0Average fee for $500 million 11.75 61.2
Median cost-large pension funds 12.00 54.0Median cost-largest pension funds 8.00 34.0
46

Emerging Market Index Active<$50 million 40 100
Balance 40 s
Average fee for $100 million 40 90Average fee for $500 million 40 82Median cost-large pension funds 23 77Median cost-largest pension funds 12 70
Fixed income Index Active<$25 million 12.0 3025-50 million 8.0 2450-100 million 5.0 17Balance 3.0 12
Average fee for $100 million 7.5 22Average fee for $500 million 3.9 14Median cost-large pension funds 6.0 24Median cost-largest pension funds 5.0 25
Other asset management costs forinstitutional investorsIntemal administrative costs:
- median cost-large pension funds 6- median cost-largest pension funds 2
Brokerage costs:
- median cost-large pension funds 10- median cost-largest pension funds 7
1. Sliding scale fees for institutional commingled funds, the BT Pyramid funds, were graciouslysupplied by Bankers Trust, a large money manager of indexed and actively managedinstitutional funds. Data on large US pension funds is from: "Cost Effectiveness PensionFund Report", prepared by CEM, 1997 for CALPERS
2. These are median costs of external money management for given type of assets, reported by167 large US pension funds ranging in size from less than $100 million to over $100 billion.Median fund = $1.5 billion. Average of 14 external money managers per fund, managing$194 million each, median amount managed per manager = $113 million
3. These are median costs for 10 largest US pension funds, excluding Calpers, ranging in sizefrom $29-65 billion. Average of 34 external money managers per fund managing $646million each ($543 million median)
4. Internal administrative costs of money management, such as executive pay, consultants,performance measurement, custodial arrangements, trustees and audits.
47

TABLE 13
Transfer Agent Costs in $'s per Account
1991 1993 1995
Cost per account 21.55 22.77 20.93
- 80% range $8-$38 $10-$36 $10-$32
Cost per open account 24.76 25.92 25.09
- if extemal 23.08 24.56 23.42
- if intemal 25.34 26.39 25.64
- if equity 20.31 22.52 21.89
- if money market 31.27 30.28 28.83
- if sales through affiliated broker 13.63 15.07 16.57
- if direct market-retail 29.31 34.01 32.61
Cost per account (all)
- if dividends paid annually 17.12 20.77 19.30
- if dividends paid monthly 23.94 24.94 22.29
Source: Investment Company Institute and Coopers Lybrand. Mutual Fund Transfer Agents.1995 & 1997
48
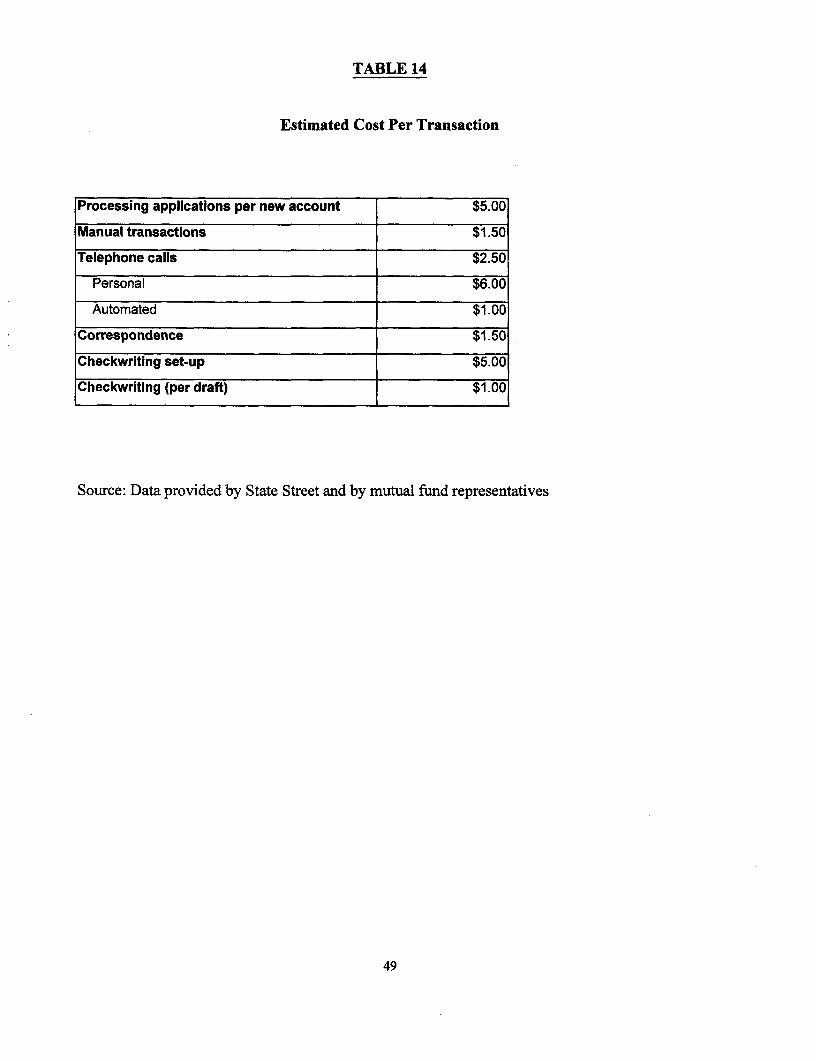
TABLE 14
Estimated Cost Per Transaction
Processing applications per new account $5.00
Manual transactions $1.50
Telephone calls $2.50
Personal $6.00
Automated $1.00
Correspondence $1.50
Checkwriting set-up $5.00
Checkwriting (per draft) $1.00
Source: Data provided by State Street and by mutual fund representatives
49

TABLE 15
Evidence of Cross-Subsidization and Absence of Incentives to Economize
l 1989 1991 1993 l 1995
% transfer agents charging mutual fund:
Flat fee per account 46 48 52 56
Flat plus transaction 30 24 15 12
Asset-based 0 4 8 9
Other 24 24 25 23
Composition of charges (as %of total fee)
Basic fee 67 78 77 79
Transaction + other 33 22 23 21
|°/ Complexes charging shareholders fee for:
l < Fee ($)
Account- Maintenance2.9 11.00
|Checkwriing j4.4 7.33
Exchanges 2.9 8.75
Low Balance 17.4 13.08
Transcript 28.4 12.89
Wire 45.6 7.44
IRA 80.6 13.19
Source: Investment Company Institute and Coopers Lybrand. Mutual Fund Transfer Agents.1995 & 1997
50

TABLE 16
Hypothetical Annual Cost per Account of Record Keeping and Service to Members(as percentage of assets)
Typical Direct Market IA System with CentralMutual Fund (in $) Clearinghouse (in $)
Account set up (annualized)' 1.00 0.05
Annual record keeping and up-date 1.00 1.00
Personal phone calls2 6.00 2.00
2 automated phone calls per account 2.00 2.00
4 quarterly statements 6.00 X
1 annual statement or tax statement 1.50 1.50
2 transactions with written confirmation 5.00 5.003
1 dividend + capital gains distribution with statement 2.50 1.004
Distribution of prospectus and annual report 2.50 1.005
Queries and mailing about other funds in complex 2.50
General educational material 2.50
Total 30.00 16.05
Source: State Street mutual fund representatives and authors' own calculations.
1. We assume that the investor switches to a new mutual fund every 7 years but would stay ina centralized clearinghouse of an IA system for 40 years.
2. We assume 1 phone call per year per account in mutual fund, 1/3 per account in IA system.
3. Possible fee for additional transactions.
4. Dividends and capital gains are credited to account in IA system and are included in annualstatement.
5. 2 page statement substitutes for prospectus.
51
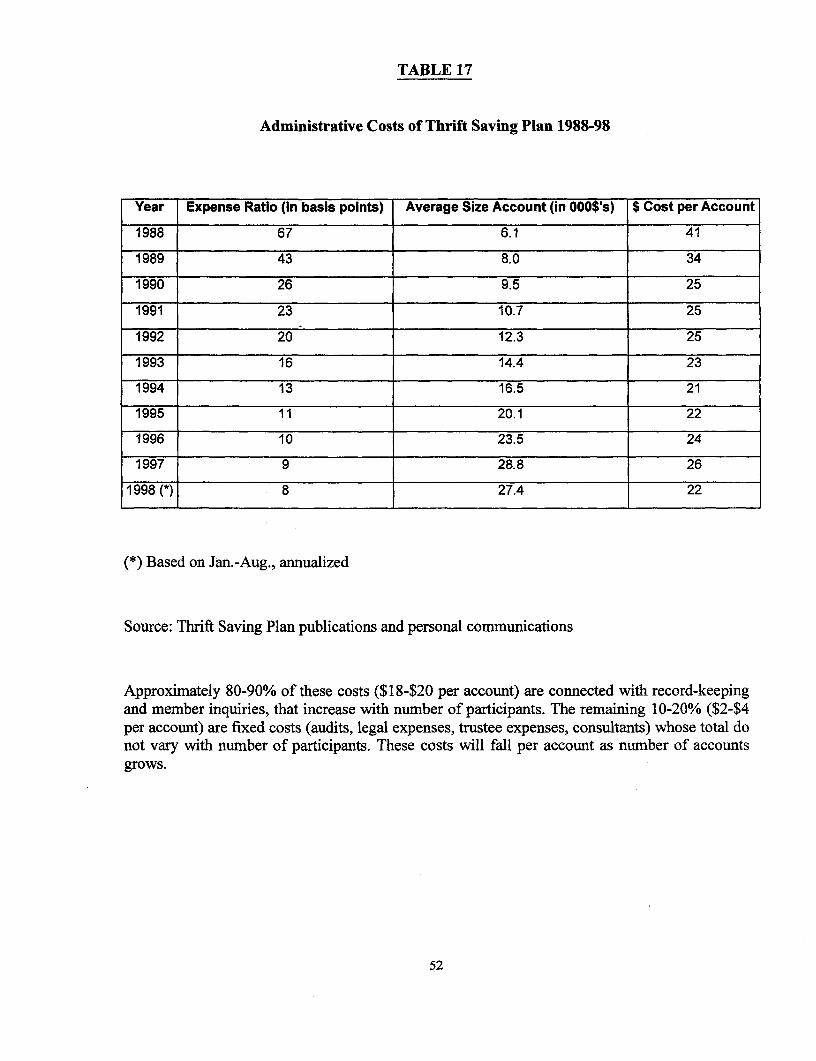
TABLE 17
Administrative Costs of Thrift Saving Plan 1988-98
Year Expense Ratio (in basis points) Average Size Account (in OOO$'s) $ Cost per Account
1988 67 6.1 41
1989 43 8.0 34
1990 26 9.5 25
1991 23 10.7 25
1992 20 12.3 25
1993 16 14.4 23
1994 13 16.5 21
1995 11 20.1 22
1996 10 23.5 24
1997 9 28.8 26
1998 (*) 8 27.4 22
(*) Based on Jan.-Aug., annualized
Source: Thrift Saving Plan publications and personal communications
Approximately 80-90% of these costs ($18-$20 per account) are connected with record-keepingand member inquiries, that increase with number of participants. The remaining 10-20% ($2-$4per account) are fixed costs (audits, legal expenses, trustee expenses, consultants) whose total donot vary with number of participants. These costs will fall per account as number of accountsgrows.
52

TABLE 18
Annual Costs as % of Average Account over Time (*)
r=3% r=5%
Year Year-end R & C exp. As Year-end R & C exp. as R&C+
Accumulation % of assets Accumulation % of assets other costs
in thousands $'s (basis points) in thousands $s (basis points) ($)
0 0.0 0 0.0 0 20
1 0.5 404 0.5 396 20
2 1.0 199 1.0 193 20
3 1.5 131 1.6 126 21
4 2.1 96 2.2 92 21
5 2.6 76 2.8 72 21
10 5.7 35 6.4 31 23
15 9.2 22 10.9 18 25
20 13.3 15 16.7 12 28
25 18.0 11 24.1 8 32
30 23.5 8 33.6 6 37
35 30.0 7 45.6 4 43
40 37.3 5 61.0 3 50
Average in
steady 15.5 13 21.9 9 31
(*) Assumptions: $500 is contributed each year. Record keeping and communication (R & C) costs are$20 per account
"Other costs" are money management, brokerage costs and marketing expenses for large capindex funds, estimated to be 5 basis points (see Tables 12 and 19)."Other costs" would be 40 - 70 basis points for actively managed funds (see Table 19).'R&C + other costs' are calculated for assets accumulated if r = 5%.

TABLE 19
Costs of Retail, Institutional and Constrained Choice Compared(in basis points)
Retail Institutional Constrained Choice
Passive Active Passive Active Passive Active
Asset management 8 52 1 - 5 25 - 55 1 - 5 25 - 55
Marketing 3 65 1.0 5
R&C 5 12 - - 9 9
Brokerage fee and other 16 20 3 10 3 10
Total cost 32 150 4 - 8 35- 65 14-18 49 - 79
$ cost per average account
in steady state $70 $329 $9 -18 $77 -142 $31 - 39 $106 -172
Retail costs are taken from Table 4.
Institutional costs are from Table 12.
Constrained choice costs are from Table 12 and 18
Advertising costs under constrained choice are based on assumption that fee ceilings or biddingprocess will keep them low.
54
Endnotes
We concentrate on the asset accumulation phase, since annuities pose a host of other issues.We do not include the cost of PAYG schemes in this analysis since (unlike transfer systems)funded schemes either represent additional saving or diversions from other savings that wouldhave incurred costs. Well-managed funded schemes cost more than well-managed PAYGschemes because they provide an additional service-the management of savings. Savingsprovide productive value to the economy that we do not get from PAYG schemes and some ofthis value is passed on to workers in the form of higher retirement benefits than they could getfrom the same contribution to a PAYG scheme. This paper is about how to manage thosesavings, not about whether or not to save.
2A centralized fund has just been established in Canada, except that the government sets adefined benefit instead of a rate of return. In the U.S., which is now debating the issue, opinionis divided between those who want to follow the Canadian example in a pure DB system andthose who prefer worker choice in a partial DC IA system.
3 The recent spate of mergers in Chile, has decreased the number of AFP's from 21 in the early1990's to eight currently. In Argentina the number has fallen from 25 to 16 and will probablyfall further. This suggests the market is gradually responding to economies of scale-as in theU.S. mutual fund industry.
4 These fees cover most expenses of asset management, marketing and record-keeping, plusAFP profits. They do not include brokerage fees, which are covered by the AFP's and reducetheir profits.
5 Average brokerage costs were estimated on the basis of a subset of funds that reported thesedata for 1997. The unweighted and weighted averages were 26 and 12 basis points, respectively.
Annualized front-loaded sales commissions were estimated as .2 time the front-loadedcommission on new sales. An annualization factor of .2 was used to convert a one-time fee intoits annual present-value equivalent, assuming that the average investment is kept in the fund for7 years and the discount rate is 10%. A high discount rate is used because the alternative forthese investors may be an additional mutual fund purchase, over a period in which the 3-yearasset-weighted net return was 20%. The annualization factor and annualized fee are not verysensitive to the discount rate; a discount rate of 5% would have made a difference of only 3 basispoints.
The 7-year average holding period is a guestimate, since good data are not available on thisvariable. A sample of redemption rates for equity funds purchased in 1974 showed that 50% oforiginal shares were sold within 5 years and 76% within 15 years, which is roughly consistentwith our 7 year assumption. (Wyatt Company 1990). However, the mutual fund industry and itsclientele have changed substantially since 1974 so it is likely that redemption behavior has alsochanged. An average holding period of 10-12 years would have reduced the annualized fee by 5-10 basis points, while an average 5 year holding period would have increased it by a similaramount.
55

Holding periods and therefore annualization factors may vary among funds. For example,evidence suggests that loads discourage movements out of funds so the holding periods of fundswith loads may be higher than average (Ippolito 1992 and Chordia 1996). However, we did nothave the disaggregated data that would allow us to take these differences into account.
Back-loaded sales charges are omitted from this calculation because they fall as a function oftime the shares are held. Investors self-select into funds with back-loads if they expect to holdtheir shares for long periods. The average Dload paid for assets held more than 5 years isnegligible and we do not have a more detailed distribution of holding periods. This omissionslightly understates total costs.
The total fund expense profile calculated here is very similar to the total shareholder cost ratiocalculated by Rea and Reid 1998, although they use slightly different datasets and definitions.The most important differences are that they deal only with equity funds (which are moreexpensive than bond funds) and they do not include brokerage fees in their measure, probablybecause they are interested in changes through time and data on brokerage fees were not reportedbefore 1996. These two effect may cancel themselves out, in terms of a comparison with ournumbers. Their simple average cost ratio is 1.99% and their asset-weighted average is 1.44%,which is very similar to our numbers of 1.85% and 1.43%, respectively. According to theircalculations, marketing fees are 40% of total costs, while in our calculations (which includebrokerage costs in the denominator) the simple avererage is 36% and the weighted average is43%.
6 The no-load is T. Rowe Price. The four companies that deal through brokers and otherintermediaries are Franklin Resources, Eaton Vance, Waddell and Reed and Alliance Capital.Other publicly traded management companies are conglomerates whose money managementfunctions are not separated from their other businesses, in their financial reports.
' For the small IA system currently under consideration in the U.S., average mutual fund fees of1% would not cover the real marginal R&C cost of the bottom half of the worker population formore than 5 years. Fees in low priced index funds would not cover these costs for more than 20years. So, these funds or their counterparts are unlikely to serve as asset managers for smallaccounts if the R&C function is decentralized. They might, however, welcome their assetmanagement business if R&C is carried out and paid for elsewhere. Also see endnote 10.
8 This $20 figure is an estimate of what a modest R&C service package would cost, based onactual TSP costs and transfer agent costs. In contrast, the $50 number in Diamond 1998 isDiamond's estimate of the political equilibrium, under the assumption that political pressureswill drive up service levels and costs. While we do not try to estimate a political equilibrium-which is highly subjective-it should be noted that the equilibrium service level and cost can beinfluenced by process and disclosure. For example, if the charge is prominently displayed on theannual statement, if the basic service is financed by cross-subsidization from large to smallaccounts via an asset-based fee, and if services are unbundled so that incremental services arepaid for by the user, the political equilibrium may result in a relatively small common servicecharge.
56

Also, Diamond's $50 may include some of the costs we cover in a different category. Our totaldollar cost for an average account in steady state, including money management and brokeragefees which are tied to money management, is $29-$37 for passive management and $96-$162 foractive management. These costs would hold when the average account size is $21,900 (in 1999dollars).
9 One factor that keeps TSP costs low is the absence of an 800 number for personalized phonecalls. Member can call, but must pay the long distance toll charges themselves. On these terms,TSP receives about 1 personalized phone call for every two members per year, many of them inconnection with loans and withdrawals.
10 It may be useful to compare the cost of passive management under constrained choice with thecost of the S&P index funds offered by Vanguard and Fidelity to individuals and institutions.These are among the lowest cost mutual funds available, marketing themselves to a cost-conscious clientele and making business strategy and cost allocation decisions accordingly.Their marketing expenses are kept low by the absence of 12bl fees, front loads or back loads.The Vanguard institutional fund has a 6 basis point expense ratio and we impute 3 basis points inbrokerage fees, bringing the total cost to 9 basis points. The Vanguard and Fidelity S&P indexfunds have an expense ratio of 19 basis points plus an imputed 3 basis points for brokerage fees,bringing the total to 22 basis points. (Actually, Fidelity's fees are higher but fees above 19 basispoints have been waived to enable them to compete with Vanguard. Asset management forFidelity's index fund has been contracted out to Banker's Trust for less than 1 basis point).
In contrast, for an IA system under constrained choice we have estimated a cost of 14 basispoints for passive management of large cap stocks, including brokerage fees. The IA systemwould be 5 basis points more expensive than the institutional fund because of the greater record-keeping and communications costs associated with numerous individual accounts. The IAsystem would be 8 basis points cheaper than the index funds for individual investors because ofthe lower level of service provided by centralized R&C, the spreading of fixed costs across alarger asset base, and the bulk buying power of large money blocs.
Importantly, for the first 15 years of the IA system most accounts will be below the $10,000minimum investment required by Fidelity and Vanguard for these funds. This minimuminvestment was set by Fidelity and Vanguard precisely because of the R&C cost per account,discussed in the text. Smaller investors are either excluded or required to pay an additional $10fee, equivalent to another 10-100 basis points depending on account size, to help cover R&C. Ingetting access to a similar index fund without this fee, small investors thus have an investmentopportunity under a constrained choice IA system with centralized R&C that they did not have,or that would have been much more expensive for them, in the retail market.
57

Bibliography
Baumol, William J., Stephen M. Goldfeld, Lilli A. Gordon and Michael F. Koehn. 1990. TheEconomics of Mutual Fund Markets: Competition Versus Regulation. Boston, MA: KluwerAcademic Publishers.
Capon, Noel, Gavan J. Fitzsimmons and Russ Alan Prince. 1996. "An Individual LevelAnalysis of the Mutual Fund Investment Decision." Journal of Financial Services Research 10:59-82.
Carhart, Mark M. 1997. "On Persistence in Mutual Fund Performance." Journal of Finance52(1): 57-82.
Chance, Don M. and Stephen P. Ferris. 1991. "Mutual Fund Distribution Fees: An EmpiricalAnalysis of the Impact of Deregulation." Journal of Financial Services Research 5: 25-42.
Chordia, Tarun 1996. "The Structure of Mutual Fund Charges." Journal of Financial Economics41: 3-39.
Collins, Sean and Phillip Mack. 1997. "The Optimal Amount of Assets under Management inthe Mutual Fund Industry." FinancialAnalysts Journal 53(5): 67-73.
Dermine, Jean and Lars-Hendrik R6ller. 1992. "Economies of Scale and Scope in FrenchMutual Funds." Journal of Financial Intermediation 2: 83-93.
Diamond, Peter. 1998. "Administrative Costs and Equilibrium Charges with IA's." NBERConference on Administrative Costs. Cambridge, MA.
Elton, E.J., M.J Gruber, S. Das, M. Hlavka. 1993. "Efficiency with Costly Information: AReinterpretation of Evidence from Managed Portfolios." The Review of Financial Studies 6(1):1-22
Ferris, Stephen P. and Don M. Chance. 1987. "The Effect of 12b-1 Plans on Mutual FundExpense Ratios: A Note." Journal of Finance 42(4): 1077-1082.
Goldberg, Fred T. Jr. and Michael Graetz. 1998 "Reforming Social Security: How to ImplementA Practical and Workable System of Personal Retirement Accounts." NBER Conference onAdministrative Costs, Cambridge MA.
Gruber, Martin J. 1996. "Another Puzzle: The Growth of Actively Managed Mutual Funds."Journal of Finance 51(3): 783-810.
Ippolito, Richard A. 1992. "Consumer Reaction To Measures of Poor Quality: Evidence fromthe Mutual Fund Industry." Journal of Law and Economics 35:45-70.

Kihn, John. 1996. "To Load or Not to Load? A Study of Marketing and Distribution Chargesof Mutual Funds." Financial Analysts Journal 52(3): 28-36.
Lipper, Michael. 1994. "The Third White Paper: Are Mutual Fund Fees Reasonable?" NewYork, NY: Lipper Analytical Services.
Livingston, Miles and Edward S. ONeal. 1996. "Mutual Fund Brokerage Commissions."Journal of Financial Research 19(2): 273-292.
McLeod, Robert W. and D. K. Malhotra. 1994. "A Re-Examination of the Effects of 12b-1Plans on Mutual Fund Expense Ratios." Journal of Financial Research 17(2): 231-240.
Malhotra. D.K. and Robert W. McLeod. 1997. "An Empirical Analysis of Mutual FundExpenses." Journal of Financial Research 20(2): 175-190.
Malkiel, Burton G. 1995. "Returns from Investing in Equity Mutual Funds 1971 to 1991."Journal of Finance 50(2): 549-572.
Muralidhar, Arun S. and Robert Weary. "The Greater Fool Theory of Asset Management orResolving the Active-Passive Debate." WPS98-020. Washington DC: The World Bank.
O'Neal, Edward S. 1998. "Mutual Fund Load Structures and Adverse Dealer Incentives."Washington, DC: U.S. Securities and Exchange Commission, mimeo.
Patel, Jayendu, Richard J. Zeckhauser and Darryll Hendricks. 1994. "Investment flows andperformance: evidence from mutual funds, cross-border investments, and new issues." In RyuzoSato, Richard M. Levich, and Rama V. Ramachandran, eds., Japan, Europe, and InternationalFinancial Markets: Analytical and Empirical Perspectives. New York, NY: CambridgeUniversity Press.
Rea, John D. and Brian K. Reid. 1998. "Trends in the Ownership Cost of Equity Mutual Funds."Perspective 4: 1-15. Washington, DC: Investment Company Institute.
Report by the Comptroller and Auditor General. 1997. "The Contract to Develop and Operate theReplacement National Insurance Recording System." London: National Audit Office. HMSO.
Shukla, Ravi K. and Gregory B. van Inwegen. 1995. "Do Locals Perform Better ThanForeigners?: An Analysis of UK and US Mutual Fund Managers." Journal of Economics andBusiness 47: 241-254.
Sirri, Erik R. and Peter Tufano. 1993. "Competition and Change in the Mutual Fund Industry."In Samuel B. Hayes III, ed., Financial Services: Perspectives and Challenges. Boston, MA:Harvard Business School Press.
Sirri, Erik R. and Peter Tufano. 1997. "Costly Search and Mutual Fund Flows," mimeo.
Trzcinka, Charles and Robert Zweig. 1990. "An Economic Analysis of The Cost and Benefitsof S.E.C. Rule 12b-1." Monograph Series in Finance and Economics. New York, NY:Salomon Brothers Center for the Study of Financial Institutions, New York University.
Wyatt Company. 1990. "Investment Company Persistency Study Conducted for the NationalAssociation of Securities Dealers."

Policy aesserc Working Paper Series
ContactT tlra Auth;r Date for paper
WPS2085 onitoring Banking Sector FragOi3i As5i Demirg0rKunt March 1999 K. LabrieA Multivariate Logit Approach with Enrica Detraciache 31001an ADppication to the 1996-97Banki1 g Crises
WPS2086 Deregulating Technology Transfer David Gisselquist March 1999 L. Tabadair Agricuiture: Reform's Impact Cari Pray 36896on Turkey in the 1980s
WPS2087 Mai-Femaje Differences in Labor Peter F. Orazem March 1999 S. FallonMarkst Outcormes during the Early Milan vodopivec 38009Transitivn to Markat: The Case ofEstonia and Sloveniz
WPS2088 Expropriation of Minority Stij3n C'aessens March 1999 R. VoShareholders: Evidence from Simeon Djankov 3S'22East Asia Josepn P. 1 Fan
Larry H. P. Lang
WPS20u9 Corporate Diversifcation in East Asia: Stihn Claessens March 1999 R. VoThe Role of Ultimate Ownera;hip and Simeon Djankov 33722Group Affilica'tion doseph P. H. Far
La,ry H, P. Lang
WPS2090 Risks Lessons Learned, and -Don3ald F. Larson March 1999 P. KokilaSecondary Markets for Greenhousae Paul Parks 33716G:s Reductions
WPS20S93 Beyond Unequal iDevelopmernm: Andr6s Solimano March 1999 A. SolimanoAn Oveniw 87671
W'S2092 vlir.&Ml Does Aid to Africa Finance? Shan'ayanan Devarajan March 1999 C. BernardoAndrew Sunil Rajkumar 31148Vinaya Swaroop
WP820G3 Free Entry in unfrastructure David Ehrhardt March 1999 R. BartolomeRebecca Burdon 35703
WPS2094 'VYK hatTriggers Market Jitters. Graciela L. Kaminsky April 1999 S. Hoi.A Chronicle of the Asian Crisis Sergio L. Schmukler 37359
WPTS2095 Ten Years of PostSooialist Lessons Grzagorz W. Kolodko April 1999 J. Prochnow-Waikerfor Poiicy Reformn 37466
WPS2096 Reforming the Urban Transport Jorge M. Rebelo April 1999 A. TurnerSecior in the Rio, de Janeiro 30933Me.,politaon Regioni: A Case SttudyIn Concessions
Policy Research Working Paper Series
ContactTitle Author Date for paper
WPS2097 The Theory of Access Pricing: Tommaso M. Valletti April 1999 G. Chenet-SmithAn Overview for Infrastructure Antonio Estache 36370Regulators
WPS2098 Reconsidering the Evidence Madhur Gautam April 1999 M. Gautamon Returns to T&V Extension Jock R. Anderson 30442in Kenya