mutual fund reviewcontent.icicidirect.com/mailimages/icicidirect_monthlymf...icici securities ltd. |...
TRANSCRIPT

Mutual FundReview
October 20 2009 | Mutual Fund October 20 2009 | Mutual Fund October 20 2009 | Mutual Fund
November 19, 2009 | Mutual Fund Mutual Fund Review
July 21, 2015
ICICI Securities Ltd. | Retail MF Research
Note: Whenever, returns for the scheme are shown in the report, they are for the growth option of the scheme.
Mutual Fund Review
Equity Markets ....................................................................................... 2 Debt Markets.......................................................................................... 3 MF industry synopsis ............................................................................ 4 MF Category Analysis............................................................................ 5
Equity funds...................................................................................... 5
Equity diversified funds....................................................................... 6 Equity Infrastructure fund.................................................................... 7 Equity Banking Funds.......................................................................... 8 Equity FMCG........................................................................................ 8 Equity Pharma Funds .......................................................................... 9 Equity Technology Funds.................................................................... 9
Exchange Traded Funds (ETF) ....................................................... 10 Balanced funds ............................................................................... 11 Monthly Income Plans (MIP) .......................................................... 11 Arbitrage Funds .............................................................................. 12 Debt funds ...................................................................................... 13
Liquid Funds ...................................................................................... 14 Income funds..................................................................................... 15 Gilt Funds ........................................................................................ 16 Gold ETFs: Medium term outlook benign......................................... 17 Model Portfolios .................................................................................. 18
Equity funds model portfolio.......................................................... 18 Debt funds model portfolio ............................................................ 19
Top Picks.............................................................................................. 20
July 21, 2015

ICICI Securities Ltd. | Retail MF Research
Page 2
Equity Markets Update
Indian equity markets recovered sharply by around 8% from the lows in the first half of June 2015. After having corrected around 10% from March to June, markets witnessed a smart recovery recouping a majority of its losses since then
Overall, the Indian equity markets have been consolidating since the start of calendar year 2015 but have been volatile. Globally, geo-political developments surrounding Greece, expectations over a US Fed rate hike, growth concerns over China leading to a sharp correction in commodity prices and Iran nuclear deal development were the main drivers of global capital market volatility
Domestically, progress over monsoons, government policy measures and quarterly results added to the overall volatility in the domestic equity markets since the start of the calendar year
Worries over monsoons have receded with rainfall, so far, being satisfactory and near its long term average. Going forward, July needs to be closely watched as it receives ~33% of the total seasonal rainfall. Its distribution and quantum will decide the impact of the current monsoon season on the domestic agricultural economy
Sowing, domestically, has, however, been upbeat post the initial spell of rains with cumulative sowing at ~31 million hectares (MH) in June 1- July 3, 2015 vs. 19 MH in the corresponding period last year. The same may ease inflationary concerns, going forward. It also helped the RBI adopt a more dovish stance with respect to a further cut in interest rates
Outlook
The monsoon session of Parliament is likely to be stormy given a few controversies surrounding the government. The same may prevent the passage of the much anticipated bills like GST and Land Acquisition bills. Non passage of these bills may impact market sentiments
The quarterly results, so far, have been muted while the results for the coming quarter (Q1FY16) are also expected to be muted with low single digit growth in topline and bottomline. However, on a yearly basis, we expect Sensex earnings to grow at ~18.3% each in FY16E and FY17E to | 1608 and | 1901, respectively
Corporate India is witnessing green shoots in terms of recovery and flow of operating leverage (increase in utilisation levels, change in favourable product mix and lower input costs) and financial leverage (improvement in working capital cycle and lower rates). This may gradually translate to improved profitability in a few quarters
Structurally, the outlook for the Indian equity markets has improved significantly. This is on the back of a steep correction in commodities, especially crude oil & industrial metals, a 75 bps repo rate cut and subsequent transmission of the same to the corporate balance sheets and relatively stable exchange rates. However, some volatility is likely to be positive for Corporate India. The effect of the above will further accelerate positively on the performances of companies across sectors going into the second half of FY16E
We expect markets to remain in a consolidation mode and undergo a base building process in the coming months amid volatility on global news flows and the result season. Any sharp correction should be utilised to build the equity portfolio
CNX Nifty: Volatility increases in last few months
6500
7000
7500
8000
8500
9000
Jul-1
4
Aug-
14
Sep-
14
Oct-1
4
Nov
-14
Dec-
14
Jan-
15
Feb-
15
Mar
-15
Apr-1
5
May
-15
Jun-
15
Jul-1
5
Source: Bloomberg, ICICIdirect.com Research
Positive returns across indices…
10.6
9.9
7.9
7.6 7.
0
0.02.04.06.08.0
10.012.0
BSEMidcap
BSESmallCap
BSE 500 BSE 100 BSESensex
Retu
rn (%
)
Source: Bloomberg, ICICIdirect.com Research Returns : June 15, 2015– July 16, 2015
Healthcare shows maximum gain
13.8
11.7
11.3
10.0
7.7
7.0
6.4
5.9
5.2
4.5
0.7
-1.0
-202468
10121416
Heal
thca
re
Cap.
Good
s
Con.
Dura
Bank
ing
FMCG
Sens
ex
Oil &
Gas
PSU
Aut
o
Real
ity IT
Met
al
Retu
rn (%
)
Source: Bloomberg, ICICIdirect.com Research Returns : June 15, 2015– July 16, 2015
Research Analyst
Sachin Jain [email protected] Sheetal Ashar [email protected] Isha Bansal [email protected]

ICICI Securities Ltd. | Retail MF Research
Page 3
Debt Markets Update
The Indian debt market witnessed a sharp sell-off during June 2015 in spite of the rate cut by the Reserve Bank of India in its June 2 policy meeting. Bond yields rose 20-25 bps across the yield curve. The sell-off in Indian bonds can be attributed to the global bonds sell-off with the RBI's hawkish policy tone lowering future rate cut expectations
Concerns over below normal monsoons and their impact on food inflation also dampened investor’s sentiments. India, as a whole, received a decent spell of rainfall in the initial period of crop sowing with rainfall in June 1-24, 2015 at 24% of long period average (LPA). The spell of rainfall has, however, weakened in the last 15 days with cumulative rainfall in June 1 – July 5, 2015 at 0% of LPA. Going forward, July needs to be closely watched as it receives ~33% of the total seasonal rainfall. Its distribution and quantum will decide the impact of the current monsoon season on domestic agricultural economy
Amid negative domestic and global news flows, the structural improvement on the fiscal management and supply side concerns continues:
a Domestically, sowing has, however, been upbeat post the initial spell of rains with cumulative sowing at ~31 million hectares (MH) in June 1-July 3, 2015 vs. 19 MH in the corresponding period last year. The sowing has been robust in pulses (up 133% YoY), oilseeds (up 404% YoY) and cotton (up 70% YoY) crops with special emphasis on pulses wherein the central government has announced a special bonus in terms of enhanced MSPs for growing pulses that are largely imported for domestic consumption
b The MSP increase has been quite moderate for domestic agri crops (3.7% YoY for paddy, 1.3% YoY for cotton)
c The Central government through its various initiatives like Pradhan Mantri Krishi Sinchai Yojana (PMKSY) is emphasising on increasing the farm productivity with special focus on increasing the irrigation penetration and optimal utilisation of water resources including implementation of micro-irrigation (MIS) technique
d The government has approved setting up of an online national agriculture market that will provide more options to farmers for selling their produce
Outlook
The Reserve Bank of India has cut the benchmark repo rate by 75 bps in the last six months while the yield on government securities is at the same levels as they were at the start of 2015
The Indian debt markets remain attractive from a medium-term perspective as the inflation trend remains on a downward trajectory and well within RBI’s target range
Investors may consider both duration funds as well as accrual funds depending on their risk return profile
We remain positive on the Indian debt markets as it is well placed to benefit from the structural improvement in macroeconomic data
G-Sec yields turn volatile after rallying significantly in last year
7.5
8.0
8.5
9.0
Jul-1
4
Aug-
14
Sep-
14
Oct-1
4
Nov
-14
Dec-
14
Jan-
15
Feb-
15
Mar
-15
Apr-1
5
May
-15
Jun-
15
Jul-1
5
Yiel
d (%
)
Source: Bloomberg, ICICIdirect.com Research
Fiscal roadmap Fiscal Deficit as % of GDP TargetFY15 (Revised Estimates) 4.1FY16 3.9FY17 3.5FY18 3.0
Source: RBI, ICICIdirect.com Research
G-sec yield curve shifts lower
7.6
8.07.8
7.9
8.1
7.7
7.9 7.9
7.4
7.6
7.8
8.0
8.2
1yr 3yr 5yr 10yr
Yiel
d (%
)
15-Jul-15 15-Jun-15
Source: Bloomberg, ICICIdirect.com Research
Corporate bond yield follows G-sec
8.3
8.4
8.6
8.4 8.5
8.58.6
8.18.28.38.48.58.6
1yr 3yr 5yr 10 yr
Yiel
d (%
)
15-Jul-15 15-Jun-15
Source: Bloomberg, ICICIdirect.com Research

ICICI Securities Ltd. | Retail MF Research
Page 4
MF industry synopsis In June 2015, assets under management (AUM) grew 20% YoY to
| 1173294 crore with share of equity oriented funds at 32% from 25% in June 2014. Total net inflows in MFs were muted with outflows of | 25085 crore in June 2015 due to substantial outflow from liquid funds
Inflows into equity schemes continue to be strong at | 12273 crore during June 2015. Income funds received | 5861 crore of net inflows during June 2015. However, outflow to the tune of | 47330 crore from money market funds resulted into muted total net inflows
Exhibit 1: Equity AUM drives overall AUM
1006
452
1012
824
9594
15
1095
653
1090
309
1051
343
1181
356
1082
807
1203
547
1186
364
9747
15
1202
196
1173
294
20%
32% 32%29%
31%
23%
27%31% 31% 31%
25%
19% 20%
0%
5%
10%
15%
20%
25%
30%
35%
Jun-
14
Jul-1
4
Aug-
14
Sep-
14
Oct-1
4
Nov
-14
Dec-
14
Jan-
15
Feb-
15
Mar
-15
Apr-1
5
May
-15
Jun-
15
| Cr
ore
0
200000
400000
600000
800000
1000000
1200000
1400000
Total AUM (RHS) Growth (YoY)
Source: Company, ICICIdirect.com Research
Exhibit 2: AUM share June 2014
Income48%
Gilt1%
Money Market22%
Gold ETFs 1%
Equity25%
Other ETFs1%
FOF(Overseas)0% Balanced
2%
Source: AMFI, ICICIdirect.com, Research
Exhibit 3: AUM share June 2015…share of equity AUM increases significantly in last year
Balanced3%
FOF(Overseas)0%Other ETFs
1%
Equity32%
Gold ETFs 1%
Money Market18%
Gilt1%
Income44%
Source: AMFI, ICICIdirect.com, Research
Exhibit 4: HDFC AMC maintains top position, Franklin Templeton records highest YoY growth in AAUM
1650
13
1555
22
1446
93
1255
02
9273
0.2
8369
3
7431
2
5449
7.9
4807
6.6
3603
6.5
1300
36
1180
56
1129
14
9855
6
7944
1
6921
3
5098
7
4369
4
3552
1
3311
3
25000
50000
75000
100000
125000
150000
175000
200000
HDFC
MF
Ipru
MF
Relia
nce
MF
Birla
Sunl
ife M
F
UTI M
F
SBI M
F
Fran
klin
Tem
pelto
n
IDFC
MF
Kota
kM
ahin
dra
DSP
Blac
kRoc
k
| Cr
Jun-15 Jun-14
Source: AMFI, ICICIdirect.com Research
Exhibit 5: HDFC, Reliance highest contributors to increase in AAUM
HDFC MF15%
Reliance MF16%
Ipru MF13%
Birla Sunlife MF11%UTI MF
6%
SBI MF6%
Franklin Tempelton MF
10%
Kotak Mahindra MF4%
DSP BlackRock MF5%
IDFC MF1%
Others13%
Source: AMFI, ICICIdirect.com Research

ICICI Securities Ltd. | Retail MF Research
Page 5
MF Category Analysis
Equity funds Midcap funds have significantly outperformed large cap funds in the
last year Among sector funds, pharma funds delivered highest returns in the last
year Exhibit 6: Midcap clear winners (returns as on July 17, 2015)
50.1
37.9
24.6
23.6
20.2
19.7
19.6
17.8
36.2
34.3
24.4
20.8
18.6 21
.7
20.2
26.6
24.0
18.8
13.4
21.3
11.1
11.8
6.3
13.6
0
10
20
30
40
50
60
Pharma Mid cap Diversified FMCG Banking Large Cap InfrastructureTechnology
Retu
rns
(%)
1 year 3 Year 5 year
Source: Crisil Fund Analyser, ICICIdirect.com Research ; Returns over one year are compounded annualised returns
Exhibit 7: Inflow into equity funds near record high levels
10845
5364
79465600
6651
12273
7153
4963
10584
6324 5840
8481 10076
-4500-2500-50015003500550075009500
1150013500
Jun-
14
Jul-1
4
Aug-
14
Sep-
14
Oct-1
4
Nov
-14
Dec-
14
Jan-
15
Feb-
15
Mar
-15
Apr-1
5
May
-15
Jun-
15
Net
Inflo
w (
| Cr
)
Net inflow (Equity + ELSS)
Source: AMFI, ICICIdirect.com Research
Exhibit 8: Equity AUM soars led by record inflows, market rally
2410
24
2516
30
2667
42
2803
97
2971
60
3146
84
3194
78
3409
36
3457
39
3451
39
3451
29
3651
66
3723
13
150000200000250000300000350000400000450000
Jun-
14
Jul-1
4
Aug-
14
Sep-
14
Oct-1
4
Nov
-14
Dec-
14
Jan-
15
Feb-
15
Mar
-15
Apr-1
5
May
-15
Jun-
15
| la
kh C
rore
Equity +ELSS
Source: AMFI, ICICIdirect.com Research
Exhibit 9: \Deployment of equity funds
Allocation Banks Software Pharma Auto FinanceConsumer
Non-Durables
Construction PetroleumIndustrial
Capital Goods
Industrial Products
| crore 78582 35410 29744 27164 24041 19826 17169 16022 15,892 14040
% of total 20.5 9.3 7.8 7.1 6.3 5.2 4.5 4.2 4.2 3.7
Source: Sebi, ICICIdirect.com Research, Sector Classification (as per Amfi)
Midcap funds gained on multiple re-rating as sentiments
improved on growth prospects post formation of the new
stable government at the Centre
Exposure to banks and finance stocks together account for
the highest proportion with 27% of equity assets followed
by technology and pharma

ICICI Securities Ltd. | Retail MF Research
Page 6
Equity diversified funds
Equity diversified funds delivered healthy returns in the last year. Midcap funds were outperformers with 38% one year average return followed by multicap funds with one year average return of 25% and then large caps with 20% return against BSE Sensex return of 11% as on July 17, 2015
The Indian equity markets have been extremely volatile since March 2015 and are trading in a narrow range (27500-28000 on the BSE Sensex). Dismal quarterly results, concerns over below normal monsoons and volatile global markets on news flows surrounding Greece and China resulted in sharp volatility in global capital markets, including India
Although earnings growth may remain muted in the next couple of quarters, it is expected to improve significantly in FY17 and FY18. The same may keep market sentiments upbeat
The structural medium to long term outlook for the Indian equity market remains positive supported by lower commodity prices, benefit of lower interest rates and policy action by the government to spur investments and, consequently, overall growth. However, volatility is likely to remain elevated in the near term on heightened global uncertainty, progress of the monsoons and the onset of the Q1FY16 result season
Volatility, however, in the near term has increased on global cues, resulting in corrections in valuations. The Sensex is currently trading at 17.7x FY16E EPS of | 1608 and 14.9x FY17E EPS of | 1901, which provides comfort. Investors should accumulate large cap funds following a buy on dips or SIP strategy
Caution is required in midcap and small cap mutual funds as they have significantly outperformed large caps in the current market rally since September 2013. Therefore, if the overall market volatility increases, midcap and small caps funds in the near term may underperform. Investment in the same should only be over a five year investment horizon
Recommended funds Large cap
Axis Equity Birla Sunlife Frontline Equity ICICI Prudential Focused Bluechip Equity SBI Bluechip UTI Opportunities
Diversified
Franklin India Prima Plus Fund ICICI Prudential Dynamic Plan Reliance Equity Opportunities
Midcap
HDFC Mid-Cap Opportunities Fund ICICI Prudential Value Discovery Fund Franklin India Smaller Companies Fund SBI Magnum Global Fund
(Refer to www.icicidirect.com for details of the fund)
View Short term: Positive Long-term: Positive

ICICI Securities Ltd. | Retail MF Research
Page 7
Equity Infrastructure fund After a clear mandate, the government unveiled its 10-year agenda to
focus on infrastructure, especially in road & railways like the dedicated freight corridor (US$80 billion), Diamond Quadrilateral (Mumbai Ahmedabad bullet train preliminary cost pegged at | 65,000 crore), Sagar Mala project (| 1 lakh crore project) and Bharat Mala project (| 55000 crore project). With increased focus on road development, NHIDCL is set to award projects worth 1.3 lakh crore over the next five years with additional 1500 km of highways under the Bharat Mala project whereas NHAI plans to award 20000 km of road projects (| 1.8 lakh crore) over the next couple of years. This lends comfort that there will be tangible opportunities in the long run for infrastructure players
Secondly, the government's progress towards speeding up the decision
making process towards low hanging fruits/stuck project worth | 8 lakh crore would not only lead to better execution but also improve the liquidity of various infrastructure projects
Also, increase in allocation to road sector & ports, rationalisation of
capital tax gains regime for sponsors & tax pass through status for infrastructure investment trusts (InvITs) and establishment of National Investment and Infrastructure Fund (NIIF) with initial annual outflow of | 20,000 crore in the recent Union Budget would pave the way for greater opportunities for various infrastructure players
Thirdly, the relatively good monsoon than forecasted re-ignites the
hopes of softening inflation & interest rates, which could lead to possible valuation upgrades on account of interest outgo and lower discount rates
Fourthly, with the RBI's recent action allowing banks to issue long term
bonds for infrastructure with benefits such as relaxation of CRR & SLR norms and longer duration of bonds, we believe the pressure on developers to fund infrastructure projects would ease. Hence, cost of funds and strain on cash flow are likely to reduce, going ahead
Going ahead, while we believe there would be opportunities in the
infrastructure, we remain selectively positive on the sector Preferred Picks
Franklin Build India Fund HDFC Infrastructure Fund ICICI Prudential Infrastructure Fund
Refer to www.icicidirect.com for
details of the fund
View Short-term: Positive Long-term: Positive

ICICI Securities Ltd. | Retail MF Research
Page 8
Equity Banking Funds • Subdued profitability in a seasonally strong Q4FY15 has kept
investors away from banking stocks. Even Q1FY16 results have started on a lacklustre note
• Absolute GNPA increased at a higher rate by 25% YoY in FY15 to
| 310772 crore. For the next two quarters, the asset quality scenario may remain bleak with the risk of higher slippages from RA owing to various accounts failing to meet their milestones required under restructuring. RBI’s Financial Stability Report stress test indicates the GNPA ratio may rise from 4.6% (March 2015) to 4.8% by September 2015. Also, it is worried about an infra pickup delay
• Further, since March 2015 10 Year G-sec yields have risen ~20 bps
to ~7.93%. This will further impact bank’s earnings owing to unavailability of treasury gains, which supported their financials in the last three quarters against higher provisions required for deteriorating asset quality
• We believe that, going ahead, asset quality woes and, consequently, growth concerns for PSU banks will continue for a bulk of FY16E. Hence, one should consider PSU bank stocks for at least a two-year horizon. Though private banks are also seeing moderation, a steady operational performance ahead should provide investors with better returns over the next two or three years. The expected turnaround in the economy, going ahead, should augur well for the banking sector, as a whole. Hence, we remain positive on the sector on a long term basis
Preferred Picks
ICICI Prudential Banking & Financial Services Reliance Banking Fund UTI Thematic - Banking Sector Fund
Refer to www.icicidirect.com for
details of the fund
Equity FMCG FMCG companies continue to witness muted demand from both rural &
urban India. With the significant correction in commodity prices, the industry has taken price cuts to pass on raw material benefit. This has affected revenue growth mainly due to the absence of a price hike in sales. However, a decline in commodity prices has resulted in a considerable expansion in operating margins despite companies increasing their advertisement & promotion (A&P) spend
In the last month, the valuation multiples of FMCG companies have seen some contraction in the wake of stringent action by the food regulator after Nestlé’s Maggi controversy. We believe recent events would remain an overhang on FMCG stocks. This may result in a further contraction of premium multiples it commands vis-à-vis the market
Preferred Picks
ICICI Prudential FMCG Fund SBI FMCG Fund
Refer to www.icicidirect.com
for details of the fund
View Short-term: Neutral Long-term: Positive
View Short-term: Neutral Long-term: Neutral

ICICI Securities Ltd. | Retail MF Research
Page 9
Equity Pharma Funds Strong visibility on the back of a good product basket and a reasonable
base business growth continue to attract buying interest in the pharma sector despite premium valuations
US and Indian formulations remain the main growth drivers for the sector on the back of a strong pipeline and incremental product launches. Healthy operating margins, relatively low leverage and strong return ratios are some of the other attributes for most pharma players
However, the pharma sector has significantly outperformed other sectors in the last few year. Therefore, they may undergo some consolidation in the near term
Preferred Picks
Reliance Pharma Fund SBI Pharma Fund UTI-Pharma & Healthcare
Refer to www.icicidirect.com
for details of the fund
Equity Technology Funds
Tier-I IT companies could report average 2.3% QoQ dollar revenue growth in Q1 vs. 1.2% decline in Q4 and 3% in Q1FY15 as Q1 is a seasonally strong quarter and cross currencies have largely been stable. TCS reported robust volume growth (4.8%) led by demand uptick in traditional verticals (BFS, retail, life sciences) while headwinds in select verticals and drop in realisation dragged overall revenue growth. However, the management commentary on FY16E growth was upbeat led by healthy deal signings and traction in digital technologies
Operationally, Europe continues to see a demand uptick in cost-optimisation deals while discretionary spending remains healthy in the US. Insurance, telecom and oil & gas verticals are structurally challenged and seeing a reduction in capex and discretionary spends
Upsides could be in line with earnings upgrades given blended valuations are at ~15.9x FY17E. However, sharp sell-offs should be used to accumulate given long-term growth prospects
Preferred Picks
ICICI Prudential Technology Fund DSPBR Technology fund
Refer to www.icicidirect.com for
details of the fund
View Short-term: Neutral Long-term: Positive
View Short-term: Neutral Long-term: Positive

ICICI Securities Ltd. | Retail MF Research
Page 10
Exchange Traded Funds (ETF) In India, three kinds of ETFs are available: Equity Index ETFs, liquid
ETFs and gold ETFs
An equity index ETF tracks a particular equity index such as the BSE Sensex, NSE Nifty, Nifty Junior, etc
An equity index ETF scores higher than index funds on several grounds. The expense of investing in ETFs is relatively less by 0.50-1.00% in comparison to an index fund. The expense ratio for ETFs is in the range of 0.50-0.75% excluding brokerage while for index funds the expense ratio varies in the range of 1.0-1.5%. However, brokerage (which varies) is applicable on ETFs while there are no entry loads now on index funds
The tracking error, which explains the extent of deviation of returns from the underlying index, is usually low in ETFs as it tracks the equity index on a real time basis whereas it is done only once in a day for index funds
ETFs also provide liquidity as they are traded on stock exchanges and investors may subscribe or redeem them even on an intra-day basis. This is unavailable in index funds, which are subscribed/redeemed only on a closing NAV basis
There are over 400 ETFs traded globally. ETFs are transparent and cost efficient. The decision on which ETF to buy should be largely governed by the decision on getting exposure in that asset class
Volumes are higher only in the Goldman Sachs Benchmark ETFs and tracking error is also lowest at 0.01%. Therefore, it is our top pick for investors wanting Nifty-linked returns
CPSE ETF is a new entry in the Goldman Sachs ETF offering. The ETF invests in selective 10 PSU stocks and has been listed on the exchange since April. It has delivered healthy 45% return since its launch. Also, bonus units at the end of the year will also provide additional benefit
Exhibit 10: CPSE ETF leads inflows
-133
21151
-439
429 492
773
128
752623
-579
-334
73
-800-600-400-200
0200400600800
1000
Jun-
14
Jul-1
4
Aug-
14
Sep-
14
Oct-1
4
Nov
-14
Dec-
14
Jan-
15
Feb-
15
Mar
-15
Apr-1
5
May
-15
Jun-
15
Net
Inflo
w (
| Cr
)
Source: AMFI, ICICIdirect.com Research
Exhibit 11: AUM moderates
5048
5083
5239
4737 54
65 5997 67
02
7056 77
95
8060
7404
7317
7322
0
2000
4000
6000
8000
10000
Jun-
14
Jul-1
4
Aug-
14
Sep-
14
Oct-1
4
Nov
-14
Dec-
14
Jan-
15
Feb-
15
Mar
-15
Apr-1
5
May
-15
Jun-
15
| Cr
ore
Other ETFs
Source: AMFI, ICICIdirect.com Research
Traded volumes should be the major criterion that is used
while deciding on investment in ETFs. Higher volumes
ensure lower spread and better pricing to investors...
Tracking error, though it should be considered, is not the
deciding factor as variation among funds is not huge...

ICICI Securities Ltd. | Retail MF Research
Page 11
Balanced funds Balanced funds are hybrid funds. More than 65% of the overall portfolio
is invested in equities. Hence, as per provisions of the Income Tax Act, 1961, any capital gains over one year become tax free. Also, dividends declared by funds are tax free
In case you separately invest 35% of your investible corpus in a debt fund, the same will be subject to higher taxation. However, if the whole corpus is invested in balanced funds, 100% shall have lower taxation applicable as mentioned above
After a sharp rally in equity markets, the funds can be a preferred investment avenue as the debt proportion serves to protect on intermediate relief rallies or the downturn while providing 65% participation on further upsides
Exhibit 12: Strong inflow…
185 348
1789
835
1491
4419
448
732
2075
879 1235
11831202
0500
100015002000250030003500400045005000
Jun-
14
Jul-1
4
Aug-
14
Sep-
14
Oct-1
4
Nov
-14
Dec-
14
Jan-
15
Feb-
15
Mar
-15
Apr-1
5
May
-15
Jun-
15
Net
Inflo
w (
| Cr
)
Source: AMFI, ICICIdirect.com Research
Exhibit 13: …leads to AUM growth
1591
4
1621
7
1729
3
1827
7
2108
0
2276
9
2449
0
2579
2
2650
7
2636
8
2701
5
2874
9
3225
9
13000
18000
23000
28000
33000
38000
Jun-
14
Jul-1
4
Aug-
14
Sep-
14
Oct-1
4
Nov
-14
Dec-
14
Jan-
15
Feb-
15
Mar
-15
Apr-1
5
May
-15
Jun-
15
| Cr
ore
Balanced
Source: AMFI, ICICIdirect.com Research
Preferred Picks
ICICI Prudential Balanced - Advantage Fund
HDFC Balanced Fund
Tata Balanced Fund
(Refer to www.icicidirect.com for details of the fund)
Monthly Income Plans (MIP) An MIP offers investors an option to invest in debt with some
participation in equity, ~10-25% of the portfolio. They are suitable for investors who seek higher return from a debt portfolio and are comfortable taking nominal risk. The debt corpus of the portfolio provides regular income while the equity portion of the fund provides alpha. However, returns can also get eroded by a fall in equities
MIPs can be classified into aggressive MIP and conservative MIP based on its equity allocation. Risk averse investors should invest in MIPs with lower equity allocation to avoid capital erosion
The change in taxation announced in the Union Budget 2014, shall be applicable to MIP funds (refer to debt funds section for details)
Preferred Picks
Birla Sun Life MIP II - Savings 5 Plan
ICICI Prudential MIP 25
DSPBR MIP Fund
(Refer to www.icicidirect.com for details of the fund)
Investors with a limited investible surplus and a lower risk
appetite but with a willingness to invest in equities can
look to invest in these funds
View Short-term: Positive Long-term: Positive
View Short-term: Neutral Long-term: Positive
MIP should be a preferred debt investment for funds that need to be parked for over two years

ICICI Securities Ltd. | Retail MF Research
Page 12
Arbitrage Funds Arbitrage funds seek to exploit market inefficiencies that get manifested
as mispricing in the cash (stock) and derivative markets
Availability of arbitrage positions depends very much on the market scenario. A directional movement in the broader index attracts speculators in the market and cost of funding makes futures positions biased
Arbitrage funds are classified as equity funds as they invest into equity share and equity derivative instruments. Since these are classified as equity funds for taxation, dividends declared by the funds are tax free. No capital gains will be applicable if they are sold after a year
These funds can be looked upon as an alternative to liquid funds. However, for these funds, returns totally depend on arbitrage opportunities available at a particular point of time and investors should consider reviewing the same before investing. Returns of arbitrage funds are non-linear and, therefore, unsuitable for investors who want consistent return across time period
Arbitrage funds should be used as a liquid investment and should not be a major part of the investor’s portfolio
Availability of arbitrage positions depends very much on the market scenario. Directional movement in the broader index attracts speculators in the market while cost of funding makes future positions biased
In case of positive movement, long build-up in futures puts pricing in an upward bias and creates a window for direct arbitrage positions
On the other hand, negative bias attracts fresh sellers in the market. Speculators try to sell the stock much cheaper than theoretical prices. In such situations, reverse arbitrage opportunities arise
On the other hand, a range bound market does not give ample room to create arbitrage positions
Preferred Picks
ICICI Prudential Equity - Arbitrage Fund – Regular IDFC Arbitrage Fund - (Regular) Kotak Equity Arbitrage Fund SBI Arbitrage Opportunities Fund
(Refer to www.icicidirect.com for details of the fund)
View Short-term: Positive Long-term: Positive

ICICI Securities Ltd. | Retail MF Research
Page 13
Debt funds Exhibit 14: Category average returns
2.41
10.6
6
8.42
3.37
10.5
4
8.64
7.14
9.57
8.92
8.22 8.47 8.76
8.45 8.84
8.75
0.00
2.00
4.00
6.00
8.00
10.00
12.00
6 months 1 year 3year%
Gilt Funds Income LT Income ST Liquid Income UST
Source: ACE MF, ICICIdirect.com Research Note : Returns as on July 17, 2015; Returns over one year are compounded annualised returns
Exhibit 15: Deployment of funds: June 2015
CP Bank CD
Bank CD
Bank CD
Corporate Debt
0
5000
0
1000
00
1500
00
2000
00
2500
00
3000
00
3500
00
4000
00Less than 90 days
90 days to 182days
182 days to 1 year
1 year and above
Government Securities
CP
Bank CD
Treasury Bills
CBLO
Other Money MarketInvestmentsCorporate Debt
PSU Bonds
Securitised Debt
Bank FD
Source: SEBI, ICICIdirect.com Research Note : Holding as percentage of total AUM
Exhibit 16: G-Sec yield curve
7.6
7.9
8.0
7.8
7.7
8.17.97.9
7.5
7.7
7.9
8.1
8.3
1yr 3yr 5yr 10yr
Yiel
d (%
)
15-Jul-15 15-Jun-15
Source: Bloomberg, ICICIdirect.com Research
Exhibit 17: Corporate bond curve
8.3
8.4
8.58.6
8.4
8.58.6
8.6
8.1
8.2
8.3
8.4
8.5
8.6
8.7
1yr 3yr 5yr 10 yr
Yiel
d (%
)
15-Jul-15 15-Jun-15
Source: Bloomberg, ICICIdirect.com Research
Within short-term funds, credit opportunities funds have delivered better consistent returns over a longer period
Investment into securities with maturity of less than 90 days and more than one year dominates total investments by mutual funds

ICICI Securities Ltd. | Retail MF Research
Page 14
Liquid Funds Liquid fund returns moderated to 8.2-8.8% pre tax from over 9% earned
in the previous year The Reserve Bank’s pro-active liquidity management operations
ensured that Call rates stayed range bound around the policy rate reducing day-to-day volatility. The CBLO rates also hovered just above the repo rate. With an improvement in liquidity conditions, the certificate of deposit and commercial paper rates in the three month bracket also eased by 80 bps to the 8.3-8.7% range from 9.1-9.3%. The same is likely to moderate returns in liquid funds going forward
For less than a year, individuals in the higher tax bracket should opt for dividend option as the dividend distribution tax @ 28.325% is marginally lower. Also, though the tax arbitrage has reduced, they still earn better pre-tax returns over bank savings (3-4%) and current accounts (0-3%)
Changes in taxation rules announced in Union Budget 2014 are also applicable to liquid funds, as post tax returns in less than a three-year period gets reduced for individuals falling in the higher tax bracket (30% tax slab) and for corporates
Exhibit 18: Call rates near repo rate
6
7
8
9
10
11
12
Jul-1
4A
ug-1
4Se
p-14
Oct-1
4N
ov-1
4De
c-14
Jan-
15Fe
b-15
Mar
-15
Apr
-15
May
-15
Jun-
15Ju
l-15
%
Call rate
Source: Bloomberg, ICICIdirect.com Research
Exhibit 19: …CP/CD yields decline
7.5
8.0
8.5
9.0
9.5
10.0
Jul-1
4Au
g-14
Sep-
14Oc
t-14
Nov
-14
Dec-
14Ja
n-15
Feb-
15M
ar-1
5Ap
r-15
May
-15
Jun-
15Ju
l-15
%
3M CD 3M CP
Source: Bloomberg, ICICIdirect.com Research
Exhibit 20: Flows into liquid funds remain volatile on institutional activity
25,5
89
-5,8
64
-67,
318
100,
611
-52,
460
-50,
786
85,8
48
8,78
4
-112
,810
101,
592
-676
97
-15,
657
-47,
330
-200000
-160000
-120000
-80000
-40000
0
40000
80000
120000
Jun-
14
Jul-1
4
Aug-
14
Sep-
14
Oct-1
4
Nov
-14
Dec-
14
Jan-
15
Feb-
15
Mar
-15
Apr-1
5
May
-15
Jun-
15
Net
Inflo
w (
| Cr
)
Source: AMFI, ICICIdirect.com Research
Exhibit 21: AUM declines in June due to net outflow
2159
95
2442
20
2450
35
1845
25
2788
07
2281
49
1784
91
2653
58
2760
70
1625
62
2667
22
2538
99
2069
79
80000
130000
180000
230000
280000
330000
Jun-
14
Jul-1
4
Aug-
14
Sep-
14
Oct-1
4
Nov
-14
Dec-
14
Jan-
15
Feb-
15
Mar
-15
Apr-1
5
May
-15
Jun-
15
| Cr
ore
Money Market
Source: AMFI, ICICIdirect.com Research
Preferred Picks
HDFC Cash Management Fund - Savings Plan SBI Magnum InstaCash Reliance Liquid Fund - Treasury Plan
(Refer to www.icicidirect.com for details of the fund)
View Neutral

ICICI Securities Ltd. | Retail MF Research
Page 15
Income funds In the income funds category, long term debt funds outperformed
delivering 10.5% absolute return in last one year (as on July 17, 2015)
We continue to remain positive on the Indian debt markets as they are well placed to benefit from a structural improvement in macroeconomic data and expect the positive undertone of the debt market to sustain
The corporate bond market segment continues to be attractive especially with expectations of an improvement in corporate profitability, going ahead, and an improved economic outlook. The credit opportunities funds are better placed due to stable returns and a change in taxation warranting a minimum holding period of three years to avail indexation benefits
We prefer credit opportunities fund in the income funds category as a inverted corporate bond curve offers an opportunity in the one to three year corporate bonds segment
The recent sell-off in yields of government securities provide an investment opportunity for aggressive investors to add duration funds with a one or two year investment horizon
Exhibit 22: Income funds witness inflows for second month in a row
1307
-10,
080
-12,
696
-10,
567
15,4
46 19,8
44
-1,6
32
12,1
63
-152
-8,9
27
-2,5
10
4,20
55,
861
-15000
-10000
-5000
0
5000
10000
15000
20000
25000
Jun-
14
Jul-1
4
Aug-
14
Sep-
14
Oct-1
4
Nov
-14
Dec-
14
Jan-
15
Feb-
15
Mar
-15
Apr-1
5
May
-15
Jun-
15
Net
Inflo
ws
(| .C
r)
Source: AMFI, ICICIdirect.com Research
Exhibit 23: AUM steady
4789
82
4716
51
4611
14
4544
95
4759
68
5005
95
5021
54
5202
34
5223
66
5157
73
5146
28
5221
78
5289
00
300000350000400000450000500000550000
Jun-
14
Jul-1
4
Aug-
14
Sep-
14
Oct-1
4
Nov
-14
Dec-
14
Jan-
15
Feb-
15
Mar
-15
Apr-1
5
May
-15
Jun-
15
| Cr
ore
Income
Source: AMFI, ICICIdirect.com Research
Recommended funds
Ultra Short Term Funds Birla Sun Life Savings Fund Franklin India Ultra Short Term Bond Fund ICICI Prudential Flexible income
Short Term Funds Birla Sunlife short term fund HDFC Short Term Opportunities Fund ICICI Pru Short Term Plan
Short Term Funds – Credit opportunities Birla Sunlife Medium term Franklin India Short term Plan HDFC Corporate debt opportunities ICICI Prudential Regular Savings
Long term/Dynamic Birla Sunlife income plus ICICI Prudential Dynamic Bond Fund IDFC dynamic bond fund
(Refer to www.icicidirect.com for details of the fund)
View Ultra-short term: Positive
Short-term: Positive Long-term: Positive
Ultra-short-term fund returns are attractive on risk adjusted basis Short-term funds will benefit as the bond curve reverts to an upward slopping curve. Credit opportunities funds earn the highest accrual and are the best in the category Dynamic bond funds are suitable for all types of investors and for longer duration. They can take exposure to all durations as per the interest rate outlook and switch between G secs and corporate bonds

ICICI Securities Ltd. | Retail MF Research
Page 16
Gilt Funds In June 2015, gilt funds delivered 10.7% absolute return in the last year,
the highest among debt funds. We believe the odds remain in favour of the government securities yield trending down over the next one or two years. However, gilt funds will be less attractive due to the longer holding period (more than three years) as lower accrual income will neutralise the impact of moderate capital gains in the near term
The front loaded rate cuts by the RBI can push overall interest rates down depending on how soon banks transmit it into the system by re-pricing their assets and liabilities lower
The central government has signed a memorandum with the RBI setting out a clear inflation objective to bring the inflation rate to the mid-point of the band of 4 +/- 2%. CPI, as per our assessment, should average close to 5% for FY16 (on assumption of normal monsoon and a stable currency). The government’s commitment towards controlling price shocks and steps taken to improve the supply chain are commendable. Also, global prices that have corrected sharply are supportive be they crude, metal or food prices. Hence, inflation should likely stay on the intended path. This creates room for the RBI to cut rates by another 25 bps to earn a real return of 2%
On the supply front, the Budget has pegged the market borrowing for FY16 at | 6 lakh crore on a gross basis and | 4.56 lakh crore on a net basis. Both gross and net market borrowings were close to market expectations. Borrowings related concern is expected to come down, given the government’s commitment towards reducing the fiscal deficit to 3% of GDP by FY17
Aggressive investor can invest in gilt funds with an investment horizon of one or two years
Recommended funds
Birla Sun Life Gilt Plus - PF Plan - Regular ICICI Prudential LT Gilt Fund - PF Option - Regular
(Refer to www.icicidirect.com for details of the fund) Exhibit 24: Profit booking as monsoons delay rate cut expectation
-211
110
-209
132 36
7
814
2090
1813 20
58
1439
164
875
-279
-500
0
500
1000
1500
2000
2500
Jun-
14
Jul-1
4
Aug-
14
Sep-
14
Oct-1
4
Nov
-14
Dec-
14
Jan-
15
Feb-
15
Mar
-15
Apr-1
5
May
-15
Jun-
15
Net
Inflo
w (
| Cr
)
Source: AMFI, ICICIdirect.com Research
View Short-term: Neutral Long-term: Neutral
ICICI Securities Ltd. | Retail MF Research
Page 17
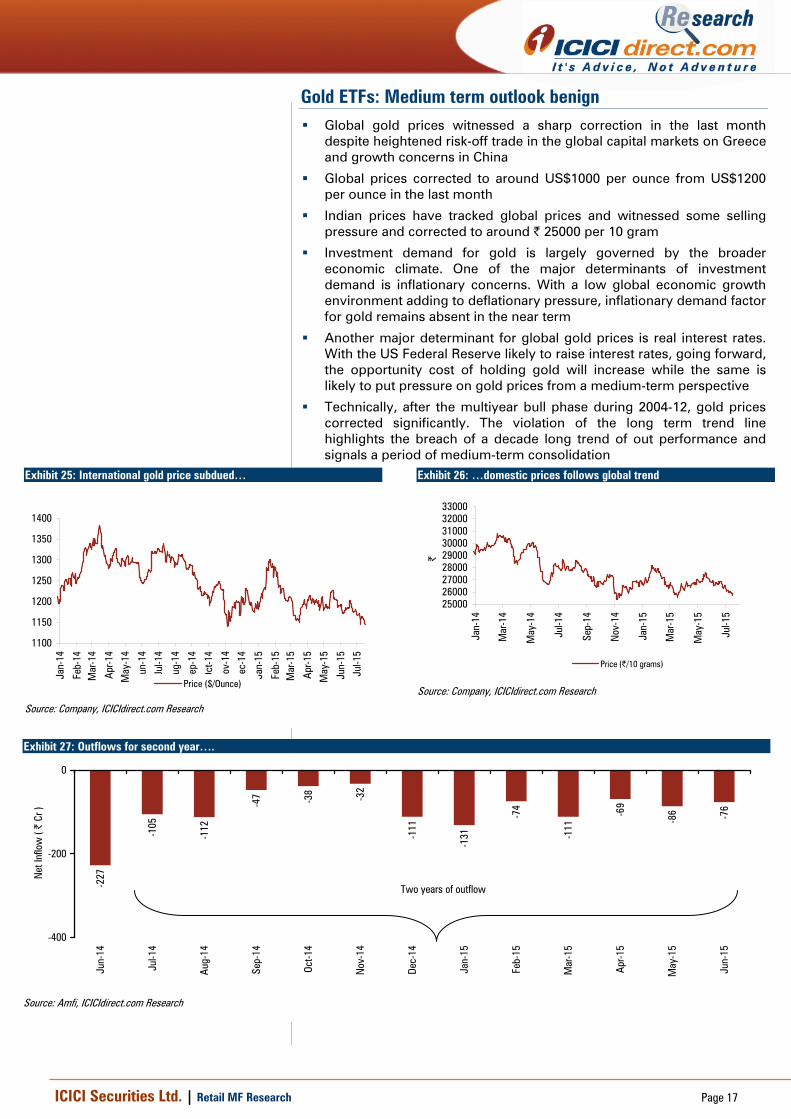
Gold ETFs: Medium term outlook benign Global gold prices witnessed a sharp correction in the last month
despite heightened risk-off trade in the global capital markets on Greece and growth concerns in China
Global prices corrected to around US$1000 per ounce from US$1200 per ounce in the last month
Indian prices have tracked global prices and witnessed some selling pressure and corrected to around | 25000 per 10 gram
Investment demand for gold is largely governed by the broader economic climate. One of the major determinants of investment demand is inflationary concerns. With a low global economic growth environment adding to deflationary pressure, inflationary demand factor for gold remains absent in the near term
Another major determinant for global gold prices is real interest rates. With the US Federal Reserve likely to raise interest rates, going forward, the opportunity cost of holding gold will increase while the same is likely to put pressure on gold prices from a medium-term perspective
Technically, after the multiyear bull phase during 2004-12, gold prices corrected significantly. The violation of the long term trend line highlights the breach of a decade long trend of out performance and signals a period of medium-term consolidation
Exhibit 25: International gold price subdued…
1100
1150
1200
1250
1300
1350
1400
Jan-
14
Feb-
14M
ar-1
4
Apr
-14
May
-14
Jun-
14
Jul-1
4
Aug-
14
Sep-
14
Oct-1
4
Nov
-14
Dec-
14
Jan-
15
Feb-
15M
ar-1
5
Apr
-15
May
-15
Jun-
15
Jul-1
5
Price ($/Ounce)
Source: Company, ICICIdirect.com Research
Exhibit 26: …domestic prices follows global trend
250002600027000280002900030000310003200033000
Jan-
14
Mar
-14
May
-14
Jul-1
4
Sep-
14
Nov
-14
Jan-
15
Mar
-15
May
-15
Jul-1
5
|
Price (|/10 grams)
Source: Company, ICICIdirect.com Research
Exhibit 27: Outflows for second year….
-227
-105
-112
-47 -38 -32
-111
-131
-74
-111
-69
-86 -76
-400
-200
0
Jun-
14
Jul-1
4
Aug-
14
Sep-
14
Oct-1
4
Nov
-14
Dec-
14
Jan-
15
Feb-
15
Mar
-15
Apr-1
5
May
-15
Jun-
15
Net
Inflo
w (
| Cr
)
Two years of outflow
Source: Amfi, ICICIdirect.com Research

ICICI Securities Ltd. | Retail MF Research
Page 18
Model Portfolios
Equity funds model portfolio Investors who are wary of investing directly into equities can still get returns almost as good as equity markets through the mutual fund route. We have designed three mutual fund model portfolios, namely, conservative, moderate and aggressive mutual fund portfolios. These portfolios have been designed keeping in mind various key parameters like investment horizon, investment objective, scheme ratings, and fund management. We have changed the mutual funds portfolio in July, to include midcap funds as we believe an improvement in the growth scenario may generate better alpha in midcap stocks over large cap stocks Exhibit 28: Equity model portfolio Particulars Aggressive Moderate ConservativeReview Interval Monthly Monthly QuarterlyRisk Return High Risk- High Return Medium Risk -
Medium ReturnLow Risk - Low Return
Funds Allocation % AllocationFranklin India Prima Plus 20 20 20Birla Sunlife Frontline Equity 20 20 20ICICI Prudential Dynamic Plan - - 20UTI Opportunites Fund - 20 20Reliance Long term Equity 20 - -ICICI Prudential Value Discovery 20 20 20HDFC Midcap Opportunities 20 20Grand Total(a+b) 100 100 100
Source: ICICIdirect.com Research
Exhibit 29: Model portfolio performance : One year performance (as on June 30,2015)
24%21%
17%
9%
0%
5%
10%
15%
20%
25%
30%
Aggressive Moderate Conservative BSE 100
%
Aggressive Moderate Conservative BSE 100
Source: Crisil Fund Analyser, ICICIdirect.com Research Portfolio inception date : April 15, 2009

ICICI Securities Ltd. | Retail MF Research
Page 19
Debt funds model portfolio We have designed three different mutual fund model portfolios for different investment duration namely less than six months, six months to one year and above one year. These portfolios have been designed keeping in mind various key parameters like investment horizon, interest rate scenarios, credit quality of the portfolio and fund management, etc.
Exhibit 30: Debt funds model portfolio
Particulars
0 – 6 months 6months - 1 Year Above 1 Year
Objective LiquidityLiquidity with
moderate return Above FDReview Interval Monthly Monthly Quarterly
Risk ReturnVery Low Risk - Nominal Return
Medium Risk - Medium Return
Low Risk - High Return
Funds AllocationUltra Short term FundsBirla SL Savings Fund 20Franklin India Ultra Short Bond Fund 20ICICI Pru Flexible Income Plan 20Short Term Debt FundsBirla Sunlife Medium Term Plan 20Birla Sunlife Short Term Fund 20 20Birla Sunlife Short Term Opportunites Fund 20Franklin India Short Term Income Fund 20HDFC Medium Term Opportunities Fund 20HDFC Short Term Opportunities Fund 20 20ICICI Prudential Regular Savings 20ICICI Prudential Short Term Fund 20IDFC SSI Short TermSundaram Select Debt 20UTI Short Term FundLong Term/Dynamic Debt FundsIDFC Dynamic Bond fund 20Total 100 100 100
Time Horizon
% Allocation
Source: ICICIdirect.com Research
Exhibit 31: Model portfolio performance
8.749.48
10.319.14
9.86
11.33
0.0
2.0
4.0
6.0
8.0
10.0
12.0
0-6 Months 6Months - 1Year Above 1yr
%
Portfolio Index
Source: Crisil Fund Analyser, , ICICIdirect.com Research
*Index: 0-6 month’s portfolio – Crisil Liquid Fund Index; 6 months-1 year – Crisil Short term Index Above 1 year: Crisil Composite Bond Index

ICICI Securities Ltd. | Retail MF Research
Page 20
Top Picks Exhibit 32: Category wise top picks
Category Top Picks
Largecaps Axis Equity Fund
Birla Sunlife Frontline equity Fund
ICICI Pru Focussed Bluechip Equity Fund
UTI Opportunities Fund
SBI Bluechip fund
Midcaps HDFC Midcap Opportunities Fund
ICICI Prudential Value Discovery Fund
Franklin India Smaller Companies Fund
SBI Magnum Global Fund
Diversified Franklin India Prima Plus
ICICI Prudential Dynamic Plan
Reliance Equity Opportunities
ELSS Axis Long Term Equity
ICICI Prudential Tax Plan
Franklin India Tax shield
Debt
Liquid Funds HDFC Cash Mgmnt Saving Plan
ICIC Pru Liquid Plan
Reliance Liquid Treasury PlanUltra Short Term Birla Sunlife Savings Fund
Franklin India Ultra Short Term Bond Fund
ICICI Pru Flexible Income Plan
Short Term Birla Sunlife Short Term FundHDFC Short Term Opportunities Fund
ICICI Pru Short Term Plan
Credit Opportunities Fund Birla Sunlife Medium Term Plan
Franklin India Short term Plan
ICICI Prudential Regular Savings
Income Funds ICICI Prudenti Dynamic Bond Fund
Birla Sun Life Income Plus - Regular Plan
IDFC Dynamic Bond Fund
Gilts Funds ICICI Pru Gilt Inv. PF Plan
Birla Sunlife Gilt Plus
MIP Birla Sunlife Savings 5
ICICI Prudential MIP 25
Equity
(Refer www.icicidirect.com for details of the fund)

ICICI Securities Ltd. | Retail MF Research
Page 21
Pankaj Pandey Head – Research [email protected]
ICICIdirect.com Research Desk, ICICI Securities Limited, 1st Floor, Akruti Trade Centre, Road No. 7, MIDC, Andheri (East) Mumbai – 400 093
Disclaimer ICICI Securities Ltd. - AMFI Regn. No.: ARN-0845. Registered office of I-Sec is at ICICI Securities Ltd. - ICICI Centre, H. T. Parekh Marg, Churchgate, Mumbai - 400020, India. The selection of the Mutual Funds for the purpose of including in the indicative portfolio does not in any way constitute any recommendation by ICICI Securities Limited (hereinafter referred to as ICICI Securities) with respect to the prospects or performance of these Mutual Funds. The same should also not be considered as solicitation of offer to buy or sell these securities/units. The investor has the discretion to buy all or any of the Mutual Fund units forming part of any of the indicative portfolios on icicidirect.com. Before placing an order to buy the securities/units forming part of the indicative portfolio, the investor has the discretion to deselect any of the securities/units, which he does not wish to buy. Nothing in the indicative portfolio constitutes investment, legal, accounting and tax advice or a representation that any investment or strategy is suitable or appropriate to the investor's specific circumstances. The details included in the indicative portfolio are based on information obtained from public sources and sources believed to be reliable, but no independent verification has been made nor is its accuracy or completeness guaranteed. The securities included in the indicative portfolio may not be suitable for all investors, who must make their own investment decisions, based on their own investment objectives, financial positions and needs. This may not be taken in substitution for the exercise of independent judgement by any investor. The investor should independently evaluate the investment risks. ICICI Securities and affiliates accept no liabilities for any loss or damage of any kind arising out of the use of this indicative portfolio. Past performance is not necessarily a guide to future performance. Actual results may differ materially from those set forth in projections. ICICI Securities may be holding all or any of the securities/units included in the indicative portfolio from time to time. ICICI Securities Limited is not providing the service of Portfolio Management Services (Discretionary or Non Discretionary) to its clients. Mutual fund investments are subject to market risks, read all scheme related documents carefully. Investors should consult their financial advisers if in doubt about whether the product is suitable for them. The information contained herein is strictly confidential and meant solely for the selected recipient and may not be altered in any way, transmitted to, copied or distributed, in part or in whole, to any other person or to the media or reproduced in any form, without prior written consent of ICICI Securities Limited. The contents of this mail are solely for informational purpose and may not be used or considered as an offer document or solicitation of offer to buy or sell or subscribe for securities or other financial instruments or any other product. While due care has been taken in preparing this mail, I-Sec and affiliates accept no liabilities for any loss or damage of any kind arising out of any inaccurate, delayed or incomplete information nor for any actions taken in reliance thereon. This mail/report is not directed or intended for distribution to, or use by, any person or entity who is a citizen or resident of or located in any locality, state, country or other jurisdiction, where such distribution, publication, availability or use would be contrary to law, regulation or which would subject I-Sec and affiliates to any registration or licensing requirement within such jurisdiction.
Pankaj Pandey Head – Research [email protected]
ICICIdirect.com Research Desk, ICICI Securities Limited, 1st Floor, Akruti Trade Centre, Road No. 7, MIDC, Andheri (East) Mumbai – 400 093
[email protected] Disclaimer ANALYST CERTIFICATION We Sachin Jain, CA, Sheetal Ashar, CA and Isha Bansal, MBA(Fin) Research Analysts, authors and the names subscribed to this report, hereby certify that all of the views expressed in this research report accurately reflect our views about the subject issuer(s) or Funds. We also certify that no part of our compensation was, is, or will be directly or indirectly related to the specific recommendation(s) or view(s) in this report. Terms & conditions and other disclosures: ICICI Securities Limited (ICICI Securities) AMFI Regn. No.: ARN-0845. Registered office of I-Sec is at ICICI Securities Ltd. - ICICI Centre, H. T. Parekh Marg, Churchgate, Mumbai - 400020, India. ICICI Securities is a full-service, integrated investment banking and is, inter alia, engaged in the business of stock broking and distribution of financial products. ICICI Securities is a wholly-owned subsidiary of ICICI Bank which is India’s largest private sector bank and has its various subsidiaries engaged in businesses of housing finance, asset management, life insurance, general insurance, venture capital fund management, distribution of financial products etc. (“associates”), the details in respect of which are available on www.icicibank.com. ICICI Securities is one of the leading distributors of Mutual Funds and participate in distribution of Mutual Fund Schemes of almost all AMCs in India. The selection of the Mutual Funds for the purpose of including in the indicative portfolio does not in any way constitute any recommendation by ICICI Securities Limited (hereinafter referred to as ICICI Securities) with respect to the prospects or performance of these Mutual Funds. The investor has the discretion to buy all or any of the Mutual Fund units forming part of any of the indicative portfolios on icicidirect.com. Before placing an order to buy the funds forming part of the indicative portfolio, the investor has the discretion to deselect any of the units, which he does not wish to buy. Nothing in the indicative portfolio constitutes investment, legal, accounting and tax advice or a representation that any investment or strategy is suitable or appropriate to the investor's specific circumstances. The details included in the indicative portfolio are based on information obtained from public sources and sources believed to be reliable, but no independent verification has been made nor is its accuracy or completeness guaranteed. The funds included in the indicative portfolio may not be suitable for all investors, who must make their own investment decisions, based on their own investment objectives, financial positions and needs. This may not be taken in substitution for the exercise of independent judgement by any investor. The investor should independently evaluate the investment risks. ICICI Securities and affiliates accept no liabilities for any loss or damage of any kind arising out of the use of this indicative portfolio. Past performance is not necessarily a guide to future performance. Actual results may differ materially from those set forth in projections. ICICI Securities may be holding all or any of the units included in the indicative portfolio from time to time as part of our treasury management. ICICI Securities Limited is not providing the service of Portfolio Management Services (Discretionary or Non Discretionary) to its clients. Mutual fund investments are subject to market risks, read all scheme related documents carefully. Kindly note that such research recommended funds in indicative portfolio are not based on individual risk profile of each customer unless a customer has opted for a paid Investment Advisory Service offered by I-Sec. Investors should consult their financial advisers if in doubt about whether the product is suitable for them. The information contained herein is strictly confidential and meant solely for the selected recipient and may not be altered in any way, transmitted to, copied or distributed, in part or in whole, to any other person or to the media or reproduced in any form, without prior written consent of ICICI Securities Limited. The contents of this mail are solely for informational purpose and may not be used or considered as an offer document or solicitation of offer to buy or sell or subscribe for securities or other financial instruments or any other product. While due care has been taken in preparing this mail, I-Sec and affiliates accept no liabilities for any loss or damage of any kind arising out of any inaccurate, delayed or incomplete information nor for any actions taken in reliance thereon. This mail/report is not directed or intended for distribution to, or use by, any person or entity who is a citizen or resident of or located in any locality, state, country or other jurisdiction, where such distribution, publication, availability or use would be contrary to law, regulation or which would subject I-Sec and affiliates to any registration or licensing requirement within such jurisdiction. ICICI Securities and/or its associates receive compensation/ commission for distribution of Mutual Funds from various Asset Management Companies (AMCs). ICICI Securities host the details of the commission rates earned by ICICI Securities from Mutual Fund houses on our website www.icicidirect.com. Hence, ICICI Securities or its associates may have received compensation from AMCs whose funds are mentioned in the report during the period preceding twelve months from the date of this report for distribution of Mutual Funds or for providing marketing advertising support to these AMCs. ICICI Securities also provides stock broking services to institutional clients including AMCs. Hence, ICICI Securities may have received brokerage for security transactions done by any of the above AMCs during the period preceding twelve months from the date of this report