mutpred splice: machine learning-based prediction of exonic
TRANSCRIPT

Mort et al. Genome Biology 2014, 15:R19http://genomebiology.com/2014/15/1/R19
SOFTWARE Open Access
MutPred Splice: machine learning-basedprediction of exonic variants that disrupt splicingMatthew Mort1*, Timothy Sterne-Weiler4,5, Biao Li2, Edward V Ball1, David N Cooper1, Predrag Radivojac3,Jeremy R Sanford4 and Sean D Mooney2*
Abstract
We have developed a novel machine-learning approach, MutPred Splice, for the identification of coding regionsubstitutions that disrupt pre-mRNA splicing. Applying MutPred Splice to human disease-causing exonic mutationssuggests that 16% of mutations causing inherited disease and 10 to 14% of somatic mutations in cancer maydisrupt pre-mRNA splicing. For inherited disease, the main mechanism responsible for the splicing defect is splicesite loss, whereas for cancer the predominant mechanism of splicing disruption is predicted to be exon skippingvia loss of exonic splicing enhancers or gain of exonic splicing silencer elements. MutPred Splice is available athttp://mutdb.org/mutpredsplice.
IntroductionIn case-control studies, the search for disease-causingvariants is typically focused on those single base substi-tutions that bring about a direct change in the primarysequence of a protein (that is, missense variants), theconsequence of which may be structural or functionalchanges to the protein product. Indeed, missense muta-tions are currently the most frequently encountered typeof human gene mutation causing genetic disease [1].The underlying assumption has generally been that it isthe nonsynonymous changes in the genetic code that arelikely to represent the cause of pathogenicity in mostcases. However, there is an increasing awareness of therole of aberrant posttranscriptional gene regulation inthe etiology of inherited disease.With the widespread adoption of next generation se-
quencing (NGS), resulting in a veritable avalanche ofDNA sequence data, it is increasingly important to beable to prioritize those variants with a potential func-tional effect. In order to identify deleterious or disease-causing missense variants, numerous bioinformatic toolshave been developed, including SIFT [2], PolyPhen2 [3],PMUT [4], LS-SNP [5], SNAP [6], SNPs3D [7], MutPred[8] and Condel [9] among others. However, the majority
* Correspondence: [email protected]; [email protected] of Medical Genetics, School of Medicine, Cardiff University, CardiffCF14 4XN, UK2Buck Institute for Research on Aging, Novato, CA 94945, USAFull list of author information is available at the end of the article
© 2014 Mort et al.; licensee BioMed Central LtCommons Attribution License (http://creativecreproduction in any medium, provided the orwaiver (http://creativecommons.org/publicdomstated.
of these methods only consider the direct impact of themissense variant at the protein level and automaticallydisregard same-sense variants as being ‘neutral’ with re-spect to functional significance. Although this may wellbe the case in many instances, same-sense mutationscan still alter the landscape of cis-acting elements in-volved in posttranscriptional gene regulation, such asthose involved in pre-mRNA splicing [10-12]. It is clearfrom the global degeneracy of the 5′ and 3′ splice siteconsensus motifs that auxiliary cis-acting elements mustplay a crucial role in exon recognition [13]. To date, aconsiderable number of exonic splicing regulatory (ESR)and intronic splicing regulatory (ISR) elements havebeen identified [14-19]. Generally these are classified aseither enhancers (exonic splicing enhancers (ESEs)/in-tronic splicing enhancers (ISEs)) or silencers (exonic spli-cing silencers (ESSs)/intronic splicing silencers (ISS)),which strengthen and repress, respectively, recognition ofadjacent splice sites by the splicing machinery. This dis-tinction may be to some extent artificial in so far as anESE can act as an ESS and vice versa depending upon thesequence context and the trans-acting factor bound toit [16,20]. These trans-acting factors include membersof the serine/arginine-rich family of proteins (SR pro-teins) typically known to bind to splicing enhancers andthe heterogeneous nuclear ribonucleoprotein family ofcomplexes (hnRNPs), which are thought to bind splicingsilencers. However, it is clear that our knowledge of the
d. This is an Open Access article distributed under the terms of the Creativeommons.org/licenses/by/2.0), which permits unrestricted use, distribution, andiginal work is properly cited. The Creative Commons Public Domain Dedicationain/zero/1.0/) applies to the data made available in this article, unless otherwise

Mort et al. Genome Biology 2014, 15:R19 Page 2 of 20http://genomebiology.com/2014/15/1/R19
cooperative and antagonistic elements that regulate pre-mRNA splicing in a context-dependent manner is stillvery limited [21].The functional consequences of a splice-altering variant
(SAV) may also vary quite dramatically; thus, splicingevents that alter the reading frame can introduce prema-ture termination codons that may then trigger transcriptdegradation through nonsense-mediated decay. Alterna-tively, an aberrant splicing event may maintain the openreading frame but lead instead to a dysfunctional proteinlacking an important functional domain. Even a splice-altering variant that produces only a small proportion ofaberrant transcripts could still serve to alter the gene ex-pression level [21].Up to approximately 14% of all reported disease-causing
nucleotide substitutions (coding and non-coding) listedin the Human Gene Mutation Database [1] (11,953 mu-tations; HGMD Pro 2013.4) are thought to disrupt pre-mRNA splicing whereas 1 to 2% of missense mutationshave been reported to disrupt pre-mRNA splicing(HGMD Pro 2013.4). Previous studies have, however,found that the actual proportion of disease-causingmissense mutations that disrupt pre-mRNA splicingcould be rather higher [22-25]. The difference betweenthe observed and predicted frequencies of disease-causing splicing mutations may be due in part to thefrequent failure to perform routine in vitro analysis (forexample, a hybrid minigene splicing assay [26]), so theimpact of a given missense mutation on the splicingphenotype is generally unknown. The likely high fre-quency of exonic variants that disrupt pre-mRNA spli-cing implies that the potential impact upon splicingshould not be neglected when assessing the functionalsignificance of newly detected coding sequence vari-ants. Coding sequence variants that disrupt splicingmay not only cause disease [22] but may in some casesalso modulate disease severity [27,28] or play a role incomplex disease [29]. The identification of disease-causing mutations that disrupt pre-mRNA splicing willalso become increasingly important as new therapeutictreatment options become available that have the po-tential to rectify the underlying splicing defect [30,31].Current bioinformatic tools designed to assess the
impact of genetic variation on splicing employ differentapproaches but typically focus on specific aspects of spli-cing regulation (for example, the sequence-based predic-tion of splice sites as employed by NNSplice [32] andMaxEntScan [33]) or the sequence-based identificationof splicing regulatory elements as exemplified by ESE-Finder [14], RESCUE-ESE [15], Spliceman [34] andPESX [19]. Other tools have employed a combination ofa sequence-based approach coupled with various gen-omic attributes - for example, Skippy [35] and HumanSplice Finder [36]. In general, however, most tools have
not been optimized to deal with single base substitu-tions, and require the wild-type and mutant sequencesto be analyzed separately with the user having to com-pute any difference in predicted splicing regulatory ele-ments. Tools that are designed specifically to handlesingle base substitutions include Spliceman, Skippy andHuman Splice Finder (HSF). In most cases, as each toolfocuses on specific aspects of the splicing code, there isoften a need to recruit multiple programs [37] beforeany general conclusions can be drawn.An exome screen will typically identify >20,000 exonic
variants [38]. This volume of data ensures that high-throughput in silico methods are an essential part of thetoolset required to prioritize candidate functional vari-ants from the growing avalanche of sequencing datanow being generated by NGS. NGS data analysis nor-mally involves applying multiple filters to the data inorder to prioritize candidate functional variants. Whenapplying NGS filters, it is important to remember thatsame-sense variants may alter pre-mRNA splicing via anumber of different mechanisms. Hence, a naïve NGSfilter that only considers variants within the splice siteconsensus as candidate splicing-sensitive variants wouldnot identify same-sense variants that caused exon skip-ping via a change in ESR elements.Currently, several general areas need to be improved
in relation to the identification of genetic variation re-sponsible for aberrant pre-mRNA splicing. Firstly, al-though the consensus splice site sequences are welldefined, the auxiliary splicing elements and their interac-tions with splice sites are not well understood. Secondly,there is an urgent need for larger unbiased datasets ofexperimentally characterized variants that alter splicingand have been quantitatively assessed with respect to themRNA splicing phenotype. This would provide bettertraining data for new models and provide new datasets tobenchmark the performance of different tools (both newand existing). Thirdly, there is an urgent need for new bio-informatic tools suitable for use in a high-throughputNGS setting. These tools promise to be invaluable for thecomprehensive evaluation of the impact of a given varianton mRNA processing (that is, not just in terms of splicesite disruption). It would also be beneficial if the specificconsequences for the splicing phenotype (that is, multipleexon skipping, cryptic splice site utilization, and so on)could be accurately predicted so as to reduce our relianceupon expensive and time-consuming in vitro analysis.Finally, these high-throughput in silico tools should be de-signed in such a way as to be able to handle different typesof genetic variation (that is, coding, non-coding, singlebase substitutions, microdeletions, microinsertions, and soon) and allow assessment of the combined impact of mul-tiple sequence changes in cis (for example, two substitu-tions within the same exon).
Mort et al. Genome Biology 2014, 15:R19 Page 3 of 20http://genomebiology.com/2014/15/1/R19
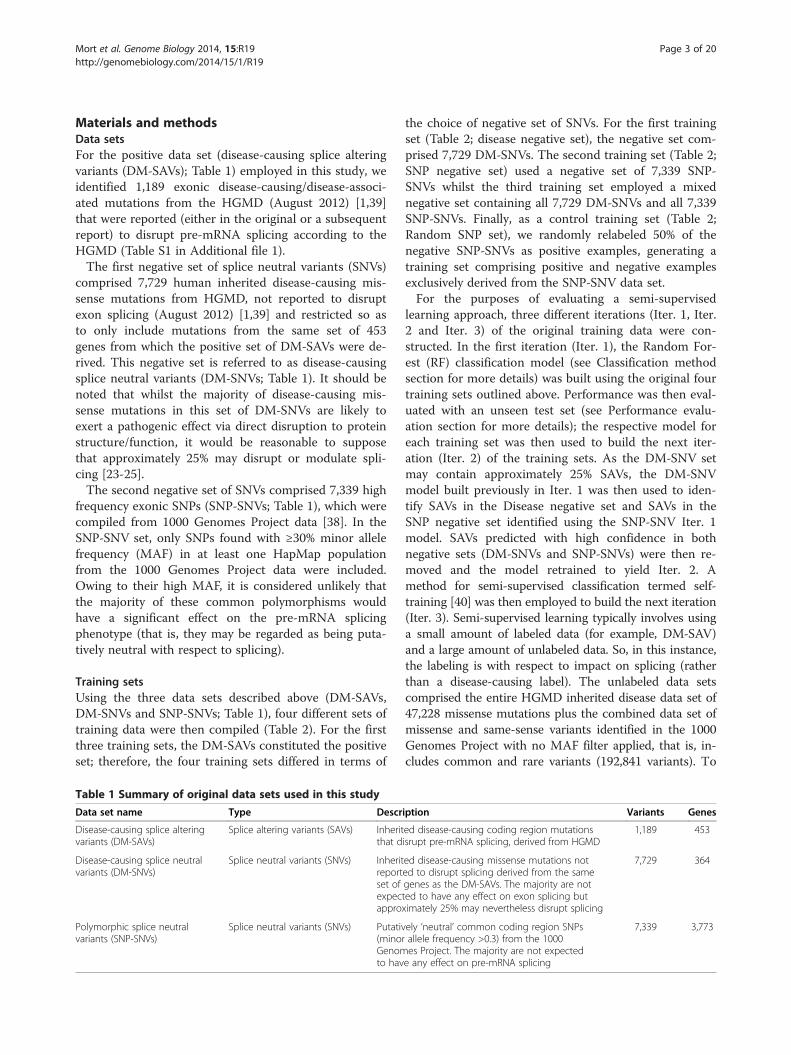
Materials and methodsData setsFor the positive data set (disease-causing splice alteringvariants (DM-SAVs); Table 1) employed in this study, weidentified 1,189 exonic disease-causing/disease-associ-ated mutations from the HGMD (August 2012) [1,39]that were reported (either in the original or a subsequentreport) to disrupt pre-mRNA splicing according to theHGMD (Table S1 in Additional file 1).The first negative set of splice neutral variants (SNVs)
comprised 7,729 human inherited disease-causing mis-sense mutations from HGMD, not reported to disruptexon splicing (August 2012) [1,39] and restricted so asto only include mutations from the same set of 453genes from which the positive set of DM-SAVs were de-rived. This negative set is referred to as disease-causingsplice neutral variants (DM-SNVs; Table 1). It should benoted that whilst the majority of disease-causing mis-sense mutations in this set of DM-SNVs are likely toexert a pathogenic effect via direct disruption to proteinstructure/function, it would be reasonable to supposethat approximately 25% may disrupt or modulate spli-cing [23-25].The second negative set of SNVs comprised 7,339 high
frequency exonic SNPs (SNP-SNVs; Table 1), which werecompiled from 1000 Genomes Project data [38]. In theSNP-SNV set, only SNPs found with ≥30% minor allelefrequency (MAF) in at least one HapMap populationfrom the 1000 Genomes Project data were included.Owing to their high MAF, it is considered unlikely thatthe majority of these common polymorphisms wouldhave a significant effect on the pre-mRNA splicingphenotype (that is, they may be regarded as being puta-tively neutral with respect to splicing).
Training setsUsing the three data sets described above (DM-SAVs,DM-SNVs and SNP-SNVs; Table 1), four different sets oftraining data were then compiled (Table 2). For the firstthree training sets, the DM-SAVs constituted the positiveset; therefore, the four training sets differed in terms of
Table 1 Summary of original data sets used in this study
Data set name Type Descr
Disease-causing splice alteringvariants (DM-SAVs)
Splice altering variants (SAVs) Inheritthat d
Disease-causing splice neutralvariants (DM-SNVs)
Splice neutral variants (SNVs) Inheritreportset ofexpecappro
Polymorphic splice neutralvariants (SNP-SNVs)
Splice neutral variants (SNVs) Putativ(minorGenomto hav
the choice of negative set of SNVs. For the first trainingset (Table 2; disease negative set), the negative set com-prised 7,729 DM-SNVs. The second training set (Table 2;SNP negative set) used a negative set of 7,339 SNP-SNVs whilst the third training set employed a mixednegative set containing all 7,729 DM-SNVs and all 7,339SNP-SNVs. Finally, as a control training set (Table 2;Random SNP set), we randomly relabeled 50% of thenegative SNP-SNVs as positive examples, generating atraining set comprising positive and negative examplesexclusively derived from the SNP-SNV data set.For the purposes of evaluating a semi-supervised
learning approach, three different iterations (Iter. 1, Iter.2 and Iter. 3) of the original training data were con-structed. In the first iteration (Iter. 1), the Random For-est (RF) classification model (see Classification methodsection for more details) was built using the original fourtraining sets outlined above. Performance was then eval-uated with an unseen test set (see Performance evalu-ation section for more details); the respective model foreach training set was then used to build the next iter-ation (Iter. 2) of the training sets. As the DM-SNV setmay contain approximately 25% SAVs, the DM-SNVmodel built previously in Iter. 1 was then used to iden-tify SAVs in the Disease negative set and SAVs in theSNP negative set identified using the SNP-SNV Iter. 1model. SAVs predicted with high confidence in bothnegative sets (DM-SNVs and SNP-SNVs) were then re-moved and the model retrained to yield Iter. 2. Amethod for semi-supervised classification termed self-training [40] was then employed to build the next iteration(Iter. 3). Semi-supervised learning typically involves usinga small amount of labeled data (for example, DM-SAV)and a large amount of unlabeled data. So, in this instance,the labeling is with respect to impact on splicing (ratherthan a disease-causing label). The unlabeled data setscomprised the entire HGMD inherited disease data set of47,228 missense mutations plus the combined data set ofmissense and same-sense variants identified in the 1000Genomes Project with no MAF filter applied, that is, in-cludes common and rare variants (192,841 variants). To
iption Variants Genes
ed disease-causing coding region mutationsisrupt pre-mRNA splicing, derived from HGMD
1,189 453
ed disease-causing missense mutations noted to disrupt splicing derived from the samegenes as the DM-SAVs. The majority are notted to have any effect on exon splicing butximately 25% may nevertheless disrupt splicing
7,729 364
ely ‘neutral’ common coding region SNPsallele frequency >0.3) from the 1000es Project. The majority are not expectede any effect on pre-mRNA splicing
7,339 3,773
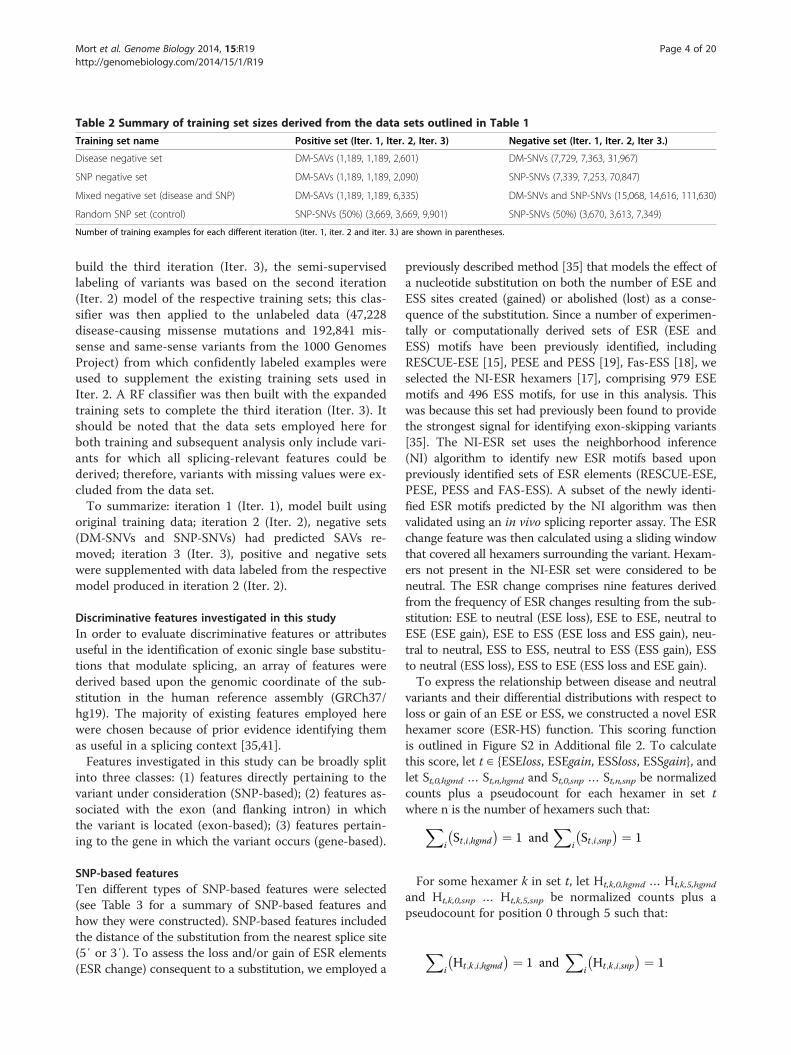
Table 2 Summary of training set sizes derived from the data sets outlined in Table 1
Training set name Positive set (Iter. 1, Iter. 2, Iter. 3) Negative set (Iter. 1, Iter. 2, Iter 3.)
Disease negative set DM-SAVs (1,189, 1,189, 2,601) DM-SNVs (7,729, 7,363, 31,967)
SNP negative set DM-SAVs (1,189, 1,189, 2,090) SNP-SNVs (7,339, 7,253, 70,847)
Mixed negative set (disease and SNP) DM-SAVs (1,189, 1,189, 6,335) DM-SNVs and SNP-SNVs (15,068, 14,616, 111,630)
Random SNP set (control) SNP-SNVs (50%) (3,669, 3,669, 9,901) SNP-SNVs (50%) (3,670, 3,613, 7,349)
Number of training examples for each different iteration (iter. 1, iter. 2 and iter. 3.) are shown in parentheses.
Mort et al. Genome Biology 2014, 15:R19 Page 4 of 20http://genomebiology.com/2014/15/1/R19
build the third iteration (Iter. 3), the semi-supervisedlabeling of variants was based on the second iteration(Iter. 2) model of the respective training sets; this clas-sifier was then applied to the unlabeled data (47,228disease-causing missense mutations and 192,841 mis-sense and same-sense variants from the 1000 GenomesProject) from which confidently labeled examples wereused to supplement the existing training sets used inIter. 2. A RF classifier was then built with the expandedtraining sets to complete the third iteration (Iter. 3). Itshould be noted that the data sets employed here forboth training and subsequent analysis only include vari-ants for which all splicing-relevant features could bederived; therefore, variants with missing values were ex-cluded from the data set.To summarize: iteration 1 (Iter. 1), model built using
original training data; iteration 2 (Iter. 2), negative sets(DM-SNVs and SNP-SNVs) had predicted SAVs re-moved; iteration 3 (Iter. 3), positive and negative setswere supplemented with data labeled from the respectivemodel produced in iteration 2 (Iter. 2).
Discriminative features investigated in this studyIn order to evaluate discriminative features or attributesuseful in the identification of exonic single base substitu-tions that modulate splicing, an array of features werederived based upon the genomic coordinate of the sub-stitution in the human reference assembly (GRCh37/hg19). The majority of existing features employed herewere chosen because of prior evidence identifying themas useful in a splicing context [35,41].Features investigated in this study can be broadly split
into three classes: (1) features directly pertaining to thevariant under consideration (SNP-based); (2) features as-sociated with the exon (and flanking intron) in whichthe variant is located (exon-based); (3) features pertain-ing to the gene in which the variant occurs (gene-based).
SNP-based featuresTen different types of SNP-based features were selected(see Table 3 for a summary of SNP-based features andhow they were constructed). SNP-based features includedthe distance of the substitution from the nearest splice site(5′ or 3′). To assess the loss and/or gain of ESR elements(ESR change) consequent to a substitution, we employed a
previously described method [35] that models the effect ofa nucleotide substitution on both the number of ESE andESS sites created (gained) or abolished (lost) as a conse-quence of the substitution. Since a number of experimen-tally or computationally derived sets of ESR (ESE andESS) motifs have been previously identified, includingRESCUE-ESE [15], PESE and PESS [19], Fas-ESS [18], weselected the NI-ESR hexamers [17], comprising 979 ESEmotifs and 496 ESS motifs, for use in this analysis. Thiswas because this set had previously been found to providethe strongest signal for identifying exon-skipping variants[35]. The NI-ESR set uses the neighborhood inference(NI) algorithm to identify new ESR motifs based uponpreviously identified sets of ESR elements (RESCUE-ESE,PESE, PESS and FAS-ESS). A subset of the newly identi-fied ESR motifs predicted by the NI algorithm was thenvalidated using an in vivo splicing reporter assay. The ESRchange feature was then calculated using a sliding windowthat covered all hexamers surrounding the variant. Hexam-ers not present in the NI-ESR set were considered to beneutral. The ESR change comprises nine features derivedfrom the frequency of ESR changes resulting from the sub-stitution: ESE to neutral (ESE loss), ESE to ESE, neutral toESE (ESE gain), ESE to ESS (ESE loss and ESS gain), neu-tral to neutral, ESS to ESS, neutral to ESS (ESS gain), ESSto neutral (ESS loss), ESS to ESE (ESS loss and ESE gain).To express the relationship between disease and neutral
variants and their differential distributions with respect toloss or gain of an ESE or ESS, we constructed a novel ESRhexamer score (ESR-HS) function. This scoring functionis outlined in Figure S2 in Additional file 2. To calculatethis score, let t ∈ {ESEloss, ESEgain, ESSloss, ESSgain}, andlet St,0,hgmd … St,n,hgmd and St,0,snp … St,n,snp be normalizedcounts plus a pseudocount for each hexamer in set twhere n is the number of hexamers such that:
XiSt;i;hgmd� � ¼ 1 and
XiSt;i;snp� � ¼ 1
For some hexamer k in set t, let Ht,k,0,hgmd … Ht,k,5,hgmd
and Ht,k,0,snp … Ht,k,5,snp be normalized counts plus apseudocount for position 0 through 5 such that:
XiHt;k;i;hgmd� � ¼ 1 and
XiHt;k;i;snp� � ¼ 1

Table 3 Summary of features investigated in this study
Feature Type Description
Distance to nearest splice site SNP-based Distance between a given variant and the nearest 5′ or3′ splice site in the target exon.
ESR change SNP-based Change in the frequency of ESR elements subsequentto a single base substitution. This includes:
ESE to neutral (ESE loss)
ESE to ESE (no change)
Neutral to ESE (ESE gain)
ESE to ESS (ESE loss and ESS gain)
Neutral to neutral (no change)
ESS to ESS
Neutral to ESS (ESS gain)
ESS to neutral (ESS loss)
ESS to ESE (ESS loss and ESE gain)
In ESE SNP-based Frequency of ESE binding sites (in the wild-type) thatoverlap with the location of the variant
In ESS SNP-based Frequency of ESS binding sites (in the wild-type) thatoverlap with the variant
ESR hexamer score (ESR-HS) SNP-based Hexamer scoring function to express the relationshipbetween disease and neutral variants and their differentialdistributions with respect to loss or gain of an ESE or ESS
Spectrum kernel SNP-based Frequency of 3-mers and 4-mers over an 11 bp window(wild type and mutant)
Change in natural splice site strength SNP-based MaxEnt splice site score of natural splice site in mutant alleleminus MaxEnt splice site score of wild-type allele
Maximum cryptic splice site SNP-based Maximum cryptic splice site (5′ and 3′) score (outside of thenatural splice site) found overlapping the variant on the mutant allele
Evolutionarily conserved element SNP-based PhastCons conserved element probability for substitution site,based on multiple alignments of 46 placental mammals
Base-wise evolutionary conservation SNP-based PhyloP base-wise sequence conservation score at site ofsingle base substitution based on multiple sequence alignmentof 46 placental mammals
Natural wild-type splice site strength Exon-based MaxEntScan score of the natural 5′ and 3′ splice site of thewild-type target exon
Flanking intron size Exon-based Length in base-pairs of the upstream and downstream intronsflanking the target exon
Intronic ESS density Exon-based Intronic ESS density was calculated for 100 bp upstream and100 bp downstream of the target exon
Exonic ESS density Exon-based ESS density was calculated across the first 50 bp and the last50 bp of the target exon. If the length of the exon wasless than 100 bp, then the full length of the exon was used tocalculate the ESS density
Exonic ESE density Exon-based Same as above but for ESEs
Internal coding exon Exon-based {true, false}, Is the target exon an internal coding exon(that is, the target exon is not the first or last coding exon)
Exonic GC content Exon-based Percentage of nucleotides that are either guanine or cytosinein the target exon
Exon size Exon-based Size of the target exon
Constitutive exon Exon-based Is the target exon constitutively spliced
Exon number Gene-based Number of exons in the transcript
Transcript number Gene-based Number of different reported isoforms that the target gene encodes
Mort et al. Genome Biology 2014, 15:R19 Page 5 of 20http://genomebiology.com/2014/15/1/R19

Mort et al. Genome Biology 2014, 15:R19 Page 6 of 20http://genomebiology.com/2014/15/1/R19
Now we define the combined ESR-HS for a specificsubstitution affecting position j of hexamer k in set t,such that:
ESR‐SH ¼ log2 St;k;hgmd=St;k;snp� �þ log2 Ht;k;hgmd=Ht;k;j;snp
� �
Thus, this ESR-HS is a robust independent combin-ation of the differential strength of the hexamer plus thedifferential strength of the mutated base in the hexamer.Another SNP-based feature utilized was the change in
natural splice site strength (5′ and 3′) as a consequenceof the substitution, as measured by the MaxEntScan al-gorithm [33]. To model cryptic splice site activation, themaximum splice site score overlapping the variant (notincluding the natural splice site) found in the mutantRNA sequence was also measured. As it is unlikely thatall types of ESR (or other splicing element) have beenfully characterized to date, we attempted to overcomethis by applying a string-based sequence similarity kernel(the ‘spectrum kernel’), first proposed for classifying pro-tein sequences [42]. By applying the spectrum kernel toboth wild-type and mutant sequences, we could identifysplicing sequence motifs and measure any changes (lossor gain) consequent to a single base substitution. Thespectrum kernel was then applied over an 11 bp window(that is, 5 bp upstream and 5 bp downstream of the vari-ant) using the wild-type genomic RNA sequence tocount the frequencies of all k-mers of length = 4 (for ex-ample, AGAG, and so on) and length = 3 (for example,GAA); this process was then repeated for the mutant al-lele. Finally, for SNP-based features, evolutionary conser-vation based on PhyloP at the position of the substitution[43] and PhastCons [44] was computed, based on themultiple DNA sequence alignments of 46 placentalmammal species. The PhyloP score represents a base-by-base (ignores neighboring bases) conservation scorefor each base of the reference genome. Therefore, Phy-loP measures both conservation (slower than expectedevolutionary change) and accelerated evolution (fasterthan would be expected under neutral drift). The Phast-Cons score represents the probability of the mutatedbase being located within an evolutionarily conservedelement and therefore considers the conservation ofthe neighboring bases. PhastCons has been used toidentify candidate functional elements (for example,splicing factors) in genomic sequences [43]. Both thePhyloP and PhastCons scores were downloaded fromthe UCSC Genome Browser [45].
Exon-based featuresWith respect to the ‘target’ exon within which a givensubstitution occurred, nine exon-based features werecomputed. These features included natural wild-typesplice site strength (5′ and 3′) using the MaxEntScan
algorithm [33], flanking intron size, exon size, exonicGC content, exonic ESE density, exonic ESS density andintronic ESS density. ESE and ESS densities were calcu-lated using a sliding window across the first 50 bp andthe last 50 bp of each target exon. Where the length ofthe exon was <100 bp, then the full length of the exonwas used to calculate the ESE and ESS density. IntronicESS density values between 100 bp upstream and down-stream of the relevant exon were calculated in the samemanner as the exonic ESE and ESS density. Finally, forthe exon-based features, two Boolean features werecomputed; internal coding exon (the target exon is nei-ther the first nor the last coding exon) and constitutiveexon (exon is present in every transcript).
Gene-based featuresTwo gene-based features were calculated, the first beingthe number of exons in the target isoform and the sec-ond being the transcript number, which records thenumber of known protein isoforms that the target geneencodes.
Feature rankingThe performance of each feature (or feature subsets)under investigation (Table 3) was evaluated to assesshow informative specific features were in discriminatingbetween the DM-SAVs (positive class) and the SNVs(negative class). Feature ranking was then performed ontwo different sets of training data (Table 2; Disease nega-tive set and SNP negative set; Iter. 1). We evaluated theperformance (10-fold cross-validation; linear supportvector machine (SVM)) of each individual feature or fea-ture subset by training the ensemble of classificationmodels with only the specific feature being tested. Re-ceiver operating characteristic (ROC) curves and thearea under the ROC curve (AUC) were then calculatedfor each individual feature. A random feature was com-puted for each training example (numeric value between0 and 1) and the AUC generated using the random fea-ture alone was used as a control. The AUC from eachfeature was then compared to the random feature bymeans of a t-test with Bonferroni correction (signifi-cance level P < 0.05). Features that were significantly dif-ferent from random in the Disease negative set or SNPnegative set are shown in Figure 1.
Classification methodThe supervised classification method employed by Mut-Pred Splice was RF [46], an ensemble method usinghundreds of decision trees to perform classification. RFhas been extensively used in bioinformatics applications,including the prediction of disease-causing mutations[8,47-49]. The popularity of RF is due in part to its sim-plicity with no fine-tuning of parameters required and in
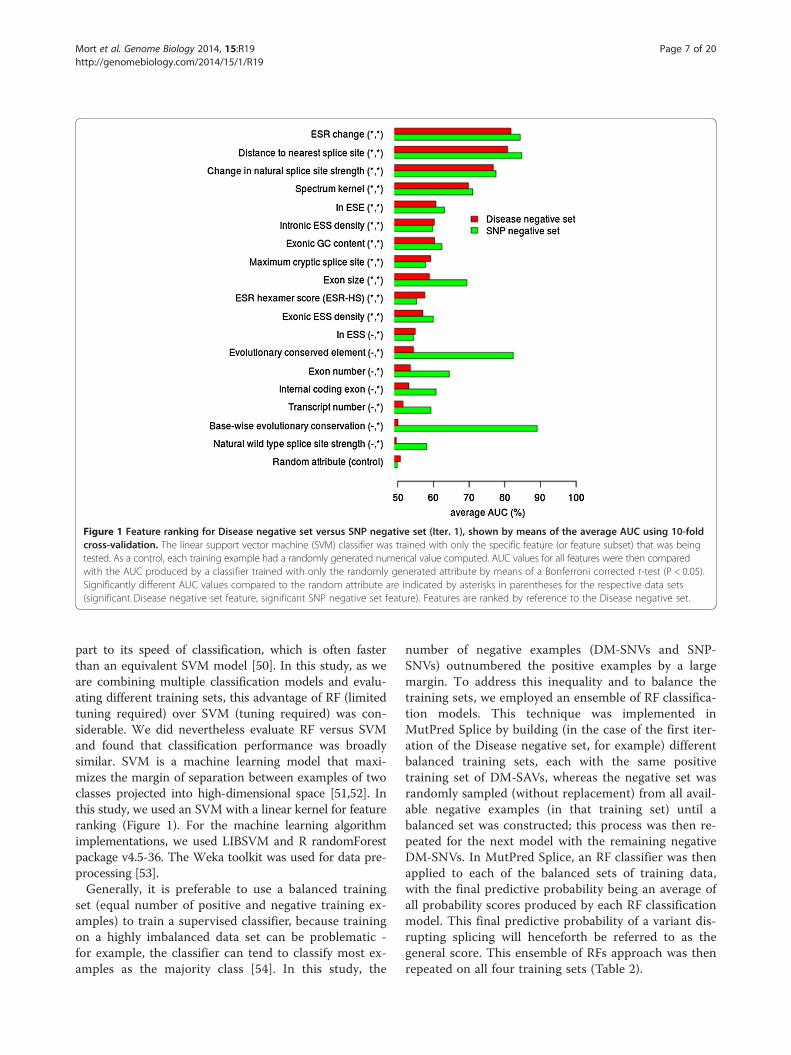
Figure 1 Feature ranking for Disease negative set versus SNP negative set (Iter. 1), shown by means of the average AUC using 10-foldcross-validation. The linear support vector machine (SVM) classifier was trained with only the specific feature (or feature subset) that was beingtested. As a control, each training example had a randomly generated numerical value computed. AUC values for all features were then comparedwith the AUC produced by a classifier trained with only the randomly generated attribute by means of a Bonferroni corrected t-test (P < 0.05).Significantly different AUC values compared to the random attribute are indicated by asterisks in parentheses for the respective data sets(significant Disease negative set feature, significant SNP negative set feature). Features are ranked by reference to the Disease negative set.
Mort et al. Genome Biology 2014, 15:R19 Page 7 of 20http://genomebiology.com/2014/15/1/R19
part to its speed of classification, which is often fasterthan an equivalent SVM model [50]. In this study, as weare combining multiple classification models and evalu-ating different training sets, this advantage of RF (limitedtuning required) over SVM (tuning required) was con-siderable. We did nevertheless evaluate RF versus SVMand found that classification performance was broadlysimilar. SVM is a machine learning model that maxi-mizes the margin of separation between examples of twoclasses projected into high-dimensional space [51,52]. Inthis study, we used an SVM with a linear kernel for featureranking (Figure 1). For the machine learning algorithmimplementations, we used LIBSVM and R randomForestpackage v4.5-36. The Weka toolkit was used for data pre-processing [53].Generally, it is preferable to use a balanced training
set (equal number of positive and negative training ex-amples) to train a supervised classifier, because trainingon a highly imbalanced data set can be problematic -for example, the classifier can tend to classify most ex-amples as the majority class [54]. In this study, the
number of negative examples (DM-SNVs and SNP-SNVs) outnumbered the positive examples by a largemargin. To address this inequality and to balance thetraining sets, we employed an ensemble of RF classifica-tion models. This technique was implemented inMutPred Splice by building (in the case of the first iter-ation of the Disease negative set, for example) differentbalanced training sets, each with the same positivetraining set of DM-SAVs, whereas the negative set wasrandomly sampled (without replacement) from all avail-able negative examples (in that training set) until abalanced set was constructed; this process was then re-peated for the next model with the remaining negativeDM-SNVs. In MutPred Splice, an RF classifier was thenapplied to each of the balanced sets of training data,with the final predictive probability being an average ofall probability scores produced by each RF classificationmodel. This final predictive probability of a variant dis-rupting splicing will henceforth be referred to as thegeneral score. This ensemble of RFs approach was thenrepeated on all four training sets (Table 2).
Mort et al. Genome Biology 2014, 15:R19 Page 8 of 20http://genomebiology.com/2014/15/1/R19
Performance evaluationIn order to evaluate the impact of different negative
training sets on classification performance, each versionof MutPred Splice (built using a different negative setand subsequent iteration; Table 2) was evaluated againstthe same independently derived experimentally charac-terized unseen test set (not present in any training dataor subsequent iterations thereof). This unseen test setcomprised 291 exonic variants (177 positive and 114negative) experimentally demonstrated to cause eitherexon skipping, exon retention or cryptic splice siteactivation and previously compiled by others [35,55-59]and 61 disease-causing exonic splice site (donor -1, ac-ceptor +1) mutations reported in the literature (derivedfrom HGMD). The final unseen test set (Table S2 inAdditional file 1) therefore contained 352 variants (238positive and 114 negative). Using this unseen test set, wewere able to establish whether the MutPred Splice predic-tions were true positives (TP; that is, predicted to disruptsplicing and demonstrated to disrupt splicing experimen-tally), false positives (FP; that is, predicted to disrupt
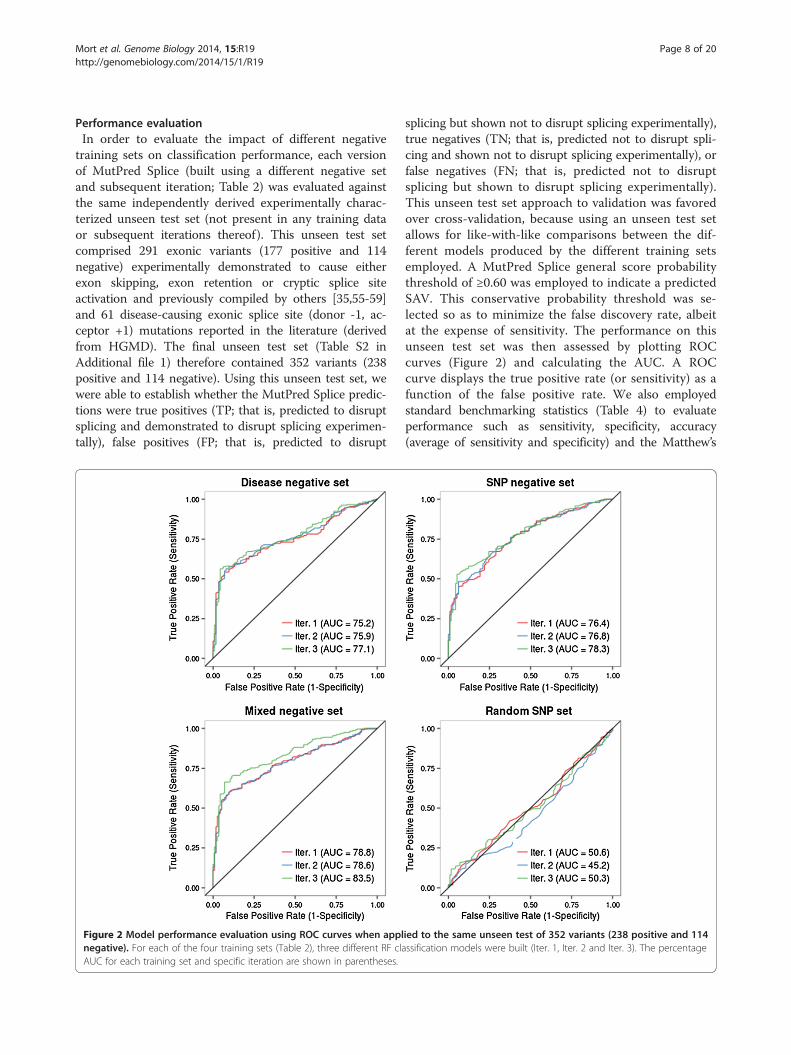
Figure 2 Model performance evaluation using ROC curves when applnegative). For each of the four training sets (Table 2), three different RF claAUC for each training set and specific iteration are shown in parentheses.
splicing but shown not to disrupt splicing experimentally),true negatives (TN; that is, predicted not to disrupt spli-cing and shown not to disrupt splicing experimentally), orfalse negatives (FN; that is, predicted not to disruptsplicing but shown to disrupt splicing experimentally).This unseen test set approach to validation was favoredover cross-validation, because using an unseen test setallows for like-with-like comparisons between the dif-ferent models produced by the different training setsemployed. A MutPred Splice general score probabilitythreshold of ≥0.60 was employed to indicate a predictedSAV. This conservative probability threshold was se-lected so as to minimize the false discovery rate, albeitat the expense of sensitivity. The performance on thisunseen test set was then assessed by plotting ROCcurves (Figure 2) and calculating the AUC. A ROCcurve displays the true positive rate (or sensitivity) as afunction of the false positive rate. We also employedstandard benchmarking statistics (Table 4) to evaluateperformance such as sensitivity, specificity, accuracy(average of sensitivity and specificity) and the Matthew’s
ied to the same unseen test of 352 variants (238 positive and 114ssification models were built (Iter. 1, Iter. 2 and Iter. 3). The percentage

Table 4 Standard performance benchmarks for MutPred Splice based on an unseen test set of 352 variants (238positive, 114 negative) using the three different iterations (Iter. 1, Iter 2. and Iter. 3) of the four different training setsidentified in this study (Table 2)
Data set False positive rate (%) Sensitivity (%) Specificity (%) Accuracy (%) AUC (%) MCC
Disease negative set Iter. 1 7.0 53.4 93.0 73.2 75.2 0.45
Iter. 2 7.0 52.5 93.0 72.8 75.9 0.44
Iter. 3 4.4 55.0 95.6 75.3 77.1 0.49
SNP negative set Iter. 1 36.8 73.1 63.2 68.1 76.4 0.35
Iter. 2 36.8 72.3 63.2 67.7 76.8 0.34
Iter. 3 34.2 71.0 65.8 68.4 78.3 0.35
Mixed negative set Iter. 1 7.9 56.3 92.1 74.2 78.8 0.46
Iter. 2 7.9 56.7 92.1 74.4 78.6 0.46
Iter. 3 7.0 64.7 93.0 78.8 83.5 0.54
Random SNP set Iter. 1 0.0 1.3 100.0 50.6 50.6 0.06
Iter. 2 0.9 1.7 99.1 50.4 45.2 0.03
Iter. 3 29.8 31.1 70.2 50.6 50.3 0.01
Classification models were built using RF with 1,000 trees. The unseen test set was experimentally characterized with respect to the splicing phenotype.Performance benchmarks for the final classification model (Mixed negative set; Iter. 3) are highlighted in bold. Performance metrics where appropriate werecalculated using a probability threshold (general score) ≥0.60. The Random SNP set is a control set. MCC, Matthews correlation coefficient.
Mort et al. Genome Biology 2014, 15:R19 Page 9 of 20http://genomebiology.com/2014/15/1/R19
correlation coefficient (MCC) [60]. The MCC wasemployed since it represents one of the best available mea-sures of prediction quality. It returns a value between -1and +1; a coefficient of -1 represents the worst possibleprediction, 0 a random prediction and +1 a perfectprediction.
Experimental characterization of mRNA phenotypeThe impact of the inherited disease-causing mutationNM_000051.3: ATM c.5932G >T; NP_000042.3: p.E1978Xwas assayed in a patient-derived cell line carrying theE1978X mutation or a control cell line (HEK293). TotalRNA was extracted from cells using Trireagent LS(Sigma Aldrich, St. Louis, MO USA) and analyzed byRT-PCR using One-Step RT-PCR mix (Invitrogen,Carlsbad, CA USA). Amplicons corresponding to theexon 41 included or skipped product were resolved byagarose gel electrophoresis and visualized by SYBRGold staining (Figure S1 in Additional file 2).
Comparison with existing tools used to identify SAVsMutPred Splice was designed to identify exonic variantsthat disrupt pre-mRNA splicing via multiple mecha-nisms: for example, splice site disruption, cryptic splicesite activation and exon skipping, and so on. In order toevaluate the performance of MutPred Splice, we optedto compare MutPred Splice with ANNOVAR [61], HSF[36] and Skippy [35]. Although not all the methods eval-uated here are directly comparable (since they have dif-ferent applications and limitations), this selection oftools is nevertheless a fair reflection of the various typesof software currently available to identify exonic SAVs. Forthe purposes of this evaluation, we followed, wherever
appropriate and possible, the reported guidelines for per-formance evaluation of mutation prediction methods [62].We employed 264 exonic variants (181 positive, 83 nega-tive) derived from the unseen test where predictions couldbe obtained from all the tools evaluated here. For ANNO-VAR and Skippy, the unseen test set included positiveSAVs that actually lie outside of the scope of the respectivemethod. Therefore, adjusted performance metrics are alsoshown using a subset of the overall test set relevant to thespecific method. For methods that output multiple scoresfor a given variant (HSF and Skippy), performance metricsmay differ depending upon both the features and thethresholds applied. For a detailed description of guide-lines, applications and performance of the tools evaluatedhere, the reader is referred to the relevant website or ori-ginal reporting publications.
Role of pre-mRNA splicing disruption in inherited disease,cancer and polymorphismTo assess the proportion of exonic mutations that dis-rupt splicing in the context of human inherited diseaseand cancer, three data sets were compiled (Table 5).First, 61,305 inherited disease-causing exonic mutationsfrom HGMD (August 2012) referred to as ‘Inheriteddisease’. It should be noted that owing to the inclusioncriteria employed by HGMD, the majority of disease-causing same-sense mutations reported in HGMD areputatively splicing-sensitive and so it is expected that amajority of these inherited disease-causing same-sensemutations will be also predicted to disrupt pre-mRNAsplicing. Second, 480,730 somatic exonic cancer variantsderived from COSMIC [63,64], referred to as ‘Cancer’. Asubset of these somatic cancer variants will be drivers

Table 5 Predicted proportion of exonic variants that disrupt pre-mRNA splicing in human genetic disease (Inheriteddisease, that is, germline; and Cancer, that is, somatic) and also identified in the general population (1000 GenomesProject participants)
Data set Proportion of SAVs in data set (predicted SAVs/total variants)
Missense Same-sense Nonsense Total
Inherited disease 11.0% (5,193/47,228) 90.3% (468/518) 30.5% (4,130/13,559) 16.0% (9,791/61,305)
Cancer 9.2% (32,056/347,380) 8.6% (9,010/105,094) 32.4% (9,141/28,256) 10.4% (50,207/480,730)
1000 Genomes 6.8% (7,016/103,445) 6.7% (5,968/89,396) 19.5% (273/1,400) 6.8% (13,257/194,241)
The somatic Cancer data set includes driver and passenger mutations recorded in COSMIC [63]. The 1000 Genomes Project data set was derived from the 1000Genomes Project without any MAF filter having been applied, that is, all rare and common variants were included. The proportion of predicted SAVs for each dataset is shown together with the frequencies of predicted SAVs; the sizes of the data sets are shown in parentheses.
Table 6 Predicted proportion of exonic variants from twogene subsets (tumor suppressor versus oncogenes) thatdisrupt pre-mRNA splicing in human genetic disease(Inherited disease that is, germline and Cancer that is,somatic) and also identified in the general population(1000 Genomes project participants)
Data set Proportion of SAVs in data set(predicted SAVs/total variants)
Tumor suppressor Oncogenes
Inherited disease 25.3% (1,130/4,463) 10.9% (132/1,207)
Cancer 16.0% (1,612/10,082) 10.9% (525/4,831)
1000 Genomes 7.4% (84/1,133) 8.0% (49/612)
The somatic Cancer data set includes driver and passenger mutationsrecorded in COSMIC [63]. The 1000 Genomes Project data set was derivedfrom the 1000 Genomes Project without any MAF filter having been applied,that is, all rare and common variants were included. The proportion ofpredicted SAVs for each data set is shown, together with the frequencies ofpredicted SAVs; the sizes of the data sets are shown in parentheses.
Mort et al. Genome Biology 2014, 15:R19 Page 10 of 20http://genomebiology.com/2014/15/1/R19
(directly implicated in oncogenesis), the remainder beingpassengers (neutral with respect to cellular prolifera-tion). A third data set comprised 194,241 exonic vari-ants, identified by the 1000 Genomes Project [38]referred to as ‘1000 Genomes’, and was used to compareand contrast with the disease data sets. Unlike the dataset employed in training (SNP-SNVs), no MAF filter wasapplied; therefore, this data set includes both rare andcommon variants identified in the 1000 Genomes Project.These data sets represent variants for which all requiredfeatures could be computed; variants with missing valueswere excluded from the analysis. The MutPred Splicemodel, built using the Mixed negative set (Iter. 3), wasthen applied to all three data sets.
Predicting the splicing mechanism disrupted by a SAVThe prediction of the underlying splicing mechanism dis-rupted by a SAV (for example, cryptic splice site activa-tion) is based on a previously described method [8], whichcompares the relevant splicing property with that of therespective distribution of scores obtained from pre-dicted SNVs found in the 1000 Genomes Project. A Zscore P-value < 0.05 is considered a confident hypothesis.
Exonic variants in oncogenes and tumor suppressor genesA list of 71 oncogenes and 54 tumor suppressor (TS)genes were compiled [65]. These two gene sets were thencross-checked against the genes recorded in the datasetsused previously (Inherited disease, Cancer and 1000 Ge-nomes with no MAF filter applied). Using these two sub-sets (oncogenes versus TS) for each of the three data sets,we applied MutPred Splice (Mixed negative set; Iter. 3) toidentify the proportion of SAVs in these subsets (Table 6).
MutPred splice availabilityThe latest MutPred Splice model is available online at[66] or to download for local installation from [67]. Thesource code is available from [68]. As new examples ofSAVs are reported in the literature, MutPred Splice willbe retrained so as to incorporate these additional posi-tive examples of SAVs. This will help to ensure that the
model is kept up to date with developments as they arereported in the literature. To facilitate the use ofMutPred Splice in an NGS setting, VCF (Variant CallFormat) files can be uploaded (or processed locally) foranalysis.
ResultsIdentification of informative features for discriminatingbetween SAVs and SNVsRanking the features individually using the AUC of theROC (linear SVM; 10-fold cross-validation) using twodifferent training sets (Disease negative set versus SNPnegative set), allowed us to compare and contrast thediscriminatory importance of the different features useddepending upon the specific negative set being employed(Figure 1). Training the classifier using the Disease nega-tive set identified 11 informative features (Figure 1) thathad significantly different AUC values when comparedto the AUC produced by a randomly generated attribute(random attribute AUC = 50.7%; t-test with Bonferronicorrection; P < 0.05). For the Disease negative set, thehighest ranking features (AUC >70%) were ESR change(AUC of 81.8%), distance to nearest splice site (AUC of
Mort et al. Genome Biology 2014, 15:R19 Page 11 of 20http://genomebiology.com/2014/15/1/R19
80.8%) and change in natural splice site strength (AUCof 76.8%).Using a classifier trained with the SNP negative set, we
identified 18 informative features (Figure 1) that had sig-nificantly different AUC values compared to the AUCproduced by a randomly generated attribute (random at-tribute AUC = 49.8%; t-test with Bonferroni correction;P < 0.05). For the SNP negative set, the highest rankingfeatures (AUC >70%) were base-wise evolutionary con-servation (AUC of 89.1%), distance to nearest splice site(AUC of 84.8%), ESR change (AUC of 84.3%), evolution-arily conserved element (AUC of 82.4%), change innatural splice site strength (AUC of 77.6%) and thespectrum kernel (AUC of 71.0%). Generally, features thatperformed significantly better than random for the Dis-ease negative set displayed broadly similar performanceirrespective of the training set (Disease negative set orSNP negative set) employed. This feature ranking usingdifferent negative data sets highlights the importance ofevaluating (and experimenting with) different negativedata sets, because the choice of training data has a sig-nificant impact upon error rate estimation and the abil-ity of the classifier to generalize to other data sets [69].
Performance evaluationWe evaluated four different training sets (Table 1) andthree different iterations of each set (Table 2). These dif-ferent models were evaluated using a previously com-piled unseen set (not present in any training set), forwhich the variants had been experimentally character-ized with respect to their splicing phenotype (SAV orSNV). Figure 2 shows the ROC curves for the four dif-ferent MutPred Splice classification models, generatedusing the same unseen test set. In all three iterations(Iter. 1, Iter. 2 and Iter. 3), the Mixed negative set (whichcombines the Disease negative and SNP negative train-ing data) outperformed the other models within thesame iteration with AUCs of 78.8% (Iter. 1), 78.6%(Iter. 2) and 83.5% (Iter. 3). The Mixed negative set alsodemonstrated the biggest improvement in performanceby employing a semi-supervised approach (as judged bythe AUC) from Iter. 1 to Iter 3, with a 4.7% AUC in-crease, compared with both the Disease negative set andthe SNP negative set achieving an increase of 1.9%.Standard performance metrics (in addition to the AUC)for all training sets and subsequent iterations are dis-played in Table 4. Interestingly, the SNP negative set ini-tially (Iter. 1) had the highest false positive rate (FPR;36.8%) compared with the Disease negative set (7.0%FPR) and Mixed negative set (7.9% FPR). For all trainingsets, the semi-supervised approach employed in Iter 3.reduced the initial FPR (Iter. 1) and in the case of boththe Disease negative and Mixed negative sets, sensitivityalso increased. Therefore, by the third iteration, the
Mixed negative set was achieving the highest MCC scoreof all the training sets (0.54) and the FPR rate had dimin-ished from 7.9% to 7.0%, whilst sensitivity had increasedfrom 56.3% to 64.7%. Based on the results of the evalu-ation, the Mixed negative classification model (Iter. 3) witha 7.0% FPR, 64.7% sensitivity, 93.0% specificity, 83.5%AUC and 0.54 MCC was selected as the final MutPredSplice classification model. Therefore, all further analysiswas performed using this final predictive model.
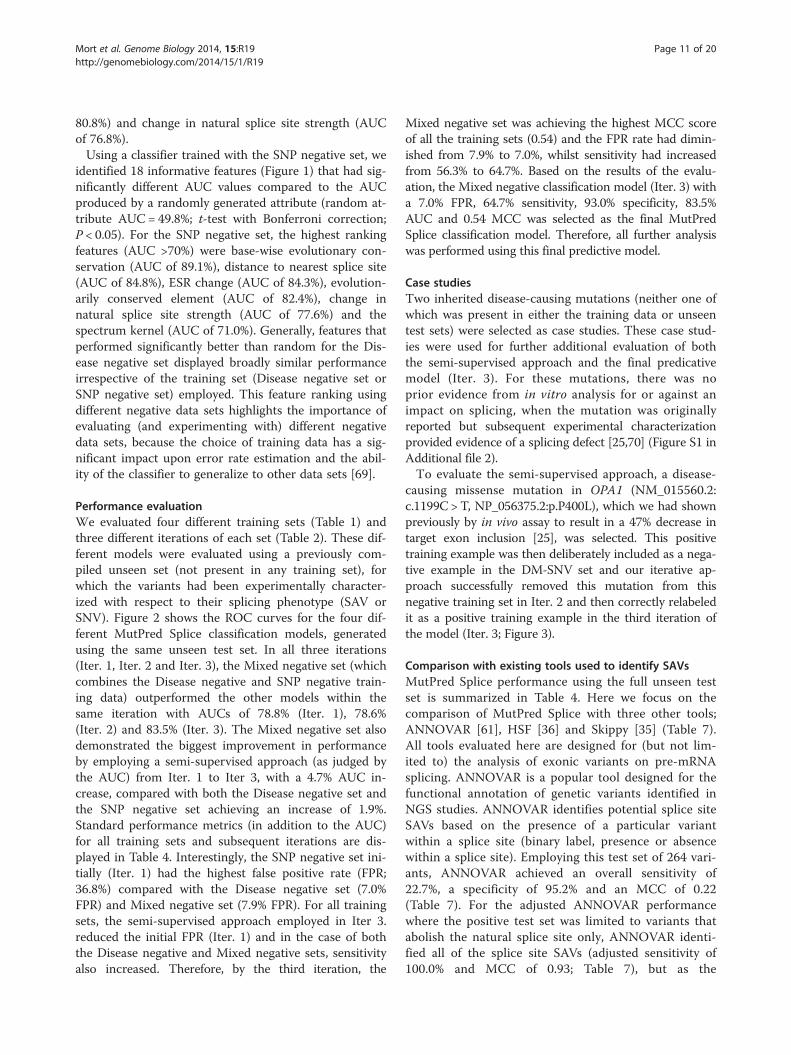
Case studiesTwo inherited disease-causing mutations (neither one ofwhich was present in either the training data or unseentest sets) were selected as case studies. These case stud-ies were used for further additional evaluation of boththe semi-supervised approach and the final predicativemodel (Iter. 3). For these mutations, there was noprior evidence from in vitro analysis for or against animpact on splicing, when the mutation was originallyreported but subsequent experimental characterizationprovided evidence of a splicing defect [25,70] (Figure S1 inAdditional file 2).To evaluate the semi-supervised approach, a disease-
causing missense mutation in OPA1 (NM_015560.2:c.1199C > T, NP_056375.2:p.P400L), which we had shownpreviously by in vivo assay to result in a 47% decrease intarget exon inclusion [25], was selected. This positivetraining example was then deliberately included as a nega-tive example in the DM-SNV set and our iterative ap-proach successfully removed this mutation from thisnegative training set in Iter. 2 and then correctly relabeledit as a positive training example in the third iteration ofthe model (Iter. 3; Figure 3).
Comparison with existing tools used to identify SAVsMutPred Splice performance using the full unseen testset is summarized in Table 4. Here we focus on thecomparison of MutPred Splice with three other tools;ANNOVAR [61], HSF [36] and Skippy [35] (Table 7).All tools evaluated here are designed for (but not lim-ited to) the analysis of exonic variants on pre-mRNAsplicing. ANNOVAR is a popular tool designed for thefunctional annotation of genetic variants identified inNGS studies. ANNOVAR identifies potential splice siteSAVs based on the presence of a particular variantwithin a splice site (binary label, presence or absencewithin a splice site). Employing this test set of 264 vari-ants, ANNOVAR achieved an overall sensitivity of22.7%, a specificity of 95.2% and an MCC of 0.22(Table 7). For the adjusted ANNOVAR performancewhere the positive test set was limited to variants thatabolish the natural splice site only, ANNOVAR identi-fied all of the splice site SAVs (adjusted sensitivity of100.0% and MCC of 0.93; Table 7), but as the
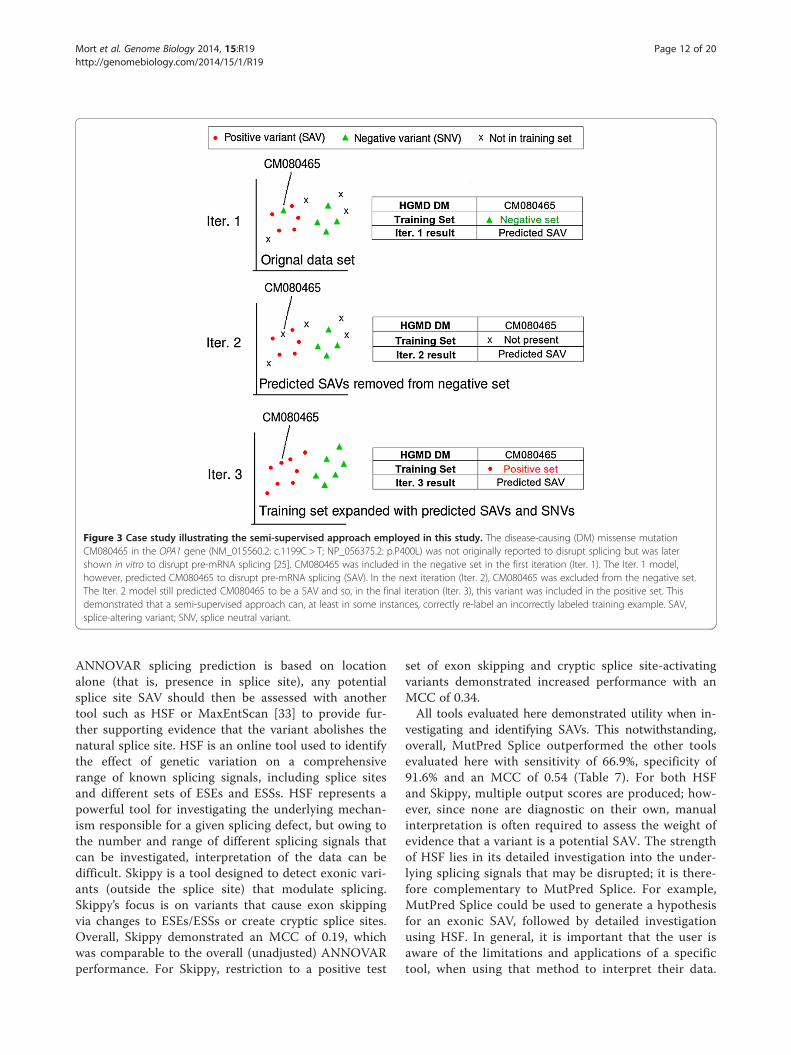
Figure 3 Case study illustrating the semi-supervised approach employed in this study. The disease-causing (DM) missense mutationCM080465 in the OPA1 gene (NM_015560.2: c.1199C > T; NP_056375.2: p.P400L) was not originally reported to disrupt splicing but was latershown in vitro to disrupt pre-mRNA splicing [25]. CM080465 was included in the negative set in the first iteration (Iter. 1). The Iter. 1 model,however, predicted CM080465 to disrupt pre-mRNA splicing (SAV). In the next iteration (Iter. 2), CM080465 was excluded from the negative set.The Iter. 2 model still predicted CM080465 to be a SAV and so, in the final iteration (Iter. 3), this variant was included in the positive set. Thisdemonstrated that a semi-supervised approach can, at least in some instances, correctly re-label an incorrectly labeled training example. SAV,splice-altering variant; SNV, splice neutral variant.
Mort et al. Genome Biology 2014, 15:R19 Page 12 of 20http://genomebiology.com/2014/15/1/R19
ANNOVAR splicing prediction is based on locationalone (that is, presence in splice site), any potentialsplice site SAV should then be assessed with anothertool such as HSF or MaxEntScan [33] to provide fur-ther supporting evidence that the variant abolishes thenatural splice site. HSF is an online tool used to identifythe effect of genetic variation on a comprehensiverange of known splicing signals, including splice sitesand different sets of ESEs and ESSs. HSF represents apowerful tool for investigating the underlying mechan-ism responsible for a given splicing defect, but owing tothe number and range of different splicing signals thatcan be investigated, interpretation of the data can bedifficult. Skippy is a tool designed to detect exonic vari-ants (outside the splice site) that modulate splicing.Skippy’s focus is on variants that cause exon skippingvia changes to ESEs/ESSs or create cryptic splice sites.Overall, Skippy demonstrated an MCC of 0.19, whichwas comparable to the overall (unadjusted) ANNOVARperformance. For Skippy, restriction to a positive test
set of exon skipping and cryptic splice site-activatingvariants demonstrated increased performance with anMCC of 0.34.All tools evaluated here demonstrated utility when in-
vestigating and identifying SAVs. This notwithstanding,overall, MutPred Splice outperformed the other toolsevaluated here with sensitivity of 66.9%, specificity of91.6% and an MCC of 0.54 (Table 7). For both HSFand Skippy, multiple output scores are produced; how-ever, since none are diagnostic on their own, manualinterpretation is often required to assess the weight ofevidence that a variant is a potential SAV. The strengthof HSF lies in its detailed investigation into the under-lying splicing signals that may be disrupted; it is there-fore complementary to MutPred Splice. For example,MutPred Splice could be used to generate a hypothesisfor an exonic SAV, followed by detailed investigationusing HSF. In general, it is important that the user isaware of the limitations and applications of a specifictool, when using that method to interpret their data.
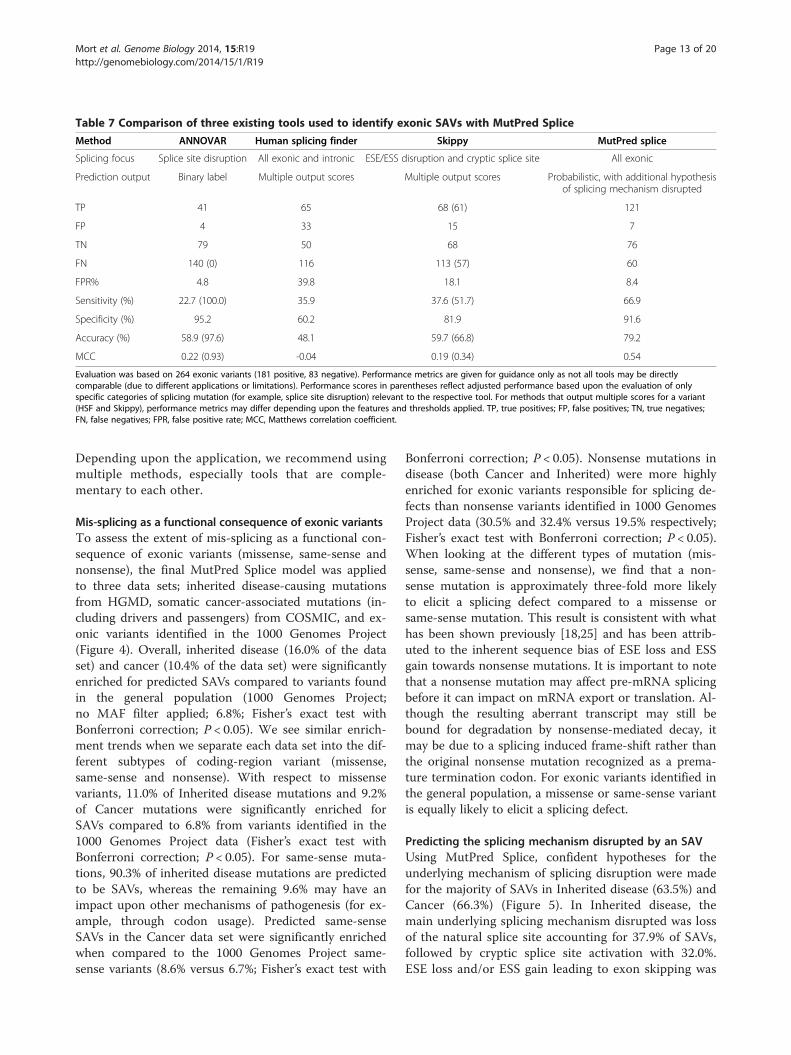
Table 7 Comparison of three existing tools used to identify exonic SAVs with MutPred Splice
Method ANNOVAR Human splicing finder Skippy MutPred splice
Splicing focus Splice site disruption All exonic and intronic ESE/ESS disruption and cryptic splice site All exonic
Prediction output Binary label Multiple output scores Multiple output scores Probabilistic, with additional hypothesisof splicing mechanism disrupted
TP 41 65 68 (61) 121
FP 4 33 15 7
TN 79 50 68 76
FN 140 (0) 116 113 (57) 60
FPR% 4.8 39.8 18.1 8.4
Sensitivity (%) 22.7 (100.0) 35.9 37.6 (51.7) 66.9
Specificity (%) 95.2 60.2 81.9 91.6
Accuracy (%) 58.9 (97.6) 48.1 59.7 (66.8) 79.2
MCC 0.22 (0.93) -0.04 0.19 (0.34) 0.54
Evaluation was based on 264 exonic variants (181 positive, 83 negative). Performance metrics are given for guidance only as not all tools may be directlycomparable (due to different applications or limitations). Performance scores in parentheses reflect adjusted performance based upon the evaluation of onlyspecific categories of splicing mutation (for example, splice site disruption) relevant to the respective tool. For methods that output multiple scores for a variant(HSF and Skippy), performance metrics may differ depending upon the features and thresholds applied. TP, true positives; FP, false positives; TN, true negatives;FN, false negatives; FPR, false positive rate; MCC, Matthews correlation coefficient.
Mort et al. Genome Biology 2014, 15:R19 Page 13 of 20http://genomebiology.com/2014/15/1/R19
Depending upon the application, we recommend usingmultiple methods, especially tools that are comple-mentary to each other.
Mis-splicing as a functional consequence of exonic variantsTo assess the extent of mis-splicing as a functional con-sequence of exonic variants (missense, same-sense andnonsense), the final MutPred Splice model was appliedto three data sets; inherited disease-causing mutationsfrom HGMD, somatic cancer-associated mutations (in-cluding drivers and passengers) from COSMIC, and ex-onic variants identified in the 1000 Genomes Project(Figure 4). Overall, inherited disease (16.0% of the dataset) and cancer (10.4% of the data set) were significantlyenriched for predicted SAVs compared to variants foundin the general population (1000 Genomes Project;no MAF filter applied; 6.8%; Fisher’s exact test withBonferroni correction; P < 0.05). We see similar enrich-ment trends when we separate each data set into the dif-ferent subtypes of coding-region variant (missense,same-sense and nonsense). With respect to missensevariants, 11.0% of Inherited disease mutations and 9.2%of Cancer mutations were significantly enriched forSAVs compared to 6.8% from variants identified in the1000 Genomes Project data (Fisher’s exact test withBonferroni correction; P < 0.05). For same-sense muta-tions, 90.3% of inherited disease mutations are predictedto be SAVs, whereas the remaining 9.6% may have animpact upon other mechanisms of pathogenesis (for ex-ample, through codon usage). Predicted same-senseSAVs in the Cancer data set were significantly enrichedwhen compared to the 1000 Genomes Project same-sense variants (8.6% versus 6.7%; Fisher’s exact test with
Bonferroni correction; P < 0.05). Nonsense mutations indisease (both Cancer and Inherited) were more highlyenriched for exonic variants responsible for splicing de-fects than nonsense variants identified in 1000 GenomesProject data (30.5% and 32.4% versus 19.5% respectively;Fisher’s exact test with Bonferroni correction; P < 0.05).When looking at the different types of mutation (mis-sense, same-sense and nonsense), we find that a non-sense mutation is approximately three-fold more likelyto elicit a splicing defect compared to a missense orsame-sense mutation. This result is consistent with whathas been shown previously [18,25] and has been attrib-uted to the inherent sequence bias of ESE loss and ESSgain towards nonsense mutations. It is important to notethat a nonsense mutation may affect pre-mRNA splicingbefore it can impact on mRNA export or translation. Al-though the resulting aberrant transcript may still bebound for degradation by nonsense-mediated decay, itmay be due to a splicing induced frame-shift rather thanthe original nonsense mutation recognized as a prema-ture termination codon. For exonic variants identified inthe general population, a missense or same-sense variantis equally likely to elicit a splicing defect.
Predicting the splicing mechanism disrupted by an SAVUsing MutPred Splice, confident hypotheses for theunderlying mechanism of splicing disruption were madefor the majority of SAVs in Inherited disease (63.5%) andCancer (66.3%) (Figure 5). In Inherited disease, themain underlying splicing mechanism disrupted was lossof the natural splice site accounting for 37.9% of SAVs,followed by cryptic splice site activation with 32.0%.ESE loss and/or ESS gain leading to exon skipping was

Figure 4 Role of exonic variants in aberrant mRNA processing for Inherited disease and Cancer data sets. The somatic Cancer variantswere derived from COSMIC and include both driver and passenger mutations. For all mutation types and the combined total, the proportions ofpredicted SAVs in both Inherited disease and Cancer were significantly enriched (Fisher’s exact test with Bonferroni correction applied; P < 0.05)when compared to exonic variants identified in the 1000 Genomes Project (unlike the SNP negative training set, in this instance no MAF filterwas applied, that is, all rare and common variants were included).
Mort et al. Genome Biology 2014, 15:R19 Page 14 of 20http://genomebiology.com/2014/15/1/R19
predicted for 29.3% of SAVs. Exon retention of an alter-native exon was predicted to be the splicing defect inonly 0.8% of SAVs. By contrast, for SAVs in Cancer, thepredominant mechanism was ESE loss and/or ESS gain(38.7%), with Cancer being significantly enriched forSAVs causing ESE loss and/or ESS gain compared toInherited disease (Fisher’s exact test with Bonferronicorrection applied; P < 0.05).
Exonic SAVs in oncogenes and tumor suppressor genesSets of 71 oncogenes and 54 TS genes were selected asdescribed in Materials and methods. Disease-causingmutations in TS genes tend to be recessive loss-of-function (inactivating), in contrast to mutations in onco-genes, which are usually dominant gains-of-function(activating). The numbers of reported variants in thesetwo gene sets (oncogenes versus TS) are given in Table 6.When comparing each gene set within the same data set
(Inherited disease, Cancer and 1000 Genomes), we seethat exonic variants in Inherited disease (25.3%) and Can-cer (16.0%) are significantly enriched for SAVs in TS genescompared to oncogenes (Figure 6). This enrichment forSAVs in TS genes is not found when looking at vari-ants that are present in the general population (1000Genomes). These data suggest that aberrant pre-mRNA splicing may be a common mechanism for in-activation of TS genes. Including the data presented inFigure 5, we propose the provocative hypothesis thatTS gene architecture may be particularly ‘fragile’ in thesense that they have both inflated proportions of SAVsand higher rates of loss/gain of ESR elements thanother genes. If this hypothesis is correct, then when weattempt to identify somatic drivers in cancer in anNGS setting, the potential impact of all types of exonicvariant (missense, same-sense and nonsense) on pre-mRNA splicing should be highlighted rather than

Figure 5 Confident hypotheses of the underlying splicing mechanism disrupted for predicted exonic SAVs in Inherited disease andsomatic variants in Cancer. Significant enrichment (+) or depletion (-) for a specific hypothesis is shown for the Cancer versus Inherited diseasedatasets (Fisher’s exact test with a Bonferroni-corrected threshold of P < 0.05).
Mort et al. Genome Biology 2014, 15:R19 Page 15 of 20http://genomebiology.com/2014/15/1/R19
neglected. Future studies that investigate the aspects ofgene architecture that are responsible for an increasedsusceptibility to aberrant pre-mRNA splicing may illu-minate the validity of this hypothesis.
DiscussionThere is abundant evidence to suggest that, for bothcoding and non-coding variants, aberrant pre-mRNAsplicing is a common mechanism of pathogenesis inboth inherited disease and cancer. In order to predictpotential disease severity from genotype data, it is ne-cessary to comprehensively evaluate the potential func-tional impact of variants. Effective computational toolstargeted towards the characterization of the impact ofvariants on posttranscriptional gene regulatory functionare urgently required. Here we have developed andevaluated a novel computational model (MutPredSplice) that uses human disease alleles for training topredict exonic nucleotide substitutions that disruptpre-mRNA splicing. This approach is complementaryto other methods that utilize known splice sites orfunctional variants that have not been directly associ-ated with disease. Since MutPred Splice predictionscan be made for missense, same-sense and nonsensevariants, this tool significantly expands the scope ofexisting tools, which tend to focus almost exclusivelyon missense variants. When applied in an NGS setting,
MutPred Splice is designed to be run in parallel withother methods such as SIFT [2] or SNAP [6], whichidentify missense mutations that are likely to disruptprotein structure/function; however, it adds an add-itional degree of resolution because MutPred Splice isalso able to assess same-sense variants, which are typ-ically excluded by the majority of current NGS filter-ing strategies. Since we predict that approximately 7%of same-sense variants disrupt pre-mRNA splicing, itis clear that this class of variant should not be blithelydismissed from the outset as being neutral to function.
Training dataIn this study, we have highlighted the difficulty in select-ing an appropriate negative training set. Since the under-lying training data are fundamental to any derivedmodel, it is clear that selecting the appropriate negative(control) set is of equal importance to selecting the ap-propriate positive set. In this study, we found that highfrequency SNPs are a valuable source of training databut combining high frequency SNPs with an additionalnegative set of inherited disease-causing mutationsserves to increase the diversity in the training set and re-duces the FPR of the model, which results in improvedperformance over a model built using either negative seton its own.

Figure 6 Proportion of exonic variants involved in aberrant mRNA processing for a set of tumor suppressor genes (71 genes) and aset of oncogenes (54 genes), from three different data sets (Inherited disease, somatic mutations in Cancer, and variants identified inthe 1000 Genomes Project with no MAF filter applied, that is, all rare and common variants included). Disease-causing substitutions intumor suppressor (TS) genes tend to be recessive loss-of-function mutations, in contrast to disease-causing substitutions in oncogenes, which areusually dominant gain-of-function mutations. Inherited disease and Cancer are significantly enriched in the TS gene set (denoted by an asterisk),when compared with the equivalent set of oncogenes, for mutations that are predicted to result in aberrant mRNA processing (SAVs). P-valueswere calculated using a Fisher’s exact test with a Bonferroni-corrected threshold of P < 0.05.
Mort et al. Genome Biology 2014, 15:R19 Page 16 of 20http://genomebiology.com/2014/15/1/R19
Classification performanceThe lack of experimental splicing data for the majorityof disease-causing missense mutations means that thevast majority of this data set is untested with respectto their impact on the mRNA splicing phenotype(positive or negative). To mitigate this unknown quan-tity, in the second iteration of our models we removedpredicted SAVs from the negative set; however, modelperformance remained broadly constant. This demon-strates that the RF ensemble approach used through-out all iterations to balance the positive and negativesets also reduces the impact of noise in the negativeset. Based on previous studies that found that approxi-mately 25% of disease-causing missense mutations maydisrupt splicing [23-25], we adopted a semi-supervisedself-training approach in an attempt to label these un-labeled mutation data. This allowed us to utilize these
unlabeled data in a novel way, increase the training setsize and improve the identification of decision bound-aries between positive and negative classes. Indeed,utilization of semi-supervised learning in this instancesaw a performance increase for all models (Diseasenegative set, SNP negative set and Mixed negative set).Self-training does have its limitations and mistakes inthe first iteration could be subsequently reinforced; tomitigate this, only confident labels were applied to ex-pand the training sets. For the final MutPred Splicemodel, we selected the third iteration of the Mixednegative set, which when coupled with a conservativeprobability threshold (at the expense of sensitivity) be-comes a useful model for prioritizing SAVs, especiallyin an NGS setting, with a FPR of 7.0%, sensitivity of64.7% and specificity of 93.0%, AUC of 83.5% and anMCC of 0.54.

Mort et al. Genome Biology 2014, 15:R19 Page 17 of 20http://genomebiology.com/2014/15/1/R19
Exonic SAVs in inherited disease and cancerBased on previous work and also as demonstrated here,disruption to pre-mRNA splicing via exonic substitu-tions underlies a large proportion of inherited diseaseand cancer mutations. Here we estimate, based on thesensitivity and specificity of our model, that approxi-mately 16% of inherited disease and approximately 10 to14% of cancer exonic mutations impact upon pre-mRNA splicing, probably as a primary mechanism forpathogenicity. This is broadly in line with the results ofprevious studies. It should be noted, however, that thecancer set analyzed will contain a large proportion ofpassenger variants, which will almost certainly lead toa serious under-estimation of the actual number ofsplicing-sensitive cancer driver mutations.In recent years, evidence for the link between cancer
development and aberrant splicing has grown [71,72]. Inthis study, we have found that TS genes are significantlyenriched (when compared to oncogenes) in predictedexonic splicing mutations in both inherited disease andcancer. This enrichment is not found in variants identi-fied in the general population (Figure 6; 1000 GenomesProject data with no MAF filter applied). Interestingly,the disease-causing nonsense variant in the ATM gene(p.E1978X), which is experimentally demonstrated tocause exon skipping, was originally reported as causingataxia telangiectasia [73] but has in addition been associ-ated with breast cancer susceptibility [74].Aberrant pre-mRNA splicing in TS genes caused by
exonic variants may represent a common mechanism ofTS gene inactivation, thereby contributing to oncogen-esis. Whilst a role for aberrant splicing leading to TSgene loss-of-function is not altogether novel [75], thescale and potential involvement of splice-altering exonicvariants in oncogenesis is not well studied. The Cancerdataset has an increased tendency towards loss of ESEand/or gain of ESS elements (compared to the Inheriteddisease dataset). This finding could be explicable interms of an increased susceptibility of TS genes to aber-rant splicing.
Variants affecting pre-mRNA splicing in the generalpopulationHere we have shown that around 7% of exonic variantsfound in the general population may alter splicing. Suchvariants may exert their effects in different ways, from asubtle change that serves to modify gene expressionlevels, to a lesion that results in the complete deficiencyof the functional protein product. In some cases, there-fore, the impact of common variants on splicing maynot have an obvious phenotypic effect but could never-theless serve to modulate disease risk, especially in thecontext of complex disease; alternatively, it may act as adisease modifier. Interestingly, not all nonsense variants
can be considered equal with respect to their impact onsplicing. A nonsense mutation identified in the contextof inherited disease or cancer is predicted to be approxi-mately twice as likely to elicit a splicing defect whencompared to a nonsense variant found in the generalpopulation. Since this study was initiated and the train-ing set compiled, six variants that were initially found inthe general population (1000 Genomes Project), andwhich MutPred Splice predicted to disrupt pre-mRNAsplicing, have been subsequently reported as disease-causing, disease-associated or of functional significance(according to HGMD). For example, a predicted SAV inthe NPR3 gene (NM_000908.3: c.1429G >A; NP_000899.1:p.G477S) is associated with reduced NPR3 protein expres-sion [76]. Another example is a predicted SAV in theMACF1 gene (NM_012090.4: c.6868A >G; NP_036222.3:p.M2290V), which has been reported in association withtype 2 diabetes [77]. Interestingly, all six of these pre-dicted SAVs were also predicted to be tolerated by SIFT,highlighting the importance of using MutPred Splice inconjunction with other tools specifically designed to iden-tify missense mutations that disrupt protein structure and/or function (for example, SIFT and Polyphen2, and so on).
LimitationsWhilst the positive training set of SAVs employed hereconstitutes the largest available dataset of its kind, it islikely that a larger positive training set would be of con-siderable benefit. The other limitation is the ‘noise’ fromactual SAVs in the Disease negative set. The semi-supervised approach was therefore employed to counter-act these limitations. The MutPred Splice model will beretrained as more training data become available in theliterature. Additionally, our current knowledge about thesplicing code is still incomplete; for example, approxi-mately 9% of exon skipping SAVs displayed no obviouschanges in ESE/ESS elements [35], indicating that novelcis-acting splicing regulatory elements probably remainto be discovered. As our knowledge in this field ad-vances, more informative features can be derived andincorporated.Another limitation of our tool is the assumption that
the single exonic variant that is being assessed for aber-rant splicing is the only deviation between the relevantreference sequence (RefSeq), with no other relevant se-quence changes being present. To illustrate this point,only 4.8% of patients in a large cohort of Duchennemuscular dystrophy patients were found to exactlymatch the coding region of the DMD gene with respectto the reference sequence [78]. Therefore, when consid-ering the impact on the splicing code, it may be in somecases too simplistic to consider just one variant in isola-tion, because other sequence changes (in cis), withinboth the coding and non-coding regions, may strengthen

Mort et al. Genome Biology 2014, 15:R19 Page 18 of 20http://genomebiology.com/2014/15/1/R19
or weaken exon definition; the resulting combined im-pact is therefore difficult to predict.We note that statistically rigorous estimation of the
fraction of variants (in a particular set) that disrupt spli-cing is a very difficult problem, caused by potentiallybiased training data combined with a general inability toachieve 100% classification accuracy. As the correctionof sample selection bias is generally hard, in this workwe chose to report the fraction of positive predictions byMutPred Splice as our best estimate.
ConclusionWe have used the most comprehensive splicing mutationdata sets currently available to build a computationalmodel to predict exonic substitutions that disrupt pre-mRNA splicing. To do this, we have adopted a machinelearning approach using semi-supervised learning andhave evaluated a combination of sequence-based and gen-omic attributes to build a new tool, MutPred Splice, toidentify coding region splice-altering variants responsiblefor either somatic or inherited disease. This model is suit-able for use in an NGS high-throughput setting to identifyand prioritize potentially splice-altering variants that maybe involved in both inherited disease and cancer.
Additional files
Additional file 1: Table S1. 1,189 putative SAVs derived from HGMDemployed in this study. Table S2. unseen test set of 352 variants(238 SAVs and 114 SNVs) employed in this study.
Additional file 2: Figure S1. experimental validation of exon skippingfor a true positive MutPred Splice prediction (Mixed negative set,Iter. 3). The disease-causing mutation CM980147 (NM_000051.3: ATMc.5932G > T; NP_000042.3: p.E1978X), which is not present in any trainingdata or the unseen evaluation test set, was predicted by MutPred Spliceto disrupt splicing. (A) Schematic diagram of the exons assayed by RT-PCR. The mutation in exon 41 is indicated. (B) RT-PCR analysis of splicedmRNA isoforms from mutant or wild-type ATM genes. This experimentcompares splicing of ATM pre-mRNA in patient-derived lymphoblastoidcells (E1978X) and HEK293 cells (wild type). Amplicons derived fromdifferent ATM mRNA isoforms were by resolved by 1% agarose gelelectrophoresis. Figure S2. novel ESR hexamer score function (ESR-HS)to express the relationship between disease-causing and commonputatively neutral variants and their differential distributions with respectto loss or gain of an ESE or ESS. Frequencies corresponding to disease-causing mutations (red) and common SNPs (blue) are shown. See Materialsand methods for more details.
AbbreviationsAUC: area under the receiver operating characteristic curve; bp: base pair;DM-SAV: disease-causing splice altering variant; DM-SNV: disease-causingsplice neutral variant; ESE: exonic splicing enhancer; ESR: exonic splicingregulatory; ESR-HS: exonic splicing regulatory hexamer score; ESS: exonicsplicing silencer; FPR: false positive rate; HGMD: Human Gene MutationDatabase; HSF: Human Splice Finder; ISE: intronic splicing enhancer;ISS: intronic splicing silencer; MAF: minor allele frequency; MCC: Matthew’scorrelation coefficient; NGS: next generation sequencing; NI: neighborhoodinference; RF: Random Forest; ROC: receiver operating characteristic;SAV: splice-altering variant; SNP: single nucleotide polymorphism; SNV: spliceneutral variant; SNP-SNV: single nucleotide polymorphism splice neutralvariant; SVM: support vector machine; TS: tumor suppressor.
Competing interestsThe authors declare that they have no competing interests.
Authors’ contributionsMM and SDM conceived the idea. MM and EVB compiled the datasets. MMdesigned the method with assistance from PR, SDM, TS-W, BL, JRS and DNC.MM implemented the method and performed the analyses. TS-W designedand implemented the ESR-HS feature. MM and BL evaluated existing thirdparty tools. MM developed the website and stand-alone software package.JRS and TS-W conducted the experimental work. MM drafted and criticallyrevised the manuscript. DNC, TS-W, MM, SDM, JRS and PR reviewed andedited the manuscript. All authors read and approved the final manuscript.
AcknowledgementsWe thank Peter Stenson for the provision of HGMD data and financialsupport from BIOBASE. GmbH to DNC, EVB and MM. This work is supportedby NIH R01 LM009722 (PI: Mooney), NIH U54-HG004028 (PI: Musen), NIHUL1DE019608 supporting the Interdisciplinary Research Consortium onGeroscience (PI: Lithgow) and the Buck Trust.
Author details1Institute of Medical Genetics, School of Medicine, Cardiff University, CardiffCF14 4XN, UK. 2Buck Institute for Research on Aging, Novato, CA 94945, USA.3Department of Computer Science and Informatics, Indiana University,Bloomington, IN 47405, USA. 4Department of Molecular, Cellular andDevelopmental Biology, University of California Santa Cruz, Santa Cruz, CA95064, USA. 5Department of Biomolecular Engineering, University ofCalifornia Santa Cruz, Santa Cruz, CA 95064, USA.
Received: 11 November 2013 Accepted: 13 January 2014Published: 13 January 2014
References1. Stenson PD, Mort M, Ball EV, Shaw K, Phillips AD, Cooper DN: The human
gene mutation database: building a comprehensive mutation repositoryfor clinical and molecular genetics, diagnostic testing and personalizedgenomic medicine. Hum Genet 2014, 133:1–9.
2. Ng PC, Henikoff S: SIFT: Predicting amino acid changes that affect proteinfunction. Nucleic Acids Res 2003, 31:3812–3814.
3. Adzhubei IA, Schmidt S, Peshkin L, Ramensky VE, Gerasimova A, Bork P,Kondrashov AS, Sunyaev SR: A method and server for predictingdamaging missense mutations. Nat Methods 2010, 7:248–249.
4. Ferrer-Costa C, Gelpi JL, Zamakola L, Parraga I, de la Cruz X, Orozco M:PMUT: a web-based tool for the annotation of pathological mutationson proteins. Bioinformatics 2005, 21:3176–3178.
5. Ryan M, Diekhans M, Lien S, Liu Y, Karchin R: LS-SNP/PDB: annotatednon-synonymous SNPs mapped to Protein Data Bank structures.Bioinformatics 2009, 25:1431–1432.
6. Bromberg Y, Rost B: SNAP: predict effect of non-synonymous polymorphismson function. Nucleic Acids Res 2007, 35:3823–3835.
7. Yue P, Melamud E, Moult J: SNPs3D: candidate gene and SNP selectionfor association studies. BMC Bioinformatics 2006, 7:166.
8. Li B, Krishnan VG, Mort ME, Xin F, Kamati KK, Cooper DN, Mooney SD,Radivojac P: Automated inference of molecular mechanisms of diseasefrom amino acid substitutions. Bioinformatics 2009, 25:2744–2750.
9. Gonzalez-Perez A, Lopez-Bigas N: Improving the assessment of theoutcome of nonsynonymous SNVs with a consensus deleteriousnessscore, Condel. Am J Hum Genet 2011, 88:440–449.
10. Wang GS, Cooper TA: Splicing in disease: disruption of the splicing codeand the decoding machinery. Nat Rev Genet 2007, 8:749–761.
11. Warf MB, Berglund JA: Role of RNA structure in regulating pre-mRNAsplicing. Trends Biochem Sci 2010, 35:169–178.
12. Watakabe A, Tanaka K, Shimura Y: The role of exon sequences in splicesite selection. Genes Dev 1993, 7:407–418.
13. Keren H, Lev-Maor G, Ast G: Alternative splicing and evolution:diversification, exon definition and function. Nat Rev Genet 2010,11:345–355.
14. Cartegni L, Wang J, Zhu Z, Zhang MQ, Krainer AR: ESEfinder: a webresource to identify exonic splicing enhancers. Nucleic Acids Res 2003,31:3568–3571.

Mort et al. Genome Biology 2014, 15:R19 Page 19 of 20http://genomebiology.com/2014/15/1/R19
15. Fairbrother WG, Yeh RF, Sharp PA, Burge CB: Predictive identification ofexonic splicing enhancers in human genes. Science 2002, 297:1007–1013.
16. Goren A, Ram O, Amit M, Keren H, Lev-Maor G, Vig I, Pupko T, Ast G:Comparative analysis identifies exonic splicing regulatory sequences–Thecomplex definition of enhancers and silencers. Mol Cell 2006, 22:769–781.
17. Stadler MB, Shomron N, Yeo GW, Schneider A, Xiao X, Burge CB: Inferenceof splicing regulatory activities by sequence neighborhood analysis.PLoS Genet 2006, 2:e191.
18. Wang Z, Rolish ME, Yeo G, Tung V, Mawson M, Burge CB: Systematicidentification and analysis of exonic splicing silencers. Cell 2004,119:831–845.
19. Zhang XH, Chasin LA: Computational definition of sequence motifsgoverning constitutive exon splicing. Genes Dev 2004, 18:1241–1250.
20. Kanopka A, Muhlemann O, Akusjarvi G: Inhibition by SR proteins ofsplicing of a regulated adenovirus pre-mRNA. Nature 1996, 381:535–538.
21. Wang Z, Burge CB: Splicing regulation: from a parts list of regulatoryelements to an integrated splicing code. RNA 2008, 14:802–813.
22. Krawczak M, Thomas NS, Hundrieser B, Mort M, Wittig M, Hampe J, Cooper DN:Single base-pair substitutions in exon-intron junctions of human genes: na-ture, distribution, and consequences for mRNA splicing.Hum Mutat 2007, 28:150–158.
23. Lim KH, Ferraris L, Filloux ME, Raphael BJ, Fairbrother WG: Using positionaldistribution to identify splicing elements and predict pre-mRNAprocessing defects in human genes. Proc Natl Acad Sci USA 2011,108:11093–11098.
24. Lopez-Bigas N, Audit B, Ouzounis C, Parra G, Guigo R: Are splicingmutations the most frequent cause of hereditary disease? FEBS Lett 2005,579:1900–1903.
25. Sterne-Weiler T, Howard J, Mort M, Cooper DN, Sanford JR: Loss of exonidentity is a common mechanism of human inherited disease.Genome Res 2011, 21:1563–1571.
26. Baralle M, Baralle D, De Conti L, Mattocks C, Whittaker J, Knezevich A,Ffrench-Constant C, Baralle FE: Identification of a mutation that perturbsNF1 a gene splicing using genomic DNA samples and a minigene assay.J Med Genet 2003, 40:220–222.
27. Nissim-Rafinia M, Kerem B: Splicing regulation as a potential geneticmodifier. Trends Genet 2002, 18:123–127.
28. Cooper DN, Krawczak M, Polychronakos C, Tyler-Smith C, Kehrer-Sawatzki H:Where genotype is not predictive of phenotype: towards an understandingof the molecular basis of reduced penetrance in human inherited disease.Hum Genet 2013, 132:1077–1130.
29. Lee Y, Gamazon ER, Rebman E, Lee S, Dolan ME, Cox NJ, Lussier YA:Variants affecting exon skipping contribute to complex traits. PLoS Genet2012, 8:e1002998.
30. Cartegni L, Chew SL, Krainer AR: Listening to silence and understandingnonsense: exonic mutations that affect splicing. Nat Rev Genet 2002,3:285–298.
31. Hua Y, Sahashi K, Hung G, Rigo F, Passini MA, Bennett CF, Krainer AR:Antisense correction of SMN2 splicing in the CNS rescues necrosis in atype III SMA mouse model. Genes Dev 2010, 24:1634–1644.
32. Reese MG, Eeckman FH, Kulp D, Haussler D: Improved splice site detectionin Genie. J Comput Biol 1997, 4:311–323.
33. Yeo G, Burge CB: Maximum entropy modeling of short sequence motifswith applications to RNA splicing signals. J Comput Biol 2004, 11:377–394.
34. Lim KH, Fairbrother WG: Spliceman–a computational web server thatpredicts sequence variations in pre-mRNA splicing. Bioinformatics 2012,28:1031–1032.
35. Woolfe A, Mullikin JC, Elnitski L: Genomic features defining exonic variantsthat modulate splicing. Genome Biol 2010, 11:R20.
36. Desmet FO, Hamroun D, Lalande M, Collod-Beroud G, Claustres M, Beroud C:Human splicing finder: an online bioinformatics tool to predictsplicing signals. Nucleic Acids Res 2009, 37:e67.
37. Spurdle AB, Couch FJ, Hogervorst FB, Radice P, Sinilnikova OM: Predictionand assessment of splicing alterations: implications for clinical testing.Hum Mutat 2008, 29:1304–1313.
38. Abecasis GR, Altshuler D, Auton A, Brooks LD, Durbin RM, Gibbs RA, Hurles ME,McVean GA: A map of human genome variation from population-scalesequencing. Nature 2010, 467:1061–1073.
39. Human gene mutation database. [http://www.hgmd.org]40. Chapelle O, Schölkopf B, Zien A: Semi-supervised Learning. Cambridge, Mass:
MIT Press; 2006.
41. Sinha R, Hiller M, Pudimat R, Gausmann U, Platzer M, Backofen R: Improvedidentification of conserved cassette exons using Bayesian networks.BMC Bioinformatics 2008, 9:477.
42. Leslie C, Eskin E, Noble WS: The spectrum kernel: a string kernel for SVMprotein classification. Pac Symp Biocomput 2002:564–575.
43. Pollard KS, Hubisz MJ, Rosenbloom KR, Siepel A: Detection of nonneutralsubstitution rates on mammalian phylogenies. Genome Res 2010, 20:110–121.
44. Siepel A, Bejerano G, Pedersen JS, Hinrichs AS, Hou M, Rosenbloom K,Clawson H, Spieth J, Hillier LW, Richards S, Weinstock GM, Wilson RK, GibbsRA, Kent WJ, Miller W, Haussler D: Evolutionarily conserved elements invertebrate, insect, worm, and yeast genomes. Genome Res 2005,15:1034–1050.
45. Meyer LR, Zweig AS, Hinrichs AS, Karolchik D, Kuhn RM, Wong M, Sloan CA,Rosenbloom KR, Roe G, Rhead B, Raney BJ, Pohl A, Malladi VS, Li CH, Lee BT,Learned K, Kirkup V, Hsu F, Heitner S, Harte RA, Haeussler M, Guruvadoo L,Goldman M, Giardine BM, Fujita PA, Dreszer TR, Diekhans M, Cline MS,Clawson H, Barber GP, Haussler D, Kent WJ: The UCSC genome browserdatabase: extensions and updates 2013. Nucleic Acids Res 2013,41:D64–D69.
46. Breiman L: Random Forests. Machine Learning 2001, 45:5–32.47. Bao L, Cui Y: Prediction of the phenotypic effects of non-synonymous
single nucleotide polymorphisms using structural and evolutionaryinformation. Bioinformatics 2005, 21:2185–2190.
48. Kaminker JS, Zhang Y, Watanabe C, Zhang Z: CanPredict: a computationaltool for predicting cancer-associated missense mutations. Nucleic AcidsRes 2007, 35:W595–W598.
49. Olatubosun A, Valiaho J, Harkonen J, Thusberg J, Vihinen M: PON-P:integrated predictor for pathogenicity of missense variants. Hum Mutat2012, 33:1166–1174.
50. Li Y, Fang Y, Fang J: Predicting residue-residue contacts using randomforest models. Bioinformatics 2011, 27:3379–3384.
51. Vapnik VN: The Nature of Statistical Learning Theory. New York: Springer; 1995.52. Vapnik VN: Statistical Learning Theory. New York: Wiley; 1998.53. Witten IH, Frank E, Trigg LE, Hall MA, Holmes G, Cunningham SJ:
Weka: Practical machine learning tools and techniques with Javaimplementations. 1999 [http://www.cs.waikato.ac.nz/~ihw/papers/99IHW-ETF-LT-MJ-GH-SJC-Weka.pdf]
54. Leskovec J, Shawe-Taylor J: Linear programming boosting for uneven datasets.2003 [http://cs.stanford.edu/people/jure/pubs/textbooster-icml03.pdf]
55. Di Giacomo D, Gaildrat P, Abuli A, Abdat J, Frébourg T, Tosi M, Martins A:Functional analysis of a large set of BRCA2 exon 7 variants highlightsthe predictive value of hexamer scores in detecting alterations of exonicsplicing regulatory elements. Hum Mutat 2013, 34:1547–1557.
56. Rice GI, Reijns MA, Coffin SR, Forte GM, Anderson BH, Szynkiewicz M, Gornall H,Gent D, Leitch A, Botella MP, Fazzi E, Gener B, Lagae L, Olivieri I, OrcesiS, Swoboda KJ, Perrino FW, Jackson AP, Crow YJ: Synonymousmutations in RNASEH2A create cryptic splice sites impairing RNaseH2 enzyme function in Aicardi-Goutières syndrome. Hum Mutat 2013,34:1066–1070.
57. Sharma VP, Fenwick AL, Brockop MS, McGowan SJ, Goos JA, Hoogeboom AJ,Brady AF, Jeelani NO, Lynch SA, Mulliken JB, Murray DJ, Phipps JM, Sweeney E,Tomkins SE, Wilson LC, Bennett S, Cornall RJ, Broxholme J, Kanapin A, 500Whole-Genome Sequences (WGS500) Consortium, Johnson D, Wall SA, van derSpek PJ, Mathijssen IM, Maxson RE, Twigg SR, Wilkie AO: Mutations in TCF12,encoding a basic helix-loop-helix partner of TWIST1, are a frequent causeof coronal craniosynostosis. Nat Genet 2013, 45:304–307.
58. Thompson BA, Greenblatt MS, Vallee MP, Herkert JC, Tessereau C, Young EL,Adzhubey IA, Li B, Bell R, Feng B, Mooney SD, Radivojac P, Sunyaev SR,Frebourg T, Hofstra RM, Sijmons RH, Boucher K, Thomas A, Goldgar DE,Spurdle AB, Tavtigian SV: Calibration of multiple in silico tools forpredicting pathogenicity of mismatch repair gene missensesubstitutions. Hum Mutat 2013, 34:255–265.
59. Whiley PJ, Pettigrew CA, Brewster BL, Walker LC, kConFab Investigators,Spurdle AB, Brown MA: Effect of BRCA2 sequence variants predicted todisrupt exonic splice enhancers on BRCA2 transcripts. BMC Med Genet2010, 11:80.
60. Matthews BW: Comparison of the predicted and observed secondarystructure of T4 phage lysozyme. Biochim Biophys Acta 1975, 405:442–451.
61. Wang K, Li M, Hakonarson H: ANNOVAR: Functional annotation of geneticvariants from next-generation sequencing data. Nucleic Acids Res 2010,38:e164.

Mort et al. Genome Biology 2014, 15:R19 Page 20 of 20http://genomebiology.com/2014/15/1/R19
62. Vihinen M: How to evaluate performance of prediction methods?Measures and their interpretation in variation effect analysis.BMC Genomics 2012, 13:S2.
63. Forbes SA, Tang G, Bindal N, Bamford S, Dawson E, Cole C, Kok CY, Jia M,Ewing R, Menzies A, Teague JW, Stratton MR, Futreal PA: COSMIC(the Catalogue of Somatic Mutations in Cancer): a resource to investigateacquired mutations in human cancer. Nucleic Acids Res 2010, 38:D652–D657.
64. COSMIC. [http://cancer.sanger.ac.uk/cancergenome/projects/cosmic/]65. Vogelstein B, Papadopoulos N, Velculescu VE, Zhou S, Diaz LA Jr, Kinzler KW:
Cancer genome landscapes. Science 2013, 339:1546–1558.66. MutPred Splice. [http://mutdb.org/mutpredsplice]67. MutPred Splice download. [http://mutdb.org/mutpredsplice/download.htm]68. MutPred Splice GitHub repository. [https://github.com/wmgmm/
mutpredsplice]69. Care MA, Needham CJ, Bulpitt AJ, Westhead DR: Deleterious SNP
prediction: be mindful of your training data! Bioinformatics 2007,23:664–672.
70. Teraoka SN, Telatar M, Becker-Catania S, Liang T, Onengüt S, Tolun A, Chessa L,Sanal O, Bernatowska E, Gatti RA, Concannon P: Splicing defects in theataxia-telangiectasia gene, ATM: underlying mutations and consequences.Am J Hum Genet 1999, 64:1617–1631.
71. Srebrow A, Kornblihtt AR: The connection between splicing and cancer.J Cell Sci 2006, 119:2635–2641.
72. Venables JP: Aberrant and alternative splicing in cancer. Cancer Res 2004,64:7647–7654.
73. Telatar M, Teraoka S, Wang Z, Chun HH, Liang T, Castellvi-Bel S, Udar N,Borresen-Dale AL, Chessa L, Bernatowska-Matuszkiewicz E, Porras O,Watanabe M, Junker A, Concannon P, Gatti RA: Ataxia-telangiectasia:identification and detection of founder-effect mutations in the ATMgene in ethnic populations. Am J Hum Genet 1998, 62:86–97.
74. Bogdanova N, Cybulski C, Bermisheva M, Datsyuk I, Yamini P, Hillemanns P,Antonenkova NN, Khusnutdinova E, Lubinski J, Dörk T: A nonsensemutation (E1978X) in the ATM gene is associated with breast cancer.Breast Cancer Res Treat 2009, 118:207–211.
75. Ge K, DuHadaway J, Du W, Herlyn M, Rodeck U, Prendergast GC:Mechanism for elimination of a tumor suppressor: aberrant splicing of abrain-specific exon causes loss of function of Bin1 in melanoma.Proc Natl Acad Sci USA 1999, 96:9689–9694.
76. Pereira NL, Lin D, Pelleymounter L, Moon I, Stilling G, Eckloff BW, Wieben ED,Redfield MM, Burnett JC Jr, Yee VC, Weinshilboum RM: Natriuretic peptidereceptor-3 gene (NPR3): nonsynonymous polymorphism results in significantreduction in protein expression because of accelerated degradation.Circ Cardiovasc Genet 2013, 6:201–210.
77. Albrechtsen A, Grarup N, Li Y, Sparso T, Tian G, Cao H, Jiang T, Kim SY,Korneliussen T, Li Q, Nie C, Wu R, Skotte L, Morris AP, Ladenvall C, Cauchi S,Stančáková A, Andersen G, Astrup A, Banasik K, Bennett AJ, Bolund L,Charpentier G, Chen Y, Dekker JM, Doney AS, Dorkhan M, Forsen T, FraylingTM, Groves CJ, et al: Exome sequencing-driven discovery of codingpolymorphisms associated with common metabolic phenotypes.Diabetologia 2013, 56:298–310.
78. Flanigan KM, Dunn DM, von Niederhausern A, Soltanzadeh P, Gappmaier E,Howard MT, Sampson JB, Mendell JR, Wall C, King WM, Pestronk A, Florence JM,Connolly AM, Mathews KD, Stephan CM, Laubenthal KS, Wong BL, Morehart PJ,Meyer A, Finkel RS, Bonnemann CG, Medne L, Day JW, Dalton JC, Margolis MK,Hinton VJ, United Dystrophinopathy Project Consortium, Weiss RB: Mutationalspectrum of DMD mutations in dystrophinopathy patients: application ofmodern diagnostic techniques to a large cohort. Hum Mutat 2009,30:1657–1666.
doi:10.1186/gb-2014-15-1-r19Cite this article as: Mort et al.: MutPred Splice: machine learning-basedprediction of exonic variants that disrupt splicing. Genome Biology2014 15:R19.
Submit your next manuscript to BioMed Centraland take full advantage of:
• Convenient online submission
• Thorough peer review
• No space constraints or color figure charges
• Immediate publication on acceptance
• Inclusion in PubMed, CAS, Scopus and Google Scholar
• Research which is freely available for redistribution
Submit your manuscript at www.biomedcentral.com/submit