mutandis sca - sogecapital
TRANSCRIPT

STOCK OVERVIEW
MUTANDIS SCA

Page 2
ABREVIATIONS
ADTV: Average Daily Trading Volume
AfDB: African Development Bank
CAGR: Compound Annual Growth Rate
DCF: Discounted Cash Flows
D/Y: Dividend Yield ratio
EBITDA: Earnings Before Interest, Taxes, Depreciation, and Amortization
GDP: Gross Domestic Product
IPO: Initial Public Offering
MAD: Moroccan Dirham
MSU: Mobile Sales Units
P/B: Price-to-Book ratio
P/E: Price Earnings ratio
PET: Polyethylene Terephthalate
USD: United States dollar
WAC: Weighted Average Cost
WACC: Weighted Average Cost of Capital
YTD: Year To Date

Page 3
Summary
Abbreviations ……………………………………………………………………………….. 2
Executive Summary ………………………………………………………………………… 4
Overview of Mutandis ………………………………………………………………………. 6
1. Turnover and gross margin ………………………………………………………… 6
2. Earnings Before Interest/Taxes/Depreciation & Amortization (EBITDA) ……… 10
3. Operating income …………………………………………………………………… 11
4. Net Income …………………………………………………………………………... 11
Summary of the estimated financial statements ………………………………………. 12
Summary of the valuation & recommendation …………………………………………. 13
Page 4
Executive Summary
The consumer goods sector in which Mutandis group operates is closely linked to changes in
household consumption. In Morocco, households spent nearly MAD 610.7 billion in 2017 against
MAD 400.4 billion in 2008, representing a CAGR of +4.8%. These growth rates are valid in both urban
and rural areas. According to the African Development Bank (AfDB), household consumption in
Morocco is expected to increase to reach MAD 780.0 billion (equivalent of US 78.0 billion) by 2019,
i.e. a CAGR of 13.0%.
Given that Mutandis group generates almost 30% of its turnover in exports and especially in the
African continent, it is important to note that household consumption in Africa has been rising over
the last eight years. This household consumption rose from USD 1,172.0 billion in 2010 to USD
1,463.0 billion in 2017 (e), i.e. a CAGR of +3.2% and, according to the AfDB, it should increase by a
rate of 7.4% to reach USD 1,686.0 billion in 2019.
This growth is explained by the rise of the African population with the emergence of the middle class
population, coupled with the increase in the purchasing power of households. Given the economic
performances revealed in 2018 with a growth rate of 3.5% in overall GDP, the situation on the African
continent remains good. The expected levels of economic growth for the year 2019 and 2020 are
respectively 4.0% and 4.1%, foreshadow a significant potential in terms of household consumption
in Africa.
In this perspective, the Group could take full advantage of the economic growth in Morocco as well
as in Africa through its strategy of diversification of activities, which allows it to ensure a balance and
a recurrence of the flows (presence in four ranges of products : detergents, seafood, beverage
bottles and juices). The group markets its products under 15 brands among them, 9 benefit from
frequent and substantial marketing budgets (Magix, Maxis, Marrakesh, Anny, Marine, etc.).
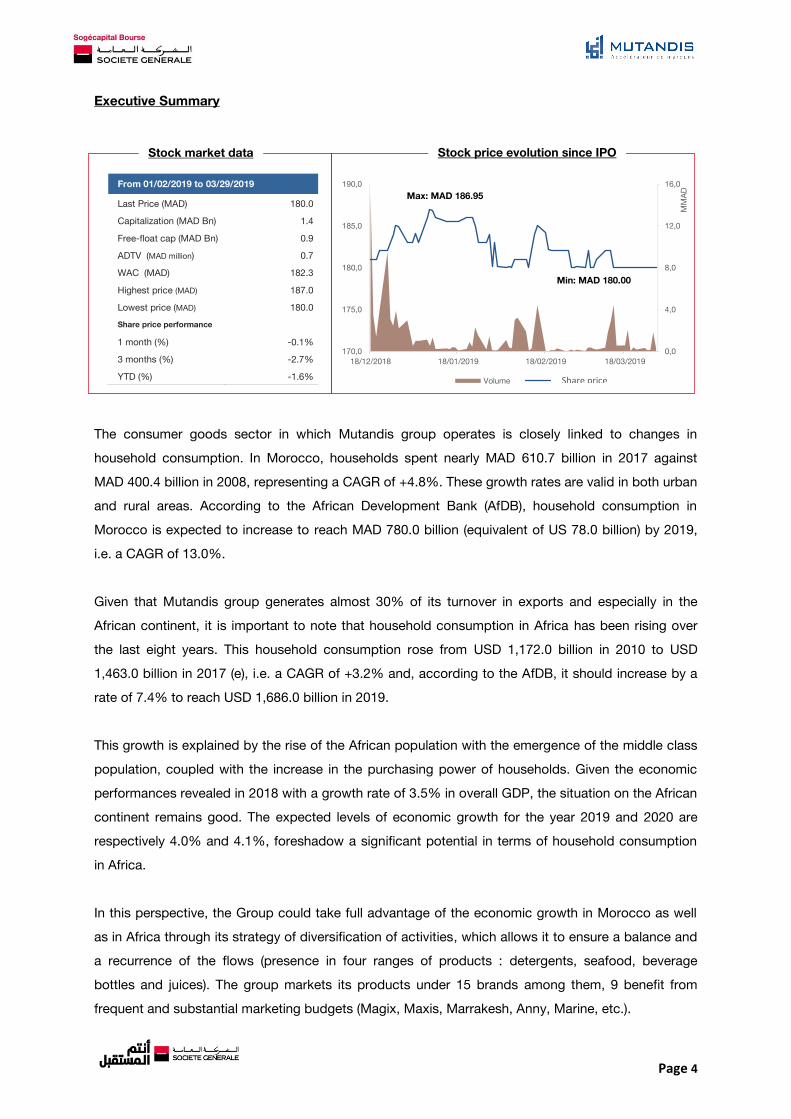
0,0
4,0
8,0
12,0
16,0
170,0
175,0
180,0
185,0
190,0
18/12/2018 18/01/2019 18/02/2019 18/03/2019
MM
AD
Volume Cours
Max: MAD 186.95
Min: MAD 180.00
From 01/02/2019 to 03/29/2019
Last Price (MAD) 180.0
Capitalization (MAD Bn) 1.4
Free-float cap (MAD Bn) 0.9
ADTV (MAD million) 0.7
WAC (MAD) 182.3
Highest price (MAD) 187.0
Lowest price (MAD) 180.0
Share price performance
1 month (%) -0.1%
3 months (%) -2.7%
YTD (%) -1.6%
Stock price evolution since IPO Stock market data
Share price
Page 5
Today, Mutandis is entering an important phase in its commercial and industrial strategy. With its
recent IPO, the group has significant financial resources to launch new agribusiness projects. In order
to launch new products with high added values especially in the seafood and hygiene activities, The
Top management is planning to invest in four potential projects with the objectives of improving sales
and EBITDA margin levels.
The management focuses on the development of four main drivers:
Growth in sales volumes over all of its current activities through its commercial strength
and the enrichment of its product lines;
Densification of distribution channels under the increase of mobile sales units;
Improvement of the seafood supply chain and migration to high value-added products;
Development of the export activity toward high-margin territories.
As part of our valuation of the Group, we have remained on the same current scope of activities, as
we do not have, as of today, any quantified data, or precise horizon for the implementation of its new
projects. Today, the management has announced the launch of advanced market studies to better
structure its new investments.
In terms of valuation methods, we have preferred the Discounting of Future Cash Flows (DCF) that we
consider is the most suitable for Mutandis, whose activities have a significant potential for future
development.
As a result of our valuation work, we have reached a value of MAD 228.9 per share, which
means a potential of + 27.1% in the medium term. Hence, we recommend to BUY the stock of
Mutandis.
Based on this target price and assuming that the company would maintain the same level of dividend
per share as the one of the previous year; Mutandis’ share would have a P/E 2019e of 18.5x and a
D/Y 2019e of 3.3%

Page 6
Overview of the company
Mutandis Group is present in four main segments of the consumer goods sector through three
subsidiaries. The following chart presents the Group and its subsidiaries:
In order to build a consolidated business plan forecast for Mutandis Group, we have conducted
interviews with the Management, through which we have selected the following main assumptions:
1. Turnover and gross margin
Detergents :
For the traditional sales segment, Distra has currently a fleet of 108 Mobile Sales Units (MSU)
covering 35,000 grocers. Distra plans to gradually increase the number of MSUs to cover more points
of sale. For the purpose of projections, we retained an increase of 10 additional MSU per year with
the same level of current visits per MSU per point of sale. The target number for the fleet would reach
158 MSUs by 2023.
In the medium to large retail stores segment, we used the assumption of revenue growth in line with
the growth of new store openings, averaging 6.5% per year.
Produits de la mer
99,1%100% 100%
Détergents & Jus de fruits
Bouteilles alimentaires
Sociétés porteuses des activités
Activités
7 Marques propres
Activities
Operating firms
7 brands
Seafood Product Detergents &
Juice Beverage Bottles

Page 7
2018 2023
The turnover of the "Detergents" business should increase from MAD 567.1 million in 2018 to MAD
841.1 Million in 2023, ie a CAGR of 8.2%. The traditional sales segment generates an average of
63.6% of the total turnover of the business compared to 35.0% on average for the medium to large
retail stores segment.
As a result, the "Detergents" business remains the largest contributor to overall sales of the group,
rising from 41.4% in 2018 to 45.8% in 2023.
In terms of gross margin, the activity should generate MAD 349.7 million in 2023, with a relatively
stable rate over the entire forecast period, representing a gross margin rate of 41.6%.
Seafood Product :
According to the management of the group, the company has changed its business model and now
produces only on a « make to order » basis.
In terms of supply and sourcing, the company should have no constraints since sardine is available
on Moroccan coasts with an abundant amount. The company exploits its own quotas and, if
necessary, turns to other fishing quotas to ensure its supply.
The Management is also focusing on strengthening the sales of high added-value products by further
promoting the sale of canned skinless and unshelled sardines over the traditional sardine canning.
The Management takes advantage of this opportunity to penetrate other markets abroad, in particular
in the Middle East region where the market is potentially significant. A first experiment is initiated in
Saudi Arabia in 2019 and should be followed by other similar operations abroad.
The group is also starting to serve the Moroccan market with canned skinless and unshelled
sardines’ products under a local brand called "Marine". According to the Management, the local
market has significant potential.
567.1620.7
673.9728.7
785.3843.8
41.6% 41.6% 41.6% 41.6% 41.6% 41.6%
40, 0%
40, 5%
41, 0%
41, 5%
42, 0%
42, 5%
43, 0%
43, 5%
44, 0%
44, 5%
45, 0%
0,0
100 ,0
200 ,0
300 ,0
400 ,0
500 ,0
600 ,0
700 ,0
800 ,0
900 ,0
2018 2019e 2020e 2021e 2022e 2023e
Detergents % Gross margin
Detergent41.4%
Détergent45.8%
Activity weight in the total turnover Turnover and gross margin evolution

Page 8
Today, LGMC's plants produce 30,777 tons of fishes and is expected to grow between 1,000 and
1,200 additional tons by a maximum of 37,000 tons by 2023. Therefore, the quantity produced by
2023 would be estimated at 128.8 million boxes (equivalent to 125 g) against 107.1 million boxes
produced in 2018.
2018 2023
Thus, the turnover of the "Seafood Products" activity should increase from MAD 503.7 million in 2018
to MAD 570.6 million in 2023, ie a CAGR of 2.5%. The sales revenue of the "Seafood" business in
relation to the group's overall turnover should decline from 36.8% in 2018 to 31.1% in 2023. This
regression is explained by the level of growth that should be achieved over the forecast period and
remains lower than that of the other activities of the group.
In terms of gross margin, the activity should generate MAD 238.6 million in 2023, with a rate slightly
improving over the entire forecast period, a gross margin rate of 41.8% against 41.3% in 2018. This
improvement is due to the commercial shift taken by the company, which favors the sale of canned
skinless and unshelled sardines’ products over the traditional products.
Beverage bottles :
In recent years, the consumption of bottled water in Morocco has reached significant levels in
comparison with the consumption of soft drinks, which is experiencing slight regressions from one
year to the next. For our growth assumptions, we used the average volume sales over the last three
years that we applied to the 2018’s sales.
503.7511.1
522.5
535.0
550.7
570.6
41.3%41.6%
41.8% 41.8% 41.8% 41.8%
40, 0%
40, 5%
41, 0%
41, 5%
42, 0%
42, 5%
43, 0%
43, 5%
44, 0%
44, 5%
45, 0%
460 ,0
480 ,0
500 ,0
520 ,0
540 ,0
560 ,0
580 ,0
2018 2019e 2020e 2021e 2022e 2023e
Seafood % Gross margin
Seafood36.8%
Seafood31.1%
Activity weight in the total turnover
Turnover and gross margin evolution

Page 9
2018
2023
As a result, the forecast turnover of the "Beverage bottles" business is expected to increase by a
CAGR of 4.1%, from MAD 239.1 million in 2018 to MAD 291.6 million in 2023.
The weight of turnover generated from the "Beverage bottles" activity is expected to decrease from
17.5% in 2018 to 15.9% in 2023.
In terms of gross margin, the activity is expected to generate MAD 72.8 million in 2023, with a stable
rate over the entire forecast period, ie a gross margin rate of 25.0% corresponding to the average
rate observed between 2017 and 2018.
Juice :
Before the acquisition of the brand by Mutandis, sales of Marrakech juice were in free fall. The
estimated market share decreased from 15% in 2015 to 8% in 2017. Since its acquisition by the
group, the main objective is to gradually regain the historical position of the brand Marrakesh in this
sector of activity, which is experiencing stable growth of 2% per year.
By pooling distribution with Distra's distribution network and its sales force, the goal of reaching 15%
market share by 2023 could be achievable.
In this perspective, Mutandis is equipping itself with human, logistical and marketing resources to
succeed in this challenge. In 2018, Mutandis launched new fruit juice products on the local market to
boost sales, particularly Pulpy (Juice in PET packaging), Vita Kids (juices for children), Marrakech
Premium.
239.1258.8
274.3 278.9 284.6 291.6
22.7%
25.0% 25.0% 25.0% 25.0% 25.0%
20, 0%
22, 0%
24, 0%
26, 0%
28, 0%
30, 0%
0,0
50, 0
100 ,0
150 ,0
200 ,0
250 ,0
300 ,0
350 ,0
2018 2019e 2020e 2021e 2022e 2023e
Beverage bottles % Gross margin
Food bottles17.5%
Food bottles15.9%
Activity weight in the total turnover
Turnover and gross margin evolution

Page 10
2018
2023
As a result, we estimate, based on our assumptions, an average annual growth in sales of the
category "Juices" of around 18.7% over the next five years. Sales are expected to increase from
MAD 55.0 million in 2018 to MAD 129.9 million in 2023.
The weight of the turnover of the "Juice" activity should increase from 4.0% in 2018 to 7.1% in 2023.
In terms of gross margin, business should generate MAD 49.6 million in 2023, with a stable rate over
the entire forecast period, representing a gross margin rate of 38.2% corresponding to the rate
observed in 2018.
2. EBITDA :
The EBITDA should grow at an average annual rate of 6.7% to reach MAD 260.1 million by 2023
against MAD 188.5 million in 2018. This increase is partly due to the continuous rise of turnover and
economies of scale on common fixed costs to all activities at the parent company and its subsidiaries
(Other external expenses and payroll charges). As a result, EBITDA margin is expected to increase
from 13.8% in 2018 to 14.2% in 2023.
55.067.7
82.297.4
113.3129.9
38.2% 38.2% 38.2% 38.2% 38.2% 38.2%38, 0%
38, 1%
38, 2%
38, 3%
38, 4%
38, 5%
0,0
20, 0
40, 0
60, 0
80, 0
100 ,0
120 ,0
140 ,0
2018 2019e 2020e 2021e 2022e 2023e
Fruit juice % Gross margin
Fruit juice4.0%
Fruit juice7.1%
1 368.11 461.2
1 555.81 643.0
1 736.91 838.9
13.8% 13.9% 13.9% 14.0% 14.1% 14.2%
10, 0%
11, 0%
12, 0%
13, 0%
14, 0%
15, 0%
16, 0%
17, 0%
18, 0%
0,0
200 ,0
400 ,0
600 ,0
800 ,0
1 00 0,0
1 20 0,0
1 40 0,0
1 60 0,0
1 80 0,0
2 00 0,0
2018 2019e 2020e 2021e 2022e 2023e
Consolidated Turnover EBITDA margin %
Activity weight in the total turnover
Turnover and gross margin evolution
Page 11
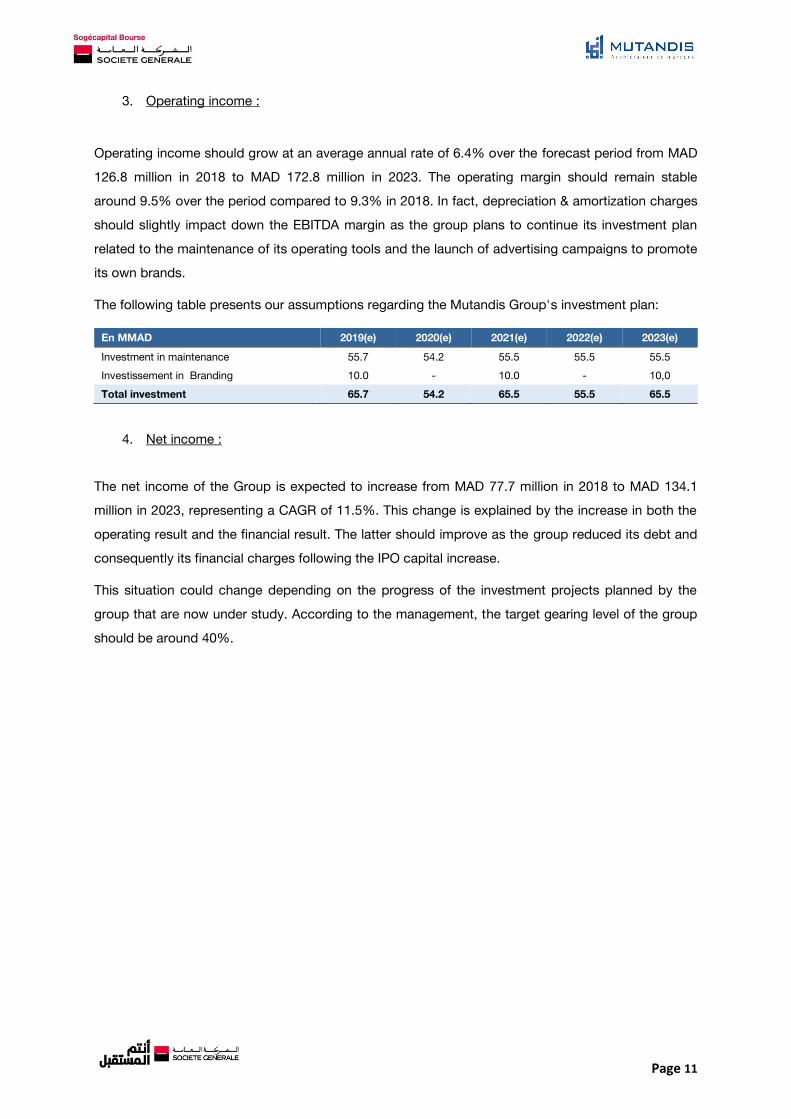
3. Operating income :
Operating income should grow at an average annual rate of 6.4% over the forecast period from MAD
126.8 million in 2018 to MAD 172.8 million in 2023. The operating margin should remain stable
around 9.5% over the period compared to 9.3% in 2018. In fact, depreciation & amortization charges
should slightly impact down the EBITDA margin as the group plans to continue its investment plan
related to the maintenance of its operating tools and the launch of advertising campaigns to promote
its own brands.
The following table presents our assumptions regarding the Mutandis Group's investment plan:
En MMAD 2019(e) 2020(e) 2021(e) 2022(e) 2023(e)
Investment in maintenance 55.7 54.2 55.5 55.5 55.5
Investissement in Branding 10.0 - 10.0 - 10,0
Total investment 65.7 54.2 65.5 55.5 65.5
4. Net income :
The net income of the Group is expected to increase from MAD 77.7 million in 2018 to MAD 134.1
million in 2023, representing a CAGR of 11.5%. This change is explained by the increase in both the
operating result and the financial result. The latter should improve as the group reduced its debt and
consequently its financial charges following the IPO capital increase.
This situation could change depending on the progress of the investment projects planned by the
group that are now under study. According to the management, the target gearing level of the group
should be around 40%.

Page 12
Summary of the estimated financial statements
Forecasted income statement
2017 2018 2019e 2020e 2021e 2022e 2023e
Revenues 1 269.0 1 368.1 1 458.9 1 553.2 1 640.2 1 734.1 1 836.2
Cost of Goods Sold 784.4 845.9 896.1 952.9 1 005.0 1 061.3 1 122.6 Gross profit 497.1 540.3 572.6 610.1 645.0 682.6 723.4
Gross margin % 39.2% 39.5% 39.3% 39.3% 39.3% 39.4% 39.4% EBITDA 165.1 188.5 202.2 215.5 229.3 244.0 260.1
EBITDA margin % 13.0% 13.8% 13.9% 13.9% 14.0% 14.1% 14.2% Depreciations and amortizations 58.0 56.7 63.3 68.7 75.2 80.8 87.3 EBIT 105.5 126.8 138.9 146.8 154.0 163.3 172.8
Operating margin % 8.3% 9.3% 9.5% 9.5% 9.4% 9.4% 9.4% Financial Income -25.5 -30.0 -11.4 -11.1 -7.6 -3.8 -0.4 Income before taxes 73.9 90.4 127.5 135.7 146.4 159.5 172.4
Taxes 17.2 19.2 28.4 30.2 32.6 35.5 38.3 Net income 55.4 77.7 99.2 105.5 113.8 124.0 134.1
Net margin % 4.4% 5.7% 6.8% 6.8% 6.9% 7.1% 7.3% Figures in MAD million
Forecasted balance sheet
2017 2018 2019e 2020e 2021e 2022e 2023e
Goodwill 410.6 410.6 410.6 410.6 410.6 410.6 410.6 Intangible assets 112.6 116.4 116.4 116.4 116.4 116.4 116.4 Tangible assets 382.8 382.5 384.9 370.5 360.7 335.5 313.6 Total non-current assets 1 133.0 1 136.2 1 138.6 1 124.2 1 114.4 1 089.2 1 067.3 Inventories and work-in-progress 247.7 274.7 288.9 307.6 324.8 343.4 363.6 Trade receivables and other receivables 255.7 298.1 305.9 325.7 344.0 363.6 385.0 Total current assets 594.1 669.1 698.3 743.4 785.0 830.0 878.8 Cash 74.3 209.2 18.0 18.9 19.9 67.2 134.4 Total assets 1 801.3 2 014.5 1 854.9 1 886.5 1 919.3 1 986.3 2 080.5
Capital 680.4 799.7 799.7 799.7 799.7 799.7 799.7 Total Shareholders' equity,group share 779.7 996.0 1 035.2 1 080.8 1 134.6 1 198.7 1 272.8 Total shareholders’ equity 783.7 999.9 1 039.1 1 084.7 1 138.6 1 202.6 1 276.7 Total non-current liabilities (including
Borrowings and other financial liabilities) 468.5 395.5 240.9 220.5 203.1 188.9 174.6
Banks (credit balances) 113.1 106.3 72.7 47.2 14.4 0.0 0.0 Accounts payable 331.3 402.2 402.3 427.8 451.2 476.5 504.0
Total current liabilities 575.2 619.1 574.9 581.4 577.7 594.9 629.2 Total liabilities 1 801.3 2 014.5 1 854.9 1 886.5 1 919.4 1 986.3 2 080.6 Figures in MAD million
Forecasted cash flow statement
2017 2018 2019e 2020e 2021e 2022e 2023e
Financing capacity 130.5 145.8 162.4 174.2 189.1 204.8 221.4 Effect of WCR change -42.4 -15.6 -30.2 -13.3 -12.4 -13.4 -14.5 Cash flows from operating activities 88.1 130.1 132.2 161.0 176.6 191.4 206.9 The net acquisition of tangible and intangible assets
-139.7 -53.2 -65.7 -54.2 -65.5 -55.5 -65.5
Net acquisition of financial assets -0.3 0.2 0.0 0.0 0.0 0.0 0.0 Cash flows from investing activities -140.0 -53.0 -65.7 -54.2 -65.5 -55.5 -65.5 Increase/decrease in capital 94.4 195.5 0.0 0.0 0.0 0.0 0.0 Dividend paid to group shareholders and minority shareholders.
-51.9 -51.0 -60.0 -60.0 -60.0 -60.0 -60.0
Debt variation 12.0 -85.6 -154.6 -20.4 -17.3 -14.3 -14.3 Cash flows from financing activities 54.4 58.9 -214.6 -80.4 -77.3 -74.2 -74.2 Net Change in Cash 2.5 136.0 -148.0 26.4 33.8 61.7 67.2 Beginning cash balance -45.2 -42.7 93.3 -72.7 -47.2 -14.4 46.2 Additional cash need at the end of the year
18.0 0.9 1.0 1.1 1.1
Ending cash balance -42.7 93.3 -72.7 -47.2 -14.4 46.2 112.3 Figures in MAD million

Page 13
Summary of the valuation & recommendation
For the valuation of the Mutandis group, we have used the discounted cash flow method (DCF). The
discount rate of flows (WACC) retained is 7.82% and an infinite growth rate of 1.5%. Here is the
WACC calculation table:
Risk-free rate 10-year T-bonds 3.30%
Market Risk premium (Rm-Rf) 6.10%
Levered beta 0.980 Cost of equity 9.28%
Cost of debt after tax 4.43%
Weighted average cost of capital (WACC) 7.82%
DCF Valuation :
Based on valuation by DCF, we reach a value of 228.9 MAD per share, which represents a potential
of 27.1% compared to the price observed on 04/05/2019.
Market multiples
Based on the target price, the stock multiples emerge as follow:
Multiples 2018 2019e 2020e
P/B 1.5x 1.8x 1.7x
P/E 18.8x 18.5x 17.4x
D/Y 4.1% 3.3% 3.3%
Multiple forecasts (2019 and 2020) are calculated based on the target price
438.7
1 492.1
118.0 77.0
1 854.8 1 836.3
0,0
1 00 0,0
2 00 0,0
3 00 0,0
(3.9)(268.4)
228.9 MAD
per share
* In June 30, 2018, the net market value of real estate assets and constructions held by Mutandis through the Seafood business is MAD 77 million.
Figures in MMAD (unless otherwise specified)

Page 14
Sensitivity matrices of the stock value
1. Sensitivity regarding WACC and growth rate :
235.98 6.82% 7.32% 7.82% 8.32% 8.82%
0.50% 237.4 218.5 202.2 187.9 175.5
1.00% 254.8 233.1 214.5 198.5 184.6
1.50% 275.5 250.2 228.9 210.7 195.0
2.00% 300.5 270.5 245.7 224.8 206.9
2.50% 331.3 295.0 265.6 241.2 220.7
2. Sensitivity regarding the valuation of non-operating land amounting to MAD 77 million
235,98 100.0% 80.0% 60.0% 40.0% 20.0% 0.0%
Target price 219.3 221.2 223.1 225.1 227.0 228.9
WACC
Gro
wth
rate
Discounting the value of the non-operating asset

Page 15
Sogécapital Bourse
55, Bd Abdelmoumen – Casablanca
Phone : (212)5 22 43 98 40
Fax. : (212)5 22 26 80 18
WARNING
This document was prepared by the Analysis & Research Department and published by SOGECAPITAL BOURSE in accordance with
regulatory provisions in order to promote the independence of judgment of financial analysts.
This briefing is intended for aware investors to the risks of stock market investments. It is published only for information and cannot be
equated with any advice. It no way constitutes an incentive to stock market investment. Responsibility for SOGECAPITAL BOURSE and
its analysts do not in any way be held liable for the use by informed investors of the information published herein. SOGECAPITAL
BOURSE cannot be held liable for financial loss or any decision taken on the basis of the information contained herein.
The information in this document was obtained from public sources carefully selected by the Analysis & Research Department. Despite
the observation of due diligence to ensure the accuracy of the information at the time of publication, SOGECAPITAL BOURSE is not
able to guarantee neither their veracity nor completeness. This document expresses the views of SOGECAPITAL BOURSE and can be
changed without notice to the extent that the information can be influenced by the vagaries of the financial markets. Past and simulated
performances do not guarantee future performances.
SOGECAPITAL BOURSE has implemented appropriate procedures in order to separate its activities "Chinese wall" aimed particularly at
preventing conflicts of interest between its Analysis & Research activities and other activities and to ensure the independence of its
financial analysts.
This document is the property of SOGECAPITAL BOURSE, it is strictly forbidden to reproduce it in whole or in part or to distribute it to
third parties without prior approval of SOGECAPITAL BOURSE. This document can be distributed only by SOGECAPITAL BOURSE,
Société Générale Marocaine de Banques or one of its subsidiaries. Neither SOGECAPITAL BOURSE or its financial analysts, nor Société
Générale Marocaine des Banques, cannot be responsible for direct or indirect loss resulting from the use of this document and its
content.
Research & analysis
Consulting & investment
Fouad Bellil
Tél : 05 22 43 98 40
Mohamed Amine Hajib
Tél : 05 22 43 98 34
Hamza El Bouchtaoui
Phone number: (212) 5 22 43 98 44
Fouad Berrada
Phone number: (212) 5 22 43 98 42