musculoskeletal symptoms and laptop...
TRANSCRIPT

MUSCULOSKELETAL SYMPTOMS AND LAPTOP COMPUTER USE AMONG COLLEGE STUDENTS
by
Hyekyoung Shin
BS, Yonsei University, 2003
MS, University of Pittsburgh, 2007
Submitted to the Graduate Faculty of
School of Health and Rehabilitation Sciences in partial fulfillment
of the requirements for the degree of
Doctor of Philosophy
University of Pittsburgh
2010

ii
UNIVERSITY OF PITTSBURGH
SCHOOL OF HEALTH AND REHABILITATION SCIENCES
This dissertation was presented
by
Hyekyoung Shin
It was defended on
December 02, 2010
and approved by
Rakié Cham, PhD, Associate Professor, Department of Bioengineering
Margo B. Holm, PhD, OTR/L, Professor, Department of Occupational Therapy
Ketki D. Raina, PhD, OTR/L, Assistant Professor, Department of Occupational Therapy
Dissertation Advisor: Nancy A. Baker, ScD, OTR/L, Associate Professor, Department of
Occupational Therapy

iii
Copyright © by Hyekyoung Shin
2010

iv
Laptop computers are widely used by college students for academic and leisure activities (Cortes,
Hollis, Amick, & Katz, 2002). However, there is limited research that identifies risk factors for
musculoskeletal discomfort during laptop computer use in this population. This dissertation
includes two studies: Study 1: This survey study explored characteristics of laptop computer use
and relationships between laptop-related risk factors and discomfort; Study 2: This randomized
cross-over study examined the effects of three most common laptop workstation setups on upper
body postures, discomfort, and task productivity.
Thirty students were recruited from the University of Pittsburgh. The survey was a self-
administered questionnaire. Subjects’ posture were videotaped while typing for 10 minutes in six
laptop workstation setups (desktop sitting, chair sitting, lying prone, lying supine, floor sitting,
and lap sitting), and the three most common workstation setups were analyzed. Body angles were
digitized at 10-time points and averaged using ImageJ. Typing style was identified using the
Keyboard-Personal Computer Style Instrument. Discomfort was determined using a 10-cm VAS.
Task productivity was assessed by typing speed and accuracy. Data were analyzed by ANOVAs
and Bonferroni post-hoc comparisons.
Subjects were primarily female (83.3%), with a mean age of 26.0±7.3, and white (63.3%).
Survey results showed that the most common workstation setups were desktop sitting, followed
by lying supine and chair sitting. There were no statistically significant relationships between
MUSCULOSKELETAL SYMPTOMS AND LAPTOP COMPUTER USE
AMONG COLLEGE STUDENTS
Hyekyoung Shin, M.S.
University of Pittsburgh, 2010

v
laptop-related factors (duration and type of workstation setup) and discomfort. Most body angles
were significantly different between the three workstation setups: neutral wrists and ulnar
deviation, upright trunk, and greater shoulder flexion during desktop sitting; greater neck flexion,
wrist extension, and ulnar deviation during chair sitting; less neck flexion and greater wrist
flexion and trunk extension during lying supine. For typing style, subjects showed large
differences in static postures among the workstation setups. Less discomfort and faster typing
speed were observed during desktop sitting, followed by lying supine, and then chair sitting.
Overall more neutral postures and less discomfort were observed during desktop sitting,
followed by lying supine and chair sitting. These findings highlight the importance of laptop
workstation setup choice for preventing potential musculoskeletal problems.

vi
TABLE OF CONTENTS
PREFACE ................................................................................................................................... XV
1.0 INTRODUCTION ........................................................................................................ 1
2.0 POTENTIAL RISK FACTORS ASSOCIATED MUSCULOSKELETAL
DISORDERS AND SYMPTOMS IN LAPTOP COMPUTER OPERATORS:
LITERATURE REVIEW ............................................................................................ 4
2.1 MUSCULOSKELETAL DISORDERS AND SYMPTOMS ........................... 4
2.2 MSD/MSS AND COMPUTER USE .................................................................. 6
2.3 POTENTIAL RISK FACTORS FOR MSD/MSS ............................................ 8
2.3.1 Awkward posture ...................................................................................... 8
2.3.2 Forceful exertion ...................................................................................... 19
2.3.3 Duration and rest breaks ........................................................................ 22
2.3.4 Individual factors ..................................................................................... 24
2.3.4.1 Gender ............................................................................................... 24
2.3.4.2 Age ..................................................................................................... 25
2.3.4.3 Obesity ............................................................................................... 26
2.3.4.4 Cigarette smoking ............................................................................. 27
2.3.4.5 Recreational activities ...................................................................... 28

vii
2.4 COLLEGE STUDENTS AND MUSCULOSKELETAL SYMPTOMS
ASSOCIATED WITH COMPUTER USE ...................................................... 28
2.5 EXPOSURE ASSESSMENT METHODS ....................................................... 31
2.5.1 Self-reports ............................................................................................... 31
2.5.2 Observational methods ........................................................................... 32
2.5.3 Direct measurement methods ................................................................. 33
2.6 SIGNIFICANCE ................................................................................................ 34
3.0 POTENTIAL RISK FACTORS AND CHARACTERISTICS OF LAPTOP
COMPUTER USE ASSOCIATED WITH MUSCULOSKELETAL SYMPTOMS
IN COLLEGE STUDENTS: SURVEY STUDY ..................................................... 36
3.1 BACKGROUND AND SIGNIFICANCE ........................................................ 36
3.2 RESEARCH DESIGN AND METHODS ........................................................ 39
3.2.1 Research aims .......................................................................................... 39
3.2.2 Research design ....................................................................................... 40
3.2.3 Participants .............................................................................................. 41
3.2.4 Instrumentation ....................................................................................... 41
3.2.4.1 Constructing the survey items ......................................................... 42
3.2.4.2 Content validation process .............................................................. 56
3.2.4.3 Test-retest reliability of the LCUSS ................................................ 57
3.2.5 Procedures ................................................................................................ 58
3.2.6 Data management and processing ......................................................... 59
3.2.7 Data analyses ............................................................................................ 59

viii
3.3 RESULTS ........................................................................................................... 61
3.3.1 Research aim 2: Characteristics of laptop computer use .................... 61
3.3.1.1 Section 1: Demographic information .............................................. 61
3.3.1.2 Section 2: Location of laptop computer use ................................... 63
3.3.1.3 Section 3: Laptop transportation methods .................................... 64
3.3.1.4 Section 4: Laptop related tasks ....................................................... 66
3.3.1.5 Section 5: Laptop specifications ...................................................... 67
3.3.1.6 Section 6: Usage time ....................................................................... 68
3.3.1.7 Section 7: Laptop workstation setup .............................................. 69
3.3.1.8 Section 8: Overall laptop related discomfort ................................. 71
3.3.1.9 Section 9: Student health related role functioning ........................ 72
3.3.1.10 Section 10: Attitude toward the laptop computer ......................... 74
3.3.1.11 Section 11: Recreational activities .................................................. 75
3.3.1.12 Section 12: Previous/current health status ..................................... 76
3.3.2 Research question 3.1: Relationship between duration of laptop
computer use and discomfort ................................................................. 78
3.3.3 Research question 3.2: Relationship between laptop workstation
setups and discomfort ............................................................................. 79
3.4 DISCUSSION ..................................................................................................... 81
3.5 CONCLUSIONS ................................................................................................ 88
4.0 THE EFFECTS OF SIX SIMULATED LAPTOP WORKSTATION SETUPS ON
BODY POSTURES, DISCOMFORT, AND TASK PRODUCTIVITY:
AN EXPERIMENTAL STUDY ................................................................................ 91

ix
4.1 BACKGROUND AND SIGNIFICANCE ........................................................ 91
4.2 RESEARCH DESIGN AND METHODS ........................................................ 94
4.2.1 Research aims .......................................................................................... 94
4.2.2 Research design ....................................................................................... 95
4.2.3 Participants .............................................................................................. 96
4.2.4 Instrumentation ....................................................................................... 96
4.2.4.1 Laptop computer user screening survey (LCUSS) ........................ 96
4.2.4.2 Upper body angles ............................................................................ 97
4.2.4.3 Discomfort rating chart ................................................................. 105
4.2.4.4 Keyboard personal computer style (K-PeCS) .............................. 105
4.2.4.5 Task productivity ........................................................................... 107
4.2.5 Procedures .............................................................................................. 108
4.2.6 Data management and processing ....................................................... 109
4.2.7 Data analyses .......................................................................................... 111
4.3 RESULTS ......................................................................................................... 112
4.3.1 Participants ............................................................................................ 112
4.3.2 Research question 1.1: Difference in upper body angles ................... 114
4.3.3 Research question 1.2: Difference in typing style ............................... 115
4.3.4 Research question 2.1: Difference in physical discomfort ................. 116
4.3.5 Research question 3.1: Difference in task productivity ..................... 117
4.4 DISCUSSION ................................................................................................... 117
4.5 CONCLUSIONS .............................................................................................. 127
5.0 CONCLUSIONS ...................................................................................................... 129

x
APPENDIX A. LCUSS EXPERT PANEL EVALUATION FORM .................................... 132
APPENDIX B. SUMMARY OF THE FEEDBACKS RAISED BY THE EXPERT
REVIEWERS ................................................................................................. 153
APPENDIX C. TEST-RETEST RELIABILITY OF THE LCUSS: INTRA-CLASS
CORRELATION ANALYSIS OF THE LCUSS ........................................ 170
APPENDIX D. TEST-RETEST RELIABILITY OF THE LCUSS: KAPPA STATISTICS
OF THE LCUSS ............................................................................................. 172
APPENDIX E. LAPTOP COMPUTER USER SCREENING SURVEY ............................ 176
APPENDIX F. FLYER FOR AN OBSERVATIONAL STUDY .......................................... 189
APPENDIX G. RESEARCH INVITATION LETTER ......................................................... 190
APPENDIX H. SCATTER PLOT OF LINEAR RELATIONSHIP BETWEEN
DURATION OF LAPTOP USE AND AVERAGE LAPTOP-RELATED
DISCOMFORT .............................................................................................. 192
APPENDIX I. SCATTER PLOT OF LINEAR RELATIONSHIP BETWEEN
PERCENTAGE OF TIME SPENT IN A LAPTOP WORKSTATION
SETUP AND AVERAGE LAPTOP-RELATED DISCOMFORT ............ 193
APPENDIX J. MEASURED ANGLES IN SIX SIMULATED LAPTOP WORKSTATION
SETUPS BETWEEN IMAGEJ AND GONIOMETER ............................. 195
APPENDIX K. DISCOMFORT RATING CHART .............................................................. 198
APPENDIX L. POST-HOC ANALYSIS OF ANGLES BETWEEN THE THREE LAPTOP
WORKSTATION SETUPS .......................................................................... 199
APPENDIX M. COMPARISON OF K-PECS AND ANOVA SUMMARY BETWEEN
THREE LAPTOP WORKSTATION SETUPS .......................................... 201

xi
APPENDIX N. POST-HOC ANALYSIS OF K-PECS BETWEEN THREE LAPTOP
WORKSTATION SETUPS .......................................................................... 204
APPENDIX O. COMPARISON OF PHYSICAL DISCOMFORT AND ANOVA
SUMMARY BETWEEN THREE LAPTOP WORKSTATION SETUPS
.......................................................................................................................... 207
APPENDIX P. POST-HOC ANALYSIS OF PHYSICAL DISCOMFORT BETWEEN
THREE LAPTOP WORKSTATION SETUPS .......................................... 208
APPENDIX Q. COMPARISON OF TASK PRODUCTIVITY AND ANOVA SUMMARY
BETWEEN THREE LAPTOP WORKSTATION SETUPS ..................... 209
APPENDIX R. POST-HOC ANALYSIS OF TASK PORDUCTIVITY BETWEEN THREE
LAPTOP WORKSTATION SETUPS ......................................................... 210
BIBLIOGRAPHY ..................................................................................................................... 211

xii
LIST OF TABLES
Table 2-1. Prevalence of MSD/MSS in Computer Use .................................................................. 7
Table 2-2. Awkward Postures Associated with MSD/MSS Among Desktop Computer Operators
....................................................................................................................................................... 12
Table 2-3. Comparison of Postural Risk Factors Between Desktop and Laptop Computer
Operators ....................................................................................................................................... 18
Table 3-1. Demographic Characteristics of Participants .............................................................. 61
Table 3-2. Location Percentages for Laptop Computer Use (Item 2.1) ........................................ 63
Table 3-3. Frequency of Reason for Location Selection (Item 2.2) ............................................. 64
Table 3-4. Frequency of the Carrying Methods of Laptop Computer (Item 3.1) ......................... 65
Table 3-5. Discomfort Related to Laptop Transportation Methods (Item 3.3) ............................. 65
Table 3-6. Frequency of the Carrying External Devices (Item 3.2) ............................................. 65
Table 3-7. Frequency of Task Types with Laptop Computer (Item 4.1) ...................................... 66
Table 3-8. Frequency of the Laptop Specifications (Item 5.1; 5.2; 5.3; 5.4; 5.5) ......................... 67
Table 3-9. Percentages of Weekly Computing Time (Item 6.1) ................................................... 69
Table 3-10. Duration of Laptop Computer Use (Item 6.2; 6.3; 6.4) ............................................. 69
Table 3-11. Frequency of the Typical Rest Breaks (Item 6.5) ...................................................... 69
Table 3-12. Percentage of Time in Each Laptop Computer Workstation Setup (Item 7.1) ......... 70

xiii
Table 3-13. Discomfort Related to Laptop Workstation Setup (Item 7.2) ................................... 70
Table 3-14. Frequency of Comfortable Workstation Setup for Laptop Computer Use (Item 7.3) 71
Table 3-15. Overall Discomfort Related to Laptop Computer Work (Item 8.2) (N = 28a ) .......... 72
Table 3-16. Frequency of Difficult Activities Related to Discomfort (Item 9.1) ......................... 73
Table 3-17. Frequency of the Attitude Toward the Laptop Computer (Item 10.1) ...................... 74
Table 3-18. Frequency of the Recreational Activities (Item 11.1) ............................................... 76
Table 3-19. Frequency of the Previous/Current History (Item 12.1 to 12.8) ................................ 77
Table 3-20. Relationship Between Duration of Laptop Computer Use and Average Laptop-
Related Discomfort ....................................................................................................................... 78
Table 3-21. Independent t-test of Duration of Laptop Computer Use Between Discomfort Groups
....................................................................................................................................................... 79
Table 3-22. Relationship Between Percentage of Time Spent in a Laptop Workstation Setup and
Average Laptop-Related Discomfort ............................................................................................ 80
Table 3-23. Independent t-test of Percentage of Time Spent in a Laptop Workstation Setups
Between Two Discomfort Groups ................................................................................................... 80
Table 4-1. Upper Body Angles Adopted in Observational Study ................................................ 99
Table 4-2. Absolute Differences in Angular Measurements Between ImageJ and Goniometer 104
Table 4-3. Essay Types for Laptop Workstation Setups ............................................................. 108
Table 4-4. Participants’ Demographic Characteristics ............................................................... 113
Table 4-5. Comparison of Angles and ANOVA Summary between Three Laptop Workstation
Setups .......................................................................................................................................... 114
Table 4-6: Significant Main Effect for 15 Items ......................................................................... 115

xiv
LIST OF FIGURES
Figure 3-1. Flowchart of survey study .......................................................................................... 40
Figure 3-2. Visual analogue scale adopted in item 3.3 ‘discomfort related to laptop transportation
methods’ ........................................................................................................................................ 45
Figure 3-3. Laptop workstation setups adopted in item 7.1 ‘typical laptop workstation setups’ . 49
Figure 3-4. Corlett and Bishop’s body chart (left) and adaptation in item 8.2 (right) .................. 51
Figure 3-5. Items of original SHRRF (left) and adaptation in section 9 (right) ........................... 53
Figure 4-1. Six simulated laptop workstation setups .................................................................... 95
Figure 4-2. Measurement of the angles using the ImageJ software program ............................... 97
Figure 4-3. Maker position in the lateral view and hand .............................................................. 99
Figure 4-4. Photograph of the laptop workstation setup configuration ...................................... 102
Figure 4-5. Overall discomfort reported following use of the three laptop workstation setups . 116

xv
PREFACE
There are many who helped me in the completion of this endeavor. I would like to express my
sincere gratitude to the chair of my dissertation committee, Dr. Nancy A. Baker, ScD, OTR/L.
Dr. Baker has given me the opportunity to experience eye-opening research, and I am grateful
for all of her support and incredible patience with me from start to finish on my dissertation.
Although there were many difficulties during this research study, Dr. Baker always showed a
resolute faith in my abilities. Also I would like to thank my committee members, Margo B.
Holm, PhD, OTR/L, for all of her support and guidance over the past four years and for sharing
her knowledge and expertise to accomplish my academic and research goals; Ketki D. Raina,
PhD, OTR/L, for refining and clarifying this dissertation and for her outstanding professional
guidance and support; Rakié Cham, PhD, for her knowledge and expertise in biomechanics and
for suggesting the methodology of my research. I would like to extend my gratitude to Joan C.
Rogers PhD, OTR/L, for her ongoing support throughout my PhD study at University of
Pittsburgh.
Finally and most importantly, I would like to thank my parents, Hyo-Chul Shin and
Moon-Soon Han, for their unconditional support and love throughout my life. Their love and
encouragement have been the foundation for my accomplishment in the United States. I also
include all of my friends and colleagues for being always supportive of me. I especially thank
Justin S. Hong for encouraging me complete this research with constant love and support.
1
1.0 INTRODUCTION
Laptop computers are widely used by college students for writing assignments, presenting
research projects, and leisure activities (e.g., playing games, watching movies, or communicating
with friends). According to two large annual surveys at the University of Texas (Wolff, 2006)
and the University of South Carolina (Crews, Brown, Bray, & Pringle, 2007), more than 50% of
students have laptop computers, and growth rate for students’ laptop computer ownership has
dramatically increased with an average of 65% from 2002 to 2004 and 227% from 2001 to 2006.
Another large web-based survey (Salaway, Caruso, Nelson, & Dede, 2007) of 15,000 college
students has reported that more students own a laptop computer (75.8%) rather than a desktop
computer (58.1%). In addition, replacement time of a laptop computer is shorter than that of a
desktop computer: approximately 34.5% of laptop computers are replaced in less than one year,
while only 8.1% of desktop computers are replaced in less than one year.
With the increasing use of laptop computers by college students, more students are
reporting musculoskeletal symptoms (MSS) while using their laptop computers. This may be,
because the design of laptop computers (e.g., small monitor and keyboard and lack of a separate
keyboard and monitor position adjustment) can promote awkward body postures (Hamilton,
Jacobs, & Orsmond, 2005; Jacobs et al., 2009; Raps & Nanthavanij, 2008). However there are
only three survey studies that have examined laptop computer use and MSS in college students.
This scarcity of information about characteristics of laptop computer use makes it difficult to

2
summarize and generalize the potential risk factors associated with MSS in laptop computer
operators.
In addition to these design problems, laptop computer operators are at high risk for
developing MSS due to environmental variability in their use. Laptop computers are widely used
in many environments (e.g., classroom, bedroom, or airport) and workstation setups (e.g.,
desktop, chair, lap sitting, lying supine, or lying prone). Harris and Straker (2000) suggested that
laptop computer operators may experience MSS due to the variety of non-traditional laptop
workstation setups that may place their body into awkward postures. However, there have been a
limited number of published research studies that have investigated the effects on postures of
laptop computer use in several laptop workstation setups. Understanding postural risk factors
related to different laptop workstation setups may provide insight into how laptop computer
operators can use their laptop computers safely.
The overall purpose of this dissertation is to extend knowledge about potential laptop-risk
factors that may be associated with MSS in college students. The general aims of this study are
to:
• Develop a valid and reliable survey instrument (Laptop Computer User Screening Survey
[LCUSS])
• Describe characteristics of laptop computer use in college students
• Examine the relationship between laptop-related risk factors and physical discomfort
• Examine the effects of the three simulated laptop workstation setups on upper body
postures, physical discomfort, and task productivity
In Chapter 2, we provide a literature review and background information on potential risk
factors associated with musculoskeletal disorder (MSD)/MSS in laptop computer operators. This

3
literature review provides the rationale for the aims addressed in this dissertation by identifying
what risk factors have been documented in previous research studies.
In Chapter 3, we report the results of a survey study that describes the characteristics of
laptop computer use (e.g., location of laptop computer use, laptop transportation methods,
laptop-related tasks, laptop specifications, duration of laptop computer use, laptop workstation
setup, and attitude toward laptop computers) in our sample population. The LCUSS was
developed from a literature review of empirical studies and then it was checked for validity and
reliability through a content validation process by a panel of content reviewers and test-retest
reliability. We also examined the relationships between laptop-related risk factors (i.e., duration
of laptop computer use and type of laptop workstation setups) and MSS (i.e., physical
discomfort).
In Chapter 4, we report the results of a randomized repeated cross-over study which
examined the effects of the three most common laptop workstation setups (i.e., desktop sitting,
chair sitting, and lying supine) on upper body postures, physical discomfort, and task
productivity. Although six simulated laptop workstation setups (i.e., desktop sitting, chair sitting,
lap sitting, floor sitting, lying supine, and lying prone) were recorded during data collection, we
only analyzed the three most common laptop workstation setups based on the findings of the
survey study in Chapter 3.
In Chapter 5, the findings of the two studies are summarized. The implications of these
findings regarding the laptop-related risk factors for MSS are also discussed.

4
2.0 POTENTIAL RISK FACTORS ASSOCIATED MUSCULOSKELETAL
DISORDERS AND SYMPTOMS IN LAPTOP COMPUTER OPERATORS:
LITERATURE REVIEW
This chapter provides background information for this dissertation. Since there have been a
limited number of published reports on the use of laptop computers and risk factors for their
use, this chapter reviews the potential risk factors associated with musculoskeletal disorders
(MSD) and symptoms (MSS) in desktop computer operators. The specific sections considered
in this chapter include the following areas: (1) musculoskeletal disorders and symptoms; (2)
MSD/MSS and computer use; (3) potential risk factors for MSD/MSS; (4) college students and
MSS associated with computer use; and (5) risk factor exposure assessments for MSD/MSS.
2.1 MUSCULOSKELETAL DISORDERS AND SYMPTOMS
According to the Bureau of Labor Statistics (2009), the term of musculoskeletal disorders (MSD)
refers to conditions that involve the nerves, tendons, muscles, and supporting structures of the
body. MSD have also been called several different names, such as ‘cumulative trauma disorder,’
‘repetitive strain or stress injury,’ ‘occupational overuse syndrome,’ and ‘activity-related pain
syndrome,’ because repeated exposure of the same muscle or tendon has been hypothesized to be
a risk factor for injury and inflammation to the affected area. However these classifications are

5
rarely accepted in scientific research field, because of their diagnostic uncertainty. Therefore, the
terminology of MSD has been selected as the common language in epidemiological research
field, because it represents diagnostic condition without assumptions about possible causative
factors (Boocock et al., 2009). The most common types of MSD are carpal tunnel syndrome, De
Quervains' disease, epicondylitis, tendonitis, thoracic outlet syndrome, tension neck syndrome,
and lower back pain (Kuorinka, Forcier, & Hagberg, 1995). Musculoskeletal symptoms (MSS),
on the other hand, are characterized by discomfort, pain, numbness, tingling, aching, stiffness,
and burning with various signs, such as swelling, redness, and difficulty moving a particular
body part (Armstrong, Foulke, Joseph, & Goldstein, 1982; Kuorinka et al., 1995; Silverstein,
Fine, & Armstrong, 1987). Early detection of MSS helps prevent the onset of potential MSD,
because physicians often diagnose MSD based on these symptoms.
MSD/MSS have been identified as the most common reason for reported work-related
illness, productivity loss, and long-term sick leave (Brady et al., 1997; Hartman, Oude Vrielink,
Huirne, & Metz, 2003; Putz-Anderson, 1988). In 2009, the Bureau of Labor Statistics reported
that there were 317,440 MSD cases requiring a median 10 days away from work, 2 days longer
than the median for all other types of work related to injuries. Aside from personal pain, health
care cost for the nation’s work force associated with MSD imposes a heavy burden on both the
community and the individual. In the United States (U.S.), conservative health care costs
associated with MSD were estimated at over $1.25 trillion in 1994 (Brady et al., 1997). Data
from Washington State also indicated that one third of workers’ compensation costs in private
industry in the U.S. were estimated to be caused by MSD and exceeded $20 billion between
1990 to 1998 (Silverstein, Viikari-Juntura, & Kalat, 2002). In the United Kingdom, an estimated

6
4.2 million working days were lost in 1995 due to upper extremity MSD, and costs associated
MSD were estimated to be at least £200 million (Graves, Way, Riley, Lawton, & Morris, 2004).
2.2 MSD/MSS AND COMPUTER USE
The associations between MSD/MSS and computer use have been a public health concern since
the mid 1980s, when the use of computers increased dramatically in the working environments
(Hopkins, 1990). In 2003, the U.S. Census Bureau reported 70 million American households
(62%) had one or more personal computers, up from 56% in 2001 (U. S. Census Bureau, 2005).
In the U.S., it was estimated that approximately 224 million people (76% of all U.S. adults) used
computers in 2004 (United Nations, 2007). The use of portable computers (i.e., laptop
computers) is also growing rapidly. In 2008, laptop computer shipments in the U.S. market
exceeded desktop computer shipments for the first time in the history of the industry
(International Data Corporation, 2008). In Japan, laptop computer sales have already reached
40% of total computer output (Villanueva, Jonai, & Saito, 1998). In China, laptop computer sales
have reached 34.5% (2.19 million units) of the total Chinese personal computer market in 2008
and accounted for nearly 40% in 2009 (Shenshen, 2009). It is not surprising that laptop
computers have become popular, because they have the advantage of being portable, lightweight,
and space and energy saving, enabling the users to work anywhere and anytime (Moffet,
Hagberg, Hansson-Risberg, & Karlqvist, 2002; Saito, Miyao, Kondo, Sakakibara, & Toyoshima,
1997).

7
Table 2-1. Prevalence of MSD/MSS in Computer Use
Study
Study Design
N
Prevalence Neck/Shoulder Hand/Arm
MSD MSS MSD MSS Kamwendo et al. (1991)
Cross-sectional
420 – 62.0%34.5%
1 – 2
25.0%15.0%
1
Hales et al.
1
(1994) Cross-sectional
518 9.0%6.0%
1 and 3 – 1 and 4
12.0%7.0%
1 and 6 – 1 and 5
Bergqvist et al. (1995b)
Cross-sectional
260 > 20.0% 61.5%1 9.0%1 30.0%1
Palmer et al. (2001)
1
Cross-sectional
1871 – 38.6% – 2 18.4%
Gerr et al.
2
(2002) Prospective cohort
632 6.0% 10.0%2 2.0%2 4.0%2
Brandt et al.
2
(2004) Prospective cohort
6943 1.4%0.6%
1 and 3 10.6%1 an4 7.6%
1 and 3 – 1 and 4
–
Cagnie et al. (2007)
Cross-sectional
512 – 45.5% – 1 –
Note. MSD = musculoskeletal disorders; MSS = musculoskeletal symptoms;11-year prevalence; 27-day prevalence; 3Neck; 4Shoulder; 5Elbow; 6
Hand and wrist
With such rapid increases in the use of computers, the health concerns about MSD/MSS
among computer operators have been increasing. The U.S. Department of Labor (2000) stated
these concerns as follows: “Internet computer use accounts for a significant number of MSD
each year, and occupational computer use is growing.” Epidemiological studies have
demonstrated a high prevalence of MSD/MSS among computer operators: the prevalence of
MSS ranges from 7.6 – 63.0% for neck/shoulder (N/S) and 4.0 – 30% for hand/arm (H/A); and
the prevalence of MSD ranges from 0.6 – 62.0% for N/S and 2.0 – 25.0% for H/A (see Table 2-
1) (Bergqvist et al., 1995b; Brandt et al., 2004; Cagnie et al., 2007; Gerr et al., 2002; Hales et al.,

8
1994; Kamwendo et al., 1991; Palmer et al., 2001). It is apparent that there is little agreement
concerning the prevalence of MSD/MSS among computer operators; these differences may be
due to differences in the measurement time-point used in the period prevalence calculation.
Given the high prevalence of MSD/MSS among computer operators, the identification of
contributing risk factors may have important public health implications.
2.3 POTENTIAL RISK FACTORS FOR MSD/MSS
This section describes potential risk factors for MSD/MSS in laptop computer operators. The
specific issues considered in this section include four subsections: (1) awkward posture; (2)
forceful exertion; (3) duration and rest breaks; and (4) individual factors. All of these risk factors
are used to provide item rationale for the initial question set of the survey instrument developed
for this dissertation studies.
2.3.1 Awkward posture
The most commonly cited risk factor in computer operators has been awkward postures. Several
epidemiological studies have suggested that awkward body posture is the strongest risk factor
associated with musculoskeletal problems (Bjelle, Hagberg, & Michaelson, 1981; Chaffin, 1973;
Liss, Jesin, Kusiak, & White, 1995; Punnett, Fine, Keyserling, Herrin, & Chaffin, 2000;
Sakakibara et al., 1987; van den Heuvel, van der Beek, Blatter, & Bongers, 2006).
In general, computer-related awkward posture is static or fixed postures of body parts.
Sustained postural muscle activity may cause localized muscle fatigue, which may develop even

9
during low-force exertion. In a cohort study by Garg et al. (2002), subjects reported high
perceived ratings of localized discomfort and muscle fatigue in their shoulders after 15 minutes
of holding a weight at 5% maximum voluntary contraction (MVC). Similarly, Sjogaard et al.
(1986) also observed the occurrence of perceived muscle fatigue during isometric knee extension
at 5% MVC, though blood flow was adequate to the muscle. Several studies support that static or
fixed postures are associated with musculoskeletal problems (Ekberg et al., 1994; Milerad &
Ekenvall, 1990). In a prospective cohort study with 1334 industrial workers, Ariens et al. (2001)
found a significant relationship between neck symptoms and prolonged neck flexion of over 20°
for more than 70% of working time and sedentary sitting posture for more than 95% of working
time.
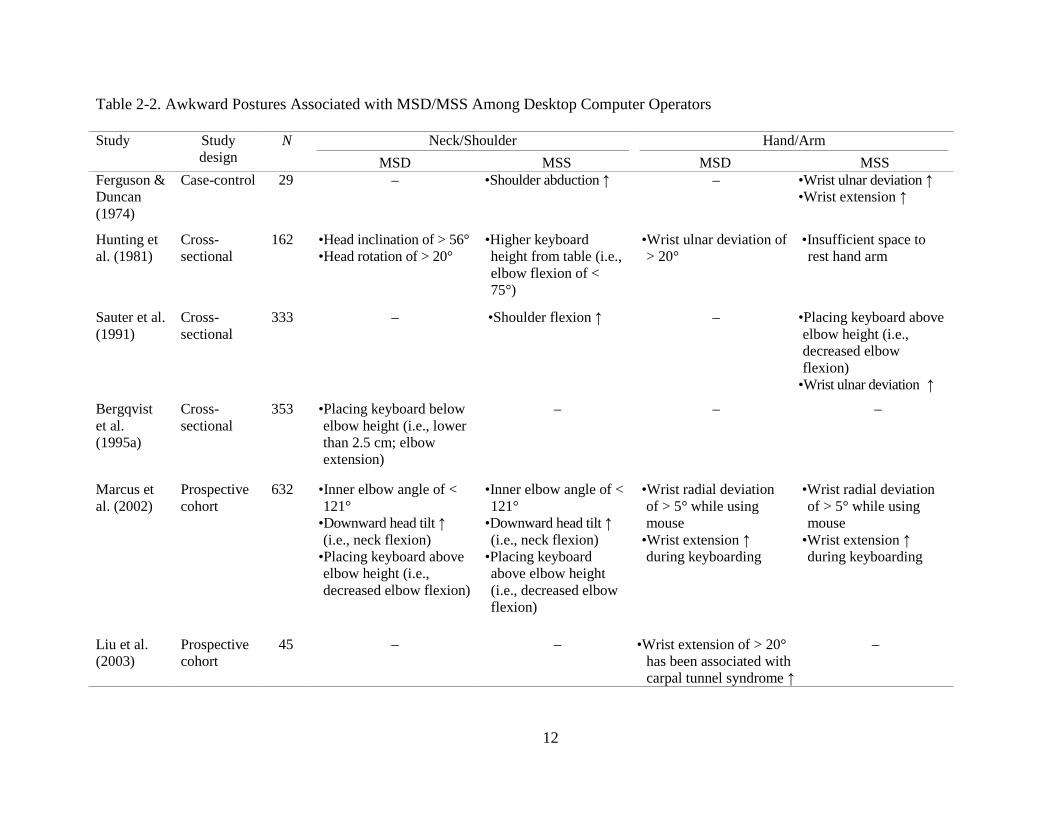
Desktop computer work with awkward upper body postures demonstrates the most
consistent relationship to MSD/MSS (see Table 2-2). Several studies have reported that desktop
computer operators work in awkward postures that place them at potential risk for developing
MSD/MSS (Jensen et al., 1998; Karlqvist, Hagberg, Koster, Wenemark, & Nell, 1996; Marcus et
al., 2002). These awkward postures include increased neck flexion greater than 20̊ (Ariens et al.,
2001), shoulder flexion greater than 35˚ (Marcus et al., 2002), ulnar deviation greater than 20̊
(Hunting, Laubli, & Grandjean, 1981; Liu et al., 2003), radial deviation greater than 5̊ (Marcus
et al., 2002), and wrist extension greater than 15˚ (Moore & Garg, 1994). In cross-sectional
studies with desktop computer operators, Hunting, Laubli, and Grandjean (1981) and Sauter,
Schleifer, and Knutson (1991) demonstrated that ulnar deviation greater than 20° was a
significant predictor of hand disorders and discomfort, specifically carpal tunnel syndrome.
Carpal tunnel pressure on the median nerve has been shown to be influenced by extreme body
postures during desktop computer work: wrist extension (Keir, Bach, & Rempel, 1998a; Liu et

10
al., 2003; Rempel, Keir, & Bach, 2008; Werner, Armstrong, Bir, & Aylard, 1997); wrist flexion
(Armstrong, Castelli, Gaynor Evans, & Diaz-perez, 1984; Rempel et al., 2008); and forearm
deviation greater than 45° of pronation (Keir, Bach, Hudes, & Rempel, 2007; Rempel, Bach,
Gordon, & So, 1998). In a prospective epidemiological study with 632 desktop computer
operators, Marcus et al. (2002) reported that static typing with an inner elbow angle of more than
121° and a radial wrist deviation of more than 5° while using a mouse, were also associated with
MSD/MSS among computer operators.
Prolonged and awkward postures of neck and shoulder are the most common awkward
postures associated with MSD/MSS in the upper body (Bergqvist et al., 1995b; Hales et al.,
1994; Kamwendo et al., 1991; Palmer et al., 2001). Several studies suggest that MSD/MSS of the
neck and shoulder were associated with sustained neck flexion, head inclination of 56° or more,
head rotation greater than 20°, and increased shoulder flexion and abduction in desktop computer
operators (Chaffin, 1973; Hunting et al., 1981; Marcus et al., 2002; Sauter et al., 1991). In
general, computer operators spend long hours at their computers without adequate breaks. And
while most people consider their hands, wrists, arms, and fingers as being used most, the neck
and shoulder generally maintain static postures (Kamwendo, Linton, & Moritz, 1991). The
prevalence of MSD/MSS for the neck/shoulder is higher than for the hand/arm among desktop
computer operators (see Table 2-1). These differences may result from the different movements
of muscles and pathophysiological reactions between hand/arm and neck/shoulder regions,
because the neck/shoulder muscles are more static than hand/arm muscles during computer
work. According to Visser and van Dieen (2006), it is unlikely that a single comprehensive
pathophysiological mechanism exists that explains tissue damage in the neck and shoulder. This

11
damage may be caused by Ca2+ accumulation in the active motor units, insufficient blood supply,
and metabolite removal in muscle compartments with large numbers of active motor units.
12
Table 2-2. Awkward Postures Associated with MSD/MSS Among Desktop Computer Operators
Study Study design
N Neck/Shoulder Hand/Arm MSD MSS MSD MSS
Ferguson & Duncan (1974)
Case-control 29
– •Shoulder abduction ↑ – •Wrist ulnar deviation ↑ •Wrist extension ↑
Hunting et al. (1981)
Cross-sectional
162 •Head inclination of > 56° •Head rotation of > 20°
•Higher keyboard height from table (i.e., elbow flexion of < 75°)
•Wrist ulnar deviation of > 20°
•Insufficient space to rest hand arm
Sauter et al. (1991)
Cross-sectional
333 – •Shoulder flexion ↑
– •Placing keyboard above elbow height (i.e., decreased elbow flexion)
•Wrist ulnar deviation ↑
Bergqvist et al. (1995a)
Cross-sectional
353 •Placing keyboard below elbow height (i.e., lower than 2.5 cm; elbow extension)
– – –
Marcus et al. (2002)
Prospective cohort
632 •Inner elbow angle of < 121°
•Downward head tilt ↑ (i.e., neck flexion)
•Placing keyboard above elbow height (i.e., decreased elbow flexion)
•Inner elbow angle of < 121°
•Downward head tilt ↑ (i.e., neck flexion)
•Placing keyboard above elbow height (i.e., decreased elbow flexion)
•Wrist radial deviation of > 5° while using mouse
•Wrist extension ↑ during keyboarding
•Wrist radial deviation of > 5° while using mouse
•Wrist extension ↑ during keyboarding
Liu et al. (2003)
Prospective cohort
45 – – •Wrist extension of > 20° has been associated with carpal tunnel syndrome ↑
–

13
Table 2–2 (continued).
Study Study design
N Neck/Shoulder Hand/Arm MSD MSS MSD MSS
Juul-Kristensen et al. (2004)
Prospective cohort
5033 – – – •Monitor below eye height (i.e., increased neck flexion)
Cagnie et al. (2007)
Cross-sectional
720 – •Prolonged neck flexion •Various short periods of movements with the neck
•Often working in static postures for a prolonged time
•Often making repetitive movements per minutes
•Often sitting for a prolonged time
– –
Rempel et al. (2008)
Cross-over 20 – – •Wrist extension of > 30° has been associated with carpal tunnel pressure ↑
•Radial wrist deviation of > 15° has been associated with carpal tunnel pressure↑
–
Note. MSD = musculoskeletal disorders; MSS = musculoskeletal symptoms

14
Laptop computers are different than desktop computers, in terms of the interaction
between inherent design characteristics and biomechanical aspects of the human body. These
differences may place laptop computer operators more at risk for MSD/MSS than desktop
computer operators, because the use of a laptop computer promotes more awkward postures. The
first aspect of laptop computers associated with awkward postures is the design and construction
of laptop computers that violate basic ergonomic requirements; namely that users can change the
positions of keyboard and monitor independently for an appropriate viewing and typing angle.
Most current laptop computers have their monitors fixed to the main body of the keyboard with a
hinge, so users cannot adjust the position (e.g., angle, height, and distance) between keyboard
and monitor (Harris & Straker, 2000; Saito et al., 1997; Saito et al., 2000). This lack of flexibility
in the arrangement of components may restrict the users from assuming a comfortable position
while operating their laptop computers. Adjustment of height and slope between the keyboard
and the monitor is one frequently recommended change in a computer workstation setup,
because a comfortable reach zone for the keyboard and the monitor varies among people with
different height, weight, and length of upper limbs. The Cornell University ergonomics website
(2004) explained this phenomenon as follows: “The reason is simple with a fixed design. If the
keyboard is in an optimal position for the user, the monitor isn't, and if the monitor is optimal the
keyboard isn't. Consequently, laptop computers are excluded from current ergonomic design
requirements because none of the designs satisfy this basic need.”
Several studies have found that as the monitor height was lowered, laptop computer
operators showed greater head and neck flexion (Burgess-Limerick, Plooy, & Ankrum, 1998;
Villanueva, Sotoyama, Jonai, Takeuchi, & Saito, 1996), increased muscle activity (Bauer &
Wittig, 1998; Villanueva et al., 1997)(Bauer & Wittig, 1998; M. B. Villanueva et al., 1997), and

15
increased physical discomfort (Sauter et al., 1991). Straker et al. (1997) found that laptop
computer operators showed significantly greater neck flexion and head tilt to view a lower laptop
monitor and to use the small keyboard, compared to the desktop computer operators. This result
was supported by Villanueva et al. (1998) and Saito et al. (1997), who reported that laptop
computer operators flexed their neck more than desktop computer operators. Furthermore,
electromyography (EMG) results of neck muscles in laptop computer operators were
significantly higher than those in the desktop computer operators (Saito et al., 1997; Villanueva,
Jonai, & Saito, 1998). These results suggest that since laptop computer devices cannot be
adjusted, subjects’ awkward body postures may increase biomechanical overload on the muscle
tissues. Table 2-3 provides a summary of research studies that compare the postural risk factors
between laptop and desktop computer operators.
Given these concerns of postural limitations caused by the laptop computer’s inherent
features, Sommerich, Starr, Smith, and Shivers (2002) examined the postural effects using a
stand-alone laptop computer vs. a laptop computer with external input devices; one group used
an external mouse, while the other group used an external keyboard. The results showed that use
of a stand-alone laptop induced significantly more postural fixity and non-neutral postures in
neck, shoulder, and elbow, compared to the other two groups with external input devices (i.e.,
external mouse and keyboard). The inherent restrictions of laptop computer design (e.g., a small
monitor and keyboard and the lack of a separate keyboard and monitor position adjustment) may
promote awkward or constrained body postures that may be associated with MSD/MSS.
Therefore, to prevent potential musculoskeletal problems, it is important to determine the
postural risk factors present in laptop computer working environment.

16
Another postural problem relevant to laptop computers is the effect of various laptop
workstation setups on their use. Since laptop computers have easy portability as the primary
advantage, they can be used in many different workstation setups. With laptop computers, people
are free to lie on the floor or bed, lean back on a couch in the hotel lobby, or even stand up. In a
survey study with school children aged 10 to 17, laptop computer operators reported that they
used their laptop computers in a wide variety of locations, such as school (98%), home (94%),
transport (10%), or other areas of school (2%) (Harris & Straker, 2000). These results were
supported by Sommerich, Ward, Sikdar, Payne, and Herman (2007), who reported that laptop
computer operators worked in various locations and workstation setups. Laptop workstation
setups assumed by laptop computer operators included desktop sitting (84%), followed by lying
prone (60%), floor sitting (58%), stool sitting (30%), and sitting with laptop computer on the lap
(50%). Harris and Straker (2000) suggested that physical discomfort experienced by laptop
computer operators may be from the variety of non-traditional laptop workstation setups that
may put their body into awkward postures. For example, lying prone may induce a laptop
computer operator to increase their neck extension and muscle load of neck and shoulder to
sustain the position.
In a laboratory study by Moffet, Hagberg, Hansson-Risber, and Karlqvist (2002) with
eight healthy subjects, the effect of two laptop workstation setups (i.e., desktop sitting and lap
sitting) was evaluated on upper body postures and muscle activities. The results found that
subjects assumed less neck flexion, backward trunk inclination, and wrist extension when
laptop computers were placed on desks than in their laps. However, higher muscle activity
levels in the trapezius and deltoid muscles were found in desktop sitting. Although the results
did not suggest the ideal laptop workstation setup, these findings suggest that the choice of

17
laptop workstation setup is important, and postural exposures can be influenced by workstation
setup. More recently, Asundi et al. (2010) compared upper body postures on three laptop
workstation setups (i.e., desktop sitting, lap sitting, and laptop sitting with a lap desk) using a
motion analysis system. They found that laptop computer operators in lap sitting showed greater
head down tilt, viewing angle, wrist extension, and physical discomfort than those in desktop
sitting. There were no differences between the lap and lap desk sitting.
In conclusion, the use of laptop computers may result in greater risk for MSD/MSS than the use
of desktop computers, due to their inherent designs and various laptop workstation setups. The
main problems are likely to be neck and upper limb discomfort, all due to restricted viewing
angles, inability to adjust the height and position of the keyboard and monitor, and small size of
the keyboard and monitor. All these problems may be exacerbated, because laptop computers
allow users great variety in workstation setups, when laptop computers are used away from
controlled environments with appropriate equipments and postures. Therefore, it is important to
evaluate physical risk factors in various laptop workstation setups and to recommend appropriate
workstation setups to laptop computer operators.

18
Table 2-3. Comparison of Postural Risk Factors Between Desktop and Laptop Computer Operators
Study Study design
N Independent variable(s)
Dependent variable(s)
Results
Straker et al. (1997)
Cross-over
16 •Desktop •Laptop (Desk sitting)
•UE Posture: angle •Discomfort: VAS •Performance: speed and number of errors
•Significantly increased neck flexion and head-down tilt in laptop computer operators compared to desktop computer operators
•Greater discomfort in laptop computer operators, but not significant •No difference in performance
Saito et al. (1997)
Cross-over
10 •Desktop •Laptop (Desk sitting)
•UE posture: angle and viewing distance
•Muscle activity: EMG
•Significantly increased head-down tilt and short viewing distance in laptop computer operators compared to desktop computer operators
•No difference in neck angle •Significantly increased EMG level of the neck muscles in laptop computer operators compared to desktop computer operators
Villanueva et al. (1998)
Cross-over
10 •Desktop •Laptop with various monitor sizes
(Desk sitting)
•UE posture: angle •Muscle activity: EMG
•Discomfort: VAS •Performance: speed and number of errors
•Significantly increased neck flexion, trunk forward bending, and inward rotation of shoulder in laptop computer operators compared to desktop computer operators
•Above values were more increased, as the size of laptop computers decreased
•Significantly increased neck, trapezius, deltoid, and extensor ulnaris muscles in laptop computer operators compared to desktop computer operators
•Significantly increased neck muscle, as the size of laptop computers decreased
•The highest discomfort was reported on a laptop computer of 6.1 inches
•No difference in performance
Szeto & Lee (2002)
Repeated measures
21 •Desktop •Laptop •Sub-laptop (Desk sitting)
•Neck posture: angle •Performance: speed, accuracy, and efficacy
•Significantly increased neck flexion •Significantly better performance on desktop computers compared to laptop computers
Note. UE = upper extremities; VAS = visual analogue scale; EMG = electromyography

19
2.3.2 Forceful exertion
Force is the amount of muscular efforts required to perform work. Exerting high forces can
increase the fatigue and physiological damage to the muscles, tendons, and joints (Armstrong,
1986). Several research studies have indicated the hand force of over 30 Newton (N) as a
potential risk factor for the development of MSD/MSS (Chiang et al., 1993; Silverstein et al.,
1987), yet other studies have not found that force may be a risk factor for these disorders and
symptoms (Moore & Garg, 1994).
Although keyboarding requires relatively low-force exertions, force applied to the
keyboard may be a risk factor for MSD/MSS due to the highly repetitive nature of typing
(Wahlstrom, 2005). It has been estimated that some professional typists can exert more than 46
N of force while typing, typically 3 – 5 times the necessary force (Marras & Karwowski, 2006).
The Board of Standards Review of the Human Factors and Ergonomics Society (BSR-HFES
100, 2002) has recommended that the minimum force required to electrically activate the key
should be between 0.25 N and 1.5 N. Rempel et al. (1997) also suggested that in order to
minimize the biomechanical loads to forearm tendons, keyboard users should exert forces of less
than 0.47 N.
Epidemiological studies have linked forceful fingertip loading tasks to carpal tunnel
syndrome (Keir, Bach, & Rempel, 1998b; Rempel, Keir, Smutz, & Hargens, 1997), MSS
(Feuerstein, Armstrong, Hickey, & Lincoln, 1997), and MSD (Armstrong, Foulke, Martin,
Gerson, & Rempel, 1994). Typing speed may influence keyboard strike force that may be
associated with risk factor for potential MSD. Although a laboratory study by Sommerich,
Marras, and Parnianpour (1996) did not show a significant relationship between key strike force

20
and typing speed, this might have been due to the greater number of keystrokes among the faster
typists. When the five subjects who participated in the study typed at three speeds (i.e., slower
than preferred, preferred, and faster than preferred), there were significant positive correlations
between the typing speed and keyboard reaction force.
However, these previous studies have been focused on the relationship between desktop
computer keyboarding and applied fingertip force. Laptop computer keyboards usually use a
scissor-switch membrane key type that is generally quiet and requires little force to press, while
desktop computers use a mechanical key that is more durable and provides louder auditory
feedback (i.e., sound of key click) than other keyboard types. The effects of auditory feedback
were examined by Gerard, Armstrong, Rempel, and Woolley (2002), who found that higher
auditory feedback caused a reduction of 10 – 20% in typing force. Bufton, Marklin, Nagurka,
and Simoneau (2006) also suggest that lower auditory feedback of laptop computer keyboard
may induce excessive overstrike force, even though laptop computers have lower key stiffness
than the desktop computer keyboard.
Carrying a laptop computer is an additional forceful exertion for laptop computer
operators which is not a consideration for desktop computer operators. Most desktop computers
are fixed in one place due to their size and weight, while laptop computers are often carried by
users. Although laptop computers have been getting lighter and smaller, many people carry them
with other supplementary accessories, such as power supply cords, spare batteries, or external
peripherals; adding weight to their laptop bag. The handling of a laptop bag with heavy loads,
particularly if it continues for long periods of time, is a potential risk factor for MSD/MSS
(Karwowski, 2001). Some surveys with schoolchildren have found that over 60% of students
who used laptop computers reported discomfort when carrying their laptop computers, and

21
shoulder discomfort was reported by more than 38% of students (Harris & Straker, 2000;
Manchester & Cayea, 1998; McDonald, 1995).
Few studies have reported on the prevalence of MSS related to carrying a laptop
computer, but the effect of carrying load in backpacks is well documented. In general, the effect
of load carrying has been measured by physiological and biological changes at different
backpack loads. Significant changes in oxygen consumption (Hong & Brueggemann, 2000), gait
pattern (Hong & Brueggemann, 2000), and trunk and head postures (Goodgold et al., 2002;
Grimmer, Dansie, Milanese, Pirunsan, & Trott, 2002) have been found in schoolchildren
carrying backpacks of 10% bodyweight or more. Pasco et al. (1997) examined the postural
effects between one-strap bag over shoulder and two-strap backpack, with constant bag weight of
17% body weight. The results demonstrated that one-strap bags promoted greater lateral trunk
bending, asymmetric shoulder elevation, and angular motion of head and trunk, compared to the
two-strap backpacks.
In conclusion, keyboard operation requires forceful fingertip exertions to press the keys.
It has been shown that keyboard reaction force may be affected by typing speed and auditory
feedback of keyboard. In addition to these risk factors, carrying a laptop computer results in an
additional burden that may be associated with potential MSD/MSS in the upper body. If people
carry other supplementary accessories (e.g., power supply cords or batteries) or textbooks in their
laptop bag, they may be at more risk for developing MSD/MSS.

22
2.3.3 Duration and rest breaks
The amount of time spent engaged in continuous computer work has been cited as a risk factor
for MSD/MSS of the neck, shoulder, and upper limbs. (Blatter & Bongers, 2002; Fredriksson et
al., 2002; Gerr et al., 2002; Jensen, Finsen, Sogaard, & Christensen, 2002; Karlqvist, Tornqvist,
Hagberg, Hagman, & Toomingas, 2002; Karlqvist et al., 1996; Tittiranonda, Burastero, &
Rempel, 1999). A systematic review of 9 longitudinal studies reported that the duration of
computer use was consistently associated with MSD/MSS (IJmker et al., 2007). These findings
may be explained using the theory of muscle overuse. Physical discomfort may be due to an
overuse of low threshold muscle fibers causing damage at muscle cell level, also known as the
Cinderella hypothesis (Hagg, 2000). In general, computer work is characterized by prolonged
and repetitive task with low external force demands. According to the Cinderella hypothesis,
prolonged low-level static contraction during working recruits type I muscle fibers, and this may
lead to chronic impairment of energy metabolism in selected muscle units.
In several research studies, a strong dose-response relationship has been established
between duration of computer use and prevalence of musculoskeletal problems; as daily
computer usage time increased, the odds of reporting daily musculoskeletal problems
consistently increased (odds ratios mostly ranged 0.99 to 2.86) (Bernard, Sauter, Fine, Petersen,
& Hales, 1994; Jensen, 2003; Lassen et al., 2004). In a cross-sectional study (Schlossberg et al.,
2004) with 206 graduate students, computer duration was identified as a risk factor for upper
extremity MSS. Hours of computer use were grouped into four levels (i.e., < 20, 20 – 29, 30 –
39, and 40 hr/week), and the results were compared to control group. Each increased hour of
computer use was associated with an increased odds ratio of reporting symptoms. This finding

23
was supported by Nakazawa et al. (2002) and Jensen (2003) suggesting that the duration of
computer use, particularly for more than 4 hours per day, was significantly associated with MSS.
Conversely, in a prospective study by Juul-Kristensen et al. (2004), the prolonged computer
work-time (i.e., 25% of time, 50% of time, 75% of time, and almost all time) was not a
significant risk factor related to the discomfort of upper extremity.
To prevent the onset of musculoskeletal problems, rest breaks away from intensive
computer operation are important for individuals who use computers for long periods of time.
Several researchers have proposed that the risk of MSD/MSS is increased in computer operators
who have limited rest break opportunities (Bergqvist et al., 1995b; Tittiranonda et al., 1999).
Rest breaks allow computer operators to obtain relief from all of the physical stains imposed by
continuous and constrained computer work, such as static muscle fatigue, reduced blood
circulation, and inflammation in tendons, muscles, and nerves (Carter & Banister, 1994).
Although the recommended interval between breaks and computer works is different among
researchers, frequent and short breaks have been proposed as a highly beneficial rest to restore
the ability to continue working (Fisher, Andres, Airth, & Smith, 1993; Henning, Jacques, Kissel,
Sullivan, & Alteras-Webb, 1997). In other words, taking a break of 5 minutes every half hour is
better than 10 minutes once an hour, although the total duration is the same (Floru, Cail, & Elias,
1985; Henning et al., 1997). Research has found that discomfort in upper extremities and eye
was significantly reduced by supplementary rest break interventions for computer operators
(Galinsky, Swanson, Sauter, Hurrell, & Schleifer, 2000; Ong, 1990). And still other research has
found that short rest breaks showed improvements in performance (e.g., typing speed or error
rate) (Floru et al., 1985; Gao et al., 1990). It is assumed that the performance improvement may

24
be mediated by increased alertness and decreased muscle fatigue produced by extra rest breaks
(Ong, 1990).
In conclusion, prolonged computer use, particularly more than 4 hours per day, is
significantly associated with the development of MSD/MSS. In order to prevent these potential
risks, frequent short breaks have been recommended as a means of reducing static loads in
computer operators. Therefore, it is important to identify accurate information about duration of
laptop computer use and rest breaks.
2.3.4 Individual factors
Individual factors have been defined as non-work, personal, or demographic factors that can
contribute to or help prevent MSD/MSS. These factors include gender, age, obesity, or cigarette
smoking (National Research Council and Institute of Medicine, 2001). In addition, we consider
that recreational activity is a potential risk factor of MSD/MSS, because participation in non-
occupational activities (e.g., sports or music-related instrument activities) may cause highly
repetitive or forceful movements.
2.3.4.1 Gender
In most of the studies which have examined the risk factors between upper extremity MSD/MSS
and computer use, women have had higher prevalence rates compared to men (Bernard et al.,
1994; Brandt et al., 2004; Gerr et al., 2002; Katz et al., 2000). Gerr et al. (2002) reported that
women had significantly greater risk factors for upper extremity MSD/MSS than men. In
epidemiological studies with college students, Katz et al. (2000) and Chang et al. (2007) reported
that female students had a significantly higher prevalence of symptoms compared to the male

25
students. Juul-Kristensen et al. (2004) also examined gender differences as a risk factor of
computer work in a prospective study. For all the regions of the upper body, a higher percentage
of women (22%) than men (11%) had physical discomfort in the shoulder.
In almost all studies regarding gender differences, women had an almost two-fold risk
compared to men. There are a variety of hypotheses to explain the differences based on
psychological and biological mechanism. One possible explanation for this increased risk for
women is that women may pay more attention to symptoms, and respond more aggressively than
men (Muller, 1990). Some studies have demonstrated that women tend to have more indirect
reactions to a pain event that include emotion-focused coping, seeking social support, and
relaxation, whereas men rely on direct action, such as problem-focused coping and talking
problems down (Unruh, 1996).
Another possible explanation is that underlying biological differences may predispose
women to have more discomfort. A review by Tittiranonda et al. (1999) suggests that some
gender differences in discomfort might be caused by differences in metabolism, physical
structures, and hormonal variations which could influence the biological mechanisms of pain
transmission, pain sensitivity, and pain perception. Although there are a number of plausible
explanations for gender differences in the prevalence of musculoskeletal problems, most research
studies suggests that women have more vulnerable biological and psychological natures (Unruh,
1996).
2.3.4.2 Age
Aging is associated with loss of skeletal muscle mass and, consequently, a decline in muscular
strength, endurance, and recovery from injury (National Research Council and Institute of
Medicine, 2001). These biological changes also include a reduction in the number of active

26
motor units (Doherty, Vandervoort, Taylor, & Brown, 1993; Kirkendall & Garrett, 1998) and in
muscle morphology and metabolism (Kirkendall & Garrett, 1998). In general, the decrease in
muscle strength begins around age 40, and is most rapid after age of 60 (Faulkner, Brooks, &
Zerba, 1990; Kirkendall & Garrett, 1998). Therefore, older individuals are more vulnerable to
injury and fatigue compared to younger individuals. Several studies have reported a high rate of
musculoskeletal discomfort in older individuals, in particular for physically demanding
occupations (de Zwart, Broersen, Frings-Dresen, & van Dijk, 1997; de Zwart, Frings-Dresen, &
van Duivenbooden, 1999).
For computer operators, higher age is significantly associated with MSD/MSS (Bergqvist
et al., 1995b). Several research studies suggest that older computer operators are more fragile to
localized muscle fatigue that may be associated with MSD/MSS, possibly due to age-related
alterations in all the major body systems (e.g., cardiovascular, metabolic, respiratory, and
neuromuscular) (Jensen, Ryholt, Burr, Villadsen, & Christensen, 2002; Kirkendall & Garrett,
1998).
Another age-related problem is computer vision syndrome for the elderly (Madhan,
2009). Focusing ability and tear production normally decrease with age (Sen & Richardson,
2007). Although rarely studied, vision problems may be related to MSD/MSS, because people
who wear bifocal or trifocal glasses tend to involuntarily lean their heads back or forward to see
through their glasses (Aaras, Horgen, Bjorset, Ro, & Thoresen, 1998; Wiholm, Richter,
Mathiassen, & Toomingas, 2007).
2.3.4.3 Obesity
In general, obesity is a very strong risk factor for carpal tunnel syndrome. The relationship
between body mass index (BMI) and carpal tunnel syndrome is explained by the accumulation of
27
fat tissues or synovial thickening in the carpal tunnel, which causes pressure to the median nerve
(Werner, Armstrong, Bir, & Aylard, 1997). In addition, many obese people use their upper
extremities as weight bearing limbs to change their center of gravity to support body fat (i.e.,
when rising from a chair, they usually have to use their arms to push up). This may put additional
pressure on the median nerve and account for the increased discomfort (Hooper, 2006).
Other than carpal tunnel syndrome, excessive weight poses an increased risk for
musculoskeletal problems, particularly for the rotator cuff tendinitis. In a case-control study with
311 patients who were required rotator cuff surgery, the risks for the shoulder surgery were
significantly higher for individuals with BMI of 35 or above (Wendelboe et al., 2004). In obese
people, accumulation of fat may lead to atherosclerosis and decreased blood flow to the rotator
cuff muscle (Hooper, 2006).
2.3.4.4 Cigarette smoking
Several studies have been found the associations between smoking and MSD/MSS for the neck
(Makela et al., 1991), shoulder (Ekberg et al., 1994), and leg (Brage & Bjerkedal, 1996), while
other studies have not found an association (Pietri et al., 1992). Although several plausible
explanations for these associations have been proposed by researchers, there is no obvious
mechanism for the associations between smoking and musculoskeletal problems. One plausible
explanation is that smoking may cause nutritional deficiencies in the musculoskeletal system and
joint structures through vasoconstriction, hypoxia, defective fibrinolysis, or atherogenic effect
(Frymoyer et al., 1983). Metabolic or direct toxic effects seem possible as well. These biological
effects may make muscle tissues sensitive to sudden high load stress causing acute injury and to
prolonged or repetitive low-load stress causing chronic trauma. Furthermore, recovery of muscle
tissue may also be delayed or incomplete (Kelsey, Githens, & O’Conner, 1984).

28
2.3.4.5 Recreational activities
Some non-occupational or recreational activities, such as sport, dance, or playing a musical
instrument, have been linked with MSD/MSS (Gosheger, Liem, Ludwig, Greshake, &
Winkelmann, 2003; Marras & Granata, 1995). Although most individuals engage in the right
amount of recreational and leisure activities as outside interests, sometimes these activities
include highly repetitive or forceful movements of the upper and lower extremities (Adams,
1965; Green & Rayan, 1997; Miller, Lowry, Meardon, & Gillette, 2007).
In addition, musculoskeletal problems relevant to performing arts or music have been
frequently cited as associated with MSS (Bruno, Lorusso, & L'Abbate, 2008; Hagberg,
Thiringer, & Brandstrom, 2005). Specifically, musicians working with an elevated arm position
(e.g., violinists, violists, flutists, and trumpet players) had a higher prevalence of the neck and
shoulder pain than those working in a more neutral position (Nyman, Wiktorin, Mulder, &
Johansson, 2007).
2.4 COLLEGE STUDENTS AND MUSCULOSKELETAL SYMPTOMS
ASSOCIATED WITH COMPUTER USE
This section discusses the rationale for selecting college students as the population group in this
dissertation and how musculoskeletal problems are associated with laptop computer use in
college students.
College students, both undergraduates and graduates, spend many hours each day at
computers, because computers are essential for carrying out routine academic activities, as well
as social and personal activities (Cortes et al., 2002; Saito et al., 1997). Several cross-sectional

29
studies with college students have reported a high prevalence (41 – 81%) of desktop computer-
related upper extremity MSS (Chang et al., 2007; Hamilton et al., 2005; Hupert et al., 2004;
Jenkins et al., 2007; Katz et al., 2000; Menendez et al., 2007; Schlossberg et al., 2004).
Furthermore, duration of daily desktop computer use longer than roughly 4 hours was
significantly associated with MSS among students (Chang et al., 2007; Schlossberg et al., 2004).
However, these studies only examined the prevalence of symptoms for desktop computer
operators, not laptop computer operators. With the increasing availability of wireless network
and laptop initiatives that provide or lease new laptop computers to freshman students on the
college campus, a laptop computer is essential for today’s college students for essay writing, web
surfing, or communicating with others (Weaver & Nilson, 2005). According to a survey at the
University of Texas at Austin from 2002 to 2004, the ownership of laptop computers increased
from 22% to 45% for undergraduates, while desktop computer ownership decreased from 75% to
55% (Wolff, 2006). The trend toward increased laptop computer ownership have also been
shown in a survey conducted by EDUCASE from 2005 to 2007 with 15,000 undergraduates
(Salaway et al., 2007). The survey revealed that 75.8% of students have laptop computers, while
58.1% of students have desktop computers.
Given the increased use of laptop computers by college students, there is a potential for
increase in exposure to risk factors associated with MSS. Although there are several research
studies that reported associations between laptop computer use and MSD/MSS in the general
population (Harris & Straker, 2000; Jonai, Villanueva, Takata, Sotoyama, & Saito, 2002;
Sommerich et al., 2007; Straker et al., 1997; Villanueva et al., 1998), only three studies
examined musculoskeletal discomfort in college laptop computer operators (Hamilton et al.,
2005; Jacobs et al., 2009; Raps & Nanthavanij, 2008). In a survey study of 111 female college
30
students by Hamilton et al. (2005), the associations between laptop computer use and
musculoskeletal symptoms were examined. Although there were no significant relationships
between physical discomfort and laptop computer use, 90% of students who used a laptop
computer reported musculoskeletal discomfort, compared to 80% for those who used a desktop
computer. Hamilton et al. (2005) suggest that further research is needed to investigate the
associations between laptop computer use and musculoskeletal discomfort. Jacobs et al. (2009)
examined how college students used their laptop computers, and what ergonomic strategies (i.e.,
provide the external notebook accessories and participatory ergonomic training) might be
effective in reducing musculoskeletal symptoms. This study reported that 66% of students
experienced musculoskeletal symptoms while using a laptop computer before starting ergonomic
training. There was a significant reduction in self-reported symptom from pre- and post- survey
in students who received external notebook accessories (78% to 65%) and in those who received
accessories and participatory ergonomic training (61% to 49%), but no changes in those in the
control group (58% to 55%). More recently, Raps and Nanthavanij (2008) also found that over
50% of students experienced discomfort related to laptop computer use, and the major body parts
reported by students for discomfort were their necks (60.8%), shoulders (53.9%), and backs
(55.9%).
In conclusion, many college students use their laptop computers for their academic and
leisure activities, and the potential awkward postural habits when using a laptop computer may
develop future musculoskeletal problems (Cortes et al., 2002; Hamilton et al., 2005). As
demonstrated in the risk factors section, laptop workstation setups are different from that of
desktop computers, in terms of a laptop’s inherent design and the diversity of workstation setups;
these differences may place laptop computer operators more at risk for musculoskeletal

31
discomfort than desktop computer operators. Therefore, it is important to understand the
associations between laptop computer use and musculoskeletal discomfort for college students.
College students are a population well suited for studying the effects of laptop computer use on
musculoskeletal discomfort, because of their role as knowledge workers in a computing-
dominated career.
2.5 EXPOSURE ASSESSMENT METHODS
This section provides an overview of various methods for assessing exposure to risk factors for
MSD/MSS. This information is used as the basis to consider respective advantages of assessment
methods and to support the rationale for selecting the assessment method used in the current
study. There are three general categories of commonly used physical exposure assessments to
estimate potential risk factors related to MSD/MSS: (1) self-reports; (2) observational methods;
and (3) direct measurement methods.
2.5.1 Self-reports
In musculoskeletal epidemiological studies, self-report methods can be used to collect data on
the prevalence of postures, the frequency of movements, or the presence of other physical agents
in the past and present via interview, questionnaire, or diaries. Self-report methods are appealing
due to their relative ease of administration and low expense compared to other methods. In
addition, these methods allow researcher to recruit a large population sample within a short
period of time (David, 2005; Marras & Karwowski, 2006). However, as subjective self-reports

32
are prone to be more easily influenced by other factors, the resulting information may be
potentially less reliable and valid. Spielholz, Silverstein, Morgan, Checkoway, and Kaufman
(2001) reported that self-reports were the least precise assessments, consistently over estimating
exposures for each of the measured factors (i.e., angle and force) compared to the observational
and direct measurement. Therefore, researchers often use self-report in conjunction with other
measurements, such as observational or direct methods (Burdorf & Laan, 1991; Wiktorin,
Karlqvist, & Winkel, 1993).
2.5.2 Observational methods
Observational measurement methods are either field-based or video-based. In a field based
measurement, a trained observer assesses workplace exposures using a checklist or summary
format. These can document predetermined activities or catalogue actions (Ketola, 2004).
Although these methods have been widely used for their simplicity (Kilbom, 1994; Stetson,
Keyserling, Silverstein, & Leonard, 1991), they do not provide sufficiently detailed information
on changes in exposure during task performance (Marras & Karwowski, 2006).
Video-based methods allow the analyst more detailed and reproducible evaluations as
they can code and review the data on videotapes either by hand or computer. In the computer, it
is also possible to analyze time codes on various time based events (e.g., tasks, postures, and
hand exertions) (Keyserling, Armstrong, & Punnett, 1991). For example, in a study by
Armstrong et al. (1982), the researcher sampled postures several times a second and classified
wrist postures using five categories: neutral, flexion, extreme flexion, and extension. Video-
based analysis is generally the most appropriate observational method to measure the risk factors
and to define the work activities for large scale epidemiological studies, because it allows the
33
analysts sufficient time to estimate the posture of various body parts. Although video-based
methods still have potential systematic biases, such as behavioral effects from the presence of
camera and occluded views of performance (Spielholz et al., 2001), it has the advantages of
being inexpensive, feasible, and accurate.
2.5.3 Direct measurement methods
Direct measurement (e.g., electromyography, goniometer, electromyography, and biomechanical
measurement) is the most accurate and precise method to obtain postural exposure information.
A variety of methods have been developed that rely on sensors attached directly to the skin to
measure exposure variables. These methods have added benefit of measuring force and joint
posture, but they have weaknesses, such as high cost, invasiveness, calibration, instrument
malfunction, and long training. Thus, although direct method may be most accurate, combined
method from questionnaire, interviews, and observational methods may be provide the best
method of measuring postural data (Marras & Karwowski, 2006).
In conclusion, although direct measurements have been considered the most accurate and
reliable measurement, modern video observation methods have the advantage of providing less
time consuming data collection while maintaining satisfactory accuracy. Spielholz et al. (2001)
comparing self-report, video observation, and direct measurement demonstrated that video
observation generally matched the results from direct measurement more closely than the self-
report questionnaire. However, after adjusting psychophysical scales as a confounding factor,
self-report results showed increased agreement with those of direct measurement.

34
2.6 SIGNIFICANCE
In the current study, the link between musculoskeletal symptoms (MSS) and laptop computer
work in college students is examined. MSS include discomfort, pain, numbness, stiffness, and
tingling, aching, and burning sensations. These symptoms have been used to diagnose
musculoskeletal disorders (MSD). Therefore, identifying the risk factors for MSS is important as
it may prevent the development of MSD. Although there are several studies that have examined
the associations between laptop computer use and MSS (Harris & Straker, 2000; Jonai et al.,
2002; Sommerich et al., 2007; Straker et al., 1997; Villanueva et al., 1998), there are only three
studies that assess if the use of laptop computers is associated with MSS among college students
(Hamilton et al., 2005; Jacobs et al., 2009; Raps & Nanthavanij, 2008). In addition, although
laptop computer operators work in many laptop workstation setups (e.g., desktop sitting, chair
sitting, lying supine, lap sitting, etc.), only two laboratory research studies have compared the
effects of different laptop workstation setups on body postures and MSS (Asundi et al., 2010;
Moffet et al., 2002). Therefore, this study contributes to scarce research on laptop computer use
that may be associated with MSS (i.e., physical discomfort). Specifically, the current study is
important for three reasons.
First, this study focuses on college students who frequently use laptop computers. As an
increasing number of college students enter computer-intensive occupations following
graduation, computer-related MSS may have a significant effect on their productivity and
professional future career plans. As described above, there are only three survey studies that
explore the characteristics of laptop computer use and the association between laptop computer

35
use and MSS in college students. The absence of this information creates a gap in understanding
the potential risk factors related to laptop computer use among college students. This study may
partially fill this gap and provide information to prevent potential MSS/MSD in college students.
Second, this study examines the effect of the three most common laptop workstation
setups (i.e., desktop sitting, chair sitting, and lying supine) on upper body postures,
musculoskeletal discomfort, and task productivity. In general, laptop computers are widely used
in various locations and workstation setups. However there are only two laboratory studies that
have examined laptop computer use in different laptop workstation setups. This limited
information about the effects of laptop workstation setups makes it difficult to summarize
postural risk factors and generalize the findings in laptop workstation setup. Understanding
postural risk factors related to laptop computer environments may provide insight into how
laptop computer operators can use their laptop computers more safely.
And third, this study increases knowledge of laptop computer use, in terms of
characteristics of laptop computer use and postural risk factors that may be associated with MSS.
This information could have major implications for occupational therapists (OTs) interested in
evaluation or wellness programs in laptop-related workplaces for the prevention of potential
MSD. OTs who are knowledgeable regarding physical, psychiatric, and interpersonal aspects of
human and environment, can help workers prevent injuries and allow them to return after an
injury. This study provides information about the characteristics of laptop computer use and
potential risk factors associated with laptop workstation setup. These findings may be useful for
OTs who want to identify the postural risks in laptop workstation setup and to provide
recommendations.

36
3.0 POTENTIAL RISK FACTORS AND CHARACTERISTICS OF LAPTOP
COMPUTER USE ASSOCIATED WITH MUSCULOSKELETAL SYMPTOMS
IN COLLEGE STUDENTS: SURVEY STUDY
3.1 BACKGROUND AND SIGNIFICANCE
Many college students use laptop computers to do academic-related activities in class and around
campus, such as research assignments, presentations, or data analyses, as well as leisure
activities (e.g., game, movie, or internet chat). According to two large annual surveys conducted
with college students by the University of Texas at Austin from 2002 to 2004 (Wolff, 2006) and
by the University of South Carolina from 2001 to 2006 (Crews et al., 2007), laptop computer
ownership had dramatically increased by more than 50%, while desktop computer ownership had
decreased to less than 50%. More recently, a survey study (Salaway et al., 2007) found that
college students’ laptop computer ownership had increased from 52.8% in 2005 to 75.8% in
2007, and younger students were more likely to use laptop computers rather than desktop
computers. Despite the increasing popularity of laptop computer use in college students, there
have been few studies that identify how college students use their laptop computers, or what
factors related to laptop computer use affect the students’ health.
Prolonged computer use has been considered a risk factor for musculoskeletal symptoms
(MSS). These symptoms include discomfort, pain, numbness, tingling, aching, stiffness, and

37
burning (Kuorinka et al., 1995). Epidemiological studies have reported a high prevalence (41% –
96%) of upper extremity MSS related to desktop computer use in college students (Chang et al.,
2007; Hamilton et al., 2005; Hupert et al., 2004; Katz et al., 2000; Menendez et al., 2009). In a
cross-sectional study by Hupert et al. (2004), 41% of college students who had computer-related
MSS reported functional limitations in their academic activities, and 23% of college students
reported taking medication for their symptoms. However, these research studies focused on
general or desktop computer use, not on the laptop computer use. Only three survey studies have
examined the relationships between laptop computer use and MSS in college students (Hamilton
et al., 2005; Jacobs et al., 2009; Raps & Nanthavanij, 2008). With the rapid increase of laptop
computer ownership in college students, it is important to characterize laptop-use patterns and to
examine the relationships between laptop computer use and MSS.
The literature review in Chapter 2 describes several risk factors associated with potential
musculoskeletal disorders (MSD)/MSS in laptop computer operators. These risk factors include
awkward body posture, forceful exertion (e.g., force related to keystroke and carrying a laptop
computer), duration of computer use and rest break, and individual factors (e.g., gender, age,
obesity, cigarette smoking, and recreational activities). Although we report several risk factors
for MSD/MSS that may be associated with laptop computer use, some factors are derived from
research studies that targeted desktop computer operators, not laptop computer operators. The
scarcity of research studies that examine the effects of laptop computer use patterns associated
with MSD/MSS makes it difficult to summarize risk factors and generalize the findings in laptop
computer operators.
Self-report surveys are useful for assessing potential risk factors and collecting
behavioral patterns at a relatively low cost and with easy administration, compared to direct or

38
observational methods (David, 2005). However, subjective self-reports are prone to
underestimate or overestimate respondent’ behaviors due to undesirable exposures, such as recall,
social desirability, or mood. Furthermore, weaknesses in self-report may arise from respondent
literacy, comprehension, or question interpretation (Spielholz et al., 2001). In order to minimize
these weaknesses in survey, it is important to develop a specific and well designed survey by
assessing the validity and reliability of the instrument.
This chapter describes how we developed the survey instrument, Laptop Computer User
Screening Survey (LCUSS). We then used the LCUSS to describe characteristics of laptop
computer use in college students and to examine the relationships between laptop-related risk
factors (i.e., duration of laptop computer use and percentage of time spent using each type of
laptop workstation setup) and MSS.
39
3.2 RESEARCH DESIGN AND METHODS
3.2.1 Research aims
This descriptive survey study describes the characteristics of laptop computer use in college
students and evaluates the relationships between laptop-related risk factors and physical
discomfort. In addition, we report how we developed the LCUSS, including a content validation
process by a panel of experts and test-retest reliability. This study addressed the following
research aims and questions:
• Research aim 1: Develop a valid and reliable survey instrument, the LCUSS
• Research aim 2: Describe the characteristics of laptop computer use (e.g., location of
laptop computer use, laptop transportation methods, laptop-related tasks, laptop
specifications, duration of laptop computer use, laptop workstation setups, and attitude
toward the laptop computers) in college students
• Research aim 3: Examine the relationship between laptop-related factors (i.e., duration of
laptop computer use and percentage of time spent using each type of laptop workstation
setup) and physical discomfort in the upper extremity
• Research question 3.1: Is there a relationship between duration of laptop
computer use and average laptop-related discomfort?
• Research question 3.2: Is there a relationship between percentage of time spent
using each type of laptop workstation setup and average laptop-related
discomfort?

40
3.2.2 Research design
This cross-sectional descriptive study used a survey methodology, and the procedures for the
study are presented in a flowchart in Figure 3-1. The development of the survey instrument,
Laptop Computer User Screening Survey (LCUSS), is described in section 3.2.4.
Figure 3-1. Flowchart of survey study
Test-retest reliability of
LCUSS
Final version of LCUSS
Survey study
Review of literature
Domain (construct)
development
Survey item development
Draft version of LCUSS
(beta-1)
Content validation
(two rounds)
First content review
by content experts
Draft version of LCUSS
Second content review
by graduate students

41
3.2.3 Participants
The subject population for the survey was college students, who were recruited from the
University of Pittsburgh. Inclusion criteria were: (1) undergraduate or graduate students; (2)
current use of a laptop computer; (3) no co-morbidities of the upper extremity, such as
neurological disorders or fractures; (4) the ability to tolerate the survey task for 30 minutes.
Exclusion criteria were: (1) presence of current musculoskeletal injuries in the back, neck,
shoulder, and upper limbs.
Subjects were recruited using advertising flyers that included research purpose, procedure,
benefit, and inclusion/exclusion criteria (see Appendix F). In addition to the recruitment using
the flyers, Master of Occupational Therapy (MOT) students were invited to participate in the
research study through means of a research invitation letter (see Appendix G). Written consent
was obtained prior to participation in the study.
3.2.4 Instrumentation
The instrument used in this study was a paper-and-pencil self-administered questionnaire. The
survey instrument was developed for this study through a literature review, content validation
process, and reliability test. The section 3.2.4 describes the instrument development (Research
Aim 1).
42
3.2.4.1 Constructing the survey items
Preliminary survey items were developed from the empirical studies that reported characteristics
of computer use in both desktop and laptop computer operators, and explored risk factors that
were related to MSD/MSS. Before constructing the survey items, the researcher determined the
topic domains based on the literature review. The following 12 domains are addressed in the
LCUSS with a total of 75 items: (1) demographic information; (2) location of laptop computer
use; (3) laptop transportation methods; (4) laptop-related tasks; (5) laptop specifications; (6)
usage time; (7) laptop workstation setup; (8) overall laptop related discomfort; (9) student health
related role functioning; (10) attitude toward the laptop computer; (11) recreational activities;
and (12) previous and current health status. Description and response scales for each survey item
are provided in the following section. Although we describe the laptop-related risk factors for
MSD/MSS in the literature review (Chapter 2), the rationale for each section is also provided.
In developing the items, scales, and design layout of the LCUSS, the researcher followed
principles of survey research suggested by Aldridge and Levine (2001). For example, the
researcher used simple and clear words, and complete sentences when constructing survey items.
If there were ambiguous terms, a brief explanation or picture were provided next to questions.
Open-ended questions were not used in the LCUSS, because respondents might find it difficult
to answer the questions or need a longer time for completion of the survey (Aldridge & Levine,
2001; DeVellis, 2003; Dillman, 2007; Presser, 2004; Thomas, 2004; Weisberg, 2005).
Demographic information section (14 items) included date of birth, gender, height, weight,
ethnicity, race, dominant hand, marital status, enrollment status, college entrance and graduation
years, class level, residence classification, and current college residence. Among these 14 items,
Section 1 – Demographic information

43
9 items were multiple choice scales, and 5 items had response textboxes to enter specific
numbers, such as birth date, height, and weight.
Rationale: Gathering basic demographic information allows the researcher to examine
trends and differences in the study sample. In addition, these data were used to identify if the
subjects participating in the survey were representative of a college student population (Green,
Camilli, & Elmore, 2006).
Location of laptop computer use section (2 items) contained information about where students
used their laptop computers, and the reasons for the selection of these locations. Locations were
defined as library, campus classroom, campus computer lap, home, cafe, and transportation (e.g.,
in bus, car, or airplane). Survey respondents were asked to assign a percentage for each answer
choice based on a total of 100 percent. Respondents were also asked to assign the rank 1 (most
important) to 6 (least important) to determine their reason for the selection of location (i.e.,
accessibility of wireless internet, presence of electrical outlet, presence of chair and desk,
presence of comfortable chair, and location is convenient).
Section 2 – Location of laptop computer use
Rationale: Laptop computers are used in a wide variety of locations and, thus, may be set
up in less than ideal workstation setup with inappropriate furniture or equipments (e.g., desks,
chairs, external devices). These unsuitable laptop workstation setups may foster adoption of
awkward body postures (Harris & Straker, 2000; Sommerich et al., 2007). This information may
enhance our understanding of how or why college students chose certain location.
44
Laptop transportation methods section (3 items) collected information about carrying methods of
laptop computers and supplementary external devices, and the severity of physical discomfort
experienced while transporting laptop computers. Methods of transporting laptop computers
were as follows: bag or briefcase with handle; over the shoulder bag or briefcase; rolling bag or
briefcase; and in a backpack. Supplementary external devices were classified as external mouse,
battery, keyboard, and disk drive, AC adaptor, and extension cord. Respondents were required to
check all possible answers out of the choices from a list.
Section 3 – Laptop transportation methods
Physical discomfort associated with each transportation method was assessed using the
Visual Analogue Scale (VAS) (see Figure 3-2). The VAS is 10-cm horizontal line; 0 indicates
‘no discomfort’ to the left of the line, while 10 indicates ‘unbearable discomfort’ to the right of
the line. Respondents placed an ‘X’ mark between the two extreme values to represent their
discomfort severity for each laptop transportation method. The reliability and validity of VAS
have been well established for measuring discomfort or pain intensity (Bijur, Silver, &
Gallagher, 2001; Downie et al., 1978; Gallagher, Bijur, Latimer, & Silver, 2002; McCormack,
Horne, & Sheather, 1988). In the VAS adopted in the LCUSS, the researcher included ‘Not
applicable; N/A’ response choice to increase the response rate and quality of collected data
(Iarossi, 2005).

45
(1) N/A No Discomfort Unbearable Discomfort Bag or briefcase with handle
(2)
N/A No Discomfort Unbearable Discomfort Over the shoulder bag or briefcase
(3)
Rolling bag or briefcase
N/A No Discomfort Unbearable Discomfort
(4)
In your backpack N/A No Discomfort Unbearable Discomfort
(5)
(If other method specified in #3.1)
Other N/A No Discomfort Unbearable Discomfort
Figure 3-2. Visual analogue scale adopted in item 3.3 ‘discomfort related to laptop transportation
methods’
Rationale: Carrying a laptop computer is a major risk factor for MSD/MSS of the neck
and shoulder. Some research studies found that over 44% of students reported physical
discomfort associated with carrying their laptop computers (Harris & Straker, 2000; Sommerich
et al., 2007). Shoulder discomfort was the most frequently cited body part related to carrying
laptop computers (Harris & Straker, 2000; Sommerich et al., 2007). Carrying laptop computers
in the shoulder bag was significantly associated with discomfort of the shoulder (Sommerich,
2002), while using a backpack or rolling bag were less risky for MSD/MSS (UC Berkeley, 2007;
University of Sunderland, 2001). Therefore, we included these items in the LCUSS, because
carrying loads may affect potential MSD/MSS of upper body parts.
Laptop related tasks section (1 item) included information about the types of tasks that students
engaged in most often when using their laptop computers. The types of tasks were as follows:
word processing; presentations; analysis or spreadsheets; CourseWeb or online courses; library
Section 4 – Laptop related tasks

46
search; web surfing to collect work related resources (e.g., assignment or research); scheduling;
look up contacts; communication with others (e.g., internet chat or chat room); shopping; check
news, weather, or sports; check e-mail; watch movies or videos; pay bills; and play games.
Respondents were asked to choose their top three task activities, and then ranked these activities
from 1 (most frequent) to 3 (least frequent).
Rationale: Describing the type of tasks students perform using their laptop computers
allows the researcher to understand how important the laptop computers are for students’ college
life. Recently, Sommerich et al. (2007) reported that laptop computers were used for a greater
variety of tasks than other writing means (i.e., paper or desktop computer). Most students used
their laptop computers not only for internet searches, but also for academic (e.g., research,
homework, or calculation) and leisure activities (e.g., communication, shopping, or video game)
(Raps & Nanthavanij, 2008; Sommerich et al., 2007; Wolff, 2006). Identifying type of laptop-
related tasks may also help to ascertain the potential for more risky postures, because different
task activities require different movements and postures. Hamilton (1996) reported that
significantly more subjects showed greater head flexion and variability in typing task than those
in reading and mouse tasks. Dennerlein and Johnson (2006) also demonstrated that typing tasks
were associated with greater ulnar deviation and postural variability of arm and hand, whereas
mouse tasks were associated with less neutral shoulder and more constrained posture. These
research studies suggest that the type of tasks may affect awkward body postures.
Laptop specifications section (5 items) consisted of: (1) laptop computer model; (2) type of input
devices (e.g., mouse, trackball, joystick, touch pad, track point, keyboard, and numeric keypad);
(3) type of external peripherals (e.g., webcam, speakers, and microphones); (4) laptop computer
Section 5 – Laptop specifications

47
weight (e.g., less than 2.5 lbs, 2.6 – 4.9 lbs, 5 – 6.9 lbs, and 7 lbs or more); and (5) monitor size.
All items used multiple-choice response scales. A picture was used to clarify the monitor size
item.
Rationale: There are numerous designs of laptop computers and input devices. Variability
of designs may have different effects on MSD/MSS, because each model of laptop computers
has a different weight and size that may require different body postures. Several studies have
examined the design effects of laptop computers and input devices (Hengel, Houwink, Odell, van
Dieen, & Dennerlein, 2008; Swanson, Galinsky, Cole, Pan, & Sauter, 1997). Smaller laptop
monitor size increased more constrained and flexed upper body postures (Sommerich, Joines, &
Psihogios, 2001; Villanueva et al., 1998; Villanueva et al., 1996), and presence of external input
devices (e.g., external keyboard, mouse, or numeric keypad) increased the use of neutral postures
and discomfort relief (Berkhout, Hendriksson-Larsen, & Bongers, 2004; Sommerich et al., 2002).
Usage time section (5 items) identified duration of laptop and desktop computer use and breaks
while using the laptop computers: (1) the percentage of time that students spent working on the
laptop and desktop computers per week; (2) the duration of time in years that students used any
laptop computers from first-time use; (3) the overall amount of time in hours that students spent
on their laptop computers per day; (4) the average amount of time in hours that students spent
continuously on their laptop computers per day without breaks; and (5) the typical amount of
time in minutes that students spent on break. First item (i.e., computing time of laptop and
desktop computers) asked respondents to assign a percentage of time spent with laptop and
desktop computer uses based on a total of 100 percent. Other three items (i.e., length of years
having a laptop computer, duration of daily laptop computer use, and duration of continuous
Section 6 – Usage time
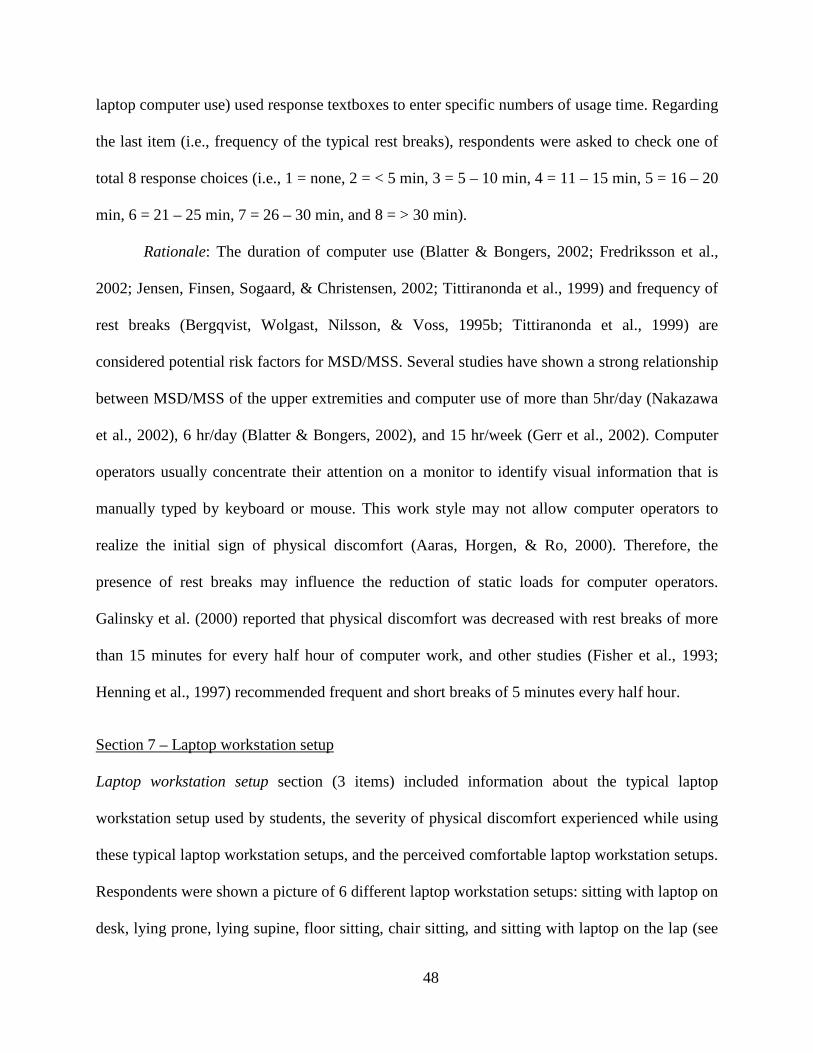
48
laptop computer use) used response textboxes to enter specific numbers of usage time. Regarding
the last item (i.e., frequency of the typical rest breaks), respondents were asked to check one of
total 8 response choices (i.e., 1 = none, 2 = < 5 min, 3 = 5 – 10 min, 4 = 11 – 15 min, 5 = 16 – 20
min, 6 = 21 – 25 min, 7 = 26 – 30 min, and 8 = > 30 min).
Rationale: The duration of computer use (Blatter & Bongers, 2002; Fredriksson et al.,
2002; Jensen, Finsen, Sogaard, & Christensen, 2002; Tittiranonda et al., 1999) and frequency of
rest breaks (Bergqvist, Wolgast, Nilsson, & Voss, 1995b; Tittiranonda et al., 1999) are
considered potential risk factors for MSD/MSS. Several studies have shown a strong relationship
between MSD/MSS of the upper extremities and computer use of more than 5hr/day (Nakazawa
et al., 2002), 6 hr/day (Blatter & Bongers, 2002), and 15 hr/week (Gerr et al., 2002). Computer
operators usually concentrate their attention on a monitor to identify visual information that is
manually typed by keyboard or mouse. This work style may not allow computer operators to
realize the initial sign of physical discomfort (Aaras, Horgen, & Ro, 2000). Therefore, the
presence of rest breaks may influence the reduction of static loads for computer operators.
Galinsky et al. (2000) reported that physical discomfort was decreased with rest breaks of more
than 15 minutes for every half hour of computer work, and other studies (Fisher et al., 1993;
Henning et al., 1997) recommended frequent and short breaks of 5 minutes every half hour.
Laptop workstation setup section (3 items) included information about the typical laptop
workstation setup used by students, the severity of physical discomfort experienced while using
these typical laptop workstation setups, and the perceived comfortable laptop workstation setups.
Respondents were shown a picture of 6 different laptop workstation setups: sitting with laptop on
desk, lying prone, lying supine, floor sitting, chair sitting, and sitting with laptop on the lap (see
Section 7 – Laptop workstation setup

49
Figure 3-3). Each respondent assigned a certain percentage of time used to each type of laptop
workstation setups, based on a total of 100 percent. Physical discomfort related to each laptop
workstation setup was measured by the VAS that is similar in format to the one described in
Section 3 (laptop transportation methods).
Figure 3-3. Laptop workstation setups adopted in item 7.1 ‘typical laptop workstation setups’
Rationale: Several surveys have reported that laptop computer operators used their laptop
computers at various workstation setups, such as desktop sitting (e.g., writing, regular, computer,
or sofa tables), lying prone, floor sitting, stool sitting, chair sitting (e.g., sofa, bench, fixed chair,
or height-adjustable chair), and lap sitting. These studies suggested that laptop computer
operators’ discomfort might be caused by awkward postures assumed in these various non-
traditional laptop workstation setups (Harris & Straker, 2000; Raps & Nanthavanij, 2008;
Sommerich et al., 2007), supporting the effect of laptop workstation setups on laptop computer
operators’ postures. This suggestion is supported by Moffet et al. (2002) and Asunsi et al. (2010),
who reported that laptop computer operators showed more neutral body postures (i.e., less head
flexion, trunk extension, and wrist extension) and less discomfort in the desktop sitting
workstation setup than those in the lap sitting workstation setup.
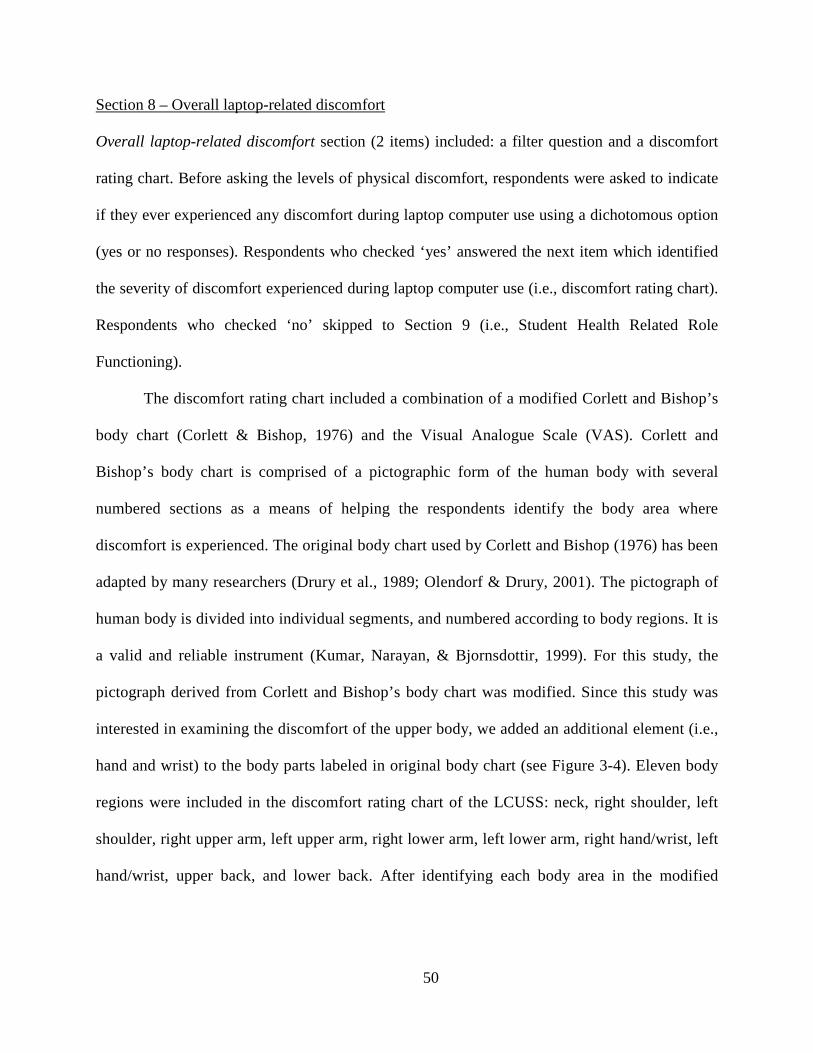
50
Overall laptop-related discomfort section (2 items) included: a filter question and a discomfort
rating chart. Before asking the levels of physical discomfort, respondents were asked to indicate
if they ever experienced any discomfort during laptop computer use using a dichotomous option
(yes or no responses). Respondents who checked ‘yes’ answered the next item which identified
the severity of discomfort experienced during laptop computer use (i.e., discomfort rating chart).
Respondents who checked ‘no’ skipped to Section 9 (i.e., Student Health Related Role
Functioning).
Section 8 – Overall laptop-related discomfort
The discomfort rating chart included a combination of a modified Corlett and Bishop’s
body chart (Corlett & Bishop, 1976) and the Visual Analogue Scale (VAS). Corlett and
Bishop’s body chart is comprised of a pictographic form of the human body with several
numbered sections as a means of helping the respondents identify the body area where
discomfort is experienced. The original body chart used by Corlett and Bishop (1976) has been
adapted by many researchers (Drury et al., 1989; Olendorf & Drury, 2001). The pictograph of
human body is divided into individual segments, and numbered according to body regions. It is
a valid and reliable instrument (Kumar, Narayan, & Bjornsdottir, 1999). For this study, the
pictograph derived from Corlett and Bishop’s body chart was modified. Since this study was
interested in examining the discomfort of the upper body, we added an additional element (i.e.,
hand and wrist) to the body parts labeled in original body chart (see Figure 3-4). Eleven body
regions were included in the discomfort rating chart of the LCUSS: neck, right shoulder, left
shoulder, right upper arm, left upper arm, right lower arm, left lower arm, right hand/wrist, left
hand/wrist, upper back, and lower back. After identifying each body area in the modified
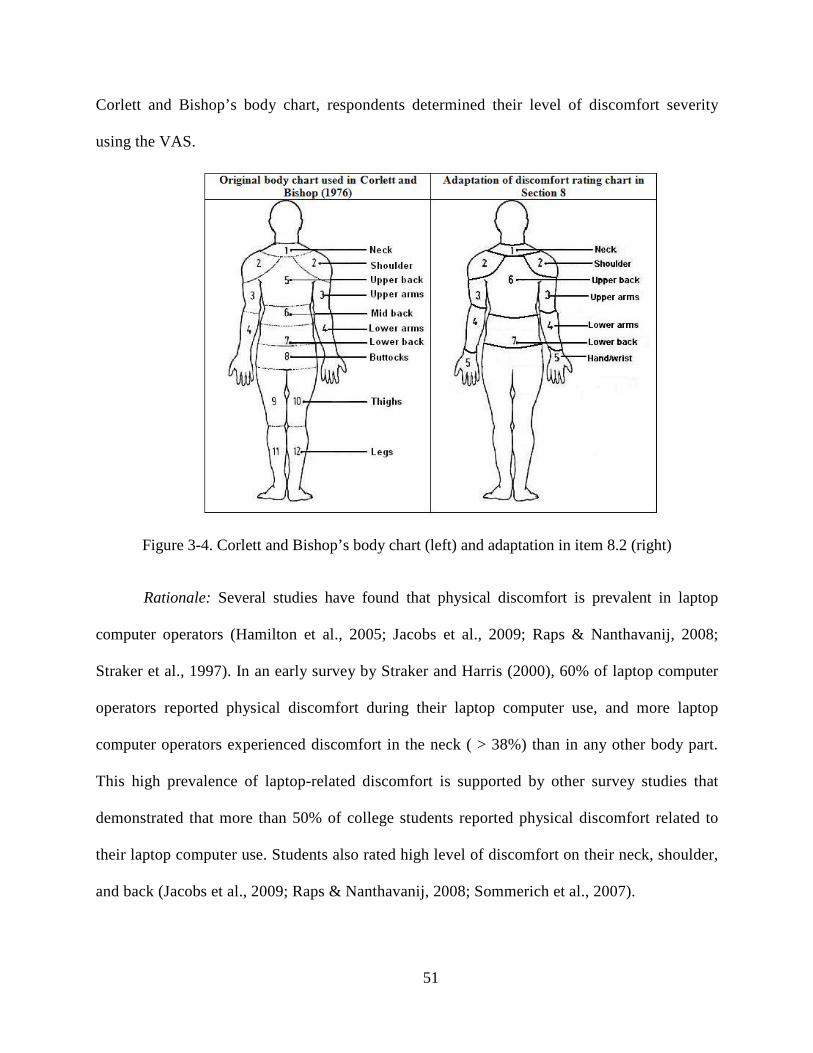
51
Corlett and Bishop’s body chart, respondents determined their level of discomfort severity
using the VAS.
Figure 3-4. Corlett and Bishop’s body chart (left) and adaptation in item 8.2 (right)
Rationale: Several studies have found that physical discomfort is prevalent in laptop
computer operators (Hamilton et al., 2005; Jacobs et al., 2009; Raps & Nanthavanij, 2008;
Straker et al., 1997). In an early survey by Straker and Harris (2000), 60% of laptop computer
operators reported physical discomfort during their laptop computer use, and more laptop
computer operators experienced discomfort in the neck ( > 38%) than in any other body part.
This high prevalence of laptop-related discomfort is supported by other survey studies that
demonstrated that more than 50% of college students reported physical discomfort related to
their laptop computer use. Students also rated high level of discomfort on their neck, shoulder,
and back (Jacobs et al., 2009; Raps & Nanthavanij, 2008; Sommerich et al., 2007).

52
Student health related role functioning section (16 items) measured effects of computer-related
MSS on roles experienced by college students. The Student Health Related Role Functioning
measure (SHRRF) developed by Katz et al. (2002) consists of 10 items ranging from 0 which
represents ‘no difficulty,’ to 4 which represents ‘so difficult I cannot do.’
Section 9 – Student health related role functioning
For the purpose of this study, the original SHRRF was modified. Figure 3-5 shows the
original SHRRF and modified version. In addition to the original 9 items in the SHRRF, the
tenth item (i.e., ‘do extracurricular activities’) was replaced with 7 recreational items to
determine detailed information about type of recreational activities. These 7 items were derived
from Section 11 (i.e., recreational activities) in the LCUSS: sports activities; playing a musical
instrument; video games; use of mobile phone; laboratory activities; intensive hand related
activities; and lifting and carrying activities. Since the original SHRRF was used for desktop
computer operators, changing some words were required for this study. Some words, such as
‘computer,’ were changed to ‘laptop computer.’
The SHRRF is internally consistent (Cronbach’s alpha of 0.87) and responsive to self-
perceived change (Katz et al., 2002). Katz and colleagues (2002) measured convergent validity
by comparing the SHRRF with the Brigham Functional Limitation Scale and with measures of
Generic Pain Severity and Brigham Symptom Severity. The results showed high correlations
with Brigham Functional Limitation Scale (r = .68), Generic Pain Severity (r = .65), and
Brigham Symptom Severity (r = .62).
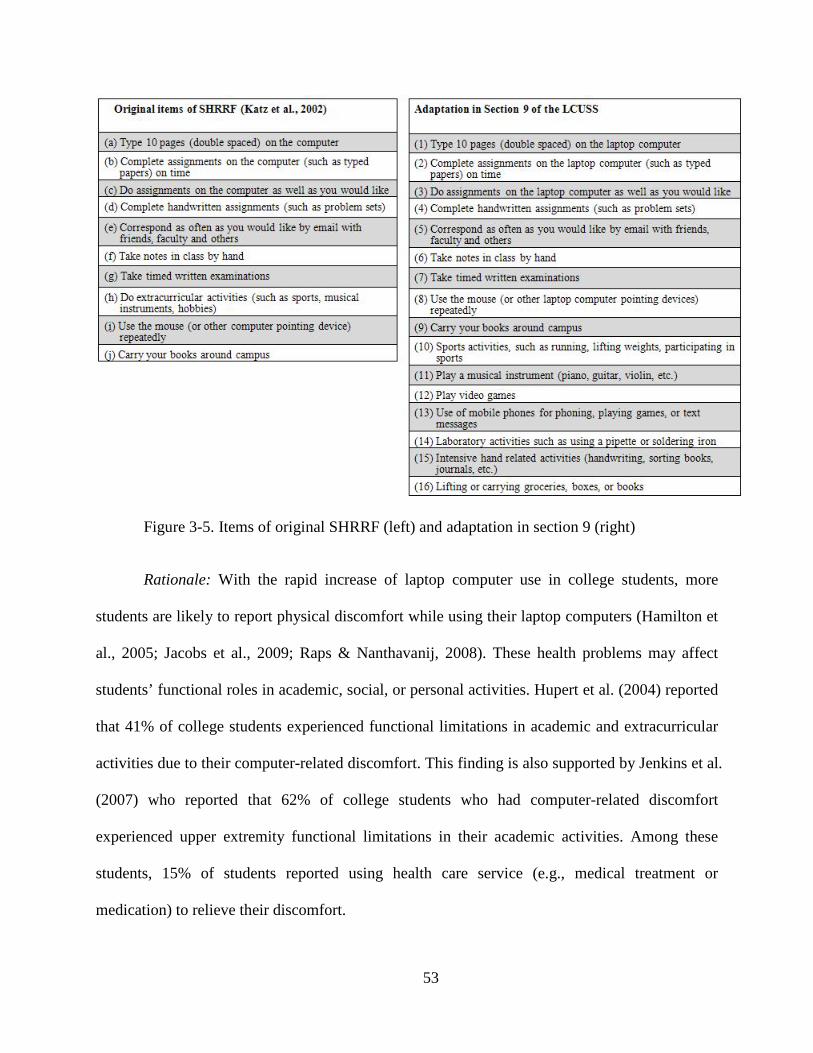
53
Figure 3-5. Items of original SHRRF (left) and adaptation in section 9 (right)
Rationale: With the rapid increase of laptop computer use in college students, more
students are likely to report physical discomfort while using their laptop computers (Hamilton et
al., 2005; Jacobs et al., 2009; Raps & Nanthavanij, 2008). These health problems may affect
students’ functional roles in academic, social, or personal activities. Hupert et al. (2004) reported
that 41% of college students experienced functional limitations in academic and extracurricular
activities due to their computer-related discomfort. This finding is also supported by Jenkins et al.
(2007) who reported that 62% of college students who had computer-related discomfort
experienced upper extremity functional limitations in their academic activities. Among these
students, 15% of students reported using health care service (e.g., medical treatment or
medication) to relieve their discomfort.

54
Attitude toward the laptop computer section (9 items) measured students’ positive and negative
attitudes towards laptop computers with 5-point Likert-type scale: strongly agree, agree, neutral,
disagree, and strongly disagree. There were 5 items which measured positive attitudes and 4
items which measured negative attitudes. These items were extracted from a survey developed
by Sommerich et al. (2007). The original version of the survey had a total of 21 items about
attitudes towards laptop computers. Although we were interested in college students’ attitudes
towards their laptop computers, the current study was focused on describing general
characteristics of laptop computer use and potential risk factors associated with these
characteristics. Therefore, only 9 items (positive and negative effects on academic activities)
were used in this section.
Section 10 – Attitude toward the laptop computer
Rationale: Students’ positive attitudes towards their laptop computers may contribute to
more frequent use or greater exposure to the laptop computers (Sommerich et al., 2007; Straker
& Pollock, 2005). In a cross-sectional study with high school students by Sommerich et al.
(2007), the students’ attitudes towards laptop computers were generally positive, suggesting that
these positive attitudes may influence increased use of laptop computers.
Recreational activities section (7 items) measured the amount of time that students spent in
seven recreational or non-occupational activities a week. These recreational activities were
defined as sports activities, playing a musical instrument, video games, use of mobile phone,
laboratory activities, intensive hand related activities, and lifting and carrying activities.
Respondents were asked to rate each activity using a 5-point Likert-type scale: never or rarely,
up to 5 hours, 6 to 10 hours, 11 to 20 hours, and more than 20 hours.
Section 11 – Recreational activities

55
Rationale: Excessive recreational or non-occupational activities may affect overall fitness
as a risk factor for MSD/MSS (Bruno et al., 2008; Gosheger et al., 2003; Green & Rayan, 1997;
Marras & Granata, 1995). If students are engaged in recreational activities that require forceful
exertion or repetitive movement, these may be risk factors that may be associated with potential
MSD/MSS. Several studies found a strong relationship between MSD/MSS and sports (Adams,
1965; Green & Rayan, 1997; Miller et al., 2007), musical activities (Bruno et al., 2008; Hagberg
et al., 2005), video or computer games (Johnsson-smaragdi, d'Haenens, & Krotz, 1998;
Macgregor, 2000), and mobile phone use (Hocking, 1998).
Previous/current health status section (8 items) gathered information regarding pre-existing
medical conditions, such as MSD (e.g., muscle spasm or sprain, tendonitis, thoracic outlet
syndrome, carpal tunnel syndrome, bursitis etc.), smoking behaviors, vision problems, and
overall self-reported physical health. Six items used multiple choice scales to determine
respondents’ previous or current health status, while the other two items were filter questions in
order to direct the respondents to the subsequent questions with dichotomous responses (yes or
no responses).
Section 12 – Previous/current health status
Rationale: Although the purpose of our study was to identify potential risk factors
associated laptop-related MSS, the multifactorial nature of MSS require investigation of some
individual factors that may be related to MSS. These factors include previous/current history of
MSD, cigarette smoking (Hartman, Vrielink, Huirne, & Metz, 2006; Kaergaard & Andersen,
2000), visual correction (Johnston, Souvlis, Jimmieson, & Jull, 2008), and self-perception of
general health condition (Kaergaard & Andersen, 2000; Lotters & Burdorf, 2006).
56
3.2.4.2 Content validation process
After creating the first draft version of the LCUSS (beta-1) based on the literature review, the
items and response choices were further expanded and modified through a content validation
process with content reviewers. Lynn (1995) has recommended that 3 to 10 content reviewers
should be employed to establish the validity of instrument. Developing survey instrument based
on a consensus from a panel of content reviewers has been widely documented in the fields of
survey research (Binkley, Finch, Hall, Black, & Gowland, 1993; Katz, 2002; Martin, Engelberg,
Agel, Snapp, & Swiontkowski, 1996).
This study had two rounds of review by a panel of content reviewers: the first round was
conducted by three content reviewers on August 20, 2009; and second round was conducted by
two graduate student reviewers on October 12, 2009. Reviewers were given a draft version of the
LCUSS (beta-1), and an expert panel evaluation form including guidelines and directions for the
panel of reviewers (see Appendix A).
The main points of consideration were: (1) if the questions were clear and
understandable; (2) if the examples were clear and appropriate; (3) if the order of questions was
clear; (4) if additional questions were needed; and (5) if the general survey design (i.e., font size,
length of the survey, and format) was appropriate. Reviewers rated each question item using a
dichotomous Yes/No scale and provided comments or suggestions. This procedure provided an
opportunity to detect and remedy a wide range of potential problems in the survey instrument.
All reviewers agreed that the 12 topic domains addressed in the LCUSS (beta-1) and
content of subsequent items were appropriate, and minor changes of content were needed. Most
concerns raised by the reviewers were specific wording problems and survey format flow. For
the wording problems, we changed some ambiguous or unclear words. In addition, the reviewers
57
suggested that less important questions should be moved to the end of the survey, and similar
questions should always be grouped together. Sections 1 to 8 were kept in their original order,
because these domains had the most similar items regarding the characteristics of laptop
computer use. Section 9 (previous/current health status) and section 10 (recreational activities) of
the original survey were moved to end of survey, because these questions were less important as
they addressed individual factors, not laptop-related factors. Additional feedback was that all
questions and response choices should be precoded to simplify and speed up the process of
entering data into a computer program. Numerical codes, therefore, were provided by the side of
each of the response choices. A summary of the suggestions raised by reviewers are described in
Appendix B. Based on feedback from a panel of reviewers, the draft version of the LCUSS (beta-
1) was modified, revised, and finalized.
3.2.4.3 Test-retest reliability of the LCUSS
Fifteen of 30 subjects who participated in the experimental study (Chapter 4) agreed to take part
in the test-retest reliability study. Fleiss (1986) has recommended that minimum of 15 to 20
subjects are required for estimating the reliability of a quantitative variable. Thus, we considered
that this sample size was a reasonable number to be confident on the reliability of the results.
After finishing the first survey, all subjects were provided with a copy of the LCUSS to take
home with them. They were asked to complete the survey two weeks later and return it. Each
subject was contacted by the PI by e-mail to complete and return the second survey.
All data were entered into the Microsoft Office Excel 2007 and analyzed by the
Statistical Package for the Social Sciences (SPSS) 17.0 software program. Test-retest reliability
was assessed by comparing instrument scores for respondents from the 2 time points. Intra-class
correlation coefficients (ICCs) were used to calculate the linear correlation of two continuous or

58
percentage variables. ICCs were considered as ‘good’ reliability when above 0.5 or less than 0.8,
and excellent if greater than .80 (Hulley, 2007). In this study, we used single measure ICCs
because this survey may be only used once by a student at one time period (Yen & Lo, 2002).
Kappa statistics were calculated for dichotomous variables (yes or no responses). A Kappa value
over 0.75 is considered as ‘excellent’ reliability, 0.40 to 0.75 as ‘good’ reliability, and below
0.40 as ‘poor’ reliability (Fleiss & Cohen, 1973).
Most ICCs were generally ‘acceptable’ or ‘good’ and ranged from 0.53 to 1.00 (p < .05),
except for one item (i.e., discomfort related to rolling back or brief case) (ICCs = 0.01, p = .49).
All Kappa coefficients were also significant at ‘good’ to ‘excellent’ level. They ranged from 0.44
to 1.00 (p < .05). Only one item showed a ‘poor’ level; item 5.2 (i.e., type of input device related
to keyboard) (Kappa = 0.33, p = .09). The results of ICCs and Kappa are shown in Appendices C
and D, respectively.
The final version of the LCUSS (see Appendix E) was used to describe the characteristics
of laptop computer use in college students, and examine the relationships between laptop related
factors (i.e., duration of laptop computer use and type of laptop workstation setups) and physical
discomfort.
3.2.5 Procedures
This survey study was approved by the University of Pittsburgh Institutional Review Board.
After obtaining informed consent, the LCUSS was distributed to 30 students at the
University of Pittsburgh. Information regarding inclusion/exclusion criteria was described
in Section 3.2.3. Filling out the survey and consent form took an average of 30 minutes and
maximum of 50 minutes.
59
3.2.6 Data management and processing
The raw data from the LCUSS was manually entered into a Microsoft Office Excel 2007
spreadsheet, and then transferred into a SPSS 17.0 software program. The LCUSS includes a
total of 75 items with seven types of response scales: multiple-choice (23 items); constant sum (3
items); rank order (3 items); Likert-type (32 items); dichotomous (3 items); textbox (8 items);
and visual analogue scales (3 items). Multiple choice scales were used for both single (17 items)
and multiple answers (6 items).
3.2.7 Data analyses
Research aim 2: Characteristics of laptop computer use
To answer this research aim, we completed descriptive analyses for all variables. Categorical
data were represented using frequencies and percentages. For the continuous data, we calculated
means, standard deviations, and ranges.
Research question 3.1: Relationship between duration of laptop computer use and discomfort
Duration of laptop computer use consisted of three items in Section 6 of the LCUSS: (1) length
of years having a laptop computer; (2) duration of daily laptop computer use, in minutes; and (3)
duration of continuous laptop computer use without breaks, in minutes. Overall laptop-related
discomfort scores were obtained from Section 8.2. To compare these time variables with overall
laptop-related discomfort, we first calculated the “average discomfort score” by summing all the
discomfort scores and dividing by eleven body regions. Pearson’s correlation was used to
discover if the continuous time variables were related to the average laptop-related discomfort
60
value. In addition, an independent t-test was used to compare time variables between two
discomfort groups (minimum discomfort group < 2 cm, and greater than minimum discomfort
group ≥ 2 cm). We selected 2 cm as our split point as previous research has suggested that less
than 2 cm indicates a minimal level of discomfort. (Oeverland, Akre, Kvaerner, & Skatvedt,
2005). The selected critical level of alpha significance for all tests was p < .05.
Research question 3.2: Relationship between laptop workstation setup and discomfort
There were six laptop workstation setups rated on a continuous scale (i.e., percentage) in Section
7.1 of the LCUSS: (1) sitting with laptop on desk; (2) lying prone; (3) lying supine; (4) floor
sitting; (5) chair sitting; and (6) sitting with laptop on the lap. We used the same analysis strategy
that was described in the research question 3.1. After calculating the average score of overall
discomfort, we computed the Pearson’s correlation between the average discomfort value and the
percentage of time spent in each of the six laptop workstation setups. An independent t-test was
used to compare percentage of time at each laptop workstation setup between the two discomfort
groups (minimum discomfort group < 2 cm, and greater than minimum discomfort group ≥ 2 cm).
Statistical significance was set at p < .05.

61
3.3 RESULTS
3.3.1 Research aim 2: Characteristics of laptop computer use
3.3.1.1 Section 1: Demographic information
There were 30 college students in this study, 25 female and 5 male. Table 3-1 shows the
demographic characteristics of the sample. Ages ranged from 20 to 48 years with a mean age of
26.0 ± 7.3. The participants’ mean height and weight were 70.3 ± 2.7 inches for men and 66.1 ±
5.6 inches for women, and 162.8 ± 35.3 lbs for men and 141.0 ± 32.9 lbs for women. The
majority of participants were white (63.3%), right handed (90.0%), never married (86.7%), and
full time students (100%).
Table 3-1. Demographic Characteristics of Participants
Demographics Mean ± SD or number (%)
Age, years 26.0 ± 7.3
Male 28.4 ± 5.2
Female 25.5 ± 7.6
Gender
Female 25 (83.3%)
Height, in. 66.8 ± 5.4
Male 70.3 ± 2.7
Female 66.1 ± 5.6
Weight, lbs 144.6 ± 33.7
Male 162.8 ± 35.3
Female 141.0 ± 32.9

62
Table 3–1 (Continued).
Demographics Mean ± SD or number (%)
Ethnicity
Non Hispanic or Latino 30 (100.0%)
Race
Asian 10 (33.3%)
Black or African American 1 (3.3%)
White or Caucasian 19 (63.3%)
Dominant hand
Right 27 (90.0%)
Left 2 (6.7%)
Both 1 (3.3%)
Marital status
Never married 26 (86.7%)
Married 2 (6.7%)
Divorced 2 (6.7%)
Current enrollment status
Full time student 30 (100.0%)
Entrance year into a university, years 2007.0 ± 2.1
Anticipated graduation year, years 2010.0 ± 0.6
Class level
Sophomore 1 (3.3%)
Junior 6 (20.0%)
Senior 6 (20.0%)
Graduate students 17 (56.7%)
Residence classification at the university
In-state student 16 (53.3%)
Out-of-state student 3 (10.0%)
International student 11 (36.7%)

63
3.3.1.2 Section 2: Location of laptop computer use
The most popular location of laptop computer use was home (69.7 ± 31.3%), followed by library
(9.8 ± 16.0%), café or restaurant (8.4 ± 20.9%), and campus classroom (4.2 ± 10.0%) (see Table
3-2). More than 20% of respondents reported that their primary reason (1st and 2nd
Table 3-2. Location Percentages for Laptop Computer Use (Item 2.1)
most
important) for location selection was accessibility of wireless internet, followed by presence of
electrical outlet and convenient location (See Table 3-3).
Locations of laptop computer use Mean ± SD (%)
Home (n = 27) 69.7 ± 31.3
Library (n = 17) 9.8 ± 16.0
Café or restaurant (n = 11) 8.4 ± 20.9
Campus classroom (n = 10) 4.2 ± 10.0
Office (n = 2) 3.0 ± 11.5
Outdoor places (yarn, lawn, street) (n =5) 2.3 ± 9.2
Campus computer lab (n = 6) 1.8 ± 3.8
Friend’s house (n = 2) 0.5 ± 2.0
Transportation (in bus, car, or plane) (n = 2) 0.2 ± 1.0
Note. ‘n’ indicates the number of respondents who selected each response, as ‘yes’

64
Table 3-3. Frequency of Reason for Location Selection (Item 2.2)
Selection Reasons
1st 2 important
nd 3 important
rd 4 important
th 5 important
th 6 important
th N/A important
n (%) n (%) n (%) n (%) n (%) n (%) n (%) Accessibility of wireless internet
10 (33.3) 8 (26.7) 6 (20.0) 5 (16.7) 1 (3.3) - -
Presence of electrical outlet
7 (23.3) 6 (20.0) 8 (26.7) 6 (20.0) 3 (10.0) - -
Presence of chair and desk
4 (13.3) 5 (16.7) 7 (23.3) 7 (23.3) 5 (16.7) 1 (3.3) 1 (3.3)
Presence of comfortable chair
- 6 (20.0) 2 (6.7) 4 (13.3) 14 (46.7) 2 (6.7) 2 (6.7)
Location is convenient
7 (23.3) 6 (20.0) 7 (23.3) 5 (16.7) 4 (13.3) - 1 (3.3)
Laptop size and weight
2 (6.7) - - - - 1 (3.3) 27 (90.0)
Note. N/A = Not applicable; Total number of respondents (N = 30) are defined as the horizontal sum
3.3.1.3 Section 3: Laptop transportation methods
Most respondents carried their laptop computers in their backpacks (76.7%) and in the
shoulder bag (63.3%) (see Table 3-4). While the backpack showed a relatively low discomfort
level on the VAS, the shoulder bag showed the highest discomfort level (see Table 3-5). Few
respondents used the rolling bag to carry their laptop computers. Most respondents (83.3%)
reported that they carried an AC adapter with their laptop computers. Approximately half of

65
the respondents took an external mouse and one-fourth of the respondents took an external
battery when carrying their laptop computers (see Table 3-6).
Table 3-4. Frequency of the Carrying Methods of Laptop Computer (Item 3.1)
Carrying methods n (%)
In your backpack 23 (76.7)
Over the shoulder bag or briefcase 19 (63.3)
Bag or briefcase with handle 10 (33.3)
Rolling bag or briefcase 1 (3.3)
Note. ‘n’ indicates the number of respondents who selected each response, as ‘yes’
Table 3-5. Discomfort Related to Laptop Transportation Methods (Item 3.3)
Discomfort (VAS) Mean ± SD (cm)
In your backpack (n = 24a 2.8 ± 1.6 )
Over the shoulder bag or briefcase (n = 20a 4.1 ± 1.9 )
Bag or briefcase with handle (n = 12a 3.4 ± 2.6 )
Rolling bag or briefcase (n = 3a 1.0 ± 1.2 )
Note. VAS = visual analogue scale; ‘n’ indicates the number of respondents who selected each
response, as ‘yes’; a
Table 3-6. Frequency of the Carrying External Devices (Item 3.2)
exclude N/A numbers from total 30 respondents. These numbers do not
agree with those in the Table 3-4, because some non-respondents for Item 3.1 rated discomfort
in Item 3.3
Carrying devices n (%)
AC adapter 25 (83.3)
External mouse (full or small size mice) 13 (43.3)
External battery 7 (23.3)
Extension cord 4 (13.3)
External disk drive 3 (10.0)
External keyboard -
Note. ‘n’ indicates the number of respondents who selected each response, as ‘yes’

66
3.3.1.4 Section 4: Laptop related tasks
Overall, laptop computers were used for several activities, excepting ‘check the news, weather,
sports, etc.’ activity which was not chosen by any respondents. The majority of respondents
reported that the most frequently performed task (1st
Table 3-7. Frequency of Task Types with Laptop Computer (Item 4.1)
frequent) was to check e-mail (50.0%),
followed by word processing (26.7%), and CourseWeb or online course (10.0%) (see Table 3-7).
Their second most frequent task was word processing (30.0%), CourseWeb or online course
(20.0%), web surfing (16.7%), and communication with others (13.3%). Most respondents tended
to do the academic-related tasks (e.g., word processing or CourseWeb) with their laptop computers
rather than non-occupational tasks (e.g., play games, pay bills, watch movies, or shopping).
Tasks 1st 2 frequent nd 3 frequent rd N/A frequent n (%) n (%) n (%) n (%)
Word processing 8 (26.7) 9 (30.0) 9 (30.0) 4 (13.3) Presentations - - 1 (3.3) 29 (96.7) Analysis or spreadsheets 1 (3.3) - 2 (6.7) 27 (90.0) CourseWeb or online courses 3 (10.0) 6 (20.0) 3 (10.0) 18 (60.0) Library search - - 1 (3.3) 29 (96.7) Web surfing 1 (3.3) 5 (16.7) 3 (10.0) 21 (70.0) Scheduling - 1 (3.3) - 29 (96.7) Look up contacts - - 1 (3.3) 29 (96.7) Communication with others 2 (6.7) 4 (13.3) 3 (10.0) 21 (70.0) Shopping - 1 (3.3) 1 (3.3) 28 (93.3) Check news, weather, sports, etc. - - - 30 (100.0) Check e-mail 15 (50.0) 4 (13.3) 3 (10.0) 8 (26.7) Watch movies or videos - - 1 (3.3) 29 (96.7) Pay bills - - 1 (3.3) 29 (96.7) Play games - - 1 (3.3) 29 (96.7)
Note. N/A = Not applicable; ‘n’ indicates the number of respondents who selected each response, as ‘yes’; Total number of respondents (N = 30) are defined as the horizontal sum

67
3.3.1.5 Section 5: Laptop specifications
The most popular laptop computer model was HP, followed by Dell, and then Lenovo. The
mouse (70.0%) and keyboard (63.3%) were the most popular input devices used by respondents.
More than half of the respondents used a webcam and speaker. Most respondents owned a laptop
computer with a monitor size of 14.0 – 15.9 inches and a weight of 5.0 – 6.9 lbs. (i.e., thin and
light type). None of the respondents reported that they used the mini-laptop computers with a
monitor size of less than 12 inches and a weight of less than 2.5 lbs. (see Table 3-8).
Table 3-8. Frequency of the Laptop Specifications (Item 5.1; 5.2; 5.3; 5.4; 5.5)
Laptop specifications n (%)
5.1 Laptop computer models
HP 9 (30.0)
Dell 8 (26.7)
Lenovo (IBM) 5 (16.7)
Toshiba 3 (10.0)
Apple Mac 2 (6.7)
Sony 1 (3.3)
Spartan 1 (3.3)
Jetta 1 (3.3)
5.2 Input devices
Mouse 21a
Keyboard
(70.0)
19a
Touch pad
(63.3)
18a
Numeric pad
(60.0)
3a
Trackball
(10.0)
2a
Track point
(6.7)
1a
Joystick
(3.3)
-

68
Table 3–8 (Continued).
Laptop specifications n (%)
5.3 Other external devices
Speakers 16a
Webcam
(53.3)
15a
Microphones
(50.0)
9a
Earphones
(30.0)
2a
5.4 Laptop weight
(6.7)
5.0 – 6.9 Ibs. (Thin and light) 15 (50.0)
2.6 – 4.9 Ibs. (Ultraportable) 8 (26.7)
7.0 Ibs. Or more (Desktop replacement) 7 (23.3)
Less than 2.5 Ibs. (Netbook or subnotebook) -
5.5 Monitor size
14.0 – 14.9 inches 9 (30.0)
15.0 – 15.9 inches 9 (30.0)
13.0 – 13.9 inches 6 (20.0)
17.0 inches or more 3 (10.0)
12.0 – 12.9 inches 2 (6.7)
16.0 – 16.9 inches 1 (3.3)
Less than 12.0 inches -
Note. a
3.3.1.6 Section 6: Usage time
indicates the number of respondents who selected each response, as ‘yes’
Respondents were more likely to use their laptop computers (78.6 ± 22.7%) than their desktop
computers (21.4 ± 22.7%) (see Table 3-9). On average, duration of daily laptop computer use
was 246.7 ± 161.5 minutes, and duration of continuous laptop computer use without any rest
breaks was 92.2 ± 58.2 minutes (see Table 3-10). One-third of the respondents reported that they
took rest breaks of less than 5 minutes during laptop computing. Only 5 respondents had a rest
break of more than 20 minutes (see Table 3-11).

69
Table 3-9. Percentages of Weekly Computing Time (Item 6.1)
Weekly computing time Mean ± SD (%) Range
Laptop computing time (n = 30) 78.6 ± 22.7 20 – 100
Desktop computing time (n = 24) 21.4 ± 22.7 0 – 80
Note. ‘n’ indicates the number of respondents who selected each response, as ‘yes’
Table 3-10. Duration of Laptop Computer Use (Item 6.2; 6.3; 6.4)
Duration of laptop computer use Mean ± SD
Length of years having a laptop computer 4.4 ± 2.6
Duration of daily laptop computer use, minutes 246.7 ± 161.5
Duration of continuous laptop computer use, minutes 92.2 ± 58.2
Table 3-11. Frequency of the Typical Rest Breaks (Item 6.5)
Rest breaks n (%)
< 5 minutes 10 (33.3)
5 – 10 minutes 9 (30.0)
11 – 15 minutes 6 (20.0)
26 – 30 minutes 2 (6.7)
> 30 minutes 2 (6.7)
21 – 25 minutes 1 (3.3)
16 – 20 minutes -
None -
3.3.1.7 Section 7: Laptop workstation setup
The most common laptop workstation setups used by respondents were sitting with the laptop on
a desk (59.3 ± 34.0%), followed by lying supine, chair sitting, lap sitting, floor sitting, and lying
prone (see Table 3-12). Most respondents reported high levels of discomfort while lying prone
(5.1 ± 2.6 cm) and floor sitting (5.1 ± 1.4 cm) (see Table 3-13). Respondents also reported that

70
they considered the most comfortable laptop workstation setup to be desktop sitting, followed by
lying supine, lap sitting, and lying prone. (see Table 3-14).
Table 3-12. Percentage of Time in Each Laptop Computer Workstation Setup (Item 7.1)
Laptop workstation setup Mean ± SD (%)
Sitting with laptop on desk (n = 27) 59.3 ± 34.0
Lying supine (n = 23) 14.3 ± 16.9
Chair sitting (n = 16) 10.7 ± 21.4
Sitting with laptop on the lap (n = 12) 10.7 ± 22.6
Floor sitting (n = 10) 3.5 ± 7.9
Lying prone (n = 5) 1.4 ± 4.1
Note. ‘n’
Table 3-13. Discomfort Related to Laptop Workstation Setup (Item 7.2)
indicates the number of respondents who selected each response, as ‘yes’
Discomfort (VAS) Mean ± SD (cm)
Sitting with laptop on desk (n = 27a 1.9 ± 1.4 )
Lying supine (n = 23 a 3.7 ± 1.9 )
Chair sitting (n = 19 a 3.7 ± 2.1 )
Sitting with laptop on the lap (n = 15 a 3.9 ± 1.9 )
Floor sitting (n = 12 a 5.1 ± 1.4 )
Lying prone (n = 9 a 5.1 ± 2.6 )
Note. VAS = visual analogue scale; ‘n’ indicates the number of respondents who selected
each response, as ‘yes’; a
exclude N/A numbers from total 30 respondents. These numbers do
not agree with those in the Table 3-12, because some non-respondents for Item 7.1 rated
discomfort in Item 7.2

71
Table 3-14. Frequency of Comfortable Workstation Setup for Laptop Computer Use (Item 7.3)
Comfortable
workstation
setup
1st
comfort
2nd 3
comfort
rd 4
comfort
th 5
comfort
th 6
comfort
th N/A
comfort
n (%) n (%) n (%) n (%) n (%) n (%) n (%)
Sitting with laptop on desk
24 (80.0) 1 (3.3) 3 (10.0) - - 2 (6.7) -
Lying prone 1 (3.3) 1 (3.3) 3 (6.7) 3 (10.0) 4 (13.3) 14 (46.7) 5 (16.7)
Lying supine 3 (10.0) 10 (33.3) 6 (20.0) 4 (13.3) 4 (13.3) - 3 (10.0)
Floor sitting - 1 (3.3) 3 (10.0) 8 (26.7) 6 (20.0) 6 (20.0) 6 (20.0)
Chair sitting - 12 (40.0) 8 (26.7) 5 (16.7) 3 (10.0) - 2 (6.7)
Sitting with laptop on the lap
2 (6.7) 4 (13.3) 6 (20.0) 5 (16.7) 7 (23.3) 1 (3.3) 5 (16.7)
Note. N/A = Not applicable; Total number of students (N = 30) are defined as the horizontal sum
3.3.1.8 Section 8: Overall laptop related discomfort
Respondents were asked if they experienced any physical discomfort while using their laptop
computers. Most respondents (96%) reported neck discomfort, which also had the highest level
of discomfort (4.3 ± 2.8 cm) (see Table 3-15). The least frequently reported body areas for
discomfort were left lower arm (1.0 ± 1.1 cm) and right (1.2 ± 1.8 cm) and left upper arm (0.9 ±
1.4 cm). Neck and upper back areas experienced the most severe discomfort when using the
laptop computers, while left upper arm experienced the least. All right body parts experienced
greater discomfort compared to left body parts.

72
Table 3-15. Overall Discomfort Related to Laptop Computer Work (Item 8.2) (N = 28a
Discomfort (VAS)
)
Mean ± SD (cm)
Neck (n = 27) 4.3 ± 2.8
Upper back (n = 26) 4.3 ± 2.5
Lower back (n = 26) 3.2 ± 2.5
Rt. shoulder (n = 21) 2.5 ± 2.8
Lt. shoulder (n = 21) 2.2 ± 2.8
Rt. hand/wrist (n = 25) 2.2 ± 2.2
Lt. hand/wrist (n = 24) 1.8 ± 2.0
Rt. lower arm (n = 21) 1.3 ± 1.5
Rt. upper arm (n = 20) 1.2 ± 1.8
Lt. lower arm (n = 19) 1.0 ± 1.1
Lt. upper arm (n = 20) 0.9 ± 1.4
Note. VAS = visual analogue scale; Rt. = Right; Lt. = Left; a
3.3.1.9 Section 9: Student health related role functioning
Two
respondents reported no discomfort during laptop computing; ‘n’ indicates
the number of respondents who selected each response, as ‘yes’
Respondents were asked to rate their health-related functional limitations associated with use of
laptop computers. Their responses to these questions are described in Table 3-16. None of the
respondents reported that they had maximum difficulty (i.e., so difficult I cannot do at all) in any
activity. In general, more than half of the respondents reported ‘no difficulty’ on most activities.
At the individual activity level, most respondents reported ‘severe difficulty’ and ‘mild
difficulty’ for carrying books around campus, ‘moderate difficulty’ for taking timed written
examinations, and ‘no difficulty’ for using mobile phones. The ‘carrying books around campus’
activity was the most frequently mentioned activity associated with functional limitations
experienced by respondents with upper extremity discomfort. More than 30% of respondents

73
reported some degree of functional limitations in following items: type 10 pages on the laptop,
carry books around campus, and sports activities.
Table 3-16. Frequency of Difficult Activities Related to Discomfort (Item 9.1)
Activities No difficulty
Mild difficulty
Moderate difficulty
Severe difficulty
So difficult
N/A *
n (%) n (%) n (%) n (%) n (%) n (%) Type 10 pages on the laptop
7 (23.3) 7 (23.3) 3 (10.0) - - 13 (43.3)
Complete assignments on the laptop on time
21 (70.0) 5 (16.7) 1 (3.3) 1 (3.3) - 2 (6.7)
Do assignments on the laptop as well as you would like
19 (63.3) 7 (23.3) 2 (6.7) - - 2 (6.7)
Complete handwritten assignments
19 (63.3) 5 (16.7) 2 (6.7) 1 (3.3) - 3 (10.0)
Correspond as often as you would like by email
25 (83.3) 2 (6.7) 3 (10.0) - - -
Take notes in class by hand
19 (63.3) 5 (16.7) 3 (10.0) 1 (3.3) - 2 (6.7)
Take timed written examinations
19 (63.3) 1 (3.3) 5 (16.7) 2 (6.7) - 3 (10.0)
Use the mouse repeatedly
24 (80.0) 5 (16.7) 1 (3.3) - - -
Carry books around campus
10 (33.3) 14 (46.7) 3 (10.0) 3 (10.0) - -
Sports activities 14 (46.7) 10 (33.3) 3 (10.0) 1 (3.3) - 2 (6.7) Play a musical instrument
10 (33.3) 1 (3.3) 1 (3.3) - - 18 (60.0)
Play video games 13 (43.3) 1 (3.3) 1 (3.3) - - 15 (50.0) Use of mobile phones 26 (86.7) 2 (6.7) 1 (3.3) 1 (3.3) - - Laboratory activities 14 (46.7) - - - - 16 (53.3) Intensive hand related activities
25 (83.3) 3 (10.0) 1 (3.3) - - 1 (3.3)
Lifting or carrying groceries, boxes, or books
16 (53.3) 1 (33.3) 2 (6.7) 2 (6.7) - -
Note. N/A = Not applicable; Total number of respondents (N = 30) are defined as the horizontal sum; *so difficult I cannot do it at all

74
3.3.1.10 Section 10: Attitude toward the laptop computer
Table 3-17 provides the respondents’ attitudes towards laptop computers. In general, respondents
had positive attitudes towards their laptop computers. For the three of five items which addressed
positive aspects of laptop computers (i.e., ‘make university easier,’ ‘make university enjoyable,’
and ‘help interact with others’), more than 40.0% of the respondents chose ‘strongly agree.’
Respondents chose neutral responses (46.7%) for other two positive items (i.e., ‘make notes
easier during class’ and ‘organize class notes easily’). Most respondents did not agree with
negative aspects towards their laptop computers, excepting ‘a laptop is a distraction in class’
item which was rated as neutral response.
Table 3-17. Frequency of the Attitude Toward the Laptop Computer (Item 10.1)
Attitudes Strongly agree
Agree
Neutral
Disagree
Strongly disagree
n (%) n (%) n (%) n (%) n (%) Positive attitude A laptop makes university easier
22 (73.3) 6 (20.0) 2 (6.7) - -
A laptop makes university more enjoyable
14 (46.7) 10 (33.3) 6 (20.0) - -
A laptop helps me interact with other students
13 (43.3) 9 (30.0) 5 (16.7) 2 (6.7) 1 (3.3)
It is easier for me to take notes during class with my laptop
2 (6.7) 2 (6.7) 14 (46.7) 9 (30.0) 3 (10.0)
I can organize my class notes easily with my laptop
3 (10.0) 7 (23.3) 14 (46.7) 4 (13.3) 2 (6.7)
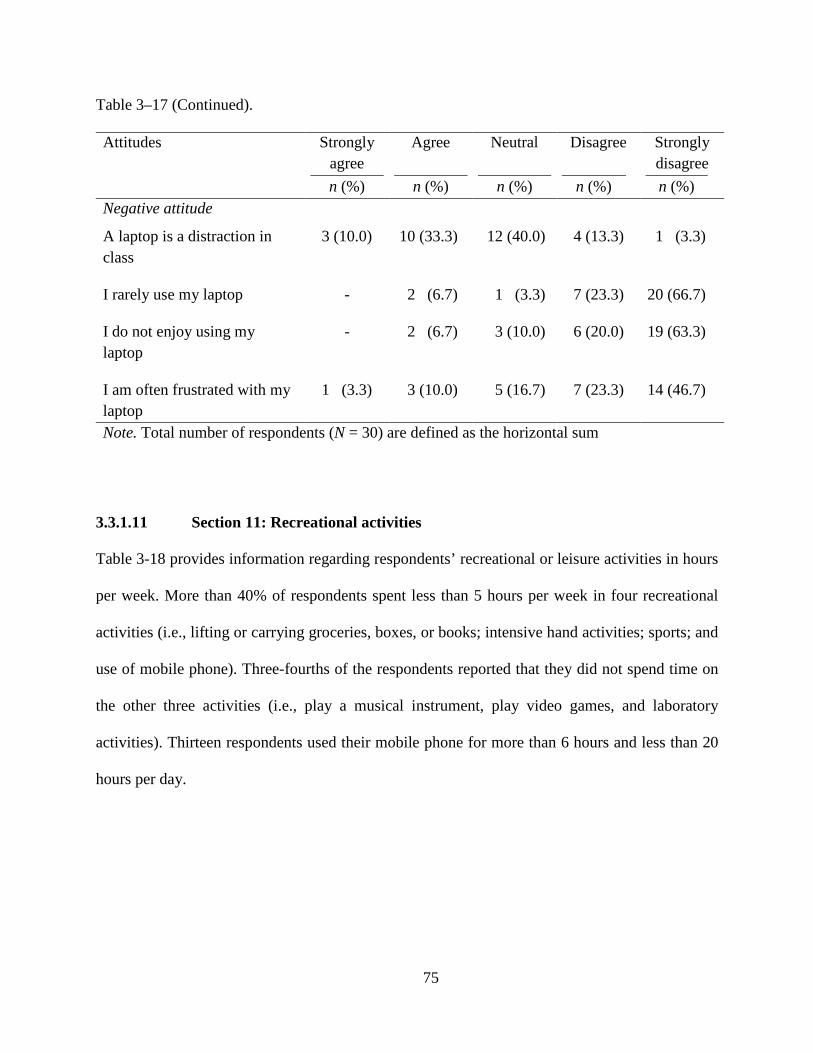
75
Table 3–17 (Continued).
Attitudes Strongly agree
Agree
Neutral
Disagree
Strongly disagree
n (%) n (%) n (%) n (%) n (%) Negative attitude
A laptop is a distraction in class
3 (10.0) 10 (33.3) 12 (40.0) 4 (13.3) 1 (3.3)
I rarely use my laptop - 2 (6.7) 1 (3.3) 7 (23.3) 20 (66.7)
I do not enjoy using my laptop
- 2 (6.7) 3 (10.0) 6 (20.0) 19 (63.3)
I am often frustrated with my laptop
1 (3.3) 3 (10.0) 5 (16.7) 7 (23.3) 14 (46.7)
Note. Total number of respondents (N = 30) are defined as the horizontal sum
3.3.1.11 Section 11: Recreational activities
Table 3-18 provides information regarding respondents’ recreational or leisure activities in hours
per week. More than 40% of respondents spent less than 5 hours per week in four recreational
activities (i.e., lifting or carrying groceries, boxes, or books; intensive hand activities; sports; and
use of mobile phone). Three-fourths of the respondents reported that they did not spend time on
the other three activities (i.e., play a musical instrument, play video games, and laboratory
activities). Thirteen respondents used their mobile phone for more than 6 hours and less than 20
hours per day.

76
Table 3-18. Frequency of the Recreational Activities (Item 11.1)
Recreational activities < 5 hours 6-10 hours 11-20 hours > 20 hours Never n (%) n (%) n (%) n (%) n (%)
Sports activities 14 (46.7) 6 (20.0) 3 (10.0) - 7 (23.3)
Play a musical instrument
3 (10.0) - - - 27 (90.0)
Play video games 4 (13.3) - - 1 (3.3) 25 (83.3)
Use a mobile phone 13 (43.3) 9 (30.0) 1 (3.3) 3 (10.0) 4 (13.3)
Laboratory activities 4 (13.3) 2 (6.7) - - 24 (80.0)
Intensive hand activities
16 (53.3) 4 (13.3) 6 (20.0) 1 (3.3) 3 (10.0)
Lifting or carrying groceries, boxes, or books
22 (73.3) 2 (6.7) - - 6 (20.0)
Note. Total number of respondents (N = 30) are defined as the horizontal sum
3.3.1.12 Section 12: Previous/current health status
With regard to previous/current health status, only 7 respondents reported that they were
diagnosed or treated by a physician due to musculoskeletal discomfort in their upper body. Most
frequently reported diagnosis was lower back pain (20%), followed by muscle spasm and
pinched nerve (6.7% for both diagnoses). In this sample, no one was a current smoker. Of 30
respondents, 46.7% had corrected vision with contact lenses (46.7%), followed by glasses and
surgery (13.3% for both of them). Most respondents described that their physical health
condition was good (60.0%), and at the same level as last year (56.7%). None of the respondents
reported that they currently had a poor health condition or that their health was much worse than
one year ago (see Table 3-19).

77
Table 3-19. Frequency of the Previous/Current History (Item 12.1 to 12.8)
Previous/current health status n (%)
History of medical diagnosis
Yes 7 (23.3)
Type of musculoskeletal disorders
Lower back pain 6 (20.0)
Muscle spasm or sprain 2 (6.7)
Pinched nerve 2 (6.7)
Ruptured or herniated disk in back 1 (3.3)
Tenosynovitis 1 (3.3)
Smoke cigarettes
No 30 (100.0)
Vision correction
Corrected with contact lenses 14 (46.7)
Uncorrected vision 8 (26.7)
Corrected with glasses 4 (13.3)
Corrected with surgery 4 (13.3)
Perceived overall physical health condition
Good 18 (60.0)
Excellent 8 (26.7)
Fair 4 (13.3)
Poor -
Comparison to the last year for the overall physical health
About the same as one year ago 17 (56.7)
Somewhat better now than one year ago 8 (26.7)
Somewhat worse now than one year ago 5 (16.7)
Much better now than one year ago -
Much worse now than one year ago -
Note. ‘n’ indicates the number of respondents who selected each response, as ‘yes’
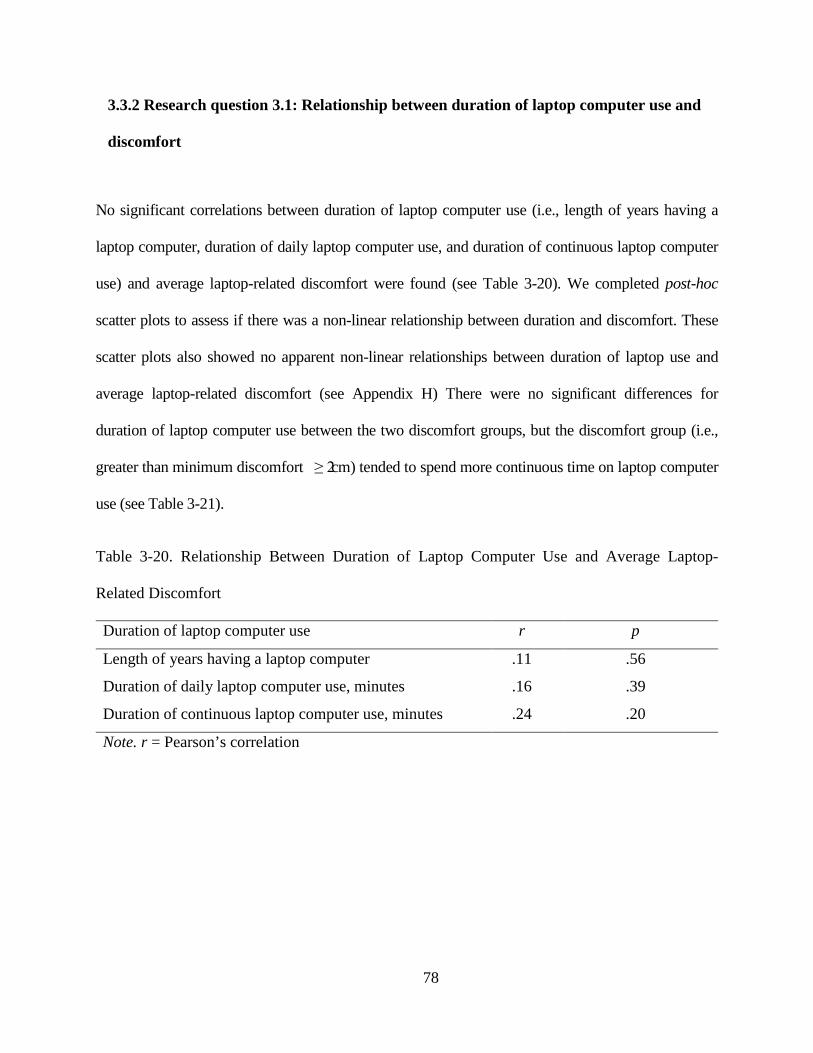
78
3.3.2 Research question 3.1: Relationship between duration of laptop computer use and
discomfort
No significant correlations between duration of laptop computer use (i.e., length of years having a
laptop computer, duration of daily laptop computer use, and duration of continuous laptop computer
use) and average laptop-related discomfort were found (see Table 3-20). We completed post-hoc
scatter plots to assess if there was a non-linear relationship between duration and discomfort. These
scatter plots also showed no apparent non-linear relationships between duration of laptop use and
average laptop-related discomfort (see Appendix H) There were no significant differences for
duration of laptop computer use between the two discomfort groups, but the discomfort group (i.e.,
greater than minimum discomfort ≥ 2 cm) tended to spend more continuous time on laptop computer
use (see Table 3-21).
Table 3-20. Relationship Between Duration of Laptop Computer Use and Average Laptop-
Related Discomfort
Duration of laptop computer use r p
Length of years having a laptop computer .11 .56
Duration of daily laptop computer use, minutes .16 .39
Duration of continuous laptop computer use, minutes .24 .20
Note. r = Pearson’s correlation

79
Table 3-21. Independent t-test of Duration of Laptop Computer Use Between Discomfort Groups
Duration Discomfort groups n Mean ± SD t df p
Length of years Min. ( < 2 cm) 18 4.3 ± 1.6 -.09 28 .93 Greater than Min.( ≥ 2 cm) 12 4.4 ± 3.6
Duration of daily laptop computer use, minutes
Min. ( < 2 cm) 18 232.8 ± 159.1 -.57 28 .57 Greater than Min. ( ≥ 2 cm) 12 267.5 ± 169.9
Duration of continuous laptop computer use, minutes
Min. ( < 2 cm) 18 79.7 ± 44.1 -1.46 28 .15 Greater than Min. ( ≥ 2 cm) 12 110.8 ± 72.6
Note. Min. = Minimum
3.3.3 Research question 3.2: Relationship between laptop workstation setups and discomfort
There was no significant relationship between time spent (%) in the various laptop workstation
setups (i.e., desktop sitting, lying prone, lying supine, floor sitting, chair sitting, and lap sitting)
and average laptop-related discomfort (see Table 3-22). In a similar fashion to Reseach
question 3.1 a scatter plot showed no apparent non-linear relationships between percentage of
time spent in a laptop workstation setup and average laptop-related discomfort (see Appendix I).
The results were not significantly different between the two groups (see Table 3-23).

80
Table 3-22. Relationship Between Percentage of Time Spent in a Laptop Workstation Setup
and Average Laptop-Related Discomfort
Laptop workstation setup r p
Desktop sitting .04 .82
Lying prone .02 .92
Lying supine .10 .62
Floor sitting .29 .13
Chair sitting -.14 .47
Lap sitting -.11 .57
Note. r = Pearson’s correlation
Table 3-23. Independent t-test of Percentage of Time Spent in a Laptop Workstation Setups
Between Two Discomfort Groups
Laptop workstation setups
Discomfort groups n Mean ± SD t df p
Desktop sitting, % Min. (< 2 cm) 18 52.8 ± 37.8 -1.31 28 .20 Greater than Min. (≥ 2 cm) 12 69.2 ± 25.8
Lying prone, % Min. (< 2 cm) 18 1.6 ± 4.8 0.39 28 .70 Greater than Min. (≥ 2 cm) 12 1.0 ± 2.9
Lying supine, % Min. (< 2 cm) 18 16.1 ± 19.9 0.73 28 .47 Greater than Min. (≥ 2 cm) 12 11.5 ± 11.3
Floor sitting, % Min. (< 2 cm) 18 2.2 ± 4.3 -1.05 28 .30 Greater than Min. (≥ 2 cm) 12 5.3 ± 11.5
Chair sitting, % Min. (< 2 cm) 18 14.7 ± 26.7 1.27 28 .21 Greater than Min. (≥ 2 cm) 12 4.7 ± 6.4
Lap sitting, % Min. (< 2 cm) 18 12.3 ± 24.4 0.46 28 .65 Greater than Min. (≥ 2 cm) 12 8.3 ± 20.4
Note. Min. = Minimum

81
3.4 DISCUSSION
Our first aim for this study was to develop a valid and reliable survey instrument (Laptop
Computer User Screening Survey [LCUSS]) to characterize laptop computer-use patterns and to
examine the relationships between laptop computer use and physical discomfort. The content
validation process supported the content and structure of the items in the LCUSS. Although
some wording and design problems were raised by the reviewers, these problems were modified,
and it was determined that the LCUSS had valid content and an adequate design format to
identify laptop computer use in college students and factors associated with discomfort.
The LCUSS demonstrated overall good test-retest reliability, suggesting that survey
results are consistent over two test administrations with a time interval of 14 days. Only two
items showed poor reliability: ‘discomfort related to rolling back or brief case’ and ‘type of
input device related to keyboard.’ For the ‘discomfort related to rolling back or brief case,’
there were only 3 respondents who reported discomfort, and all the levels were lower at the
second survey compared with levels at the first survey. These respondents may have
underestimated their discomfort levels on the second survey, because this carrying method was
rarely used. For the ‘input device related to the keyboard,’ 5 respondents who reported ‘no use
of keyboard’ at the first survey changed their responses to ‘use of keyboard.’ This change may
have been caused by a misunderstanding of the term ‘input device.’ During the first survey,
many respondents asked if keyboard was a type of input device, indicating confusion of this
term. In addition, while rating discomfort associated with carrying a laptop computer, some
respondents misunderstood the question. For example, although some respondents reported non-
use of their backpacks to transport their laptop computers, they rated discomfort associated with

82
their backpacks on the VAS. The LCUSS should be modified to address these unclear wording
problems.
The test-retest agreement for discomfort rated using the 10-cm VAS also had relatively
low reliability coefficients compared with other items. Respondents were asked to rate their
discomfort based on their symptoms at the time of the survey. Since physical discomfort can
easily fluctuate over time, it is likely that respondents had slightly different severity of
discomfort after 14 days. The LCUSS should be modified a term of ‘current symptom’ to
‘average symptom over some period.’
The second aim of our study was to identify the characteristics of laptop computer use in college
students. The results indicate that respondents tended to use their laptop computers in a variety of
locations without appropriate environmental equipment (e.g., desks, chairs, or external devices),
The most popular location was home, followed by library, café or restaurant,. The type of laptop
workstation setups used by this sample was also varied, and the most common workstation setup
was desktop sitting, followed by lying supine, chair sitting, lap sitting, and floor sitting, and lying
prone. This variability of location for laptop computer use may place laptop computer operators
at more risk than desktop computer operators who usually work in traditional computer
workstation setups with a desk and a chair, because laptop computer operators may assume
awkward body postures in various environments without appropriate supports (Harris & Straker,
2000; Moffet et al., 2002; Raps & Nanthavanij, 2008). In addition, most respondents reported
that they selected their location of laptop computer use based on laptop-related technical
supports (e.g., accessibility of wireless internet or presence of electrical outlet), rather than
environmental adequacy (e.g., presence of desk, table, or chair). This suggests that public place

83
with wireless internet set-up should be well furnished with desk, chair, and electrical outlet to
facilitate optimal workstation setup.
A lack of understanding of environmental adequacy may lead laptop computer operators
to assume a greater variety of awkward postures when using their laptop computers. If laptop
computer operators maintain these awkward postures for long periods of time, they may be at
greater risk for getting MSD/MSS than those who work in traditional computer workstation
setups with appropriate environmental supports (Harris & Straker, 2000; Moffet et al., 2002;
Raps & Nanthavanij, 2008; Sommerich et al., 2007). Several research studies have reported that
non-traditional laptop workstation setups which allow laptop computer operators to assume
awkward postures may cause physical discomfort (Harris & Straker, 2000; Raps & Nanthavanij,
2008; Sommerich et al., 2007). In our study, most respondents experienced the least discomfort
in the traditional laptop workstation setup (i.e., desktop sitting) compared to the other laptop
workstation setups.
Our respondents reported that they used their laptop computers for approximately 1 ½
hours without any rest breaks, and spent an average of 4 hr/day on their laptop computers.
Prolonged computer use without appropriate rest breaks has been recognized as a predominant
risk factor for MSD/MSS (Carter & Banister, 1994; Schlossberg et al., 2004). Desktop computer
work of greater than 4-5 hr/day are considered to place computer operators at risk (Chang et al.,
2007; Schlossberg et al., 2004), and research studies recommend that computer operators should
take frequent and short breaks of 5 minutes every half hour to prevent the onset of discomfort
(Fisher et al., 1993; Henning et al., 1997). Our respondents reported that they spent more time
with their laptop computers (78.6% per week), than desktop computers (21.4% per week),
suggesting that respondents may be at greater risk for developing MSD/MSS.

84
Although the most frequently performed task with laptop computer was to check e-mail,
more respondents performed word processing tasks related to their academic assignments than
any other task. These keyboard intensive tasks (i.e., word-processing task) may require more
dynamic and repetitive movements of the upper extremities, compared with the mouse clicking
tasks (i.e., checking e-mail or news, web surfing, or paying bills). Dennerlein and Johnson
(2006) demonstrated that keyboard intensive tasks were associated with more postural variability
and muscle activity in the upper extremities. Therefore, our sample may have greater chances of
awkward postures in their keyboard intensive tasks, particularly if it continues for long periods
of time. All these findings suggest that laptop computer use is positively associated with
potential risk factors for MSS, and future studies should be done to confirm laptop-related risk
factors and to establish best laptop workstation setup to minimize these risk factors.
The most common areas for discomfort reported by the respondents while using their
laptop computers were the neck and upper back. Since previous research studies have reported a
high prevalence of neck and shoulder discomfort in laptop computer operators (Harris & Straker,
2000; Sommerich et al., 2007; Straker et al., 1997), we had assumed that respondents would
experience greater discomfort in their necks and shoulders. However, our respondents
experienced relatively less discomfort in their shoulders than their necks. This difference may be
caused by confusion as to the precise body area designated as ‘shoulder.’ Neck, shoulder, and
upper back are connected together by the trapezius muscle that extends vertically form occipital
bone to thoracic vertebrae and laterally from spine to acromion process (Oatis, 2009). If
respondents felt discomfort between the lowermost portion of neck and shoulder blade (i.e.,
upper portion of the trapezius), they may have identified this as the upper back discomfort rather
than the shoulder discomfort.
85
Respondents experienced the most severe discomfort when carrying a laptop computer in
a shoulder bag (66.6%) and the least when using a backpack (76.7%). The use of a two strap
backpack may spread the loading weight more evenly, compared with a shoulder bag with one
strap. These results highlight the importance of choice of laptop carrying methods. Most
respondents (83.3%) also reported that they carried an AC adapter with their laptop computers.
This additional weight may increase physical discomfort while carrying a laptop computer,
because the weight of some AC adaptors is more than 2 pounds. If respondents added other
supplementary devices (e.g., external battery or extension cord) in their carrying bag, this could
also increase the risks for discomfort. Although other research studies (Harris & Straker, 2000;
Sommerich et al., 2007) have reported similar results, that shoulder discomfort is frequently cited
by laptop computer operators while carrying their laptop computers, these studies did not
measure the severity of discomfort associated with the type of carrying methods. Overall, the
method of carrying a laptop computer appears to be a potential risk factor for neck and upper
back discomfort. Future studies are needed to confirm the best method of carrying a laptop
computer, and finding a balance between portability (i.e., small and light laptop devices).
Reducing awkward postures related to the small monitor and keyboard size may also be an
important consideration for reducing MSS in laptop computer operators.
Although respondents generally reported ‘no difficulty’ with most aspects of their role
function, they experienced some difficulties in performing certain academic and leisure activities,
such as typing 10 pages on their laptop computers, carrying books around campus, and sports
activities. These results are similar to those reported by Hupert et al. (2004) and Jenkins et al.
(2007) who reported that more than 40% of college students who had computer-related
discomfort experienced functional limitations in their academic activities, and more than 15% of

86
students reported using medical services (e.g., medical treatment or medication) to relieve their
discomfort. Although there were no research studies that examined the effects of laptop-related
discomfort on functional limitations in other activities (e.g., activities of daily living), discomfort
associated with laptop computer use may affect students’ current role function or future career
function. Future research studies are required to assess the relationships between laptop-related
discomfort and functional limitations in various activities.
The third aim of our study was to examine the relationship between laptop-related risk
factors (i.e., duration of laptop computer use and percentage of time spent using each type of
laptop workstation setup) and physical discomfort. Although duration of computer use has been
recognized as a potential risk factor for musculoskeletal discomfort (Blatter & Bongers, 2002;
Fredriksson et al., 2002; Jensen, Finsen, Sogaard, & Christensen, 2002; Tittiranonda, Burastero,
& Rempel, 1999), this study did not find a significant relationship between duration of laptop
computer use (i.e., length of years having a laptop computer, duration of daily laptop computer
use, and duration of continuous laptop computer use) and average laptop-related discomfort.
Considering that laptop computer workstation setups have a greater potential to cause more
awkward postures than desktop computer workstation setups (Saito et al., 1997; Straker et al.,
1997; Szeto & Lee, 2002; Villanueva et al., 1998), we assumed that there would be significant
relationships between duration of laptop computer use and physical discomfort. The reason
underlying this discrepancy may be related to the insufficient sample size and lack of control for
additional individual risk factors. In most surveys that examined the associations between
computer work duration and musculoskeletal discomfort, the sample sizes were quite large, at
least 304 subjects and as many as 25,000 subjects (Juul-Kristensen et al., 2004; Katz et al., 2000;
Nakazawa et al., 2002; Rossignol, Morse, Summers, & Pagnotto, 1987; Schlossberg et al., 2004).

87
Another plausible explanation for this discrepancy is that duration of laptop computer use was
self-reported, and thus not objectively confirmed. Self-reported duration is based on subjective
judgments, so respondents may over- or under- estimate their exact time period (Spielholz et al.,
2001). In order to minimize this limitation, future studies are needed to measure the duration of
laptop computer use by installing computer software that automatically calculates a total amount
of time in use.
Percentage of time spent using each type of laptop workstation setup (i.e., desktop sitting,
lying prone, lying supine, floor sitting, chair sitting, and lap sitting) also was not significantly
related to average laptop-related discomfort. Asundi et al. (2010) examined the effect of three
laptop workstation setups (i.e., desktop sitting, lap sitting, and lap sitting with a commercially
available lap desk) on the level of discomfort with a 10-cm VAS. The results indicated that
laptop computer operators reported that the desktop sitting workstation setup caused the least
discomfort, with no difference between the lap and lap-desk sitting workstation setups. Based on
this finding, we assumed that there would be a difference between type of laptop workstation
setups and discomfort during laptop computer use. As described previously, this discrepancy
may be caused by small sample size and lack of control for the additional individual risk factors.
Another plausible explanation is that respondents rated their discomfort by recall, rather than as
they actually used a laptop computer in the workstation setup.. Since respondents recalled
discomfort severity in each of the six laptop workstation setups, their discomfort may be over- or
under- estimated.

88
Limitations
This study had several limitations. The sample size was relatively small and limited primarily to
women. Small sample sizes limit the generalizability of survey results and do not allow subgroup
analyses among laptop-related risk factors, individual risk factors, and musculoskeletal
discomfort. Other surveys that examined computer use and MSS in college students had a
sample size of over 111 students (Hamilton et al., 2005; Hupert et al., 2004; Jenkins et al., 2007;
Katz et al., 2000; Menendez et al., 2009; Schlossberg et al., 2004). Future survey studies should
be done with large number of college students to obtain sufficient statistical power.
In addition, the respondents in our study were primarily women (83.3%). Several studies
have reported that women have significantly higher prevalence of MSD/MSS, compared with
men (Bernard et al., 1994; Brandt et al., 2004; Gerr et al., 2002; Katz et al., 2000). Future studies
should keep a balance of the gender ratio, and examine gender difference as a potential risk
factor of MSD/MSS.
3.5 CONCLUSIONS
We initially developed a valid and reliable instrument (Laptop Computer User Screening Survey
[LCUSS]), used the instrument to describe the characteristics of laptop computer use in college
students, and examined the relationships between laptop-related risk factors and physical
discomfort. Overall, this study identified the following characteristics of college laptop computer
operators:
89
1) The most common laptop workstation setups used by respondents were desktop sitting,
followed by lying supine and chair sitting.
2) The most common locations of laptop computer use were home, followed by library, café
and restaurant, and campus classroom.
3) The primary reasons for the location selection were accessibility of wireless internet and
presence of electrical outlet.
4) Respondents spent an average of 4 hours per day on their laptop computers and
approximately 1 ½ hours without any rest breaks.
5) More respondents spent more time with their laptop computers (78.6% per week) than
desktop computers (21.4% per week).
6) Respondents reported that most frequently performed task activities were to check e-mail,
followed by word processing, and CourseWeb or online courses.
7) Neck and upper back discomfort were the most frequent areas of discomfort reported by
respondents while using their laptop computers.
8) Most respondents carried their laptop computers in a backpack or shoulder bag. The
shoulder bag was reported to cause the greatest severity of discomfort.
9) More than 30% of respondents reported some degree of functional limitations in their
academic and leisure activities (i.e., type 10 pages on the laptop, carry books around
campus, and sports activities).
10) Respondents were more likely to report positive attitudes towards their laptop computers.
Although statistical relationships were not found between physical discomfort and laptop-
related factors (duration of laptop computer use and type of laptop workstation setups), more
respondents reported: greater discomfort associated with a long daily duration of laptop

90
computer use; greater discomfort in the neck and upper back regions while working with laptop
computers; greater discomfort in floor sitting and lying prone; and less discomfort in desktop
sitting.
In summary, although we developed the LCUSS to identify factors associated with
physical discomfort during laptop computer use, the results of the survey provide some general
insights for designing laptop computer environments and developing recommendations to
promote overall healthy laptop computer habits. First, since most students selected various
locations and workstation setups based on presence of the technical supports rather than the
environmental supports, school-based public places with a wireless internet service should be
well furnished with desks, chairs, and electrical outlets for optimal workstation setup. Second,
students should be encouraged to take frequent and short rest breaks of 5 minutes every half hour
to avoid prolonged static postures. One way to promote breaks would be to install computer
alarm software to notify students to take breaks while using a laptop computer. Third, students
should use their laptop computers in a desktop sitting workstation setup with desks, chairs, or
external devices (i.e., separate monitor, keyboard, or mouse). Fourth, since most students
frequently reported neck and back discomfort while using a laptop computer, they should avoid
excessive neck and back flexion, and arrange themselves in a relaxed and neutral posture. Lastly,
carrying a laptop computer is an additional forceful exertion and strongly associated with
shoulder discomfort. Thus students should consider the weight of the entire laptop bag and carry
their laptop computers using a backpack with wide straps and sufficient padding, instead of a
single strap shoulder bag. If students have to carry a laptop computer in a shoulder bag, they
should shift between shoulders to balance the load of the laptop bag on shoulder muscles.

91
4.0 THE EFFECTS OF SIX SIMULATED LAPTOP WORKSTATION SETUPS ON
BODY POSTURES, DISCOMFORT, AND TASK PRODUCTIVITY:
AN EXPERIMENTAL STUDY
4.1 BACKGROUND AND SIGNIFICANCE
Laptop computers are widely used in many environments (e.g., classroom, bedroom, or airport),
because of their compact portability and high technological performance (Moffet et al., 2002;
Sommerich et al., 2007). While the size of laptop computers is getting smaller, the technological
characteristics of laptop computers (e.g., hard drive space, memory, and power supply) have
been improving and are currently at a similar level to standard desktop computers, with a lower
cost than in the past. Additionally, the popularization of the Wi-Fi wireless network has fueled
the burgeoning use of laptop computers by users who want to promptly collect information (e.g.,
news, weather, or sports), to check e-mail, and to use the internet anywhere or at anytime. These
advantages of laptop computers (e.g., compact portability, powerful performance, and relative
low price) may encourage computer operators to replace desktop computers with laptop
computers. According to the International Data Corporation (2008), laptop computer sales
overtook desktop computer sales for the first time in the history of the United States market, and
they anticipate that portable computers (i.e., laptop computers) will account for more than 60%
of all computer markets in 2010 (International Data Corporation, 2010). This trend of increased

92
laptop computer use compared to desktop computer use has also been found among college
students (Shin, 2010), who spent more time with their laptop computers (78.6% per week), than
with desktop computers (21.4% per week).
Laptop computer use may involve more risk factors for musculoskeletal disorders (MSD)
and symptoms (MSS) than use of desktop computers. Several research studies have identified
and reported potential risk factors associated with MSD/MSS among desktop computer
operators, such as prolonged computer use, repetitive movement of the wrist and hand, sustained
and awkward body posture, and forceful and excessive keyboarding (Armstrong et al., 1994;
Bergqvist et al., 1995b; Ferguson & Duncan, 1974; Gerr et al., 2002). However, laptop computer
operators may be at more risk than desktop computer operators due to the inherent design of the
laptop computer and a lack of environmental supports (e.g., desk, chair, or external devices).
Generally, the design of laptop computers promotes awkward or constrained body postures
during typing because of small monitors, flat keyboards, and the lack of a separate keyboard and
monitor position adjustment. Use of the integrated monitor and keyboard causes uncomfortably
crouched body postures, because laptop computer operators have to view a low and small
monitor and use a flat keyboard and awkwardly placed track pad (Saito et al., 2000). Research
studies which compared upper body postures between laptop and desktop computers, indicated
that laptop computer operators assumed more trunk flexion, neck flexion, head-down tilt, inward
rotation of shoulder, and ulnar deviation of the wrist than desktop computer operators (Saito et
al., 1997; Straker et al., 1997; Szeto & Lee, 2002; Villanueva et al., 1998). However, most
studies described body postures carried out at desktop sitting workstation setup, with or without
an adjustable height desk or chair. They did not consider other laptop workstation setups used by
laptop computer operators. To date, only two research studies have examined the effect of

93
different laptop workstation setups on body postures. Moffet et al. (2002) measured upper body
angles for two laptop workstation setups (i.e., desktop and lap sitting), and then compared the
angle differences between the two laptop workstation setups and two laptop designs (i.e., with
and without palm rest) to identify which environmental factors (i.e., laptop workstation setups vs.
laptop designs) had a greater effect on body postures. The results showed that the subjects in lap
sitting workstation setup had more head flexion, backward trunk inclination, and wrist extension,
compared with those in desktop sitting workstation setup. Interestingly, the type of laptop
workstation setups had a greater influence on body postures than the type of laptop designs. This
finding was supported by Asundi et al. (2010) who reported that in lap sitting setup laptop
computer operators showed more awkward body postures and discomfort rather than those in
desktop sitting setup. The survey by Shin (2010) found that laptop computer operators work in a
variety of laptop workstation setups (i.e., desktop sitting, lying prone, lying supine, floor sitting,
chair sitting, and sitting with laptop on the lap), it is therefore important to determine the postural
effects of these laptop workstation setups.
College students are in the preparatory stage for professional work, often in computer-
related careers. The awkward computer postures that students have acquired during this period
may influence their further work efficiency and health condition. According to survey of 400
American college students (Research and Markets, 2009), young students were more likely to
own a laptop computer, compared to students over 30 years old. Interestingly, younger students
reported significantly more arm/shoulder discomfort than older students, possibly because
younger students were more likely to use only a laptop computer in a variety of laptop
workstation setups (e.g., lying on the bed or slumping in a couch), while older students worked
in traditional desktop sitting setup. Despite the increase of laptop computer use and discomfort in

94
college students, only few lab-based research studies have been conducted on laptop-related risk
factors in college students.
4.2 RESEARCH DESIGN AND METHODS
4.2.1 Research aims
The overall aim of this experimental study was to examine the effects of the six simulated laptop
workstation setups on upper body postures, discomfort, and task productivity of college students.
Although all six simulated laptop workstation setups (i.e., desktop sitting, lying prone, lying
supine, floor sitting, chair sitting, and lap sitting) were recorded during data collection, we only
report data related to the three most common laptop workstation setups (i.e., desktop sitting,
lying supine, and chair sitting) that were identified by Shin (2010).
• Research aim 1: Examine the effects of the three most common laptop workstation setups
on upper body postures
• Research question 1.1: Is there a difference in upper body angles between the
three simulated laptop workstation setups?
• Research question 1.2: Is there a difference in typing style between the three
simulated laptop workstation setups?

95
• Research aim 2: Examine the effects of the three most common laptop workstation setups
on physical discomfort
• Research question 2.1: Is there a difference in physical discomfort between the
three simulated laptop workstation setups?
• Research aim 3: Examine the effects of the three most common laptop workstation setups
on task productivity
• Research question 3.1: Is there a difference in task productivity between the three
simulated laptop workstation setups?
4.2.2 Research design
This research study used an experimental randomized repeated cross-over design to measure
upper body postures, discomfort, and task productivity in the six simulated laptop
workstation setups (see Figure 4-1).
Figure 4-1. Six simulated laptop workstation setups

96
4.2.3 Participants
Thirty college students were recruited from the University of Pittsburgh. Subjects had to meet
the following inclusion criteria: (1) undergraduate or graduate students from the University of
Pittsburgh; (2) use of a laptop computer at present; (3) no co-morbidities of the upper extremity,
such as neurological disorders or fractures; (4) the ability to tolerate the laboratory tasks for three
hours. Exclusion criteria were: (1) presence of current musculoskeletal injuries in the back, neck,
shoulder, and upper limbs.
Advertising flyers (see Appendix F) containing the purpose, procedure, benefits, and
eligibility were circulated and posted throughout the college campus one month prior to the
study. In addition to the recruitment using the flyers, Master of Occupational Therapy (MOT)
students were invited to participate in the research study with research invitation blurb (see
Appendix G). Written consent was obtained prior to participation in the study.
4.2.4 Instrumentation
4.2.4.1 Laptop computer user screening survey (LCUSS)
The self-administered LCUSS (see Appendix E) was used to identify demographic
characteristics of the sample and select the most common laptop workstation setup to use during
analysis. Development procedures (i.e., validation process of item content and test-retest
reliability) and item rationales of the LCUSS are detailed in Chapter 3. The LCUSS is divided
into the following 12 sections with total 75 questions: (1) demographic information (14 items);
(2) location of laptop computer use (2 items); (3) laptop transportation methods (3 items); (4)
laptop related tasks (1 item); (5) laptop specifications (5 items); (6) usage time (5 items); (7)

97
laptop workstation setups (3 items); (8) overall laptop related discomfort (2 items); (9)
student health related role functioning (16 items); (10) attitude toward the laptop computer (9
items); (11) recreational activities (7 items); and (12) previous/current health status (8 items).
4.2.4.2 Upper body angles
ImageJ software, an open-access Java-based image processing and analysis software program
developed at the United States National Institutes of Health (NIH), was used to digitize the
snapshots and calculate the angles (Ferreira & Rasband, 2010). From the video clips of this study,
each angle is estimated by selecting three anatomical landmarks with the angle tool (
ImageJ software program
) in the
ImageJ software (see Figure 4-2). The angle is automatically displayed in the result window by
clicking the “analyze button.”
Figure 4-2. Measurement of the angles using the ImageJ software program
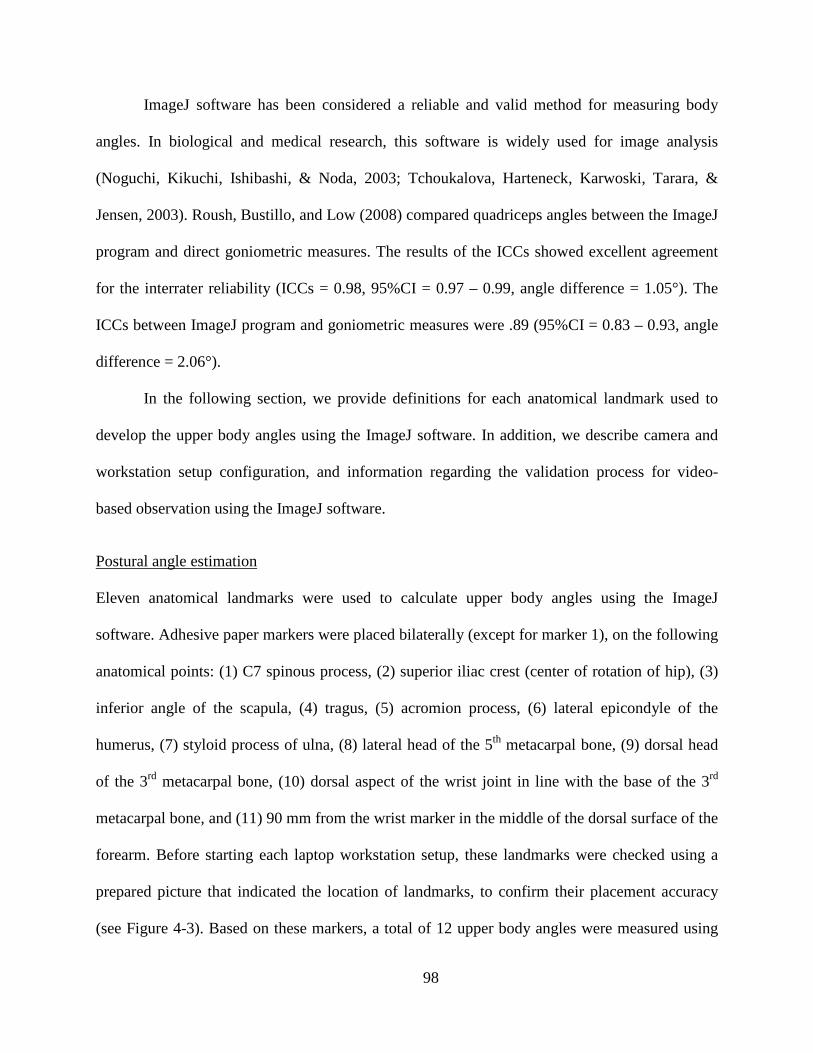
98
ImageJ software has been considered a reliable and valid method for measuring body
angles. In biological and medical research, this software is widely used for image analysis
(Noguchi, Kikuchi, Ishibashi, & Noda, 2003; Tchoukalova, Harteneck, Karwoski, Tarara, &
Jensen, 2003). Roush, Bustillo, and Low (2008) compared quadriceps angles between the ImageJ
program and direct goniometric measures. The results of the ICCs showed excellent agreement
for the interrater reliability (ICCs = 0.98, 95%CI = 0.97 – 0.99, angle difference = 1.05°). The
ICCs between ImageJ program and goniometric measures were .89 (95%CI = 0.83 – 0.93, angle
difference = 2.06°).
In the following section, we provide definitions for each anatomical landmark used to
develop the upper body angles using the ImageJ software. In addition, we describe camera and
workstation setup configuration, and information regarding the validation process for video-
based observation using the ImageJ software.
Eleven anatomical landmarks were used to calculate upper body angles using the ImageJ
software. Adhesive paper markers were placed bilaterally (except for marker 1), on the following
anatomical points: (1) C7 spinous process, (2) superior iliac crest (center of rotation of hip), (3)
inferior angle of the scapula, (4) tragus, (5) acromion process, (6) lateral epicondyle of the
humerus, (7) styloid process of ulna, (8) lateral head of the 5
Postural angle estimation
th metacarpal bone, (9) dorsal head
of the 3rd metacarpal bone, (10) dorsal aspect of the wrist joint in line with the base of the 3rd
metacarpal bone, and (11) 90 mm from the wrist marker in the middle of the dorsal surface of the
forearm. Before starting each laptop workstation setup, these landmarks were checked using a
prepared picture that indicated the location of landmarks, to confirm their placement accuracy
(see Figure 4-3). Based on these markers, a total of 12 upper body angles were measured using

99
the ImageJ software (see Table 4-1). To facilitate marker identity, subjects wore a short T-shirt
that did not restrict arm movements or obscure the anatomical markers. The color of the T-shirts
was complementary to the marker’s color.
Figure 4-3. Maker position in the lateral view and hand
Table 4-1. Upper Body Angles Adopted in Observational Study
Body angle Definition Measurement of angle Neck angle Angle formed by the vertical line and the line
from the C7 spinous process to tragus (Ankrum & Nemeth, 2000)
Shoulder angle
a Angle formed by the line from the acromion process to the lateral epicondyle line relative to the trunk line (Villanueva et al., 1998)
Elbow angle
a Angle formed by the acromion process, lateral epicondyle of the humerus, and styloid process of the ulna (Villanueva et al., 1998)

100
Table 4–1 (Continued).
Body angle Definition Measurement of angle Wrist angle
a Angle formed by the lateral head of 5th metacarpal bone, styloid process of the ulna, and lateral epicondyle of the humerus (Straker et al., 1997)
Ulnar/radial deviation Angle formed by the dorsal head of 3a rd metacarpal bone, dorsal aspect of the wrist joint in line with the base of 3rd
metacarpal bone, and 90 mm from the wrist marker in the middle of the dorsal surface of the forearm (Burgess-Limerick, Shemmell, Scadden, & Plooy, 1999)
Thoracic bend angle Angle formed by the C7, inferior angle of the scapula, and superior iliac crest (Sommerich et al., 2002)
Trunk angle Angle formed by the horizontal line and the line between the C7 spinous process to superior iliac crest (Sommerich et al., 2002; Villanueva et al., 1998)
View angle Angle formed by the horizontal line and the line between the eye and the middle of the monitor (Berkhout et al., 2004; Jonai et al., 2002; Villanueva et al., 1998)
Note. aincludes the right and left angles

101
In addition to body angles, the following workstation setup parameters were manually
measured for each laptop workstation setup:
1) LCD monitor tilt angle (Degrees)
2) Laptop depth: Distance between the edge of a desk and the edge of the computer (cm)
3) Chair height (cm)
Three cameras (right camera: JVC GR-D72U; left camera: Sony DCR-TRV50; and overhead
camera: Sony Handycam HDR-HC7) were mounted on tripods and used to record subjects’
typing postures. The two cameras on the right and left sides were used to obtain lateral views
during laptop computer operation. The overhead camera was used to capture ulnar and radial
deviation of the wrist. The height of the cameras was adjusted to the level of the C7 spinous
process of each subject for the right and left cameras (lateral view) (Berkhout et al., 2004) and to
the midpoint of a line joining the radial and ulna heads for the wrist and hand camera (overhead).
All cameras were adjusted with the power zoom so that all markers were detectable in the LCD
panel.
Camera and workstation setup configuration
In order to conduct the six simulated laptop workstation setups, the laboratory room was
configured in three stations: the desk, chair, and mat stations (see Figure 4-4). A standardized
desktop station was used for ‘desktop sitting.’ An un-adjustable desk and adjustable chair were
used. The desk height was fixed at 72 cm. This station was set up to be similar to a typical
classroom situation where the desk is usually not adjustable, while the chair height is adjustable.
In desktop sitting, all subjects adjusted the height of chairs to place their feet on the floor and
laptop computers to their preferred settings (i.e., LCD monitor tilt angle and laptop depth). The
main difference between the simulated desktop and chair sitting workstation setups were the

102
placement of laptop computers and the presence or absence of the desk. In chair sitting, all
subjects placed the laptop computers on their laps.
A mat was used for the other simulated laptop workstation setups; floor sitting, lap sitting,
lying supine, and lying prone. The floor and lap sitting were similar, except for placement of the
laptop computers: in the former subjects placed their laptop computers on the floors, while for
the latter subjects placed them on their laps. In lying supine, subjects leaned their trunks onto
cushions and placed the laptop computers on their laps. The laptop computers were placed on the
floor in lying prone, with subjects propped on their elbows. An overview of the laptop workstation
setups and the placement of laptop computers is shown in Figure 4-4.
Desktop sitting Chair sitting Floor sitting
Lap sitting Lying supine Lying prone
Figure 4-4. Photograph of the laptop workstation setup configuration

103
A well-defined and accurate method for assessing exposure to the risk factors that may be
associated with musculoskeletal problems has been considered an important issue in the field of
the ergonomics (David, 2005; Spielholz et al., 2001). Although video-based observation methods
have been frequently used to obtain the postural risk factors in several studies related to
musculoskeletal problems (McAtamney & Nigel Corlett, 1993; Occhipinti, 1998; Paquet,
Punnett, & Buchholz, 2001), researchers must have confidence of the validity of their methods
by determining the amount of errors between observational and direct estimates. Therefore we
compared measurement errors when measuring the postural angles using an ImageJ and a
handheld goniometer on one subject as a validation process.
Validation process of the ImageJ measurement
One subject was asked to pose with a laptop computer in each of the six simulated laptop
workstation setups. We then captured three body snapshots (i.e., right, left, and overhead) to
obtain the 11 upper body angles and 1 workstation setup parameter (i.e., LCD monitor tilt angle)
for each laptop workstation setup. The test procedure (i.e., postural angle estimation and camera
and workstation setup configuration) was conducted under the same conditions as the main
experimental study. Simultaneous with the snapshot capture, these 12 angles (i.e., 11 body angles
and 1 LCD monitor tilt angle) were directly measured with a goniometer and recorded by the PI.
The body images derived from video capture were then calculated for each angle by the ImageJ
program, and compared to the direct goniometer measurement.
The results of angles measured by two measurement methods (i.e., ImageJ vs.
goniometer) were similar (see Appendix J). The average absolute differences across 12 angles
were 0.67 ± 0.48 degrees for the desktop sitting, 1.36 ± 0.77 degrees for the chair sitting, 0.84 ±

104
0.70 degrees for the floor sitting, 1.33 ± 0.75 degrees for the lap sitting, 1.36 ± 1.48 degrees for
the lying supine, and 0.91 ± 0.53 degrees for the lying prone (see Table 4-2).
In a study by Shea et al. (1998), that compared computer-assisted measurement with
manual measurement, the measurement error was 2.6 degrees (range = 2.3 – 3.3 degrees) for
computer-assisted measurement and 3.3 degrees (range 2.5 – 4.5 degrees) for manual
measurement. They concluded that computer-assisted measurement was accurate, consistent, and
valid, and in some ways might be more powerful than manual measurement due to decreased
errors resulting from inappropriate manipulation or variability of the goniometer. In our study,
the variability of angle differences was less than 2 degrees between the ImageJ and handheld
goniomter measurements. Therefore, we considered that this variability was reasonable angle
differences and that we could be confident in the validity of the video-based observation method.
Table 4-2. Absolute Differences in Angular Measurements Between ImageJ and Goniometer
Absolute differences (degree)
Mean ± SD Minimum Maximum
Desktop sitting 0.67 ± 0.48 0.13 1.77
Chair sitting 1.36 ± 0.77 0.24 2.52
Floor sitting 0.84 ± 0.70 0.04 1.96
Lap sitting 1.33 ± 0.75 0.06 2.46
Lying supine 1.36 ± 1.48 0.36 5.75
Lying prone 0.91 ± 0.53 0.11 1.69

105
4.2.4.3 Discomfort rating chart
All subjects completed a discomfort rating chart to determine the intensity of discomfort of neck,
shoulder, arm, hand, wrist, and trunk, after completing each of the six simulated laptop
workstation setup. The chart consisted of Corlett and Bishop’s body chart (Corlett & Bishop,
1976) and a horizontal 10-cm visual analogue scale (VAS) (Bijur et al., 2001; Downie et al.,
1978; Gallagher et al., 2002; Kumar et al., 1999; McCormack et al., 1988) (see Appendix K).
After identifying each body area in which subjects experienced discomfort while working on a
laptop computer, subjects determined the levels of discomfort severity using the VAS, which
ranged from 0 cm (i.e., no discomfort) to 10 cm (i.e., unbearable discomfort). Subjects were
asked to place an ‘X’ mark on the line at the point most closely describing their discomfort for
each body region while using the laptop computer in each of the six simulated laptop workstation
setups.
4.2.4.4 Keyboard personal computer style (K-PeCS)
The K-PeCS, observational checklist, was used to assess personal typing style while using a
laptop computer (Baker & Redfern, 2005). This instrument consists of 19 items that are
divided into three sections: (1) static posture, which includes items that are related to relatively
unchanging body postures during typing (e.g., torso angle, head flexion angle, shoulder flexion
angle, and elbow flexion angle); (2) dynamic posture (i.e., frequency), which consists of items
that are related to flexible joint movements by the typists on the wrists, hands, and fingers (e.g.,
wrist/hand movement, wrist ulnar angle > 20°, wrist extension angle > 15°, changes in
pronation, isolated 5th digit, isolated thumb, space bar activation, number of digits used to type,
MCP extension, DIP/PIP curve, and hypermobility); and (3) tension and force, which includes

106
items that describe key strike forces and the use of supports (e.g., back rest use, forearm
support use, wrist support use, and force). In most items, both the right and left hands are
assessed separately. The K-PeCS is rated either live or from a video that captures the
keyboarding postures in sagittal (left and right body postures) and transverse (wrist and hand
postures) planes. The duration of video data must be at least 1 minute. The K-PeCS items are
rated on an ordinal scale.
Overall, the K-PeCS has demonstrated excellent inter-rater reliability (ICCs = 0.90, p
< .001), and intra-rater reliability (ICCs = 0.92, p < .001) (Baker, Cook, & Redfern, 2009). Most
individual items’ reliability showed excellent results, except six items which fell below an ICCs
of 0.75 that indicated moderate reliability: torso angle (ICCs = 0.71, p < .001), force (ICCs =
0.67, p < .001), isolated thumb (ICCs = 0.63, p < .001), and hypermobility (ICCs = 0.33, p
< .001) for the inter-rater reliability and force (ICCs = 0.67, p = .04), isolated thumb (ICCs =
0.62, p < .001), ulnar deviation angle (ICCs = 0.71, p < .001), and PIP/DIP curve (ICCs = 0.73, p
< .001) for the intra-rater reliability. The concurrent and content validity of the K-PeCS were
also well established (Baker et al., 2009; Baker & Redfern, 2005), as well as the ability to
identify the potentially problematic postures of keyboard users (Baker & Redfern, 2009).
To improve the reliability of the K-PeCS measurement in this study, we assessed the
reproducibility of the K-PeCS items within raters (i.e., intra-rater reliability). ICCs were used to
calculate the reliability of each item, and considered an excellent reliability greater than or equal
to 0.80 and a good reliability greater than 0.5 and less than 0.8 (Hulley, 2007). In general, all
ICCs were good to excellent (range = 0.57 – 0.94, p < .05), except for three items: wrist ulnar
angle > 20˚ (ICCs = 0.38); wrist extension angle > 15̊ (ICCs = 0.34); and isolated thumb (ICCs

107
= 0.47). In the static posture section, excellent ICCs were demonstrated for all items, while the
tension and force section ranged from good to excellent.
4.2.4.5 Task productivity
Task productivity was assessed using typing speed (words/min) and by absolute and relative
number of errors. The computer software program used to present the essays and generate the
scores was “Typing Master ProTM
• Gross speed indicates the total number of keystrokes divided by total time.
(Typing Master Finland, Inc., Helsinki, Finland).” This
program saves personal typing data by subject case number, and automatically calculates 6
productivity measurements: gross speed, net speed, accuracy, gross hits, net hits, and error hits.
In order to calculate typing speed (i.e., gross and net speed) and accuracy, three variables (i.e.,
gross, net, and error hits) are required. Each definition used in this study is as follows;
• Net speed is calculated by taking the number of correct words typed (i.e., total number of
keystrokes – number of error hits), divided by total time.
• Accuracy is calculated by taking the number of correct words typed (i.e., total number of
keystrokes – number of error hits), divided by the total number of keystrokes, and then
multiplying by 100 to provide a percentage.
• Gross hits are the total number of keystrokes.
• Net hits are calculated by subtracting the error hits from the total number of keystrokes.
• Error hits are the total number of incorrect words typed.
The essays typed by the subjects were provided in the typing software program. These
essays were at the fourth-grade reading level. The PI selected six essays that were long enough to
allow subjects to type for 10 minutes regardless of their personal typing speed. Each essay was
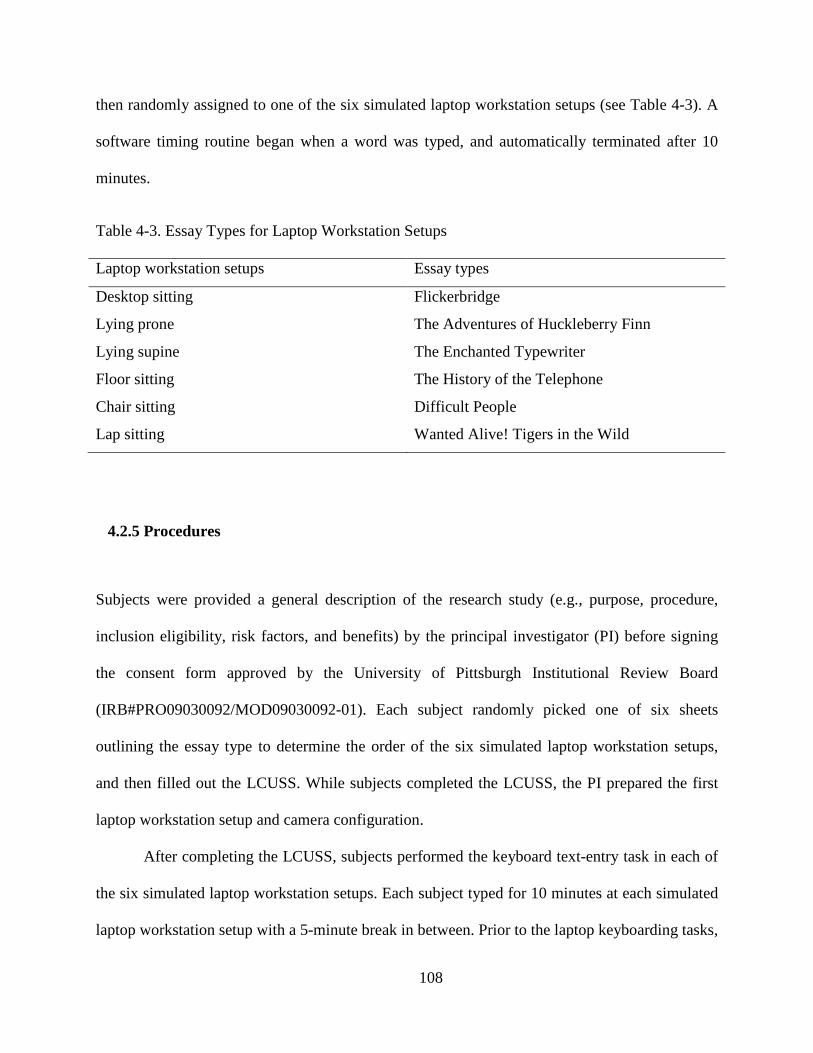
108
then randomly assigned to one of the six simulated laptop workstation setups (see Table 4-3). A
software timing routine began when a word was typed, and automatically terminated after 10
minutes.
Table 4-3. Essay Types for Laptop Workstation Setups
Laptop workstation setups Essay types
Desktop sitting Flickerbridge
Lying prone The Adventures of Huckleberry Finn
Lying supine The Enchanted Typewriter
Floor sitting The History of the Telephone
Chair sitting Difficult People
Lap sitting Wanted Alive! Tigers in the Wild
4.2.5 Procedures
Subjects were provided a general description of the research study (e.g., purpose, procedure,
inclusion eligibility, risk factors, and benefits) by the principal investigator (PI) before signing
the consent form approved by the University of Pittsburgh Institutional Review Board
(IRB#PRO09030092/MOD09030092-01). Each subject randomly picked one of six sheets
outlining the essay type to determine the order of the six simulated laptop workstation setups,
and then filled out the LCUSS. While subjects completed the LCUSS, the PI prepared the first
laptop workstation setup and camera configuration.
After completing the LCUSS, subjects performed the keyboard text-entry task in each of
the six simulated laptop workstation setups. Each subject typed for 10 minutes at each simulated
laptop workstation setup with a 5-minute break in between. Prior to the laptop keyboarding tasks,

109
subjects were asked to be as natural as possible, while typing in the simulated laptop workstation
setups. The subjects were, however, shown a picture of each laptop workstation setup to provide
basic guide (see Figure 4-1). Subjects could change the height of the chair and monitor angle to
their preferred height and angle, and these changes in the workstation setup parameters (e.g.,
LCD monitor tilt angle, laptop depth from the edge of a desk, chair height) were recorded by the
PI at the completion of each of the tasks.
After completing each of the six simulated laptop workstation setups, all subjects were
asked to immediately rate their discomfort levels on the VAS. In the meanwhile, the PI set up
the next laptop workstation setup and camera configuration. The level of lighting in the
laboratory room was kept constant during the experimental session across all subjects. The
amount of time required to complete this experiment was approximately 2 ½ hours, including
50 minutes for the LCUSS and consent form, 60 minutes for the six simulated laptop
workstation setups, and 40 minutes for the rest breaks between workstation setups.
4.2.6 Data management and processing
All subjects’ identities were indicated by case number. All information about subjects obtained
from this study was stored in a locked file cabinet. All data (i.e., LCUSS, upper body angles, K-
PeCS, discomfort, and task productivity) were entered into Microsoft Office Excel 2007, and
then transferred into a SPSS 17.0 software program for analysis.
To obtain the upper body angles, the data in the videotape was downloaded to a personal
computer into video clip types using an external DVD movie burner for digital storage (HP DVD
movie writer dc 4000) and later scoring of angles. Subjects’ postures were analyzed using a time-
sampling technique that was characterized as the systematic recording of frequency or variation

110
of specific behaviors during the observation period (Li & Buckle, 1999). In time sampling,
subjects’ postures were recorded in real time using the video recording system, and divided into
a number of equal time intervals (David, 2005; Suen & Ary, 1986). In this study, the video file
was divided into 1-minute intervals during the 10-minute laptop keyboarding task. To prevent a
rater from identifying a snapshot (i.e., electronic picture in jpg format) at a preferred starting
point, a starting point was randomly selected from either 1, 2, 3, 4, or 5 seconds. After selecting
the first snapshot, ten time points for each body angle were selected at 1-minute intervals. Each
snapshot was analyzed by the ImageJ software to obtain a numerical value of body angles. These
angles were entered into a database and averaged across the 10 data sets. Each snapshot had a
time stamp (e.g., day, hour, minute, and second) that the picture was taken.
In order to rate typing style using the K-PeCS, 1-minute video clips were extracted from
original video files. These video clips include two lateral views (i.e., right and left side) and one
transverse view (i.e., hand and wrist side). The PI selected the last minute of typing to avoid the
potential of conscious actions about being video-recorded and to observe a more stereotypical
moment (Baker, Sussman, & Redfern, 2008; James, Harburn, & Kramer, 1997).
Intensity of discomfort was assessed using the 10-cm VAS. The VAS was manually
scored by measuring how far along the line (in centimeter) from the ‘no discomfort’ anchor that
the line was marked. Task productivity (e.g., typing speed and number of errors) was
automatically stored in a preinstalled keyboarding program, Typing Master ProTM (Typing
Master Finland, Inc., Helsinki, Finland).

111
4.2.7 Data analyses
All statistical analyses were performed using the SPSS 17.0 statistical package program.
Demographic characteristics of the study sample (N = 30) were summarized using relative
frequency distributions for the nominal and ordinal data, and means and standard deviation (SD)
for the continuous data. Prior to analysis, we identified the three most common workstation
setups used: desktop sitting, lying supine, and chair sitting (Shin, 2010). All further data analysis
for this study was delimited to these three workstation setups.
Research question 1.1: Difference in upper body angles
The average angle for each upper body area was calculated using mean and standard deviation.
Data were analyzed by a repeated measures analysis of variance (ANOVA). A separate ANOVA
model was used for each body angle as the dependent variables, and each of the three simulated
laptop workstation setups as the independent variables. If there were significant main effects
between the three simulated laptop workstation setups, Bonferroni post-hoc comparisons were
conducted to determine significant differences in the outcome variables among the laptop
workstation setups.
Effect size was determined by partial eta-squared (ηP2). In a repeated measures ANOVA
model, the partial eta-squared is commonly used in conjunction with statistical significance, and
it is interpreted as “the proportion of variance that a variable explains that is not explained by
other variables” (Field, 2009, p. 791). In a repeated measures ANOVA model with only a single
factor, effect size scores for partial eta-squared and eta-squared are identical. Interpretation for

112
strength of these values was: small (ηp2 = .01), medium (ηp
2 = .06), and large (ηp2
Research question 1.2: Difference in typing style
= .14) (Cohen,
1998).
We completed descriptive statistics for the K-PeCS to identify frequency and percentage
distribution of each item. We compared the K-PeCS items among the three simulated laptop
workstation setups using a Friedman’s ANOVA and the Wilcoxon signed rank test for post-hoc
comparisons (asymptotic significance, 2-tailed). Statistical significance was set at p < .05.
Research question 2.1 and 3.1: Difference in physical discomfort and task productivity
Repeated measures ANOVAs were used to analyze differences in physical discomfort and task
productivity (i.e., gross speed, net speed, accuracy, gross hits, net hits, and error hits) among the
three simulated laptop workstation setups. If the main effect was significant between the laptop
workstation setups, Bonferroni post-hoc comparisons were conducted. In addition to statistical
significance, we reported the partial eta-squared, a measure of effect size. The selected critical
level of alpha significance for all tests was p < .05.
4.3 RESULTS
4.3.1 Participants
Table 4-4 presents the demographic characteristics of 30 subjects, 25 females and 5 males, who
were enrolled in this study. All subjects were full-time students from the University of Pittsburgh.

113
Most subjects were graduate students (56.7%), followed by junior (20%) and senior (20%), and
sophomore (3.3%). The ages of students ranged from 20 years to 48 years, with mean age of
25.97 ± 7.29. The majority of subjects were also non-Hispanic or Latino (100%), white (63.3%),
right-handed (90%), and never married (86.7%).
Table 4-4. Participants’ Demographic Characteristics
Demographics Mean ± SD or number (%)
Age, years 26.0 ± 7.3
Male 28.4 ± 5.2
Female 25.5 ± 7.6
Gender
Female 25 (83.3%)
Ethnicity
Non Hispanic or Latino 30 (100.0%)
Race
Asian 10 (33.3%)
Black or African American 1 (3.3%)
White or Caucasian 19 (63.3%)
Dominant hand
Right 27 (90.0%)
Left 2 (6.7%)
Both 1 (3.3%)
Current enrollment status
Full time student 30 (100.0%)
Class level
Sophomore 1 (3.3%)
Junior 6 (20.0%)
Senior 6 (20.0%)
Graduate students 17 (56.7%)

114
4.3.2 Research question 1.1: Difference in upper body angles
Table 4-5 provides the results of mean, standard deviation (SD), and ANOVA for each body
angle for the three simulated laptop workstation setups.
Table 4-5. Comparison of Angles and ANOVA Summary between Three Laptop Workstation
Setups
Posture angles
Mean ± SD (degree)
F
p
c ηPDesktop
sitting
2 Lying
supine
Chair
sitting
Neck angle 46.0 ± 6.7 35.2 ± 8.1 55.5 ± 6.7 104.25 < .001 .78
Rt. shoulder angle 21.9 ± 7.8 α -3.8 ± 7.6 0.2 ± 8.7 167.40 < .001 .85
Lt. shoulder angle 23.0 ± 7.7 α -4.0 ± 7.6 1.1 ± 9.0 188.46 < .001 .87
Rt. elbow angle 109.1 ± 8.8 a 111.2 ± 14.8 112.4 ± 12.9 0.93 .40 .03
Lt. elbow angle 111.6 ± 9.1 a 112.2 ± 15.0 114.2 ± 13.3 0.60 .55 .02
Rt. wrist angle -0.5 ± 7.2 a 4.5 ± 11.6 -3.4 ± 10.2 13.30 < .001 .31
Lt. wrist anglea -2.5 ± 7.6 5.4 ± 12.5 -6.5 ± 12.7 28.31 < .001 .49
Rt. ulnar/radial deviation 5.5 ± 2.3 b 10.5 ± 4.4 12.5 ± 4.4 72.40 < .001 .71
Lt. ulnar/radial deviation 7.5 ± 2.3 b 12.2 ± 3.5 13.7 ± 4.7 71.58 < .001 .71
Thoracic bend angle 133.4 ± 9.1 α 115.6 ± 6.8 124.5 ± 8.1 134.88 < .001 .82
Trunk angle 94.2 ± 5.0 α 128.0 ± 11.3 103.7 ± 6.1 173.93 < .001 .86
View angle 32.6 ± 3.7 25.8 ± 11.6 50.4 ± 5.0 87.80 < .001 .75
Note. Rt. = Right; Lt. = Left; aThe plus sign (+) indicates flexion and the minus sign (–)
indicates extension; bThe plus sign (+) indicates ulnar deviation of the wrist and the minus sign
(–) indicates radial deviation of the wrist; c
In general, most angles were significantly different between the three simulated laptop
workstation setups, with a large effect size of more than 0.14. Only elbow angles showed no
significant difference and a small effect size. As significant main effects were found, Bonferroni
post-hoc analyses were calculated. Most angles were significantly different among all three
Statistical significance was set at p < .05

115
simulated laptop workstation setups, except for right wrist angle between desktop and chair
sitting (p = .17), left wrist angle between desktop and chair sitting (p = .07), and left ulnar/radial
deviation between lying supine and chair sitting (p = .05) (see Appendix L).
4.3.3 Research question 1.2: Difference in typing style
Friedman’s ANOVA results indicated a significant main effect for 15 of the 19 K-PeCS items
among the three laptop workstation setups (see Table 4-6 and Appendix M). Post-hoc analyses
using the Wilcoxon signed rank tests revealed that of the 45 post-hoc models, 28 were significant
(p < .05) (see Appendix N).
Table 4-6: Significant Main Effect for 15 Items
K-PeCS items
Mean rank χ
2 df
p Desktop
sitting Lying supine
Chair sitting
Torso angle 2.7 1.3 2.1 42.20 2 < .001 Back rest use 2.5 1.5 2.0 28.53 2 < .001 Head flexion angle 1.3 2.5 2.3 41.61 2 < .001 Rt. shoulder flexion angle 2.7 1.6 1.7 42.09 2 < .001 Lt. shoulder flexion angle 2.7 1.6 1.6 44.00 2 < .001 Forearm support use 1.7 2.1 2.3 10.66 2 < .001 Rt. wrist support use 2.1 1.8 2.1 6.23 2 .04 Rt. ulnar angle > 20° 1.6 2.2 2.3 17.03 2 < .001 Lt. ulnar angle > 20° 1.5 2.3 2.2 19.97 2 < .001 Rt. wrist extension > 15° 1.7 1.7 2.6 18.27 2 < .001 Lt. wrist extension > 15° 1.9 1.8 2.4 8.91 2 .01 Rt. isolated 5th 1.9 digit 2.3 1.9 10.67 2 < .001 L-3 MCP hyperextension 1.9 2.2 1.9 10.75 2 < .001 L-4 MCP hyperextension 1.6 2.2 2.2 11.56 2 < .001 L-5 MCP hyperextension 1.5 2.3 2.2 22.46 2 < .001 Note. Rt. = Right; Lt. = Left; MCP = Metacarpophalangeal joints

116
4.3.4 Research question 2.1: Difference in physical discomfort
Figure 4-5 displays the average discomfort experienced by participants during laptop computer use
for each of the three simulated laptop workstation setups. While desktop sitting and lying supine
showed a similar trend for discomfort, the discomfort in chair sitting was greater than the
discomfort reported in the other two laptop workstation setups. For upper back discomfort, the
main effect was significantly different among the three laptop workstation setups (F (2, 58) = 6.01,
p < .001, ηP2 = .17), and post-hoc analyses were also significantly different between desktop sitting
vs. chair sitting (p = .01) and lying supine vs. chair sitting (p = .02). Although there were
significant main effects for the right (F (2, 58) = 3.76, p = .03, ηP2 = .12) and left shoulder (F (2,
58) = 3.32, p = .04, ηP2 = .10) among the three laptop workstation setups, post-hoc analyses
showed no significant differences (see Appendix O and P). While the shoulder and upper back
showed medium to large effect sizes (ηP2) among the three laptop workstation setups, the other
body areas showed smaller effect sizes. Although there were no significant differences for neck
discomfort among the three laptop workstation setups, respondents rated the neck area as having
the greatest area of discomfort compared to other body areas.
Figure 4-5. Overall discomfort reported following use of the three laptop workstation setups
Note. Rt. = Right; Lt. = Left; *Asterisk indicates significant difference among the three simulated laptop workstation setups

117
4.3.5 Research question 3.1: Difference in task productivity
Both the main effects for speed (i.e., gross and net speeds) and typing hits (i.e., gross and net
hits) were statistically significant (all p < .001) with a large effect size (all ηP2 > .59), while
accuracy (p = .37, ηP2 = .03) and error hits (p = .73, ηP
2
4.4 DISCUSSION
= .01) did not show significant
differences among the three laptop workstation setups (see Appendix Q). Most results derived
from post-hoc analyses were significant (p < .05), except for net speed and net hits between
desktop sitting and lying supine (p = .10) (see Appendix R). Overall, faster typing speed and
more typing hits were observed during desktop sitting, followed by lying supine and then chair
sitting.
With the advantage of portability fulfilling everyday computing needs, laptop computers are
frequently used in a variety of workstation setups without appropriate equipment (e.g., desk,
chair, or external device). Therefore, in reality, it can be difficult to apply postural implications
of traditional computer workstation setups to laptop computer operators. To date, only two
experimental studies have compared several laptop workstation setups (i.e., desktop sitting, lap
sitting, or lap desk sitting) on upper body postures and musculoskeletal discomfort (Asundi et al.,
2010; Moffet et al., 2002). However, research studies are still lacking that provide appropriate
information on how various laptop workstation setups affect laptop computer operators, in terms
of body postures and discomfort. This experimental study provides preliminary data in this area
as it describes upper body angles, typing style, physical discomfort, and task productivity in the

118
three most common laptop workstation setups reported by a sample of college students (i.e.,
desktop sitting, chair sitting, and lying supine). In this discussion, we provide a summary of
results in light of previous research, problems or limitations, and suggestions for future research.
The first aim for this study was to examine the effects of the three most common laptop
workstation setups on body postures. Overall, type of laptop workstation setups had a significant
influence on upper body angles. Specifically, in chair sitting, subjects assumed more awkward
body postures than those in desktop sitting: increased trunk extension, thoracic flexion, neck
flexion, wrist extension, ulnar deviation, and view angle. Our results are consistent with the
findings of Moffet et al. (2002) who reported that in chair sitting, laptop computer operators
assumed increased trunk extension, neck flexion, and wrist extension, compared with those in
desktop sitting. Asundi et al. (2010) also found that laptop computer operators’ neck flexion and
wrist extension were increased in chair sitting. However in both previous research studies, no
significant difference was observed for ulnar deviation of the wrist between the two laptop
workstation setups (i.e., desktop vs. chair sitting), while our findings showed that subjects
increased ulnar deviation of the wrist during chair sitting. These differences may be due to the
adjustable chair used in the current study. In previous research studies, subjects could not adjust
the height of their chair, while our sample changed the chair height by preference. This
experimental condition may allow our sample to adjust their laptop workstation setups to assume
more neutral wrist postures, compared with previous research studies.
In lying supine, subjects assumed more neutral body postures as compared to those in
chair sitting: less neck flexion, wrist extension, ulnar deviation, thoracic flexion, and view angle.
It was particularly interesting to note that neck flexion decreased more than 20° when lying
supine compared to chair sitting. Pheasant and Haslegrave (2006) indicated that a difference of
119
6° in neck flexion caused a torque change of 9% around the C7, suggesting that small changes of
neck flexion may have a great influence on muscle load of the neck that may be associated with
neck discomfort. In our study, subjects showed the least neck flexion during lying supine,
possibly because subjects could assume more comfortable upper body postures by supporting
their trunk against the back cushion. Some subjects also supported their necks against the wall.
In this posture, subjects may decrease the likelihood of neck discomfort, as the center of gravity
of the head lies over the entire vertebral column (Greene & Roberts, 2005).
Interestingly, we observed several compensatory body postures that may be associated
with physical discomfort during typing tasks, even though we did not measure the frequency of
these postures. We believe that most subjects assumed compensatory postures to reduce their
physical discomfort, possibly caused by the low heights of keyboards and monitors. For example,
in lying supine, we noticed that the knee positions assumed by subjects affected the neck, elbow,
wrist, and view angles. When subjects raised their knees and positioned laptop monitors at eye
level, subjects tended to assume a more neutral body posture with lesser neck flexion and view
angles, and more neutral wrist angles than subjects who kept their legs straight. Although we did
not measure the relationships between compensatory postures and upper body angles or
discomfort, future research studies should examine these relationships. Currently, there is no
published evidence that explores postural angles in lying supine with desktop and chair sitting.
Therefore these findings may expand the understanding of workstation setups used by laptop
computer operators.
Another interesting observation was a floating wrist position of subjects while using a
laptop computer. We noticed that when subjects kept their wrists floating above the keyboard
during typing, the shoulder abduction and ulnar deviation tended to be increased, while the wrists

120
tended to be maintained in a neutral posture. The postural effects of a floating wrist position have
been a controversial issue among researchers. Some researchers have reported that this posture
reduces wrist flexion and extension and ulnar deviation, resulting in more neutral wrist postures
(Aaras, Horgen, Bjorset, Ro, & Walsoe, 2001; Albin, 1997; Cook & Burgess-Limerick, 2002),
while others have reported increased MSD/MSS while floating the wrists above the keyboard
(Bendix & Jessen, 1986; Horie, Hargens, & Rempel, 1993; Visser, de Korte, van der Kraan, &
Kuijer, 2000). Assessment of this compensatory movement is important in order to avoid
misinterpretation of the effects of the laptop workstation setups. Future studies should control
these movements to establish clear relationships between upper body angles and laptop
workstation setups.
In addition, distance between keyboard and abdomen appeared to affect the neck,
shoulder, and elbow angles. When the laptop computers were placed closer to the abdomen
(specifically in chair sitting), subjects tended to assume greater neck flexion, shoulder abduction,
and elbow flexion. Previous research studies have reported that placement of the keyboard low
and away from the body results in less neck and shoulder discomfort than placement of the
keyboard at above elbow height and close to the body (Bergqvist et al., 1995a; Marcus et al.,
2002). In chair sitting, laptop computers were placed low and close to the body (on their laps), so
we believe that this placement of laptop computers may negatively affect subjects’ neck and
elbow flexion.
As with measurements taken using the ImageJ, the K-PeCs results also indicated large
differences in typing style for static postures among the three simulated laptop workstation
setups for torso, neck, and shoulder angles. Specifically, in desktop sitting, more subjects
assumed neutral postures for torso and neck angles, than those in lying supine and chair sitting.

121
Holding sustained awkward static postures may put larger loads on the muscles and tendons,
resulting in increased discomfort, compared with dynamic postures (Chaffin, 1973; Mamaghani,
Shimomura, Iwanaga, & Katsuura, 2003). In lying supine, subjects showed greater torso
extension angles than those in the other two workstation setups, but all subjects leaned their
trunks against the back cushions to support their body weights. These back cushions may allow
the subjects to assume more stable wrist and hand postures (dynamic postures) by providing
stable trunk position, compared to those in chair sitting. In contrast, for chair sitting a greater
number of subjects did not lean their trunk against the chair backs which, in turn, allowed greater
postural variability in the trunk. This unstable trunk position may allow laptop computer
operators to assume unstable wrist and hand postures: subjects frequently exceeded 20 degrees of
ulnar deviation and 15 degrees of wrist extension in chair sitting. Although there are no research
studies that examine the relationships between variability of the trunk and wrist and hand
postures during typing, this information may inspire future studies.
Interestingly, in lying supine, neck flexion angle reported by video-based observation
was considerably lower than the angle measured by the K-PeCS. This difference may be caused
by the difference of postural angle estimation. In the K-PeCS, neck angle was formed by the
vertical line and the line from the glenohumeral joint to the center of the ear (Baker, 2008),
whereas video-based observational study used the C7 spinous process as the axis of rotation
(Ankrum & Nemeth, 2000). The glenohumeral joint is located more anterior and inferior than the
C7 spinouse process and close to the ear, so neck flexion angle was smaller when using the K-
PeCS than when using the video-based observation method.
With regard to dynamic postures, subjects generally showed more neutral body postures
in desktop sitting (i.e., wrist extension, ulnar deviation, isolated 5th digit, and left MCP

122
hyperextension) than in the other two laptop workstation setups. This result supports the
importance of a workstation environment with desks and chairs. In desktop sitting, over 50% of
subjects supported their forearms (but not wrists) on the desk surface, while over 75% of subjects
supported their forearms in the other laptop workstation setups, so using a forearm support may
decrease postural variability of wrist and hand movements by providing stability for upper limbs.
This hypothesis was supported when we compared standard deviations among the three
simulated laptop workstation setups, in desktop sitting, an average of standard deviations was
approximately 7.4 degrees for wrist extension and 2.3 degrees for ulnar deviation, while in chair
sitting and lying supine, an average of standard deviations was approximately 12.0 degrees for
wrist extension and 4.3 degrees for ulnar deviation. Delisle, Lariviere, Plamondon, and Imbeau
(2006) found less variability of wrist extension and deviation when forearms on the desk surface
were supported, than the chair arm rest with a smaller surface. Epidemiological research studies
support the importance of supported forearms while typing: Karlqvist (1998) and Rempel (2006)
reported that providing a large forearm support was an effective intervention to prevent upper
body MSD/MSS in computer operators. Thus future research studies should be done to establish
the relationships between forearm supports and postural variability of hand and wrist and
associated discomfort.
The second aim of our study was to examine the effects of the three most common laptop
workstation setups on physical discomfort. Overall, among the three laptop workstation setups,
subjects showed significant differences only for their upper back discomfort. Although we did
not find a significant difference for neck discomfort, this finding was similar to our previous self-
report data (Chapter 3) in which respondents reported greater discomfort in their neck and upper
back areas. In chair sitting, subjects experienced greater neck discomfort than the other laptop
123
workstation setups. When considering the upper body angles in chair sitting, subjects showed
increased neck flexion and view angle, possibly due to the lower monitor placement below
elbow height. Low monitor placement has been considered previously as a potential risk factor
for neck discomfort (Dewall, Vanriel, Aghina, Burdorf, & Snijders, 1992; Hunting et al., 1981;
Psihogios, Sommerich, Mirka, & Moon, 2001; Sommerich, Joines, & Psihogios, 2001), while
high monitor placement has been linked to visual stress (Bergqvist & Knave, 1994; Sotoyama,
Jonai, Saito, & Villanueva, 1996). Our postural findings in chair sitting are consistent with
previous evidence that low monitor placement increased neck flexion (Burgess-Limerick et al.,
1998; Villanueva et al., 1996). Increased neck flexion may also be associated with greater
gravitational moment, because the center of mass movements is away from the corresponding
rotation center (Straker et al., 2008). These increased gravitational loads and muscle activities
may result in localized muscle fatigue of the neck during chair sitting.
However, our study did not show significant differences for shoulder and neck
discomfort while previous research studies reported the highest discomfort for the neck and
shoulder in laptop computer operators (Harris & Straker, 2000; Sommerich et al., 2007; Straker
et al., 1997). This is likely attributable to the confusion of precise body areas of neck and
shoulder. Trapezius muscles connect the entire upper back, neck, and shoulder areas (Oatis,
2009), so if subjects experienced the discomfort on upper portion of trapezius, they may be
confused about precise areas among upper back, neck, and shoulder. In future research studies,
subjects should be well instructed to figure out precise body areas that they experience the
discomfort while using a laptop computer. Another plausible explanation is the short period of
rest breaks (i.e., 5 minutes) between the laptop workstation setups, or that 10 minutes of typing
was not enough to elicit discomfort. This short break also has resulted in an overlapping effect of

124
discomfort between the laptop workstation setups and body areas. Future studies should be done
with a greater period of rest breaks and typing to better differentiate discomfort associated with
specific workstation setups.
Another interesting finding was that discomfort in lying supine showed a similar trend to
desktop sitting, possibly suggesting that providing back (i.e., cushion) or neck supports may
relieve the upper body discomfort. In lying supine, all subjects leaned their trunks against a back
cushion. This finding suggests that environmental supports may allow laptop computer operators
to position their bodies in natural typing postures that may be associated with less discomfort.
The third aim of our study was to examine the effects of the three most common laptop
workstation setups on task productivity. Overall, subjects had the fastest typing rates in desktop
sitting, followed by lying supine, and then chair sitting. This result is consistent with the findings
of Moffet et al. (2002) who reported that in desktop sitting, subjects wrote more characters than
in chair sitting. Although we did not analyze an association between productivity and discomfort,
typing speed may be linked with a comfortable computer workstation setup. Several researchers
have suggested that decreased typing productivity has been directly associated with increased
discomfort during computer use (Liao & Drury, 2000; Pan, Shell, & Schleifer, 1994), because
discomfort derived from awkward postures may undermine precise hand and finger movements
(Chaffin, Andersson, & Martin, 2006; Pan & Schleifer, 1996). However, there were no
significant differences on the accuracy and error rate among the three simulated laptop
workstation setups, suggesting that typing accuracy may be influenced by individual typing
proficiency.

125
Limitations
The current study had several limitations. Its repeated exposure to the keyboarding tasks may
have affected physical discomfort, so that subjects may have rated their discomfort for laptop
workstation setups later in the sequence as causing more severe discomfort than the laptop
workstation setups experienced earlier regardless of the actual effects. This repeated exposure
may mask an actual association between the laptop workstation setup and discomfort, or falsely
describe an apparent association even though there is no real association between variables (i.e.,
Type I error). In order to minimize this bias, each subject was randomly assigned to the order in
which they used each laptop workstation setup.
In addition, the exposure time that subjects had to type in each laptop workstation setup
was relatively short. Ten minutes of typing time may not be enough to demonstrate accurate
physical discomfort and task productivity. If we had provided a longer time for each typing
session, subject may have adjusted their postures to relieve the discomfort of each body area, and
their typing speed may have improved by adapting to the typing software program, or they may
have experienced greater discomfort and fatigue with reduced productivity.
In this study, we used a video-based observational method to measure each body angle.
Although we compared measurement errors between the video-based observational method (i.e.,
ImageJ) and a handheld goniometer method as a validation process, these angles may be less
accurate than those by a direct measurement method, such as a three dimensional system or
electromyography. Furthermore, in time sampling, 1-minute intervals may not have been
sufficient to determine accurate angles of hands and wrists that had greater postural variability.
Future studies are recommended to compare postural factors using more accurate measurement
methods on more dependent variables (e.g., muscle activity, joint angular velocity/acceleration,

126
or displacement), or using a shorter time-interval for the time sampling technique (e.g., 10-
second intervals). In addition, we did not analyze knee flexion and shoulder abduction which was
frequently observed as a compensatory movement. In future studies, compensatory movements
should be examined concurrently to provide a more complete picture of postural patterns
between several laptop workstation setups.
Another important note is that although the simulated laptop workstation setups were
standardized across all subjects with a picture that recommended specific postures for each
workstation setup, individual typing style and postures (e.g., keyboard and monitor heights,
angle of monitor, or position of lower limbs) were not controlled to replicate real-world
conditions. For example, in the lying supine workstation setup, subjects adjusted the height of
their monitors by raising the knee position (i.e., knee flexion) to place their monitors at eye level.
There may be additional factors that may affect upper body angles and discomfort. Future studies
should control these individual variations among the laptop workstation setups.
Finally, there is a possibility that the subjects experienced an overlap of symptoms due to
their short rest intervals (i.e., 5-minutes rest breaks) between the different laptop workstation
setups. We could address this by performing our testing over a longer period of time. We could
increase both the typing time during each session and also the post-session recovery time. In that
way, we could avoid a potential cumulative effect of the laptop workstation setups on the
subjects’ level of discomfort. Statistically, we could utilize the “Latin Square” design to control
for potential order effects of laptop workstation setups. Future studies should use a larger sample
size in order to strengthen statistical power. We could also improve the accuracy of our
measurement methods by utilizing additional measurement tools, such as a three dimensional
system or electromyography in addition to our current observational methods.

127
4.5 CONCLUSIONS
The current experimental study examined the effect of the three most common laptop
workstation setups (i.e., desktop sitting, chair sitting, and lying supine) on upper body postures,
physical discomfort, and task productivity. Overall, the use of laptop computers in the desktop
sitting workstation setup maintained more neutral body postures, resulted in less discomfort and
contributed to faster typing rates. These findings are consistent with previous research studies
which have reported that laptop computer use in a desktop sitting workstation setup improved
upper body postures, discomfort relief, and typing speed (Asundi et al., 2010; Moffet et al.,
2002). Interestingly, compared with the chair sitting workstation setup, the lying supine
workstation setup was associated with less flexed neck, shoulder, and view angles, less ulnar
deviation, less discomfort, and faster typing speeds. We believe that these advantages of the
lying supine workstation setup may result from the use of a back cushion to support the trunk
and neck. Providing external supports may increase trunk and neck stability, and allow laptop
computer operators to assume stable upper body postures. Considering greater neck flexion
increased localized muscle strain around neck that may be associated with neck discomfort
(Marcus et al., 2002; Sauter et al., 1991; Straker et al., 2008), decreased neck flexion in lying
supine may lead to less neck discomfort. In addition, although more subjects showed greater
shoulder flexion in desktop sitting than the other workstation setups, subjects experienced the
least discomfort in their shoulders, possibly due to the forearm support on the desk surface.
These findings suggest that although proper sitting postures (i.e., upright neck posture, shoulder

128
flexion of less than 25̊, elbow flexion of 90˚, neutral wrist posture) are important to prevent
potential musculoskeletal discomfort during laptop computer use (BSR-HFES 100, 2002), it is
also important to use environmental supports to provide stable body postures.
In future studies, it is recommended that researchers provide a longer typing time than 10
minutes, in order to ensure the relationships between laptop workstation setup and physical
discomfort. Additionally, future studies should evaluate compensatory movements (i.e., shoulder
abduction, knee flexion, and floating wrist position) and use more accurate measurement
methods (e.g., three dimensional system or electromyography) to provide a more complete
picture of the physical discomfort associated with postural patterns among several laptop
workstation setups.

129
5.0 CONCLUSIONS
The purpose of this study was to explore laptop-related risk factors associated with potential
musculoskeletal symptoms (MSS) in college students. The general aims of this study were to:
• Develop a valid and reliable survey instrument (Laptop Computer User Screening Survey
[LCUSS])
• Describe characteristics of laptop computer use in college students
• Examine the relationship between laptop-related risk factors and physical discomfort
• Examine the effects of the three simulated laptop workstation setups on upper body
postures, physical discomfort, and task productivity
The first study identified that the LCUSS was a valid and reliable survey instrument to
identify the characteristics of laptop computer use in college students. Using this instrument, we
described characteristics of laptop computer use, and examined the relationship between laptop-
related risk factors (i.e., duration of laptop computer use and type of laptop workstation setups)
and physical discomfort in upper body. The survey revealed that this study sample used their
laptop computers to do academic-based assignments (i.e., word processing task) in the home,
library, or café and restaurant. The primary reasons for selecting the location of laptop computer
use were accessibility of wireless internet and presence of an electrical outlet. The most common
laptop workstation setups selected by this sample were desktop sitting, followed by lying supine,
and chair sitting. One-third of respondents reported some degree of functional limitations in

130
college-based activities: type 10 pages on the laptop computers, carry books around campus, and
sports activities. Most of the sample showed positive attitudes towards their laptop computers
and passive engagement in recreational activities. Although there were no significant
relationships between the laptop-related risk factors (duration of laptop computer use and
percentage of time spent using each type of laptop workstation setups) and average laptop-
related discomfort, the study sample reported greater discomfort associated with: prolonged daily
use of the laptop computers; neck and upper back areas while using a laptop computer; floor
sitting and lying prone laptop workstation setups; and carrying the laptop computers in shoulder
bag or briefcases.
The second study compared the three most common laptop workstation setups (i.e.,
desktop sitting, lying supine, and chair sitting) on upper body postures, discomfort, and task
productivity. Overall, less discomfort and faster typing rates were achieved during desktop
sitting, followed by lying supine, and chair sitting. Most upper body angles were significantly
different among the three simulated laptop workstation setups:
• Desktop sitting: neutral wrist posture and ulnar deviation, upright trunk, and greater
shoulder flexion than for the other workstation setups
• Lying supine: least neck flexion and greater wrist flexion and trunk extension than for the
other workstation setups
• Chair sitting: greater neck flexion, wrist extension, and ulnar deviation than for the other
workstation setups
This research study provides preliminary data that describes the characteristics of laptop
computer use and the effects of the three most common laptop workstation setups on upper body
postures, discomfort, and task productivity in college students. As described above, laptop

131
computer operators used their laptop computers in many workstation setups, and these
workstation setups affected upper body postures, discomfort, and task productivity differently.
Although we identified that subjects working in desktop sitting showed fewer awkward postures,
less discomfort, and faster typing speed, interestingly subjects lying supine showed similar
positive patterns, but to lesser degree. These results suggest that environmental supports (e.g.,
desks, chairs, and back or neck supports) may have a strong positive influence on potential
MSD/MSS associated with using a laptop computer in portable computing environment.
Therefore, it is important to use the surrounding environments (e.g., bag, book, or cushion) to
raise the height of keyboards and monitors to prevent neck and trunk flexion. If laptop computer
operators cannot find any environmental supports, they should take short and frequent breaks
which may relieve musculoskeletal discomfort caused by prolonged laptop computer use. In
addition, laptop computer operators should carry their laptop computers using a backpack instead
of a single strap shoulder bag, because survey results revealed high levels of discomfort
associated with a shoulder bag.

132
APPENDIX A
LCUSS EXPERT PANEL EVALUATION FORM
Guideline for the Work of the Expert Panel
Purpose of the Study:
The purpose of this study is to develop and validate a reliable survey instrument (i.e., Laptop Computer User Screening Survey; LCUSS) which will be used to describe characteristics of laptop computer usage among college students.
Task of the Panel of Experts:
• To help determine the most effective survey items • To detect specific wording or layout problems in the survey
Committee of the Experts:
• Nancy A. Baker, ScD, OTR/L, Professor, University of Pittsburgh, Department of Occupational Therapy
• Margo B. Holm, PhD, OTR/L, FAOTA, ABDA, Professor, University of Pittsburgh, Department of Occupational Therapy
• Ketki D. Raina, PhD, OTR/L, Professor, University Pittsburgh, Department of Occupational Therapy
• Rakié Cham, PhD, Professor, University of Pittsburgh, Department of Bioengineering • Young-Joo Kim, MS, University of Pittsburgh, Department of Occupational Therapy • Krissy Moehling, MPH, CHES, University of Pittsburgh, Department of Occupational Therapy

133
Content of the Survey:
The purpose of the LCUSS is to describe the characteristics of laptop computer use that may be associated with potential musculoskeletal problems among college students. Survey items have been developed from the literature content and empirical studies. The following are the sections addressed in the LCUSS:
• Demographic information • Location of laptop computer use • Laptop transportation methods • Laptop related tasks • Laptop specifications • Usage time • Laptop workstation setup • Overall laptop related discomfort • Previous/current health status • Recreational activities • Health related functional role • Attitude toward the laptop computer
Directions for the Panel of Experts:
After reading the LCUSS items, please use your knowledge and expertise to help identify and refine problems with question content (i.e., overall meaning of questions and individual terms or concepts) and survey design.
• First, evaluate the quality of survey items and general survey design, according to the criteria presented on the LCUSS Expert Panel Evaluation Form (attached).
• Second, please suggest revisions to each item that needs to be articulated more clearly in the space provided.
• Finally, record any additional recommendations that will improve the quality of the survey.
Thank you for sharing your expertise and opinion in the validation process of the survey instrument development. The results from this validation process will be used to modify, revise, and finalize the items and designs of the LCUSS.
Hyekyoung Shin
(412) 337 - 4856
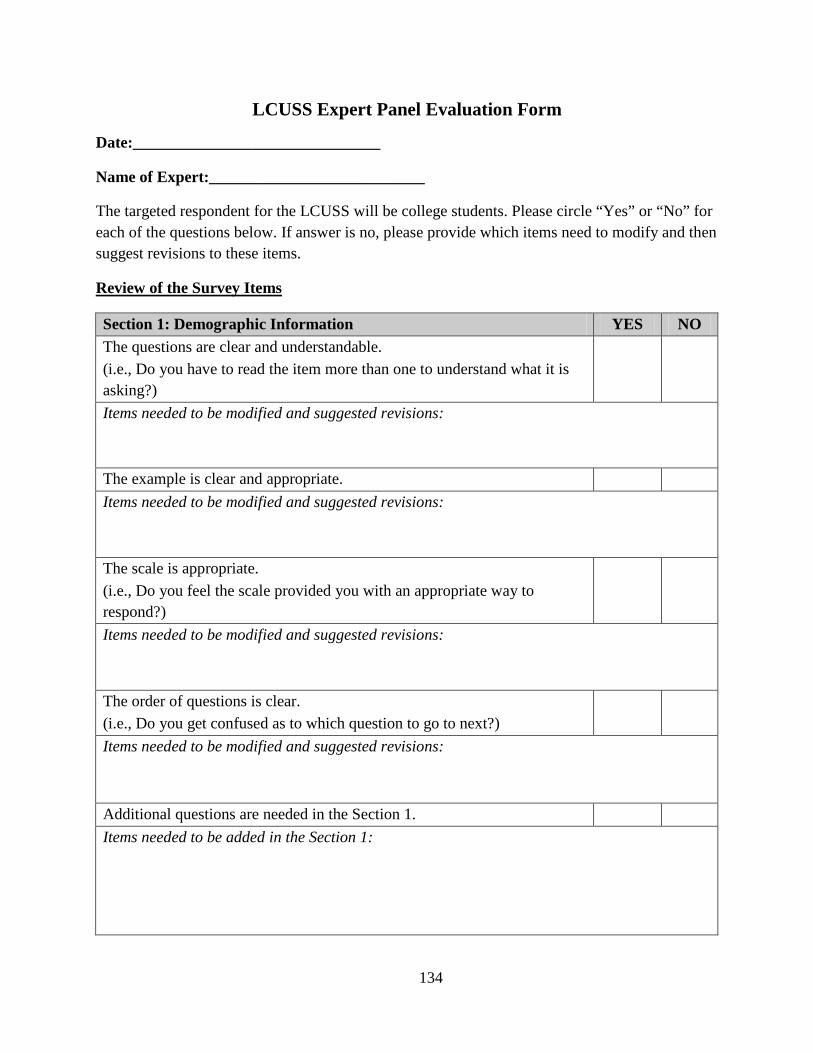
134
LCUSS Expert Panel Evaluation Form
Date:_______________________________
Name of Expert:___________________________
The targeted respondent for the LCUSS will be college students. Please circle “Yes” or “No” for each of the questions below. If answer is no, please provide which items need to modify and then suggest revisions to these items.
Section 1: Demographic Information
Review of the Survey Items
• YES NO The questions are clear and understandable. (i.e., Do you have to read the item more than one to understand what it is
asking?)
Items needed to be modified and suggested revisions:
The example is clear and appropriate. Items needed to be modified and suggested revisions:
The scale is appropriate. (i.e., Do you feel the scale provided you with an appropriate way to
respond?)
Items needed to be modified and suggested revisions:
The order of questions is clear. (i.e., Do you get confused as to which question to go to next?)
Items needed to be modified and suggested revisions: Additional questions are needed in the Section 1. Items needed to be added in the Section 1:

135
Section 2: Location of Laptop Computer Use 2.1. Where do you use your laptop computer? • YES NO The question is clear and understandable. (i.e., Do you have to read the item more than one to understand what it is
asking?)
Suggested revisions: The example is clear and appropriate. Suggested revisions: The scale is appropriate. (i.e., Do you feel the scale provided you with an appropriate way to
respond?)
Suggested revisions: 2.2. What is the reason for selection of location to use your laptop
computer? • YES NO
The question is clear and understandable. (i.e., Do you have to read the item more than one to understand what it is
asking?)
Suggested revisions: The example is clear and appropriate. Suggested revisions: The scale is appropriate. (i.e., Do you feel the scale provided you with an appropriate way to
respond?)
Suggested revisions:

136
The order of questions (item 2.1 and 2.2) is clear. (i.e., Do you get confused as to which question to go to next?)
Suggested revisions: Additional questions are needed in the Section 2. Items needed to be added in the Section 2: Section 3: Laptop Transportation Methods 3.1. How do you carry your laptop computer? • YES NO The question is clear and understandable. (i.e., Do you have to read the item more than one to understand what it is
asking?)
Suggested revisions: The example is clear and appropriate. Suggested revisions: The scale is appropriate. (i.e., Do you feel the scale provided you with an appropriate way to
respond?)
Suggested revisions: 3.2. How severe is the discomfort (aching, cramping, sore,
uncomfortable, stiff, dull, pressure, burning, or shooting) you experience with the following laptop transportation methods?
• YES NO
The question is clear and understandable. (i.e., Do you have to read the item more than one to understand what it is
asking?)
Suggested revisions:

137
The example is clear and appropriate. Suggested revisions: The scale is appropriate. (i.e., Do you feel the scale provided you with an appropriate way to
respond?)
Suggested revisions: 3.3. What devices do you typically take • YES when carrying your laptop
computer? NO
The question is clear and understandable. (i.e., Do you have to read the item more than one to understand what it is
asking?)
Suggested revisions: The example is clear and appropriate. Suggested revisions: The scale is appropriate. (i.e., Do you feel the scale provided you with an appropriate way to
respond?)
Suggested revisions: The order of questions (item 3.1, 3.2, and 3.3) is clear. (i.e., Do you get confused as to which question to go to next?)
Suggested revisions: Additional questions are needed in the Section 3. Items needed to be added in the Section 3:

138
Section 4: Laptop Related Tasks 4.1. What type of tasks do you do the most often when using your
laptop computer? • YES NO
The question is clear and understandable. Suggested revisions: The example is clear and appropriate. Suggested revisions: The scale is appropriate. (i.e., Do you feel the scale provided you with an appropriate way to
respond?)
Suggested revisions: Additional questions are needed in the Section 4. Items needed to be added in the Section 4: Section 5: Laptop Specifications 5.1. What model of laptop computer do you typically use? • YES NO The question is clear and understandable. Suggested revisions: The example is clear and appropriate. Suggested revisions: The scale is appropriate. (i.e., Do you feel the scale provided you with an appropriate way to
respond?)
Suggested revisions:

139
5.2. What type of input device(s) do you use • YES with your laptop computer?
NO
The question is clear and understandable. Suggested revisions: The example is clear and appropriate. Suggested revisions: The scale is appropriate. (i.e., Do you feel the scale provided you with an appropriate way to
respond?)
Suggested revisions: 5.3. What type of other device(s) do you use besides your laptop
computer? • YES NO
The question is clear and understandable. Suggested revisions: The example is clear and appropriate. Suggested revisions: The scale is appropriate. (i.e., Do you feel the scale provided you with an appropriate way to
respond?)
Suggested revisions: 5.4. How much does your laptop weigh, including battery? • YES NO The question is clear and understandable. Suggested revisions:

140
The example is clear and appropriate. Suggested revisions: The scale is appropriate. (i.e., Do you feel the scale provided you with an appropriate way to
respond?)
Suggested revisions: 5.5. What is your laptop monitor size? • YES NO The question is clear and understandable. Suggested revisions: The example is clear and appropriate. Suggested revisions: The scale is appropriate. (i.e., Do you feel the scale provided you with an appropriate way to
respond?)
Suggested revisions: The order of questions (item 5.1, 5.2, 5.3, and 5.5) is clear. (i.e., Do you get confused as to which question to go to next?)
Suggested revisions: Additional questions are needed in the Section 5. Items needed to be added in the Section 5:

141
Section 6: Usage Time 6.1. What percentage of computing time • YES during a week do you spend
working on a laptop and a desktop computer? NO
The question is clear and understandable. Suggested revisions: The example is clear and appropriate. Suggested revisions: The scale is appropriate. (i.e., Do you feel the scale provided you with an appropriate way to
respond?)
Suggested revisions: 6.2. On average, how many years have you used any • YES laptop computer? NO The question is clear and understandable. Suggested revisions: The example is clear and appropriate. Suggested revisions: The scale is appropriate. (i.e., Do you feel the scale provided you with an appropriate way to
respond?)
Suggested revisions: 6.3. On average, how many hours per day do you use any YES laptop
computer? NO
The question is clear and understandable. Suggested revisions:

142
The example is clear and appropriate. Suggested revisions: The scale is appropriate. (i.e., Do you feel the scale provided you with an appropriate way to
respond?)
Suggested revisions: 6.4. On average, how long do you work on your laptop computer without
breaks? • YES NO
The question is clear and understandable. Suggested revisions: The example is clear and appropriate. Suggested revisions: The scale is appropriate. (i.e., Do you feel the scale provided you with an appropriate way to
respond?)
Suggested revisions: 6.5. On average, how often do you take a rest break during laptop
computing? • YES NO
The question is clear and understandable. Suggested revisions: The example is clear and appropriate. Suggested revisions:

143
The scale is appropriate. (i.e., Do you feel the scale provided you with an appropriate way to
respond?)
Suggested revisions: 6.6. How many minutes is typical rest break during laptop computing? • YES NO The question is clear and understandable. Suggested revisions: The example is clear and appropriate. Suggested revisions: The scale is appropriate. (i.e., Do you feel the scale provided you with an appropriate way to
respond?)
Suggested revisions: The order of questions (item 6.1, 6.2, 6.3, 6.4, 6.5, and 6.6) is clear. (i.e., Do you get confused as to which question to go to next?)
Suggested revisions: Additional questions are needed in the Section 6. Items needed to be added in the Section 6: Section 7: Laptop Workstation Setup 7.1. What are your TYPICAL workstation setups during laptop
computing? • YES NO
The question is clear and understandable. Suggested revisions: The example is clear and appropriate. Suggested revisions:

144
The scale is appropriate. (i.e., Do you feel the scale provided you with an appropriate way to
respond?)
Suggested revisions: 7.2. How severe is the discomfort (aching, cramping, sore,
uncomfortable, stiff, dull, pressure, burning, or shooting) you experience with the following laptop workstation setups?
• YES NO
The question is clear and understandable. Suggested revisions: The example is clear and appropriate. Suggested revisions: The scale is appropriate. (i.e., Do you feel the scale provided you with an appropriate way to
respond?)
Suggested revisions: 7.3. What is your most COMFORTABLE laptop workstation setup
during laptop computing? • YES NO
The question is clear and understandable. Suggested revisions: The example is clear and appropriate. Suggested revisions: The scale is appropriate. (i.e., Do you feel the scale provided you with an appropriate way to
respond?)
Suggested revisions:

145
The order of questions (item 7.1, 7.2, and 7.3) is clear. (i.e., Do you get confused as to which question to go to next?)
Suggested revisions: Additional questions are needed in the Section 7. Items needed to be added in the Section 7: Section 8: Overall Laptop Related Discomfort 8.1. Have you ever experienced discomfort in your neck, shoulders,
arms, hands, wrists, upper back, and trunk, during laptop computing? • YES NO
The question is clear and understandable. Suggested revisions: The example is clear and appropriate. Suggested revisions: The scale is appropriate. (i.e., Do you feel the scale provided you with an appropriate way to
respond?)
Suggested revisions: 8.2. How severe is the discomfort you usually • YES experience when working
on a laptop computer? NO
The question is clear and understandable. Suggested revisions: The example is clear and appropriate. Suggested revisions:

146
The scale is appropriate. (i.e., Do you feel the scale provided you with an appropriate way to
respond?)
Suggested revisions: The order of questions (item 8.1 and 8.2) is clear. (i.e., Do you get confused as to which question to go to next?)
Suggested revisions: Additional questions are needed in the Section 8. Items needed to be added in the Section 8: Section 9: Previous/Current Health Status 9.1. Have you ever been diagnosed or treated by a doctor for
pain/discomfort in your neck, shoulders, arms, hands, wrists, or trunk?
• YES NO
The question is clear and understandable. Suggested revisions: The example is clear and appropriate. Suggested revisions: The scale is appropriate. (i.e., Do you feel the scale provided you with an appropriate way to
respond?)
Suggested revisions: 9.2. What type of diagnosis did you receive from a doctor? • YES NO The question is clear and understandable. Suggested revisions:

147
The example is clear and appropriate. Suggested revisions: The scale is appropriate. (i.e., Do you feel the scale provided you with an appropriate way to
respond?)
Suggested revisions: 9.3. Do you smoke cigarette? • YES NO The question is clear and understandable. Suggested revisions: The example is clear and appropriate. Suggested revisions: The scale is appropriate. (i.e., Do you feel the scale provided you with an appropriate way to
respond?)
Suggested revisions: 9.4. On average, how many cigarettes did you smoke each day? • YES NO The question is clear and understandable. Suggested revisions: The example is clear and appropriate. Suggested revisions: The scale is appropriate. (i.e., Do you feel the scale provided you with an appropriate way to
respond?)
Suggested revisions:

148
9.5. Do you use other forms of tobacco, other than cigarettes? • YES NO The question is clear and understandable. Suggested revisions: The example is clear and appropriate. Suggested revisions: The scale is appropriate. (i.e., Do you feel the scale provided you with an appropriate way to
respond?)
Suggested revisions: 9.6. Is your vision corrected? • YES NO The question is clear and understandable. Suggested revisions: The example is clear and appropriate. Suggested revisions: The scale is appropriate. (i.e., Do you feel the scale provided you with an appropriate way to
respond?)
Suggested revisions: 9.7. In general, how would you describe your overall physical health? YES NO The question is clear and understandable. Suggested revisions: The example is clear and appropriate. Suggested revisions:
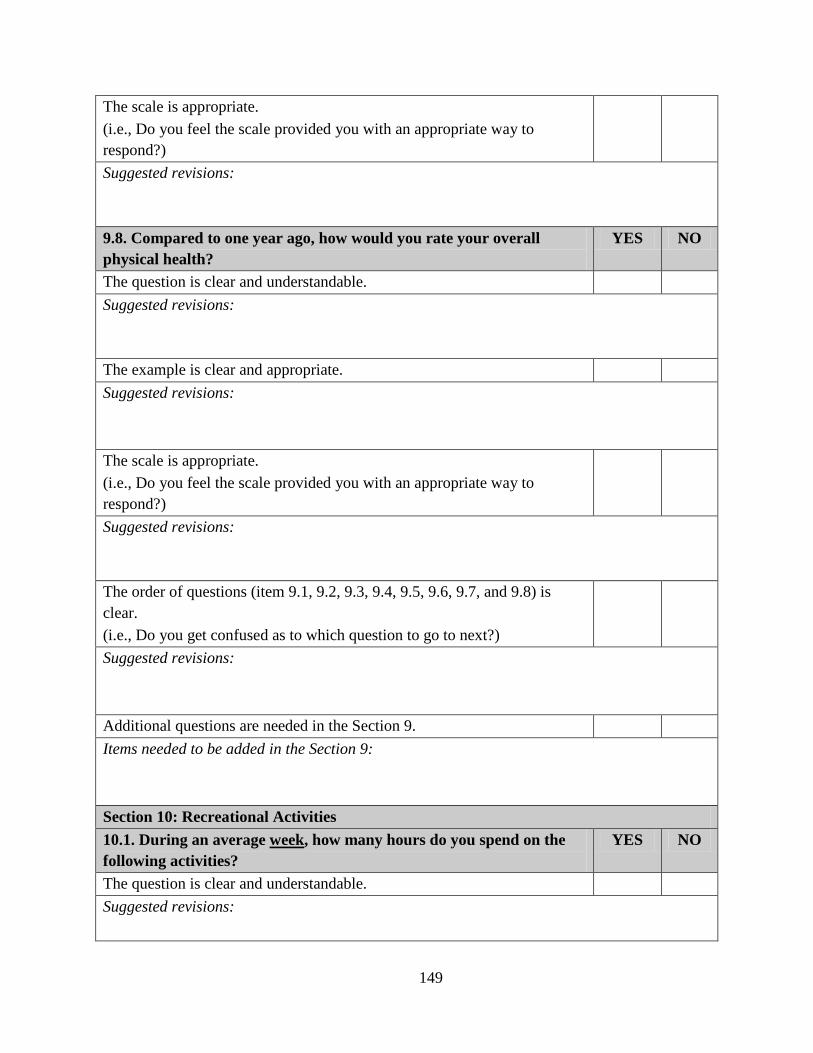
149
The scale is appropriate. (i.e., Do you feel the scale provided you with an appropriate way to
respond?)
Suggested revisions: 9.8. Compared to one year ago, how would you rate your overall
physical health? • YES NO
The question is clear and understandable. Suggested revisions: The example is clear and appropriate. Suggested revisions: The scale is appropriate. (i.e., Do you feel the scale provided you with an appropriate way to
respond?)
Suggested revisions: The order of questions (item 9.1, 9.2, 9.3, 9.4, 9.5, 9.6, 9.7, and 9.8) is
clear. (i.e., Do you get confused as to which question to go to next?)
Suggested revisions: Additional questions are needed in the Section 9. Items needed to be added in the Section 9: Section 10: Recreational Activities 10.1. During an average week • YES , how many hours do you spend on the
following activities? NO
The question is clear and understandable. Suggested revisions:

150
The example is clear and appropriate. Suggested revisions: The scale is appropriate. (i.e., Do you feel the scale provided you with an appropriate way to
respond?)
Suggested revisions: Additional questions are needed in the Section 10. Items needed to be added in the Section 10: Section 11: Student Health Related Role Functioning 11.1. In the past 2 weeks, how much difficulty have you had with the
following activities as a result of discomfort in your hands, wrists, arms, shoulders, back, or neck?
• YES NO
The question is clear and understandable. Suggested revisions: The example is clear and appropriate. Suggested revisions: The scale is appropriate. (i.e., Do you feel the scale provided you with an appropriate way to
respond?)
Suggested revisions: Additional questions are needed in the Section 11. Items needed to be added in the Section 11:

151
Section 12: Attitude Toward the Laptop Computer 12.1. In this section, we are interested in your general attitude toward
the laptop computer. How much do you agree or disagree with the following statements?
• YES NO
The question is clear and understandable. Suggested revisions:
The example is clear and appropriate. Suggested revisions:
The scale is appropriate. (i.e., Do you feel the scale provided you with an appropriate way to
respond?)
Suggested revisions: Additional questions are needed in the Section 12. Items needed to be added in the Section 12:

152
General Survey Design
Review of the Survey Design
• Yes No The font size is big enough to be read easily by respondents. Suggested revisions: The length of the survey is appropriate. (Estimated time needed to complete the survey is 20 – 30 minutes).
Suggested revisions: The survey format flow is effective. Suggested revisions:
Additional Recommendations for Improving the Quality of the Survey
Thank you again for sharing your knowledge and expertise in the validation process of the survey development.

153
APPENDIX B
SUMMARY OF THE FEEDBACKS RAISED BY THE EXPERT REVIEWERS
Specific Concerns Raised by the Expert Reviewers
in the Validation Process of the LCUSS Development
Submitted to: Expert Reviewers
Submitted by: Hyekyoung Shin
Thank you for sharing your expertise and opinion in the validation process of the survey
instrument development (i.e., Laptop Computer User Screening Survey; LCUSS). Based on your
feedback, I modified and finalized the items and designs of the LCUSS. The specific concerns
below were also reflected in final version of the LCUSS.
LCUSS Expert Panel Evaluation Form
The targeted respondent for the LCUSS will be college students. Please circle “Yes” or “No” for each of the questions below. If answer is no, please provide which items need to modify and then suggest revisions to these items.
Section 1: Demographic Information
Review of the Survey Items
• YES • NO The questions are clear and understandable. X Items needed to be modified and suggested revisions:
• “college” should be “university” From Dr. Holm
• Item 1.3: Change “or” to “and” / “inch” to “inches”

154
• Item 1.2: Change “sex” to “gender”
From Dr. Raina
• Item 1.3: Height is generally indicated as ____ft_____inches (e.g., 5' 3'')
The example is clear and appropriate. X Items needed to be modified and suggested revisions:
• Item 1.14: Include “university graduate house” as an additional example From Dr. Holm
• Item 1.14: Change “off-campus room or apartment” to “off-campus room/different
from a rented apartment”
From Dr. Baker
• Item 1.14: Not clear the difference between “off-campus room or apartment” and
“rented apartment or house”
From Dr. Raina
Item 1.12: Ask the duration of attendance for graduate school
From Young-Joo
The scale is appropriate. X Items needed to be modified and suggested revisions:
• Item 1.5: Change “check one” to “check more than one race” From Krissy
• Item 1.8: Break out the single category into separate categories
• Item 1.8: Break out the single category into separate categories From Young-Joo
The order of questions is clear. X Items needed to be modified and suggested revisions:
• Item 1.5 and 1.6: Change the order between Item 1.5 and 1.6 From Young-Joo
Additional questions are not needed in the Section 1. X Items needed to be added in the Section 1: Section 2: Location of Laptop Computer Use 2.1. Where do you use the laptop computer? • YES • NO The question is clear and understandable. X Suggested revisions:
• “the laptop computer” should be “your laptop computer” From Dr. Holm
• Not clear “your laptop computer” if it means all sort of laptop computers
From Young-Joo
The example is clear and appropriate. X Suggested revisions:

155
• Wrong word (“lap” to “lab”)
From Dr. Holm
• Include “restaurant or other eating place” and “outdoors”
From Dr. Baker
• Wrong word (“lap” to “lab”)
• Wrong word (“lap” to “lab”) From Dr. Raina
The scale is appropriate. X Suggested revisions:
• Include more space for “others” From Dr. Raina
2.2. What is the reason for selection of location to use your laptop computer?
• YES • NO
The question is clear and understandable. X Suggested revisions:
• “to use the laptop computer” should be “for use of your laptop computer” From Dr. Holm
• Change to “Please rank the following options from the most important (1) to the least
important (5) for selecting location for your laptop computer use”
From Krisssy
The example is clear and appropriate. X Suggested revisions:
• “presence of charge connection” should be “electrical outlet” From Dr. Holm
• Include “comfortable chair”
• “presence of table” are similar with “presence of chair and desk” From Dr. Baker
• “charge connection” should be “wall outlet”
From Dr. Raina
• Clarify “Location is convenient” The scale is appropriate. X Suggested revisions:
The order of questions (item 2.1 and 2.2) is clear. X Suggested revisions: Additional questions are needed in the Section 2. X Items needed to be added in the Section 2:

156
Section 3: Laptop Transportation Methods 3.1. How do you carry your laptop computer? • YES • NO The question is clear and understandable. X Suggested revisions: The example is clear and appropriate. X Suggested revisions:
• “Handed bag or briefcase” should be “Bag or briefcase with handle” From Dr. Holm
• “Rolling pull cart or wheeled cart bag” should be “Rolling backpack or briefcase” • “In a backpack” should be “in your backpack”
• “Rolling pull cart or wheeled cart bag” should be “Rolling bag or briefcase”
From Dr. Baker
• Wrong word (“lap” to “lab”)
From Dr. Raina
• “Handed bag or briefcase” should be “Bag or briefcase with handles” • “Rolling pull cart or wheeled cart bag” should be “Rolling pull cart or bag with
wheels” The scale is appropriate. X Suggested revisions: 3.2. How severe is the discomfort (aching, cramping, sore,
uncomfortable, stiff, dull, pressure, burning, or shooting) you experience with the following laptop transportation methods?
• YES • NO
The question is clear and understandable. X Suggested revisions:
• “Please circle one answer for each line” should be “Please circle one number for each line”
From Dr. Baker
• Change to “soreness, uncomfortableness, stiffness, dullness”
From Krissy
The example is clear and appropriate. X Suggested revisions:
• Match example with item 3.1 From Dr. Holm
• Match example with item 3.1
From Dr. Baker
• Match example with item 3.1
From Dr. Raina
• Include “Other” to match with item 3.1 • Move the number “0” to the left
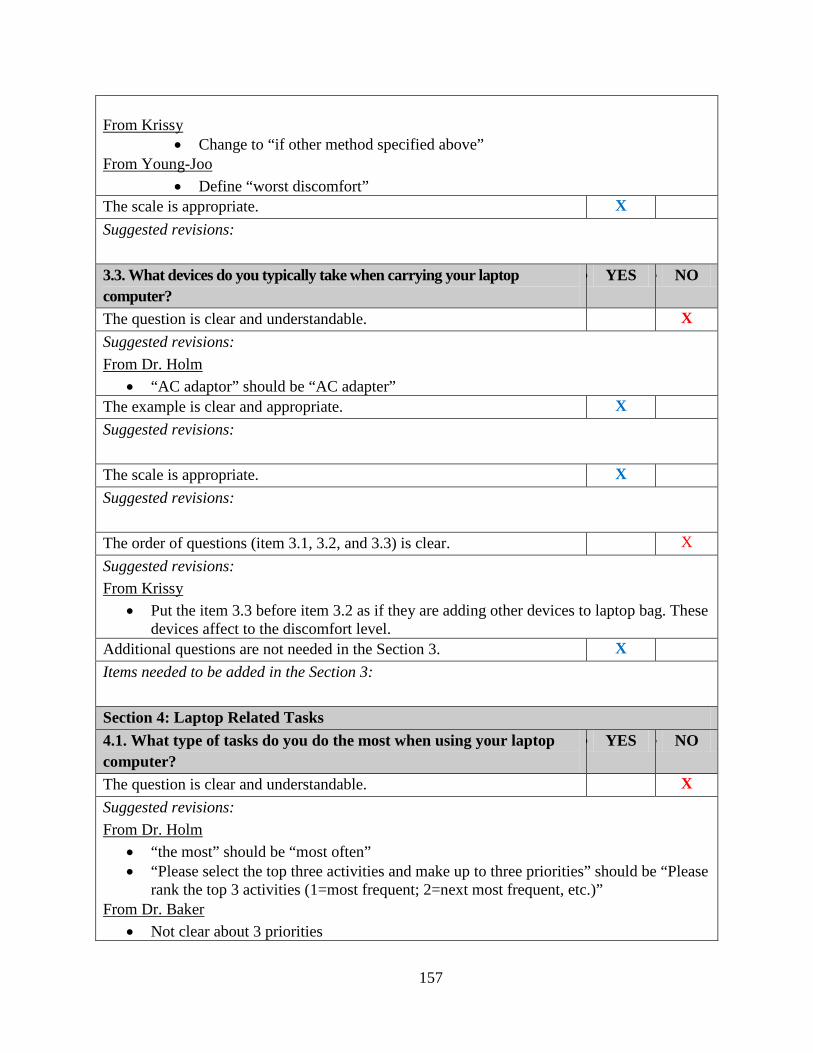
157
• Change to “if other method specified above” From Krissy
• Define “worst discomfort”
From Young-Joo
The scale is appropriate. X Suggested revisions: 3.3. What devices do you typically take when carrying your laptop
computer? • YES • NO
The question is clear and understandable. X Suggested revisions:
• “AC adaptor” should be “AC adapter” From Dr. Holm
The example is clear and appropriate. X Suggested revisions: The scale is appropriate. X Suggested revisions: The order of questions (item 3.1, 3.2, and 3.3) is clear. X Suggested revisions:
• Put the item 3.3 before item 3.2 as if they are adding other devices to laptop bag. These devices affect to the discomfort level.
From Krissy
Additional questions are not needed in the Section 3. X Items needed to be added in the Section 3: Section 4: Laptop Related Tasks 4.1. What type of tasks do you do the most when using your laptop
computer? • YES • NO
The question is clear and understandable. X Suggested revisions:
• “the most” should be “most often” From Dr. Holm
• “Please select the top three activities and make up to three priorities” should be “Please rank the top 3 activities (1=most frequent; 2=next most frequent, etc.)”
• Not clear about 3 priorities
From Dr. Baker

158
• Not clear “make up to three priorities”
From Dr. Raina
• “Please rank the top 3 activities ” should be “Choose your top 3 activities and rank
each activity”
From Krissy
The example is clear and appropriate. X Suggested revisions:
• Include “look up contacts (addresses or phone numbers),” “course web or online courses,” and “library search”
From Dr. Holm
• Delete “school research or courses”
• Not clear the difference between “check news, weather, sports” and “web surfing” From Dr. Raina
The scale is appropriate. X Suggested revisions: Additional questions are not needed in the Section 4. X Items needed to be added in the Section 4: Section 5: Laptop Specifications 5.1. What model of laptop computer do you typically use? • YES • NO The question is clear and understandable. X Suggested revisions:
• Not clear if the laptop means frequently used one or one of the laptop computers From Young-Joo
The example is clear and appropriate. X Suggested revisions: The scale is appropriate. X Suggested revisions: 5.2. What type of input device(s) do you use • YES with your laptop
computer? • NO
The question is clear and understandable. X Suggested revisions: The example is clear and appropriate. X Suggested revisions: From Krissy

159
• Add an N/A category
The scale is appropriate. X Suggested revisions: 5.3. What type of other device(s) do you use besides your laptop
computer? • YES • NO
The question is clear and understandable. X Suggested revisions: The example is clear and appropriate. X Suggested revisions:
• Include N/A category From Krissy
The scale is appropriate. X Suggested revisions: 5.4. How much does your laptop weigh, including battery? • YES • NO The question is clear and understandable. X Suggested revisions:
• “weight” should be “weigh” From Dr. Holm
• “weight” should be “weigh”
From Dr. Baker
• A both 5.2 and 5.3 are looking at input devices, so put together
From Krissy
The example is clear and appropriate. X Suggested revisions:
• Add an NA category From Krissy
The scale is appropriate. X Suggested revisions: 5.5. What is your laptop monitor size? • YES • NO The question is clear and understandable. X Suggested revisions: The example is clear and appropriate. X Suggested revisions:

160
The scale is appropriate. X Suggested revisions: The order of questions (item 5.1, 5.2, 5.3, and 5.4) is clear. X Suggested revisions: Additional questions are not needed in the Section 5. • X Items needed to be added in the Section 5:
• Include additional question if students use other devices with their laptop computers (webcam, speakers, microphone)
From Dr. Holm
Section 6: Usage Time 6.1. What percentage of computing time • YES during a week do you spend
working on a laptop and a desktop computer? • NO
The question is clear and understandable. X Suggested revisions: The example is clear and appropriate. X Suggested revisions: The scale is appropriate. X Suggested revisions: 6.2. On average, how many years have you used any • YES laptop
computer? • NO
The question is clear and understandable. X Suggested revisions: The example is clear and appropriate. X Suggested revisions:
• “year” should be “years” From Dr. Baker
The scale is appropriate. X Suggested revisions: 6.3. On average, how many hours per day do you use any • YES laptop
computer? • NO

161
The question is clear and understandable. X Suggested revisions:
The example is clear and appropriate. X Suggested revisions:
• Include “minutes” From Dr. Holm
The scale is appropriate. X Suggested revisions: 6.4. On average, how long do you work on your laptop computer without
breaks? • YES • NO
The question is clear and understandable. X Suggested revisions:
• Overlap with item 6.5 From Young-Joo
The example is clear and appropriate. X Suggested revisions:
• Include “minutes” From Dr. Holm
The scale is appropriate. X Suggested revisions: 6.5. On average, how often do you take a rest break during laptop
computing? • YES • NO
The question is clear and understandable. X Suggested revisions:
• Overlap with item 6.4 From Young-Joo
The example is clear and appropriate. X Suggested revisions: The scale is appropriate. X Suggested revisions:
• Change the scales with ½ hour intervals From Dr. Holm
From Dr. Raina
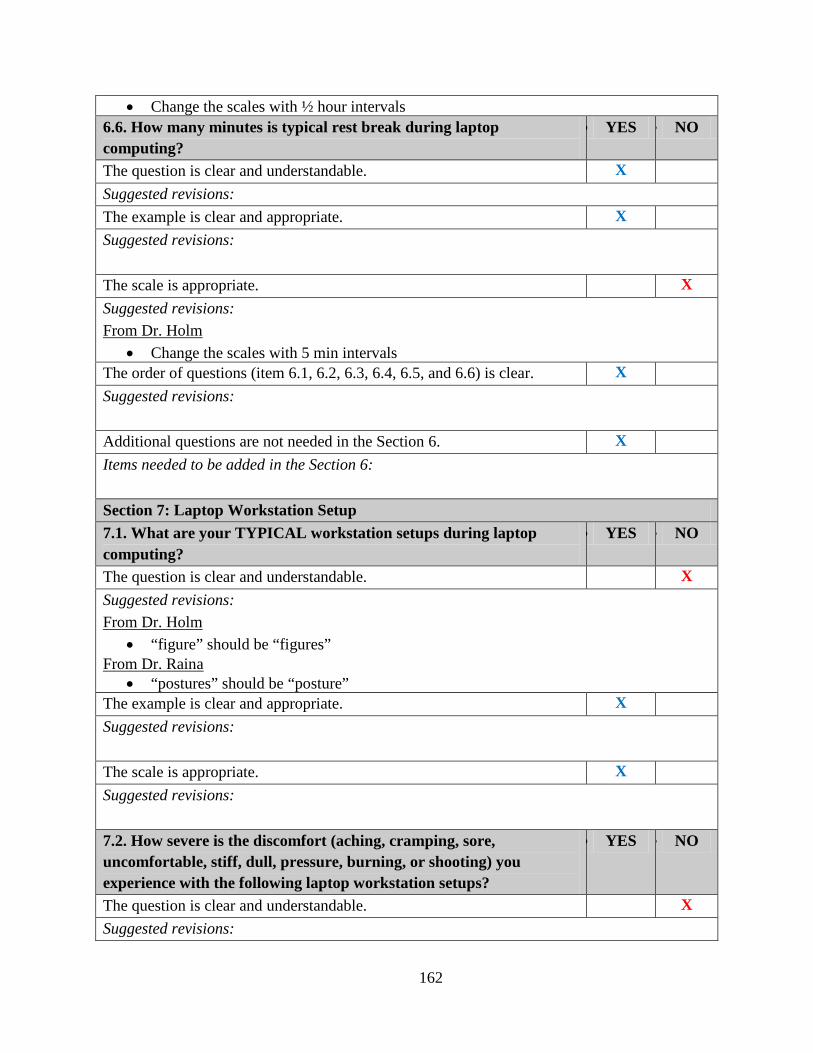
162
• Change the scales with ½ hour intervals 6.6. How many minutes is typical rest break during laptop
computing? • YES • NO
The question is clear and understandable. X Suggested revisions: The example is clear and appropriate. X Suggested revisions: The scale is appropriate. X Suggested revisions:
• Change the scales with 5 min intervals From Dr. Holm
The order of questions (item 6.1, 6.2, 6.3, 6.4, 6.5, and 6.6) is clear. X Suggested revisions: Additional questions are not needed in the Section 6. X Items needed to be added in the Section 6: Section 7: Laptop Workstation Setup 7.1. What are your TYPICAL workstation setups during laptop
computing? • YES • NO
The question is clear and understandable. X Suggested revisions:
• “figure” should be “figures” From Dr. Holm
• “postures” should be “posture”
From Dr. Raina
The example is clear and appropriate. X Suggested revisions: The scale is appropriate. X Suggested revisions: 7.2. How severe is the discomfort (aching, cramping, sore,
uncomfortable, stiff, dull, pressure, burning, or shooting) you experience with the following laptop workstation setups?
• YES • NO
The question is clear and understandable. X Suggested revisions:

163
• “transportation methods” should be “computing postures”
From Dr. Holm
• “transportation methods” should be “postures”
From Dr. Baker
The example is clear and appropriate. X Suggested revisions:
• Include “Other” to match with item 7.1 From Dr. Holm
• Include “Other” to match with item 7.1
From Dr. Raina
• Change to “if other posture specified above”
From Krissy
The scale is appropriate. X Suggested revisions:
• “Please circle one answer for each line” should be “Please circle one number for each line” From Dr. Baker
• Include the option for “NA” (“not applicable” is not the same with “no discomfort”)
From Dr. Raina
7.3. What is your most COMFORTABLE laptop workstation setup during laptop computing?
• YES • NO
The question is clear and understandable. X Suggested revisions:
• “from your most comfortable (1) to the least (6)” should be “for your most comfortable(1) to your least comfortable postures (6)”
From Dr. Holm
The example is clear and appropriate. X Suggested revisions:
• Match examples with item 7.1 From Dr. Baker
The scale is appropriate. X Suggested revisions:
• Include the option for “NA” From Dr. Raina
• Include the option for “NA”
From Krissy
• Include the option for “NA”
From Young-Joo
The order of questions (item 7.1, 7.2, and 7.3) is clear. X Suggested revisions:

164
Additional questions are not needed in the Section 7. X Items needed to be added in the Section 7: Section 8: Overall Laptop Related Discomfort 8.1. Have you ever experienced discomfort in your neck, shoulders,
arms, hands, wrists, upper back, and trunk, during laptop computing? • YES • NO
The question is clear and understandable. X Suggested revisions: The example is clear and appropriate. X Suggested revisions:
• “No” answer should be first. From Dr. Holm
The scale is appropriate. X Suggested revisions: 8.2. How severe is the discomfort you usually • YES experience when
working on a laptop computer? • NO
The question is clear and understandable. X Suggested revisions:
• “presently” should be “usually” From Dr. Baker
The example is clear and appropriate. X Suggested revisions: The scale is appropriate. X Suggested revisions: The order of questions (item 8.1 and 8.2) is clear. X Suggested revisions: Additional questions are not needed in the Section 8. X Items needed to be added in the Section 8: Section 9: Previous/Current Health Status 9.1. Have you ever been diagnosed or treated by a doctor for
pain/discomfort in your neck, shoulders, arms, hands, wrists, or trunk?
• YES • NO

165
The question is clear and understandable. X Suggested revisions: The example is clear and appropriate. X Suggested revisions:
• “No” answer should be first. From Dr. Holm
The scale is appropriate. X Suggested revisions: 9.2. What type of diagnosis did you receive from a doctor? • YES • NO The question is clear and understandable. X Suggested revisions:
• “received” should be “receive” From Dr. Holm
• “received” should be “receive”
From Dr. Raina
• Delete “treatment” The example is clear and appropriate. X Suggested revisions:
• “ligament stain” should be “ligament strain” From Dr. Holm
• “stain” should be “strain”
From Dr. Raina
• Check “tendonitis” The scale is appropriate. X Suggested revisions: 9.3. Do you smoke cigarette? • YES • NO The question is clear and understandable. X Suggested revisions:
• “cigarette” should be “cigarettes” From Krissy
The example is clear and appropriate. X Suggested revisions:
• Include “pipe” and “chewing tobacco” From Dr. Holm

166
The scale is appropriate. X Suggested revisions: 9.4. On average, how many cigarettes did you smoke each day? • YES • NO The question is clear and understandable. X Suggested revisions:
• “did” should be “do” From Krissy
• “did” should be “do”
From Young-Joo
The example is clear and appropriate. X Suggested revisions: The scale is appropriate. X Suggested revisions: 9.5. Do you use other forms of tobacco, other than cigarettes? • YES • NO The question is clear and understandable. X Suggested revisions: The example is clear and appropriate. X Suggested revisions: The scale is appropriate. Suggested revisions: 9.6. Is your vision corrected? • YES • NO The question is clear and understandable. X Suggested revisions: The example is clear and appropriate. X Suggested revisions:
• Include “corrected with surgery” From Dr. Holm
The scale is appropriate. X Suggested revisions:

167
9.7. In general, how would you describe your overall physical health? • YES • NO The question is clear and understandable. X Suggested revisions: The example is clear and appropriate. X Suggested revisions: The scale is appropriate. X Suggested revisions: 9.8. Compared to one year ago, how would you rate your overall
physical health in general now? • YES • NO
The question is clear and understandable. X Suggested revisions: The example is clear and appropriate. X Suggested revisions: The scale is appropriate. X Suggested revisions: The order of questions (item 9.1, 9.2, 9.3, 9.4, 9.5, and 9.6) is clear. X Suggested revisions: Additional questions are not needed in the Section 9. X Items needed to be added in the Section 9: Section 10: Recreational Activities 10.1. During an average week, how many hours do you spend on the
following activities? • YES • NO
The question is clear and understandable. X Suggested revisions: The example is clear and appropriate. X Suggested revisions:
• “lifting objects” should be “lifting weights” From Dr. Holm
• “assorting” should be “sorting” • “lifting carrying groceries, box or books” should be “lifting or carrying groceries,

168
boxes, or books”
• “assorting” should be “sorting” From Dr. Baker
• “lifting carrying groceries, box or books” should be “ lifting or carrying objects, such as groceries, boxes, or books”
• “assorting” should be “sorting”
From Dr. Raina
• Include “or” between “lifting” and “carrying” The scale is appropriate. X Suggested revisions: Additional questions are not needed in the Section 10. X Items needed to be added in the Section 10: Section 11: Health Related Functional role 11.1. In the past 2 weeks, how much difficulty have you had with the
following activities as a result of discomfort in your hands, wrist, arms, shoulder, back, or neck?
• YES • NO
The question is clear and understandable. X Suggested revisions:
• “If not applicable with the activity” should be “If not applicable” From Dr. Baker
The example is clear and appropriate. X Suggested revisions:
• “lifting objects” should be “lifting weights” From Dr. Holm
• “lifting carrying groceries, box or books” should be “lifting or carrying groceries, boxes, or books”
• “so difficulty” should be “so difficult”
• “assignment” should be “assignments” From Dr. Baker
• “assorting” should be “sorting”
From Dr. Raina
• “lifting objects” should be “lifting weights” • Include “NA” box
The scale is appropriate. X Suggested revisions:
Additional questions are not needed in the Section 11. X Items needed to be added in the Section 11:
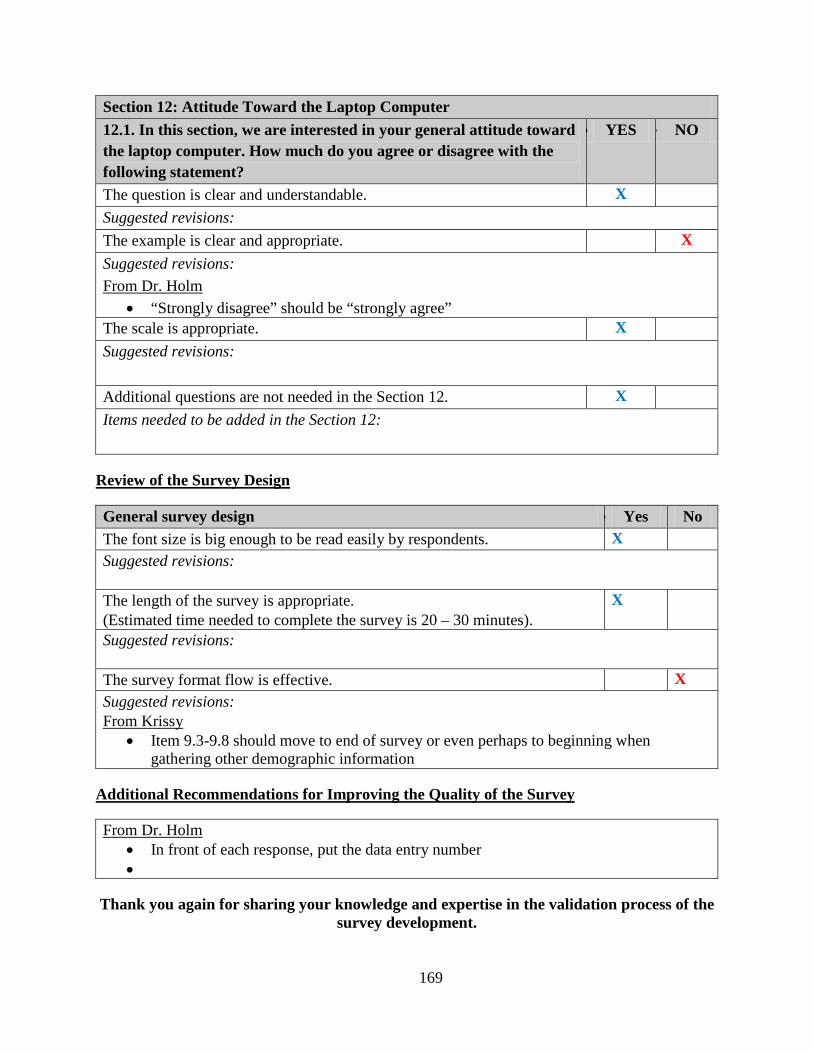
169
Section 12: Attitude Toward the Laptop Computer 12.1. In this section, we are interested in your general attitude toward
the laptop computer. How much do you agree or disagree with the following statement?
• YES • NO
The question is clear and understandable. X Suggested revisions: The example is clear and appropriate. X Suggested revisions:
• “Strongly disagree” should be “strongly agree” From Dr. Holm
The scale is appropriate. X Suggested revisions: Additional questions are not needed in the Section 12. X Items needed to be added in the Section 12:
General survey design
Review of the Survey Design
• Yes No The font size is big enough to be read easily by respondents. X Suggested revisions: The length of the survey is appropriate. (Estimated time needed to complete the survey is 20 – 30 minutes).
X
Suggested revisions: The survey format flow is effective. X Suggested revisions:
• Item 9.3-9.8 should move to end of survey or even perhaps to beginning when gathering other demographic information
From Krissy
Additional Recommendations for Improving the Quality of the Survey
• In front of each response, put the data entry number From Dr. Holm
•
Thank you again for sharing your knowledge and expertise in the validation process of the survey development.

170
APPENDIX C
TEST-RETEST RELIABILITY OF THE LCUSS: INTRA-CLASS CORRELATION
ANALYSIS OF THE LCUSS
# LCUSS items ICCs 95% CI p Single
measures Lower Upper
2.1 % Location – Library 0.93 0.81 0.98 < .001 % Location – Campus classroom 1.00 1.00 1.00 < .001 % Location – Campus computer lab 0.76 0.43 0.91 < .001 % Location – Home 0.83 0.57 0.94 < .001 % Location – Café or restaurant 0.95 0.87 0.98 < .001 % Location – Outdoor places 0.89 0.69 0.96 < .001 % Location – Transportation 0.62 0.17 0.85 .01 % Location – Office 0.76 0.42 0.91 < .001 % Location – Friend’s house 1.00 1.00 1.00 < .001 3.3 Discomfort – Bag or briefcase with handle 0.56 0.09 0.83 .01 Discomfort – Over the shoulder bag 0.61 0.16 0.85 .01 Discomfort – Rolling bag or briefcase 0.01 -0.49 0.51 .49 Discomfort – In your backpack 0.91 0.76 0.97 < .001 6.1 % laptop computer usage time 0.94 0.83 0.98 < .001 % desktop computer usage time 0.94 0.83 0.98 < .001 6.2 Length of years having a laptop computer 0.99 0.97 1.00 < .001 6.3 Duration of daily laptop computer use 0.92 0.78 0.97 < .001 6.4 Duration of continuous laptop computer use 0.74 0.38 0.90 < .001

171
Table (Continued).
# LCUSS items ICCs 95% CI p Single
measures Lower Upper
7.1 % Posture – Desktop sitting 0.98 0.95 0.99 < .001 % Posture – Lying prone 0.85 0.61 0.95 < .001 % Posture – Lying supine 0.97 0.93 0.99 < .001 % Posture – Floor sitting 0.98 0.94 0.99 < .001 % Posture – Chair sitting 0.97 0.91 0.99 < .001 % Posture – Lap sitting 1.00 0.99 1.00 < .001 7.2 Discomfort – Desktop sitting 0.79 0.48 0.92 < .001 Discomfort – Lying prone 0.96 0.90 0.99 < .001 Discomfort – Lying supine 0.80 0.50 0.93 < .001 Discomfort – Floor sitting 0.81 0.53 0.93 < .001 Discomfort – Chair sitting 0.54 0.06 0.82 .02 Discomfort – Lap sitting 0.79 0.48 0.92 < .001 8.2 Overall discomfort – Neck 0.93 0.82 0.98 < .001 Overall discomfort – Rt. shoulder 0.84 0.58 0.94 < .001 Overall discomfort – Lt. shoulder 0.81 0.53 0.93 < .001 Overall discomfort – Rt. upper arm 0.54 0.06 0.82 .02 Overall discomfort – Lt. upper arm 0.53 0.05 0.81 .02 Overall discomfort – Rt. lower arm 0.66 0.24 0.87 < .001 Overall discomfort – Lt. lower arm 0.81 0.53 0.93 < .001 Overall discomfort – Rt. hand/wrist 0.85 0.62 0.95 < .001 Overall discomfort – Lt. hand/wrist 0.92 0.78 0.97 < .001 Overall discomfort – Upper back 0.97 0.90 0.99 < .001 Overall discomfort – Lower back 0.93 0.81 0.98 < .001 Note. ICCs = Intra-class correlation coefficients; CI = Confidence interval; Rt. = Right; Lt. = Left; Bold indicates significant items

172
APPENDIX D
TEST-RETEST RELIABILITY OF THE LCUSS: KAPPA STATISTICS OF THE LCUSS
# LCUSS items Kappa p 2.2 Accessibility of wireless internet 0.65 < .001 Presence of electrical outlet 1.00 < .001 Presence of chair and desk 0.60 < .001 presence of comfortable chair 0.73 < .001 Location is convenient 0.66 < .001 Size or weight of laptop 1.00 < .001 3.1 Carrying type: Bag with handle 0.71 < .001 Carrying type: Over the shoulder bag 0.73 .01 Carrying type: Rolling bag 1.00 < .001 Carrying type: In your backpack 1.00 < .001 3.2 Carrying device: External mouse 0.61 .01 Carrying device: AC adapter 1.00 < .001 Carrying device: External battery 1.00 < .001 Carrying device: External keyboard 1.00 < .001 Carrying device: External disk drive 0.63 .01 Carrying device: Extension cord 1.00 < .001

173
Table (Continued).
# LCUSS items Kappa p 4.1 Laptop related tasks: Word processing 0.73 < .001 Laptop related tasks: Presentation 1.00 < .001 Laptop related tasks: Analysis or spreadsheets 1.00 < .001 Laptop related tasks: CourseWeb 0.85 < .001 Laptop related tasks: Library search 1.00 < .001 Laptop related tasks: Web surfing 1.00 < .001 Laptop related tasks: Scheduling 1.00 < .001 Laptop related tasks: Look up contacts 1.00 < .001 Laptop related tasks: Communication 1.00 < .001 Laptop related tasks: Shopping 1.00 < .001 Laptop related tasks: Check news, weather 1.00 < .001 Laptop related tasks: Check email 1.00 < .001 Laptop related tasks: Watch movies or videos 1.00 < .001 Laptop related tasks: Pay bills 1.00 < .001 Laptop related tasks: Play games 1.00 < .001 5.1 Laptop model 1.00 < .001 5.2 Input device: Mouse 0.67 .01 Input device: Trackball 1.00 < .001 Input device: Joystick 1.00 < .001 Input device: Touch pad 0.67 .01 Input device: Track point 0.44 .04 Input device: Keyboard 0.33 .09 Input device: Numeric keypad 1.00 < .001 5.3 Other device: Webcam 1.00 < .001 Other device: Speakers 1.00 < .001 Other device: Microphones 1.00 < .001 Other device: Earphone 0.60 .01 5.4 Laptop weight 1.00 < .001 5.5 Monitor size 1.00 < .001 6.5 Typical rest break 1.00 < .001

174
Table (Continued).
# LCUSS items Kappa p 7.3 Comfortable posture: Desktop sitting 1.00 < .001 Comfortable posture: Lying prone 0.91 < .001 Comfortable posture: Lying supine 0.83 < .001 Comfortable posture: Floor sitting 1.00 < .001 Comfortable posture: Chair sitting 0.74 < .001 Comfortable posture: Lap sitting 0.59 < .001 9.1 SHRRF: Type 10 pages 0.91 < .001 SHRRF: Complete assignment on time 0.74 < .001 SHRRF: Do assignment as well as you like 1.00 < .001 SHRRF: Handwritten assignment 1.00 < .001 SHRRF: Email with others 0.81 < .001 SHRRF: Take notes in class by hand 1.00 < .001 SHRRF: Take timed written examinations 1.00 < .001 SHRRF: Use the moue 1.00 < .001 SHRRF: Carry book around campus 0.71 < .001 SHRRF: Sports activities 1.00 < .001 SHRRF: Play musical instruments 1.00 < .001 SHRRF: Play video games 0.78 < .001 SHRRF: Use of mobile phones 1.00 < .001 SHRRF: Lab activities 0.48 .03 SHRRF: Intensive hand related activities 0.69 < .001 SHRRF: Lifting or carrying groceries, box, books 1.00 < .001 10.1 Attitude Toward Laptop Computer: Easier 1.00 < .001 Attitude Toward Laptop Computer: Enjoyable 0.65 < .001 Attitude Toward Laptop Computer: Help me interact 0.80 < .001 Attitude Toward Laptop Computer: Easier to take notes 0.80 < .001 Attitude Toward Laptop Computer: Organize class notes 0.75 < .001 Attitude Toward Laptop Computer: Distraction in class 0.37 .01 Attitude Toward Laptop Computer: Rarely use 0.61 < .001 Attitude Toward Laptop Computer: Do not enjoy 1.00 < .001 Attitude Toward Laptop Computer: Frustrate me 0.41 .03

175
Table (Continued).
# LCUSS items Kappa p 11.1 Recreational activities: Sports activities 0.90 < .001 Recreational activities: Play a musical instruments 1.00 < .001 Recreational activities: Play video games 1.00 < .001 Recreational activities: Use mobile phone .80 < .001 Recreational activities: Laboratory activities 1.00 < .001 Recreational activities: Intensive hand related activities .49 < .001 Recreational activities: Lifting or carrying groceries, boxes 1.00 < .001 12.6 Vision correction 1.00 < .001 12.7 Overall physical health 0.89 < .001 12.8 Comparison to the last year for the overall physical health 1.00 < .001 Note. SHRRF = Student Health Related Role Functioning; Bold indicates significant items

176
APPENDIX E
LAPTOP COMPUTER USER SCREENING SURVEY
Section 1 Demographic Information
1.1. Date of Birth_________________________
1.2. Gender (Check one) (1)__________Male (2)
1.3. Height___________ft. (and)____________inches
__________Female
1.4. Weight___________lbs.
1.5. Ethnicity (Check one) (1)__________Hispanic or Latino (2)
1.6. Race (Check all that apply)
__________Non Hispanic or Latino
(1)__________American Indian or Alaska Native (2)__________Asian (3)__________Black or African American (4)__________Native Hawaiian or Other Pacific Islander (5)__________White or Caucasian (6)__________Other (Specify_________________________________________________)

177
1.7. Dominant Hand (Check one) (1)__________Right (2)__________Left (3)
1.8. Marital Status (Check one)
__________Both
(1)__________Never Married (2)__________Married (3)__________Divorced (4)__________Widowed (5)
1.9. What is your current enrollment status at the university? (Check one)
__________Separated
(1)__________Full time student (2)
1.10. What year did you first enter the university? ______________________year
__________Part time student
1.11. What year do you anticipate graduating? ______________________year
1.12. What is your class level? (Check one) (1)__________Freshman (2)__________Sophomore (3)__________Junior (4)__________Senior (5)__________Graduate or professional student (masters, doctoral, and post doctoral program) (6)__________Special student (non-degree program) (7)
1.13. What is your residence classification at the university? (Check one)
__________Other (Specify_________________________________________________)
(1)__________In-state student (2)__________Out-of-state student (3)__________International student (not a U.S. citizen)

178
1.14. Indicate your current university residence (Check one) (1)__________University residence hall (2)__________Fraternity or sorority house (3)__________University married student housing (4)__________University graduate housing (5)__________University-owned house or apartments (6)__________Rented house or apartment (7)__________Home of parents, guardians, or relatives (8)__________Personally-owned home (9)
__________Other (Specify_________________________________________________)
Section 2 Location of Laptop Computer Use 2.1. Where do you use your laptop computer? Please assign a percentage for each item.
The total should equal 100%. (1)__________% Library (2)__________% Campus classroom (3)__________% Campus computer lab (4)__________% Home (5)__________% Café or restaurant (6)__________% Outdoor places (yard, lawn, or street) (7)__________% Transportation (in bus, car, or plane) (8)
100 % Total
__________% Other (Specify_______________________________________________)
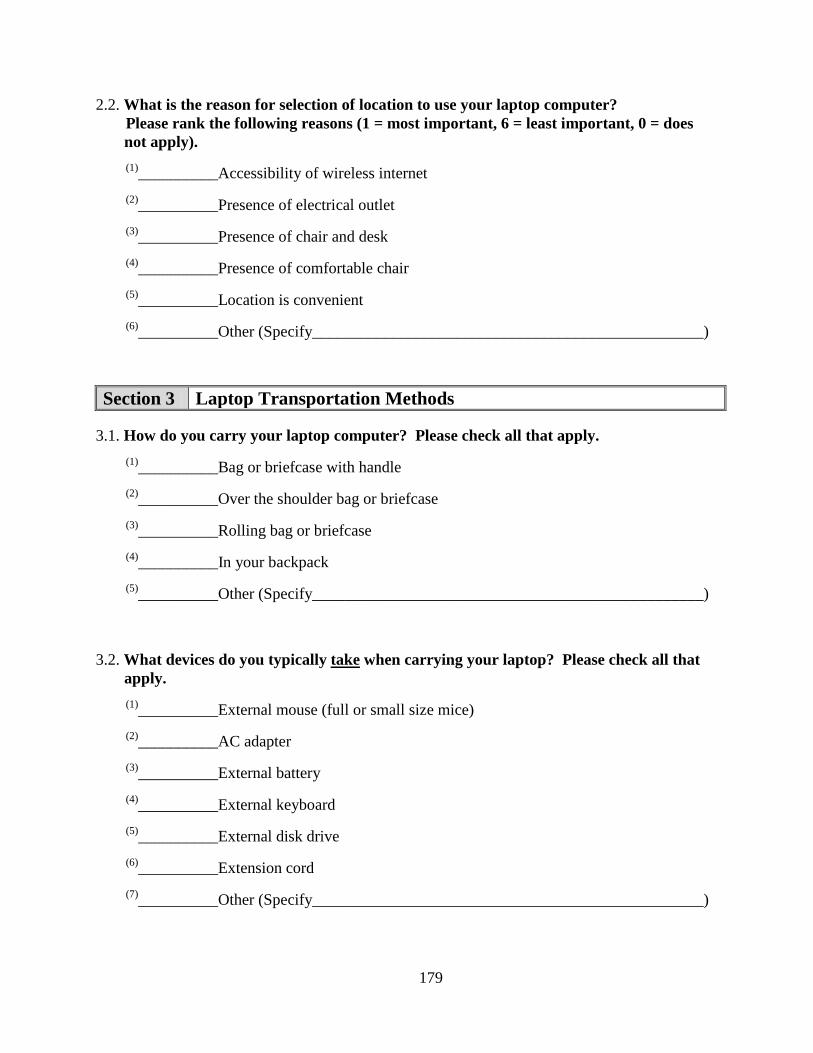
179
2.2. What is the reason for selection of location to use your laptop computer? Please rank the following reasons (1 = most important, 6 = least important, 0 = does not apply). (1)__________Accessibility of wireless internet (2)__________Presence of electrical outlet (3)__________Presence of chair and desk (4)__________Presence of comfortable chair (5)__________Location is convenient (6)
__________Other (Specify_________________________________________________)
Section 3 Laptop Transportation Methods 3.1. How do you carry your laptop computer? Please check all that apply.
(1)__________Bag or briefcase with handle (2)__________Over the shoulder bag or briefcase (3)__________Rolling bag or briefcase (4)__________In your backpack (5)
__________Other (Specify_________________________________________________)
3.2. What devices do you typically take when carrying your laptop? Please check all that apply. (1)__________External mouse (full or small size mice) (2)__________AC adapter (3)__________External battery (4)__________External keyboard (5)__________External disk drive (6)__________Extension cord (7)__________Other (Specify_________________________________________________)

180
3.3. How severe is the discomfort (aching, cramping, sore, uncomfortable, stiff, dull, pressure, burning, or shooting) you experience with the following laptop transportation methods? Please mark an “X”If not applicable, please check “N/A”
on each line, which most closely describes your discomfort.
(1) N/A No Discomfort Unbearable Discomfort Bag or briefcase with handle
(2) N/A No Discomfort Unbearable Discomfort Over the shoulder bag or briefcase
(3) N/A No Discomfort Unbearable Discomfort Rolling bag or briefcase
(4)
N/A No Discomfort Unbearable Discomfort In your backpack
(5)
(If other method specified in #3.1)
Other N/A No Discomfort Unbearable Discomfort
Section 4 Laptop Related Tasks
4.1. What types of tasks do you do most often when using your laptop? Please rank your top 3 activities (1 = most frequent, 3 = least frequent). (1) __________Word processing (word-related tasks) (2) __________Presentations (Power Point slide creation) (3) __________Analysis or spreadsheets (Excel, Lotus, Quattro Pro, etc.) (4) __________CourseWeb or online courses (5) __________Library search (6) __________Web surfing to collect work related resources (assignment or research) (7) __________Scheduling (schedule using the calendar) (8) __________Look up contacts (addresses or phone numbers) (9) __________Communication with others (internet chat, MSN, chat room, etc.) (10)__________Shopping (11)__________Check news, weather, sports, etc. (12)__________Check e-mail

181
(13)__________Watch movies or videos (14)__________Pay bills (15)__________Play games (16)
__________Other (Specify_______________________________________________)
Section 5 Laptop Specifications
5.1. What model of laptop computer do you typically use? Please check one. (1) __________Apple Mac (2)__________Sony (3) __________Lenovo (IBM) (4)__________Gateway (5) __________Dell (6)__________Toshiba (7) __________HP (8)__________Compaq (9) __________Samsung (10)
__________Other (Specify_______________________________________________)
5.2. What type of input devices do you use with your laptop computer? Please check all that apply. (1)__________Mouse (2)__________Trackball (3)__________Joystick (4)__________Touch pad (5)__________Track point (6)__________Keyboard (7)__________Numeric keypad (8)
__________Other (Specify_______________________________________________)
5.3. What type of other devices do you use with your laptop computer? Please check all that apply. (1)__________Webcam (2)__________Speakers (3)__________Microphones (4)__________Other (Specify__________________________________________________)

182
5.4. How much does your laptop weigh, including battery? Please check one. (1)__________Less than 2.5 Ibs. (Netbook or subnotebook) (2)__________2.6 – 4.9 Ibs. (Ultraportable) (3)__________5 – 6.9 Ibs. (Thin and light) (4)
__________7 Ibs. or more (Desktop replacement)
5.5. What is your laptop monitor size? (Monitor size is measured diagonally in inches) Please check one.
(1)__________Less than 12 inches
(2)__________12 – 12.9 inches
(3)__________13 – 13.9 inches
(4)__________14 – 14.9 inches
(5)__________15 – 15.9 inches
(6)__________16 – 16.9 inches
(7)
__________17 inches or more
Section 6 Usage Time
6.1. What percentage of computing time during a week do you spend working on a laptop and a desktop computer? Please assign a percentage for each item. The total should equal 100%. (1)__________% Laptop computer (2)
100 % Total
__________% Desktop computer
6.2. On average, how many years have you used any
6.3. On average, how many hours per day do you use
laptop computer? _____________years
any
________________hours ________________minutes
laptop computer?

183
6.4. On average, how long do you work on your laptop computer without
________________hours ________________minutes
rest breaks?
6.5. On average, how many minutes is a typical rest break during laptop computing? Please check one. (1)__________None (2)__________< 5 min (3)__________5 – 10 min (4)__________11 – 15 min (5)__________16 – 20 min (6)__________21 – 25 min (7)__________26 – 30 min (8)
__________> 30 min
Section 7 Laptop Workstation Setup
7.1. What are your TYPICAL workstation setups during laptop computing? Please see following figures. The percentages should total 100%.
(1)__________% Sitting with laptop on desk (2)__________% Lying prone (3)__________% Lying supine (4)__________% Floor sitting (5)__________% Chair sitting (6)__________% Sitting with laptop on the lap (7)
100 % Total
__________% Other (Specify_______________________________________________)

184
7.2. How severe is the discomfort (aching, cramping, sore, uncomfortable, stiff, dull, pressure, burning, or shooting) you experience with the following laptop workstation setups? Please mark an “X”
(1) Sitting with laptop on desk
on each line. If not applicable, please check “N/A”
N/A No Discomfort Unbearable Discomfort
(2)
Lying prone N/A No Discomfort Unbearable Discomfort
(3) Lying supine N/A No Discomfort Unbearable Discomfort
(4)
Floor sitting N/A No Discomfort Unbearable Discomfort
(5)
Chair sitting N/A No Discomfort Unbearable Discomfort
(6) N/A No Discomfort Unbearable Discomfort Sitting with laptop on the lap
(7)
(If other posture specified in #7.1)
Other N/A No Discomfort Unbearable Discomfort
7.3. What is your most COMFORTABLE workstation setup during laptop computing? Please rank the following postures (1 = most comfortable, 6 = least comfortable, 0 = does not apply). (1)__________Sitting with laptop on desk (2)__________Lying prone (3)__________Lying supine (4)__________Floor sitting (5)__________Chair sitting (6)__________Sitting with laptop on the lap (7)
Section 8
__________Other (Specify_______________________________________________)
Overall Laptop Related Discomfort
8.1. Have you ever experienced discomfort in your neck, shoulders, arms, hands, wrists, upper back, and trunk, during laptop computing? (1)__________No (Please go to Section 9) (2)
__________Yes (Please answer 8.2)

185
8.2. How severe is the discomfort you usually experience when working on a laptop computer? Please mark an “X” on each line, which most closely describes your discomfort for each body region.
Section 9 Student Health Related Role Functioning 9.1. In the past 2 weeks
Please circle
, how much difficulty have you had with the following activities as a result of discomfort in your hands, wrists, arms, shoulders, back, or neck?
one response for each line.

186
Section 10 Attitude Toward the Laptop Computer 10.1. In this section, we are interested in your general attitude toward the laptop computer.
How much do you agree or disagree with the following statements? Please check one response
for each question.
Section 11 Recreational Activities
11.1. During an average week, how many hours do you spend on the following activities?
Please check one response for each question.

187
Section 12 Previous/Current Health Status
12.1. Have you ever been diagnosed or treated by a doctor for pain/discomfort in your neck, shoulders, arms, hands, wrists, or trunk? (1)__________No (Please go to 12.3) (2)
__________Yes (Please answer 12.2)
12.2. What type of diagnosis did you receive from a doctor? Please check all that apply. (1)________Muscle spasm or sprain (2) ________Tendonitis (3)________Ruptured or herniated disk in back (4) ________Thoracic outlet syndrome (5)________Ruptured or herniated disk in neck (6) ________Ligament strain (7)________Lower back pain (8) ________Tennis elbow (9)________Pinched nerve (10)________Tenosynovitis (11)_______Carpal tunnel syndrome (12)________Bursitis (13)
_______Other (Specify_________________________________________________)
12.3 Do you smoke cigarettes? (1)__________No (Please go to 12.5) (2)
__________Yes (Please answer 12.4)
12.4. On average, how many cigarettes do you smoke each day? Please check one. (1)__________1 cigarette (2)__________2 – 5 cigarettes (3)__________6 – 10 cigarettes (4)__________11 –15 cigarettes (5)__________16 – 20 cigarettes (6)__________between one and two packs (7)
__________More than two packs
12.5. Do you use other forms of tobacco, other than cigarettes? (1)__________No (2)__________I smoke a pipe (3)__________I use snuff (4)
__________I chew tobacco

188
12.6. Is your vision corrected? (1)__________Uncorrected vision (2)__________Corrected with contact lenses (3)__________Corrected with glasses (4)
__________Corrected with surgery
12.7. In general, how would you describe your overall physical health? (1)__________Excellent (2)__________Good (3)__________Fair (4)
__________Poor
12.8. Compared to one year ago, how would you rate your overall physical health? (1)__________Much better now than one year ago (2)__________Somewhat better now than one year ago (3)__________About the same as one year ago (4)__________Somewhat worse now than one year ago (5)__________Much worse now than one year ago
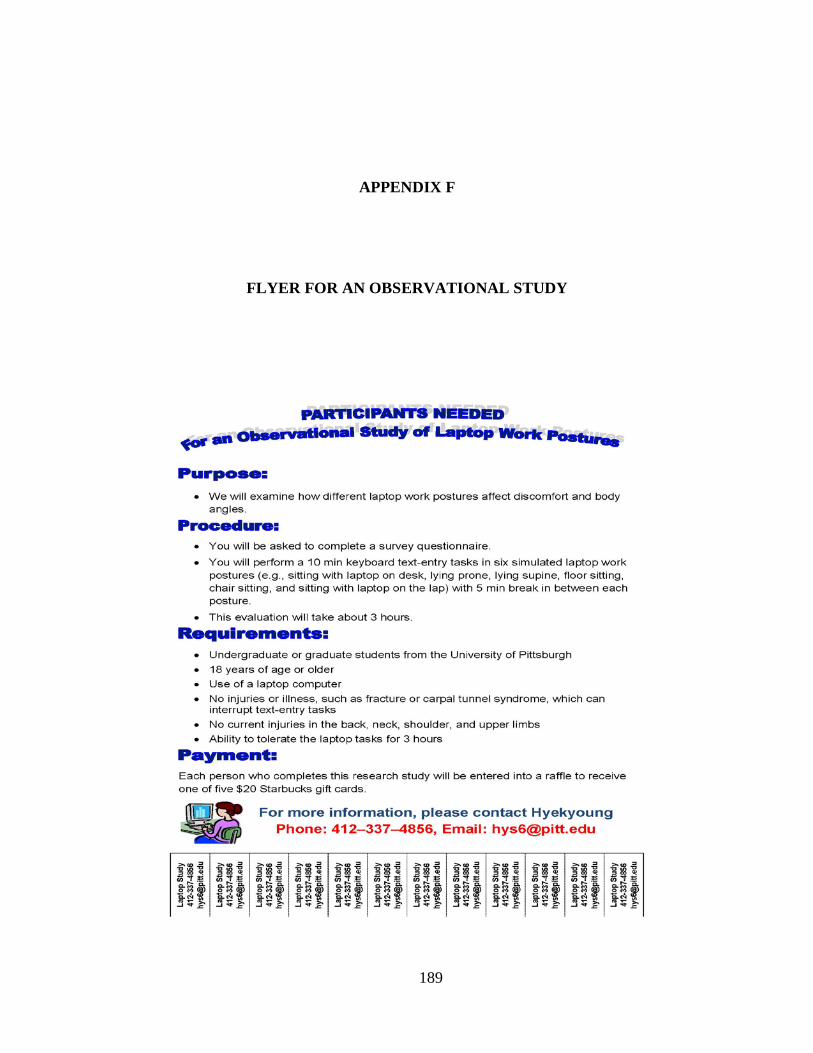
189
APPENDIX F
FLYER FOR AN OBSERVATIONAL STUDY

190
APPENDIX G
RESEARCH INVITATION LETTER

191

192
APPENDIX H
SCATTER PLOT OF LINEAR RELATIONSHIP BETWEEN DURATION OF LAPTOP
USE AND AVERAGE LAPTOP-RELATED DISCOMFORT

193
APPENDIX I
SCATTER PLOT OF LINEAR RELATIONSHIP BETWEEN PERCENTAGE OF TIME
SPENT IN A LAPTOP WORKSTATION SETUP AND AVERAGE LAPTOP-RELATED
DISCOMFORT

194

195
APPENDIX J
MEASURED ANGLES IN SIX SIMULATED LAPTOP WORKSTATION SETUPS
BETWEEN IMAGEJ AND GONIOMETER

196

197

198
APPENDIX K
DISCOMFORT RATING CHART

199
APPENDIX L
POST-HOC ANALYSIS OF ANGLES BETWEEN THE THREE LAPTOP
WORKSTATION SETUPS
Postural angle (deg) Post-hoc analysis Mean difference pNeck angle
c
Desktop sitting vs. Lying supine 10.8 < .001 Desktop sitting vs. Chair sitting -9.5 < .001 Lying supine vs. Chair sitting -20.3 < .001
Rt. shoulder angleα
Desktop sitting vs. Lying supine 25.7 < .001
Desktop sitting vs. Chair sitting 21.7 .02 Lying supine vs. Chair sitting -4.0 < .001
Lt. shoulder angle
α Desktop sitting vs. Lying supine 27.0 < .001 Desktop sitting vs. Chair sitting 21.9 < .001 Lying supine vs. Chair sitting -5.2 < .001
Rt. wrist angle
α Desktop sitting vs. Lying supine -5.1 .03 Desktop sitting vs. Chair sitting 2.9 .17 Lying supine vs. Chair sitting 7.9 < .001
Lt. wrist angleα
Desktop sitting vs. Lying supine -7.8 < .001
Desktop sitting vs. Chair sitting 4.1 .07 Lying supine vs. Chair sitting 11.9 < .001

200
Table (Continued).
Postural angle (deg) Post-hoc analysis Mean difference p
Rt. ulnar/radial deviation
c
b Desktop sitting vs. Lying supine -5.1 < .001 Desktop sitting vs. Chair sitting -7.1 < .001 Lying supine vs. Chair sitting -2.0 .01
Lt. ulnar/radial deviation
b Desktop sitting vs. Lying supine -4.8 < .001 Desktop sitting vs. Chair sitting -6.2 < .001 Lying supine vs. Chair sitting -1.5 .05
Thoracic bend angle Desktop sitting vs. Lying supine α 17.8 < .001 Desktop sitting vs. Chair sitting 8.9 < .001 Lying supine vs. Chair sitting -9.0 < .001
Trunk angle Desktop sitting vs. Lying supine α -33.9 < .001 Desktop sitting vs. Chair sitting -9.5 < .001 Lying supine vs. Chair sitting 24.4 < .001
View angle Desktop sitting vs. Lying supine 6.8 .02 Desktop sitting vs. Chair sitting -17.7 < .001 Lying supine vs. Chair sitting -24.6 < .001
Note. Rt. = Right; Lt. = Left; aThe plus sign (+) indicates flexion and the minus sign (–) indicates extension; bThe plus sign (+) indicates ulnar deviation of the wrist and the minus sign (–) indicates radial deviation of the wrist; c
Statistical significance was set at p < .05; Bold indicates significant items

201
APPENDIX M
COMPARISON OF K-PECS AND ANOVA SUMMARY BETWEEN THREE LAPTOP
WORKSTATION SETUPS
K-PeCS items
Mean rank χ
2 df
pDesktop
sitting
a Lying supine
Chair sitting
Torso angle 2.7 1.3 2.1 42.20 2 < .001
Back rest use 2.5 1.5 2.0 28.53 2 < .001
Head flexion angle 1.3 2.5 2.3 41.61 2 < .001
Rt. shoulder flexion angle 2.7 1.6 1.7 42.09 2 < .001
Lt. shoulder flexion angle 2.7 1.6 1.6 44.00 2 < .001
Rt. elbow flexion angle 2.0 2.1 1.9 1.86 2 .40
Lt. elbow flexion angle 2.0 2.0 2.0 0.11 2 .95
Forearm support use 1.7 2.1 2.3 10.66 2 < .001
Rt. wrist support use 2.1 1.8 2.1 6.23 2 .04
Lt. wrist support use 2.1 1.9 2.1 3.90 2 .14
Rt. wrist/hand movement 1.9 2.1 2.0 4.33 2 .12
Lt. wrist/hand movement 1.9 2.1 2.0 4.31 2 .12
Force 2.1 1.9 2.0 1.75 2 .42

202
Table (Continued).
K-PeCS items
Mean rank χ
2 df
pDesktop
sitting
a Lying supine
Chair sitting
Rt. ulnar angle > 20° 1.6 2.2 2.3 17.03 2 < .001
Lt. ulnar angle > 20° 1.5 2.3 2.2 19.97 2 < .001
Rt. wrist extension > 15° 1.7 1.7 2.6 18.27 2 < .001
Lt. wrist extension > 15° 1.9 1.8 2.4 8.91 2 .01
Rt. changes in pronation 1.9 2.1 2.1 4.50 2 .11
Lt. changes in pronation 2.0 2.0 2.0 2.00 2 .37
Rt. isolated 5th 1.9 digit 2.3 1.9 10.67 2 < .001
Lt. isolated 5th 1.8 digit 2.1 2.1 5.21 2 .07
Rt. isolated thumb 2.0 2.0 2.0 2.00 2 .37
Lt. isolated thumb 1.9 2.1 2.1 3.00 2 .22
Space bar activation 2.0 2.0 2.0 0.00 2 1.00
Rt. # of digits used to type 2.0 2.0 2.0 0.00 2 1.00
Lt. # of digits used to type 2.0 2.0 2.0 0.00 2 1.00
R-3 MCP hyperextension 2.0 2.1 2.0 1.63 2 .44
R-4 MCP hyperextension 1.9 2.0 2.2 3.50 2 .17
R-5 MCP hyperextension 1.9 2.1 2.0 2.04 2 .36
L-3 MCP hyperextension 1.9 2.2 1.9 10.75 2 < .001
L-4 MCP hyperextension 1.6 2.2 2.2 11.56 2 < .001
L-5 MCP hyperextension 1.5 2.3 2.2 22.46 2 < .001

203
Table (Continued).
K-PeCS items
Mean rank χ
2 df
pDesktop
sitting
a Lying supine
Chair sitting
R-3 PIP/DIP curve 2.0 2.0 2.0 2.00 2 .37
R-4 PIP/DIP curve 2.0 2.0 2.0 2.00 2 .37
R-5 PIP/DIP curve 2.0 2.0 2.0 0.00 2 1.00
L-3 PIP/DIP curve 2.0 2.0 2.0 0.00 2 1.00
L-4 PIP/DIP curve 2.0 2.0 2.0 0.00 2 1.00
L-5 PIP/DIP curve 2.0 2.1 2.0 3.00 2 .22
Rt. hypermobility 2.0 2.0 2.0 0.00 2 1.00
Rt. hypermobility 2.0 2.0 2.0 2.00 2 .37
Note. Rt. = Right; Lt. = Left; MCP = Metacarpophalangeal joints; PIP = Proximal interphalangeal joints; DIP = Distal interphalangeal joints; a
Statistical significance was set at p < .05; Bold indicates significant items
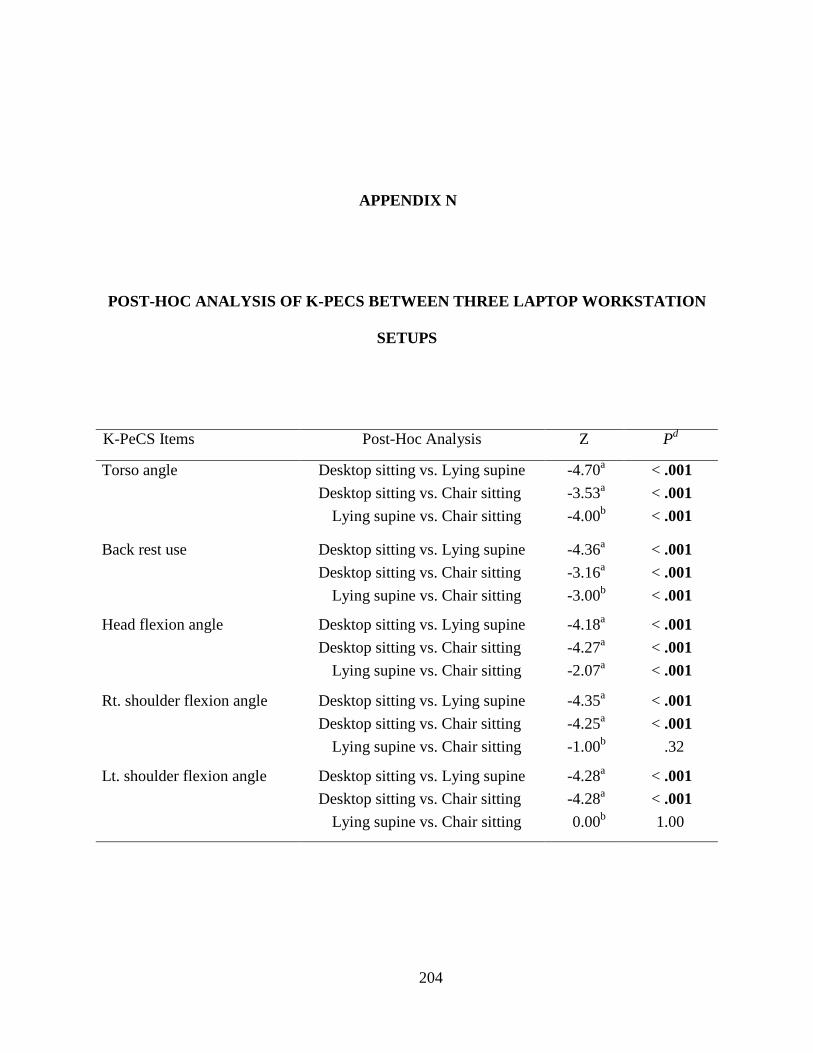
204
APPENDIX N
POST-HOC ANALYSIS OF K-PECS BETWEEN THREE LAPTOP WORKSTATION
SETUPS
K-PeCS Items Post-Hoc Analysis Z P
Torso angle
d
Desktop sitting vs. Lying supine -4.70 < .001 a Desktop sitting vs. Chair sitting -3.53 < .001 a Lying supine vs. Chair sitting -4.00 < .001 b
Back rest use
Desktop sitting vs. Lying supine -4.36 < .001 a Desktop sitting vs. Chair sitting -3.16 < .001 a Lying supine vs. Chair sitting -3.00 < .001 b
Head flexion angle Desktop sitting vs. Lying supine -4.18 < .001 a Desktop sitting vs. Chair sitting -4.27 < .001 a Lying supine vs. Chair sitting -2.07 < .001 a
Rt. shoulder flexion angle Desktop sitting vs. Lying supine -4.35 < .001 a Desktop sitting vs. Chair sitting -4.25 < .001 a Lying supine vs. Chair sitting -1.00 .32 b
Lt. shoulder flexion angle Desktop sitting vs. Lying supine -4.28 < .001 a Desktop sitting vs. Chair sitting -4.28 < .001 a Lying supine vs. Chair sitting 0.00 1.00 b

205
Table (Continued).
K-PeCS Items Post-Hoc Analysis Z P
Forearm support use
d
Desktop sitting vs. Lying supine -1.94 .05 a Desktop sitting vs. Chair sitting -3.17 < .001 a Lying supine vs. Chair sitting -0.74 .46 a
Rt. wrist support use Desktop sitting vs. Lying supine -2.08 .04 a Desktop sitting vs. Chair sitting -0.30 .76 b Lying supine vs. Chair sitting -2.33 .02 b
Rt. ulnar angle > 20° Desktop sitting vs. Lying supine -3.10 < .001 a Desktop sitting vs. Chair sitting -3.37 < .001 a Lying supine vs. Chair sitting -0.54 .59 a
Lt. ulnar angle > 20° Desktop sitting vs. Lying supine -3.46 < .001 a Desktop sitting vs. Chair sitting -3.39 < .001 a Lying supine vs. Chair sitting -0.16 .87 b
Rt. wrist extension > 15° Desktop sitting vs. Lying supine -0.75 .45 a Desktop sitting vs. Chair sitting -3.76 < .001 b Lying supine vs. Chair sitting -2.92 < .001 b
Lt. wrist extension > 15° Desktop sitting vs. Lying supine -0.35 .73 a Desktop sitting vs. Chair sitting -2.86 < .001 b Lying supine vs. Chair sitting -2.35 .02 b
Rt. isolated 5th Desktop sitting vs. Lying supine digit -2.71 .01 a Desktop sitting vs. Chair sitting 0.00 1.00 b Lying supine vs. Chair sitting -2.71 .01 c

206
Table (Continued).
K-PeCS Items Post-Hoc Analysis Z P
L-3 MCP hyperextension
d
Desktop sitting vs. Lying supine -2.43 .015 a Desktop sitting vs. Chair sitting -0.58 .56 a Lying supine vs. Chair sitting -2.25 .02 b
L-4 MCP hyperextension Desktop sitting vs. Lying supine -2.83 .01 a Desktop sitting vs. Chair sitting -2.83 .01 a Lying supine vs. Chair sitting 0.00 1.00 b
L-5 MCP hyperextension Desktop sitting vs. Lying supine -4.12 < .001 a Desktop sitting vs. Chair sitting -3.74 < .001 a Lying supine vs. Chair sitting -0.83 .41 b
Note. Rt. = Right; Lt. = Left; MCP = Metacarpophalangeal joints; abased on the positive ranks; bbased on negative ranks; cWilcoxon signed ranks test; d
Statistical significance was set at p < .0167; Bold indicates significant items

207
APPENDIX O
COMPARISON OF PHYSICAL DISCOMFORT AND ANOVA SUMMARY BETWEEN
THREE LAPTOP WORKSTATION SETUPS
Body regions (cm) Desktop sitting Lying supine Chair sitting F p ηa P
Neck
2
2.2 ± 2.3 2.4 ± 2.2 3.1 ± 2.7 2.29 .11 .07
Rt. shoulder 1.1 ± 1.7 0.8 ± 1.1 1.8 ± 2.6 3.76 .03 .12
Lt. shoulder 1.2 ± 1.7 0.9 ± 1.4 1.8 ± 2.6 3.32 .04 .10
Rt. upper arm 0.7 ± 0.8 0.8 ± 1.1 1.1 ± 1.5 1.62 .21 .05
Lt. upper arm 0.8 ± 0.9 0.8 ± 1.1 1.2 ± 1.5 1.36 .26 .05
Rt. lower arm 0.7 ± 0.8 0.8 ± 0.9 1.1 ± 1.3 2.60 .09 .08
Lt. lower arm 0.7 ± 0.8 0.8 ± 0.9 1.1 ± 1.3 2.54 .10 .08
Rt. hand/wrist 0.9 ± 1.4 1.0 ± 1.2 1.2 ± 1.5 1.36 .26 .05
Lt. hand/wrist 0.9 ± 1.5 1.0 ± 1.3 1.4 ± 1.6 2.09 .15 .07
Upper back 1.6 ± 2.2 1.5 ± 1.8 2.4 ± 2.5 6.01 < .001 .17
Lower back 1.5 ± 1.9 1.4 ± 2.0 1.4 ± 1.6 0.06 .94 .00
Note. Rt. = Right; Lt. = Left; a
Statistical significance was set at p < .05; Bold indicates
significant items
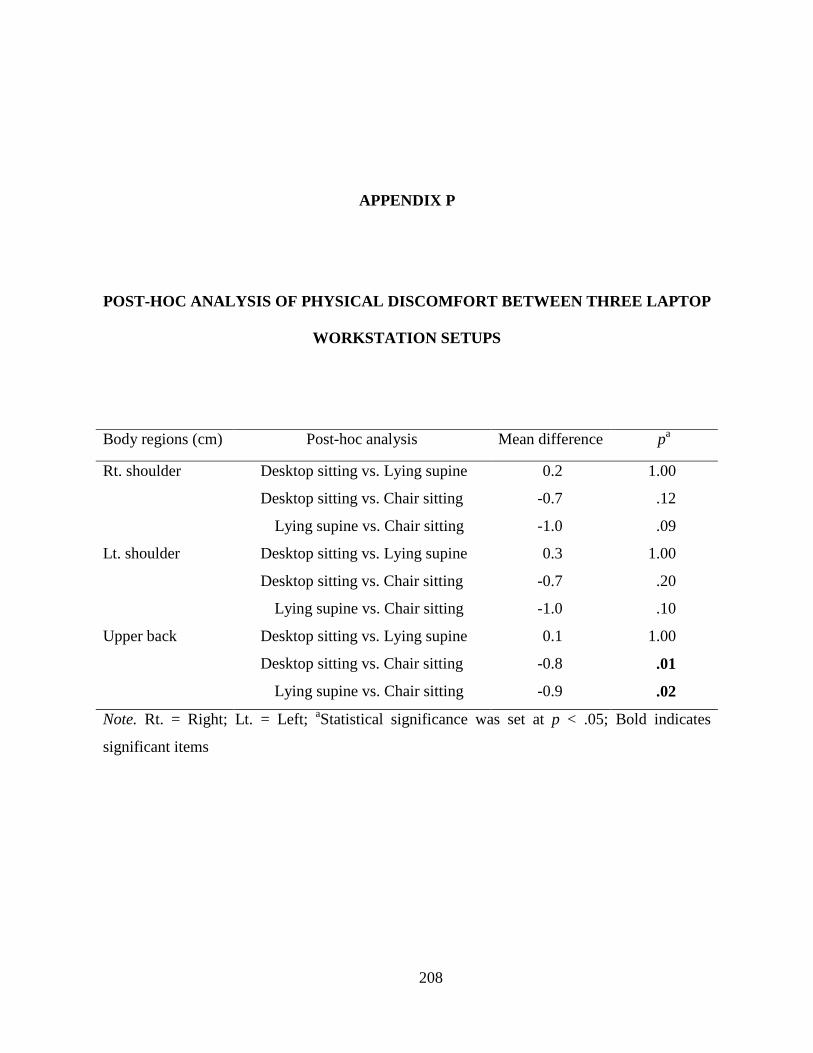
208
APPENDIX P
POST-HOC ANALYSIS OF PHYSICAL DISCOMFORT BETWEEN THREE LAPTOP
WORKSTATION SETUPS
Body regions (cm) Post-hoc analysis Mean difference p
Rt. shoulder
a
Desktop sitting vs. Lying supine 0.2 1.00
Desktop sitting vs. Chair sitting -0.7 .12
Lying supine vs. Chair sitting -1.0 .09
Lt. shoulder Desktop sitting vs. Lying supine 0.3 1.00
Desktop sitting vs. Chair sitting -0.7 .20
Lying supine vs. Chair sitting -1.0 .10
Upper back Desktop sitting vs. Lying supine 0.1 1.00
Desktop sitting vs. Chair sitting -0.8 .01
Lying supine vs. Chair sitting -0.9 .02
Note. Rt. = Right; Lt. = Left; a
Statistical significance was set at p < .05; Bold indicates
significant items

209
APPENDIX Q
COMPARISON OF TASK PRODUCTIVITY AND ANOVA SUMMARY BETWEEN
THREE LAPTOP WORKSTATION SETUPS
Productivity Mean ± SD F p ηd P
Desktop sitting
2
Lying supine Chair sitting
Net speed 46.5 ± 15.8 a 44.3 ± 15.7 39.6 ± 14.1 41.28 < .001 .59
Gross speed 50.6 ± 15.8 a 49.2 ± 14.7 44.5 ± 13.0 60.59 < .001 .68
Accuracy 90.2 ± 9.9 b 88.8 ± 10.9 87.8 ± 12.1 1.02 .37 .03
Error hit 269.0 ± 284.7 c 243.5 ± 206.6 242.0 ± 199.8 0.23 .73 .01
Gross hit 2532.5 ± 789.6 c 2460.1 ± 735.3 2221.7 ± 650.3 65.21 < .001 .69
Net hit 2306.8 ± 791.1 c 2216.6 ± 782.1 1979.7 ± 705.1 41.81 < .001 .59
Note. aWords per minute (wpm); bPercentage (%); cNumbers; d
Statistical significance was set
at p < .05; Bold indicates significant items

210
APPENDIX R
POST-HOC ANALYSIS OF TASK PORDUCTIVITY BETWEEN THREE LAPTOP
WORKSTATION SETUPS
Body region Post-hoc analysis Mean difference P
Net speed
c
Desktop sitting vs. Lying supine a 1.8 .10
Desktop sitting vs. Chair sitting 6.5 < .001
Lying supine vs. Chair sitting 4.7 < .001
Gross speed Desktop sitting vs. Lying supine a 6.0 < .001
Desktop sitting vs. Chair sitting 1.4 < .001
Lying supine vs. Chair sitting -4.6 < .001
Gross hit Desktop sitting vs. Lying supine b 72.3 .04
Desktop sitting vs. Chair sitting 310.8 < .001
Lying supine vs. Chair sitting 238.5 < .001
Net hit Desktop sitting vs. Lying supine b 90.2 .10
Desktop sitting vs. Chair sitting 327.1 < .001
Lying supine vs. Chair sitting 237.0 < .001
Note. aWords per minute (wpm); bNumbers; c
Statistical significance was set at p < .05; Bold
indicates significant items
211
BIBLIOGRAPHY
Aaras, A., Horgen, G., Bjorset, H. H., Ro, O., & Thoresen, M. (1998). Musculoskeletal, visual and psychosocial stress in VDU operators before and after multidisciplinary ergonomic interventions. Applied Ergonomics, 29, 335-354.
Aaras, A., Horgen, G., Bjorset, H. H., Ro, O., & Walsoe, H. (2001). Musculoskeletal, visual and psychosocial stress in VDU operators before and after multidisciplinary ergonomic interventions: A 6 years prospective study-Part II. Applied Ergonomics, 32, 559-571.
Aaras, A., Horgen, G., & Ro, O. (2000). Work with the visual display unit: Health consequences. International Journal of Human-Computer Interaction, 12, 107-134.
Adams, J. E. (1965). Injury to the throwing arm: A study of traumatic changes in the elbow joints of boy baseball players. California Medicine, 102, 127-132.
Albin, T. (1997). Effect of wrist rest use and keyboard tilt on wrist angle while keying. Paper presented at the The 13th Triennial Conference of the International Ergonomics Association.
Aldridge, A., & Levine, K. (2001). Surveying the social world: Principles and practice in survey research. Philadelphia, PA: Open University Press.
Ankrum, D. R., & Nemeth, K. J. (2000). Head and neck posture at computer workstation: What's neutral? Paper presented at the 14th Triennial Congress of the International Ergonomics Association.
Ariens, G. A., Bongers, P. M., Douwes, M., Miedema, M. C., Hoogendoorn, W. E., van der Wal, G., et al. (2001). Are neck flexion, neck rotation, and sitting at work risk factors for neck pain? Results of a prospective cohort study. Occupational and Environmental Medicine, 58, 200-207.
Armstrong, T. J. (1986). Ergonomics and cumulative trauma disorders. Hand Clinics, 2, 553-565.
Armstrong, T. J., Castelli, W., Gaynor Evans, F., & Diaz-perez, R. (1984). Some histological changes in carpal tunnel contents and their biomechanical implications. Journal of Occupational Medicine, 26, 197-201.
Armstrong, T. J., Foulke, J. A., Joseph, B. S., & Goldstein, S. A. (1982). Investigation of cumulative trauma disorders in a poultry processing plant. American Industrial Hygiene Association Journal, 43, 103-116.
Armstrong, T. J., Foulke, J. A., Martin, B. J., Gerson, J., & Rempel, D. M. (1994). Investigation of applied forces in alphanumeric keyboard work. American Industrial Hygiene Association Journal, 55, 30-35.
Asundi, K., Odell, D., Luce, A., & Dennerlein, J. T. (2010). Notebook computer use on a desk, lap and lap support: Effects on posture, performance and comfort. Ergonomics, 53, 74-82.

212
Baker, N. A. (2008). Keyboard-Personal Computer Style Instrument Procedural Manual. Pittsburgh, PA: University of Pittsburgh.
Baker, N. A., Cook, J. R., & Redfern, M. S. (2009). Rater reliability and concurrent validity of the Keyboard Personal Computer Style instrument (K-PeCS). Applied Ergonomics, 40, 136-144.
Baker, N. A., & Redfern, M. (2009). Potentially problematic postures during work site keyboard use. American Journal of Occupational Therapy, 63, 386-397.
Baker, N. A., & Redfern, M. S. (2005). Developing an observational instrument to evaluate personal computer keyboarding style. Applied Ergonomics, 36, 345-354.
Baker, N. A., Sussman, N. B., & Redfern, M. S. (2008). Discriminating between individuals with and without musculoskeletal disorders of the upper extremity by means of items related to computer keyboard use. Journal of Occupational Rehabilitation, 18, 157-165.
Bauer, W., & Wittig, T. (1998). Influence of screen and copy holder positions on head posture, muscle activity and user judgment. Applied Ergonomics, 29, 185-192.
Bendix, T., & Jessen, F. (1986). Wrist support during typing: A controlled, electromyographic study. Applied Ergonomics, 17, 162-168.
Bergqvist, U., Wolgast, E., Nilsson, B., & Voss, M. (1995a). The influence of VDT work on musculoskeletal disorders. Ergonomics, 38, 754-762.
Bergqvist, U., Wolgast, E., Nilsson, B., & Voss, M. (1995b). Musculoskeletal disorders among visual display terminal workers: Individual, ergonomic, and work organizational factors. Ergonomics, 38, 763-776.
Bergqvist, U. O., & Knave, B. G. (1994). Eye discomfort and work with visual display terminals. Scandinavian Journal of Work, Environment & Health, 20, 27-33.
Berkhout, A. L., Hendriksson-Larsen, K., & Bongers, P. (2004). The effect of using a laptopstation compared to using a standard laptop PC on the cervical spine torque, perceived strain and productivity. Applied Ergonomics, 35, 147-152.
Bernard, B., Sauter, S., Fine, L., Petersen, M., & Hales, T. (1994). Job task and psychosocial risk factors for work-related musculoskeletal disorders among newspaper employees. Scandinavian Journal of Work, Environment & Health, 20, 417-426.
Bijur, P. E., Silver, W., & Gallagher, E. J. (2001). Reliability of the visual analog scale for measurement of acute pain. Academic Emergency Medicine, 8, 1153-1157.
Binkley, J., Finch, E., Hall, J., Black, T., & Gowland, C. (1993). Diagnostic classification of patients with low-back pain: Report on a survey of physical therapy experts. Physical Therapy, 73, 138-155.
Bjelle, A., Hagberg, M., & Michaelson, G. (1981). Occupational and individual factors in acute shoulder-neck disorders among industrial workers. British Journal of Industrial Medicine, 38, 356-363.
Blatter, B. M., & Bongers, P. M. (2002). Duration of computer use and mouse use in relation to musculoskeletal disorders of neck or upper limb. International Journal of Industrial Ergonomics, 30, 295-306.
Boocock, M. G., Collier, J. M., McNair, P. J., Simmonds, M., Larmer, P. J., & Armstrong, B. (2009). A framework for the classification and diagnosis of work-related upper extremity conditions: Systematic review. Seminars in Arthritis and Rheumatism, 38, 296-311.
Brady, W., Bass, J., Moser, R., Jr., Anstadt, G. W., Loeppke, R. R., & Leopold, R. (1997). Defining total corporate health and safety costs significance and impact: Review and recommendations. Journal of Occupational and Environmental Medicine, 39, 224-231.

213
Brage, S., & Bjerkedal, T. (1996). Musculoskeletal pain and smoking in Norway. Journal of Epidemiology and Community Health, 50, 166-169.
Brandt, L. P., Andersen, J. H., Lassen, C. F., Kryger, A., Overgaard, E., Vilstrup, I., et al. (2004). Neck and shoulder symptoms and disorders among Danish computer workers. Scandinavian Journal of Work, Environment & Health, 30, 399-409.
Bruno, S., Lorusso, A., & L'Abbate, N. (2008). Playing-related disabling musculoskeletal disorders in young and adult classical piano students. International Archives of Occupational and Environmental Health, 81, 855-860.
BSR-HFES 100. (2002). Human factors engineering of computer workstation. Santa Monica, CA: Human Factors and Ergonomics Society.
Bufton, M. J., Marklin, R. W., Nagurka, M. L., & Simoneau, G. G. (2006). Effect of keyswitch design of desktop and notebook keyboards related to key stiffness and typing force. Ergonomics, 49, 996-1012.
Burdorf, A., & Laan, J. (1991). Comparison of methods for the assessment of postural load on the back. Scandinavian Journal of Work, Environment & Health, 17, 425-429.
Bureau of Labor Statistics. (2009). News releases: Nonfatal occupational injuries and illnesses requiring days away from work, 2008. Retrieved October, 1, 2010, from Bureau of Labor Statistics via BLS Access: http://stats.bls.gov/news.release/osh2.toc.htm
Burgess-Limerick, R., Plooy, A., & Ankrum, D. R. (1998). The effect of imposed and self-selected computer monitor height on posture and gaze angle. Clinical Biomechanics, 13, 584-592.
Burgess-Limerick, R., Shemmell, J., Scadden, R., & Plooy, A. (1999). Wrist posture during computer pointing device use. Clinical Biomechanics, 14, 280-286.
Cagnie, B., Danneels, L., Van Tiggelen, D., De Loose, V., & Cambier, D. (2007). Individual and work related risk factors for neck pain among office workers: A cross sectional study. European Spine Journal, 16, 679-686.
Carter, J. B., & Banister, E. W. (1994). Musculoskeletal problems in VDT work: A review. Ergonomics, 37, 1623-1648.
Chaffin, D. B. (1973). Localized muscle fatigue definiton and measurement. Journal of Occuppational Medicine, 15, 346-354.
Chaffin, D. B., Andersson, G., & Martin, B. J. (2006). Occupational biomechanics (4th ed.). Hoboken, NJ: Wiley Interscience.
Chang, C. H., Amick, B. C., 3rd, Menendez, C. C., Katz, J. N., Johnson, P. W., Robertson, M., et al. (2007). Daily computer usage correlated with undergraduate students' musculoskeletal symptoms. American Journal of Industrial Medicine, 50, 481-488.
Chiang, H. C., Ko, Y. C., Chen, S. S., Yu, H. S., Wu, T. N., & Chang, P. Y. (1993). Prevalence of shoulder and upper-limb disorders among workers in the fish-processing industry. Scandinavian Journal of Work, Environment & Health, 19, 126-131.
Cohen, J. (1988). Statistical power analysis for the behavioral sciences (2nd ed.). Hillsdale, NJ: Erlbaum Associates.
Cook, C., & Burgess-Limerick, R. (2002). Forearm support for intensive computer users: A field study. Paper presented at the HF 2002 Human Factors Conference.
Corlett, E. N., & Bishop, R. P. (1976). A technique for assessing postural discomfort. Ergonomics, 19, 175-182.
Cornell University Ergonomics Web. (2004). Computer keyboard design (Publication. Retrieved January, 11, 2010, from CU Ergo: http://ergo.human.cornell.edu/ahtutorials/ckd.htm
214
Cortes, M. C., Hollis, C., Amick, B. C., III, & Katz, J. N. (2002). An invisible disability: Qualitative research on upper extremity disorders in a university community. Work, 18, 315-321.
Crews, T. B., Brown, H. F., Bray, S., & Pringle, E. M. (2007). Student campus technology trends: 2001 versus 2006. Educase Quarterly, 30, 30-36.
David, G. C. (2005). Ergonomic methods for assessing exposure to risk factors for work-related musculoskeletal disorders. Occupational Medicine, 55, 190-199.
de Zwart, B. C. H., Broersen, J. P., Frings-Dresen, M. H., & van Dijk, F. J. (1997). Musculoskeletal complaints in the Netherlands in relation to age, gender and physically demanding work. International Archives of Occupational and Environmental health, 70, 352-360.
de Zwart, B. C. H., Frings-Dresen, M. H. W., & van Duivenbooden, J. C. (1999). Senior workers in the Dutch construction industry: A search for age-related work and health issues. Experimental Aging Research, 25, 385-391.
Delisle, A., Lariviere, C., Plamondon, A., & Imbeau, D. (2006). Comparison of three computer office workstations offering forearm support: Impact on upper limb posture and muscle activation. Ergonomics, 49, 139-160.
Dennerlein, J. T., & Johnson, P. W. (2006). Different computer tasks affect the exposure of the upper extremity to biomechanical risk factors. Ergonomics, 49, 45-61.
DeVellis, R. F. (2003). Scale development: Theory and applications (2nd ed.). Thousand Oaks, CA: Sage Publications.
Dewall, M., Vanriel, M. P. J. M., Aghina, J. C. F. M., Burdorf, A., & Snijders, C. J. (1992). Improving the sitting posture of CAD/CAM workers by increasing VDU monitor working height. Ergonomics, 35, 427-436.
Dillman, D. A. (2007). Mail and internet surveys: The tailored design method (2nd ed.). Hoboken, NJ: Wiley.
Doherty, T. J., Vandervoort, A. A., Taylor, A. W., & Brown, W. F. (1993). Effects of motor unit losses on strength in older men and women. Journal of Applied Physiology, 74, 868-874.
Downie, W. W., Leatham, P. A., Rhind, V. M., Wright, V., Branco, J. A., & Anderson, J. A. (1978). Studies with pain rating scales. Annals of the Rheumatic Diseases 37, 378-381.
Drury, C. G., Deeb, J. M., Hartman, B., Woolley, S., Drury, C. E., & Gallagher, S. (1989). Symmetric and asymmetric manual materials handling. Part 1: Physiology and psychophysics. Ergonomics, 32, 467-489.
Ekberg, K., Bjorkqvist, B., Malm, P., Bjerrekiely, B., Karlsson, M., & Axelson, O. (1994). Case-control atudy of risk-factors for disease in the neck and shoulder area. Occupational and Environmental Medicine, 51, 262-266.
Faulkner, J. A., Brooks, S. V., & Zerba, E. (1990). Skeletal muscle weakness and fatigue in old age: Underlying mechanisms. Annual Review of Gerontology & Geriatrics, 10, 147-166.
Ferguson, D., & Duncan, J. (1974). Keyboard design and operating posture. Ergonomics, 17, 731-744.
Ferreira, T. A., & Rasband, W. S. (2010). The ImageJ user guide. Retrieved November, 13, 2009, from http://rsbweb.nih.gov/ij/docs/user-guide.pdf
Feuerstein, M., Armstrong, T., Hickey, P., & Lincoln, A. (1997). Computer keyboard force and upper extremity symptoms. Journal of Occupational and Environmental Medicine, 39, 1144-1153.
Field, A. (2009). Discovering statistics using SPSS (3rd ed.). Los Angeles: Sage.

215
Fisher, D. L., Andres, R. O., Airth, D., & Smith, S. S. (1993). Repetitive motion disorders: The design of optimal rate-rest profiles. Human Factors, 35, 283-304.
Fleiss, J. L. (1986). The design and analysis of clinical experiments. New York: Wiley. Fleiss, J. L., & Cohen, J. (1973). The equivalence of weighted kappa and the intraclass
correlation coefficient as measures of reliability. Educational and Psychological Measurement, 33, 613-619.
Floru, R., Cail, F., & Elias, R. (1985). Psychophysiological changes during a VDU repetitive task. Ergonomics, 28, 1455-1468.
Fredriksson, K., Alfredsson, L., Ahlberg, G., Josephson, M., Kilbom, A., Hjelm, E. W., et al. (2002). Work environment and neck and shoulder pain: The influence of exposure time. Results from a population based case-control study. Occupational and Environmental Medicine, 59, 182-188.
Frymoyer, J. W., Pope, M. H., Clements, J. H., Wilder, D. G., MacPherson, B., & Ashikaga, T. (1983). Risk factors in low back pain. The Journal of Bone and Joint Surgery, 65, 213-218.
Galinsky, T. L., Swanson, N. G., Sauter, S. L., Hurrell, J. J., & Schleifer, L. M. (2000). A field study of supplementary rest breaks for data-entry operators. Ergonomics, 43, 622-638.
Gallagher, E. J., Bijur, P. E., Latimer, C., & Silver, W. (2002). Reliability and validity of a visual analog scale for acute abdominal pain in the ED. The American Journal of Emergency Medicine, 20, 287-290.
Gao, C. S., Lu, D. M., She, Q. Y., Cai, R. T., Yang, L., & Zhang, G. G. (1990). The effects of VDT data entry work on operators. Ergonomics, 33, 917-923.
Garg, A., Hermann, K. T., Schwoerer, B. J., & Kapellusch, J. M. (2002). The effect of maximum voluntary contraction on endurance times for the shoulder girdle. International Journal of Industrial Ergonomics, 30, 103-113.
Gerard, M. J., Armstrong, T. J., Rempel, D. A., & Woolley, C. (2002). Short term and long term effects of enhanced auditory feedback on typing force, EMG, and comfort while typing. Applied Ergonomics, 33, 129-138.
Gerr, F., Marcus, M., Ensor, C., Kleinbaum, D., Cohen, S., Edwards, A., et al. (2002). A prospective study of computer users: I. Study design and incidence of musculoskeletal symptoms and disorders. American Journal of Industrial Medicine, 41, 221-235.
Goodgold, S., Mohr, K., Samant, A., Parke, T., Burns, T., & Gardner, L. (2002). Effects of backpack load and task demand on trunk forward lean: Pilot findings on two boys. Work, 18, 213-220.
Gosheger, G., Liem, D., Ludwig, K., Greshake, O., & Winkelmann, W. (2003). Injuries and overuse syndromes in golf. The American Journal of Sports Medicine 31, 438-443.
Graves, R. J., Way, K., Riley, D., Lawton, C., & Morris, L. (2004). Development of risk filter and risk assessment worksheets for HSE guidance: Upper limb disorders in the workplace’ 2002. Applied Ergonomics, 35, 475-484.
Green, J. L., Camilli, G., & Elmore, P. B. (2006). Handbook of complementary methods in education research. Mahwah, NJ: Lawrence Erlbaum Associates.
Green, J. R., & Rayan, G. M. (1997). Scaphoid fractures in soccer goalkeepers. The Journal of the Oklahoma State Medical Association, 90, 45-47.
Greene, D. P., & Roberts, S. L. (2005). Kinesiology: Movement in the context of activity (2nd ed.). St. Louis: Elsevier Mosby.
216
Grimmer, K., Dansie, B., Milanese, S., Pirunsan, U., & Trott, P. (2002). Adolescent standing postural response to backpack loads: A randomised controlled experimental study. BMC Musculoskeletal Disorders, 3, 10.
Hagberg, M., Thiringer, G., & Brandstrom, L. (2005). Incidence of tinnitus, impaired hearing and musculoskeletal disorders among students enrolled in academic music education: A retrospective cohort study. International Archives of Occupational and Environmental Health, 78, 575-583.
Hagg, G. M. (2000). Human muscle fibre abnormalities related to occupational load. European Journal of Applied Physiology, 83, 159-165.
Hales, T. R., Sauter, S. L., Peterson, M. R., Fine, L. J., Putz-Anderson, V., Schleifer, L. R., et al. (1994). Musculoskeletal disorders among visual display terminal users in a telecommunications company. Ergonomics, 37, 1603-1621.
Hamilton, A. G., Jacobs, K., & Orsmond, G. (2005). The prevalence of computer-related musculoskeletal complaints in female college students. Work, 24, 387-394.
Hamilton, N. (1996). Source document position as it affects head position and neck muscle tension. Ergonomics, 39, 593-610.
Harris, C., & Straker, L. (2000). Survey of physical ergonomics issues associated with school childrens’ use of laptop computers. International Journal of Industrial Ergonomics, 26, 337-346.
Hartman, E., Oude Vrielink, H. H., Huirne, R. B., & Metz, J. H. (2003). Sick leave analysis among self-employed Dutch farmers. Occupational Medicine, 53, 461-468.
Hartman, E., Vrielink, H. H. E. O., Huirne, R. B. M., & Metz, J. H. M. (2006). Risk factors for sick leave due to musculoskeletal disorders among self-employed Dutch farmers: A case-control study. American Journal of Industrial Medicine, 49, 204-214.
Heasman, T., Brooks, A., & Stewart, T. (2000). Health and safety of portable display screen equipment (Publication. Retrieved August, 23, 2009, from Health and Safety Executive: http://www.hse.gov.uk/research/crr_pdf/2000/crr00304.pdf
Hengel, K. M. O., Houwink, A., Odell, D., van Dieen, J. H., & Dennerlein, J. T. (2008). Smaller external notebook mice have different effects on posture and muscle activity. Clinical Biomechanics, 23, 727-734.
Henning, R. A., Jacques, P., Kissel, G. V., Sullivan, A. B., & Alteras-Webb, S. M. (1997). Frequent short rest breaks from computer work: Effects on productivity and well-being at two field sites. Ergonomics, 1, 78-91.
Hocking, B. (1998). Symptoms associated with mobile phone use: Addendum. Occupational Medicine-Oxford, 48, 472-472.
Hong, Y. L., & Brueggemann, G. P. (2000). Changes in gait patterns in 10-year-old boys with increasing loads when walking on a treadmill. Gait & Posture, 11, 254-259.
Hooper, M. M. (2006). Tending to the musculoskeletal problems of obesity. Cleveland Clinic Journal of Medicine, 73, 839-845.
Hopkins, A. (1990). Stress, the quality of work, and repetition strain injury in Australia. Work & Stress, 4, 129-138.
Horie, S., Hargens, A., & Rempel, D. (1993). The effect of keyboard wrist rest in preventing carpal tunnel syndrome. Paper presented at the Proceedings of American Public Health Association Annual Meeting.
Hulley, S. B. (2007). Designing clinical research (3rd ed.). Philadelphia, PA: Lippincott Williams & Wilkins.
217
Hunting, W., Laubli, T., & Grandjean, E. (1981). Postural and visual loads at VDT workplaces: I. Constrained postures. Ergonomics, 24, 917-931.
Hupert, N., Amick, B. C., Fossel, A. H., Coley, C. M., Robertson, M. M., & Katz, J. N. (2004). Upper extremity musculoskeletal symptoms and functional impairment associated with computer use among college students. Work, 23, 85-93.
Iarossi, G. (2005). The power of survey design: A user's guide for managing surveys, interpreting results, and influencing respondents. Washington, DC: World Bank.
IJmker, S., Huysmans, M. A., Blatter, B. M., van der Beek, A. J., van Mechelen, W., & Bongers, P. M. (2007). Should office workers spend fewer hours at their computer? A systematic review of the literature. Occupational and Environmental Medicine, 64, 211-222.
International Data Corporation. (2008). Notebook shipments surpass desktop in the United States market for the first time. Retrieved Decemebr, 23, 2009, from http://www.idc.com/getdoc.jsp?containerId=prUS21493208
International Data Corporation. (2010). IDC predicts further gains for specialized form factors in 2010 PC market. Retrieved May, 10, 2010, from http://www.idc.com/getdoc.jsp?containerID=prUS22237010
Jacobs, K., Johnson, P., Dennerlein, J., Peterson, D., Kaufman, J., Gold, J., et al. (2009). University students' notebook computer use. Applied Ergonomics, 40, 404-409.
James, C. P., Harburn, K. L., & Kramer, J. F. (1997). Cumulative trauma disorders in the upper extremities: Reliability of the postural and repetitive risk-factors index. Archives of Physical Medicine and Rehabilitation, 78, 860-866.
Jenkins, M., Menendez, C. C., Amick, B. C., 3rd, Tullar, J., Hupert, N., Robertson, M. M., et al. (2007). Undergraduate college students’ upper extremity symptoms and functional limitations related to computer use: A replication study. Work, 28, 231-238.
Jensen, C. (2003). Development of neck and hand-wrist symptoms in relation to duration of computer use at work. Scandinavian Journal of Work, Environment & Health, 29, 197-205.
Jensen, C., Borg, V., Finsen, L., Hansen, K., Juul-Kristensen, B., & Christensen, H. (1998). Job demands, muscle activity and musculoskeletal symptoms in relation to work with the computer mouse. Scandinavian Journal of Work, Environment & Health, 24, 418-424.
Jensen, C., Finsen, L., Sogaard, K., & Christensen, H. (2002). Musculoskeletal symptoms and duration of computer and mouse use. International Journal of Industrial Ergonomics, 30, 265-275.
Jensen, C., Ryholt, C. U., Burr, H., Villadsen, E., & Christensen, H. (2002). Work-related psychosocial, physical and individual factors associated with musculoskeletal symptoms in computer users. Work & Stress, 16, 107-120.
Johnsson-smaragdi, U., d'Haenens, L., & Krotz, F. (1998). Patterns of old and new media use among young people in Filanders, Germany, and Sweden. European Journal of Communication, 13, 479-501.
Johnston, V., Souvlis, T., Jimmieson, N. L., & Jull, G. (2008). Associations between individual and workplace risk factors for self-reported neck pain and disability among female office workers. Applied Ergonomics, 39, 171-182.
Jonai, H., Villanueva, M. B. G., Takata, A., Sotoyama, M., & Saito, S. (2002). Effects of the liquid crystal display tilt angle of a notebook computer on posture, muscle activities and somatic complaints. International Journal of Industrial Ergonomics, 29, 219-229.

218
Juul-Kristensen, B., Sogaard, K., Stroyer, J., & Jensen, C. (2004). Computer users’ risk factors for developing shoulder, elbow and back symptoms. Scandinavian Journal of Work, Environment & Health, 30, 390-398.
Kaergaard, A., & Andersen, J. H. (2000). Musculoskeletal disorders of the neck and shoulders in female sewing machine operators: Prevalence, incidence, and prognosis. Occupational and Environmental Medicine, 57, 528-534.
Kamwendo, K., Linton, S. J., & Moritz, U. (1991). Neck and shoulder disorders in medical secretaries: Part I. pain prevalence and risk factors. Scandinavian Journal of Rehabilitation Medicine, 23, 127-133.
Karlqvist, L. (1998). A process for the development, specification and evaluation of VDU work tables. Applied Ergonomics, 29, 423-432.
Karlqvist, L., Tornqvist, E. W., Hagberg, M., Hagman, M., & Toomingas, A. (2002). Self-reported working conditions of VDU operators and associations with musculoskeletal symptoms: A cross-sectional study focussing on gender differences. International Journal of Industrial Ergonomics, 30, 277-294.
Karlqvist, L. K., Hagberg, M., Koster, M., Wenemark, M., & Nell, R. (1996). Musculoskeletal symptoms among computer-assisted design (CAD) operators and evaluation of a self-assessment questionnaire. International Journal of Occupational and Environmental Health, 2, 185-194.
Karwowski, W. (2001). International encyclopedia of ergonomics and human factors. New York: Taylor & Francis.
Katz, J. N., Amick, B. C., Hupert, N., Cortes, M. C., Fossel, A. H., Robertson, M., et al. (2002). Assessment of upper extremity role functioning in students. American Journal of Industrial Medicine, 41, 19-26.
Katz, J. N., Amick, B. C., Carroll, B. B., Hollis, C., Fossel, A. H., & Coley, C. M. (2000). Prevalence of upper extremity musculoskeletal disorders in college students. The American Journal of Medicine, 109, 586-588.
Katz, Y. J. (2002). Attitudes affecting college students’ preferences for distance learning. Journal of Computer Assisted Learning, 18, 2-9.
Keir, P. J., Bach, J. M., Hudes, M., & Rempel, D. M. (2007). Guidelines for wrist posture based on carpal tunnel pressure thresholds. Human Factors, 49, 88-99.
Keir, P. J., Bach, J. M., & Rempel, D. M. (1998a). Effects of finger posture on carpal tunnel pressure during wrist motion. The Journal of Hand Surgery, 23, 1004-1009.
Keir, P. J., Bach, J. M., & Rempel, D. M. (1998b). Fingertip loading and carpal tunnel pressure: Differences between a pinching and a pressing task. Journal of Orthopaedic Research, 16, 112-115.
Kelsey, J. L., Githens, P. B., & O’Conner, T. (1984). Acute prolapsed lumbar intervertebral disc: An epidemiologic study with special reference to driving automobiles and cigarette smoking. Spine, 9, 608-613.
Ketola, R. (2004). Physical workload as a risk factor for symptoms in the neck and upper limbs: Exposure assessment and ergonomic intervention. Journal of Sports Science and Medicine, 3, 6-46.
Keyserling, W. M., Armstrong, T. J., & Punnett, L. (1991). Ergonomic job analysis: A structured approach for identifying risk factors associated with overexertion injuries and disorders. Applications in Occupational and Environmental Hygiene, 6, 353-363.

219
Kilbom, A. (1994). Assessment of physical exposure in relation to work-related musculoskeletal disorders: What information can be obtained from systematic observations? Scandinavian Journal of Work, Environment & Health, 20, 30-45.
Kirkendall, D. T., & Garrett, W. E. (1998). The effects of aging and training on skeletal muscle. The American journal of sports medicine, 26, 598-602.
Kumar, S., Narayan, Y., & Bjornsdottir, S. (1999). Comparison of the sensitivity of three psychophysical techniques to three manual materials handling task variables. Ergonomics, 42, 61-73.
Kuorinka, I., Forcier, L., & Hagberg, M. (1995). Work related musculoskeletal disorders (WMSDs): A reference book for prevention. Bristol, PA: Taylor & Francis.
Lassen, C. F., Mikkelsen, S., Kryger, A. I., Brandt, L. P. A., Overgaard, E., Thomsen, J. F., et al. (2004). Elbow and wrist/hand symptoms among 6,943 computer operators: A 1-year follow-up study (The NUDATA study). American Journal of Industrial Medicine, 46, 521-533.
Li, G., & Buckle, P. (1999). Current techniques for assessing physical exposure to work-related musculoskeletal risks, with emphasis on posture-based methods. Ergonomics, 42, 674-695.
Liao, M. H., & Drury, C. G. (2000). Posture, discomfort and performance in a VDT task. Ergonomics, 43, 345-359.
Liss, G. M., Jesin, E., Kusiak, R. A., & White, P. (1995). Musculoskeletal problems among Ontario dental hygienists. American Journal of Industrial Medicine, 28, 521-540.
Liu, C. W., Chen, T. W., Wang, M. C., Chen, C. H., Lee, C. L., & Huang, M. H. (2003). Relationship between carpal tunnel syndrome and wrist angle in computer workers. The Kaohsiung Journal of Medical Sciences, 19, 617-623.
Lotters, F., & Burdorf, A. (2006). Prognostic factors for duration of sickness absence due to musculoskeletal disorders. The Clinical Journal of Pain, 22, 212-221.
Lynn, M. R. (1995). Development and testing of the Nursing Role Model Competence Scale (NRMCS). Journal of Nursing Measurement, 3, 93-108.
Macgregor, D. M. (2000). Nintendonitis? A case report of repetitive strain injury in a child as a result of playing computer games. Scottish Medical Journal, 45, 150.
Madhan, M. R. (2009). Computer vision syndrome. The Nursing Journal of India, 100, 236-237. Makela, M., Heliovaara, M., Sievers, K., Impivaara, O., Knekt, P., & Aromaa, A. (1991).
Prevalence, determinants, and consequences of chronic neck pain in Finland. American Journal of Epidemiology, 134, 1356-1367.
Mamaghani, N. K., Shimomura, Y., Iwanaga, K., & Katsuura, T. (2003). Muscular performance modeling of the upper limb in static postures. Journal of Physiological Anthropology and Applied Human Science, 22, 149-157.
Marcus, M., Gerr, F., Monteilh, C., Ortiz, D. J., Gentry, E., Cohen, S., et al. (2002). A prospective study of computer users: II. Postural risk factors for musculoskeletal symptoms and disorders. American Journal of Industrial Medicine, 41, 236-249.
Marras, W. S., & Granata, K. P. (1995). A biomechanical assessment and model of axial twisting in the thoracolumbar spine. Spine, 20, 1440-1451.
Marras, W. S., & Karwowski, W. (2006). The occupational ergonomics handbook (2nd ed.). Boca Raton, FL: Taylor & Francis.
220
Martin, D. P., Engelberg, R., Agel, J., Snapp, D., & Swiontkowski, M. F. (1996). Development of a musculoskeletal extremity health status instrument: The musculoskeletal function assessment instrument. Journal of Orthopaedic Research, 14, 173-181.
McAtamney, L., & Nigel Corlett, E. (1993). RULA: A survey method for the investigation of work-related upper limb disorders. Applied Ergonomics, 24, 91-99.
McCormack, H. M., Horne, D. J., & Sheather, S. (1988). Clinical applications of visual analogue scales: A critical review. Psychological Medicine, 18, 1007-1019.
Menendez, C. C., Amick, B. C., 3rd, Jenkins, M., Caroom, C., Robertson, M., Harrist, R. B., et al. (2009). Upper extremity pain and computer use among engineering graduate students: A replication study. American Journal of Industrial Medicine, 52, 113-123.
Menendez, C. C., Amick, B. C., 3rd, Jenkins, M., Janowitz, I., Rempel, D. M., Robertson, M., et al. (2007). A multi-method study evaluating computing-related risk factors among college students. Work, 28, 287-297.
Milerad, E., & Ekenvall, L. (1990). Symptoms of the neck and upper extremities in dentists. Scandinavian Journal of Work, Environment & Health, 16, 129-134.
Miller, R. H., Lowry, J. L., Meardon, S. A., & Gillette, J. C. (2007). Lower extremity mechanics of iliotibial band syndrome during an exhaustive run. Gait Posture, 26, 407-413.
Moffet, H., Hagberg, M., Hansson-Risberg, E., & Karlqvist, L. (2002). Influence of laptop computer design and working position on physical exposure variables. Clinical Biomechanics, 17, 368-375.
Moore, J. S., & Garg, A. (1994). Upper extremity disorders in a pork processing plant: Relationships between job risk factors and morbidity. American Industrial Hygiene Association Journal, 55, 703-715.
Muller, C. F. (1990). Health care and gender. New York: Russell Sage Foundation. Nakazawa, T., Okubo, Y., Suwazono, Y., Kobayashi, E., Komine, S., Kato, N., et al. (2002).
Association between duration of daily VDT use and subjective symptoms. American Journal of Industrial Medicine, 42, 421-426.
National Research Council and Institute of Medicine. (2001). Musculoskeletal disorders and the workplace. Washington, DC: National Academy Press.
Noguchi, M., Kikuchi, H., Ishibashi, M., & Noda, S. (2003). Percentage of the positive area of bone metastasis is an independent predictor of disease death in advanced prostate cancer. British Journal of Cancer, 88, 195-201.
Nyman, T., Wiktorin, C., Mulder, M., & Johansson, Y. L. (2007). Work postures and neck-shoulder pain among orchestra musicians. American Journal of Industrial Medicine, 50, 370-376.
Oatis, C. A. (2009). Kinesiology: The mechanics and pathomechanics of human movement (2nd ed.). Baltimore: Lippincott Williams & Wilkins.
Oeverland, B., Akre, H., Kvaerner, K. J., & Skatvedt, O. (2005). Patient discomfort in polysomnography with esophageal pressure measurements. European Archives of Otorhinolaryngology, 262, 241-245.
Occhipinti, E. (1998). OCRA: A concise index for the assessment of exposure to repetitive movements of the upper limbs. Ergonomics, 41, 1290-1311.
Olendorf, M. R., & Drury, C. G. (2001). Postural discomfort and perceived exertion in standardized box-holding postures. Ergonomics, 44, 1341-1367.
Ong, C. M. (1990). Ergonomic intervention for better health and productivity: Two case studies. In S. Sauter, M. Dainoff & M. Smith (Eds.), Promoting health and productivity in the

221
computerized office: Models of successful ergonomic interventions (pp. 17-27). London: Taylor & Francis.
Palmer, K. T., Cooper, C., Walker-Bone, K., Syddall, H., & Coggon, D. (2001). Use of keyboards and symptoms in the neck and arm: Evidence from a national survey. Occupational Medicine 51, 392-395.
Pan, C. S., & Schleifer, L. M. (1996). An exploratory study of the relationship between biomechanical factors and right-arm musculoskeletal discomfort and fatigue in a VDT data-entry task. Applied Ergonomics, 27, 195-200.
Pan, C. S., Shell, R. L., & Schleifer, L. M. (1994). Performance variability as an indicator of fatigue and boredom effects in a VDT data entry task. International Journal of Human-Computer Interaction, 6, 37-45.
Paquet, V. L., Punnett, L., & Buchholz, B. (2001). Validity of fixed-interval observations for postural assessment in construction work. Applied Rrgonomics, 32, 215-224.
Pascoe, D. D., Pascoe, D. E., Wang, Y. T., Shim, D. M., & Kim, C. K. (1997). Influence of carrying book bags on gait cycle and posture of youths. Ergonomics, 40, 631-641.
Pheasant, S., & Haslegrave, C. M. (2006). Bodyspace: Anthropometry, ergonomics and the design of work. London: Taylor & Francis.
Pietri, F., Leclerc, A., Boitel, L., Chastang, J. F., Morcet, J. F., & Blondet, M. (1992). Low-back pain in commercial travelers. Scandinavian Journal of Work, Environment & Health, 18, 52-58.
Presser, S. (2004). Methods for testing and evaluating survey questionnaires. Hoboken, NJ: John Wiley & Sons Inc.
Psihogios, J. P., Sommerich, C. M., Mirka, G. A., & Moon, S. D. (2001). A field evaluation of monitor placement effects in VDT users. Applied Ergonomics, 32, 313-325.
Punnett, L., Fine, L. J., Keyserling, W. M., Herrin, G. D., & Chaffin, D. B. (2000). Shoulder disorders and postural stress in automobile assembly work. Scandinavian Journal of Work, Environment & Health, 26, 283-291.
Putz-Anderson, V. (1988). Cumulative trauma disorders: A manual for musculoskeletal diseases of the upper limbs. New York: Taylor & Francis.
Raps, T., & Nanthavanij, S. (2008). Survey study of notebook computer use and preferred work postures among Thai university students. Thammasat International Journal of Science and Technology 13, 62-75.
Rempel, D., Bach, J. M., Gordon, L., & So, Y. (1998). Effects of forearm pronation and supination on carpal tunnel pressure. The Journal of Hand Surgery, 23, 38-42.
Rempel, D., Keir, P. J., Smutz, W. P., & Hargens, A. (1997). Effects of static fingertip loading on carpal tunnel pressure. Journal of Orthopaedic Research, 15, 422-426.
Rempel, D., Serina, E., Klinenberg, E., Martin, B. J., Armstrong, T. J., Foulke, J. A., et al. (1997). The effect of keyboard keyswitch make force on applied force and finger flexor muscle activity. Ergonomics, 40, 800-808.
Rempel, D. M., Keir, P. J., & Bach, J. M. (2008). Effect of wrist posture on carpal tunnel pressure while typing. Journal of Orthopaedic Research, 26, 1269-1273.
Rempel, D. M., Krause, N., Goldberg, R., Benner, D., Hudes, M., & Goldner, G. U. (2006). A randomized controlled trial evaluating the effects of two workstation interventions on upper body pain and incident musculoskeletal disorders among computer operators. Occupational and Environmental Medicine, 63, 300-306.

222
Research and Markets. (2009). The survey of american college students: Computer technology preferences and purchasing plans - nearly 93% of the students in the sample owned a computer. Retrieved May, 17, 2010, from http://www.researchandmarkets.com/reportinfo.asp?report_id=693982
Rossignol, A. M., Morse, E. P., Summers, V. M., & Pagnotto, L. D. (1987). Video display terminal use and reported health symptoms among Massachusetts clerical workers. Journal of Occupational Medicine, 29, 112-118.
Roush, J. R., Bustillo, K., & Low, E. (2008). Measurement error between a goniometer and the NIH ImageJ program for measuring quadriceps angle [Electronic Version]. The Internet Journal of Allied Health Sciences and Practice, 6. Retrieved May, 03, 2010 from http://ijahsp.nova.edu/articles/vol6num2/pdf/Roush.pdf
Saito, S., Miyao, M., Kondo, T., Sakakibara, H., & Toyoshima, H. (1997). Ergonomic evaluation of working posture of VDT operation using personal computer with flat panel display. Industrial Health, 35, 264-270.
Saito, S., Piccoli, B., Smith, M. J., Sotoyama, M., Sweitzer, G., Villanueva, M. B. G., et al. (2000). Ergonomic guidelines for using notebook personal computers. Industrial Health, 38, 421-434.
Sakakibara, H., Miyao, M., Kondo, T., Yamada, S., Nakagawa, T., & Kobayashi, F. (1987). Relation between overhead work and complaints of pear and apple orchard workers. Ergonomics, 30, 805-815.
Salaway, G., Caruso, J. B., Nelson, M. R., & Dede, C. (2007). The ECAR study of undergraduate students and information technology (Publication. Retrieved April, 04, 2010, from Education Center for Applied Research: http://www.educause.edu/ers0808
Sauter, S. L., Schleifer, L. M., & Knutson, S. J. (1991). Work posture, workstation design, and musculoskeletal discomfort in a VDT data entry task. Human Factors, 33, 151-167.
Schlossberg, E. B., Morrow, S., Llosa, A. E., Mamary, E., Dietrich, P., & Rempel, D. M. (2004). Upper extremity pain and computer use among engineering graduate students. American Journal of Industrial Medicine, 46, 297-303.
Sen, A., & Richardson, S. (2007). A study of computer-related upper limb discomfort and computer vision syndrome. Journal of Human Ergology, 36, 45-50.
Shea, K. G., Stevens, P. M., Nelson, M., Smith, J. T., Masters, K. S., & Yandow, S. (1998). A comparison of manual versus computer-assisted radiographic measurement. Intraobserver measurement variability for Cobb angles. Spine, 23, 551-555.
Shenshen, Z. (2009). Laptop surge in computer market [Electronic Version]. Shanhai Daily. Retrieved January, 03, 2010 from http://www.shanghaidaily.com/sp/article/2008/200812/20081223/article_385525.htm.
Shin, H. (2010). Musculoskeletal symptoms and laptop computer use among college students. Un published doctoral dissertation, University of Pittsburgh, PA.
Silverstein, B., Viikari-Juntura, E., & Kalat, J. (2002). Use of a prevention index to identify industries at high risk for work-related musculoskeletal disorders of the neck, back, and upper extremity in Washington state, 1990-1998. American Journal of Industrial Medicine, 41, 149-169.
Silverstein, B. A., Fine, L. J., & Armstrong, T. J. (1987). Occupational factors and carpal tunnel syndrome. American Journal of Industrial Medicine, 11, 343-358.

223
Sjogaard, G., Kiens, B., Jorgensen, K., & Saltin, B. (1986). Intramuscular pressure, EMG and blood flow during low-level prolonged static contraction in man. Acta Physiologica Scandinavica, 128, 475-484.
Sommerich, C. M. (2002). A survey of desktop and notebook computer use by professionals. Paper presented at the Human Factors and Ergonomics Society 46th Annual Meeting.
Sommerich, C. M., Joines, S. M. B., & Psihogios, J. P. (2001). Effects of computer monitor viewing angle and related factors on strain, performance, and preference outcomes. Human Factors, 43, 39-55.
Sommerich, C. M., Marras, W. S., & Parnianpour, M. (1996). Observation on the relationship between key strike force and typing speed. American Industrial Hygiene Association Journal, 57, 1109-1114.
Sommerich, C. M., Starr, H., Smith, C. A., & Shivers, C. (2002). Effects of notebook computer configuration and task on user biomechanics, productivity, and comfort. International Journal of Industrial Ergonomics, 30, 7-31.
Sommerich, C. M., Ward, R., Sikdar, K., Payne, J., & Herman, L. (2007). A survey of high school students with ubiquitous access to tablet PCs. Ergonomics, 50, 706-727.
Sotoyama, M., Jonai, H., Saito, S., & Villanueva, M. B. (1996). Analysis of ocular surface area for comfortable VDT workstation layout. Ergonomics, 39, 877-884.
Spielholz, P., Silverstein, B., Morgan, M., Checkoway, H., & Kaufman, J. (2001). Comparison of self-report, video observation and direct measurement methods for upper extremity musculoskeletal disorder physical risk factors. Ergonomics, 44, 588-613.
Stetson, D., Keyserling, W., Silverstein, B., & Leonard, J. (1991). Observational analysis of the hand and wrist: A pilot study. Applied Occupational and Environmental Hygiene, 6, 927-937.
Straker, K., & Pollock, C. (2005). Optimizing the interaction of children with information and communication technologies. Ergonomics, 48, 506-521.
Straker, L., Jones, K. J., & Miller, J. (1997). A comparison of the postures assumed when using laptop computers and desktop computers. Applied Ergonomics, 28, 263-268.
Straker, L. M., Coleman, J., Skoss, R., Maslen, B. A., Burgess-Limerick, R., & Pollock, C. M. (2008). A comparison of posture and muscle activity during tablet computer, desktop computer and paper use by young children. Ergonomics, 51, 540-555.
Suen, H. K., & Ary, D. (1986). A post hoc correction procedure for systematic errors in time-sampling duration estimates. Journal of Psychopathology and Behavioral Assessment 8, 31-38.
Swanson, N. G., Galinsky, T. L., Cole, L. L., Pan, C. S., & Sauter, S. L. (1997). The impact of keyboard design on comfort and productivity in a text-entry task. Applied Ergonomics, 28, 9-16.
Szeto, G. P., & Lee, R. (2002). An ergonomic evaluation comparing desktop, notebook, and subnotebook computers. Archives of Physical Medicine and Rehabilitation, 83, 527-532.
Tchoukalova, Y. D., Harteneck, D. A., Karwoski, R. A., Tarara, J., & Jensen, M. D. (2003). A quick, reliable, and automated method for fat cell sizing. Journal of Lipid Research, 44, 1795-1801.
Thomas, S. J. (2004). Using web and paper questionnaires for data-based decision making from design to interpretation of the results. Thousand Oaks, CA: Corwin Press.
Tittiranonda, P., Burastero, S., & Rempel, D. (1999). Risk factors for musculoskeletal disorders among computer users. Occupational Medicine, 14, 17-38.
224
U. S. Census Bureau. (2005). Computer and internet use in the United States 2003: Current population reports. U.S. Census Bureau.
UC Berkeley. (2007). Ergonomic tips for laptop users. Retrieved March, 01, 2009, from http://uhs.berkeley.edu/FacStaff/pdf/ergonomics/laptop.pdf
United Nations. (2007). Personal computers. Retrieved December,09, 2009, from http://mdgs.un.org/unsd/mdg/SeriesDetail.aspx?srid=606&crid=
United States Department of Labor: Occupational Safety and Health Administration. (2000). Ergonomic program: Final rule. Retrieved February 20, 2009. from http://www.osha.gov/pls/oshaweb/owadisp.show_document?p_table=federal_register&p_id=16305.
University of Sunderland. (2001). D-4b guidance for users for laptop computers (Publication. Retrieved January, 19, 2010, from University Health & Safety Office: https://docushare.sunderland.ac.uk/.../D-4b+Guidance+for+users+of+laptop+compouters.pdf
Unruh, A. M. (1996). Gender variations in clinical pain experience. Pain, 65, 123-167. van den Heuvel, S. G., van der Beek, A. J., Blatter, B. M., & Bongers, P. M. (2006). Do work-
related physical factors predict neck and upper limb symptoms in office workers? International Archives of Occupational and Environmental Health, 79, 585-592.
Villanueva, M. B., Jonai, H., Sotoyama, M., Hisanaga, N., Takeuchi, Y., & Saito, S. (1997). Sitting posture and neck and shoulder muscle activities at different screen height settings of the visual display terminal. Industrial Health, 35, 330-336.
Villanueva, M. B. G., Jonai, H., & Saito, S. (1998). Ergonomic aspects of portable personal computers with flat panel displays (PC-FPDs): Evaluation of posture, muscle activities, discomfort and performance. Industrial Health, 36, 282-289.
Villanueva, M. B. G., Sotoyama, M., Jonai, H., Takeuchi, Y., & Saito, S. (1996). Adjustments of posture and viewing parameters of the eye to changes in the screen height of the visual display terminal. Ergonomics, 39, 933-945.
Visser, B., de Korte, E., van der Kraan, I., & Kuijer, P. (2000). The effect of arm and wrist supports on the load of the upper extremity during VDU work. Clinical Biomechanics, 15, S34-38.
Visser, B., & van Dieen, J. H. (2006). Pathophysiology of upper extremity muscle disorders. Journal of Electromyography and Kinesiology, 16, 1-16.
Wahlstrom, J. (2005). Ergonomics, musculoskeletal disorders and computer work. Occupational Medicine, 55, 168-176.
Weaver, B. E., & Nilson, L. B. (2005). Laptops in class: What are they good for? What can you do with them? New Directions for Teaching and Learning, 101, 3-13.
Weisberg, H. F. (2005). The total survey error approach: A guide to the new science of survey research. Chicago: University of Chicago Press.
Wendelboe, A. M., Hegmann, K. T., Gren, L. H., Alder, S. C., White, G. L., Jr., & Lyon, J. L. (2004). Associations between body-mass index and surgery for rotator cuff tendinitis. The Journal of Bone and Joint Surgery, 86, 743-747.
Werner, R., Armstrong, T. J., Bir, C., & Aylard, M. K. (1997). Intracarpal canal pressures: The role of finger, hand, wrist and forearm position. Clinical Biomechanics 12, 44-51.
Wiholm, C., Richter, H., Mathiassen, S. E., & Toomingas, A. (2007). Associations between eyestrain and neck-shoulder symptoms among call-center operators. Scandinavian Journal of Work Environment & Health, 3, 54-59.

225
Wiktorin, C., Karlqvist, L., & Winkel, J. (1993). Validity of self-reported exposures to work postures and manual materials handling: Stockholm MUSIC I study group. Scandinavian Journal of Work, Environment & Health, 19, 208-214.
Wolff, B. (2006). Laptop use in university common space [Electronic Version]. Educause Quarterly, 29, 74-76 from http://connect.educause.edu/Library/EDUCAUSE+Quarterly/LaptopUseinUniversityComm/39958?time=1230676709
Yen, M., & Lo, L. H. (2002). Examining test-retest reliability: An intra-class correlation approach. Nursing Research, 51, 59-62.