muscle-derived mir-26a mediate cardiac fibrosis … · web viewit can downregulate sodium-calcium...
TRANSCRIPT

miR-26a limits muscle wasting and cardiac fibrosis through exosome-mediated microRNA
transfer in chronic kidney disease
Bin Wang, MD, PhD1,3,#, Aiqing Zhang, MD2,3,#, Haidong Wang, PhD3,4, Janet D. Klein, PhD3,
Lin Tan, PhD5, Ze-Mu Wang, MD, PhD 6, Jie Du, PhD7, Nawazish Naqvi, PhD5, Bi-Cheng
Liu,MD, PhD1, and Xiaonan H. Wang, MD3*
1 Institute of Nephrology, Zhong Da Hospital, Southeast University, Nanjing, Jiangsu, 210009,
China2Department of Pediatric Nephrology, the Second Affiliated Hospital of Nanjing Medical
University, Nanjing, 210003, China3 Renal Division, Department of Medicine, Emory University, Atlanta, GA 30322, USA4College of Animal Science and Veterinary Medicine, Shanxi Agricultural University, Taigu,
Shanxi, 030801, China5Division of Cardiology, Department of Medicine, Emory University, Atlanta, GA 30322, USA6Department of Cardiology, The First Affiliated Hospital of Nanjing Medical University,
Nanjing, Jiangsu, China7The Key Laboratory of Remodeling-related Cardiovascular Diseases, Beijing Anzhen Hospital
Affiliated to Capital Medical University, Beijing Institute of Heart Lung and Blood Vessel
Diseases, Beijing 100029, China# Both authors contributed equally to this work.
Running title: miR-26a improve heart function in CKD mice*Correspondence:
Xiaonan H. Wang, MD
Renal / Medicine
WMB Room 338C
M/S 1930/001/1AG
1639 Pierce Dr.
Emory University, School of Medicine
Atlanta, GA, 30322-0001
Tel. (404) 727-8654 (L) (404) 727-1798 (O)
Fax. (404) 727-3425
1
Abstract
Uremic cardiomyopathy and muscle atrophy are associated with insulin resistance and contribute
to chronic kidney disease (CKD)-induced morbidity and mortality. We hypothesized that
restoration of miR-26a levels would enhance exosome-mediated microRNA transfer to improve
muscle wasting and cardiomyopathy that occur in CKD.
Methods: Using next generation sequencing and qPCR, we found that CKD mice had a
decreased level of miR-26a in heart and skeletal muscle. We engineered an exosome vector that
contained Lamp2b, an exosomal membrane protein gene fused with a muscle-specific surface
peptide that targets muscle delivery. We transfected this vector into muscle satellite cells and
then transduced these cells with adenovirus that expresses miR-26a to produce exosomes
encapsulated miR-26a (Exo/miR-26a). Exo/miR-26a was injected once per week for 8 weeks into
the tibialis anterior (TA) muscle of 5/6 nephrectomized CKD mice.
Results: Treatment with Exo/miR-26a resulted in increased expression of miR-26a in skeletal
muscle and heart. Overexpression of miR-26a increased the skeletal muscle cross-sectional area,
decreased the upregulation of FBXO32/atrogin-1 and TRIM63/MuRF1 and depressed cardiac
fibrosis lesions. In the hearts of CKD mice, FoxO1 was activated, and connective tissue growth
factor, fibronectin and collagen type I alpha 1 were increased. These responses were blunted by
injection of Exo/miR-26a. Echocardiograms showed that cardiac function was improved in CKD
mice treated with Exo/miR-26a.
Conclusion: Overexpression of miR-26a in muscle prevented CKD-induced muscle wasting and
attenuated cardiomyopathy via exosome-mediated miR-26a transfer. These results suggest
possible therapeutic strategies for using exosome delivery of miR-26a to treat complications of
CKD.
Key words: uremic cardiomyopathy, muscle wasting, insulin resistance, surface peptide,
Lamp2b
2

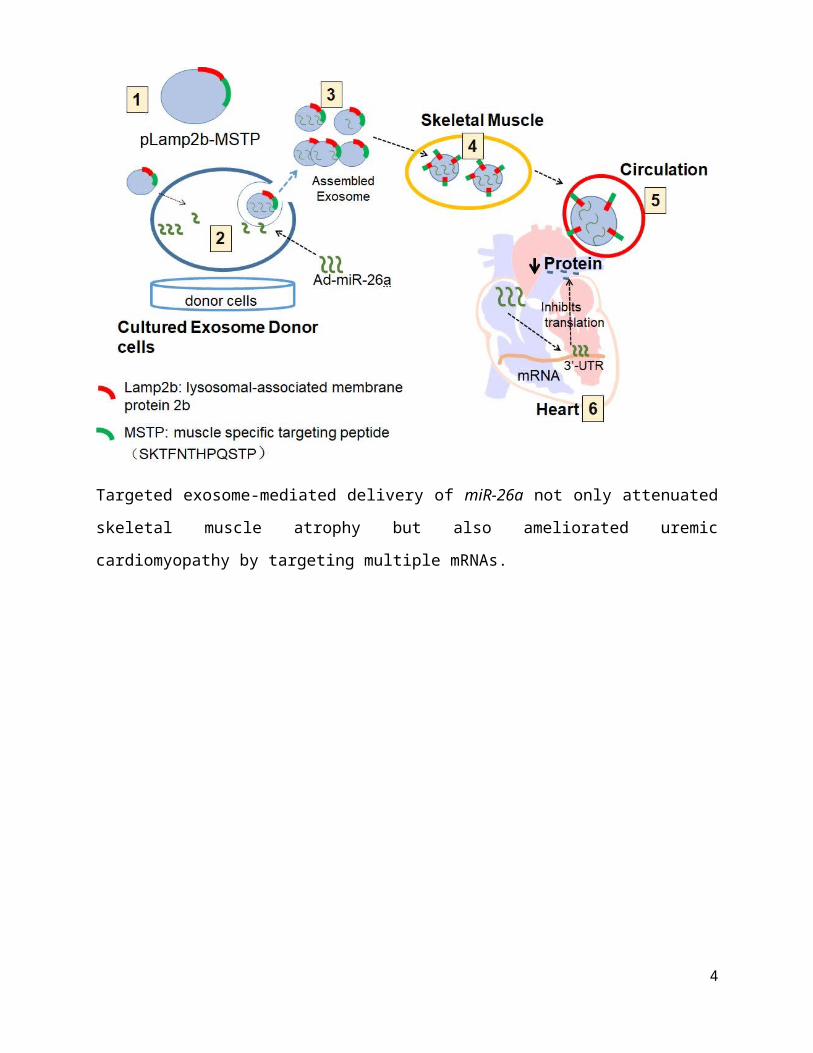
Graphical Abstract
Targeted exosome-mediated delivery of miR-26a not only attenuated skeletal muscle atrophy but
also ameliorated uremic cardiomyopathy by targeting multiple mRNAs.
3
Introduction
Chronic kidney disease (CKD) develops over time and ultimately leads to end-stage renal
disease. Uremic cardiomyopathy and muscle atrophy are critical complications for CKD-related
disastrous outcomes [1, 2]. Cardiomyopathy accounts for approximately 50% of CKD deaths [3].
Muscle wasting occurs in almost every type of CKD and is an independent risk factor for CKD-
induced morbidity and mortality [4, 5]. Current treatment strategies offer improved quality and
length of patient life but are not effective in curing or reversing either cardiomyopathy or muscle
wasting associated with CKD.
Uremic cardiomyopathy is independent of primary/intrinsic cardiomyopathies and other
atherosclerotic coronary-related heart disease. In fact, atherosclerotic coronary disorders are
decreased in CKD patients compared with the normal population [6]. CKD-induced uremic
cardiomyopathy is characterized by cardiac fibrosis and heart failure, which are closely related to
insulin resistance [1]. Uremic cardiomyopathy has a higher rate of sudden cardiac death than
does atherosclerotic coronary disease [7].
Insulin resistance is an acknowledged risk factor for cardiac disease related to CKD [8,
9]. During a study of 1187 first hospitalization heart failure patients, the investigator found that
insulin resistance predicts and precedes the development of chronic heart failure [9]. In addition,
insulin resistance is positively correlated with heart function decline [10]. A widely used
antagonist of insulin resistance, metformin, can improve left ventricular function and reduce
myocardial lipid accumulation and cardiac fibrosis [11]. Blocking insulin resistance with
metformin results in 13% lower mortality compared with therapies to increase insulin sensitivity
[12]. Insulin resistance causes heart problems through multiple mechanisms. It can downregulate
sodium-calcium exchange, decrease myosin ATPase activity and upregulate angiotensin-II in the
heart, resulting in reduced cardiac efficiency [13]. Insulin resistance is also a critical contributor
to skeletal muscle atrophy in CKD and other metabolic diseases by decreasing protein synthesis,
increasing protein degradation and limiting skeletal muscle regeneration [2, 14].
In humans, insulin regulates many metabolism processes by influencing glucose
metabolism, fat synthesis and fatty acid esterification, increasing protein synthesis through
control of amino acid uptake, altering DNA replication, and modifying numerous enzyme
activity states [15]. Our group found that insulin resistance induces muscle atrophy by increasing
protein degradation in skeletal muscle [16]. Insulin regulates protein metabolism through the
insulin/IGF-1 signaling pathway, which includes the insulin-like growth factor-1 (IGF-1), insulin 4

receptor substrate, phosphoinositide 3-kinase (PI3K), GSK/Akt and FoxO cascade [15]. Akt
plays a central role in this insulin-signaling pathway. Phosphorylation of Akt at serine 473
indicates activation and leads to insulin sensitivity. Decreased phosphorylation at this site leads
to insulin resistance. Akt and GSK-3β activity are reciprocal regulators of the insulin signaling
pathway. Activation of GSK-3β by tyrosine-216 phosphorylation induces insulin resistance,
whereas serine (9/21) phosphorylation inhibits GSK-3β, leading to increased insulin sensitivity
[17]. Normally, Akt inhibits GSK-3β activity, resulting in increased insulin sensitivity [18].
Under CKD conditions, Akt activation is inhibited by uremic toxins, and the resulting increased
GSK-3β activity leads to insulin resistance, impaired glucose and lipid metabolism and the
development of uremic cardiomyopathy [1]. FoxO1 is another important factor that contributes
to uremic muscle wasting. Activation of FoxO by de-phosphorylation induces muscle wasting
along with transcriptional upregulation of E3 ubiquitin ligases, cardiac hypertrophy and fibrosis
[19, 20].
Recent studies have shown that microRNAs (miRs) are important regulators of
metabolism during development and disease [21]. Many miRs have been linked to regulation of
the insulin signaling pathway and have led to some new treatment strategies using these miRs.
miR-26a has been suggested as a therapeutic target for traditional atherosclerotic cardiac disease
[22], but it is not clear whether it can limit CKD-induced muscle atrophy and uremic
cardiomyopathy. A major challenge in using synthetic miRs for treatment purposes is that
exogenously added miRs are quickly degraded by high levels of ribonuclease activity in plasma
or are rapidly cleared by phagocytosis, renal filtration or bile excretion resulting in minimal
tissue accumulation and minimal therapeutic effectiveness [23]. These drawbacks could be
overcome by using exosomes as microRNA carriers. Because exosomes stabilize miRs and are
non-cytotoxic and non-mutagenic to the recipient, they are longer lived compared to viral or
liposome-based gene delivery vehicles [24].
Here, we show the impact of intramuscular injection of exosomes carrying miR-26a-5p
on muscle atrophy and cardiac fibrosis in CKD mice. We investigated the outcome of exogenous
miR-26a on CKD-induced muscle wasting, insulin signaling and heart function in uremic mice.
We also used fluorescently labeled exosomes/miR-26a to track the exosomes in vivo. Our
findings provide new insights into how miR-26a participates in the control of skeletal muscle
mass and cardiac fibrosis.
Results5
miR-26a was decreased in the heart and skeletal muscle of CKD mice
In exploring new therapeutic targets for treating cardiomyopathy associated with CKD, we
performed miRNA deep sequence analysis from heart samples of CKD mice. The data revealed
56 miRs that were altered in CKD mice compared with sham-operated pair-fed mice (Figure 1A
and Table S1). These included miR-26a, which was decreased 37.2% in CKD heart. We first
used qPCR to determine whether miR-26a was expressed in major organs of normal mice and
found that miR-26a was mainly expressed in skeletal muscle and heart (Figure 1B). Further
qPCR analysis showed that miR-26a levels were 61% lower in the cardiac muscle of CKD versus
sham mice (Figure 1C). When we examined whether CKD influences miR-26a expression in
skeletal muscle, we found that miR-26a was decreased by 35% in skeletal muscle of CKD vs.
sham mice (Figure 1D).
Uremic serum increased catabolic signaling and profibrotic proteins
To further study the impact of CKD stress on miR-26a, we treated skeletal muscle
satellite cells and H9C2 cardiac myoblasts with 5% mouse serum from CKD or normal control
mice for 24 hours. We isolated RNA from these cells and probed for the expression of miR-26a
by qPCR. Treatment with uremic serum resulted in a 31% decrease in miR-26a in skeletal
muscle satellite cells (Figure 2A) and a 44% decrease in H9C2 cardiac myocytes (Figure 2B).
These results suggest that a decrease in miR-26a in skeletal muscle and heart could be due to
uremic toxicity. To explore the impact of uremic serum on protein changes, we measured Akt,
PTEN and TGF1 in uremic serum-treated cells by western blot. The uremic serum decreased
Akt phosphorylation and increased PTEN protein in satellite cells (Figure 2C). Similar
decreases in Akt phosphorylation were also observed in H9C2 cells (Figure 2D). TGF1 was
increased by uremic serum, suggesting increased fibrosis signaling. These results suggest that
uremic serum is critical for the induction of insulin resistance and is associated with decreasing
miR-26a.
Exosomes with encapsulated miR-26a and muscular surface target peptide (MSTP) surface
peptide were generated
Since microRNA has a relatively short life and exosomes can stabilize microRNA [25],
we used exosome-encapsulated microRNA to overexpress miR-26a in vivo (Figure S4). First, a
pLamp2b/MSTP vector was constructed. This vector contained lysosomal-associated membrane
protein 2b (Lamp2b), which is an exosomal membrane protein gene [26], fused with 3-muscle 6
surface targeting peptide SKTFNTHPQSTP. This peptide has strong cardiac muscle targeting
ability [27]. Second, an adenovirus containing a precursor miR-26a gene (Ad-miR-26a) was
generated. Third, satellite cells were transfected with pLamp2b/MSTP and transduced with Ad-
miR-26a or control virus (Ad-empty) in exosome-free medium. In this case, the exosomes
secreted from satellite cells should contain miR-26a with muscle target ability. Last, the
pLamp2b/MSTP-miR-26a enriched exosomes (Exo/miR-26a) and pLamp2b/MSTP-ctrl
exosomes (Exo/ctrl) were isolated from the conditioned medium of cultured cells. The
concentration and size of the collected exosomes were measured using a NanoSight instrument
(Figure S1). The average size of the isolated exosomes was 89 ± 1.8 nm. The exosome protein
marker TSG101 was absent in the transduced cells but present in the Exo/miR-ctrl and Exo/miR-
26a isolated from conditioned medium (Figure S3). Real-time qPCR showed that miR-26a was
increased 35-fold in Exo/miR-26a vs. Exo/ctrl (Figure S5). We labeled Exo/miR-26a with DiR
(1,1-dioctadecyl-3,3,3,3-tetramethylindotricarbocyanine iodide), a fluorescent tag for exosome
surface lipids (D12731; Invitrogen, Carlsbad, CA, USA), before intramuscular injection and
imaged the legs with an In-Vivo Xtreme camera system (Bruker, Billerica, MA, USA). We
observed a dose-dependent increase in fluorescence intensity in the injected TA muscles (Figure
S6).
miR-26a-5p attenuated CKD-induced muscle atrophy
The CKD experimental procedures are shown in Figure 3A. To examine whether
enhancing miR-26a in the muscles might prevent muscle wasting, Exo/miR-26a and Exo/ctrl
were injected into the TA muscle of CKD mice once per week beginning immediately following
the second CKD surgery. Skeletal muscle and heart were harvested 8 weeks after initiation. The
exogenously added Exo/miR-26a replenished miR-26a in skeletal muscle to control levels
(Figure 3B) as well as limited CKD-induced mouse body weight and muscle weight loss (Table
1). This result was supported by the improved muscle cross section area. Consistent with our
previous studies [2], the muscle cross section area was decreased by CKD (Figure 3C).
Conversely, overexpressing miR-26a caused a shift to a large cross sectional area when
compared with results in CKD muscles injected with the Exo/ctrl (Figure 3D). To examine the
possible mechanisms by which overexpression of Exo/miR-26a attenuates muscle mass loss in
CKD mice, we examined the proteins related to the insulin-IGF-1/Akt/FoxO signaling pathway.
The active form of Akt, phosphorylated at serine-473, was decreased in CKD, indicating
decreased insulin sensitivity. Similarly, CKD decreased the amounts of serine-21/9-7

phosphorylated GSK-3β and tyrosine-24-phosphorylated FoxO1, resulting in their activation and
increasing insulin resistance. Consequent to FoxO1 activation, FBXO32/atrogin-1 and
TRIM63/MuRF1, two FoxO-targeted E3 ubiquitin ligases, were increased (Figure 3E).
Provision of miR-26a in TA muscle reversed all these changes (Figure 3) and should lessen
insulin resistance, which suggests a mechanism for limiting skeletal muscle loss.
Intramuscular injection of Exo/miR-26a attenuated uremic cardiomyopathy in CKD mice
Since Exo/miR-26a contains a muscle-specific surface peptide with the potential to target
cardiac muscle [27], we hypothesized that these exosomes would carry miR-26a to the heart. To
verify whether skeletal muscle injection of Exo/miR-26a could transfer miR-26a to the heart or
other distant organs, we stained Exo/miR-26a with 1 μmol/l fluorescent tracer DiR before
intramuscular injection, and one week later, we imaged dissected organs with the In-Vivo
Xtreme camera system. Dissected organs from uninjected normal mice (right group), sham mice
injected with Exo/miR-26a (center group) and CKD mice injected with Exo/miR-26a (left group)
are shown in Figure S7. In the injected CKD mice, fluorescence was observed not only in
injected TA muscle but also in contralateral uninjected TA muscle and heart (Figure 4A). In the
injected sham mice, fluorescence was observed in the same organs; however, the labeled
exosome fluorescence intensity was higher in CKD hearts than in sham hearts (Figure 4B). The
expression of miR-26a was higher in CKD hearts than in hearts from sham-operated mice
(Figure S8), which suggests that the uremic heart has a higher capacity to recruit Exo/miR-26a.
We measured the expression of miR-26a in the hearts of CKD mice with Exo/miR-26a or
Exo/MiR-ctrl intramuscular injections. The expression of miR-26a was increased 1.8-fold in
CKD mouse heart from the Exo/miR-26a-injected animals versus the mice receiving Exo/ctrl
injection (Figure 4C). We next determined if Exo/miR-26a was increased in the circulation. We
found a 2.1-fold increase in miR-26a in serum exosomes from CKD mice injected with
Exo/miR-26a versus Exo/ctrl administration (Figure 4D). To discover whether circulating
exosomes that are enriched in miR-26a have the potential to attenuate insulin resistance and
inhibit fibrosis, we measured FoxO1 phosphorylation and TGFβ1 in serum exosomes. FoxO1
phosphorylation was decreased, and TGFβ1 and PTEN were increased in the exosomes from
CKD mouse serum. These changes were blunted in serum exosomes from CKD mice that were
treated with Exo/miR-26a (Figure 4E). Treatment of CKD mice with Exo/ctrl did not show the
beneficial blunting of these protein responses. These data suggest that 1) damaged heart has a
tendency to recruit more exosomes/miR than a healthy heart; 2) intramuscular injection of 8
Exo/miR-26a can increase miR-26a expression in the heart; and 3) in serum, miR-26a-enriched
exosomes carry signaling proteins that can limit insulin resistance.
CKD mouse heart showed significant uremic cardiomyopathy, as evidenced by the
increased ratio of heart weight to body weight (Table 2). Exogenous miR-26a reduced CKD-
induced increases in the heart/body weight ratio. CKD mice also had significantly increased
cardiac fibrosis vs. sham mice, as demonstrated by Masson’s trichrome staining. Collagen
deposits (indicated by blue staining in heart sections) were increased 43-fold in the hearts of
CKD mice, and intervention with miR-26a in CKD mice reduced the elevated collagen
accumulation by 50% compared to CKD with Exo/miR-ctrl (Figure 5A). The interstitial matrix
protein marker fibronectin is a signature for myofibroblast activation and was significantly
increased in the heart of CKD mice. The provision of miR-26a to CKD mice decreased the
amount of fibronectin (Figure 5B) and also partially limited the CKD-induced increase in two
fibrotic protein markers, collagen 1A1 and connective tissue growth factor (CTGF), in the heart
(Figure 5C). These results suggest that intramuscular injection of Exo/miR-26a can decrease
cardiac fibrosis in CKD mice.
miR-26a limited insulin resistance resulting in improved cardiac function
Insulin/IGF-1 signaling pathway-related proteins were evaluated by western blot. The
phosphorylation levels of ser-21/9 in GSK-3β and thr-24 in FoxO1 were decreased by CKD,
resulting in increased insulin resistance. The increase of pser-473-Akt by Exo/miR-26a suggested
increasing insulin sensitivity (Figure 6A). Exogenous miR-26a increased both pser-21/9-GSK-
3β and pthr-24-FoxO1, limiting insulin resistance. In addition, we determined whether
overexpression of miR-26a might downregulate FoxO1 expression since FoxO1 was predicted as
a target of miR-26a-5p by in silico analysis (TargetScan, PITA, miRanda). We performed a
luciferase reporter analysis in cultured skeletal muscle satellite cells using a reporter construct in
which the luciferase coding sequence was fused to the 3’-UTRs (position 3358 – 3364 nt) of
human FoxO1 (pLuc.miR-26a/FoxO1-3’UTR). miR-26a markedly repressed luciferase activity in
cells transfected with pLuc.miR-26a/FoxO1-3’UTR (Fox/3’UTR). Mutation of the miR-26a target
sites abrogated miR-26a-induced repression of luciferase activity (Figure 6B). These data
suggest that FoxO1 is a direct target of miR-26a.
Cardiac function was evaluated by echocardiography (Table 2 & Figure 6C). In CKD
mice, left ventricle (LV) end-diastolic diameter (LVEDD), LV end-systolic chamber dimensions
(LVESD), and left ventricular volume in diastole and systole (LV vol-d and LV vol-s) were all 9

significantly increased in the hearts of CKD mice. These changes were accompanied by a
decrease in the percentage of ejection fraction (%EF) and fractional shortening (FS) in CKD
mice. Provision of miR-26a improved all of these CKD-induced changes in cardiac function
parameters. The echocardiographic results suggest that miR-26a intervention improves cardiac
function.
To demonstrate that MSTP is important in Exo/miR-26a accumulation in the heart, we
generated additional exosomes encapsulated miR-26a without MSTP (Flag-Exo/miR-26a). We
injected both Flag-Exo/miR-26a and MSTP-Exo/miR-26a into the TA muscles of CKD mice and
measured miR-26a expression in circulation exosomes and in the heart. The expression of miR-
26a in serum exosomes from the two groups of mice was not significantly different (Figure 6D).
However, the expression of miR-26a in the cardiac muscle of MSTP-Exo/miR-26a-injected mice
was significantly higher than in hearts from Flag-Exo/miR-26a-injected mice (Figure 6E).
Interestingly, the miR-26a that accumulated in the CKD heart was significantly higher than that
in the sham-operated heart. These data indicate that MSTP plays an important role in targeting
microRNA to the injured heart. To show that the fluorescence accumulated in the various tissues
was an indication of Exo/miR-26a or Exo/miR-ctrl, not just nonspecific spreading of unattached
dye, we injected fluorescent lipophilic DiR without exosomes into TA muscle and looked for
fluorescence throughout the body. A signal was detected at 1, 2 and 4 weeks after DiR injection
in vivo. Analysis of organs ex vivo showed that fluorescence was confined to muscle and not
detected in other organs, including the kidney at all times (Figure S9).
Discussion
In this study, we showed that under CKD stress conditions, skeletal muscle atrophy and
uremic cardiomyopathy are related to a decrease in miR-26a. When we injected exosomes
encapsulating miR-26a with the muscle-targeting peptide MSTP into skeletal muscle of CKD
mice, we observed attenuated skeletal muscle wasting but also decreased evidence of
cardiomyopathy. Our data indicate that overexpression of miR-26a achieves these benefits by
limiting insulin resistance. In addition, we determined that FoxO1 is a direct target of miR-26a.
Our findings that exogenous application of miR-26a increases muscle cross section area,
diminishes CKD-induced cardiac fibrosis and improves heart function strongly suggest that these
miR-related changes are involved in the limitation of insulin resistance. Many systems and renal-
specific factors contribute to muscle atrophy and uremic cardiomyopathy in CKD, including
metabolic acidosis, inflammation, and increased oxidant stress [1, 28]. However, insulin 10

resistance is recognized as a major and common mechanism causing both muscle wasting and
cardiomyopathy in CKD [1]. Our previous studies proved that the downregulation of
insulin/IGF-1 signaling is the major cause of muscle wasting in CKD because it increases
accelerated protein degradation by activating the ubiquitin proteasome pathway [16, 29]. In the
current study, we found that several proteins closely related to the insulin/IGF-1 cascade were
altered by miR-26a-5p. Activation of Akt by miR-26a upregulates the insulin/IGF-1 signaling
pathway. Inactivation of FoxO1 and GSK-3β by miR-26a lessens insulin resistance. Other
investigators have also observed that obesity-induced decreases in miR-26a attenuate insulin
sensitivity [30], overexpression of miR-26a inhibits GSK-3β activation [31], and miR-26a has
important implications for cardiovascular repair [32].
In non-CKD pathologies, the cardiac response to increased phospho-Akt is to undergo
postnatal coronary angiogenesis and cardiac hypertrophy [33]. However, in the heart of CKD
animals, we and others have found that phospho-Akt protein is decreased and FoxO is activated
[34]. Importantly, CKD promotes the development of specific forms of cardiomyopathy that are
independent of increased coronary artery disease or hypertension. In CKD pathology, decreased
phospho-Akt and increased FoxO1 can cause increased insulin resistance with a disadvantageous
outcome. In an ischemia reperfusion injury model, Rota et al. showed that nuclear-targeted
overexpression of Akt1 did not induce cardiac hypertrophy but instead increased the number of
cardiomyocytes, increased contractility and protected against ischemia-reperfusion injury [35].
Insulin resistance can induce cardiac fibrosis, which is another consequence of CKD. In
the uremic heart, increased expression of profibrosis mediators such as TGFβ and CTGF causes
increased collagen levels and results in interstitial fibrosis, which contributes to diastolic
dysfunction, ventricular stiffness, and cardiac dysrhythmias [36]. Our study demonstrates that
miR-26a intervention reduces CTGF abundance and restricts collagen deposition in the heart.
Koga et al. showed that miR-26a inhibits TGFβ by directly targeting CTGF [37]. This is
consistent with our findings that show that cardiac fibrosis is inhibited by miR-26a.
Studies have found that miR-26a has multiple targets that are involved in fibrosis and
insulin resistance, such as GSK-3β, PTEN, CTGF and collagen I [31, 38, 39]. In this study, we
identified a novel target of miR-26a, FoxO1. The following is evidence to prove this outcome:
provision of miR-26a in skeletal muscle decreased FoxO1 protein in vivo (Figure 3E and Figure
6A). Using a luciferase reporter assay, we found direct binding of miR-26a to the 3’-UTR of
FoxO1 (Figure 6B). Both our FoxO1 target results and the target studies from us and others
provide reasonable evidence that intervention with miR-26a can limit insulin resistance and 11

fibrosis. All microRNAs have the potential for off target effects due to the multiplicity of their
targets. According to the literature, miR-26a suppresses cell proliferation in esophageal cancer
cells and tenon capsule fibroblasts [40]. In addition, one study found that miR-26a decreases
inflammation-mediated tumorigenesis and metastasis of cancer cells [41]. Our results indicating
that muscle size and mass increased in response to miR-26a suggest that this miR is not
inhibiting or suppressing cell proliferation, i.e., it does not show the same trend as the previously
observed off-target effects. However, we cannot rule out the possibility that miR-26a could affect
other tissues that are not the subject of our investigations.
Another important outcome of these studies is the determination that the use of a muscle-
specific targeting peptide is a good approach to direct microRNA to skeletal muscle and heart.
Exosomes are carrier vehicles. Both pre-miRNAs and mature miRNAs are located in exosomes
and have been determined to be quite stable [42]. In a clinical trial, patients tolerated exosome
injection for up to 21 months [43]. In this study, we constructed a new exosome targeting vector
to promote the accumulation of exosome-packaged miRs to specific destinations. Using a
muscle-specific target peptide, SKTFNTHPQSTP, in the structure of the exosomes/microRNA
caused them to preferentially move to skeletal muscle and heart. This vector contains Lamp2b
and MSTP. Since Lamp2b is ubiquitously expressed on the surface of exosomes, it facilitates the
fusion of target peptides to the surface of exosomes and endows exosomes with targeting ability
[27]. Interestingly, we also found that an injured organ has a higher capacity to recruit
exosomes/miR than do normal organs because miR-26a expression is much higher in CKD
hearts than in normal sham control hearts after matched intramuscular injections of Exo/miR-26a
(Figure 4A and Figure 4B). We believe that the damaged tissue creates a hierarchy for the
recruitment of exosomes. The CKD heart has damage, giving it higher priority to collect
therapeutic exosomes than healthy heart in sham mice. This could involve the response of
injured organs to induce secretion of inflammatory cytokines, leading to increased capillary
permeability. Any increased vascular permeability could result in increased exosome uptake.
Another potential mechanism for increased exosome uptake is fusion. Fusion efficiency is
enhanced in an acidic environment. A hallmark of CKD is tissue acidosis, which could increase
exosome uptake [44]. The mechanisms of these phenomena require future studies.
In conclusion, exogenous miR-26a not only attenuated skeletal muscle atrophy but also
ameliorated uremic cardiomyopathy by targeting multiple mRNAs. These findings suggest that
miR-26a could be useful as a therapeutic agent for increasing insulin sensitivity and inhibiting
muscle wasting and uremic cardiomyopathy.12

Methods
CKD mouse model and treatment: The experiments were approved by the Emory
University IACUC (protocol 4000152). Mice (C57BL/6J) were purchased from Jackson
Laboratories (Bar Harbor, ME, USA). The CKD model was obtained through a two-step 5/6
nephrectomy [14]. We started Exo/miR-26a or Exo/control tibialis anterior (TA) injection after
the second CKD surgery (40 µg of exosomes each time, once per week for a total of 8 weeks).
Generation of exosome-encapsulated miR-26a and exosome purification: A
pLamp2b/MSTP vector was constructed by the Genomics core of Emory University. Satellite
cells were grown to 60% confluence in DMEM/F12 culture medium containing 20% fetal bovine
serum [14]. The Lamp2b/MSTP vector was transfected into satellite cells using the Effectene
transfection reagent (Qiagen, Valencia, CA, USA). Six hours after transfection, the cells were
transduced with Ad-miR-26a (adenovirus containing miR-26a processor sequences) to produce
exosome-encapsulated miR-26a (Exo/miR-26a). Control cells were transduced with Ad-empty
for production of MSTP-exosome-control (Exo/ctrl). Exosome-free medium was used to replace
the growth medium to allow exosome secretion for 48 hours. Last, the pLamp2b/MSTP-miR-26a
enriched exosomes (Exo/miR-26a) and pLamp2b/MSTP-ctrl exosomes (Exo/ctrl) were isolated
from the conditioned medium of cultured cells and resuspended in PBS. Exosomes were purified
by several centrifugation and filtration steps as described previously [45]. Exosome size and
concentration were analyzed using a NanoSight instrument and an electro-microscope (Figure
S1 and Figure S2). The presence of the exosomal marker protein TSG101 was determined by
western blot (Figure S3). Exosome distribution images were taken with the Bruker Small
Animal Optical Imaging System (In-Vivo Xtreme II; Billerica, MA, USA).
Real-time quantitative PCR (qPCR): To measure microRNA, total RNA was extracted
using Tri-Reagent (Molecular Research Inc., Cincinnati, OH, USA). For synthesis of cDNA, 10
ng of total RNA that was enriched in small RNAs was reverse transcribed using an NCode
miRNA cDNA synthesis kit (Exiqon, Vedbaek, Denmark). The expression of microRNA was
measured as described [46]. Primers were purchased from Exiqon. The mouse U6 gene was used
as the standard for evaluating the tissue expression of individual miRNAs. miR-103 was used to
evaluate serum microRNA levels. The response or change in expression levels of individual
miRs was calculated as the difference between the threshold values of the sham and CKD genes
(ΔΔcq) [47, 48].
13
miRNA-Seq library preparation and sequencing was performed by the Genomics core of
Yerkes National Primate Research Center of Emory University. The method is provided in “A
detailed, expanded Methods” (supplement).
Luciferase Reporter Assay and Transfection: The luciferase reporter constructs
containing the luciferase coding sequence fused to the 3’-UTRs of FoxO1
(pLuc.miR-26a/FoxO1-3’UTR) were generated by the Emory Integrated Genomics Core. The
transfection and luciferase assay was described before and is provided in “A detailed, expanded
Methods” (supplement) [49].
Western blot analysis and histology staining: Proteins were lysed in RIPA buffer.
Detection of protein expression by western blot was performed according to established
protocols [50]. The western blot, immunofluorescence staining procedure and antibodies are
listed in “A detailed, expanded Methods” (supplement). The histological analysis was performed
in a blinded manner to avoid bias. All immunohistochemical analyses were repeated at least
three times, and representative images are shown.
Echocardiographic Evaluations of Cardiac Function: Echocardiography was performed
on lightly anesthetized mice (under 1-2% isoflurane, in oxygen) using a Vevo 3,100 ultrasound
system (VisualSonics, Toronto, CA) as described previously [51]. LV dimensions were obtained
using parasternal long-axis views by two-dimensional-sided M-mode imaging. The cursor was
positioned perpendicular to the interventricular septum and at the level of the papillary muscles
and posterior wall of the LV. An M-mode image obtained at a sweep speed of 100 mm/s was
used to determine diastolic and systolic LV wall thicknesses, LV end-diastolic dimensions
(LVDD) and LV end-systolic chamber dimensions (LVSD). Systolic function was calculated
from LV dimensions as fractional shortening (FS), as follows: FS = (LVDD LVSD)/LVDD.
Recording of echocardiographic images was performed in random order with respect to the
treatment or control animals. The acquisition of images and evaluation of data were performed
by independent operators who were blinded to the treatment.
Statistical analysis: Data are presented as the mean ± se. To identify significant
differences between two groups, comparisons were made using the t-test. Differences with P
values < 0.05 were considered significant. For a comparison of more than two groups, one-way
ANOVA was performed with a post hoc analysis using the Student-Newman-Keuls test.
Differences with P values < 0.05 were considered significant.
Competing Interests:
The authors declare that no competing interests exist.14
Abbreviations
BUN: blood urea nitrogen; CKD: chronic kidney disease; CTGF: connective tissue growth
factor; DiR: 1,1-dioctadecyl-3,3,3,3-tetramethylindotricarbocyanine iodide; EDL: extensor
digitorum longus; EF: ejection fraction; FS: fractional shortening; IGF-1: insulin-like growth
factor-1; Lamp2b: lysosomal-associated membrane protein 2b; LV: left ventricle; LVEDD: LV
end-diastolic diameter; LVESD: LV end-systolic chamber dimensions; LV vol-d and LV vol-s:
left ventricular volume in diastole and systole; MSTP: muscular surface target peptide; PI3K:
phosphoinositide 3-kinase; TA: Tibialis anterior.
Acknowledgments and Sources of Funding
Research reported in this publication was supported by the National Institute of Arthritis and
Musculoskeletal and Skin Diseases (NIAMS) of the National Institutes of Health under Award
Number R01 AR060268 and American Heart Association Discover and Innovation Grants
supported by Bayer Group (17IBDG33780000) to X.H.W; The National Natural Science
Foundation of China (81700618), the Natural Science Foundation of Jiangsu Province
(BK20181487), China Young Nephrologist Research Funding and the Fundamental Research
Funds for the Central Universities (2242018K41089) to B.W; The Natural Science Foundation of
Jiangsu Province (BK20161071) to A.Q.Z; and The National Natural Science Foundation of
China (31772690) to H.D.W. This research project was also supported in part (microRNA deep
sequencing) by the Genomics core of Yerkes National Primate Research Center under Award
number NIH ORIP/OD P51OD011132 and in part (luciferase constructs) by the Emory
Integrated Genomics Core (EIGC), which is subsidized by the Emory University School of
Medicine and is one of the Emory Integrated Core Facilities under NIH Award Number
UL1TR000454. The content is solely the responsibility of the authors and does not necessarily
reflect the official views of the NIH or the US Government.
We thank Drs. Matthew Wood and Yiqi Seow from the University of Oxford, UK, for providing
the pLamp2b-Flag vectors and control vectors.
References:
1. Semple D, Smith K, Bhandari S, Seymour AM. Uremic cardiomyopathy and insulin
resistance: a critical role for akt? J Am Soc Nephrol. 2011; 22: 207-15.
2. Wang XH, Mitch WE. Mechanisms of muscle wasting in chronic kidney disease. Nature
reviews Nephrology. 2014; 10: 504-16.
15

3. Patient mortality and survival. United States Renal Data System. Am J Kidney Dis. 1998; 32:
S69-80.
4. Avram MM, Mittman N. Malnutrition in uremia. Seminars in nephrology. 1994; 14: 238-44.
5. Wang XH, Mitch WE. Muscle wasting from kidney failure-a model for catabolic conditions.
Int J Biochem Cell Biol. 2013; 45: 2230-8.
6. Rostand SG, Kirk KA, Rutsky EA. Dialysis-associated ischemic heart disease: insights from
coronary angiography. Kidney Int. 1984; 25: 653-9.
7. Kottgen A, Russell SD, Loehr LR, Crainiceanu CM, Rosamond WD, Chang PP, et al.
Reduced kidney function as a risk factor for incident heart failure: the atherosclerosis risk in
communities (ARIC) study. J Am Soc Nephrol. 2007; 18: 1307-15.
8. Shinohara K, Shoji T, Emoto M, Tahara H, Koyama H, Ishimura E, et al. Insulin resistance as
an independent predictor of cardiovascular mortality in patients with end-stage renal disease. J
Am Soc Nephrol. 2002; 13: 1894-900.
9. Ingelsson E, Sundström J, Arnlöv J, Zethelius B, Lind L. Insulin resistance and risk of
congestive heart failure. JAMA. 2005; 294: 334-41.
10. Suskin N, McKelvie RS, Burns RJ, Latini R, Pericak D, Probstfield J, et al. Glucose and
insulin abnormalities relate to functional capacity in patients with congestive heart failure. Eur
Heart J. 2000; 21: 1368-75.
11. Cittadini A, Napoli R, Monti MG, Rea D, Longobardi S, Netti PA, et al. Metformin prevents
the development of chronic heart failure in the SHHF rat model. Diabetes. 2012; 61: 944-53.
12. Masoudi FA, Inzucchi SE, Wang Y, Havranek EP, Foody JM, Krumholz HM.
Thiazolidinediones, metformin, and outcomes in older patients with diabetes and heart failure: an
observational study. Circulation. 2005; 111: 583-90.
13. Singh VP, Le B, Khode R, Baker KM, Kumar R. Intracellular angiotensin II production in
diabetic rats is correlated with cardiomyocyte apoptosis, oxidative stress, and cardiac fibrosis.
Diabetes. 2008; 57: 3297-306.
14. Wang XH, Hu Z, Klein JD, Zhang L, Fang F, Mitch WE. Decreased miR-29 suppresses
myogenesis in CKD. J Am Soc Nephrol. 2011; 22: 2068-76.
15. Dimitriadis G, Mitrou P, Lambadiari V, Maratou E, Raptis SA. Insulin effects in muscle and
adipose tissue. Diabetes Res Clin Pract. 2011; 93 (Suppl 1): S52-9.
16. Wang X, Hu Z, Hu J, Du J, Mitch WE. Insulin resistance accelerates muscle protein
degradation: Activation of the ubiquitin-proteasome pathway by defects in muscle cell signaling.
Endocrinology. 2006; 147: 4160-8.16
17. Wang QM, Fiol CJ, DePaoli-Roach AA, Roach PJ. Glycogen synthase kinase-3 beta is a dual
specificity kinase differentially regulated by tyrosine and serine/threonine phosphorylation. J
Biol Chem. 1994; 269: 14566-74.
18. Chakraborty A, Koldobskiy MA, Bello NT, Maxwell M, Potter JJ, Juluri KR, et al. Inositol
pyrophosphates inhibit Akt signaling, thereby regulating insulin sensitivity and weight gain. Cell.
2010; 143: 897-910.
19. Xu J, Li R, Workeneh B, Dong Y, Wang X, Hu Z. Transcription factor FoxO1, the dominant
mediator of muscle wasting in chronic kidney disease, is inhibited by microRNA-486. Kidney
Int. 2012; 82: 401-11.
20. Wang XH, Du J, Klein JD, Bailey JL, Mitch WE. Exercise ameliorates chronic kidney
disease-induced defects in muscle protein metabolism and progenitor cell function. Kidney Int.
2009; 76: 751-9.
21. Wang XH. MicroRNA in myogenesis and muscle atrophy. Curr Opin Clin Nutr Metab Care
2013; 16: 258-66.
22. Icli B, Dorbala P, Feinberg MW. An emerging role for the miR-26 family in cardiovascular
disease. Trends Cardiovasc Med. 2014; 24: 241-8.
23. Smyth T, Kullberg M, Malik N, Smith-Jones P, Graner MW, Anchordoquy TJ.
Biodistribution and delivery efficiency of unmodified tumor-derived exosomes. J Control
Release. 2015; 199:145-55.
24. O'Loughlin AJ, Woffindale CA, Wood MJ. Exosomes and the emerging field of exosome-
based gene therapy. Curr Gene Ther. 2012; 12: 262-74.
25. Chevillet JR, Kang Q, Ruf IK, Briggs HA, Vojtech LN, Hughes SM, et al. Quantitative and
stoichiometric analysis of the microRNA content of exosomes. Proc Natl Acad Sci U S A. 2014;
111: 14888-93.
26. Hung ME, Leonard JN. Stabilization of exosome-targeting peptides via engineered
glycosylation. J Biol Chem. 2015; 290: 8166-72.
27. Seow Y, Yin H, Wood MJ. Identification of a novel muscle targeting peptide in mdx mice.
Peptides. 2010; 31: 1873-7.
28. Parfrey PS, Foley RN. The clinical epidemiology of cardiac disease in chronic renal failure. J
Am Soc Nephrol. 1999; 10:1606-15.
29. Zhou Q, Du J, Hu Z, Walsh K, Wang XH. Evidence for adipose-muscle cross talk: opposing
regulation of muscle proteolysis by adiponectin and Fatty acids. Endocrinology. 2007; 148:
5696-705.17

30. Fu X, Dong B, Tian Y, Lefebvre P, Meng Z, Wang X, et al. MicroRNA-26a regulates insulin
sensitivity and metabolism of glucose and lipids. J Clin Invest. 2015; 125: 2497-509.
31. Mohamed JS, Lopez MA, Boriek AM. Mechanical stretch up-regulates microRNA-26a and
induces human airway smooth muscle hypertrophy by suppressing glycogen synthase kinase-3β.
J Biol Chem. 2010; 285: 29336-47.
32. Icli B, Wara AK, Moslehi J, Sun X, Plovie E, Cahill M, et al. MicroRNA-26a regulates
pathological and physiological angiogenesis by targeting BMP/SMAD1 signaling. Circ Res.
2013; 113: 1231-41.
33. Dharaneeswaran H, Abid MR, Yuan L, Dupuis D, Beeler D, Spokes KC, et al. FOXO1-
mediated activation of Akt plays a critical role in vascular homeostasis. Circ Res. 2014; 115:
238-51.
34. Sindhu RK, Ehdaie A, Vaziri ND, Roberts CK. Effects of chronic renal failure on caveolin-1,
guanylate cyclase and AKT protein expression. Biochim Biophys Acta. 2004; 1690: 231-7.
35. Rota M, Boni A, Urbanek K, Padin-Iruegas ME, Kajstura TJ, Fiore G, et al. Nuclear
targeting of Akt enhances ventricular function and myocyte contractility. Circ Res. 2005; 97:
1332-41.
36. Mall G, Rambausek M, Neumeister A, Kollmar S, Vetterlein F, Ritz E. Myocardial
interstitial fibrosis in experimental uremia--implications for cardiac compliance. Kidney Int.
1988; 33: 804-11.
37. Koga K, Yokoi H, Mori K, Kasahara M, Kuwabara T, Imamaki H, et al. MicroRNA-26a
inhibits TGF-beta-induced extracellular matrix protein expression in podocytes by targeting
CTGF and is downregulated in diabetic nephropathy. Diabetologia. 2015; 58: 2169-80.
38. Huse JT, Brennan C, Hambardzumyan D, Wee B, Pena J, Rouhanifard SH, et al. The PTEN-
regulating microRNA miR-26a is amplified in high-grade glioma and facilitates gliomagenesis in
vivo. Genes Dev. 2009; 23: 1327-37.
39. Wei C, Kim IK, Kumar S, Jayasinghe S, Hong N, Castoldi G, et al. NF-κB mediated miR-
26a regulation in cardiac fibrosis. J Cell Physiol. 2013; 228: 1433-42.
40. Bao H, Jiang K, Meng K, Liu W, Liu P, Du Y, et al. TGF-β2 induces proliferation and
inhibits apoptosis of human tenon capsule fibroblast by miR-26 and its targeting of CTGF.
Biomed Pharmacother. 2018; 104: 558-65.
41. Kwon Y, Kim Y, Eom S, Kim M, Park D, Kim H, et al. MicroRNA-26a/-26b-COX-2-MIP-2
loop regulates allergic inflammation and allergic inflammation-promoted enhanced tumorigenic
and metastatic potential of cancer cells. J Biol Chem. 2015; 290: 14245-66.18
42. Li Y, Shen Z, Yu XY. Transport of microRNAs via exosomes. Nat Rev Cardiol. 2015; 12:
198.
43. Escudier B, Dorval T, Chaput N, André F, Caby MP, Novault S, et al. Vaccination of
metastatic melanoma patients with autologous dendritic cell (DC) derived-exosomes: results of
thefirst phase I clinical trial. J Transl Med. 2005; 3: 10.
44. Parolini I, Federici C, Raggi C, Lugini L, Palleschi S, De Milito A, et al. Microenvironmental
pH is a key factor for exosome traffic in tumor cells. J Biol Chem. 2009; 284: 34211-22.
45. Zhang A, Li M, Wang B, Klein JD, Price SR, Wang XH. miRNA-23a/27a attenuates muscle
atrophy and renal fibrosis through muscle-kidney crosstalk. J Cachexia Sarcopenia Muscle.
2018; 9: 755-70.
46. Su Z, Hu L, Cheng J, Klein JD, Hassounah F, Cai H, et al. Acupuncture plus low-frequency
electrical stimulation (Acu-LFES) attenuates denervation-induced muscle atrophy. J Appl
Physiol (1985). 2016; 120: 426-36.
47. Hu L, Klein JD, Hassounah F, Cai H, Zhang C, Xu P, et al. Low-frequency electrical
stimulation attenuates muscle atrophy in CKD-A potential treatment strategy. J Am Soc Nephrol.
2015; 26: 626-35.
48. Su Z, Klein JD, Du J, Franch HA, Zhang L, Hassounah F, et al. Chronic kidney disease
induces autophagy leading to dysfunction of mitochondria in skeletal muscle. Am J Physiol
Renal Physiol. 2017; 312: F1128-40.
49. Wang X, Chinsky JM, Costeas PA, Price SR. Acidification and glucocorticoids
independently regulate branched-chain alpha-ketoacid dehydrogenase subunit genes. Am J
Physiol Cell Physiol. 2001; 280: C1176-83.
50. Wang B, Zhang C, Zhang A, Cai H, Price SR, Wang XH. MicroRNA-23a and microRNA-
27a mimic exercise by ameliorating CKD-induced muscle atrophy. J Am Soc Nephrol. 2017; 28:
2631-40.
51. Naqvi N, Li M, Calvert JW, Tejada T, Lambert JP, Wu J, et al. A proliferative burst during
preadolescence establishes the final cardiomyocyte number. Cell. 2014; 157: 795-807.
19

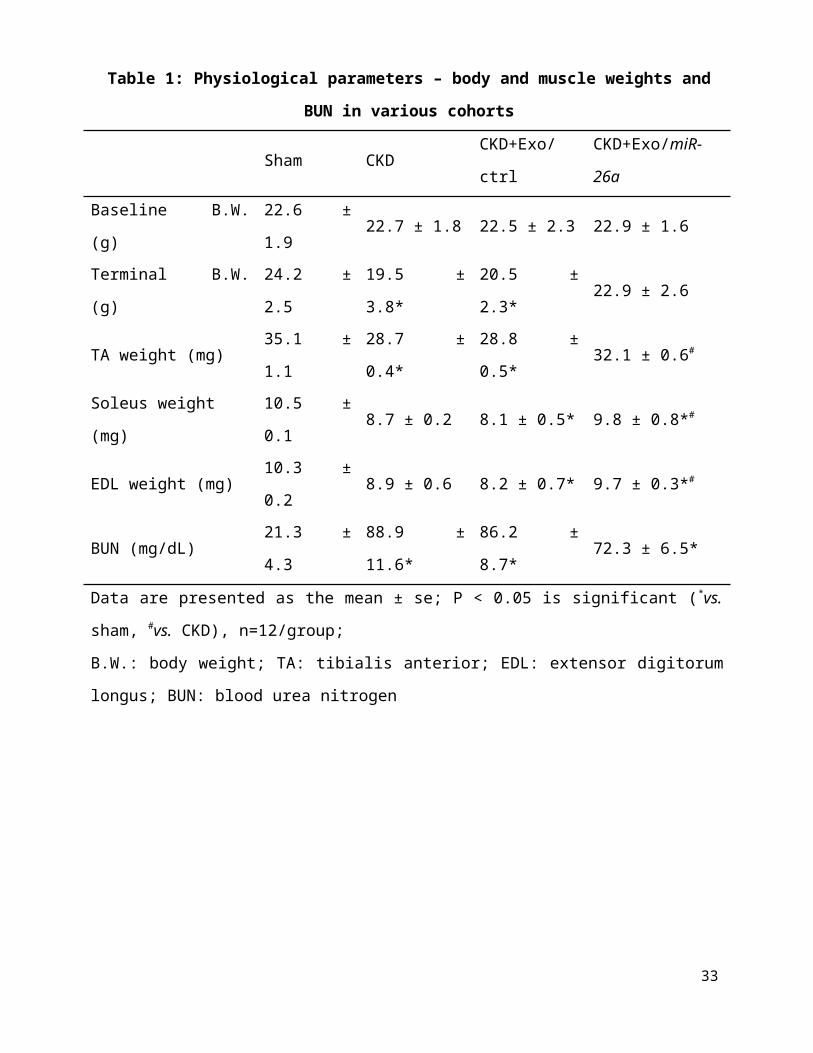
Table 1: Physiological parameters – body and muscle weights and BUN in various cohorts
Sham CKD CKD+Exo/ctrl CKD+Exo/miR-26a
Baseline B.W. (g) 22.6 ± 1.9 22.7 ± 1.8 22.5 ± 2.3 22.9 ± 1.6
Terminal B.W. (g) 24.2 ± 2.5 19.5 ± 3.8* 20.5 ± 2.3* 22.9 ± 2.6
TA weight (mg) 35.1 ± 1.1 28.7 ± 0.4* 28.8 ± 0.5* 32.1 ± 0.6#
Soleus weight (mg) 10.5 ± 0.1 8.7 ± 0.2 8.1 ± 0.5* 9.8 ± 0.8*#
EDL weight (mg) 10.3 ± 0.2 8.9 ± 0.6 8.2 ± 0.7* 9.7 ± 0.3*#
BUN (mg/dL) 21.3 ± 4.3 88.9 ± 11.6* 86.2 ± 8.7* 72.3 ± 6.5*
Data are presented as the mean ± se; P < 0.05 is significant (*vs. sham, #vs. CKD), n=12/group;
B.W.: body weight; TA: tibialis anterior; EDL: extensor digitorum longus; BUN: blood urea
nitrogen
20
Table 2: Cardiac function evaluated by echocardiography
Sham
(n=5)
CKD
(n=5)
CKD+Exo/ctrl
(n=5)
CKD+Exo/miR-26a
(n=5)
Heart weight (g) 0.14±0.01 0.17±0.03 0.18±0.04 0.15±0.01
Heart/Body weight 5.78±0.51 8.72±0.86# 8.78±0.71# 6.55±0.49*
IVS-d (mm) 0.51±0.0 0.48±0.0 0.49±0.0 0.48±0.0
LVEDD (mm) 3.71±0.1 4.01±0.0# 4.11±0.0# 3.83±0.0*
FW-D (mm) 0.50±0.0 0.47±0.0 0.46±0.0 0.48±0.0
IVS-s (mm) 1.05±0.0 1.10±0.0 1.09±0.0 1.07±0.0
LVESD (mm) 2.68±0.1 3.19±0.1# 3.23±0.2# 2.86±0.1*
FW-S (mm) 0.74±0.0 0.73±0.0 0.74±0.0 0.74±0.0
LV Vol-d 58.94±3.1 70.66±1.6# 71.33±1.8# 62.33±2.5*
LV Vol-s 26.98±2.3 40.97±2.3# 41.58±2.7# 32.69±2.1*
%EF 54.59±2.2 42.20±2.2# 41.78±2.1# 49.87±2.4*
FS 27.85±1.5 20.49±1.2# 19.55±1.1# 25.61±1.4*
LV Mass 56.79±2.7 60.84±1.7 61.0±1.8 57.89±2.6#P < 0.05 vs. Sham; *P < 0.05 vs. CKD+Exo-ctrl; IVS-d: interventricular septum diameter;
LVEDD: left ventricular end-diastolic diameter; FW-D: free wall in diastole; IVS-s:
interventricular septum in systole; LVESD: left ventricular end-systolic diameter; FW-S: free
wall in systole; LV Vol-d: left ventricular volume in diastole; LV Vol-s: left ventricular volume
in systole; %EF: % ejection fraction; FS: fractional shortening; LV Mass: left ventricular mass
21

Figures:
Figure 1. miR-26a was decreased in the heart and skeletal muscle of CKD mice
(A) Small RNA libraries were prepared using a SeqMatic tailormix miRNA sample preparation
kit. The adapter-ligated libraries were then enriched using PCR amplification followed by gel
enrichment for the mature miRNA library. The libraries were quantified on a Qubit® 2.0
Fluorometer using the High Sensitivity dsDNA assay. The heat map showed that miR-26a
(orange square) was decreased in serum exosomes from CKD mice compared with sham mice (n
= 3/group).
(B) Total RNA was extracted from skeletal muscle, heart, kidney, liver, intestine and lung of
normal mice. The expression of miR-26a-5p was assayed by real-time qPCR. The bar graph
shows microRNA expression from each organ. The results are normalized to U6 (Bars: mean ±
se; n = 6/group).
(C) Total RNA was extracted from the hearts of sham and CKD mice. The expression of miR-
26a-5p was assayed by real-time qPCR at 8 weeks after CKD surgery. The bar graph shows
microRNA from the heart of CKD mice compared with levels in sham mice (represented by 1-
fold). The results are normalized to U6 (Bars: mean ± se; n = 9/group; #p<0.05 vs. control).
22
(D) Total RNA was extracted from skeletal muscle of sham and CKD mice. The expression of
miR-26a-5p was assayed by real-time qPCR at 8 weeks after CKD surgery. The bar graph shows
microRNA from the gastrocnemius muscle of CKD mice compared with levels in sham mice
(represented by 1-fold). The results are normalized to U6 (Bars: mean ± se; n = 9/group; #p<0.05
vs. control).
23
Figure 2. Exosome-carried mediator induces insulin resistance in skeletal and cardiac
muscle cells
Cultured skeletal muscle satellite cells or cardiac H9C2 cells were treated with media containing
5% sham mouse serum (control) or 5% CKD mouse serum (uremia) for 24 hours.
(A) Total RNA was extracted from satellite cells. The expression of miR-26a-5p in cells was
assayed by real time qPCR. The bar graph shows miR-26a-5p from the uremic serum treatment
group compared with the level in the control serum treatment group (represented by 1-fold). The
results are normalized to U6 (Bars: mean ± se; n=8/group; #p<0.05 vs. control serum).
(B) Total RNA was extracted from cardiac H9C2 cells. The expression of miR-26a-5p in cells
was assayed by real time qPCR. The bar graph shows miR-26a-5p from the uremic treatment
group compared with the levels in the control serum treatment group (represented by 1-fold).
The results are normalized to U6 (Bars: mean ± se; n=8/group; #p<0.05 vs. control serum).
(C) Protein was isolated from satellite cells. PTEN and Akt in cell lysates were measured by
western blots from different groups of cells. The bar graph shows the fold change of each protein
band compared with levels in control serum treatment group represented by 1-fold. (Bars: mean
± se; n = 8/group; #p<0.05 vs. control serum).
24
(D) Protein was isolated from H9C2 cells. TGFβ1 and Akt in cell lysates were measured by
western blots. The bar graph shows the fold change of each protein band compared with levels in
control serum treatment group represented by 1-fold. (Bars: mean ± se; n = 8/group; #p<0.05 vs.
control).
25
Figure 3. Provision of miR-26a-5p in skeletal muscle attenuated CKD-induced muscle
atrophy
(A) Experiment procedure: Mice were divided into 4 groups: sham, CKD without exosome
treatment, CKD with intramuscular injection of exosome-encapsulated microRNA control
26
(Exo/ctrl) and CKD with intramuscular injection of exosome-encapsulated miR-26a (Exo/miR-
26a) mice, once per week.
(B) Total RNA was isolated from TA muscle of sham, CKD, CKD plus Exo/ctrl and CKD plus
Exo/miR-26a (Exo/miR-26a) mice. The expression of miR-26a-5p in muscle was assayed by real
time qPCR. The bar graph shows the expression levels of the three miR-26a in each group
compared with levels in the sham mice (represented by 1-fold). The results are normalized to U6.
(Bars: mean ± se; n=9/group; #p<0.05 vs. sham and *p<0.05 vs. CKD+Exo/ctrl).
(C) The representative cross-sectional area of TA muscle of sham and CKD mice. Cryosections
of TA muscles were immunostained with anti-laminin antibody. The bar graph shows the
frequency distribution of fiber cross-sectional areas (µm2) in sham (orange) and CKD (blue)
mice (n=6/group).
(D) The representative cross-sectional area of TA muscle of CKD plus Exo/ctrl and CKD plus
Exo/miR-26a (Exo/miR-26a) mice. The bar graph shows the frequency distribution of fiber
cross-sectional areas in CKD plus Exo/Ctrl (blue) and CKD with Exo/miR-26a (orange) mice
(n=6/group).
(E) Akt, p-Akt, GSK-3β, pGSK-3β, FoxO1, pFoxO1, PTEN, TRIM63/MuRF1 and
FBXO32/atrogin-1 were measured by western blot in CKD mice with or without miR-26a. The
bar graph shows the fold change of each protein band (bottom panel) or ratio of phospho-protein
to total protein (top panel) compared with levels in sham mice (represented by a line at 1-fold).
GAPDH was used as a loading control (Bars: mean ± se; n=9/group; *p<0.05 vs. CKD and #p<0.05 vs. sham).
27

Figure 4. miR-26a was increased in the heart of mice with intramuscular injection of
Exo/miR-26a
(A) Exosomes were labeled with 1 μmol/l fluorescent lipophilic tracer DiR. Mice were injected
in skeletal muscle with Exo/miR-26a. Fluorescent organ images were acquired using a Bruker
Small Animal Optical Imaging System. Normal mice (right) were not injected; sham mice
(middle) and CKD mice (left) were injected with Exo/miR-26a in the left TA muscle. The
fluorescence in the heart and TA muscle was assessed at 7 days after injection.
(B) The fluorescence intensity of the heart was acquired by a Bruker Small Animal Optical
Imaging System at 7 days after injection. The control was no exosome injection. The bar graph
28
shows fluorescence intensity in the heart. (Bars: mean ± se; n=6/group; *p<0.05 vs. control, #p<0.05 vs. sham).
(C) Total RNA was isolated from the heart of sham, CKD, CKD plus Exo/ctrl and CKD plus
Exo/miR-26a (Exo/miR-26a) mice. The expression of miR-26a-5p was assayed by real time
qPCR. The bar graph shows miR-26a expression in hearts from each group compared with levels
in sham hearts (represented at 1-fold). The results are normalized to U6. (Bars: mean ± se; n =
6/group; #p<0.05 vs. sham, #p<0.05 vs. CKD + Exo/ctrl).
(D) Total RNA was isolated from serum exosomes of sham, CKD, CKD plus Exo/ctrl and CKD
plus Exo/miR-26a (Exo/miR-26a) mice. The expression of miR-26a-5p was assayed by real time
qPCR. The bar graph shows miR-26a expression in exosomes from each group compared with
levels in sham exosomes (represented at 1-fold). The results are normalized to miR-103. (Bars:
mean ± se; n = 6/group; #p<0.05 vs. sham, #p<0.05 vs. CKD + Exo/ctrl).
(E) Exosomes were isolated from the serum of sham, CKD, CKD plus Exo/ctrl and CKD plus
Exo/miR-26a (Exo/miR-26a) mice and lysed in RIPA buffer. The insulin signaling- and fibrosis-
related proteins phosphorylated FoxO1, PTEN and TGF-β1 were measured by western blot.
TSG101 is an exosome protein marker. All protein band densities are normalized to the
appropriate GAPDH control. The bar graph shows total PTEN, total TGF-β1 and the ratio of
phospho-FoxO1 to total FoxO protein. The fold change is compared to levels in the control plus
Exo/miR-ctrl (represented by a line at 1-fold). (Bars: mean ± se; n=6/group; *p<0.05 vs.
CKD+Exo//ctrl and #p<0.05 vs. sham).
29

Figure 5. Intramuscular injection of Exo/miR-26a attenuated uremic cardiomyopathy in
CKD mice
(A) Representative Masson’s Trichrome staining of hearts from sham, CKD, CKD plus Exo/ctrl
and CKD plus Exo/miR-26a (Exo/miR-26a) mice. The bar graph shows collagen (blue in
staining) measured at 8-weeks using the Micro-suite Five Biological Software (Olympus,
30

Melville, NY, USA). The results show the fold change compared to sham levels, represented as a
dotted line at 1-fold (Bars: mean ± se; n = 6/group; #p<0.05 vs. sham, *p<0.05 vs. CKD with
Exo/ctrl).
(B) Representative cryosections of heart from the four different treatment groups were
immunostained with a fibronectin antibody. The bar graph shows fibronectin measured at 8-
weeks. Fold change reflects a comparison with sham levels, represented as a dotted line at 1-fold
(Bars: mean ± se; n = 6/group; #p<0.05 vs. sham, *p<0.05 vs. CKD with Exo/ctrl).
(C) Protein was isolated from the heart of sham, CKD, CKD plus Exo/ctrl and CKD plus
Exo/miR-26a (Exo/miR-26a) mice. The fibrosis-related protein CTGF and collagen1A1 in heart
lysates were measured by western blots from different groups of mice. The bar graph shows the
fold change from sham mice, represented by a line at 1-fold. (Bars: mean ± se; n = 9/group; #p<0.05 vs. sham, *p<0.05 vs. CKD plus Exo/ctrl).
31
Figure 6. miR-26a limits insulin resistance by targeting FoxO1, leading to improved cardiac
function
(A) Insulin signaling protein markers Akt, p-Akt, GSK-3β, pGSK-3β, PTEN, FoxO1, and
pFoxO1 were measured by western blot in the heart of sham, CKD, CKD plus Exo/ctrl and CKD
plus Exo/miR-26a (Exo/miR-26a) mice. The bar graph shows the fold change of each individual
protein band or ratio of phospho-protein to total protein compared with levels in sham mice
(represented by a line at 1-fold). GAPDH was used as a loading control (Bars: mean ± se;
n=9/group; #p<0.05 vs. sham, *p<0.05 vs. CKD plus Exo/ctrl).32
(B) Binding of miR-26a to the 3’-UTR of FoxO1 inhibits FoxO1 translation. H9C2 cells were
transfected with luciferase pLuc-ctrl vector or the vector containing the 3’-UTR of FoxO1
(pMIR-FoxO1/3358 – 3364) or a vector containing a mutated 3’-UTR of FoxO1 (pMIR-mut-
FoxO1). Cells were cotransfected with renilla luciferase as a transfection control. Cells were then
transduced by adenovirus containing miR-26a precursor RNA (miR-26a) and control virus (miR-
ctrl). Luciferase activity in cells that received the pLuc-ctrl (no target 3’UTR) and miR-ctrl
(sequence unrelated to miR-26a) was designated as 100%. The response to miR-26a is expressed
as a percent relative to the control. Bars present the results from triplicate determinations. Data:
mean ± se; n=9; #p<0.05 vs. FoxO/3UTR + miR-ctrl.
(C) Representative echocardiographic evaluations of cardiac function in sham, CKD, CKD plus
Exo/ctrl and CKD plus Exo/miR-26a (Exo/miR-26a) mice are shown. Echocardiography was
performed on lightly anesthetized mice (under 1-2% isoflurane, in oxygen) using a Vevo 3,100
ultrasound system (VisualSonics). The green line represents left ventricular end-diastolic
dimensions, and the red line represents left ventricular end-systolic dimensions. Detailed
information is provided in table 2.
(D) Comparison of miR-26a expression in Flag-Exo/miR-26a- and MSTP-Exo/miR-26a-injected
mice. RNA was isolated from serum exosomes from sham and CKD mice treated with Flag-
Exo/miR-26a and MSTP-Exo/miR-26a. The expression of miR-26a-5p was assayed by real-time
qPCR. The bar graph shows the expression of miR-26a from each cohort compared with levels in
sham plus Flag-Exo/miR-26a injection mice (represented at 1-fold). The results are normalized
to miR-103a. (Bars: mean ± se; n=6/group).
(E) RNA was isolated from the hearts of sham and CKD mice. The expression of miR-26a-5p
was assayed by real-time qPCR. The expression of miR-26a from each cohort compared with
levels in sham plus Flag-Exo/miR-26a-injected mice (represented at 1-fold). The results are
normalized to U6. (Bars: mean ± se; n=6/group; *p<0.05 vs. CKD + Flag-Exo/miR-26a, #p<0.05
vs. sham + MSTP-Exo/miR-26a, &p<0.05 vs. Flag-Exo/miR-26a).
33