muscle activity and jaw movements as predictors of chevi'ing
TRANSCRIPT

Muscle Activity and Jaw Movementsas Predictors of Chevi'ing Performance
Robin J. C. Wilding, BDS, Dip Pros,MDent, PhD
ChairmEinDepartment of Oral Biology
Manzur Shaikh, BScDepartment of Orai Bioiogy
University of the Western CapeMitcheils PlainSoutfi Afnca
Correspondence to:Dr Robin J C. WiidingDepartment of Orai BiologyUniversity cf the Western CapeP. Bag X08 Mitchelis Plain, 7785South Africa
Chewing performance can be defined in terms of ihe reductionmfood particle size after IS chewing strokes. In this study, the rela-tionship between chewing performance and electromyographicactivity was investigated to develop optimal values of electromyo-graphic variables, based on their ability to predict chewing perfor-mance. Electrognathographic and electromyograpbic recordingsfrom surface electrodes over the digastric (abductor), masseter,and temporalis (adductors) muscles were made from 24 subjectswhile they cheiued a hard fruit gum. A moderate negative correla-tion tuas found between the food particle size and tbe root meansquare calculation for masseter activity (-.48; P < .01). Weakerpositive correlations were found between particle size and theasyncbrony of ipsilateral and contralateral anterior temporalismuscles f.36; P < .OS). A multiple regression model of electromyo-graphic and electrognathographic variables was able to predictchewing performance with an R value of .66. If chewing perfor-mance is used as an output measure of masticatory function, itmay be possible to determine optimal ranges for electromyo-graphic variables and jaw movements.J OROFACIAL PAIN 1997;11:24-36.
key words: chewing performance, jaw movement,elect roniyogtaphy
Chewing requires two main processes: selection and hreak-age.' Selectioti involves the mantpulatton of unreducedfood parricles onto occluding tooth sutfaces by movements
of the tongue, jaws, lips, and cheeks. In monkeys, movement ofthe tongue and lips not only helps select food, but it also influ-ences the shape of the chewing cycle. Some aspects of jaw move-ment in humans are fair predictors of chewing performance.^ Jawmovement is not produced by any single muscle, but it is affectedby a variety of synergistic combinations of functioning unitswithin several jaw muscles."* For any particular occlusal force anddtrection, there are cettain combinations of muscles that generatethe force most efficiently. Therefore, the relation between muscleactivtty and jaw movetnent ts complicated by the large numher ofdistinct units in each masticatory muscle that can function inde-pendently of one another.*' Although the occlusal force vector gen-erated at a partlculat tooth by even the smallest physiologic unitcan be determined theoretically, rhe number of possihle interac-tions with other untts makes it difficult to predict jaw movementon the hasis of electromyographic (EMG) activity recorded withonly a few surface electrodes. In spite of this complexit;', associa-tions have heen found, for exatnple berween lateral grinding move-tnents and contralateral jaw tnuscle activity.^"'
24 Volume 11. Number 1, 1997

Wilding/Shaikh
Claims^" '- have been made for the value ofEMG recordings in the diagnosis of dysfunctionalmovements and activity of temporomandibular dis-orders (TMD). In a review of the literature, Lundand Widmar'^ concluded that, as yet, the data fromasymptomatic subjects are not adequate to supportthe use of EMG recording in tbe diagnosis of dys-function. Diagnostic tests require a substantial base-line of both normative data and a reliable gold stan-dard of disease to allow predictions to be madewitb acceptable levels of accuracy, precision, sensi-tivit)', and specificity.'""
The purpose of the present study was to determinewhether chewing performance could be used toidentify an optimal range of muscle activity. Thesedata mighr define a useful baseline against wbichputative muscle dysfunction could be compared. Inaddition, evidence of an association between opti-mal muscle activity and optimal ¡aw movementsderived from an earlier study^ was sought.
Materials and Methods
Subjects
The subjects who participated in the present studyare the same subjects who participated in earlierstudies^''^ of jaw movement and chewmg perfor-mance. The sample comprised 12 women and 12men with a mean age of 27.3 years. None of thesubjects had signs or symptoms of TMD.
Chewing Performatice
Chewing performance on the left and right sides ofthe dentition was determined using weighed wholealmonds as a test food. Subjects chewed for 10 andthen 20 times on either side. The food particle sizeand area were measured using digital image analy-sis.'* Tbe data were analyzed, and the median sizecategory after 10 and 20 chewing strokes was cal-culated using the Rosin-Rammler function accord-ing to Olchoff et al.'^ Tbe particle size was calcu-lated for 15 chewing strokes using the functionderived by Olrhoff et al.'^
Data Collection
Electromyographic recordings were made usingsurface electrodes over the posterior and anterioraspects of the ramus of the mandible, tbe region ofthe anterior temporal muscle, and under the chinover the region of the anterior belly of the digastricmuscles on either side of the jaw. Although these
regions of sampling may not represent the activityof muscles defined in anatomic terms, the electricalactivity sampled from these regions is referred tofor convenience as EMC of superficial and deepmasseter, anterior temporalis, and anterior digas-tric muscles.
The subjects chewed on a hard fruit gum for 15seconds on the left side first and then on the rightside. Incisai movements were simultaneouslyrecorded in three planes using a Sirognathograph(Siemens, Benheim, Germany). The signals weredigitized ar 300 Hz and were converted to ASCIIfiles using Bio-Pak equipment (Bio-Research, Mil-waukee, WI). The data for vertical displacementwere used Co separate the EMG data into a seriesof chewing cycles. The mean duration for eachchewing cycle was calculated and is referred ro asthe cycle time.
Electromyography
A moving average of 20 data points was used torectify and smooth each value using a root tneansquare calculation (RMS). Eor each contractionphase, the RMS and peak value were calculated,and tbe mean values for all cycles were found. Theperiod during active contraction (burst time) wascalculated for each closing cycle for the masseterand temporalis muscles. Eor each of the adductors,the integrated EMG (iEMC) was calculated foreach closing cycle, and the mean was found for thetotal period of recording. The iEMG was also cal-culated for rhe digastric data during jaw opening.
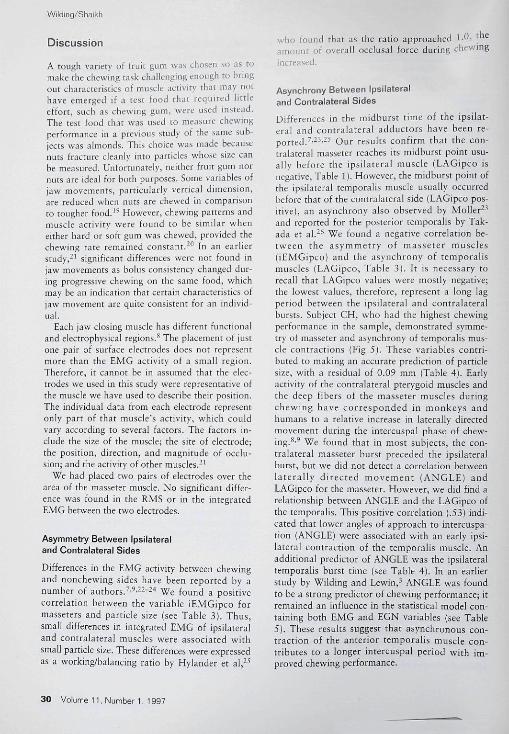
The difference between the iEMG for ipsilateraland conrralateral adductors was calculated for eachclosing phase, and the mean was calculated (Fig 1).This variable is referred to as iEMGipco. A pointfound along the rime axis during each muscle burstequally divided the area under the smoothed andrectified curve. This point was used to define rhemidpoint of the burst. The difference between rhemidpoints of ipsilateral and contralateral adducrorswas used to express the phase lag between contrac-tions of tbe chewing and nonchewing sides and isreferred to as LAGipco. From the manner in whichthe phase lag was calculated, a negative value indi-cated that the ipsilateral midburst point occurredearlier (lower time value) than did the contralateralmidburst point. The difference between the integralof each adductor (tempotalis and masseter) and theabductor (digastric) of the same side, during theadductor burst period, was calculated. This wasdone ro represent the net adductor iEMG availablefor that muscle during closing (Fig 2). This variableis referred to as lEMGnet.
Journal of Orofacial Pain 2 5

Wilding/Shaikh
4G0
300
J 200UJ
100
0
/ •
nmm
M
Contralateral masseter i l H | d
Ipsilaterai masseter fl^^^l
iEMGipco p ^ r ^ a
jf 1 ZlW
LAGipco
Time (800 milliseconds]
Fig 1 Rectified and smooched EMGsignals for one chewing cycle- Theareas under the curve for the con-tralateral masseter EMC values aresuperimposed over the ipsilateralmasscter EMG values. The variablejEMGipco represents the differencebetween these two areas. The timedifference between the center of eacharea is represented by the variableLAGipco.
>
lU
400
300
300
100
S ^ Abductot
J B Adductor
• iEMGnet
Time (800 m
ÁÊÊL
il ^HH
¡seconds}
Fig 2 The area between the adductor(masseter and temporalisi and abduc-tor (digastrici curves during the dos-ing phase reflecrs the net adductorE.MG and is represented by the vari-able iEMGnet.
In view of the potential for voltage reversals todescribe some of the characteristics of an EMGwave form, the number of turns and the mean turninterval was calculated after the method describedby Junge and Clark.'^
Jaw Movement
Displacements in the frontal and sagittal plane ofthe midincisal point were transformed onto a grid
of frequency distributions. The frontal grid con-sisted of a matrix 40 rows deep with 20 columnsfor each side of the midline. For every datarecord of displacement (x, y), a count was storedin the grid window that enclosed those coordi-nates. Statistical analysis of the frequency distri-bution of displacements was used to describe thecharacteristics of the most frequented pathwaysduring chewing.^ They included the followingvariables:
26 Volume 11, Number 1, 1997

Wilding/Shaikh
Table 1 Mean iEMG and SD for Ipsilaterai and Contralateral Adductors andDigastric Muscles During Closing and LAGipco
MeanSD
Masserer
Ipsi-laterai
48.529 8
Contra-lateral
34 r24 8
Temporalis(|iVs)
Ipsi-laterai
42,g25,0
Contra-lateral
36,024,7
Digastric(liVs)
Ipsi- Contra-lateral lateral
21.5 19,88.87 8,48
LAGipco (ms)
Mas-serer
20 337,6
Temp-orally
-32 542 6
Digas-tric
-15 S26,2
•Pi ,01,A negative value foi LAGipco reflecis ariy contraction oF Che ipsilaleral adductor.
1. ANGLE was the angle between the most fre-quented approach to the region of maximalintercuspation and the horizontal plane: thehigher the angle near intercuspation, the flat-ter the chewing cycle would appear to be inthe frontal plane.
2. BIMODE was the percentage of rows in whicha bimodal pattern in the frequency distribu-tion was found: the higher the percentage, themore separated would be the opening andclosing pathways.
Statistical Analysis
A two-sample í test was used to investigate differ-ences between ipsilaterai and contralateral chewingsides and gender differences. A simple linear regres-sion was used to rest for correlations between parti-cle size, EMG, and electrognathographic (EGN)variables, A stepwisc multiple regression was usedto develop a model to predict particle size, usingvariables derived from EMG data, A second modelwas derived using EGN- in addition to EMG-derived variables. All data were analyzed usingStatgraphics Plus {Manugistics, Rockviile, MD)software.
Results
The sample mean for the masseter EMG (RMS)during its active burst was 145.4 (lV (standarddeviation [SD] 60.8), and for the temporalis ante-rior it was 133,6 pV (SD 55,7). The mean valuefor the digastric RMS during the opening phase ofmovement was 53.8 pV (SD 21.3), No statisticallysignificant difference was found between thesuperficial and deep masseter RMS; thus, thesevalues were combined for analysis.
The iEMG values for ipsilaterai and contralat-eral chewing sides were compared, and a statisti-
cally significant difference was found herweentheir sample means for the masseter muscles {P <.0011, but not for the temporalis or digastric mus-cles (Table 1), The sample mean for rhe phase lagbetween ipsilaterai and contralateral massetersmidburst was 20,3 milliseconds (SD 37.6), whichindicates that the masseter burst on the contralar-eral side usually occurred before that on the ipsi-laterai side. The sample mean for the phase lag forthe temporalis muscle (-32.5 milliseconds, SD42,6) indicated that for rhe temporalis muscle, theipsilaterai midburst usually occurred before that ofthe contralateral side, A patrern similar to that oftemporalis muscles was found for the digastricmuscles, with a lag between the ipsilaterai andcontralareral sides of-15,6 milliseconds (SD 26.2),
The sample mean for iEMGnet was 27.0pVseconds (SD 24.2) for the masseter and 21,4pVseconds (SD 20.5) for the temporalis. The meanduration of the burst period was 149,2 milliseconds(SD 100,9) for the masseter muscles and 133.1 mil-liseconds (SD 77.5) for the temporalis muscles. Thesample mean for the average turn inrerval was160.9 pV (SD 45.1) for the massercr muscles and155.9 \iV (SD 45,4) for the temporahs muscles.
Gender Differences
The mean iEMG for the temporalis muscle washigher in women (51,1 pVseconds, SD 22.2) thanin men (34.8 pVseconds, SD 25.4) (P < ,02). Themean for iEMGnet (temporalis) for women (98.0pV, SD 30.7) was higher than for men (72.9 JJV,SD37,2)(P<.02) (Table 2).
Correlations Between Variables
Several EMG variables were found to correlare neg-atively with particle size. These included the RMSvalues for rhe masseter, temporalis, and digastricmuscles, and the masseter turn frequency. The
Journal of Orofsclsl Pain 27

Wilding/Shaikh
Table 2 Sample Means {and SD)for ¡EMG (pVs) in Temporalis MuscleDuring Chewing in Men and Women
Mean iEMG
Mean ¡EMGnct
Men(n= 12]
34.S(25.4)72.9 fiV
(37.2)
Women(n = 12]
51.1(22.2)98.0 pV
(30.7)
Table 3 Correlation Coefficients for Panicle Size, EGN, and EMG Variables
'article s ze\^asseteVlasseteVlassetevlasseteTempora
RMS¡EMG¡EMGnetlEMGipcos LAGipcQ
Digastnc lEMGBIMODEANGLECycle time
Particlesize
- 4 8- 3 3-.30-31
36-.32-.41
46-.34
Mas-seterRMS
>.,
94.92.53
-.386257
- 4 2.39
Mas-seter
lEMG
-* ' "
.91
.54-.44
.71-.22- 4 4
37
Mas-seter
iEMGnet
'
' "*
.49-.42
.42-.32-.43
33
Mas-seter
iEMGipco.
**-......
-.36.45.04
-.172A
Temp-oralis
LAGipco
•
"*
-.33-.26
.53,00
Digas-tric Cycle
iEMG BIMODE ANGLE time.
.. . ••"** " ''* * • .
03-.33 -.48.32 .11 04
—p< .001—P< .002
highest correlation was found for masseter RMS(coefficient - .48, P < .01). The variable iEMGipcofor masseters also had a negative but weaker corre-lation with particle size (coefficient - . 31 , P < .05)(Table 3). A positive correlation between particlesize and the LAGipco for temporahs muscles wasfound (coefficient .36, P < .05). The sample meanvalue for this phase lag was negative, indicatingthat the ipsilateral temporalis burst usually oc-curred before the contralateral burst.
A negative correlation between particle size andcycle time was found (-.34, P < .01). A positivecorrelation between ANGLE and particle size wasfound (.46, P < .001). Correlations were fotmdbetween ANGLE and several EMG variables; themost significant was with LACipco for temporahs(.53, ?< .002 ) (Table 3).
No correlations were found between the RMSpeak values for adductors and particle size. A strongcorrelation of .91 (P < .001) was found between theturns interval for masseter and masseter RMS.
Multivariate Models
A stepwise multiple regression was used to gener-ate a number of models using EMG data as the
dependent variables. It was possible to predict44% of the variance of the vertical dimension ofjaw opening from EMG variables (Table 4, Eig 3).Tbe masseter, temporalis, and digastric RMS,iEMG, and iEMGnet had powerful influences inthe model. A model constructed to predict chewingcycle time had an adjusted R- value of .48 and wasdominated by masseter iEMG and tbc duration ofthe temporalis burst. The relationship betweenEMG variables and jaw movement patterns wasrevealed in a model in which ANGLE was thedependent variable. The components of the modelfor ANGLE were dominated hy variables repre-senting temporalis muscle activity.
The logarithm of the particle size was predictedwith an adjusted R value of .51 using EMG vari-ables. The masseter RMS, the lEMG, and the tem-poralis LAGipco were the dominant adductorvariables. The model also included the digastriclEMG.
A model containing both EGN data and EMGvariables provided a more accurate prediction ofparticle size than cither group on its own. Thiscombined model had an adjusted R^ value of .66(Table 5, Eig 4). The EMG components of themodel included most of those selected for EMG
28 Volume 11, Number 1, 1997

Wilding/Shaikh
Table 4 Components of Multivariate ModelsWith EMG Data as Indepetidenr Variables
Opentng Cycle Log particlemax time ANGLE size
R- = .44 R- = .48 R- = .46 R = .5 I
WasseterRMS ++¡EMG + + + + + + -
.|. +¡EWGnet
Tempo railsRMS¡EMG 4- 4-LAGipco f + -t + + .|.Burst time¡EMGnet .1.
D¡gastncIEMG
For eacti modei. Ihe mfiuerce of eacor - signs. The r timber of signs refleing the varabie from the modei loneR' vaiues are adjusled.
I component is indicated by í:l5 the F factor for adding oriign = d factor ijnitsi
Table 5 Components of a Multivariate ModelWith Both EMG and ECN Data as DependentVariables, With the Logarithm of Particle Size asthe Dependent Vatiable
Independent variables Influence'
ANGLE' ' ~ ~~nBiMODECycle TimeMasseterRMSMasseter iEMG (iog] + +Masseter iEMGnet +Temporalis LAGipco + +
fi2 adjusted = 66.R' adjusted ^ 75. including indicator variable (gender).For each model, ttie intiuence of each cümponent is indicated by eithei
+ o r - signs Tlie number of signs reiiects the F factor for adding orremoving Ihe varjabie From the model tone siqn = 4 F factor unils).
esO
bser
ved
val
0.6
0.2
-0.2
-0.6
-1.0
-1-4
-1.8
- .
...
• • /
-1.8 -1.4
* • * " ^
I
-1.0 -0.6 -0.2 0.2
Predicted values
/ -
• • -
^ •
. -
0.6
Fig 3 Predicted values for particle size caktilated fromthe EMG model (Tahle 4} and the ohserved values forparticle size. Both scales are logarithmic. The i i ' valueof the mtjltivariate model was .51.
iues
Obs
erve
d ve
0.6
0.2
-0.2
-0.6
-1.0
-1-4
-1.8
--
-
;
-1.8
* • /
-1.4 -1.0 -0.6 -0.2 0.2
P red idea values
• -
•
. . .
0.6
Fig 4 Observed values for particle size and tho5e calcu-lated from the EMG and EGN model, excluding theindicator variable gender (Table 5}. The K v;ilue of thismodel was .66.
alone and those listed in Table 4. The EGN vari-ables all had high coefficients in the model, Amodel conststing of just the three EGN vatiables,ANGEE, BIMODE, and chewing time, had anadjusted R^ value of .53.
The addition of gender as an tndtcator variableraised the predictive accuracy of the comhinedEGN/EMC model to an adjusted ÍÍ- value of .75.Indicator variahles help to show the matn effectsof a gtouping of data in a regression model.^"^
Journai of Orofacial Pain 2 9
Wilding/Shaikh
Discussion
A tough variety of fruit gum was chosen so as tomake the cbewing task cballenging enough to bringout characteristics of muscle activity that may nothave emerged if a test food that required littleeffort, such as chewing gum, were used instead.The test food that was used to measure chewingperformance in a previous study of the same sub-jects was almonds. This choice was made becausenuts fracture cleanly into particles whose size canbe measured. Unfortunately, neither fruit gum nornuts are idea! for both purposes. Some variables ofjaw movements, particularly vertical dimension,are reduced when nuts are chewed in comparisonto tougher food.'' However, chewing patterns andmuscle activity were found to he similar wheneither hard or soft gum was chewed, provided thechewing rate remained constant.^" In an earlierstudy,-' significant differences were not found injaw movements as bolus consistency changed dur-ing progressive chewing on the same food, whichmay be an indication that certain characteristics ofjaw movement are quite consistent for an individ-ual.
Each jaw closing muscle has different functionaland electro physical regions.** The placement of justone pair of surface electrodes does not representmore than the EMG activity of a small region.Therefore, it cannot be in assumed that the elec-trodes we used in this study were representative ofthe muscle we have used ro describe rheir position.The individual data from each electrode representonly part of that muscle's activity, which couldvary according to several factors. Tbe factors in-clude the size of the muscle; the site of electrode;the position, direction, and magnitude of occlu-sion; and the activity of other muscles.-'
We had placed two pairs of electrodes over thearea of the masseter muscle. No significant differ-ence was found in the RMS or in the integraredEMG berween rhe two electrodes.
Asymmetry Between Ipsilateraland Contralateral Sides
Differences in the EMG activity between chewingand nonchewing sides have been repotted by anumber of authors. - ' ^"-'* "We found a positivecorrelation between the variable iFMGipco formasseters and particle size (see Table 3). Thus,small differences in integrated EMG of ipsilatetaland contralateral muscles were associated withsmall particle size. These differences were expressedas a working/balancing ratio by Hylander et al, ^
who found that as tbe ratio approacbed I.Ü. f ^amount of overall occlusai force during chev/ingincreased.
Asynchrony Between Ipsilateraland Contralateral Sides
Differences in the midburst time of the ipsilat-eral and contralaterai adductors have been re-ported. -^^-^^ Our results confirm that the con-tralateral masseter reaches its midburst point usu-ally hefore the ipsilareral muscle (LAGipco isnegative. Table 1). However, the midburst point ofthe ipsilateral temporalis muscle usually occurredbefore that of the conrralateral side (LAGipco pos-itive), an asynchrony also observed by Moller^^and reported for tbe posterior temporalis by Tak-ada et al.'* We found a negative correlation be-tween tbe asymmetry of masseter muscles(iEMGipco) and the asynchrony of temporalismuscles (LAGipco, Table 3). It is necessary torecall that LAGipco values were mostly negative;the lowest values, therefore, represenr a long lagperiod between the ipsilateral and contralateralbursts. Subject CH, who had the highest chewingperformance m the sample, demonstrated symme-try of masseter and asynchrony of temporalis mus-cle contractions (Fig 5). These variables contri-buted to making an accurate predicrion of particlesize, with a residual of 0.09 mm (Table 4). Earlyactivity of the contralateral pterygoid muscles andtbe deep fibers of the masseter muscles duringchewing have corresponded in monkeys andhumans to a relative increase in laterally directedmovement during the intercuspal phase of chew-ing.*'' We found that in most subjects, the con-tralateral masseter bursr preceded the ipsilateralburst, but we did not detect a correlation betweenlaterally directed movement (ANGLE) andLACipco for the masseter. However, we did find arelarionship between ANGLE and the LAGipco ofthe temporalis. This positive correlation (.53) indi-cated that lower angles of approach to intercuspa-tion (ANGLE) were associated with an early ipsi-lateral contraction of the temporalis muscle. Anadditional predictor of ANGLE was the ipsilateraltemporalis burst time (see Table 4). In an earlierstudy by Wilding and Lewin, ANGLE was foundto be a strong predictor of chewing performance; itremained an influence in the statistical model con-taining both EMG and EGN variables (see Table5). These results suggest that asynchronous con-traction of the anterior remporalis muscle con-tributes to a longer intercuspal period with im-proved chewing performance.
30 Volume 11, Number 1, 1997

Wildrng/Shaikh
Lateral displacement
Digastric
100
0
Fig 5 Rectified and smoothed EMG signals for the ipsilateral and c;ontralateral adductor mus-cles during three chewing strokes on the left side for subject CH. The lateral displacement inthe frontal plane of the midincisor point is included. The difference between ipsilateral andcontralateral masseter curves (iEMGipco = 112 (lVsecunds) and the phase lag between ipsilat-eral and eontralateral temporalis muscles (LAGipco - -17.2 milliseconds) contributed to accu-rately predicting the superior chewing performance of this subject (Table 6}.
Journal of Orofacial Pain 31

Wilding/Shaikh
Lateral displacement
Digastric
100
0
Bight
Fig 6 Results for subject KD. (This figure is not drawn to the same scale as Fig 5.) The lowmean RMS [65.0 pV), the coactivation of digastric (low ¡EMCnet), and the reverse syn-chrony of temporalis muscles (LAGipco = 9,8 milliseconds] contributed to accurately pre-dicting the inferior chewing performance of this subject (Table 6), The reversed sequence ofthe first two chewing cycles, which approach intercuspation from the nonchewing side,were reflected by a more vertical approach to intercuspation (ANGLE ~ 7,5 degrees).
The relative significance of temporalis activity asa determinant of chewing performance was sug-gested hy Thexton and McGarrick,* who foundthat the temporalis muscles in the cat were particu-larly active at a time late in jaw closure after toothcontact with the bolus. Takada et al^^ found that a
longer duration of rhe posterior temporalis was afeature of chewing harder food. These observa-tions, together with our findings, confirm the sug-gestion made by Möller-^ that a primary role ofasynchronous remporalis contraction is to movethe jaws through the mtercuspal zone without nec-
32 Volume 11, Number 1, 1997

Wridirtg/Shaikh
Table 6 Means and SD for Sample Data and for Two Subjects SelectedFrom the Top and Bottom of the Range of Chewing Performance
Mas- Digas-Panicle Cycle se ter trie
size Residual time ANGLE BIMODE RMS RMS(mm) (mm) (s] (degrees) (%) (|iV¡ (tiV)
Mas- Mas- Temp- Temp-scter seter uralis oralis
iEMGnet iEMGipco RMS LAGipco(pVs) (|iVs] (pV) (ms)
MeanSDCHKD
5 100.531.132,98
0 00 0.81 54.80 00 0.12 15 8
+0 09 1.10 53.9+0.53 0.55 75.1
28 6 145.5 53.921 2 60.9 21.367.6 262.1 82 151.4 65 7 39 4
88.4 2 74 133.6 -5,4339.0 6 81 55.8 7.48
164.1 9.40 274.1 -17.2156.4 4.27 157.6 9.82
essarily exerting a higb occlusal force. Wben bighocclusal forces are required, tbe masseter musclesbecome more active than temporahs muscles.- Intbis role, tbe temporabs may be contributing tofood particle selection and placement, while adduc-tors witb greater mecbanical advantage sucb asmasseter and medial pterygoid muscles provide tbenecessary breaking forces. However, tbe roles ofadducror muscles are clearly not circumscribed andare able to take over a secondary role wben neces-sary. If one muscle is "knocked out," others arerecruited ro do tbe work.-**
Digastric Coactivation
Tbe adductor muscle activities were cbaracterizedby well-defined bursrs of activity during tbe clos-ing pbases of cbewing cycles and during relaxationpbases of opening. Althougb the activity of thedigastric muscles peaked during opening, therewas considerable sustained activity tbrougbout tbecycle (Figs 5 and 6). Miles and Madigan-^ foundthat coactivation of tbe digastric muscle alwaysoccurred during isometric mastication but wasmodified by tbe level of force being generated bytbe adductors or by the expectation tbat the resis-tance to jaw closing may suddenly yield. It basbeen suggested tbat the coactivation of digastricmuscles during closing is tbe resulr of a separatepool of motor neuron activity concerned wirb con-trol, rarher tban primary opening.^ We found tbedigastric iEMG to be negatively correlated withparticle size, indicating that increased digastric ac-tivity during opening was associated witb im-proved chewing performance. Digastric iEMG wasselected in tbe process of generating some multi-variate models, in particular, in tbe prediction ofmaximum opening (see Table 4).
The method we used in rbe present study toquantify digastric coactivation (lEMGnet) was notadequate because the masseter and digastric mus-
cles have different masses, origins, and lines ofaction. Therefore, subtracting electrical activityfrom tbeir two surface electrodes (of uncertainposition) may not represent any functional rela-tionsbip between these rwo muscles. It would havebeen preferable ro use tbe timing of the activiry ofmasseter and digastric muscles to detect coactiva-tion. However, tbe absence of a clearly defineddigastric burst makes the onset of contraction andrelaxation difficult to determine. The data derivedfrom tbe variable iEMGnet must nevertheless beviewed witb some suspicion. With rhis caveat, wecautiously suggest that interactions that emergedbetween iEMGnet and other variables are of pass-ing interest.
An inverse correlation was found between mas-seter iEMGnet and particle size (see Table 3). TbeiEMGnet also was selected as a component in tbestatistical model developed to predict particle size(see Table 4). It has been suggested tbat coactiva-tion of digastric muscle provides some stiffness totbe jaw movement, and this stiffness is protec-tive.-^ Our results suggest tbat if tbis protection ismore rhan optimal (low iEMGnet), it is inbibitoryto cbewing performance. Subject KD, who bad abigb median particle si e (poor cbewing perfor-mance) and a low value for iEMGnet, may reflecttbe influence of excessive coactivation (Table 6,Fig 6). Multivariare models for maximum openingand cycle time are botb influenced by rhe iEMGnetfor masseter and temporahs muscles, respectively(see Table 4).
Gender Differences
No gender differences in the variables of massetermuscles were found, but tbe iEMG value for tem-poralis muscles was significantly higher in womenthan in men; this may bave accounted for tbeincrease in value for temporalis iEMGnet in wom-en (see Table 2). Tbis increase in activity is consis-
Journal of Orofacial Pain 3 3
Wiiding/Shaikh
tent with the ohservations made that women usemore muscle power to achieve the same occlusalforce as men.-'-^" Getider differences in chewingperformance were reported in a previous study :the median particle size aftet 15 chewing sttokeswas significantly larger in wotncn than in men.This appears to be in spite of significant increasestn the tetnporalis muscle activity of tbe same wom-en who volnnteered for the present study. How-ever, maximum occlusal forces are well in excessof those required to chew even hatd test foods,and so it is likely that the occlusal forces availahleto women are more than adequate to athteve foodbreakage." Slagtet et aP' suggested that a smoothuninterrupted chewing cycle may make greaterdemands on muscle power than food hreakage.There is some evidence in our study and in otherstudics ' '- ' ^ to sitggest that the tetnporahs mus-cle plays a greater role than does the massetermuscle in directing lateral jaw movement (AN-GEE, Table 4). The gender differences we found Inremporalis muscles, rather than In masseter mus-cles, suggest that it may he movement rather thanocclusal force for which wotiieti use greater muscleactivity. These data still do not account fot theohserved gender differences in chewing perfor-mance.
It has been suggested that gendet differences inchewing performance may he influenced by spe-cific cultural patterns thar inhihit oral activtty inwomen.•* The results of the present study do notcontribute any further understanding of genderdifferences in chewing, although the presence of afactor associated wtth gender ts clearly evtdentfrom the effect gender had as an indicator variahieadded to the F.GN/EMG model (see Tahle 4).
Multivatiate Models
The model selected to predict chewing perfor-mance from multiple EMG variables was moder-ately accurate (R- = .51, see Table 4, Fig 3). Themajor determinants derived from the massetermuscle activity were the RMS and iEMG variables.Notably ahsent from this model was the peak mus-cle activity, which confirms the suggestions ofSlagter et aP' that food breakage does not dependon maximum occlusal force. The majot contribu-tion of temporalis activity to the model was theasynchrony of ipsilateral and contralatetal contrac-tion.
When both EMG and EGN variables were usedto predict chewing performance, the accuracy ofthe model was better than with either factor alone.Wilding and Lewin^ descrihed a model to predict
chewing performance based only on jaw move-ment. In that model, an indicator variahie wasfound to increase the accuracy of prediction froman R^ value of .40 to .79. It was suggested chat thismissing variable, wbich was subject dependent,might be telated to muscle activity. Thts predictionappears to bave been partly correct, because tbeaccutacy of out model, without any indicator vari-able, now accounts for 66% of the variance in theohserved level of chewing performance. In the pre-sent study, we noted that the inclusion of an indica-tor vartable—gendet—further improved the predic-tive accuracy of the model. There appears to be agender-related characteristic that influences chew-ing performance and, therefore, requires furtherinvestigation.
Optimal Values
It is likely that the characteristics of muscle activityand jaw movement that are associated with im-proved chewing performance are more effectiveand perhaps more efficient rhan patterns of muscleactivity associated with poor chewing performance.Therefore, such effective patterns of movement andmuscle activity may he described as optimal, ormost likely to produce the desired effect. By thisdefinition, optimal masticatory movements arecharacterized by a prolonged chewing cycle timethat moves in an open loop, with a lateralapproach to and from positions of tooth contact.Optimal muscle activity would he characterized byadequate masseter activity, minimal coactivationhetween opening and closing muscles, and asyn-chrony of the antetior temporalis muscles. None ofthese observations is new to the literature on masti-cation: their collective presence in this study merelyserves to validate their role. They are naturallyquite restricted observations, confined by the lim-ited movement and EMG data recorded in the pre-senr study; therefore, a host of other aspects ofchewing that promote optimal performance arenot excluded. It must he stressed that all these dataare derived from clinically asymptomatic subjects,and so there appears to be a wide range of valuesfor jaw movement and EMG that is compatiblewith health. Additional studies may determinewhether there is a wide overlap between these sug-gested optimum pattetns and subjects diagnosedwith TMD.
The combination of muscle activity and incisaidisplacement suggests that an investigation intothe acceleration of the midincisal area might reflectboth movement and muscle activity. Accelerationdata not only reflect forces acting on the mandible
34 Voiume 11, Number 1, 1997

Wilding/Shaikh
but also reveal the rhythmic oscillations of physio-logic tremor. In view of the association betweentremor and efficient skilled tasks such as handwrit-ing, we are currently investigating the role of jawtremor as a predictor of chewing performance.^-
References
1. Lucas PW, Luke DA. Methods for analyzing the break-down of food in human mastication. Arch Oral Biol 1983;28:813-819.
2. Hiicmae KM, Hayenga SM, Ree5e A. Parrerns of tongueand jaw movement in a cinefluorographic study of feedingin the macaque. Arch Oral Eiol 1994;40:229-246.
3. Wilding RJC, Lewin A. The determination of optimalhuman iaw movements based on their association witbchewing performance. Arch Oral Biol 1994Í3S: .SR9-596.
4. Thexton AJ, McGarrick JD. The elect rom yograpbic activi-ties of jaw and hyoid musculature in different ingestivebehaviours in tbe cat. Ajch Oral Biol 1994;39:599-612.
5. Oshorn JW, Baragar FA. Predicted pattern of human mus-cle activity during clenching from a computer assistedmodel. I Biomecb 198S;1S:599-6I2.
6. Schumann N, Scbolle H, Anders C, Mey E. A topograpbi-cal analysis of spectral electromyographic data of the hu-man masseter muscle under different functional conditionsin healthy subjects. Arch Oral Biol 1994;39;369-377.
7. Hannam AG, Wood WW. Medial pterygoid muscle activ-ity during rbe closing and compressive phase of humanmastication. Am JPhysAntbropol I 9 S 1 ; 5 5 Í 3 S 9 - 3 6 7 .
B. Wood WW, Takada K, Hannam AG. The electromyo-gtaphic activity of the inferior part of tbe human lateralpterygoid muscle during dencbing and chewing. ArchOral Biol 1 9 8 6 ; 3 1 : 2 4 S - 2 J 3 ,
- 9. Hyiander WL, Johnson KR, Cronipton AW. Loading pat-terns and jaw movements during mastication in Macucû fas-dcularis: A bone-srrain, electromyographic and cineradio-grapbic analysis. Am J Phys Ancbropol 19S7;72:287-314.
10. Cooper BC, Rabuïïi DD. Myofascial pain dysfunclion syn-drome: A clinical study of asymptomatic suhjects. Laryn-goscope 1984;94:68-7.5.
11. Asb MM. Current conceprs in tbe aetiology, diagnosis andtreatment of TMJ and muscle dysfunclion. J Oral Rehabil1986;13:l-20.
12. Naeije M, Hansson TL, Electromyographic screening ofmyogenous and arthrogenous TMJ dysfunction patients. JOralRehahil 198e;13:433-441.
13. Lund JP, Widmar CG. An evaluation of rhe use of surfacedectromyograpby in ibe diagnosis, documentation andtreatment of denral patienrs. J Craniomandib DisordFacial Oral Pain 1989;3:125-137.
14. Douglass CW. Evaluaring diagnostic tests, Adv Dent Res
15. Wilding RJC. The association between chewing efficiencyand occlusal contact area in man. Arcb Oral Biol 1993;38:i89-596.
16. Olthoff LW, van der Bilt A, Bosman F, Kleizen HH.Distribution of particle size in food comminuted bybuman mastication. Arch Oral Biol I984;29:S9S-9Ü3.
17. Junge D, Clark GT, Electromyographic turns analysis ofsustained contraction in buman masseter muscle ar vari-ous isometric force levels. Arcb Oral Biol 1993;38583-588.
18. Armitage P, Retry G. Sratistical Methods in Medical Re-search, ed 2. Oxford: Biackwell, 1987:315.
19. Chew CL, Lucas PW, Tay DKL, Keng SB, Ow RKK. Tbeeffect of food texture on tbe replication of jaw movementin mastication, J Dent 1988;! 6:210-214.
20. Bisbop B. Plesh O, McCall WD Jr. Effects of chewing fre-quency and bolus bardness on buman incisor trajectoryand masseter muscle acrivity. Arcb Oral Biol 1990;35:311-318,
2! . Throckmorton GS, Dean JS. The relarionship berweenjaw-muscle mechanical advantage and activity levels dur-ing isomelric bites in humans. Arcb Oral Biol 1994;39:429^37.
22. Ahlgren J, Owall B. Muscular activity and chewing force:A polygrapbic study of buman mandibular movements.Arcb Oral Biol 1970;15:27]-279.
23. Möller E. Action of the muscles of mastication. In: Kawa-mura Y (edl. Frontiers of Oral Physiology. Vol 1: Phys-iology of mastication. Basel: Karger, 1970:121-156,
24. Stohler CS, A comparative elecrromyographic and kinesio-grapbic study of deliberate and habitual mastication inman. Arch Oral Biol l986;31:669-678.
25. Hylander WL, Jobnson KR, Crompton AW. Muscle forcerecruitment and biomechanical modelhng: An analysis ofmassetei muscle function during mastication in Macacafasdculûris. Am J Pbys Anthropol I992;88:365-387.
26. Takada K, Miyawaki S, Tatsuta M. The effects of foodconsistency on jaw movement and posterior tempotalisand inferior obicularis oris mustie activity during chexvingin children. Arcb Oral Biol 1994;39:793-805.
27. Naeije M, McCarroll RS, Weijs WA. Electromyographicactivity of the human masticatory muscles during submax-imal clencbing in tbe inter-cuspal position. J Oral Rchabil1989;16:63-70.
28. Huang X, Zhang G, Herring SW. Alrerations of muscleactivities and jaw movements after blocking individuallaw-closing muscles in the miniature pig. Arcb Oral Bioi1993;38:291-297.
29. Miles TS, Madigan ML. Programming of antagonist mus-cle stiffness during masticatory muscle unloading in man.Arch Oral Biol 1983;2S:947-951.
30. Visser SL, De Ruke W. Influence of sex and age on EMGcontraction pattern. Eur Neurol 1974;12:229-235.
31. Slagrer AP, Bosman F, van der Glas HW, van der Bilt A.Human jaw-elevator muscle activity and food commmu-tion in the dentate and edentulous state. Arcb Oral Biol1993i38:19S-205.
32. van Galen GP, Portier SJ, Smits-Engelsman BC, Scho-maker LR. Neuromotor noise and poor handwriting inchildren. Acta Psychol Amst 1993;82:161-178,
Journal of Orofacial Pain 3 5
Wilding/Shaikh
Resumen
La Actividad Muscular y los Movimientos Mandibularescomo Factores de Predicción del Desempeño Masti-catorio
Ei desempeño maslicatorio puede definirse en términos de iareducción en el tamaño de ia partícuia de comida después demasticar 15 veces. En este estudio, se investigó ia relaciónentre ei desempeño masticatono y ia actividad eiectroniiográ-fica para desarroliar unos valores óptimos de las variabies elec-tromiagráficas. basadas en su habilidad para predecir eldesempeño masticatono. Se efectuaron grabaciones eiectro-gnatográficas y eiectromiográficas de ios eiectrodos de iasuperficie sobre ios músculos digástrico (abductor), masetero,y temporai (aductores) en 24 personas, mientras que eilas mas-ticaban una goma de fruta dura. Se encontró ura correlaciónnegativa moderada entre el tamaño de la partícula de comida yei câicuio de la rai? cuadrada media de ia actividad masetera(-0,43: P í 0.01). Se encontraron correlaciones positivas masdébiies entre el tamaño de la particula y el asincronismo de iosmúsculos temparaies ipsolaterai y contraiateral anterior (0,36; P< 0.05). Por medio de un niodeio de regresión múitiple de van-ables eiectromiográficas y elec trog na tográf reas, fue posibie pre-decir ei desempeño masticatorio con iin vaior R^ de 0,66. Si seutiliza ei desempeño masticatorio como una medida derendimiento de la función masticatoria, puede ser posibie deter-minar ios iimites óptimos para las variabies eiectromiográficas ylos movimientos ma ndi bu i a res
Zusammenfassung
Muskeisktivitât und Kieferbewegungen ;JÍ'' Vorsus-sagungen der Kauverrichtung
Die Kauverrichtung i(ann definiert werden in Zeitabschnitte derVeriileinerung von Nahrungspartikelgrösse nach 15 Kauzyiden.in dieser Studie wurde die Beziehung ïwischen derKauverrichturg und der eiei<tromyographischen Aktivität unter-suclit. um opt:imale Werte von eiektromyographischen Variablenzu entwici<ein, welche auf deren Fähigkeit, die Kau Verrichtungvorauszusagen, basieren, Elektrognalhographische und elek-tromyographische Aufzeichnungen von Oberflâchenelektrodenüber den Digastricus- IAbdui<tor), Masseter- undTemporaiismusi<eln (Adduktoren) wurden bei 24 Personengemacht, v^ahrend sie einen harten Fruchtgummi kauten. Einemassige negative Korreiation wurde zwischen derNahrungspartikeigfösse und der mittleren(puadratwurzeiberechnung fiif die fviasseteraktivität (-.48:.P <.01). Schwächere positive Korrelationen wurden zwischen derPartiiielgrosse und der Asynchronität von ipsiiateraien und kon-tralateraien antenoren Temporalismuskeln (.36; P < .051. Einmultiples Regressionsmodeli von eieiftromyographrsohen undelektrogna(:bographischen Variabien war in der Lage, dieKauverrichtung mit einen R2 Wert von .66 vorauszusager.Wenn die Kauverrchtung ais ein Leistungsmass der mastiiia-tonschen Funktion verwendet wird, mag es möglich sein, opti-male Bereiche fur eiektromyographische Variablen undKieferbewegungen zu bestimmen.
36 Volume 1 1, Number 1, 1997
