municipal solid waste management in finlandnortech.oulu.fi/greensettle_files/municipal solid...
TRANSCRIPT
Greensettle project is co-funded by the European Union, the Russian Federation and the Republic of Finland
CONTACT PERSONS
Project leader: Eva Pongrácz, Docent, Dr.Tech., [email protected] manager: Niko Hänninen, Phil.Lic., [email protected]
Centre of Northern Environmental TechnologyThule Institute, P.O. Box 7300, FI-90014 University of Oulu, FinlandTel. +358 29 448 7417, Fax. +358 8 553 3564
http://nortech.oulu.fi
http://www.facebook.com/NorTechOulu
@
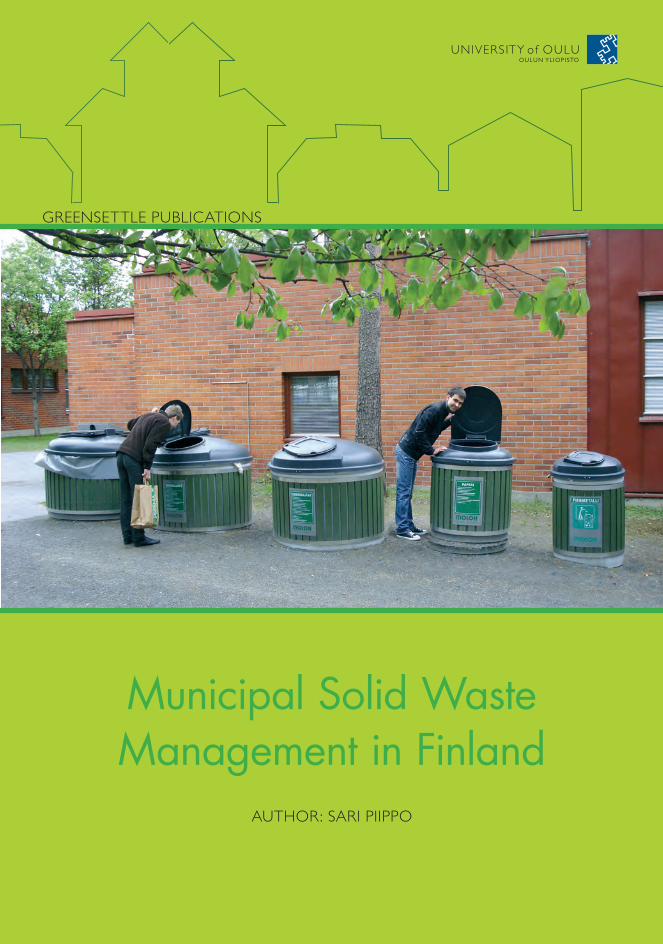
Municipal Solid WasteManagement in Finland
AUTHOR: SARI PIIPPO
GREENSETTLE PUBLICATIONS
ISBN 978-952-62-0071-2

Municipal Solid WasteManagement in Finland
AUTHOR: SARI PIIPPO
EdITOR: EvA POngRácz
gREEnSETTlE PUblIcATIOnS
greensettle project is co-funded by the European Union, the Russian Federation and the Republic of Finland

graphic design: Hannele Heikkilä-TuomaalaPhotos by victor Pavlov, Sari Piippo and Oulun JätehuoltoPrinted in Uniprint Oulu, 2013ISbn 978-952-62-0071-2
3
Table of Contents
1 Introduction 5
2 Waste legislation 6
2.1 The Waste Framework directive 6 2.2 Finnish waste legislation 6 2.3 Producer responsibility in waste management 9
3 Municipal Solid Wastes (MSW) in Finland 11
3.1 composition and sources of MSW 13 3.2 Hazardous wastes 13
4 Municipal Solid Waste Management 15
4.1 Recovery of MSW 16 4.2 Recycling of source separated MSW 18
5 Organization of Municipal Solid Waste Management in Finland 21
5.1 Sorting 21 5.2 collection 21 5.3 Transportation 22 5.4 Waste treatment 23 5.5 landfilling 23 5.6 case: MSWM in Oulu 23
6 Economic instruments of MSWM in Finland 27
6.1 Waste taxes and charges 27 6.2 costs of MSWM in households and public services 29 6.3 cost of producer responsibility systems 30 6.4 Total costs of waste recovery in Finland 32 6.5 Prices of recoverables on the European market 33
7 conclusion 35
Reference list 37
Appendices 43
Appendix 1: Waste legislation in Finland
Appendix 2: Producer responsibility organizations in Finland
Appendix 3: Amounts of wastes under producer responsibility
Appendix 4: national statistics on quantities of packaging used in 2009
4
5
Wastes are all objects or substances which the holder discards, intends to discard, or is legally obliged to discard. Wastes represent an inef-ficient use of raw materials and, therefore, a loss of resources. Moreover, wastes can con-tain dangerous substances or have hazardous properties and can consequently pollute the environment and cause health hazards. Also the waste recovery and processing operations can produce emissions. (Finnish Environment Institute 2011a)
Until the end of the 19th century, Finland was rural and the cities were very small. The amount of waste was also low because almost everything was effectively recycled. notwith-standing, even then waste spoiled the water in wells and caused diseases. before the 1970s, waste management in Finland was mainly con-sidered a health issue and, hence, connected with the development of general healthcare regulation. (nygård 2000). In the early 1980s, waste management became more focused on environmental protection and was administra-tively separated from public sanitation. (Tur-
1 Introduction
peinen 2005). At the moment, waste reduc-tion is the primary aim of waste management. (Sokka et al. 2007)
Municipal solid waste (MSW) usually means all the mixed waste (e.g. kitchen waste, packag-ing materials, glassware, tin cans) which are handled in the municipal waste management system. Municipal solid waste is produced in households, trade, industries, construction and public and private institutes. Some part of municipal waste is composted, recycled or otherwise recovered as material, some of the waste is incinerated or gasified and the rest is landfilled. (Sokka et al. 2007) When think-ing of saving of non-renewable resources, the recovering the waste as material or energy is particularly important. (Finnish Environment Institute 2011a).
This research was conducted as a part of the “green cities and settlements” (gREEnSETT-lE) EnPI cbc project financed by the Euro-pean Union, the Russian Federation and the Republic of Finland. ■
6
2 Waste legislation
2.1 The Waste Framework Directive
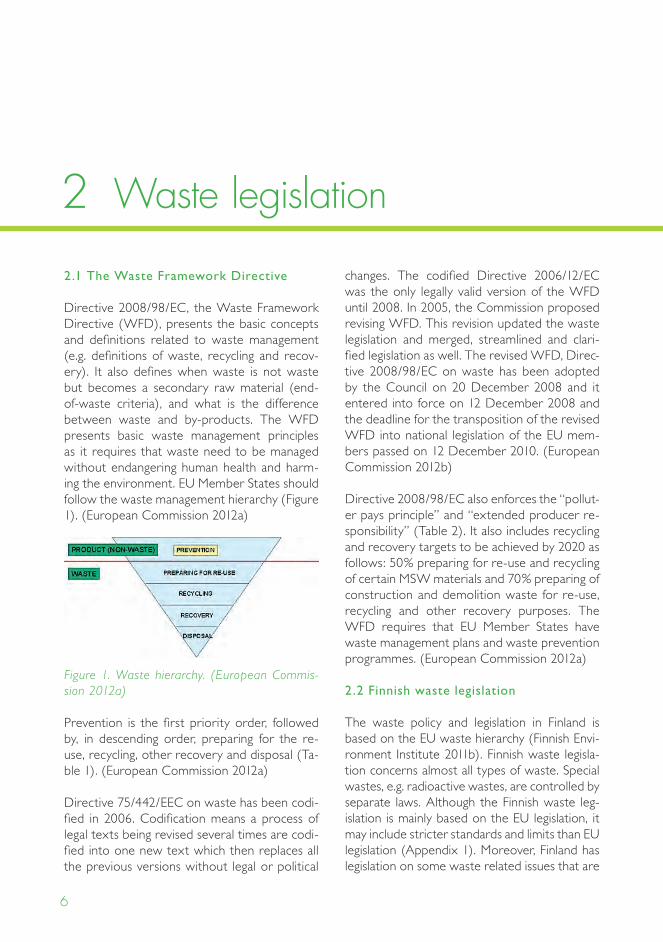
directive 2008/98/Ec, the Waste Framework directive (WFd), presents the basic concepts and definitions related to waste management (e.g. definitions of waste, recycling and recov-ery). It also defines when waste is not waste but becomes a secondary raw material (end-of-waste criteria), and what is the difference between waste and by-products. The WFd presents basic waste management principles as it requires that waste need to be managed without endangering human health and harm-ing the environment. EU Member States should follow the waste management hierarchy (Figure 1). (European commission 2012a)
Figure 1. Waste hierarchy. (European Commis-sion 2012a)
Prevention is the first priority order, followed by, in descending order, preparing for the re-use, recycling, other recovery and disposal (Ta-ble 1). (European commission 2012a)
directive 75/442/EEc on waste has been codi-fied in 2006. codification means a process of legal texts being revised several times are codi-fied into one new text which then replaces all the previous versions without legal or political
changes. The codified directive 2006/12/Ec was the only legally valid version of the WFd until 2008. In 2005, the commission proposed revising WFd. This revision updated the waste legislation and merged, streamlined and clari-fied legislation as well. The revised WFd, direc-tive 2008/98/Ec on waste has been adopted by the council on 20 december 2008 and it entered into force on 12 december 2008 and the deadline for the transposition of the revised WFd into national legislation of the EU mem-bers passed on 12 december 2010. (European commission 2012b)
directive 2008/98/Ec also enforces the “pollut-er pays principle” and “extended producer re-sponsibility” (Table 2). It also includes recycling and recovery targets to be achieved by 2020 as follows: 50% preparing for re-use and recycling of certain MSW materials and 70% preparing of construction and demolition waste for re-use, recycling and other recovery purposes. The WFd requires that EU Member States have waste management plans and waste prevention programmes. (European commission 2012a)
2.2 Finnish waste legislation
The waste policy and legislation in Finland is based on the EU waste hierarchy (Finnish Envi-ronment Institute 2011b). Finnish waste legisla-tion concerns almost all types of waste. Special wastes, e.g. radioactive wastes, are controlled by separate laws. Although the Finnish waste leg-islation is mainly based on the EU legislation, it may include stricter standards and limits than EU legislation (Appendix 1). Moreover, Finland has legislation on some waste related issues that are
7
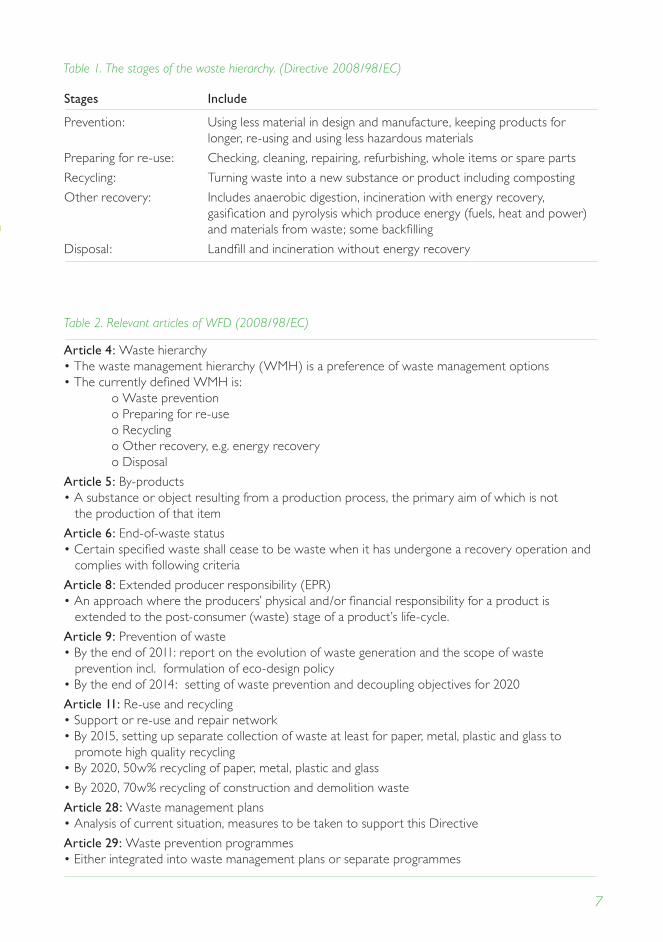
Table 1. The stages of the waste hierarchy. (Directive 2008/98/EC)
Stages Include
Prevention: Using less material in design and manufacture, keeping products for longer, re-using and using less hazardous materials
Preparing for re-use: checking, cleaning, repairing, refurbishing, whole items or spare parts
Recycling: Turning waste into a new substance or product including composting
Other recovery: Includes anaerobic digestion, incineration with energy recovery, gasification and pyrolysis which produce energy (fuels, heat and power) and materials from waste; some backfilling
disposal: landfill and incineration without energy recovery
Table 2. Relevant articles of WFD (2008/98/EC)
Article 4: Waste hierarchy• The waste management hierarchy (WMH) is a preference of waste management options• The currently defined WMH is: o Waste prevention o Preparing for re-use o Recycling o Other recovery, e.g. energy recovery o disposal
Article 5: by-products• A substance or object resulting from a production process, the primary aim of which is not the production of that item
Article 6: End-of-waste status• Certain specified waste shall cease to be waste when it has undergone a recovery operation and complies with following criteria
Article 8: Extended producer responsibility (EPR)• An approach where the producers’ physical and/or financial responsibility for a product is extended to the post-consumer (waste) stage of a product’s life-cycle.
Article 9: Prevention of waste• By the end of 2011: report on the evolution of waste generation and the scope of waste prevention incl. formulation of eco-design policy • By the end of 2014: setting of waste prevention and decoupling objectives for 2020
Article 11: Re-use and recycling • Support or re-use and repair network • By 2015, setting up separate collection of waste at least for paper, metal, plastic and glass to promote high quality recycling • By 2020, 50w% recycling of paper, metal, plastic and glass
• By 2020, 70w% recycling of construction and demolition waste
Article 28: Waste management plans• Analysis of current situation, measures to be taken to support this Directive
Article 29: Waste prevention programmes• Either integrated into waste management plans or separate programmes
8
not yet included in EU legislation. (Finnish Envi-ronment Institute 2010a) Over 20 decrees have been issued after 1994 after national Waste Act came into effect. Finland has also national Waste Plan which is a requirement of the EU. (Melanen et al. 2002) The general aim of the waste legislation is to support sustainable devel-opment by promoting rational use of natural re-sources and by preventing harm and danger to human health and the environment caused by wastes. The waste legislation has regulations for promoting the utilization of wastes, organization of waste management, prevention of littering and cleaning of littered areas. In addition, the legislation includes regulations on preventative measures such as preventing the formation of waste and reduction of the amount and harm-fulness of waste. The Environmental Protection Act regulates pollution prevention as well. (HE 199/2010 vp)
The Finnish Waste Act, the Finnish Waste de-cree and decision 659/1996 of the council of State cover the transports of wastes within Fin-land. Further to the Waste Act, the professional collection and transportation of waste need to be reported to the national Waste Regis-ter, kept by the Regional centres for Economic development, Transport and the Environment
(ElY centre). The responsibility of the owner or holder of the waste is to check whether the collector or transporter of the waste has regis-tered his activities with the ElY centre and that the registration covers the waste transportation as well. Moreover, the owner or the holder of waste needs to check that the waste collector or the waste consignee have a valid environmental permit issued by the authority, or else the waste or hazardous waste must not be given to the waste collector or the waste consignee. The validity of the permit can be checked with the Regional Environmental centre remarked in the permit and the permit needs to be shown on request. (Finnish Environment Institute 2011a)
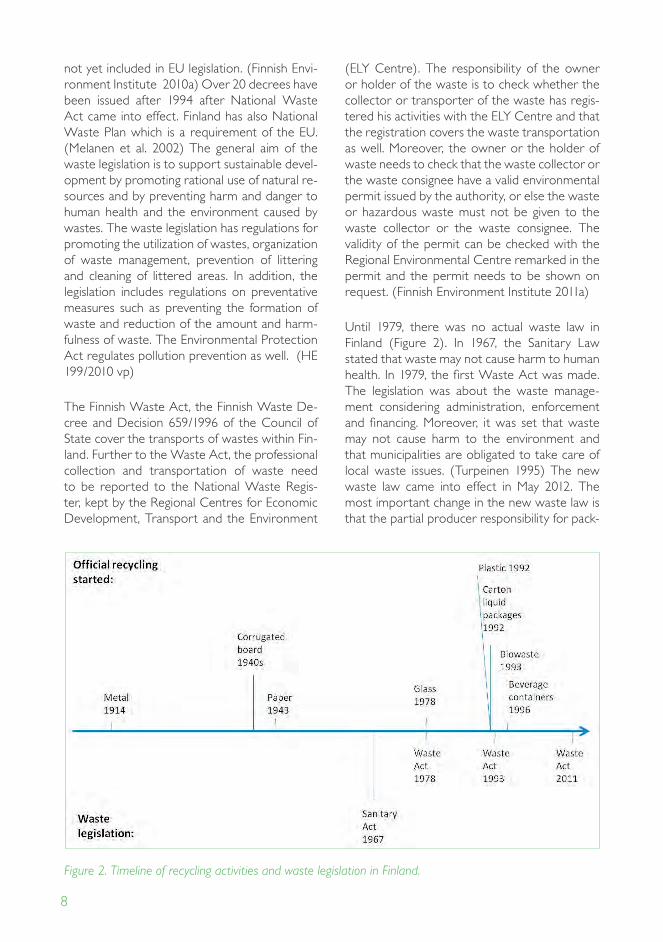
Until 1979, there was no actual waste law in Finland (Figure 2). In 1967, the Sanitary law stated that waste may not cause harm to human health. In 1979, the first Waste Act was made. The legislation was about the waste manage-ment considering administration, enforcement and financing. Moreover, it was set that waste may not cause harm to the environment and that municipalities are obligated to take care of local waste issues. (Turpeinen 1995) The new waste law came into effect in May 2012. The most important change in the new waste law is that the partial producer responsibility for pack-
Figure 2. Timeline of recycling activities and waste legislation in Finland.
9
aging is turning to full producer responsibility (i.e. the producers or importers of packagings need to take care of the collection, transportation and utilization of packaging material produced in the households as well). The definition of waste is more accurate and clear as well. Some waste materials can be classified as by-products, which can be utilized easier than wastes. (Elinkeino-elämän keskusliitto 2011)
The Ministry of the Environment supervises and controls the execution of Finnish waste legisla-tion. The Finnish Environment Institute performs research and training, publicizes new ideas and methods, monitors all waste related develop-ment issues, and also takes part in establishing new legislation and guidelines related to waste, and also monitors international waste shipments. (Finnish Environment Institute 2010b).
2.3 Producer responsibility in waste management
Some product groups belong under producer responsibility schemes. Extended Producer Re-sponsibility (EPR) means that the producer has the obligation to recover the product after be-comes waste. Producers are obligated to finance and organize the collection, pre-processing, recycling, utilization and management of their products removed from use. They can take care of this obligation themselves or transfer the re-covery obligation to producer organizations (Ap-pendices 2 and 3). (The Environmental Register of Packaging 2011b) The Pirkanmaa ElY centre is the national authority that is responsible for producer registration and other related issues in Finland (except Åland Islands). (Finnish Environ-ment Institute 2011c) Producers and producer organizations are obliged to submit their details for the national producer data register. (Finnish Environment Institute 2011d)
The aim of producer responsibility is to encour-age manufacturers and importers to consider the whole life cycle of their products. Producer responsibility promotes environmentally favour-able product planning, waste prevention, sepa-rate collection and recovery of useful wastes, waste reuse and recycling and the incorporation of environmental costs into product prices. In
the context of producer responsibility the pro-ducer means the manufacturers and importers of the products or, in the case of packaging, packagers and the importers of packaged prod-ucts. Producer responsibility covers electronic and electrical appliances; batteries and accumu-lators; tires from motor vehicles, other vehicles and equipment; cars, vans and comparable ve-hicles; newspapers, magazines, copy paper, and other comparable paper products and packag-ing. (Finnish Environment Institute 2011d).
A packager is a company which is manufactur-ing a product that uses packaging materials to protect its products (e.g. in production, storing, transport and distribution). Usually, the manu-facturer of a product is a packager but it may be also the distributor or retailer, if it adds packag-ing to its products. The importer of packaged products is a company that imports products that are packaged, and who owns the packaged product when it is imported. The re-use means the use of packaging in the same form after cleaning. Finland is among the top re-users of packaging in Europe. The recovery of packaging waste means both the recovery of packaging to make raw material for new products, and the recovery of packaging as energy. Sorting itself or the delivery of packaging to waste collection or sorting sites is not recovery. Recycling is the re-processing of packaging material so that it can be used to produce a new product. Packaging that is not used anymore is considered packaging waste. Re-usable packaging is packaging waste only when it is taken out of the re-use system. (The environmental Register of Packaging 2011c) because of the effective collection and recycling system for packaging materials, the amount of waste packages is very low in Finland: only 84 kg per inhabitants, while the EU average is ca. 200 kg. (Suomen keräyslasiyhdistys 2011h)
In 1998, the collection and recovery system of producer responsibility was constructed in Fin-land. waste management system. Further, it was pointed out that producer responsibility systems may not lead to waste reduction but rather in-creased recycling, which needs to be addressed by e.g. encouraging eco-design. (Melanen et al. 2002) The realization of the sustainable MSWM system and the producer responsibility system
10
is especially difficult in sparsely populated areas. For instance, the progress of MSWM systems has been slower in lapland than in other parts of Finland. The main reasons for that have been the large area, small amounts of generated waste and the long transportation distances to the waste centers and utilization facilities. (lapin ElY 2011) Also the producer responsibility system has faced some challenges in northern sparsely populated areas. E.g. in lapland, until May 2012 there was only a partial producer responsibility for packages. As collection targets for Finland were fulfilled already in southern parts, there was no motivation to establish proper collec-tion network for packages in lapland. The new Waste law addressed this situation and changes are expected to producer responsibility systems in lapland. (lapin ElY 2011) ■
11
3 Municipal Solid Wastes (MSW)
in Finland
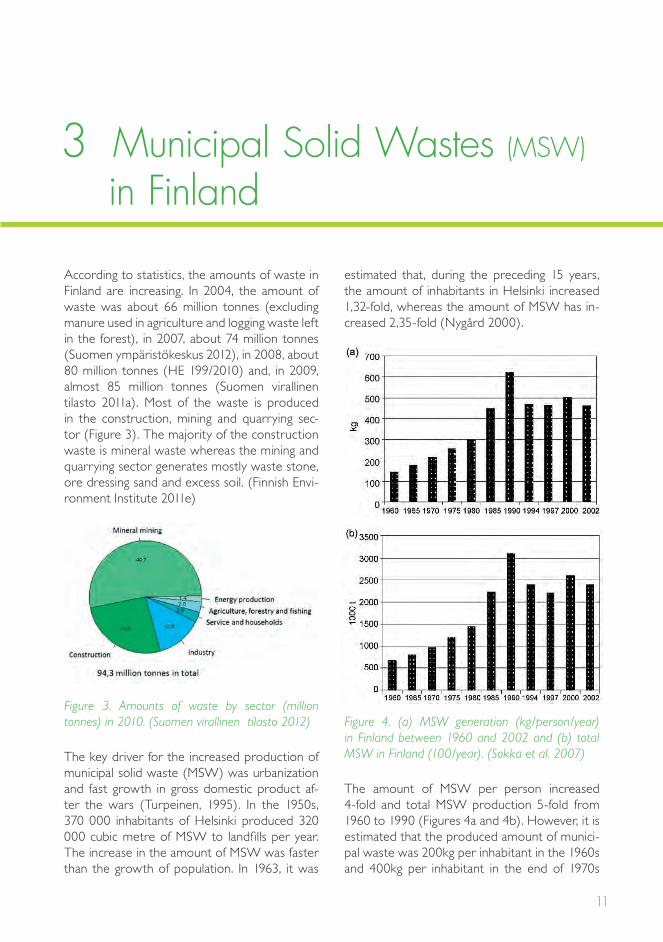
According to statistics, the amounts of waste in Finland are increasing. In 2004, the amount of waste was about 66 million tonnes (excluding manure used in agriculture and logging waste left in the forest), in 2007, about 74 million tonnes (Suomen ympäristökeskus 2012), in 2008, about 80 million tonnes (HE 199/2010) and, in 2009, almost 85 million tonnes (Suomen virallinen tilasto 2011a). Most of the waste is produced in the construction, mining and quarrying sec-tor (Figure 3). The majority of the construction waste is mineral waste whereas the mining and quarrying sector generates mostly waste stone, ore dressing sand and excess soil. (Finnish Envi-ronment Institute 2011e)
Figure 3. Amounts of waste by sector (million tonnes) in 2010. (Suomen virallinen tilasto 2012)
The key driver for the increased production of municipal solid waste (MSW) was urbanization and fast growth in gross domestic product af-ter the wars (Turpeinen, 1995). In the 1950s, 370 000 inhabitants of Helsinki produced 320 000 cubic metre of MSW to landfills per year. The increase in the amount of MSW was faster than the growth of population. In 1963, it was
estimated that, during the preceding 15 years, the amount of inhabitants in Helsinki increased 1,32-fold, whereas the amount of MSW has in-creased 2,35-fold (nygård 2000).
Figure 4. (a) mSW generation (kg/person/year) in Finland between 1960 and 2002 and (b) total mSW in Finland (100/year). (Sokka et al. 2007)
The amount of MSW per person increased 4-fold and total MSW production 5-fold from 1960 to 1990 (Figures 4a and 4b). However, it is estimated that the produced amount of munici-pal waste was 200kg per inhabitant in the 1960s and 400kg per inhabitant in the end of 1970s
12
(Tommila 1984) which are higher than in stud-ies of Sokka et al. (2007). In both figures the increasing trend is obvious.
between 1960-1980, the increase in MSW generation remained stable (3–4% per year) but in the 1980s, the growth rate was already about 7% per year. The strong increase in the amount of MSW from the 1960s to the 1970s may partially be due to increase in the use of packaging material and decrease in the amount of waste furnaces (Tommila 1984). Other rea-sons for increased amount of wastes are e.g. higher living standard, use of disposable pack-ages and the short operating life of goods (Hän-ninen 2009). The amount of waste usually in-creases as the standard of living of inhabitants becomes higher (European commission 2011). during 1990-1997, MSW production fell, then increased between 1997 and 2000 but declined again from 2000 to 2002. The study of Sokka et al (2007) indicates that the relationship between gross domestic product growth and municipal solid waste production is not distinct because MSW production is not as directly proportional to gross domestic product as is often expected. The severe economic depression had a strong reducing impact on the production of munici-pal solid waste in the early 1990s. The annual change in population was quite low, less than 0.6%, all the time. zacarias-Farah and geyer-Allély (2003) found that the generation of MSW per capita in OEcd countries has increased by 22% from 1980 to 2000. After 1994 the annual increase in per capita gross domestic product was over 3%, hence, obviously improved policy measures played a role in the reduction in the growth rate of municipal waste. In Finland, the increase was over 60% (despite the decrease in production of municipal waste since the 1990s) which may be due to the high economic growth rate of the 1980s in Finland. Walsh (2002) found out that the generation of MSW per capita in new York city was about the same at the be-ginning and at the end of the 20th century but there was strong fluctuation during the decades. Per capita production MSW was in the highest in 1940 (940 kg/inhabitant/year), then at the lowest in the 1960s (320 kg/inhabitant/year) and remained constant after the 1980s (430 kg/in-habitant/year).
According to the European Environment Agen-cy’s (2005) studies in 29 European countries (1995-2003), in the Eastern and central Euro-pean countries, MSW production has stabilized but, in the Western European countries, it con-tinues to grow. MSW generation seems to have stabilized in the 21st century in Finland but there is no clear explanation why. (Sokka et al. 2007) The most recent statistics show even decline in the amount of produced MSW since 2008 (Suomen virallinen tilasto 2010 a) which contin-ued in 2010 being 470 kg per inhabitant (Suomen virallinen tilasto 2011d). In 2009, consumption expenditure of households decreased 1,8 % and net sales of the service sector decreased 7,5 % in Finland (Suomen virallinen tilasto 2010b) which may partially explain the decreased amount of waste.
Although the amount of MSW has been rising rather steadily for many decades till the year 2008 (Figure 5), the amount of waste landfilled is slowly decreasing.
Figure 5. Amounts and treatment of municipal waste during 1997-2010. (Suomen virallinen tilasto 2011c)
In 2009 about 2,56 million tonnes of MSW were collected (Suomen virallinen tilasto 2010a) which was 7,4 % less than in 2008 (Suomen virallinen tilasto 2011c). Altogether 1,13 million tonnes municipal waste were landfilled in 2009, which was 16 % less than in previous year (Suomen virallinen tilasto 2010a). Altogether 478 kg of municipal waste per year per inhabitant was produced in 2009 in Finland (Suomen virallinen tilasto 2010b) and, in 2010, the amount of mu-nicipal waste produced and landfilled has still slightly decreased (Figure 5) so that the amount of municipal waste per inhabitant was then 470
13
kg (Suomen virallinen tilasto 2011d). About 60 % of MSW is generated by households and the rest is produced in the service sector (Finnish Environment Institute 2010e).
According to Sokka et al. (2007) the new ordi-nances on waste have achieved an increase in the level of recovery of waste but they have not been as efficient at encouraging waste reduc-tion. Municipal waste charge and national waste tax has been quite encouraging as economic instruments. (Melanen et al. 2002) Packaging policy naturally affects waste generation and, hence, any changes in the type of packaging (i.e. using refundable packaging) have an impact on municipal waste production. Over 2/3 of the packaging is reusable in Finland and therefore less packaging waste is generated than in the EU on average (Environmental Register of Packag-ing PYR ltd., 2011d, see also Appendix 4).
3.1 Composition and sources of mSW
The composition of MSW has also changed dur-ing 1960s-1990s in Finland. The proportion of paper and cardboard declined from 50–70% (in the 1960s and the 1970s) to 40–50% in the 1990s, assumably because other packaging materials such as plastics replaced paper. The
proportion of the organic waste fraction has increased from 10–20% (in the 1960s) to 30–40% (end of the 1990s) and the share of plas-tic waste increased to about 10% in the 1990s. Earlier, MSW contained even 20% of ash, sand
and other non-combustible materials but their proportion decreased to 5–7% by the end of the 1990s because of transition to district heat-ing, electricity and oil in the heating of residen-tial buildings. (Sokka et al. 2007). The same kind of change was seen in new York from 1920 to 1990, as the mass fraction of fuel ash reduced and amount of organic waste, paper and plastic increased markedly (Walsh 2002).
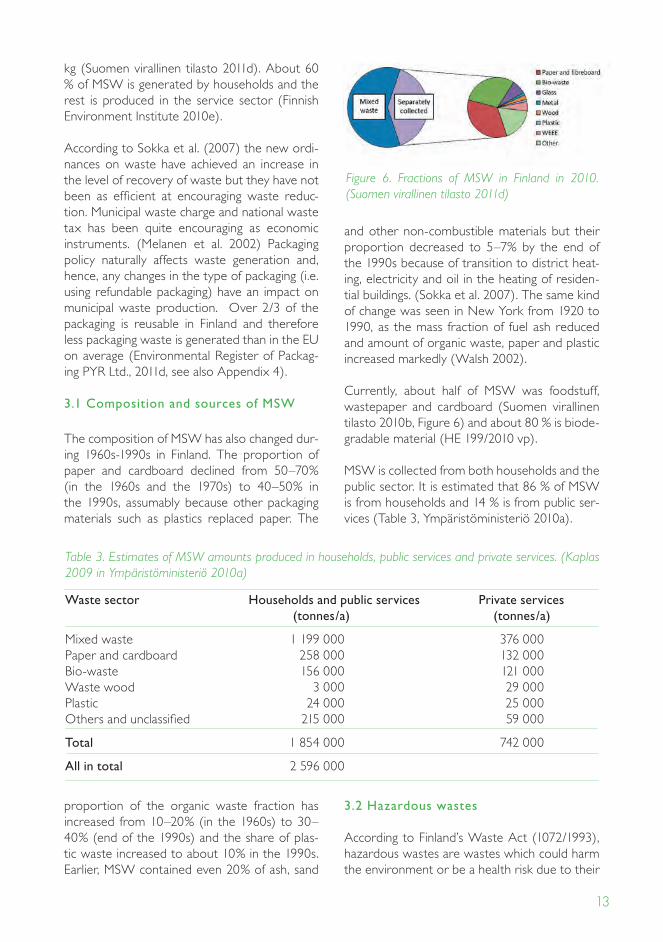
currently, about half of MSW was foodstuff, wastepaper and cardboard (Suomen virallinen tilasto 2010b, Figure 6) and about 80 % is biode-gradable material (HE 199/2010 vp).
MSW is collected from both households and the public sector. It is estimated that 86 % of MSW is from households and 14 % is from public ser-vices (Table 3, Ympäristöministeriö 2010a).
3.2 Hazardous wastes
According to Finland’s Waste Act (1072/1993), hazardous wastes are wastes which could harm the environment or be a health risk due to their
Figure 6. Fractions of mSW in Finland in 2010. (Suomen virallinen tilasto 2011d)
Table 3. Estimates of mSW amounts produced in households, public services and private services. (Kaplas 2009 in Ympäristöministeriö 2010a)
Waste sector Households and public services Private services (tonnes/a) (tonnes/a)
Mixed waste 1 199 000 376 000Paper and cardboard 258 000 132 000bio-waste 156 000 121 000Waste wood 3 000 29 000Plastic 24 000 25 000Others and unclassified 215 000 59 000
Total 1 854 000 742 000
All in total 2 596 000
14
chemical or other properties. Hazardous wastes types are classified in a list of hazardous and general waste types which are defined in con-nection with the Ministry of the Environment decree 1129/2001 which is again based on a sim-ilar list defined by the European community. lo-cal authorities are responsible for the recovery and treatment of hazardous wastes produced in homes, farming and forestry, if the quantities are not excessive. The packing and labelling of haz-ardous wastes is controlled according to special legislation. Hazardous wastes may only be trans-ported to landfills which are equipped to treat them. (Finnish Environment Institute 2011f)
Several Finnish firms are specialized in the treat-ment and recovery of hazardous wastes. The national hazardous waste facility Ekokem Oy is jointly owned by the state, local authorities and industry. In 2003, Ekokem Oy treated ca. 10% of the hazardous waste produced in Finland, and is equipped to treat all common hazardous waste. Other facilities have specialized in the treatment of specific types of hazardous waste. during 2003, 1,3 million tonnes of hazardous waste was produced in Finland, of which 57% was trans-ported to hazardous waste landfill sites and 22% was recovered as material or energy. (Finn-ish Environment Institute 2011g). ■
15
4 Municipal Solid Waste Management
In 1904, municipal waste collection system, based on barrel and cement containers, was es-tablished in Helsinki. In the 1920s, excrements and ash were collected separately for fertiliza-tion use in some parts of Helsinki. later on, the target of sorting was to separate waste for three different purposes: food for pigs, material for fertilization use and other kinds of wastes. (Turpeinen, 1995) In the 1950s, waste furnaces were common in residential buildings but due to odour problems and small particles, they were abandoned in the 1970s (nygård 2000).
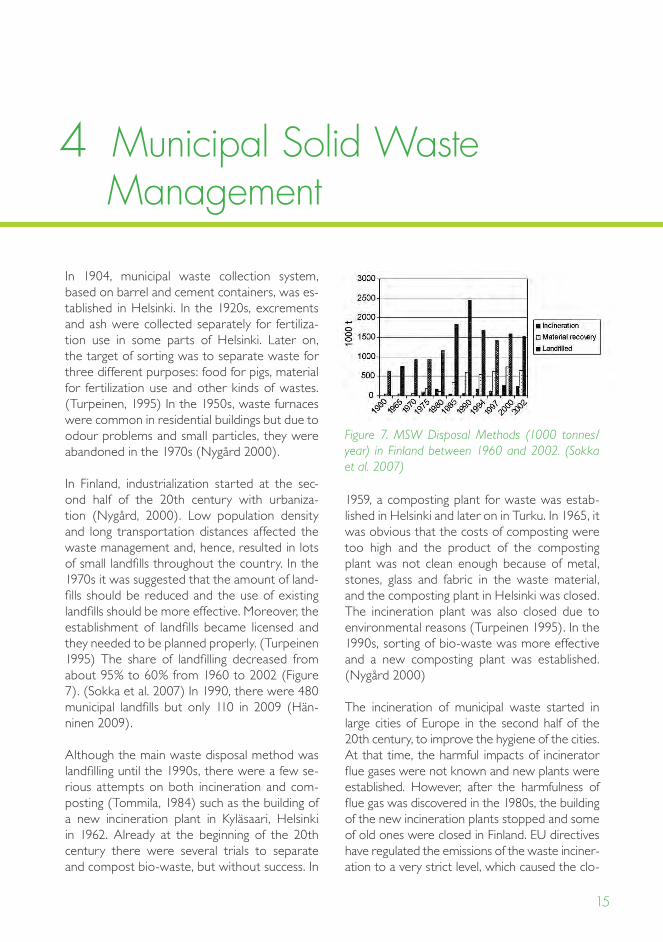
In Finland, industrialization started at the sec-ond half of the 20th century with urbaniza-tion (nygård, 2000). low population density and long transportation distances affected the waste management and, hence, resulted in lots of small landfills throughout the country. In the 1970s it was suggested that the amount of land-fills should be reduced and the use of existing landfills should be more effective. Moreover, the establishment of landfills became licensed and they needed to be planned properly. (Turpeinen 1995) The share of landfilling decreased from about 95% to 60% from 1960 to 2002 (Figure 7). (Sokka et al. 2007) In 1990, there were 480 municipal landfills but only 110 in 2009 (Hän-ninen 2009).
Although the main waste disposal method was landfilling until the 1990s, there were a few se-rious attempts on both incineration and com-posting (Tommila, 1984) such as the building of a new incineration plant in Kyläsaari, Helsinki in 1962. Already at the beginning of the 20th century there were several trials to separate and compost bio-waste, but without success. In
1959, a composting plant for waste was estab-lished in Helsinki and later on in Turku. In 1965, it was obvious that the costs of composting were too high and the product of the composting plant was not clean enough because of metal, stones, glass and fabric in the waste material, and the composting plant in Helsinki was closed. The incineration plant was also closed due to environmental reasons (Turpeinen 1995). In the 1990s, sorting of bio-waste was more effective and a new composting plant was established. (nygård 2000)
The incineration of municipal waste started in large cities of Europe in the second half of the 20th century, to improve the hygiene of the cities. At that time, the harmful impacts of incinerator flue gases were not known and new plants were established. However, after the harmfulness of flue gas was discovered in the 1980s, the building of the new incineration plants stopped and some of old ones were closed in Finland. EU directives have regulated the emissions of the waste inciner-ation to a very strict level, which caused the clo-
Figure 7. mSW Disposal methods (1000 tonnes/year) in Finland between 1960 and 2002. (Sokka et al. 2007)
16
sure of some of the old waste incineration plants in Finland. After that, the purification techniques of flue gases have developed fast and amount of emissions has declined efficiently. Many new waste incineration plants have been built in the 21st century. (Jätelaitosyhdistys 2011a).
4.1 Recovery of mSW
Waste recovery rates vary depending on the waste sector. In 2009, the mineral and wood-en wastes and metal scrap formed the largest group of the total amount of wastes in tonnes recovered as material. The majority of the min-eral wastes are landfilled and wooden wastes are mainly used as energy. Almost all metal scrap and glass are recycled. (Finnish Environment In-
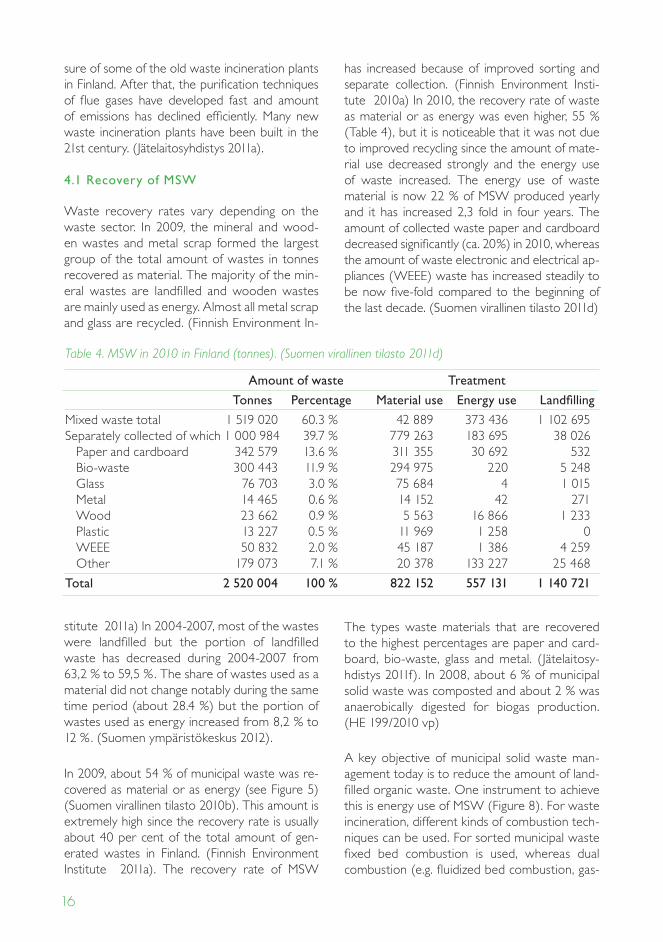
stitute 2011a) In 2004-2007, most of the wastes were landfilled but the portion of landfilled waste has decreased during 2004-2007 from 63,2 % to 59,5 %. The share of wastes used as a material did not change notably during the same time period (about 28.4 %) but the portion of wastes used as energy increased from 8,2 % to 12 %. (Suomen ympäristökeskus 2012).
In 2009, about 54 % of municipal waste was re-covered as material or as energy (see Figure 5) (Suomen virallinen tilasto 2010b). This amount is extremely high since the recovery rate is usually about 40 per cent of the total amount of gen-erated wastes in Finland. (Finnish Environment Institute 2011a). The recovery rate of MSW
has increased because of improved sorting and separate collection. (Finnish Environment Insti-tute 2010a) In 2010, the recovery rate of waste as material or as energy was even higher, 55 % (Table 4), but it is noticeable that it was not due to improved recycling since the amount of mate-rial use decreased strongly and the energy use of waste increased. The energy use of waste material is now 22 % of MSW produced yearly and it has increased 2,3 fold in four years. The amount of collected waste paper and cardboard decreased significantly (ca. 20%) in 2010, whereas the amount of waste electronic and electrical ap-pliances (WEEE) waste has increased steadily to be now five-fold compared to the beginning of the last decade. (Suomen virallinen tilasto 2011d)
The types waste materials that are recovered to the highest percentages are paper and card-board, bio-waste, glass and metal. (Jätelaitosy-hdistys 2011f). In 2008, about 6 % of municipal solid waste was composted and about 2 % was anaerobically digested for biogas production. (HE 199/2010 vp)
A key objective of municipal solid waste man-agement today is to reduce the amount of land-filled organic waste. One instrument to achieve this is energy use of MSW (Figure 8). For waste incineration, different kinds of combustion tech-niques can be used. For sorted municipal waste fixed bed combustion is used, whereas dual combustion (e.g. fluidized bed combustion, gas-
Amount of waste Treatment
Tonnes Percentage material use Energy use Landfilling
Mixed waste total 1 519 020 60.3 % 42 889 373 436 1 102 695Separately collected of which 1 000 984 39.7 % 779 263 183 695 38 026 Paper and cardboard 342 579 13.6 % 311 355 30 692 532 bio-waste 300 443 11.9 % 294 975 220 5 248 glass 76 703 3.0 % 75 684 4 1 015 Metal 14 465 0.6 % 14 152 42 271 Wood 23 662 0.9 % 5 563 16 866 1 233 Plastic 13 227 0.5 % 11 969 1 258 0 WEEE 50 832 2.0 % 45 187 1 386 4 259 Other 179 073 7.1 % 20 378 133 227 25 468
Total 2 520 004 100 % 822 152 557 131 1 140 721
Table 4. mSW in 2010 in Finland (tonnes). (Suomen virallinen tilasto 2011d)
17
ification) is suitable for clean and homogenous packing and wooden waste from trade and in-dustry. The waste incineration directive (no. 4) requires efficient purifications and controlling for the emissions. (Jätelaitosyhdistys 2012a)
Figure 8. The waste for the energy use is taken from the landfilled waste segment. (Jätelaitosyhdis-tys 2012a)
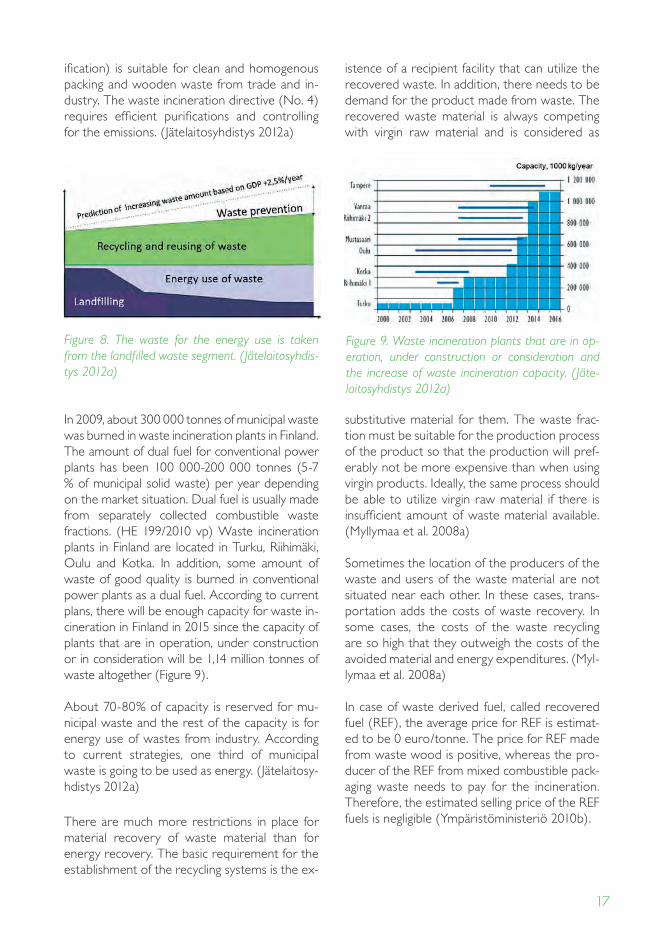
In 2009, about 300 000 tonnes of municipal waste was burned in waste incineration plants in Finland. The amount of dual fuel for conventional power plants has been 100 000-200 000 tonnes (5-7 % of municipal solid waste) per year depending on the market situation. dual fuel is usually made from separately collected combustible waste fractions. (HE 199/2010 vp) Waste incineration plants in Finland are located in Turku, Riihimäki, Oulu and Kotka. In addition, some amount of waste of good quality is burned in conventional power plants as a dual fuel. According to current plans, there will be enough capacity for waste in-cineration in Finland in 2015 since the capacity of plants that are in operation, under construction or in consideration will be 1,14 million tonnes of waste altogether (Figure 9).
About 70-80% of capacity is reserved for mu-nicipal waste and the rest of the capacity is for energy use of wastes from industry. According to current strategies, one third of municipal waste is going to be used as energy. (Jätelaitosy-hdistys 2012a)
There are much more restrictions in place for material recovery of waste material than for energy recovery. The basic requirement for the establishment of the recycling systems is the ex-
istence of a recipient facility that can utilize the recovered waste. In addition, there needs to be demand for the product made from waste. The recovered waste material is always competing with virgin raw material and is considered as
substitutive material for them. The waste frac-tion must be suitable for the production process of the product so that the production will pref-erably not be more expensive than when using virgin products. Ideally, the same process should be able to utilize virgin raw material if there is insufficient amount of waste material available. (Myllymaa et al. 2008a)
Sometimes the location of the producers of the waste and users of the waste material are not situated near each other. In these cases, trans-portation adds the costs of waste recovery. In some cases, the costs of the waste recycling are so high that they outweigh the costs of the avoided material and energy expenditures. (Myl-lymaa et al. 2008a)
In case of waste derived fuel, called recovered fuel (REF), the average price for REF is estimat-ed to be 0 euro/tonne. The price for REF made from waste wood is positive, whereas the pro-ducer of the REF from mixed combustible pack-aging waste needs to pay for the incineration. Therefore, the estimated selling price of the REF fuels is negligible (Ympäristöministeriö 2010b).
Figure 9. Waste incineration plants that are in op-eration, under construction or consideration and the increase of waste incineration capacity. (Jäte-laitosyhdistys 2012a)
18
4.2 Recycling of source separated mSW
MetalMetal recycling has a long history in Finland because metal has always has been a valuable material (Romukeskus 2011a). The Romukeskus Oy wholesale company was established in 1940 during the Second World War. At that time, there was a controlled economy, which included also scrap selling in Finland. Scrap was an impor-tant raw material which was not allowed to be exported, and the domestic market was con-trolled by the purchasing monopoly of industry. The supervision of the interests of scrap sellers motivated them to cooperate and they estab-lished Suomen Romukauppiaiden liitto (Finnish Scrapdealers Associaton) and wholesale firm Romukeskus Oy. For many years Romukeskus Oy was the only wholesale firm for the scrap sector in Finland. It negotiated with the industry and regulation authorities for the prices of scrap and took care of bulk selling of domestic scrap metal as raw material to industry. The wholesale firm confirmed the bargaining position of scrap dealers and it made the collection of scrap more effective. (Romukeskus 2011b).
After the war, the amount of scrap material col-lected by Romukeskus increased in Finland since industrialization demanded a continuous need for iron. In the early 1960s, Romukeskus was de-livering 90% of scrap iron to industry and in 1963 the company delivered over 100 000 tonnes of scrap. The energy crisis and the increase in the price of raw materials affected the scrap sec-tor as well. Although world market prices were increasing, the price of scrap in Finland de-creased because of the export. This caused a price war between the industry and scrap deal-ers in 1973-1974 and new wholesale firms for the scrap sector were established. In the 1990s, markets were freed and the export ban was dis-solved, and scrap export commenced in 1991. Occasional shortages of domestic raw material also caused iron scrap import from Russia. The trade of nonferrous metals has increased rapidly as well, and most of the material is exported. (Romukeskus 2011b) due to EUs regulations, recycling is nowadays increasingly important for both industry and private person (Romukeskus 2011a).
Romukeskus Oy is currenty an organization of selling, purchasing and marketing for indepen-dently working scrap dealers. Romukeskus has over 50 dealers countrywide and its turnover was over 60 million euro in 2010. (Romukeskus 2011c) Romukeskus is dealing with bulk selling of scrap steel and cast iron, dealing and exporting of nonferrous metal scrap (copper, aluminium, brass) and exporting and importing of scrap steel (Romukeskus 2011a).
Kuusakoski company was established in viipuri, Finland in 1914 as scrap company based on re-cycling. The principle of Kuusakoski is to keep irreplaceable natural raw materials in produc-tion by recycling and refining metals into new raw materials for use in industry. (Kuusakoski recycling 2011a) Most active times of growth were the time of industrialism after the wars and internationalization during 1970-1990. In the 21st century, Kuusakoski has increased and developed their delivery network. The quality of metal is not so important, since Kuusakoski accepts steel, copper, aluminium, precious metal and mixed metal. All household metal, such as food cans and roofing iron, sauna stoves, mo-peds, bikes, toys, wire fencing kettles, of all sizes and/or ages are accepted to be recycled. (Kuu-sakoski recycling 2011b).
nowadays Kuusakoski is an international com-pany providing recycling services. Kuusakoski is the leading recycler of metal-based products in northern Europe and one of the largest suppli-ers and refiners of recycled metals in the world. Kuusakoski provides recycling services for cus-tomers in industry, trade, offices, construction or consumers. Kuusakoski collects all recyclable materials from customers, processes and makes them into recycled steel and aluminium. Kuusa-koski also designs, manufactures and delivers re-cycling machinery and equipment for customers in industry. (Kuusakoski recycling 2011a).
PaperThe shortage of paper in germany launched the recycling and exporting of paper in Finland. Ruben liebkind, an export agent in 1920-1930, delivered up to 10 000 tons of recycled paper per year. The very first sorting plant for recycled paper was established to länsisatama in Helsinki
19
by Kurt Pilack. In the 1930s, non-profit organi-zations collected e.g. metal, rubber and paper as voluntary work. during the war years, paper was collected only from major sources such as printing houses, paper converting mills, compa-nies using packages and the public sector. The overall recycling rate of waste increased after the war since there was a shortage of raw mate-rials. (Paperinkeräys Oy 2011a)
Jätekeskus Oy was established in 1943 for the collection of paper and acquisition of raw mate-rial. The founder members were four forestry companies and berndt Relander, a private mem-ber. The name of Jätekeskus Oy was changed to Paperinkeräyskeskus Oy in 1961 and to Pa-perinkeräys Oy in 1965. during peace times, the collection of recovered paper was expanded to the households as well. The Ministry and For-eign trade licence office invented to offer the re-ward for collected material to motivate people to collect the paper. The first collection cam-paign with rewards such as candy was launched in 1947. during the same year, the Jäte-Joonas campaign with reward of candies, sugar and rice was introduced. 5400 tonnes of paper were col-lected in 1947. In the beginning of 1950s, Swiss and german clocks were used as rewards. In the 1950s, silverware and in the 1960s children’s toys such as assembly kits and dolls were used as rewards, as well as English and Swedish lan-guage course material. Schools were awarded by providing e.g. televisions and other devises, and class libraries and films. There were alto-gether 5400 collection points for paper in 1965. (Paperinkeräys Oy 2011a).
The use of collection rewards for paper was very common until the early 1970s, after which the collection was organized by professional collection companies. There were collection containers for properties in urban areas and regional collection containers in sparsely popu-lated areas. collection of office paper increased after 1976, when g. A. Serlachius (nowadays Metsä Tissue Oyj) established a deinking plant in Mänttä. In the beginning, recovered paper was used only for carton interlayer, saturating felt and packaging paper. In 1978, the deinking plant Keräyskuitu Oy was established in Kotka, after which recovered paper was used for raw-mate-
rial of newspaper as well. In 1992, the first ex-periments of collection of milk- and juice carton in East-Helsinki and of carton packaging in Salo was launched. The first Kiertolaari-containers were introduced in 1996. In 1997, Paperinkeräys Oy received the ISO 9002 quality certificate. In 1998, the council of State made a decision for collection and recycling of recovered paper. (Pa-perinkeräys Oy 2011a)
Fibre packagesRecycling of board started already in the 1940s and it is a valuable raw material for cardboard industry (Suomen aaltopahviyhdistys 2011a). corrugated board consists of wood fibres and starch size. Old corrugated containers are very valuable and wanted raw material (Suomen aal-topahviyhdistys 2011b). The Suomen Aaltopah-viyhdistys ry (SAPY) organization was founded in 1963 by Finnish corrugated board factories (Suomen aaltopahviyhdistys 2011c). SAPY has promoted the collection of corrugated card-board together with trade and collection stores already since the beginning of the 1990s and, as a consequence, the amount of landfilled cardboard material has decreased markedly. (Suomen aal-topahviyhdistys 2011d) The first experiments of sorting and collection of carton liquid packages was carried on in 1992 to Helsinki and in 1994 to Hämeenlinna. The experiments were suc-cessful and the collection percentage was 43% (lettenmeier 1994).
GlassThe collection of glass was launched in Finland in 1978, when a committee for glass collection was founded in Riihimäki. The committee con-sisted of the city of Riihimäki, the Riihimäen lasi (Riihimäki glass) company and the Häti Ky waste management company. In the beginning, 3-4 containers were located near shops. In 1978, the collection of glass started in Karhula, by the Karhulan lasi Oy (Karhula glass) company. The collection had a successful start and people participated actively. Impurities in the collected glass (e.g. metal parts in bottles) caused some problems in the utilization of the glass. In the 1980s, small purifying plants were founded in Riihimäki and Karhula, but the results of puri-fying were not very good. collection rates in-creased yearly, and transporting and financing
20
caused trouble. In 1995, Finland joined the EU, after which the EU set targets for the utilization of packaging materials. For glass the target was 48% which was exceeded in Finland. In the same year, a modern glass purifying plant (operated by company Suomen Uusioaines Oy) was launched in Forssa. (Suomen keräyslasiyhdistys 2011a) It was more specialized and efficient so the use of glass expanded into new areas. (Uusioaines Oy 2011a).
In 2000, Finland was the second largest glass collecting country after Switzerland. (Suomen keräyslasiyhdistys 2011a) In 2001, the collection rate of glass was ca. 72% in Finland, of which ca. 49% was utilized (EUs objective 48%). (Suomen keräyslasiyhdistys 2011b) As the importing lim-its of alcoholic beverages were removed, the amount of packaging glass outside of statistics increased. Earlier the collection of glass was or-ganized by municipalities and, since 1990, Alko has been accepting the bottles sold by them. In 2005, the collection of glassware was organized both by municipal organizations and the reward system. Problems are still caused by impurities in collected glass material and increasing costs, es-pecially in municipal collection. (Suomen keräys-lasiyhdistys 2011a)
Beverage containersTraditional glass bottles became refundable in the 1950s. bottles are refilled so they can be re-used several times (Palpa 2011a). beverage cans came to the Finnish market in 1996 and recy-clable plastic bottles in 2008 (Palpa 2011b)
PlasticsThe history of the use of plastic started in 1868 when plastic replaced the use of ivory. In Finland, the first company producing plastic was Sarvis Oy in 1921. Hartsiteollisuus Oy started in 1932. The word “muovi” was introduced in 1949. Pekema Oy was started in 1969 and neste Oy expanded to plastic production in 1971. In the 1980s, there was a strong increase in the us-ing of plastics. In 1992, Suomen Uusiomuovi was established and the utilization of used plastic in-creased. In 2001, Finland accomplished the tar-get of 15 % plastic recycling set by the EU. In 2006, energy use of plastics nearly vanished in Finland and the recycling of plastic as material
became more important. In 2008, waste plastic was used in new waste power plants and the recycling of PET bottles was launched. (Suomen uusiomuovi 2009a).
The recycling of plastics for use as material is not very common. (Hänninen 2009). In the 1990s, there were demonstration projects in several localities for the separate collection of unrefund-able plastic funnels and bottles. The collected plastic was not clean enough for material use to manufacture new plastic products so after those experiment, the unrefundable plastic was used mostly for energy production. (Suomen uusio-muovi 2009b) In addition, the municipal collec-tion of plastic was demonstrated in the 1990s in Porvoo, lahti, Helsinki, Turku, Kokkola and Kangasala. (lettenmeier 1994) nowadays, only a few companies are collecting plastics (Hän-ninen 2009).
Bio-Wastecomposting has always been a very common method of taking care of bio-waste in rural areas. (lettenmeier 1994). The pioneer in separate collection of bio-waste is the Helsinki Metropolitan Area council (YTv). It started the collection experiments in the 1980s (Hän-ninen 2009). The first bio-waste collection and composting experiments in Finland were in 1988 in vuosaari, Helsinki, in 1982 in Joensuu, in 1990-1991 in Espoo and in 1993 in Tampere. The results of these experiments were positive. (lettenmeier 1994). The recycling rate of bio-waste in Tampere was 20-60% depending on the type of apartment house. Also the quality of sorting was good (nieminen & Isoaho 1995). YTv launched the actual separate collection of bio-waste in 1993, after which the other mu-nicipalities started separate collection due to legislation. Production of bio-waste is quite re-markable, 10-15 liters per family in one week (Hänninen 2009). ■
21
5 Organization of Municipal Solid Waste Management in Finland
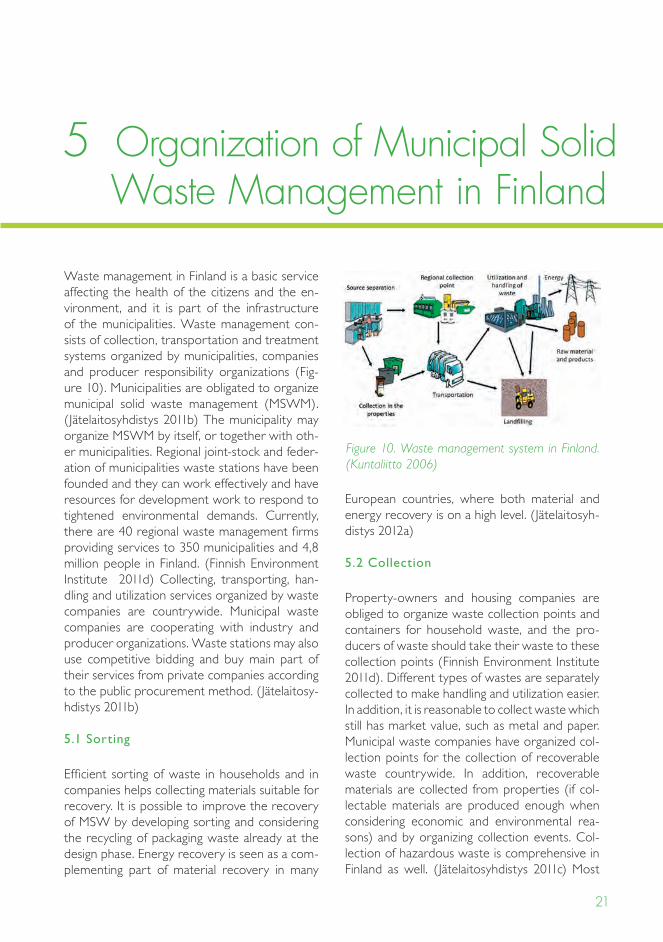
Waste management in Finland is a basic service affecting the health of the citizens and the en-vironment, and it is part of the infrastructure of the municipalities. Waste management con-sists of collection, transportation and treatment systems organized by municipalities, companies and producer responsibility organizations (Fig-ure 10). Municipalities are obligated to organize municipal solid waste management (MSWM). (Jätelaitosyhdistys 2011b) The municipality may organize MSWM by itself, or together with oth-er municipalities. Regional joint-stock and feder-ation of municipalities waste stations have been founded and they can work effectively and have resources for development work to respond to tightened environmental demands. currently, there are 40 regional waste management firms providing services to 350 municipalities and 4,8 million people in Finland. (Finnish Environment Institute 2011d) collecting, transporting, han-dling and utilization services organized by waste companies are countrywide. Municipal waste companies are cooperating with industry and producer organizations. Waste stations may also use competitive bidding and buy main part of their services from private companies according to the public procurement method. (Jätelaitosy-hdistys 2011b)
5.1 Sorting
Efficient sorting of waste in households and in companies helps collecting materials suitable for recovery. It is possible to improve the recovery of MSW by developing sorting and considering the recycling of packaging waste already at the design phase. Energy recovery is seen as a com-plementing part of material recovery in many
European countries, where both material and energy recovery is on a high level. (Jätelaitosyh-distys 2012a)
5.2 Collection
Property-owners and housing companies are obliged to organize waste collection points and containers for household waste, and the pro-ducers of waste should take their waste to these collection points (Finnish Environment Institute 2011d). different types of wastes are separately collected to make handling and utilization easier. In addition, it is reasonable to collect waste which still has market value, such as metal and paper. Municipal waste companies have organized col-lection points for the collection of recoverable waste countrywide. In addition, recoverable materials are collected from properties (if col-lectable materials are produced enough when considering economic and environmental rea-sons) and by organizing collection events. col-lection of hazardous waste is comprehensive in Finland as well. (Jätelaitosyhdistys 2011c) Most
Figure 10. Waste management system in Finland. (Kuntaliitto 2006)
22
commonly, paper, glass, organic wastes, hazard-ous wastes and cardboard are separated but en-ergy waste for incineration and metallic wastes are also collected separately in some localities. (Finnish Environment Institute 2011d) Almost all citizens are able to use the separate collec-tion of paper, glass and hazardous waste. There is separate collection for metal in ca. 96%, for cardboard in ca. 97%, and for bio-waste in 68% of Finnish municipalities (Hänninen 2009).
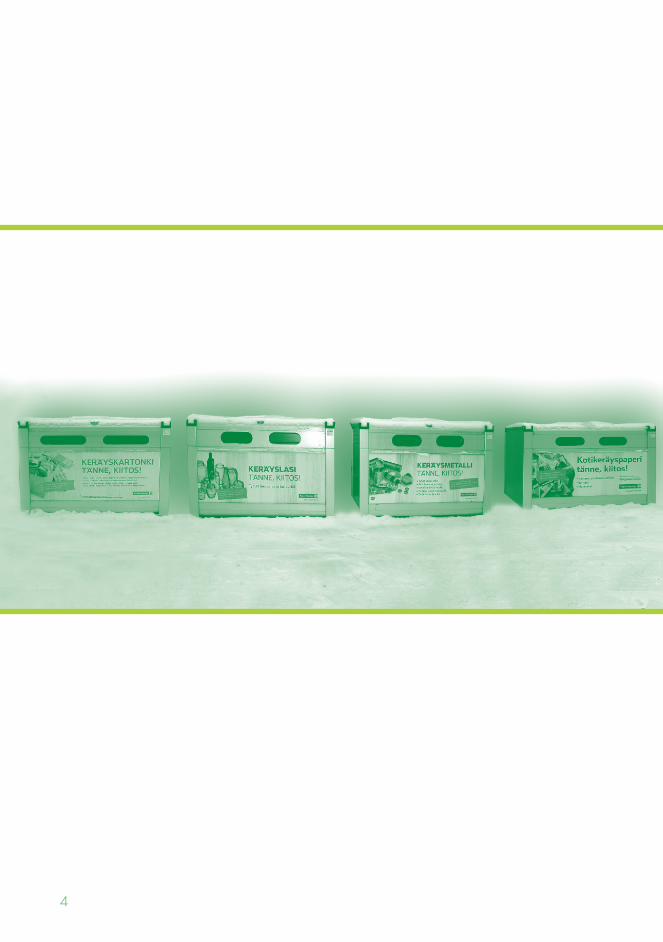
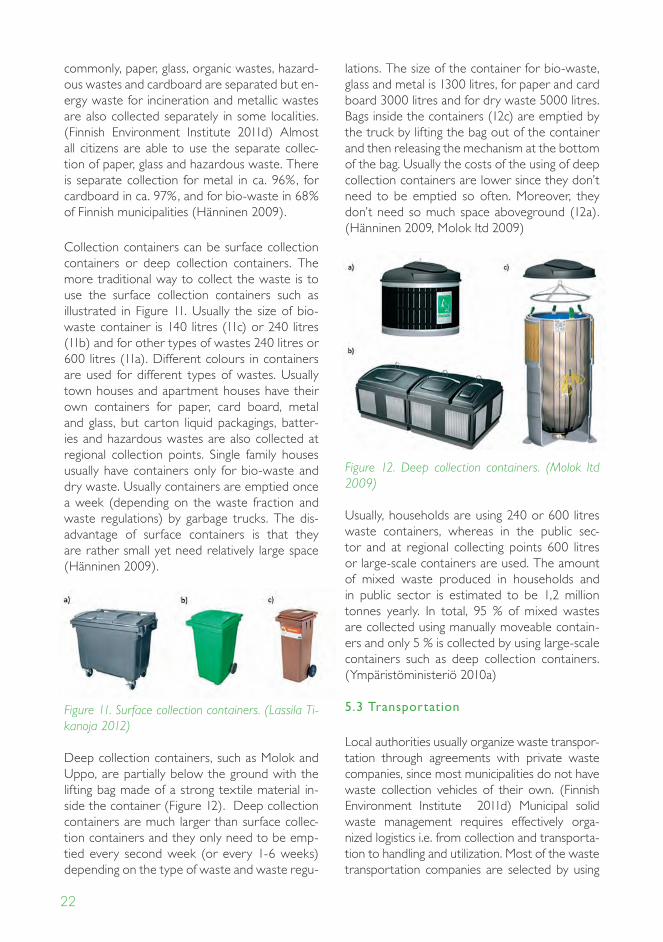
collection containers can be surface collection containers or deep collection containers. The more traditional way to collect the waste is to use the surface collection containers such as illustrated in Figure 11. Usually the size of bio-waste container is 140 litres (11c) or 240 litres (11b) and for other types of wastes 240 litres or 600 litres (11a). different colours in containers are used for different types of wastes. Usually town houses and apartment houses have their own containers for paper, card board, metal and glass, but carton liquid packagings, batter-ies and hazardous wastes are also collected at regional collection points. Single family houses usually have containers only for bio-waste and dry waste. Usually containers are emptied once a week (depending on the waste fraction and waste regulations) by garbage trucks. The dis-advantage of surface containers is that they are rather small yet need relatively large space (Hänninen 2009).
Figure 11. Surface collection containers. (Lassila Ti-kanoja 2012)
deep collection containers, such as Molok and Uppo, are partially below the ground with the lifting bag made of a strong textile material in-side the container (Figure 12). deep collection containers are much larger than surface collec-tion containers and they only need to be emp-tied every second week (or every 1-6 weeks) depending on the type of waste and waste regu-
lations. The size of the container for bio-waste, glass and metal is 1300 litres, for paper and card board 3000 litres and for dry waste 5000 litres. bags inside the containers (12c) are emptied by the truck by lifting the bag out of the container and then releasing the mechanism at the bottom of the bag. Usually the costs of the using of deep collection containers are lower since they don’t need to be emptied so often. Moreover, they don’t need so much space aboveground (12a). (Hänninen 2009, Molok ltd 2009)
Figure 12. Deep collection containers. (molok ltd 2009)
Usually, households are using 240 or 600 litres waste containers, whereas in the public sec-tor and at regional collecting points 600 litres or large-scale containers are used. The amount of mixed waste produced in households and in public sector is estimated to be 1,2 million tonnes yearly. In total, 95 % of mixed wastes are collected using manually moveable contain-ers and only 5 % is collected by using large-scale containers such as deep collection containers. (Ympäristöministeriö 2010a)
5.3 Transportation
local authorities usually organize waste transpor-tation through agreements with private waste companies, since most municipalities do not have waste collection vehicles of their own. (Finnish Environment Institute 2011d) Municipal solid waste management requires effectively orga-nized logistics i.e. from collection and transporta-tion to handling and utilization. Most of the waste transportation companies are selected by using
23
competitive bidding but some of the properties use contractual waste transportation by making the contract with the transportation company directly. Using competitive bidding may lower the cost on transportation, since municipalities can buy transportation services in bulk and, as major customers, they have advantage over other com-petitors. (Jätelaitosyhdistys 2011d)
If the municipality is organizing the waste trans-portation, it can set the price of the transporta-tion for the owner of properties. This system was in use in 33% of municipalities and it cov-ered 50 % of the citizens in 2006. The owner of property may use competitive bidding and select the contractual transportation with the waste company directly (in about 47 % of mu-nicipalities and 40 % of the citizens). The rest of the municipalities are using both systems. (Ram-boll 2008) 5.4 Waste treatment
Municipalities are obligated to organize the utili-zation and treatment of the waste that they are responsible for. All the waste that municipalities are responsible for, including the wastes from contractual waste transportations, needs to be transported to the adequate place organized by municipalities for their utilization and treat-ment. (HE 199/2010 vp, 20). Waste treatment means recovery or disposal operations, includ-ing preparation prior to recovery or disposal. In essence, it involves converting the waste mate-rial to more harmless or more useful form, con-sidering future utilization. Waste can be treated by biological, mechanical and thermal processes. In Finland, waste treatment is centralized in large regional treatment centres where the treatment can be done effectively and economically. All the centres have processes for different waste types and disposal places for the wastes that are not recoverable. (Jätelaitosyhdistys 2011e)
In biological treatment, the bio-waste is decom-posed by using composting or anaerobic diges-tion to more harmless and safer form that can be used in soil improvement. biogas produced in anaerobic digestion consists mainly of meth-ane which can be used as a source of energy. biological treatment is used for municipal bio-
waste and sewage sludge. For large amounts of bio-waste, there are treatment facilities where the bio-waste can be treated in closed reactors. (Jätelaitosyhdistys 2011e)
5.5 Landfilling
Mechanical pre-treatment, e.g. crushing and screening is often used when there is a need to separate or reshape different fractions of waste before utilization. The method is used for the processing of MSW to recovered fuel (REF). Waste fractions that cannot be utilized are transported to landfills for final disposal. As the degradation of biodegradable wastes generates greenhouse gases, the landfilling of bio-waste has been banned and only inorganic wastes such as ashes from energy production can be placed in landfill. (Jätelaitosyhdistys 2011e) As can be seen in Table 5, the number of landfills has been declining strongly during the past years because of the strict requirements for the base structure of landfills (HE 199/2010 vp)
Table 5. Number of landfills in Finland in 2009. (hE 199/2010)
5.6 Case: mSWm in Oulu
Separate collection of MSW in the city of Oulu According to the waste management regula-tions of the city of Oulu, properties are obliged to have collection bins for mixed waste. In ad-dition, residential buildings with a minimum of four apartments must have separate collection bins for waste paper, cardboard and bio-waste. In addition, residential buildings with a minimum of ten apartments need to have separate collec-tion bins for carton and liquid packages, metal
Landfills in Finland in 2009
landfill for soil 167landfill for hazardous waste 27landfill for permanent waste 37landfill for regular waste (inc. municipal waste) 137Other landfills 29
Total 397
24
and glass. Other properties, such as office and business premises, industrial properties, schools and restaurants need to have collection bins for (Oulun kaupunki 2006): • waste paper, bio-waste (if the property has canteen or foodstore),• cardboard (if it is produced over 10 kg week),• paperboard (if it is produced over 10 kg week), • glass (if it is produced over 20 kg/week),• waste wood (if it is produced over 20 kg week) and • metal waste (if it is produced over 10 kg/week).
bio-waste needs to be transported to a licensed composting plant or composting area by using or-ganized waste transportation, or it can be com-posted in the property. All the separately col-lected waste fractions need to be recycled. Small residential buildings are obliged to transport their recyclables to the regional waste collection points and compost their bio-waste if possible. Recy-clables need to be collected separately in public events as well. (Oulun kaupunki 2006)
The Oulu Waste Management CompanyThe Oulu Waste Management company (Oulun Jätehuolto) is a public-service company of the city of Oulu. It is responsible for waste treatment, coordination of waste transport and waste edu-cation and supplementary services. The waste management operations are funded by the fees collected from the delivery of waste to the Rusko Waste Management centre and funds received from the sale of methane gas produced in waste management centre and from other services. Tax money is not used for the operations. (Oulu Waste Management 2012)
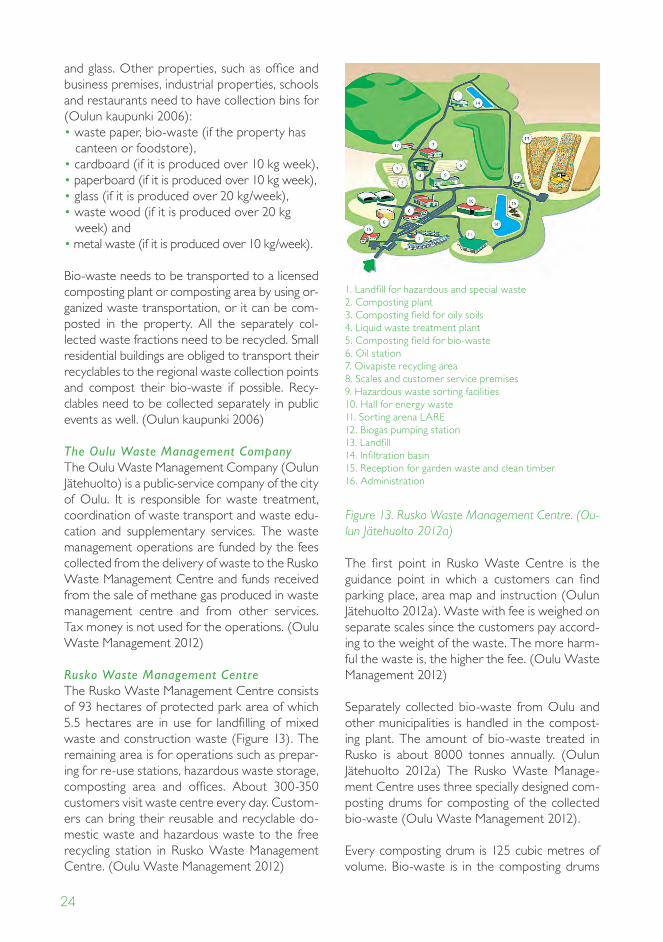
Rusko Waste Management CentreThe Rusko Waste Management centre consists of 93 hectares of protected park area of which 5.5 hectares are in use for landfilling of mixed waste and construction waste (Figure 13). The remaining area is for operations such as prepar-ing for re-use stations, hazardous waste storage, composting area and offices. About 300-350 customers visit waste centre every day. custom-ers can bring their reusable and recyclable do-mestic waste and hazardous waste to the free recycling station in Rusko Waste Management centre. (Oulu Waste Management 2012)
The first point in Rusko Waste centre is the guidance point in which a customers can find parking place, area map and instruction (Oulun Jätehuolto 2012a). Waste with fee is weighed on separate scales since the customers pay accord-ing to the weight of the waste. The more harm-ful the waste is, the higher the fee. (Oulu Waste Management 2012)
Separately collected bio-waste from Oulu and other municipalities is handled in the compost-ing plant. The amount of bio-waste treated in Rusko is about 8000 tonnes annually. (Oulun Jätehuolto 2012a) The Rusko Waste Manage-ment centre uses three specially designed com-posting drums for composting of the collected bio-waste (Oulu Waste Management 2012).
Every composting drum is 125 cubic metres of volume. bio-waste is in the composting drums
1. landfill for hazardous and special waste2. composting plant3. composting field for oily soils4. liquid waste treatment plant5. composting field for bio-waste6. Oil station7. Oivapiste recycling area8. Scales and customer service premises9. Hazardous waste sorting facilities10. Hall for energy waste11. Sorting arena lARE12. biogas pumping station13. landfill14. Infiltration basin15. Reception for garden waste and clean timber16. Administration
Figure 13. Rusko Waste management Centre. (Ou-lun Jätehuolto 2012a)
25
for one week after which it is transferred to a designated area for maturation. The maturation process lasts 6-12 months, when the material is ready for landscaping. (Oulun Jätehuolto 2012a)
The Rusko landfill produces methane which has been recovered and utilized for over ten years. Methane is used in the Paroc factory, in the Oulu University Hospital and for own heating purpos-es. One third of the landfill gases is used to pro-duce electricity and the rest two thirds produce heat. Electricity and heat are used in the Rusko Waste Management centre area. The remaining excess electricity is sold to the national power grid. (Oulu Waste Management 2012)
There are 74 recycling stations in Oulu Waste Management’s operation region. These stations are located in areas residents have adequate access to (near the large shopping centres or schools). Recyclables produced in households (e.g. plastic, cardboard, glass, metal and paper) can be transported to these recycling stations. Hazardous waste and small amounts of waste oil from domestic and agricultural activities and electrical and electronics waste are accepted for free. (Oulu Waste Management 2012)
Oivapiste is the largest collection point for recy-clables and hazardous materials in Oulu and it is located in the Rusko Waste Management cen-tre (Figure 14). Households are allowed to bring their cardboard, paper, paperboard, plastic, metal, clean and untreated timber, less than one cubic meter of pressure treated timber, pack-ing glass, tires (with and without rims), WEEE,
hazardous waste and expanded polystyrene for free. (Oulu Waste Management 2012)
The sorting “arena” called lARE is used in Rusko Waste Management center for the sorting of construction waste and mixed waste from oth-er sources than from compactor vehicles. In the lARE arena, the wastes are sorted for material and energy recovery, which decreases the amount of landfilled waste significantly. In addi-tion to the non-recoverable waste from lARE, the bottom ash from the waste incineration plant is landfilled as well since currently there are no possibilities for its utilization.
Laanila waste incineration plantPresently, mixed waste not suitable for recycling is utilized as energy in Oulu. Wastes collected from the households with compactor vehicles are transported directly to the laanila waste incineration plant. The waste to be incinerated is collected from Oulu and from northern and Eastern Finland. The power plant capacity is over 120 000 tons annually. Most of the produced energy is utilized in Kemira s industrial processes and the rest is used for electricity and district heating purposes in the Oulu region. Incineration of wastes reduces the need for landfill space and increases the utilization rate beyond 70 percent.
Utilization of recoverables collected in Oulu areaThe amounts of separately collected recover-ables have increased steadily during the past years (Figure 15).
Figure 15. The amount of recoverables generated in Oulu Waste management operating area. (Oulun Jätehuolto 2012b)
Figure 14. Oivapiste of Rusko Waste management Centre for the collection of household waste. (Ou-lun Jätehuolto 2012a)
26
The bio-waste composted in Rusko is used for landscaping and construction work at the waste centre (Oulun Jätehuolto 2012a). Since autumn 2012 combustible waste fractions have been incinerated in the laanila incineration plant in Oulu. (Oulun Jätehuolto 2012a, Illikainen 2012) The collected waste paper is recycled to news-paper, catalogs, toilet paper and kitchen paper whereas cardboard is recycled to coreboard, packing board and corrugated cardboard. Some waste paper is used for the preparation of wood fibre wool. (Turunen et al. 2008). The collected glass is used in the earthworks of Rusko waste management centre (Illikainen 2012). In addition, some of the glass was transported to Forssa to be used as raw material e.g. for the preparation of thermal insulation material. (Turunen et al. 2008). Some of the glass is stored for later use. Metal is used as a raw material in industry (Ou-lun Jätehuolto 2012a), mostly in the Outokumpu factory in Tornio (Illikainen 2012). The collected cardboard is used in the factory in Pori (Suomen kuluttajakuitu ry 2011a)
As it can be seen from Figure 16, some of the recoverables from Oulu are transported to re-cycling facilities over remarkably large distances. The lack of recipient facilities in the north is one of the economic burdens of sustainable waste management in sparsely populated northern areas. ■
Figure 16. Transportation distances of recovered materials from Oulu to their utilization facilities.
27
6 Economic instruments of MSWM in Finland
It is estimated that the overall costs of waste management as a turnover of companies in the waste sector in Finland were about 1750 mil-lion euros and the number of personnel 4300 in 2007. These figures don’t include management of sludge and contaminated soil. The net costs of waste management to the waste producer are 1148 million euros annually (Table 6, this does not include the cost of producer responsibility systems). While the amount of MSW in total waste amounts is about three percent, municipal solid waste management (MSWM) attributes to 36 percent of total waste management costs. (Ympäristöministeriö 2010a)
The costs of MSWM have increased due to in-vestment in landfills, waste incineration plants and other treatment facilities. Recycling attri-butes to costs as well since waste materials need to be pre-processed before production. Incomes of waste management consist of reception fees
of waste and revenues from material and en-ergy. The world market price of raw materials has fluctuated strongly during the past years and this has affected the waste sector as well. There has been a demand for some waste material as the raw material prices have increased and the investments in the Far East have increased. On the other hand, the prices of recovered materials have dropped because of the economic depres-sion and need decreased due to reduction of new investments. Therefore, both the demand and supply and the price of waste material have fluctuated strongly. (HE 199/2010 vp)
6.1 Waste taxes and charges
The purpose of economic instruments is to cre-ate incentives for people to change their behav-iour to a more environmentally preferable one such as by finding ways of preventing waste pro-
Waste producer Waste amount Costs Average costs (million tonnes/year) (million euros/year) (euros/tonne)
Households and public services* 2 414 205Trade and other private services 1 65 109Housebuilding and earthwork 23 440 19Extractive activities 22 60 3Industrial activities 18 92 5Energy management 2 24 15Water supply services 1 40 40Agricultural industry 2 13 6
Total 71 1 148
*Without composting in properties
Table 6. Summary of net costs of the waste management in different waste sectors (including waste taxes, vat 0%). (Ympäristöministeriö 2010a)
28
Table 7. Economic instruments in Finland. (Finnish Environment Institute 2012) Economic instrument Purpose Amount of the charge
Municipal waste charge Waste transportation According to the waste tariff Establishment, maintenance, approved by the municipality decommissioning and after-care of Usually a smaller fee for waste treatment facilities that is sorted and fit for use Register maintenance and waste guidance compared to the mixed MSW
Waste tax To encourage the public to reduce waste 40 euros/tonne from 2011 To make waste less harmful 50 euros/tonne from 2013 To utilize waste
drinks packaging taxes To encourage the reuse of drinks packages 0.51 euros/litre To reduce the landfilling of drinks packages To prevent litter
Oil waste charges Managing oil wastes 5.75 euro cents/kilo cleaning up soil and groundwater contaminated with oil
duction or selecting less damaging waste man-agement options. (European commission 2003)
common economic incentives are waste charges for collection and transportation of waste, and waste taxes, charges and fees such as taxes on landfill and packaging [Table 7, European com-mission 2003].
Municipal waste chargesMunicipal waste charges are collected for the establishment, maintenance, decommissioning and purification of waste treatment facilities and for the transportation of wastes. The aims of the waste charges are to reduce the quantity and risks of waste generated and to improve waste recovery. Waste holders pay waste charges and the rates are set by the municipalities. The charges include transportation and waste treat-ment fees and they are often lower for sorted recoverables than for mixed wastes. In 2007, the average fee was 102 euro/tonne of municipal waste and 68 euro/tonne for bio-waste. (Finn-ish Environment Institute 2012).
Waste taxThe aim of waste taxes is to improve waste recovery and to decrease the quantity of land-filled waste. The Waste tax act of Finland came into force in 1996. The Finnish customs author-
ity is liable for the collecting and controlling the waste taxes. Waste taxes are collected for wastes that are brought to public landfill sites. If wastes are recovered or suitably treated e.g. through composting or incineration, waste taxes do not apply. The waste taxes are paid by the landfill operator. However, it is covered by the original producer of the waste in form of fees
when delivering the waste. Waste taxation has helped to reduce the quantity of wastes coming in public landfills despite increased consumption. Waste taxes affect particularly on the amounts of wastes in construction, commercial and in-dustrial activities but they are less effective in limiting household waste. (Finnish Environment Institute 2012)
Drinks packaging taxdrinks packaging taxes are paid on non-re-turnable packages for alcoholic beverages, soft drinks, bottled water and certain other drinks packages. The tax is not levied for returnable packages which are covered with deposit sys-tems. The aims of these taxes are to increase re-use and lower the quantities of landfilled drinks packages, and to restrain littering. drinks packag-ing taxes have effectively increased the amount of returned drinks packages in Finland, since in 2006, almost 98% of the refillable drinks pack-
29
ages were returned and 88% of those packages that can be recycled. The legislation and taxation of drinks packaging in Finland is covered by the legislation on the manufacture of certain types of drinks packaging (1037/2004), the statutes in the Waste Act and the decree on collection sys-tems for returnable drinks packages (180/2005). (Finnish Environment Institute 2012).
Oil waste chargesOil waste charges are added to the prices of lubrication oils. These charges cover the costs of managing oil wastes and cleaning up soils and groundwater which are contaminated with oil. (Finnish Environment Institute 2012).
6.2 Costs of mSWm in households and public services
In the report of the Ministry of Environment (Ympäristöministeriö 2010a) the economic im-pact of waste management was estimated based on statistics and surveys. The collection of MSW is organized either by using property specific or regional waste collection.
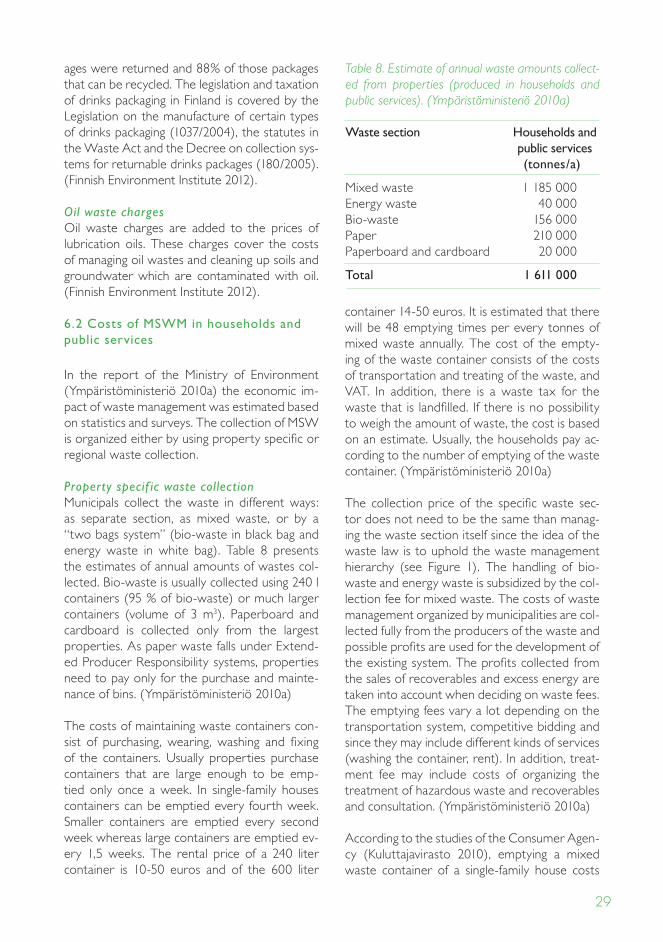
Property specif ic waste collectionMunicipals collect the waste in different ways: as separate section, as mixed waste, or by a “two bags system” (bio-waste in black bag and energy waste in white bag). Table 8 presents the estimates of annual amounts of wastes col-lected. bio-waste is usually collected using 240 l containers (95 % of bio-waste) or much larger containers (volume of 3 m3). Paperboard and cardboard is collected only from the largest properties. As paper waste falls under Extend-ed Producer Responsibility systems, properties need to pay only for the purchase and mainte-nance of bins. (Ympäristöministeriö 2010a)
The costs of maintaining waste containers con-sist of purchasing, wearing, washing and fixing of the containers. Usually properties purchase containers that are large enough to be emp-tied only once a week. In single-family houses containers can be emptied every fourth week. Smaller containers are emptied every second week whereas large containers are emptied ev-ery 1,5 weeks. The rental price of a 240 liter container is 10-50 euros and of the 600 liter
container 14-50 euros. It is estimated that there will be 48 emptying times per every tonnes of mixed waste annually. The cost of the empty-ing of the waste container consists of the costs of transportation and treating of the waste, and vAT. In addition, there is a waste tax for the waste that is landfilled. If there is no possibility to weigh the amount of waste, the cost is based on an estimate. Usually, the households pay ac-cording to the number of emptying of the waste container. (Ympäristöministeriö 2010a)
The collection price of the specific waste sec-tor does not need to be the same than manag-ing the waste section itself since the idea of the waste law is to uphold the waste management hierarchy (see Figure 1). The handling of bio-waste and energy waste is subsidized by the col-lection fee for mixed waste. The costs of waste management organized by municipalities are col-lected fully from the producers of the waste and possible profits are used for the development of the existing system. The profits collected from the sales of recoverables and excess energy are taken into account when deciding on waste fees. The emptying fees vary a lot depending on the transportation system, competitive bidding and since they may include different kinds of services (washing the container, rent). In addition, treat-ment fee may include costs of organizing the treatment of hazardous waste and recoverables and consultation. (Ympäristöministeriö 2010a)
According to the studies of the consumer Agen-cy (Kuluttajavirasto 2010), emptying a mixed waste container of a single-family house costs
Table 8. Estimate of annual waste amounts collect-ed from properties (produced in households and public services). (Ympäristöministeriö 2010a)
Waste section Households and public services (tonnes/a)
Mixed waste 1 185 000Energy waste 40 000bio-waste 156 000Paper 210 000Paperboard and cardboard 20 000
Total 1 611 000
30
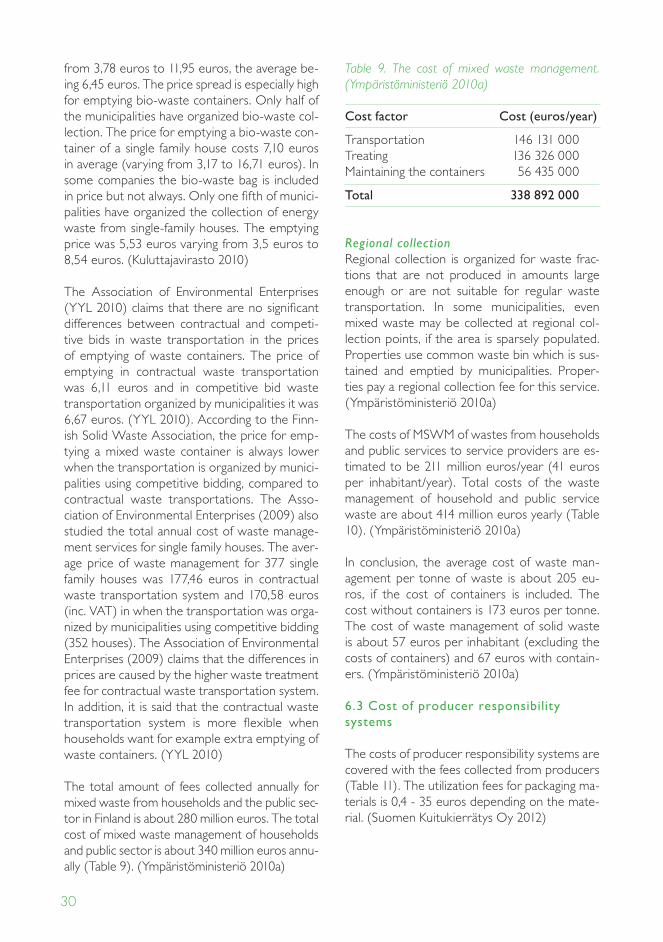
Table 9. The cost of mixed waste management. (Ympäristöministeriö 2010a)
Cost factor Cost (euros/year)
Transportation 146 131 000Treating 136 326 000Maintaining the containers 56 435 000
Total 338 892 000
Regional collectionRegional collection is organized for waste frac-tions that are not produced in amounts large enough or are not suitable for regular waste transportation. In some municipalities, even mixed waste may be collected at regional col-lection points, if the area is sparsely populated. Properties use common waste bin which is sus-tained and emptied by municipalities. Proper-ties pay a regional collection fee for this service. (Ympäristöministeriö 2010a)
The costs of MSWM of wastes from households and public services to service providers are es-timated to be 211 million euros/year (41 euros per inhabitant/year). Total costs of the waste management of household and public service waste are about 414 million euros yearly (Table 10). (Ympäristöministeriö 2010a)
In conclusion, the average cost of waste man-agement per tonne of waste is about 205 eu-ros, if the cost of containers is included. The cost without containers is 173 euros per tonne. The cost of waste management of solid waste is about 57 euros per inhabitant (excluding the costs of containers) and 67 euros with contain-ers. (Ympäristöministeriö 2010a)
6.3 Cost of producer responsibility systems
The costs of producer responsibility systems are covered with the fees collected from producers (Table 11). The utilization fees for packaging ma-terials is 0,4 - 35 euros depending on the mate-rial. (Suomen Kuitukierrätys Oy 2012)
from 3,78 euros to 11,95 euros, the average be-ing 6,45 euros. The price spread is especially high for emptying bio-waste containers. Only half of the municipalities have organized bio-waste col-lection. The price for emptying a bio-waste con-tainer of a single family house costs 7,10 euros in average (varying from 3,17 to 16,71 euros). In some companies the bio-waste bag is included in price but not always. Only one fifth of munici-palities have organized the collection of energy waste from single-family houses. The emptying price was 5,53 euros varying from 3,5 euros to 8,54 euros. (Kuluttajavirasto 2010)
The Association of Environmental Enterprises (YYl 2010) claims that there are no significant differences between contractual and competi-tive bids in waste transportation in the prices of emptying of waste containers. The price of emptying in contractual waste transportation was 6,11 euros and in competitive bid waste transportation organized by municipalities it was 6,67 euros. (YYl 2010). According to the Finn-ish Solid Waste Association, the price for emp-tying a mixed waste container is always lower when the transportation is organized by munici-palities using competitive bidding, compared to contractual waste transportations. The Asso-ciation of Environmental Enterprises (2009) also studied the total annual cost of waste manage-ment services for single family houses. The aver-age price of waste management for 377 single family houses was 177,46 euros in contractual waste transportation system and 170,58 euros (inc. vAT) in when the transportation was orga-nized by municipalities using competitive bidding (352 houses). The Association of Environmental Enterprises (2009) claims that the differences in prices are caused by the higher waste treatment fee for contractual waste transportation system. In addition, it is said that the contractual waste transportation system is more flexible when households want for example extra emptying of waste containers. (YYl 2010)
The total amount of fees collected annually for mixed waste from households and the public sec-tor in Finland is about 280 million euros. The total cost of mixed waste management of households and public sector is about 340 million euros annu-ally (Table 9). (Ympäristöministeriö 2010a)
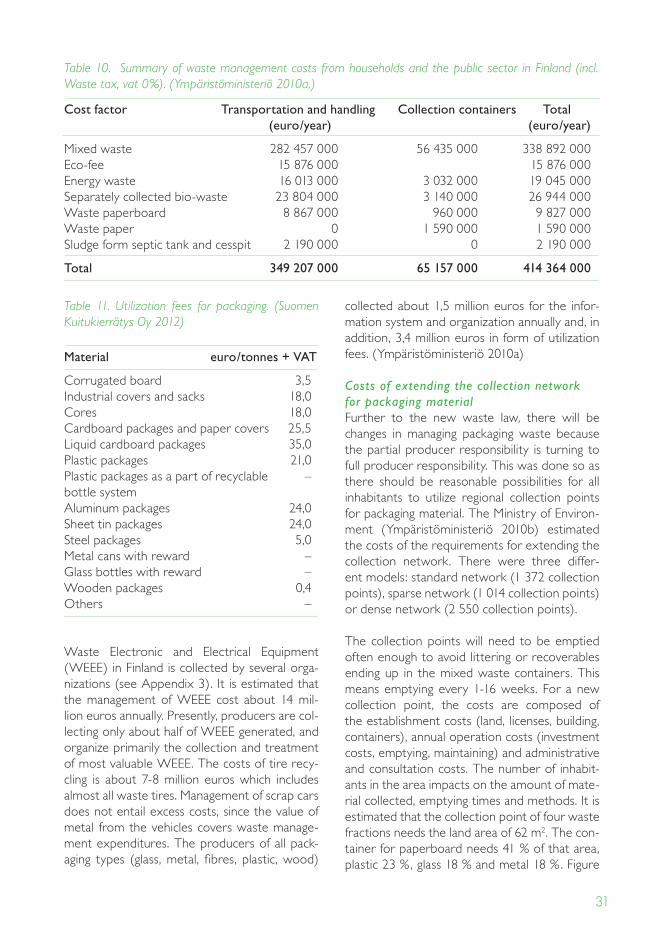
31
Table 11. Utilization fees for packaging. (Suomen Kuitukierrätys Oy 2012)
material euro/tonnes + VAT
corrugated board 3,5Industrial covers and sacks 18,0cores 18,0cardboard packages and paper covers 25,5liquid cardboard packages 35,0Plastic packages 21,0Plastic packages as a part of recyclable –bottle system Aluminum packages 24,0Sheet tin packages 24,0Steel packages 5,0Metal cans with reward –glass bottles with reward –Wooden packages 0,4Others –
Waste Electronic and Electrical Equipment (WEEE) in Finland is collected by several orga-nizations (see Appendix 3). It is estimated that the management of WEEE cost about 14 mil-lion euros annually. Presently, producers are col-lecting only about half of WEEE generated, and organize primarily the collection and treatment of most valuable WEEE. The costs of tire recy-cling is about 7-8 million euros which includes almost all waste tires. Management of scrap cars does not entail excess costs, since the value of metal from the vehicles covers waste manage-ment expenditures. The producers of all pack-aging types (glass, metal, fibres, plastic, wood)
collected about 1,5 million euros for the infor-mation system and organization annually and, in addition, 3,4 million euros in form of utilization fees. (Ympäristöministeriö 2010a)
Costs of extending the collection network for packaging material Further to the new waste law, there will be changes in managing packaging waste because the partial producer responsibility is turning to full producer responsibility. This was done so as there should be reasonable possibilities for all inhabitants to utilize regional collection points for packaging material. The Ministry of Environ-ment (Ympäristöministeriö 2010b) estimated the costs of the requirements for extending the collection network. There were three differ-ent models: standard network (1 372 collection points), sparse network (1 014 collection points) or dense network (2 550 collection points).
The collection points will need to be emptied often enough to avoid littering or recoverables ending up in the mixed waste containers. This means emptying every 1-16 weeks. For a new collection point, the costs are composed of the establishment costs (land, licenses, building, containers), annual operation costs (investment costs, emptying, maintaining) and administrative and consultation costs. The number of inhabit-ants in the area impacts on the amount of mate-rial collected, emptying times and methods. It is estimated that the collection point of four waste fractions needs the land area of 62 m2. The con-tainer for paperboard needs 41 % of that area, plastic 23 %, glass 18 % and metal 18 %. Figure
Cost factor Transportation and handling Collection containers Total (euro/year) (euro/year)
Mixed waste 282 457 000 56 435 000 338 892 000Eco-fee 15 876 000 15 876 000Energy waste 16 013 000 3 032 000 19 045 000Separately collected bio-waste 23 804 000 3 140 000 26 944 000Waste paperboard 8 867 000 960 000 9 827 000Waste paper 0 1 590 000 1 590 000Sludge form septic tank and cesspit 2 190 000 0 2 190 000
Total 349 207 000 65 157 000 414 364 000
Table 10. Summary of waste management costs from households and the public sector in Finland (incl.Waste tax, vat 0%). (Ympäristöministeriö 2010a,)
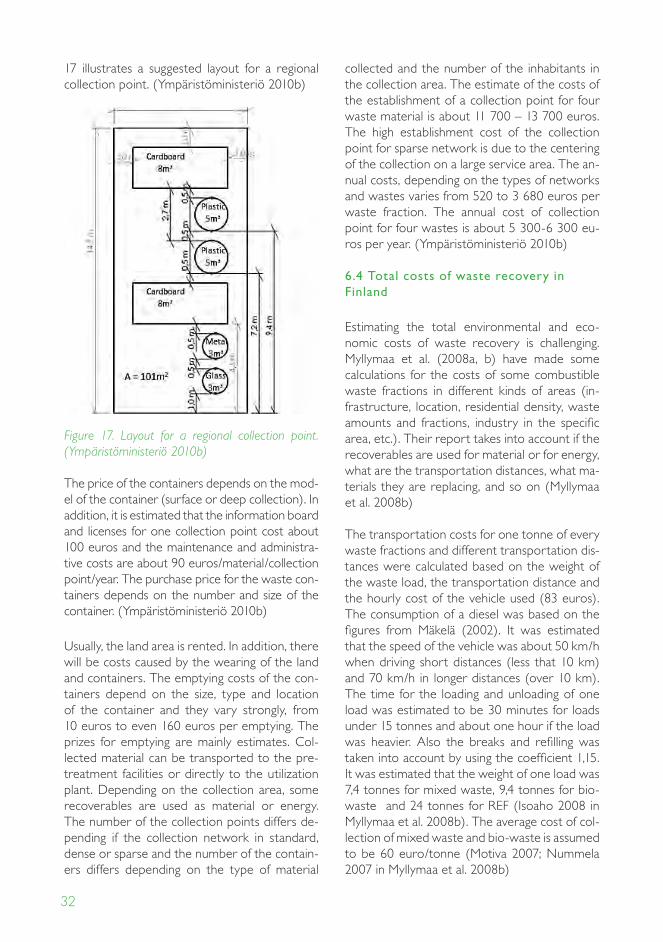
32
17 illustrates a suggested layout for a regional collection point. (Ympäristöministeriö 2010b)
Figure 17. Layout for a regional collection point. (Ympäristöministeriö 2010b)
The price of the containers depends on the mod-el of the container (surface or deep collection). In addition, it is estimated that the information board and licenses for one collection point cost about 100 euros and the maintenance and administra-tive costs are about 90 euros/material/collection point/year. The purchase price for the waste con-tainers depends on the number and size of the container. (Ympäristöministeriö 2010b)
Usually, the land area is rented. In addition, there will be costs caused by the wearing of the land and containers. The emptying costs of the con-tainers depend on the size, type and location of the container and they vary strongly, from 10 euros to even 160 euros per emptying. The prizes for emptying are mainly estimates. col-lected material can be transported to the pre-treatment facilities or directly to the utilization plant. depending on the collection area, some recoverables are used as material or energy. The number of the collection points differs de-pending if the collection network in standard, dense or sparse and the number of the contain-ers differs depending on the type of material
collected and the number of the inhabitants in the collection area. The estimate of the costs of the establishment of a collection point for four waste material is about 11 700 – 13 700 euros. The high establishment cost of the collection point for sparse network is due to the centering of the collection on a large service area. The an-nual costs, depending on the types of networks and wastes varies from 520 to 3 680 euros per waste fraction. The annual cost of collection point for four wastes is about 5 300-6 300 eu-ros per year. (Ympäristöministeriö 2010b)
6.4 Total costs of waste recovery in Finland
Estimating the total environmental and eco-nomic costs of waste recovery is challenging. Myllymaa et al. (2008a, b) have made some calculations for the costs of some combustible waste fractions in different kinds of areas (in-frastructure, location, residential density, waste amounts and fractions, industry in the specific area, etc.). Their report takes into account if the recoverables are used for material or for energy, what are the transportation distances, what ma-terials they are replacing, and so on (Myllymaa et al. 2008b)
The transportation costs for one tonne of every waste fractions and different transportation dis-tances were calculated based on the weight of the waste load, the transportation distance and the hourly cost of the vehicle used (83 euros). The consumption of a diesel was based on the figures from Mäkelä (2002). It was estimated that the speed of the vehicle was about 50 km/h when driving short distances (less that 10 km) and 70 km/h in longer distances (over 10 km). The time for the loading and unloading of one load was estimated to be 30 minutes for loads under 15 tonnes and about one hour if the load was heavier. Also the breaks and refilling was taken into account by using the coefficient 1,15. It was estimated that the weight of one load was 7,4 tonnes for mixed waste, 9,4 tonnes for bio-waste and 24 tonnes for REF (Isoaho 2008 in Myllymaa et al. 2008b). The average cost of col-lection of mixed waste and bio-waste is assumed to be 60 euro/tonne (Motiva 2007; nummela 2007 in Myllymaa et al. 2008b)
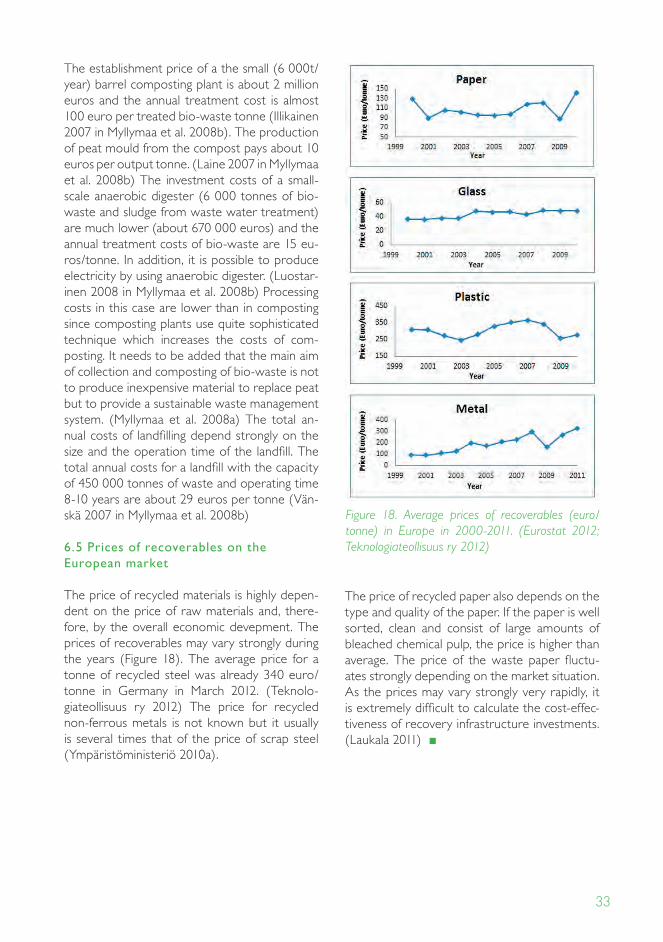
33
The establishment price of a the small (6 000t/year) barrel composting plant is about 2 million euros and the annual treatment cost is almost 100 euro per treated bio-waste tonne (Illikainen 2007 in Myllymaa et al. 2008b). The production of peat mould from the compost pays about 10 euros per output tonne. (laine 2007 in Myllymaa et al. 2008b) The investment costs of a small-scale anaerobic digester (6 000 tonnes of bio-waste and sludge from waste water treatment) are much lower (about 670 000 euros) and the annual treatment costs of bio-waste are 15 eu-ros/tonne. In addition, it is possible to produce electricity by using anaerobic digester. (luostar-inen 2008 in Myllymaa et al. 2008b) Processing costs in this case are lower than in composting since composting plants use quite sophisticated technique which increases the costs of com-posting. It needs to be added that the main aim of collection and composting of bio-waste is not to produce inexpensive material to replace peat but to provide a sustainable waste management system. (Myllymaa et al. 2008a) The total an-nual costs of landfilling depend strongly on the size and the operation time of the landfill. The total annual costs for a landfill with the capacity of 450 000 tonnes of waste and operating time 8-10 years are about 29 euros per tonne (vän-skä 2007 in Myllymaa et al. 2008b)
6.5 Prices of recoverables on the European market
The price of recycled materials is highly depen-dent on the price of raw materials and, there-fore, by the overall economic devepment. The prices of recoverables may vary strongly during the years (Figure 18). The average price for a tonne of recycled steel was already 340 euro/tonne in germany in March 2012. (Teknolo-giateollisuus ry 2012) The price for recycled non-ferrous metals is not known but it usually is several times that of the price of scrap steel (Ympäristöministeriö 2010a).
The price of recycled paper also depends on the type and quality of the paper. If the paper is well sorted, clean and consist of large amounts of bleached chemical pulp, the price is higher than average. The price of the waste paper fluctu-ates strongly depending on the market situation. As the prices may vary strongly very rapidly, it is extremely difficult to calculate the cost-effec-tiveness of recovery infrastructure investments. (laukala 2011) ■
Figure 18. Average prices of recoverables (euro/tonne) in Europe in 2000-2011. (Eurostat 2012; Teknologiateollisuus ry 2012)
34
35
decades ago, waste management was rather cheap for municipalities since the only cost was the maintenance of the “dumping place” (Tom-mila 1984). nowadays it is very well known that uncontrolled waste dumping pollutes the envi-ronment and may cause health problems (Finnish Environment Institute 2011a). As the amounts of virgin raw materials are limited, the recovery of waste as material or energy is essential. due to policy instruments, the infrastructure of waste management and the recovery of wastes in Fin-land have improved substantially in the 1990s. (Melanen et al. 2002).
The recovery of municipal waste, in general, is well-organized in Finland. Most of the nutrients embedded in MSW are in the organic waste fraction and they are in a form that is easy to uti-lize but which is also the most liable to leaching or volatilization. (Sokka et al. 2004) Therefore, policies are increasingly addressing the organic waste component of MSW. There is a need to decrease the amount of bio-waste going to land-fills and, therefore, the biological treatment and energy use of bio-waste will further increase. (Jätelaitosyhdistys 2011 b)
According to the national Waste Plan (Ympä-ristöministeriö 2008), the primary aim is, firstly, to stabilize the amount of waste and further re-duce the amount of the waste by the year 2016. Moreover, 50 % of MSW is to be recovered as material and 30 % as energy and only 20% will be taken to landfills. (Sokka et al. 2007)
Although the MSWM system is considered to be at a good level in Finland, the situation in sparsely populated northern areas is still chal-
lenging. As the waste taxes are getting higher in future, landfilling may become an unfavourable option compared to energy recovery. (lapin ElY 2011) Oulu has a very well-established and well-functioning MSWM infrastructure with high reli-ance on kerbside recovery of recyclables. Oulu is also a hub for the collection of recyclables, some of which are transported over rather long distances for recycling. It is yet to be seen how the situation will change should the combustible fractions be routed for energy recovery.
A general tendency for the whole country is the further reduction of the number of landfills in operation. As well, waste management opera-tors are increasingly interested in moving toward waste incineration. As only large-scale waste incineration plants are feasible, these develop-ments will increase transportation distances. notwithstanding, the tendency is likely to be the further centralization of waste treatment sta-tions, with an increased need for the establish-ment of new transfer stations. It is hoped that, in the case of bio-waste, local utilization possibili-ties will be explored, such as co-digestion with wastewater sludge and biodegradable industrial wastes. ■
7 Conclusion
36
37
Reference list
Akkukierrätys (2008) Tuottajayhteisö Akku-kierrätys Pb Oy. http://www.akkukierrätys.fi/Yritys-%20ja%20yhteystiedot.htm
Elinkeinoelämän keskusliitto (2011) Uusi jätelaki selkeyttää jätteen määritelmän. http://www.ek.fi/ek/fi/ajankohtaista/uusi_jatelaki_selkeyt-taa_jatteen_maaritelman-5823
Elker Oy (2010a) Producer Responsibility. http://www.elker.fi/en/tuottajayhteisot_en/tuottajavastuu_en
Elker Oy (2010b) SElT Association. http://www.elker.fi/en/tuottajayhteisot_en/selt_en
Elker Oy (2010c) IcT Producer co-operative. http://www.elker.fi/en/tuottajayhteisot_en/ict-tuottajaosuuskunta_en
Elker Oy (2010d) FlIP Association. http://www.elker.fi/en/tuottajayhteisot_en/flip_en
Elker Oy (2010e) Recycling. http://www.elker.fi/en/FAQ_en/Recycling
The Environmental Register of Packaging PYR ltd (2011a) concepts used in recovery. http://www.pyr.fi/eng/statistics/concepts.html
The Environmental Register of Packaging PYR ltd (2011) PYR. http://www.pyr.fi/eng/pyr.html
The Environmental Register of Packaging PYR ltd (2011) What is packaging recovery? http://www.pyr.fi/eng/recovery.html
The Environmental Register of Packaging PYR ltd (2011d) Statistics on the recovery of packag-ing. http://www.pyr.fi/eng/statistics/recovery.html
The Environmental Register of Packaging PYR ltd (2011e) carton liquid packaging. http://www.pyr.fi/eng/producer-organisations/carton-liquid-packaging.html
European commission (2003) Preparing a Waste Management Plan. A methodological guidance note. European commission Environ-ment dg. European Topic centre on Waste and Material Flows.
European commission (2011) Waste. http://ec.europa.eu/environment/waste/index.htm
European commission (2012a) directive 2008/98/Ec on waste (Waste Framework directive). http://ec.europa.eu/environment/waste/framework/index.htm
European commission (2012b) Waste Frame-work directive. Revision of the Waste Frame-work directive. http://ec.europa.eu/environ-ment/waste/framework/revision.htm
European Environment Agency (2005) Munici-pal waste generation - May 2006 assessment.http://themes.eea.eu.int/IMS/IMS/ISpecs/ISpecification20041007131809/ IAssess-ment1116426884700/view content>.
The European Recycling Platform (2011) About ERP Finland. http://www.erp-recycling.fi/index.php?content=12
38
Eurostat (2012) Recycling.European commis-sion. Eurostat. http://epp.eurostat.ec.europa.eu/portal/page/portal/waste/data/wasteman-agement/recycling
Finnish Environment Institute (2011a). col-lection and transport of waste within Finland. http://www.ymparisto.fi/default.asp?contentid=216783&lan=En
Finnish Environment Institute (2010b) Wastes and waste management. http://www.ymparis-to.fi/default.asp?node=6044&lan=en
Finnish Environment Institute (2011c) Waste management for businesses. http://www.ym-paristo.fi/default.asp?contentid=176215&lan=en
Finnish Environment Institute (2011d) Producer responsibility in waste manage-ment. http://www.ymparisto.fi/default.asp?contentid=188660&lan=en
Finnish Environment Institute (2011e) Wastes. http://www.ymparisto.fi/default.asp?contentid=37856&lan=en
Finnish Environment Institute (2011f) Munici-pal wastes. http://www.ymparisto.fi/default.asp?node=18451&lan=en
Finnish Environment Institute (2011g) Hazard-ous wastes. http://www.ymparisto.fi/default.asp?contentid=216783&lan=En
Finnish Environment Institute (2012). Waste taxes and charges. http://www.ymparisto.fi/default.asp?contentid=280586&lan=En
HE 199/2010 vp (2010) Hallituksen esitys Eduskunnalle jätelaiksi ja eräiksi siihen liittyvik-si laeiksi. http://www.ymparisto.fi/download.asp?contentid=121743&lan=fi
Hänninen, K. (2009) Jätteiden käsittely ja kierrätys Suomessa. Jyväskylän yliopiston bio- ja ympäristötieteiden laitoksen tiedonantoja 87. University of Jyväskylä. Finland.
Illikainen, M. (2007) Personal communication 29.5.2007. In Myllymaa et al. 2008.
Illikainen, M (2012) Personal communication. 26.4.2012
Isoaho, S. (2008) Tampereen teknillinen yliopis-to. Kirjallinen tiedonanto 3.3.2008. In Myllymaa et al. 2008b
Jätelaitosyhdistys (2011a) Jätteenpolton kehitysvaiheita. http://www.jly.fi/energia11.php?treeviewid=tree3&nodeid=11
Jätelaitosyhdistys (2011b) Suomen yhdys-kuntajätehuolto. http://www.jly.fi/jateh0.php?treeviewid=tree2&nodeid=0
Jätelaitosyhdistys (2011c) Keräys. http://www.jly.fi/jateh1.php?treeviewid=tree2&nodeid=1
Jätelaitosyhdistys (2011d) Kuljetukset.http://www.jly.fi/jateh2.php?treeviewid= tree2&nodeid=2
Jätelaitosyhdistys (2011e) Jätteenkäsittely.http://www.jly.fi/jateh3.php?treeviewid= tree2&nodeid=3
Jätelaitosyhdistys (2011f) Hyödyntäminen.http://www.jly.fi/jateh4.php?treeviewid= tree2&nodeid=4
Kaplas, M (2009) Kotitalouksien, julkisen toiminnan ja yksityisten palvelujen jätemäärien erillisarvio. Henkilökohtainen tiedonanto. In: Ympäristöministeriö (2010a) Jätehuollon talou-dellinen merkitys ja kustannukset. Ympäristömi-nisteriön raportteja 12 | 2010.
Kuluttajavirasto (2010) Jätehuoltopalveluis-sa huomattavia hintaeroja. Tiedote. http://www.kuluttajavirasto.fi/fi-FI/ajankohtaista/tiedotteet/2010/tiedote/10/jatehuoltopalveluis-sa-huomattavia-hintaeroja
Kuntaliitto 2006. Jätehuollon järjestäminen kunnan näkökulmasta. Omistajaohjauksessa huomioon otettavia asioita. Helsinki.
Kuusakoski recycling (2011a) Saving the Envi-ronment. http://www.kuusakoski.com/environ-ment/Environment
39
Kuusakoski recycling (2011b) Metalliromut kier-rätykseen Kuusakoski Oy:n kautta. http://www.kuusakoski.fi/Kuluttajille/Kuluttajille_Metallit
Kuusakoski recycling (2011c) Sähkö- ja elektro-niikkaromut (SER) kierrätykseen. http://www.kuusakoski.fi/Kuluttajille/Kuluttajille_Sahko-_ja_elektroniikkalaitteet
Kuusakoski recycling (2011d) Kuusakoski Oy. http://www.kuusakoski.fi/Yritysinfo/Kuusakos-ki_Oy
Kuusakoski recycling (2011e) Kysymyksiä kierrätyksestä. http://www.kuusakoski.fi/Kierra-tys_ja_Ymparisto/Kysymyksia_kierratyksesta
laine, M. (2007) Kirjallinen tiedoksianto 16.4.2007. Envor group Oy. In Myllymaa et al. 2008b.
lapin ElY (2011) lapin alueellinen jätesuunnitel-ma vuoteen 2020. lapin elinkeino-, liikenne- ja ympäristökeskus. http://www.ely-keskus.fi/fi/ElYkeskukset/lapinElY/Ymparistonsuojelu/do-cuments/lapin_jatesuunnitelma_2011_12_19.pdf
lassila-Tikanoja (2012) Jäteastia ja astiasuojat. http://www.lassila-tikanoja.fi/fi/PalvelutJaTuot-teet/palvelujatuotevalikoima/ymparistotuotteet/jateastiat/Sivut/jateastiat.aspx
laukala, T (2011). Uusiomassan laatuluokat, ominaisuudet ja käyttökohteet. lappeenrannan teknillinen yliopisto. Kemiantekniikan laitos. Kandidaatintyö. http://www.doria.fi/bitstream/handle/10024/67499/nbnfi-fe201103091321.pdf?sequence=3
lettenmeier, M. (1994) Roskapuhetta. Jäteneu-vonnan käsikirja. Ympäristöministeriö. vesi- ja ympäristöhallitus. Helsinki, Finland.
luostarinen, J (2008) Metener Oy. Written com-munication 3.3.2008. In Myllymaa et al. 2008.
Melanen M, Kautto P, Saarikoski H, Ilomäki M, Yli-Kauppila H. (2002) Finnish waste policy—effects and effectiveness. Resoures conserva-tion and Recycling 35:1–15.
Mepak-Kierrätys (2011a) Mepak-Kierrätys Oy in English. http://www.mepak.fi/english.htm
Mepak-Kierrätys (2011b) Mepak-Kierrätys Oy. http://www.mepak.fi/mepak.htm
Molok ltd (2009) basic container. http://www.molok.com/eng/main.php?loc_id=8
Motiva Oy 2007. Interaction toimenpide-selvi-tys - kuorma-autokuljetusten energia-, ympä-ristö- ja kustannustehokkuuden parantaminen. http://www.jly.fi/interaction-toimenpideselvitys. pdf?PHPSESSId=11bfa37f4caf7c9f9b83c6aba2fa956f
Myllymaa, T, Moliis, K., Tohka, A., Isoaho, S., zevenhoven, M., Ollikainen, M., & dahlbo, H. (2008a) Jätteiden kierrätyksen ja polton ympäristövaikutukset ja kustannukset – jä-tehuollon vaihtoehtojen tarkastelu alueel-lisesta näkökulmasta. Suomen ympäristö 39 / 2008 http://www.ymparisto.fi/default.asp?contentid=298884&lan=fi
Myllymaa, T, Moliis, K., Tohka, A., Rantanen, P., Ollikainen, M., & dahlbo, H. (2008b) Jätteiden kierrätyksen ja polton ympäristövaikutukset ja kustannukset – Inventaarioraportti. Suomen ympäristö 28 / 2008. http://www.ymparisto.fi/download.asp?contentid=92262
Mäkelä, K. (2002) Yksikköpäästötietokanta (vTT liisa). http://lipasto.vtt.fi/yksikkopaastot/henkiloliikenne/tieliikenne/henkilo_tie.htm
nieminen, H. & Isoaho, S. (1995) Kotitalousjät-teen keräys ja kuljetus. vesi- ja ympäristöhallin-non julkaisuja –sarja A. vesi- ja ympäristöhalli-tus. Helsinki, Finland.
north Re-Tyre Oy (2010) http://www.northre-tyre.com/
nP-kierrätys (2011a) Kierrätysohjeet. http://www.np-kierratys.fi/kierratysohjeet.php
nP-kierrätys (2011b) Pakkauksen kiertokulku. http://www.np-kierratys.fi/pakkauksen_kierto-kulku.php
40
nummela, E. (2007) Jätelaitosyhdistys ry. Writ-ten communication, 1.11.2007. In Myllymaa et al. 2008b.
Nygård, H. (2000) ‘Kompostoida vai polttaa’ (To compost or to burn) In: laakkonen, S., laurila, S., Kansanen, P. & Schulman, H. (Eds.): näkökulmia Helsingin ympäristöhistoriaan), city of Helsinki Urban Facts, Helsinki, Finland, pp. 90–101.
Oulun kaupunki (2006) Jätehuoltomääräykset. Hailuoto, Kempele, Kiiminki, liminka, lumijoki, Muhos, Oulu, Oulunsalo, Tyrnävä, Ylikiiminki. Annettu jätelain 17 §:n nojalla. Oulun seudun ympäristölautakunta 22.11.2006 § 259 http://www.ouka.fi/documents/64417/b844c5db-7723-4437-b94a-143f639e8b26
Oulun Jätehuolto (2012a). http://www.ouka.fi/jatehuolto/index.asp
Oulun Jätehuolto (2012b). vuosikertomus 2009. (Annual report 2009) Oulu Waste Management (2012). Recycling and reuse. Oulun jätehuolto. http://www.ouka.fi/jatehuolto/PdFT/Esitteet/yleisesite_englan-niksi_netti.pdf
Palpa (2011a) Kierrätysjärjestelmäthttp://www.palpa.fi/kauppa/kauppa-kierra-tysj%c3%A4rjestelm%c3%A4t
Palpa (2011b) Recycling systems. http://www.palpa.fi/retail-trade/recycling-systems
Palpa (2011c) Suomen Palautuspakkaus Oy. http://www.palpa.fi/retail-trade/recycling-systems
Palpa (2011d) Keep the deposit-based beverage containers in circulation – for the good of the environment. http://www.palpa.fi/english
Palpa (2011e). Pullojen kierto. http://www.palpa.fi/juomateollisuus/ekopullojen_kierratys-jarjestelma/pullojen-kierto
Palpa (2011f). Toimintaperiaate. http://www.palpa.fi/juomateollisuus/jt-kmp-kierra-
tysj%c3%A4rjestelm%c3%A4/toimintaperi-aate
Paperinkeräys Oy (2011a) Historia. http://www.paperinkerays.fi/yritys/tietoa/historia
Paperinkeräys Oy (2011b) nationwide envi-ronmental service provider, recovered paper wholesaler and producers association. http://www.paperinkerays.fi/home
Puupakkausten Kierrätys (2011) http://www.puupakkauskierratys.fi/
Ramboll (2008) Järjestetyn jätteenkuljetuksen vaihtoehtojen vertailu. Oulun Jätehuolto, Oulun seudun jätteenkuljetusyrittäjät. http://www.jly.fi/oulun_jatehuolto_loppuraportti.pdf
Recser Oy (2008) Recser Oy - Producer or-ganisation for portable batteries and accumula-tors. http://www.recser.fi/en/?Home_page
Rengaskierrätys Oy (2011) http://www.rengas-kierratys.com/en/index.php/etusivu/
Romukeskus Oy (2011a) http://www.romukes-kus.fi/yritys/
Romukeskus Oy (2011b) Historia.http://www.romukeskus.fi/yritys/index.php?group=00000075&mag_nr=3
Romukeskus Oy (2011c) Romukeskus briefly in English. http://www.romukeskus.fi/english/
SERTY (2011a) SER-tuottajayhteisö ry. http://www.serty.fi/
SERTY (2011b). Toiminta ja jäsenet. http://www.serty.fi/fi/toiminta-ja-jaesenet
Sokka, l., Antikainen, R. & Kauppi, P. (2004) Flows of nitrogen and phosphorus in municipal waste: a substance flow analysis in Finland. Progress in Industrial Ecology, 1(1-3): 165-186.
Sokka, l., Antikainen, R. & Kauppi, P. (2007) Municipal solid waste production and composi-tion in Finland—changes in the period 1960–2002 and prospects until 2020. Resources,
41
conservation and Recycling 50: 475–488
Suomen keräyslasiyhdistys (2011a) lasinkierrä-tyksen historiaa Suomessa. http://www.kerays-lasiyhdistys.fi/default.aspx?intObjectId=62
Suomen keräyslasiyhdistys (2011b) Keräys ja hyötykäyttö 1990-2001. http://www.kerayslasi-yhdistys.fi/files/sky_tilastoja.pdf
Suomen keräyslasiyhdistys (2011c) Yhdistyksen esittely. http://www.kerayslasiyhdistys.fi/default.aspx?intObjectId=44
Suomen keräyslasiyhdistys (2011d) Miten kierrättää lasia. http://www.kerayslasiyhdistys.fi/default.aspx?intObjectId=98
Suomen keräyslasiyhdistys (2011e) Pantilliset järjestelmät. http://www.kerayslasiyhdistys.fi/default.aspx?intObjectId=70
Suomen keräyslasiyhdistys (2011f) FAQ. http://www.kerayslasiyhdistys.fi/default.aspx?intObjectId=63
Suomen keräyslasiyhdistys (2011g) Mitä lasille tapahtuu? http://www.kerayslasiyhdistys.fi/default.aspx?intObjectId=99
Suomen keräyslasiyhdistys (2011h) Toiminnan esittely. http://www.kerayslasiyhdistys.fi/default.aspx?intObjectId=67
Suomen aaltopahviyhdistys (2011a) Ympäristö ja kierrätys. http://www.aaltopahvi.fi/index.php?documentid=4
Suomen aaltopahviyhdistys (2011b) Maailman yleisin pakkausmateriaali. http://www.aaltopah-vi.fi/index.php?documentid=3 Suomen aaltopahviyhdistys (2011c) Suomen Aaltopahviyhdistys ry – SAPY. http://www.aaltopahvi.fi/index.php?documentid=2
Suomen aaltopahviyhdistys (2011d) Tuotta-javastuu. http://www.aaltopahvi.fi/index.php?documentid=16&sub=4
Suomen autokierrätys (2011a) http://www.
autokierratys.fi/en/index.php?go=48;48;0;;49Suomen autokierrätys (2011b) http://www.autokierratys.fi/en/index.php?go=49;49;0;;48
Suomen keräystuote Oy (2011) Suomen Kerä-ystuote Oy on keräyspaperin tuottajayhteisö. http://www.suomenkeraystuote.fi/fi/tuottaja-vastuu/tuottajayhteiso/
Suomen kuitukierrätys Oy (2011) Kuitupak-kaukset. http://www.kuitukierratys.fi/index.php?documentid=3
Suomen kuitukierrätys Oy (2012) Pakkausten uuden jätelain mukaista vastaanottoa pilotoi-daan Tampereella ja Kuopiossa. http://www.kuitukierratys.fi/index.php?documentid=4 Suomen kuluttajakuitu ry (2011a) Pakkauksen kiertokulku. http://www.kuluttajakuitu.fi/index.php?documentid=2
Suomen kuluttajakuitu ry (2011b) Kysymyksiä ja vastauksia. http://www.kuluttajakuitu.fi/index.php?documentid=7
Suomen Teollisuuskuitu (2011) Suomen Teolli-suuskuitu Oy - In English. http://www.teollisuus-kuitu.fi/indexeng.htm
Suomen uusiomuovi (2009a) Mistä tämä kaikki on saanut alkunsa? http://www.suomenuusio-muovi.fi/fin/tietoa_muoveista/muovin_historiaa/
Suomen uusiomuovi (2009b) Usein kysyttyä muoveista ja muovin kierrätyksestä. http://www.suomenuusiomuovi.fi/fin/tietoa_muoveis-ta/usein_kysyttya/
Suomen uusiomuovi (2009c) Uusinta uusiota-esite.
Suomen uusiomuovi (2009d) Muovipakkausten kierrätys. http://www.suomenuusiomuovi.fi/fin/tietoa_muoveista/usein_kysyttya/
Suomen virallinen tilasto (2010a) Jätetilasto. liitetaulukko 1. Yhdyskuntajätteet vuonna 2009 tonnia. Helsinki: Tilastokeskus. http://www.stat.fi/til/jate/2009/jate_2009_2010-11-23_tau_001_fi.html
42
Suomen virallinen tilasto (2010b) Jätetilasto 2009. Yhdyskuntajätteen määrä laski. http://www.stat.fi/til/jate/2009/jate_2009_2010-11-23_fi.pdf
Suomen virallinen tilasto (2011a) Jätetilasto. liitetaulukko 2. Jätteiden kertymät sektoreit-tain ja jätelajeittain vuonna 2009, 1 000 tonnia vuodessa. Helsinki: Tilastokeskus http://www.stat.fi/til/jate/2009/jate_2009_2011-05-20_tau_002_fi.html
Suomen virallinen tilasto (2011b) Jätetilasto 2009. Kaivokset mineraalijätteen suurtuot-tajia. http://www.stat.fi/til/jate/2009/jate_2009_2011-05-20_fi.pdf
Suomen virallinen tilasto (2011c) Jätetilas-to. Kaivokset mineraalijätteen suurtuotta-jia. 2009. http://www.stat.fi/til/jate/2009/jate_2009_2011-05-20_tie_001_fi.html
Suomen virallinen tilasto (2011d) Jätetilasto 2010. Yhä suurempi osa yhdyskuntajätteestä polttoon. 2009. http://www.stat.fi/til/jate/2010/jate_2010_2011-11-18_fi.pdf
Suomen virallinen tilasto (2012) Jätetilasto. biohajoava jäteaines hyödynnetään valta-osaltaan. http://www.stat.fi/til/jate/2010/jate_2010_2012-05-16_tie_001_fi.html
Suomen ympäristökeskus (2012) Jätteiden synty toimialoittain. http://www.ymparisto.fi/default.asp?contentid=171384&lan=fi
Teknologiateollisuus ry (2012) Standardi-teräs-tuotteiden sekä värimetallien hintoja. Talouden arviointi.
Tommila P (ed.) (1984) Suomen kaupunkilaitok-sen historia 3. Itsenäisyyden aika. Helsinki, Finland: Suomen Kaupunkiliitto
Turpeinen, O. (1995) Kunnalllistekniikkaa Suomessa keskiajalta 1990-luvulle. Suomen kuntatekniikan yhdistys, Helsinki, Finland.
Turunen, T, Sallmén, M, Meski, S, Ritvanen, U. & Partanen, E. (2008) Oulun läänin alueellinen jätesuunnitelma. Jätehuollon kehittämisohjel-
ma vuosille 2008 – 2018. Suomen ympäristö 6/2008. http://www.ymparisto.fi/download.asp?contentid=83715
Uusioaines Oy (2011a) History. http://en.uusioainesoy.kotisivukone.com/10
Uusioaines Oy (2011b) company operations. http://en.uusioainesoy.kotisivukone.com/12
vänskä, v. (2007) Kirjalliset tiedoksiannot 10.1. ja 18.9.2007. Joensuun Seudun Jätehuolto Oy. InMyllymaa et al. 2008
Walsh dc. (2002) Urban residential refuse composition and generation rates for 20th century. Environmental Science and Technology 36:4936–42.
Ympäristöministeriö (2008) Kohti kierrätys-yhteiskuntaa. valtakunnallinen jätesuunni-telma vuoteen 2016. Suomen ympäristö 32. http://www.ymparisto.fi/download.asp?contentid=91466&lan=fi
Ympäristöministeriö (2010a) Jätehuol-lon taloudellinen merkitys ja kustannuk-set. Ympäristöministeriön raportteja 12 | 2010. http://www.ymparisto.fi/download.asp?contentid=117613&lan=fi
Ympäristöministeriö (2010b). Uuden jätelain-säädännön mukaisten keräysverkostovaatimus-ten kustannusvaikutukset pakkausten jäte-huollossa. Raportti 1907-P11168. Fcg Finnish consulting group Oy. http://www.ymparisto.fi/download.asp?contentid=121811&lan=fi
zacarias-Farah A, geyer-Allély E. (2003) Household consumption patterns in OEcd countries: trends and figures. Journal of cleaner Production 11:819–27. ■
43
Appendices
APPENDIX 1: WASTE LEGISLATION IN FINLAND
general waste legislation• Waste Act (646/2011)• Waste Decree (17972012)
End-of-waste• Council Regulation (EU) No 333/2011 establishing criteria determining when certain types of scrap metal cease to be waste under directive 2008/98/Ec of the European Parliament and of the council (333/2011)
Waste treatment and recovery• Government Decree on waste incineration (362/2003)• Government Decision on landfill sites (861/1997)
legislation on specific waste types, products and activities• Government Decree on end-of-life vehicles (581/2004)• Government Decree on subsidies for the processing of end-of-life vehicles (582/2004)• Government Decree controlling the use of certain hazardous substances in vehicles (572/2003)• Government Decree on Waste Electrical and Electronic Equipment (852/2004)• Government Decree controlling the use of certain hazardous substances in electrical and electronic equipment (853/2004)• Government Decision on restricting the use of PCBs and PCTs (1071/1989)• Government Decision on the prohibition of PCBs and equipment containing PCBs, and the processing of wastes containing Pcbs (711/1998)• Government Decision on ozone-depleting substances (262/1998)• Council of State Decision on batteries and accumulators containing certain dangerous substances (105/1995)• Government Decision on amalgam-containing wastewater and waste resulting from dental care (112/1997)• Government Decision on the management of oily wastes (101/1997)• Government Decision on the use of sewage sludge in agriculture (282/1994) • Government Decision on the recovery and disposal of discarded tyres (1246/1995)• Government Decision on construction waste (295/1997)• Government Decision on the collection and recovery of waste paper (883/1998)• Government Decision on packaging and packaging waste (962/1997)
44
• Ministry of the Environment Decision on derogations from limitations of heavy metal concentration levels in packaging (273/2000). In force 1.4.2000-10.2.2009.
Waste shipments• Regulation (EC) No 1013/2006 of the European Parliament and of the Council on shipments of waste (EUR-lex)• Government Decision on the part of the National Waste Plan concerning transfrontier waste shipments (495/1998)
Other legislation• Waste Oil Charge Act (894/1986)
45
APPENDIX 2 : PRODUCER RESPONSIBILITY ORGANIZATIONS IN FINLAND
The Environmental Register of Packaging (Pakkausalan Ympäristörekisteri PYR Oy)The Environmental Register of Packaging PYR ltd is a non-profit organization which co-operates with producer organizations in the packaging sector. It helps companies and the authorities to fulfil packag-ing recovery obligations. Firms that place packed products on the market and have a sales volume of one million euro or more have a packaging recovery obligation/producer responsibility in Finland. If a firm has a contract with PYR, it transfers the recovery obligation to the producer organizations. (The environmental register of packaging 2011b).
Producer responsibility organization for glass packagingSuomen Keräyslasiyhdistys was established in 1998. It is a producers organization which promotes recycling and re-use of glass, and aims at reducing production of waste glass. The organization makes statements and tries to find out new ways to recycle glass and gives municipalities reward for collected packaging glass. The members of the organization are trade and importers, industry and companies using glass packaging (Suomen keräyslasiyhdistys 2011c).
glass is collected using two different collection routes. Most of the glass is collected by using refund system which is organized by industry and trade and producer organization is the decision-mak-ing body. Smaller part of glass is collected in municipal collection points. (Suomen keräyslasiyhdistys 2011h) Refundable glass packages can be returned to stores. grocery shops are receiving beverage packaging they have sold and Alko accepts bottles of alcoholic beverages and soft drinks they have sold. non-refundable packages can be returned to the nearest collection point. Refunded glass should be reasonably clean and sorted according to colour, if possible. (Suomen keräyslasiyhdistys 2011d). The number of collection points for refundable packages was estimated to be 8000 in 2002 (Suomen keräyslasiyhdistys 2011e).
All clean waste glass can be returned to collection points: glass packaging (bottles and jars) and glass-ware. Glass material can be recycled basically forever since its quality won’t suffer from reprocessing. Refillable bottles can be filled dozens of times (depending on the type of a bottle) until it is put out of circulation. After that, the glass can be used as a material for manufacturing new packages or glass wool. (Suomen keräyslasiyhdistys 2011f)
Refillable bottles are taken to breweries and alcoholic beverage plants for sorting, washing and refilling. Other glassware and disposable bottles with a deposit will be crashed and sorted according to their colour, after which they are used for the manufacturing of packing glass and glass wool. Part of glass from municipal collection points are crashed and sorted but some of them are landfilled. (Suomen keräyslasiyhdistys 2011g). The major suppliers of the packaging glass are Alko, beverage wholesalers and waste management companies. The deliverers of float glass (e.g. windows and windscreens) are glass sellers, cutters, downstream operators and construction companies. (Uusioaines Oy 2011b)
The law in Finland permits to use recycled cullet for producing new packing glass and glass wool. Recycled cullet has been used for the manufacturing of the glass wool since 1983. The proportion of waste glass in glass wool product is about 60-80% and the share of waste glass in new packing glass is about 20%. Recycled cullet can be used for other purposes as well, e.g. for the manufacturing of glass blocks and glass-concrete; in swimming pool filters; for land reclamation, sandblasting and road bed. In Finland, the use of cullet in the road bed could be a good option, since cullet has good frost resistance. In addition, there is a need to find new ways to utilize cullet because of the demand for a higher utilization rate further to the Packaging directive. (Suomen keräyslasiyhdistys 2011g)
46
Producer responsibility organization for f ibre packagingFormer producer organizations for fibre packaging, Suomen Kuluttajakuitu ry (consumer fibres), Suomen nP-kierrätys Oy (carton liquid packaging) and Suomen Aaltopahviyhdistys ry (corrugated board), have since closed down their operations. Together, they have established Suomen Kuitukier-rätys Oy and will go on with their activities in packaging recovery. (The Environmental Register of Packaging 2011e) Suomen Kuitukierrätys Oy is the producer organization for fibre packages such as paper, cardboard and corrugated cardboard packages. (Suomen kuitukierrätys Oy 2011)
Fibre packages are environmentally friendly, since they can be re-used again. Usually, these packages are used for customer products such as cardboard boxes, paper bags, egg cartons and disposable containers. Recyclable packages for liquid foodstuff such as milk and juice cartons coated belong to this group as well. corrugated cardboard is the most common material in transport packaging such as boxes and wrappings. Fibre packages are collected from properties and there are 1800-1900 col-lection points in densely populated areas. Shops and industry also produce corrugated cardboard and industrial fibres. Fibre packages are used as material for corrugated cardboard and cardboard but there is still a need to develop applications that can replace the use of virgin wood or pulp. (Suomen kuitukierrätys Oy 2011)
All the carton liquid packagings are recyclable, even those with aluminium coating and plastic parts (e.g. cap). Packages need to be washed and flattened and taken to the collection point. (nP-kierrätys 2011a) Empty carton liquid packagings are sorted, baled and transported to the cardboard factory. Fi-bre is then separated from plastic and used as material for coreboard. (nP-kierrätys 2011b) Separated plastic is burned as energy and aluminium is recycled. (Suomen kuluttajakuitu ry 2011a). There is no need for deinking of used packages. Recycled cardboard is used in the factory of corenso United ltd in Pori and Fiskeby cardboard factory in Sweden. (Suomen kuluttajakuitu ry 2011b).
Producer responsibility organization for beverage containersSuomen Palautuspakkaus Oy (PAlPA) is owned by the retail trade and the breweries and it administers and develops deposit-based systems for beverage containers in Finland. The return percentage goal level is 90 %. The recycling system for beverage containers is very comprehensive in Finland, since almost all soft drink, water, beer, cider, long drink and sport drink bottles and cans have a deposit. Since 2008, recyclable plastic bottles (spring water, mead, iced tea and wine) also have a deposit. (Palpa 2011c)
PAlPA administers the recycling of beverage containers. A very large proportion of beverage contain-ers is recycled or re-used because of the deposits paid on returned containers. (Palpa 2011d) The return percentage of used bottles is very high, since 97% of the bottles are recycled. glass bottles are used 33 times on average. cast-off glass bottles are used for new glass ware or glass wool and the labels are recovered as energy. (Palpa 2011e)
nowadays, the return rate of beverage cans is about 90 %, which is top class worldwide. Returned aluminium cans are melted and used as material for new beverage. (Palpa 2011b) Recyclable plastic bottles from the shops are transported to the recycling center, after which they are baled, crushed, washed, granulated for utilization as raw material e.g. for new bottles. (Palpa 2011f)
Producer responsibility organization for plasticsSuomen Uusiomuovi Oy (The Finnish Plastics Recycling ltd) is a producer organization for plastics. It was founded in order to improve the recycling of used plastic products in Finland. Most of the plastics are pro-duced from the by-products of oil refining. Recycling of used plastics has been executed almost from the beginning of plastics use but it has become business only with more common use of plastics and because of the more efficient use of raw materials. Recyclable plastic needs to be well sorted and clean. There are several ways for the utilization of used plastic products: they can be used again as a product (cages, boxes)
47
or as material (refuse sack, plastic pipe) as there are several plants in Finland that are recycling plastic. In addition, plastic can be used as energy in appropriate power plants. (Suomen uusiomuovi 2009c)
Most of the plastic packages recycled by Suomen Uusiomuovi Oy are PE-ld, PE-lld, PE-Hd films and PE-Hd canisters, bottles and boxes. Recycled raw material can be used for the manufacturing of plastic tubes and films and die-casting products whereas PET bottles are used as material in textile industry. new products, such as plastic sheets and straps from recycled plastics need to be generated and the combining of plastic and fibre need to be studied. (Suomen uusiomuovi 2009d).
Producer responsibility organization for wooden packagingThe producer organization for wooden packaging is Puupakkausten Kierrätys PPK Oy. The most important product of wooden packages is the loading pallet but frame works, boxes, casks and cable reels also belong this group. The recycled wooden material can be used as material in chipboard in-dustry or for new wooden packages. (Puupakkausten Kierrätys (2011)
Producer responsibility organization for metalsThe producer organization for metal packaging, Mepak-Kierrätys Oy, (Mepak-Recycling ltd) was founded in 1997 and registered with the authorities in 1998. The partners of the organization are twelve metal packaging manufacturers, the packing industry and retail-wholesale trade organizations in Finland. Metal packaging includes food cans, paint pails, drums, crown caps, closures, aluminium trays, aerosols, steel bands and straps. Suomen Palautuspakkaus Oy represents deposit based bever-age cans. Mepak-Kierrätys Oy has a contract with Kuusakoski Oy, Stena Recycling Oy and Eurajoen Romu Oy in order to ensure the use of the tinplate scrap and the registered supplier gets a refund for tinplate and aluminium packages. Mepak has also made a contract with the largest Finnish waste com-pany lassila & Tikanoja Oyj to improve metal collection. Every metal product has over 25 % recycled content, and saving in energy is 75 - 95 % when using recycled steel instead of virgin raw material. (Mepak-Kierrätys 2011a) There are about 10 000 collection points for the collection of household metal. Usually, the collected material has been clean enough for recycling, since the small amount of tin is no problem. (Mepak-Kierrätys 2011b)
Producer responsibility organization for f ibre-based industrial packagingSuomen Teollisuuskuitu Oy is the producer organization which is responsible for the recovery of fibre-based industrial packaging in Finland. It was established in 1998. Among other packaging, it cov-ers wrappings and end labels for the paper industry, fibre-based wrapping used e.g. for the timber, ply-wood and steel industries, paper sacks and cardboard cores for rolls. (Suomen Teollisuuskuitu 2011).
Producer responsibility organizations for paperPaperinkeräys Oy is a wholesaler and a producer organization. companies in the Paperinkeräys group buy recycled paper, paperboard and cardboard for raw material in the forest products indus-try. collection of paper is carried out through local collection points, from residential, commercial and industrial premises, through paper recovery and waste management firms, from printing companies and from other commercial and industrial sources. (Paperinkeräys Oy 2011b) At the moment, empty-ing collection containers of housing companies is provided by independent collection company. For other residents, there are 6700 collection points for paper and carton in Finland, which are emptied by Paperinkeräys Oy. collection points are open 24 hours per day and they are free of charge for citizens. (Paperinkeräys Oy 2011b)
Suomen Keräystuote has been the producer organization for paper since 2005. It was established in 1987 by private paper collection companies and now it is the subsidiary company of lassila & Tikanoja. The collected paper is mainly used as raw material for newspaper and sanitary tissue by domestic paper industry. (Suomen keräystuote Oy 2011)
48
Producer responsibility organizations for Waste Electronic and Electrical Equipment (WEEE)The SER-tuottajayhteisö ry (SERTY), the association of electric and electronic equipment manu-facturers and importers takes care of the collection and recycling of waste electric and electronic equipment (WEEE) on behalf of its members in Finland. (SERTY 2011a) SERTY was founded in 2000, because of the changes in the hazardous waste legislation (SERTY 2011b)
Elker Oy is a service company established by the producer organisations SElT Association, IcT Pro-ducer co-operative, and FlIP Association. The above producer organisations have transferred obliga-tions to Elker Oy. (Elker Oy 2010a) SElT Association recycles electrical and electronic equipments (Elker Oy 2010b), IcT Producer co-operative recycles IT and telecommunications technology equip-ments (Elker Oy 2010c) and FlIP Association recycling lamps falling within the scope of the WEEE directive (Elker Oy 2010d) discarded household electrical and electronic equipment are returned to consumer product collection points without fee. (Elker Oy 2010e)
The European Recycling Platform (ERP) Finland is a producer responsibility organization both for WEEE and portable batteries. ERP Finland was established in 2005, originally under the company name nERA (nordic Electronics Recycling Association), but has been working under the ERP brand since 2009. In 2008, ERP Finland expanded to cover also the producer responsibility on portable bat-teries. (The European Recycling Platform 2011).
Kuusakoski service points are receiving electronic and electric devices from household as well, for the utili-zation of metal, plastic and glass. Moreover, many electronic and electric devices include hazardous materi-als and, therefore, it is especially important to organize a safe WEEE recycling. (Kuusakoski recycling 2011c)
Producer responsibility organization for end-of- life vehiclesSuomen autokierrätys (Finnish car Recycling ltd) is the producer organization co-ordinating the col-lection, treatment and recycling of scrap cars. The Association of Automobile Importers in Finland owns Finnish car Recycling ltd. (Suomen autokierrätys 2011a).
In the recycling system, the vehicle documents and registration and identification data are verified because only the owner can scrap the vehicle. The deliverer of the car gets a certificate of destruction and the vehicle is deregistered. As a pre-treatment in the recycling system, the vehicle is emptied of all liquids. Tires, the battery and catalysator are removed and components with a danger of explo-sion such as airbags are removed or deactivated. After that, the vehicles are crushed and sorted into three different categories: magnetic steel (raw-material for the steel industry), non-ferrous residue of various metals (processed further into the raw-materials of the metal industry) and light components (recovered as energy or landfilled) (Suomen autokierrätys 2011b).
Producer responsibility organization for batteries and accumulatorsRecser Oy is producer organization for portable batteries and accumulators. Retail outlets that are selling batteries and accumulators receive used portable batteries and accumulators from consumers. (Recser 2008).
Akkukierrätys Pb Oy is a producer organization for lead acid batteries used in cars. The organization was established by importers Exide Technologies Oy, EnerSys Europe Oy, Koivunen Oy and Akro-Power Oy and over 80 importers of lead acid batteries have also joined Akkukierrätys Pb Oy. collec-tion of lead acid batteries has been organized in cooperation with Kuusakoski Oy, lassila & Tikanoja Oyj and Stena Recycling Oy and it has been successful. There are over 600 collections points all over Finland. Materials of batteries are recovered in foundry and they are used again when manufacturing new batteries. (Akkukierrätys 2008)
49
Producer responsibility organization for used tiresSuomen Rengaskierrätys (Finnish Tyre Recycling ltd) is responsible for the recycling of used vehicle tires in Finland. The company started tire recycling in 1996 and is owned by major Finnish tire manu-facturers and importers. (Rengaskierrätys Oy 2011) Pohjoinen rengaskierrätys (north Re-Tyre Oy) is another producer organization for used tires (north Re-Tyre Oy 2010).
Kuusakoski and Suomen Rengaskierrätys take care of the recycling of the used tires in Finland. An-nually, about 40 000 tonnes of tires are recycled in Finland, and the utilization percentage is about 95%. In comparison, the average utilization percentage in Europe is ca 60%. The targets of utilization of crushed tires are elastic groundwork for e.g. riding and sports fields. All the service points of Kuu-sakoski and tire selling companies receive the tires with and without the band for free, after which they are recycled. (Kuusakoski recycling 2011d) The collection rate of tires was 90% already in 1999. (Melanen et al. 1999)

50
APPENDIX 3: AmOUNTS OF WASTES UNDER PRODUCER RESPONSIBILITY
Amounts of wastes under producer responsibility collected in 2006. (Ympäristöministeriö 2010a)
Waste sector Producer organization Collected waste (tonnes/a)
WEEE producer organization 38 940 Flip Ry 946 IcT-tuottajaosuuskunta-TY 5 336 Pohjoismaiden Elektroniikkakierrätysyhdistys Ry nERA 11 823 SElT Ry 546 Ser-Tuottajayhteisö ry 20 289vehicle producer organization 14 183 Suomen autokierrätys Oy 14 183 Suomen matkailuautokierrätys 0Tire producer organization 45 535 Suomen rengaskierrrätys Oy 44 698 north Re-Tyre Oy 837Paper producer organization 355 931 Paperinkeräys Oy 301 376 Suomen Keräystuote Oy 54 555Packagings* Suomen Aaltopahviyhdistys Ry, Suomen Teollisuuskuitu Oy, Suomen kuluttajakuitu Ry, Suomen nP-Kierrätys Oy 225 000 Suomen Uusiomuovi Oy 15 400 Suomen Keräyslasiyhdistys Ry 49 600 Mepak-Kierrätys Oy and Suomen Palautuspakkaus Oy 26 400 Puupakkausten Kierrätys PPK Oy 15 800
*Amounts of packaging waste include also other packaging waste than collected by using producer responsibility organization system
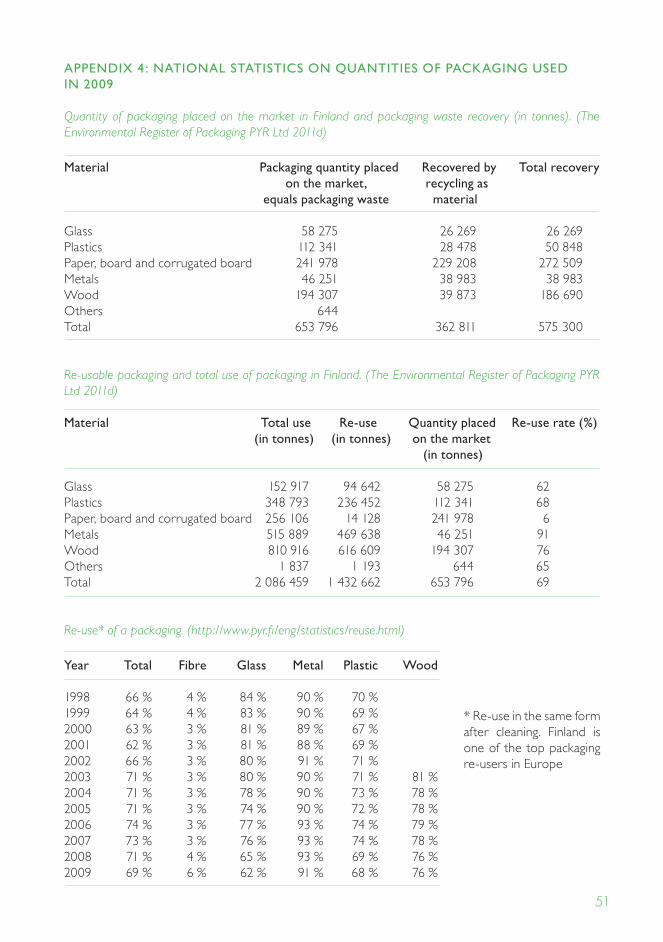
51
APPENDIX 4 : NATIONAL STATISTICS ON QUANTITIES OF PACKAGING USED IN 2009
Quantity of packaging placed on the market in Finland and packaging waste recovery (in tonnes). (The Environmental Register of Packaging PYR Ltd 2011d)
material Packaging quantity placed Recovered by Total recovery on the market, recycling as equals packaging waste material
glass 58 275 26 269 26 269Plastics 112 341 28 478 50 848Paper, board and corrugated board 241 978 229 208 272 509Metals 46 251 38 983 38 983Wood 194 307 39 873 186 690Others 644 Total 653 796 362 811 575 300
Re-usable packaging and total use of packaging in Finland. (The Environmental Register of Packaging PYR Ltd 2011d) material Total use Re-use Quantity placed Re-use rate (%) (in tonnes) (in tonnes) on the market (in tonnes)
glass 152 917 94 642 58 275 62Plastics 348 793 236 452 112 341 68Paper, board and corrugated board 256 106 14 128 241 978 6Metals 515 889 469 638 46 251 91Wood 810 916 616 609 194 307 76Others 1 837 1 193 644 65Total 2 086 459 1 432 662 653 796 69
Re-use* of a packaging. (http://www.pyr.fi/eng/statistics/reuse.html)
Year Total Fibre Glass metal Plastic Wood
1998 66 % 4 % 84 % 90 % 70 % 1999 64 % 4 % 83 % 90 % 69 % 2000 63 % 3 % 81 % 89 % 67 % 2001 62 % 3 % 81 % 88 % 69 % 2002 66 % 3 % 80 % 91 % 71 % 2003 71 % 3 % 80 % 90 % 71 % 81 % 2004 71 % 3 % 78 % 90 % 73 % 78 % 2005 71 % 3 % 74 % 90 % 72 % 78 % 2006 74 % 3 % 77 % 93 % 74 % 79 % 2007 73 % 3 % 76 % 93 % 74 % 78 % 2008 71 % 4 % 65 % 93 % 69 % 76 % 2009 69 % 6 % 62 % 91 % 68 % 76 %
* Re-use in the same form after cleaning. Finland is one of the top packaging re-users in Europe
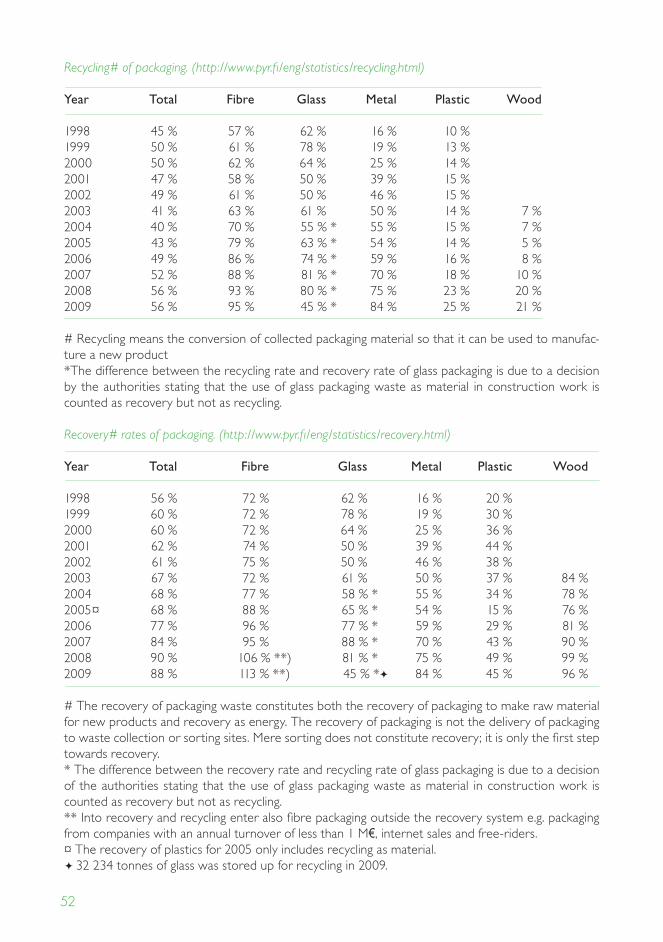
52
Recycling# of packaging. (http://www.pyr.fi/eng/statistics/recycling.html)
Year Total Fibre Glass metal Plastic Wood
1998 45 % 57 % 62 % 16 % 10 % 1999 50 % 61 % 78 % 19 % 13 % 2000 50 % 62 % 64 % 25 % 14 % 2001 47 % 58 % 50 % 39 % 15 % 2002 49 % 61 % 50 % 46 % 15 % 2003 41 % 63 % 61 % 50 % 14 % 7 % 2004 40 % 70 % 55 % * 55 % 15 % 7 % 2005 43 % 79 % 63 % * 54 % 14 % 5 % 2006 49 % 86 % 74 % * 59 % 16 % 8 % 2007 52 % 88 % 81 % * 70 % 18 % 10 % 2008 56 % 93 % 80 % * 75 % 23 % 20 % 2009 56 % 95 % 45 % * 84 % 25 % 21 %
# Recycling means the conversion of collected packaging material so that it can be used to manufac-ture a new product*The difference between the recycling rate and recovery rate of glass packaging is due to a decision by the authorities stating that the use of glass packaging waste as material in construction work is counted as recovery but not as recycling.
Recovery# rates of packaging. (http://www.pyr.fi/eng/statistics/recovery.html)
Year Total Fibre Glass metal Plastic Wood
1998 56 % 72 % 62 % 16 % 20 % 1999 60 % 72 % 78 % 19 % 30 % 2000 60 % 72 % 64 % 25 % 36 % 2001 62 % 74 % 50 % 39 % 44 % 2002 61 % 75 % 50 % 46 % 38 % 2003 67 % 72 % 61 % 50 % 37 % 84 % 2004 68 % 77 % 58 % * 55 % 34 % 78 % 2005¤ 68 % 88 % 65 % * 54 % 15 % 76 % 2006 77 % 96 % 77 % * 59 % 29 % 81 % 2007 84 % 95 % 88 % * 70 % 43 % 90 % 2008 90 % 106 % **) 81 % * 75 % 49 % 99 % 2009 88 % 113 % **) 45 % * 84 % 45 % 96 %
# The recovery of packaging waste constitutes both the recovery of packaging to make raw material for new products and recovery as energy. The recovery of packaging is not the delivery of packaging to waste collection or sorting sites. Mere sorting does not constitute recovery; it is only the first step towards recovery.* The difference between the recovery rate and recycling rate of glass packaging is due to a decision of the authorities stating that the use of glass packaging waste as material in construction work is counted as recovery but not as recycling.** Into recovery and recycling enter also fibre packaging outside the recovery system e.g. packaging from companies with an annual turnover of less than 1 M€, internet sales and free-riders.¤ The recovery of plastics for 2005 only includes recycling as material. 32 234 tonnes of glass was stored up for recycling in 2009.

Greensettle project is co-funded by the European Union, the Russian Federation and the Republic of Finland
CONTACT PERSONS
Project leader: Eva Pongrácz, Docent, Dr.Tech., [email protected] manager: Niko Hänninen, Phil.Lic., [email protected]
Centre of Northern Environmental TechnologyThule Institute, P.O. Box 7300, FI-90014 University of Oulu, FinlandTel. +358 29 448 7417, Fax. +358 8 553 3564
http://nortech.oulu.fi
http://www.facebook.com/NorTechOulu
@
Municipal Solid WasteManagement in Finland
AUTHOR: SARI PIIPPO
GREENSETTLE PUBLICATIONS
ISBN 978-952-62-0071-2