municipal bond market...
TRANSCRIPT

MUNICIPAL BOND MARKET INNOVATIONTRENDING TOPICS IN PORTFOLIO MANAGEMENT, TRADING & RISK
Webinar: May 2019
1

Agenda
May 22 & 23, 2019 Market Implied Benchmark Yield Curves and Volatility 2
Automated Trading in the Municipal MarketMartin Mannion, PresidentHeadlands Tech Global Markets
Evolution of Municipal Bond Market TechnologyDavid Stryker, Principal, MarketsGreenwich Associates
Market Implied Benchmark Yield Curves & Volatility Leslie Abreo, Director of Product DevelopmentKalotay Analytics
Integrating Tax-Aware Analytics and Bond DataJeff Walker, PresidentThomas Kokoska, Chief Technical and Financial Engineering OfficerAccendo Strategies
Thanks to our data providers:

3May, 2019
Headlands Tech Global Markets:Automated Trading in the Municipal Market

4
Tradable Issues by Asset ClassOver a million municipal issues are eligible to trade
0
100,000
200,000
300,000
400,000
500,000
600,000
700,000
800,000
900,000
1,000,000
Listed Equities Corporate Bonds Municipal Bonds

5
Daily Trades by Asset ClassBut relatively few trades are spread out over all of those issues
0
5,000,000
10,000,000
15,000,000
20,000,000
25,000,000
30,000,000
35,000,000
Listed Equities Corporate Bonds Municipal Bonds

6
The Price Discovery ContinuumLots of issues which seldom trade make it a dealer market
Futures Options Equities Fixed Income

7
6,000
7,000
8,000
9,000
10,000
2016 2017 2018
Unique Market AuctionsElectronic auctions increased over 30% since end of 2016
*Unique auctions received by HTGM; eliminates duplicate auctions of the same bonds on different platforms
Evolution of Muni Market TechnologyAn analysis of trends we’re tracking in the industry
May 2019

Retail Investors Hold Nearly Half of all Munis
Greenwich Associates 9
Unlike most other fixed income asset classes, munis has a large retail investor base, which creates an interesting dynamic, though their overall position in the market has shrunk from its peak in 2010.
Source: SIFMA
42%
25%
14%15%4%
Individuals Mutual Funds Banking Institutions Insurance Other

Institutional Interest in the Asset Class Remains Robust
Greenwich Associates 10
Half of all institutional investors that Greenwich Associates speaks with anticipate being more active in munis… hedge funds are a key driver
Source: Greenwich Associates
-20%
-21%
-16%
-16%
80%
43%
63%
44%
50%
-40% -30% -20% -10% 0% 10% 20% 30% 40% 50% 60% 70% 80%
Percentage of Clients Expecting to Increase or Decrease their Trading Volume*
Decrease Increase
Total Institutions
Funds/Advisors
Hedge Funds
Insurance Companies
Banks
The Market is Highly Concentrated
Greenwich Associates 11
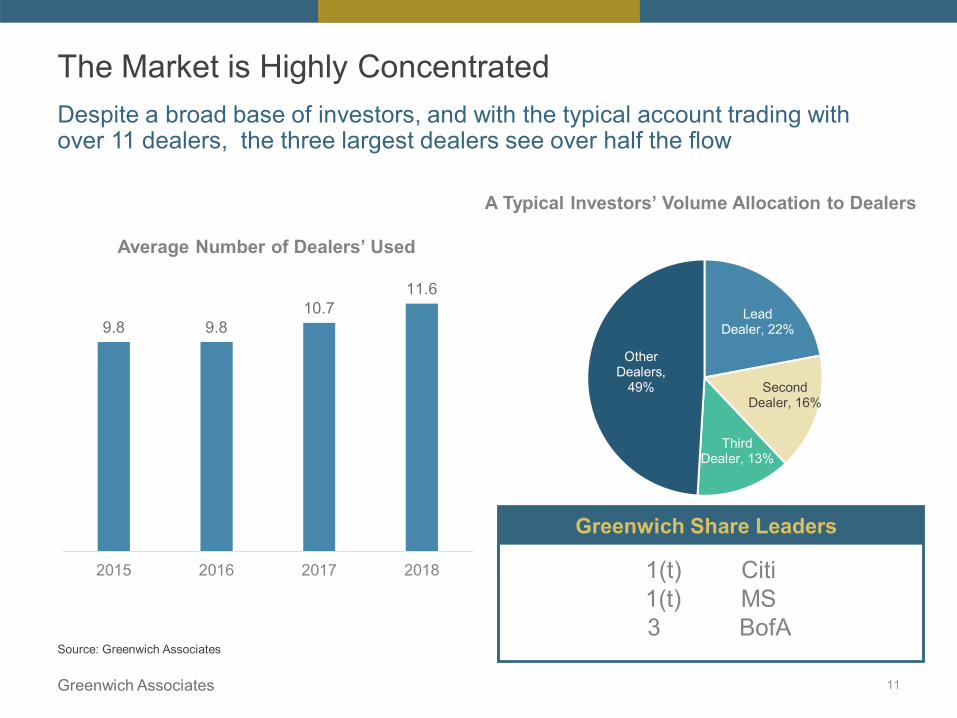
Despite a broad base of investors, and with the typical account trading with over 11 dealers, the three largest dealers see over half the flow
Source: Greenwich Associates
Lead Dealer, 22%
Second Dealer, 16%
Third Dealer, 13%
Other Dealers,
49%
A Typical Investors’ Volume Allocation to Dealers
9.8 9.810.7
11.6
2015 2016 2017 2018
Average Number of Dealers’ Used
Greenwich Share Leaders
1(t) Citi1(t) MS3 BofA

Investors Still Care About Their Dealer Relationships
Execution in Secondary
Markets40%
New Issue Capabilities
and Allocations
27%
Sales Service20%
Research Service
10%
Back Office/ Operations
2%
Repo/ Financing
1%
Greenwich Associates 12
Even as the market electronifies, investors still value the partnership they have with their dealers
Source: Greenwich Associates
Key Business Drivers What “Matters” Within Service

… But an E-Trading Evolution is Underway
Greenwich Associates 13
More investors are trading munis electronically and volumes have been growing
Source: Greenwich Associates
51%56%
62%
2016 2017 2018
Proportion of Buy-Side Firms Trading Electronically
12-15% of all munis volume
is now traded electronically
… And We Are Already Seeing the Impact
Greenwich Associates 14
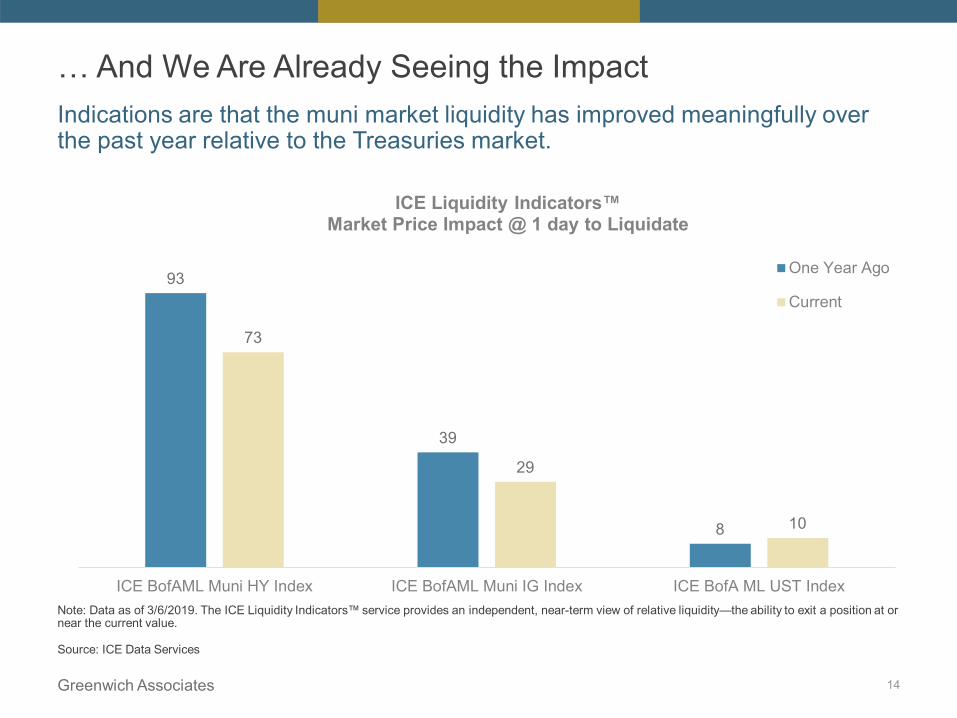
Indications are that the muni market liquidity has improved meaningfully over the past year relative to the Treasuries market.
Note: Data as of 3/6/2019. The ICE Liquidity Indicators™ service provides an independent, near-term view of relative liquidity—the ability to exit a position at or near the current value.
Source: ICE Data Services
93
39
8
73
29
10
ICE BofAML Muni HY Index ICE BofAML Muni IG Index ICE BofA ML UST Index
ICE Liquidity Indicators™Market Price Impact @ 1 day to Liquidate
One Year Ago
Current

What Do Investors Want Moving Forward?
Greenwich Associates 15
We asked muni PMs and Traders what types of e-innovations they wanted to see in Munis…
Source: Greenwich Associates
“I'd love to see dealers’ inventory electronically offered, maybe with an API or something like that.”
“From the bid wanted process, if there was a way to electronically send tickets, that would be the best. Especially when doing the bid-wanted process through Bloomberg, having basically everybody on board so that we can electronically execute trades -- instead of having to call up and having to confirm everything over the phone.”
“I’d like dealer to find a way to better distribute inventory so we can see what offers are live and in play.”
“There might be disrupters who are going to bring technology that would involve the dealer community as a whole. We set up things to try to exist with the existing framework of communications between the buy and the sell side which is like a sea of inventory runs and messages coming into the buy side firms like us, and typically via Bloomberg, and we try to use Bloomberg's technology to put some structure and form to all that, to sort through it, to classify it, to help us wade through the myriad offerings that are out there in the secondary market. So we're doing some technology on our end, but I would think our market is ripe for more growth in electronic means by which transactions are considered and executed.”
“The most obvious one to us is better electronic delivery of information and/or dealer inventories.”
“Streamlined and efficient dissemination of market information in order to enhance best execution.”

Stamford | London | Singapore | Tokyo | Pleasanton, CA
Contact Information
© 2019 Greenwich Associates, LLC. Javelin Strategy & Research is a division of Greenwich Associates. All rights reserved. No portion of these materials may be copied, reproduced, distributed or transmitted, electronically or otherwise, to external parties or publicly without the permission of Greenwich Associates, LLC. Greenwich Associates®, Competitive Challenges®, Greenwich Quality Index®, Greenwich ACCESSTM, Greenwich AIMTM, and Greenwich Reports® are registered marks of Greenwich Associates, LLC. Greenwich Associates may also have rights in certain other marks used in these materials.
16
David StrykerPrincipalGreenwich Associates
+1 203 [email protected]
Greenwich Associates

MARKET IMPLIED BENCHMARK YIELD CURVES AND VOLATILITY
May 22 & 23, 2019 17Market Implied Benchmark Yield Curves and Volatility

Selected Benchmark Yield Curves
MMD publishes dominant reference curve in muni market• “… updated periodically throughout the day, depending on market conditions…”• Also publishes numerous other yield curves (state, sector, credit, muni taxable, etc.)
MMA builds consensus curve based on survey of 20 dealers• Reports median yields after excluding extremes• Updated once a day
Bloomberg BVAL uses “… real-time trades and contributed sources …”• Updated hourly
MBIS – powered by Kalotay Analytics• Updated hourly• Based on large number of dealer bids/offers• Benchmark based on pool of AA/A bonds• Also publishes a AAA 5% NC-10 curve
Still Missing• Real-time, market-implied yield curves• Market-implied interest rate volatility
May 22 & 23, 2019 Market Implied Benchmark Yield Curves and Volatility 18

Why Interest Rate Volatility Needed
Most long munis are callable• Need OAS* model for proper rich/cheap analysis and risk management
OAS model needs interest rate volatility as input
*Option-adjusted spread
May 22 & 23, 2019 Market Implied Benchmark Yield Curves and Volatility 19

Kalotay’s CurviLinear™ Software
Solves for best-fit yield curve and interest rate volatility• Explains prices of a set of investment grade bonds with minimum error
Relies on unmatched speed and precision of MuniOAS™*, which incorporates tax effect on market prices of discounts• Ideally suited for muni yield curves
*Patent pending, one million valuations per minute
May 22 & 23, 2019 Market Implied Benchmark Yield Curves and Volatility 20

Extracting Market-Implied Yield Curve and Volatility
Given set of bonds and prices, first solve for best-fit par optionlessyield curve and volatility• Minimize least squared error between OAS model prices and input prices• Recent vol range has been 15% - 17%
Then convert par optionless curve into standard 5% NC-10 benchmark form using OAS model with same vol as above• Other reference curves to accommodate shorter calls and different coupons,
e.g. 4% NC-8, possible
May 22 & 23, 2019 Market Implied Benchmark Yield Curves and Volatility 21

From Par Optionless to 5% NC-10 at 15% Vol
May 22 & 23, 2019 Market Implied Benchmark Yield Curves and Volatility 22
1.0
1.5
2.0
2.5
3.0
3.5
4.0
0 5 10 15 20 25 30
Yiel
d (%
)
Maturity (yrs)
Par Optionless5% NC-10

CurviLinear™ In Action
May 22 & 23, 2019 Market Implied Benchmark Yield Curves and Volatility 23
Benchmark is a hybrid AA/A curveOther curves, including a AAA 5% NC-10 and AAA NCL, are available
Vol used: 15%
Related Articles
“Life Without Advance Refunding”, Municipal Finance Journal, 2018
“Creating a Live Yield Curve in the Illiquid Muni Market”, Journal of Fixed Income, 2017
In the Bond Buyer:
Beware of Bad Benchmark Curves – January 6, 2016 Spread(ing) Confusion – November 23, 2015
May 22 & 23, 2019 Market Implied Benchmark Yield Curves and Volatility 24

Accendo StrategiesHelping Clients Make Informed Strategic Decisions
and Deploy Successful Product Initiatives

Major Trends in Buy-side Fixed Income
Accendo interviewed hundreds of portfolio managers – here are some of the dominant findings of the muni world:• Municipal bonds are still one of the top three sectors
producing valuation issues
• Significant valuation and risk (effective duration) differences between major providers of muni analytics
• Demand for accuracy

Major Trends in Buy-side Fixed Income
• On-demand higher speed analytics
• Hourly curve updates and intraday pricing
• The move towards real-time valuations
• The creation and use of fixed income ETF’s for short and long term sector allocations and hedging
• The move towards electronic fixed income marketplace and exchange traded fixed income securities including less traded OTC’s

The MuniOAS demo
• An integration of MuniOAS with the ICE Data Services municipal bond database
• Sample muni bond portfolio

The MuniOAS demoNon-Deminimis Discount Bond (+100 bp Shift)
• Downside can be precipitous because rate shift up pushes price below de minimis threshold (95.50)

The MuniOAS demoDe Minimis Discount Bond (+100 bp Shift)
• De minimis effect pronounced when rates rise• Overestimated (conventional) OAS underprices bond when rates decline

Questions & Answers
Thank you for attending.Please contact us for one on one presentations and demos.
Contacts: Jeff [email protected](203) 834-2725
Michael [email protected](212) 482-0900 ext. 4
Webinar Playback Link
www.kalotay.com