munich personal repec archive - uni-muenchen.de · munich personal repec archive on the use of...
TRANSCRIPT

MPRAMunich Personal RePEc Archive
On the Use of Palynological Data inEconomic History: New Methods and anApplication to Agricultural Output inCentral Europe, 0–2000 AD
Adam Izdebski and Grzegorz Koloch and Tymon S loczynski
and Marta Tycner-Wolicka
March 2014
Online at http://mpra.ub.uni-muenchen.de/54582/MPRA Paper No. 54582, posted 23. March 2014 14:51 UTC

On the Use of Palynological Data
in Economic History: New Methods
and an Application to Agricultural
Output in Central Europe, 0–2000 ad∗
A. Izdebski† G. Koloch‡ T. Słoczyński§
M. Tycner-Wolicka¶
Abstract: In this paper we introduce a new source of data to economic history: pa-
lynological data, i.e. information about pollen grains which are preserved in bottom
sediments of various water basins. We discuss how this data is collected and how
it should be interpreted; develop new methods for aggregating this information into
regional trends in agricultural output; construct an extensive data set with a large
number of pollen sites from Central Europe; and use our methods to study the eco-
nomic history of Greater Poland, Lesser Poland, Bohemia, Brandenburg, and Lower
Saxony since the first century AD.
∗This project was funded by the Ministry of Research and Higher Education of the Republic ofPoland within the Iuventus Plus program (grant IP2011 018371). The project was based at andadministered by the Institute of History of the Polish Academy of Sciences. Tymon Słoczyńskialso acknowledges a START scholarship from the Foundation for Polish Science (FNP). We ben-efited from comments and discussions with participants in the ESEH Conference (Munich), theFRESH Meeting (Warsaw), the World Economic History Congress (Stellenbosch), and seminars atthe Jagiellonian University in Krakow, the Polish Academy of Arts and Sciences (PAU), the PolishAcademy of Sciences (PAN), and the University of Warsaw. We are also grateful to Piotr Kołaczek,Radka Kozakova, and Petr Pokorny who generously provided the data which is not available in theEuropean Pollen Database. We thank Jesse Simon for improving the language style.†Jagiellonian University in Krakow.‡Warsaw School of Economics.§Michigan State University; Warsaw School of Economics; and IZA, Bonn.¶University of Oxford.
1 Introduction
Economic historians are often interested in studying the dynamics of human activity
over the very long term.1 However, data about the past is inherently scarce, and
many interesting questions, especially about the pre-modern era, cannot be answered.
As noted by Steckel (2013), “economic historians are left with surviving scraps of
evidence, often collected for other purposes”; they “cannot design or update a survey
to gather more information”; they “cannot interview the deceased”; and they “are
stuck with what was recorded, has survived, and is now housed in an accessible
location”. As a consequence, various researchers aim to collect and analyze data from
non-standard sources which could serve as a proxy for human activity. For example,
skeletal remains are now routinely used as a source of data about the evolution of
human health (Steckel, 2003; Koepke and Baten, 2005, 2008; Steckel, 2008, 2013).
Other “biological measures of economic history”, namely mortality rates, stature,
and body mass index (BMI), are also used to study shorter time periods.2
In this paper we introduce palynological data as an alternative “biological mea-
sure” which can also serve as a useful proxy for human activity. Various plants pro-
duce pollen grains and spores which are then accumulated in the bottom sediments
of lakes and other water basins. Palynologists extract sediment cores from the floor of
lakes, establish a chronology of layers of sediments, and count pollen grains of various
plant taxa within each layer. Selected taxa – especially Cerealia (cereals) – are gen-
erally regarded as anthropogenic indicators, and variations in their relative presence
can be interpreted as variations in human activity (Behre, 1981; Feeser and Furholt,
2013). However, most of the palynological literature focuses on local phenomena (a
single site or several sites in close proximity to one another) which are arguably of
1Similar questions are also of interest to growth theorists. For example, Galor and Weil (2000)and Galor and Moav (2002) develop a unified growth theory which is intended to capture varyingpatterns of stagnation and growth over the entire course of human history. Related contributionsinclude Goodfriend and McDermott (1995), Acemoglu and Zilibotti (1997), Kelly (2001), Kogel andPrskawetz (2001), Hansen and Prescott (2002), and Lagerlof (2003).
2See, e.g., Voth and Leunig (1996), Baten and Murray (2000), Komlos et al. (2003), Komlos(2007), Baten et al. (2010), Brainerd (2010), and Austin et al. (2012) for recent applications.
1
limited interest to economic historians.3 Therefore, we must develop new methods of
aggregating palynological data into regional trends. Our methods take into account
both the geographical distribution of pollen sites and the chronological distributions
of core samples which can (and do) differ between these sites. Moreover, we use cross
validation to determine the optimal structure of penalties for spatial distance and
time distance. We then use our methods to study long-term variation in agricultural
output in Central Europe during the last two millennia.
Our paper is thereby related to an important field of research in economic history
which studies trends in agricultural production and productivity. Notable contribu-
tions to this field include Clark (1991), O’Brien and Prados de la Escosura (1992),
Allen (2000), Olmstead and Rhode (2002), Federico and Malanima (2004), Allen
(2009), Campbell and Ó Grada (2011), Kelly and Ó Grada (2013), and many others.
The advantage of our approach is that it significantly extends the timespan of analy-
sis. While most of these previous studies are restricted to several centuries or less, our
paper investigates regional trends in agricultural output in Greater Poland, Lesser
Poland, Bohemia, Brandenburg, and Lower Saxony since the first century AD. The
disadvantage of our data, however, is that it cannot be transformed into common
measures of amount of land under cultivation and output per unit of land. On the
contrary, this data is inherently relative, and is only suggestive of the relative impor-
tance of various plant taxa in the vegetation of a given region. Clearly, each source
of data has its own limitations; our intention is therefore to increase the number of
alternative sources which are available to economic historians.
The remainder of this paper is organized as follows. In the next section, we provide
a short introduction to palynology, and discuss how palynological data is collected
and how it should be interpreted. In Section 3, we develop new methods of aggregating
3To the best of our knowledge, there exists only one paper in the economic literature whichanalyzes palynological data. Namely, Hanley et al. (2009) study economic determinants of long-runbiodiversity change, and they use pollen data to construct their measure of diversity. Therefore,they do not use pollen data to approximate actual human activity, while this is the approach whichwe take in this paper.
2
such data into regional trends. In Section 4, we describe our data set. In Section 5,
we use our methods to analyze this data as well as discuss our findings. Finally, in
Section 6, we offer some conclusions from our research.
2 Background
Nature has its own archive, in which information from its past is stored in the form of
sediment which accumulates over millennia. Among these archives, lakes and marshes
preserve material from the most recent periods. In particular, lakebed and peat sed-
iments, accumulated every year, contain pollen grains produced by the surrounding
vegetation. This pollen signal reflects the spatial structure of vegetation around a
lake or marsh in a given period, and the radius which delineates the relevant area
can vary from less than one kilometer to dozens of kilometers, depending on the plant
in question (Sugita, 1993; Gaillard et al., 2008; Hellman et al., 2009). The task of
palynology is to retrieve and analyze this material, so that one can reconstruct the
past environment around a given site.4
The first step is to extract a core sample from a lakebed or peat accumulation.
Sediment cores of an appropriate length (often several meters) are brought to lab-
oratories, where pollen samples for microscope analyses, and organic material for
radiocarbon dating, are collected at regular intervals (usually a few centimeters).
Then, pollen grains from each sample are identified and counted, and this procedure
results in creation of a data set with counts of pollen grains from different plants or
plant groups. Each of these plants or plant groups is typically referred to as taxon
(pl. taxa), since for some plants it is possible to identify the exact species while, in
other cases, only a genus or family can be identified. Palynologists never count all
the pollen grains in a sample, and usually restrict their attention to a subsample
of 500–1,500 grains which is believed to provide representative information on the
4A good introduction to palynology for historians is provided by Eastwood (2005). See alsomethodological discussions in Vermoere (2004) and Izdebski (2013).
3

proportions of pollen grains in a sample.
Such a data set has only an ordinal chronology which is based on the actual core
depths of subsequent samples. However, there are several methods of constructing an
absolute chronology for this data. Typically, radiocarbon dating is applied to organic
material from a selection of core depths. Once these dates are known, it is possible to
model the relationship between age and depth in a particular core and to extrapolate
ages on depths for which there is no radiocarbon date, while taking into account
the geological structure of the core (Bjorck and Wohlfarth, 2001). The changing
relationship between depth and age is described by the accumulation rate, i.e. the
amount of sediment that accumulates every year, and this value is almost never
stable throughout the history of a core. The modeling also involves a transformation
of original radiocarbon dates into calibrated ones (Reimer et al., 2009), and the final
result is an estimate of a calendar year for each sample.
The resulting data set contains information about pollen counts of various plant
taxa in different years, and these dates are usually distributed in an irregular way,
because sampling and laboratory analysis are never rigorously regular, and the accu-
mulation rate also tends to vary over time. Importantly, pollen counts only become
meaningful after their recalculation into their proportion in the pollen sum, i.e. the
number of all pollen grains in a sample. Consequently, every interpretation of pollen
profiles is concerned with the changing structure of the pollen signal which is infor-
mative about the structure of the vegetation around a given site. Recent research has
examined the possibility of translating the changing proportions of plant taxa into
exact measures of land cover (Gaillard et al., 2008; Hellman et al., 2008; Fyfe et al.,
2010), although such inferences are typically regarded as too extreme. Of course, this
does not mean that the changing proportions of plant pollen in sediment cores do
not reflect the transformations of land cover – on the contrary, recent studies on con-
temporary pollen dispersal confirm that this information is contained in the pollen
signal (Andrade et al., 1994; Dıaz, 1994; Vermoere et al., 2001; Favre et al., 2008).
4

Thus, at present, any interpretation should focus on the changes in proportion of
those pollen grains which represent the plant taxa of interest, when and how quickly
they increase or decrease, and how long they remain stable. Moreover, interpretations
of pollen profiles require considerable knowledge of how different plants produce
pollen and how it is distributed, as well as the ecological ‘habits’ of these plants, in
particular their relationship with human activity (Behre, 1981). In this paper, because
of our interest in agricultural output, we focus solely on cereals, and examine how
their share in the vegetation of entire regions has changed since the beginning of the
European Middle Ages. From this period onward, cereals are certainly the clearest
and most reliable indicator of human activity in the landscape, together with forest
clearance and pasturing. However, while these two phenomena are visible in pollen
profiles, their interpretation is much more complex and less certain, as they would,
with the exception of very specific cases, normally appear in conjunction with cereal
cultivation. In consequence, we focus on pollen grains which represent wheat, rye,
barley, oats, and a separate category of Cerealia-type, i.e. those pollen grains that
certainly belong to cereals, but where the state of preservation does not allow for
attribution to any specific species. Importantly, we do not consider millet, since its
pollen is undistinguishable from pollen of other plants of the genus of Panicum.
3 Method
3.1 Framework and Notation
Let there be m sites, indexed by k = 1, 2, . . . ,m, and n plant taxa, indexed by
j = 1, 2, . . . , n. Also, let Ω = 1, 2, . . . ,m. Each site k ∈ Ω is represented by:
(i) A series of time periods Tk = (tk1 , tk2 , . . . , tknk ) which represent dates on which
measurements were carried out at site k. Series Tk consists of nk 1 elements which
can vary across k. Moreover, measurement dates do not have to overlap across sites.
(ii) A matrix of measurements Zk where zk(i, j), the (i, j)-th element of Zk, is equal
5

to the fraction of j-type pollen grains in the overall number of pollen grains at site k,
as measured on date Tk(i). (iii) A pair of coordinates ck = (xk, yk) which represent
the geographical location of site k. (iv) A quality index qk ∈ [0, 1] which represents
the quality of measurements at site k.
Also, let there be w regions and let the q-th region include ωq ⊂ Ω, a subset of
available sites. Let T = (Tmin, Tmin + 1, Tmin + 2, . . . , Tmax) and i = 1, 2, . . . , Tmax −
Tmin + 1. Series T represents our time periods of inference which are common for all
sites. Define our goal to be the construction of matrices Xq, q = 1, 2, . . . , w, such that
xq(i, j) is an estimate of the fraction of j-type pollen grains in the overall number of
pollen grains in region ωq, as measured on date T (i).
Our procedure now consists of three steps: interpolation, smoothing, and aggrega-
tion. In the first step, for each site k, we interpolate missing measurements in Zk. Let
Tk = [Tk(1), Tk(1)+1, Tk(1)+2, . . . , Tk(nk)] where nk is the number of measurements
which are available at site k. Then, missing measurements correspond to time periods
Tk \ Tk, and we interpolate them, for each site k and each taxon j, using a linear
spline function with data points located in (Tk(i), zk(i, j)), i = 1, 2, . . . , nk. There-
fore, in this step, for each site k, we obtain measurements for all t ∈ Tk. Let these
measurements be collected in matrices Zk = [zk(i, j), i = 1, 2, . . . , nk, j = 1, 2, . . . , n]
where nk = Tk(nk)− Tk(1) + 1.
In the second step, measurements in zk(j) = (zk(1, j), zk(2, j), . . . , zk(nk, j))T are
smoothed using a low-pass filter, i.e. a filter which erases high-frequency fluctuations
from the time series, as they can be attributed to random noise and errors in physical
measurement. We smooth independently across k and j, i.e. across sites and taxa,
in order to obtain the smoothed measurement series, zk(j). More specifically, we use
the Hodrick–Prescott filter, which sets zk(j) as a minimizer of the following function
(Hodrick and Prescott, 1997):
nk∑i=1
(zk(i, j)− zk(i, j))2 + λnk−1∑i=2
(zk(i− 1, j) + zk(i+ 1, j))2 (1)
6

where λ is a free parameter. If any measurement becomes negative after the smooth-
ing, it is replaced by zero. Vectors zk(j), for j = 1, 2, . . . , n, constitute a matrix of in-
terpolated and smoothed measurements at site k, and we denote it by Zk = [zk(i, j)].
After interpolation and smoothing, vectors zk(j) are of the same length when k
is fixed, but they can vary in this respect when k changes. In particular, they do not
necessarily contain the entire time range T , for which aggregation is to be done.
Therefore, let T ?k = T ∩ Tk and let Z?k be composed of those rows of Zk which
correspond to time periods in T ?k . Let z?k(j) denote the j-th column of Z?k and let n?k
denote the length of z?k(j) which is equal across j. For site k, missing measurements
in vectors zk(j), j = 1, 2, . . . , n, correspond to time periods Tk = T \T ?k . If Tmin ∈ Tk,
then we use zk(1, j) to replace measurements in time periods Tmin, Tmin+1, . . . , T ?k (1)−
1 (for each j = 1, 2, . . . , n). Analogously, if Tmax ∈ Tk, then we use zk(nk, j) to
replace measurements in time periods T ?k (n?k) + 1, T ?k (n?k) + 2, . . . , Tmax (for each j =
1, 2, . . . , n). Let the resulting measurement matrix be denoted by Zk (which is |T |×n
for each k, where |T | = Tmax − Tmin + 1).
In the third step, for each region ωq, these measurements are aggregated into
regional trends. We develop three aggregation methods which we describe in sub-
sequent subsections. These methods differ in the degree to which they incorporate
additional spatial and time information which is entirely omitted by the simplest
approach.
3.2 Simple Aggregation
Let xq(j) denote the j-th column of Xq. For each region ωq, vectors xq(j), j =
1, 2, . . . , n, are constructed according to the following procedure:
xq(j) =1∑
k∈ωq qk
∑k∈ωq
zk(j) · qk. (2)
7

3.3 Incorporating Spatial Information
In the previous subsection, for each region ωq, there is a single matrix Xq which is
assumed to represent inferred pollen fractions for various plant taxa in the region as
a whole. Now we want to relax this assumption and utilize spatial information which
is contained in pairs of coordinates of respective sites. In particular, we assume that
information which is relevant for inference at any given location is a function of
the distance between this location and the pollen site, from which the information
originates. A similar approach is typical for gravity models of trade in economics
where the intensity of trade between two countries varies inversely with the distance
between them (Anderson, 1979; Anderson and van Wincoop, 2003).
Such an extension allows for inference at any location which is described by a
pair of coordinates (x, y), so that the matrix Xq is a function of these coordinates,
Xq = Xq(x, y). In particular, we can define a set of pairs of coordinates Cq which
defines q in a spatial sense. Then, for each region ωq, we can construct a spatial
map Xq(x, y) : (x, y) ∈ Cq of this region. Such a map not only describes how the
distribution of pollen fractions for various plant taxa changes over time, but also how
these fractions are distributed spatially across the region ωq for a given t ∈ T .5
In our applications we restrict our attention to describing each region ωq by a
single pair of coordinates, Cq = (xq, yq), and we assume these coordinates to be
representative for q. Then, Xq = Xq(xq, yq) represents, as before, pollen fractions for
various plant taxa in region ωq. In particular, we first describe each region ωq by a set
of four vertices, Θq = (xqr, yqr), r = 1, 2, 3, 4, i.e. we define q to be a quadrangle.
Then, we assume that coordinates (xq, yq), which ultimately represent region ωq, are
given by geometric centers of the quadrangle Θq, namely we assign the same mass to
5Note that our concept of spatial maps is very closely related to isopollen maps in palynology.See, e.g., Webb (1974), Ralska-Jasiewiczowa (1983), Ralska-Jasiewiczowa et al. (2004), and Feeserand Furholt (2013).
8

each vertex (xqr, yqr) ∈ Θq:
(xq, yq) =14
∑(xqr,yqr)∈Θq
(xqr, yqr) (3)
Let xq(j), as previously, denote the j-th column of Xq. For each region ωq, vectors
xq(j), j = 1, 2, . . . , n, are constructed according to the following procedure:
xq(j) =∑k∈ωq
zk(j) · wk (4)
where weights wk sum to one, are corrected with quality indexes qk, and contain
spatial information such that, controlling for quality, i.e. for qk, wk ∝ ρ−αq,k where ρq,k
is the Euclidean distance between location of region ωq, which is given by (xq, yq),
and of site k, which is given by its spatial coordinates. Note that α 0 is a free
parameter. If α = 0, then the current procedure is equivalent to the previous one.
3.4 Incorporating Spatial and Time Information
In this subsection we extend the spatial approach so that it also takes into account the
fact that time periods for which measurements are available at site k, i.e. time periods
in Tk, neither overlap across the sites (i.e. across k), nor are uniformly distributed over
the time span [Tk(1), Tk(nk)]. Moreover, their intersection with T can be arbitrary.
As a consequence, when inference about xq(i, j) is made for a given region ωq on
the basis of measurements in zk(i, j), k ∈ ωq, some of the information from these
measurements is more relevant than the other, depending on the time distance of T (i)
from measurements which are closest to T (i) in Tk, k ∈ ωq. Therefore, analogically
to the spatial case, here we use a notion of time distance, ψi,k, where:
ψi,k = minτ∈Tk|T (i)− τ | (5)
9

is equal to the minimal number of years between T (i) and Tk, i.e. between the date
in which xq(i, j) is to be estimated and any date in which some measurement was
originally available for site k. For each region ωq, elements xq(i, j) of vectors xq(j),
j = 1, 2, . . . , n, are constructed according to the following procedure:
xq(i, j) =∑k∈ωq
zk(i, j) · wi,k (6)
where weights wi,k sum to one, are corrected with quality indexes qk, and contain
spatial information such that, controlling for quality and time distance, wi,k ∝ ρ−αq,k
as well as, controlling for quality and spatial distance, wi,k ∝ ψ−βi,k where α 0 and
β 0 are free parameters. More specifically, we assume that:
wi,k ∝ (1− θ) · ρ−αq,k + θ · ψ−βi,k (7)
where θ ∈ [0, 1] is a free parameter.
Also, note that the current procedure is equivalent to the previous one if θ = 0.
On the other hand, if θ = 1, then spatial information is neglected and we only use
information about time distances. The latter approach, however, seems less appealing
a priori, since the purpose of using the information on time differences between
various measurements is only to adjust spatial relations for the fact that information
in respective measurements is more or less outdated from the perspective of T (i).
3.5 Cross Validation
Parameters α, β, and θ are arbitrary and their proper selection constitutes a problem
of model calibration. We use cross validation to select these parameters, so that
they minimize in-sample prediction errors for available data points. This subsection
describes our calibration strategy.
For each site k, we have appropriate measurements in Zk. We analyze, one by one,
all sites which are available, k ∈ Ω, and we use our methods to predict corresponding
10

measurements, at each k, using all the information in ωq \ k. Then, we compare
these predicted values, Xk, with actual ones, Zk. The error matrix, Γk = Xk − Zk,
produces the root-mean-square error (RMSE) of prediction:
µk = tr(1
|T | · nΓTk Γk)
12 . (8)
where |T | = Tmax − Tmin + 1 and tr is a trace operator. We obtain µk for each k and
compute the resulting total RMSE:
µ =1m
∑k∈Ω
µk. (9)
Note that µ = µ(α, β, θ), i.e. the total RMSE, is a function of α, β, and θ. In
consequence, we minimize the total RMSE over these parameters.6
4 Data
In this section we describe our data set, which contains all pollen sites from Central
Europe with reliable information on human activity in the last two millennia. We
have used two criteria for including pollen sites to this data set: (i) that a given
site provides data for cereals; and (ii) that the chronology of the last two millennia
can be based on varve years or radiocarbon dating. In most cases, we have retrieved
these data either from the European Pollen Database (Fyfe et al., 2009) or from the
PALYCZ database (Kunes et al., 2009) which gathers information on pollen sites in
the Czech Republic and Slovakia.7 The resulting data set consists of 36 pollen sites
which we group in five regions (see Table 1).
Clearly, it is essential to ensure the chronological reliability of such data. To
accomplish this goal, instead of relying on the original age-depth models for our pollen
6We use a grid search and consider the following values for the respective three parameters:α = 0, 0.25, 0.5, . . . , 3.75, 4; β = 0, 0.25, 0.5, . . . , 3.75, 4; and θ = 0, 0.125, 0.25, . . . , 0.875, 1.
7See also http://www.europeanpollendatabase.net/ and http://botany.natur.cuni.cz/palycz/, respectively (accessed March 15, 2014).
11

Table 1: Pollen Sites
Site name Latitude Longitude Chronological quality Original publication
A – Greater Poland
1. Giecz 52.31944 17.36333 2 Milecka (1998)2. Lake Skrzetuszewskie 1 52.55000 17.36056 2 Tobolski (1991)3. Lake Skrzetuszewskie 2 52.55000 17.36056 1 Tobolski (1990)4. Lake Lednica 52.55694 17.39028 2 Makohonienko (1991)5. Lake Świętokrzyskie 52.54444 17.59861 2 Makohonienko (2000)6. Sławsko 52.66667 18.25000 3 Unpublished7. Lake Gościąż 52.58333 19.35000 1 Ralska-Jasiewiczowa et al. (1998)
B – Lesser Poland
8. Zlatnicka Dolina 49.51667 19.28333 1 Rybnıcek and Rybnıckova (1985)9. Bobrov 49.44583 19.56667 1 Rybnıcek and Rybnıckova (1985)10. Puścizna Mała 49.45600 19.78530 1 Kołaczek et al. (2010)11. Puścizna Rękowiańska 49.48333 19.81667 3 Obidowicz (1990)12. Regetovka 49.42500 21.27917 1 Wacnik (1995)13. Cergowa Góra 49.53333 21.70000 1 Szczepanek (2001)14. Jasiel 49.37278 21.88694 2 Szczepanek (1987)15. Tarnawa Wyżna 1 49.10000 22.83333 2 Ralska-Jasiewiczowa (1980)
C – Bohemia
16. Na bahne 50.19888 15.96119 1 Pokorny et al. (2000)17. Stara Boleslav (hradiste) 50.19793 14.66743 3 Unpublished18. Stara Boleslav (cisticka) 50.19793 14.66743 1 Brızova (1999)19. Brve 50.07178 14.24492 1 Pokorny and van der Knaap (2011)20. Veselov 50.11500 13.14056 3 Pokorny (2011)21. Zahajı 50.37922 14.11555 1 Pokorny (2005)22. Kosatky 50.31878 14.66337 1 Unpublished
D – Brandenburg
23. Kleiner Mochowsee 51.99639 14.19889 2 Jahns (1999a)24. Großer Treppelsee 52.15000 14.45278 1 Giesecke (2000)25. Langes Fenn Kemnitzerheide 52.31361 12.91361 1 Wolters (1999)26. Großer Krebssee 1 52.84659 14.09932 2 Jahns (1999b, 2000)27. Großer Krebssee 2 52.84659 14.09932 3 Jahns (1999b, 2000)28. Felchowsee 1 53.05509 14.12928 3 Jahns (2000)29. Loddigsee 53.43333 11.85000 1 Jahns (2007)
E – Lower Saxony
30. Ahlequellmoor 51.73056 9.50944 1 Jahns (2006)31. Silberhohl 51.91023 10.18267 2 Chen (1988)32. Burchberg 2 51.75902 10.46010 3 Willutzki (1962)33. Wachel 3 53.43889 8.86889 3 Dorfler (1989)34. Waschhorn 53.61500 8.73694 2 Kuhl (1998)35. Flogeln 5 53.66667 8.76389 2 Behre (1976)36. Ahlenmoor 53.70000 8.73333 3 Behre (1976)
12

Figure 1: Pollen Sites and Regions
sites, we have produced our own chronological models for 25 out of 36 cases, using
a computer program called clam (Blaauw, 2010).8 Moreover, we have divided our
pollen sites into three categories of chronological quality, and we explicitly utilize this
information in our aggregation procedures to reweight these data and ensure thereby
a bigger impact of more reliable sites (see Section 3). Namely, we use the following
categories and weights: (i) a certain surface date and a minimum of one radiocarbon
date for the last millennium and a minimum of one additional radiocarbon date, or
varve chronology (1st category, weight: 1.00); (ii) a certain surface date and either
lack of radiocarbon dates for the last millennium or only one radiocarbon date in
total (2nd category, weight: 0.90); and (iii) an uncertain surface date (3rd category,
weight: 0.70).9
8See also http://chrono.qub.ac.uk/blaauw/clam.html (accessed March 15, 2014). Note thatwe provide further details on these new age-depth models in our companion paper (Izdebski et al.,2014).
9Note that all of our main results are robust to not using these weights, and instead attachingthe same weight to each site.
13
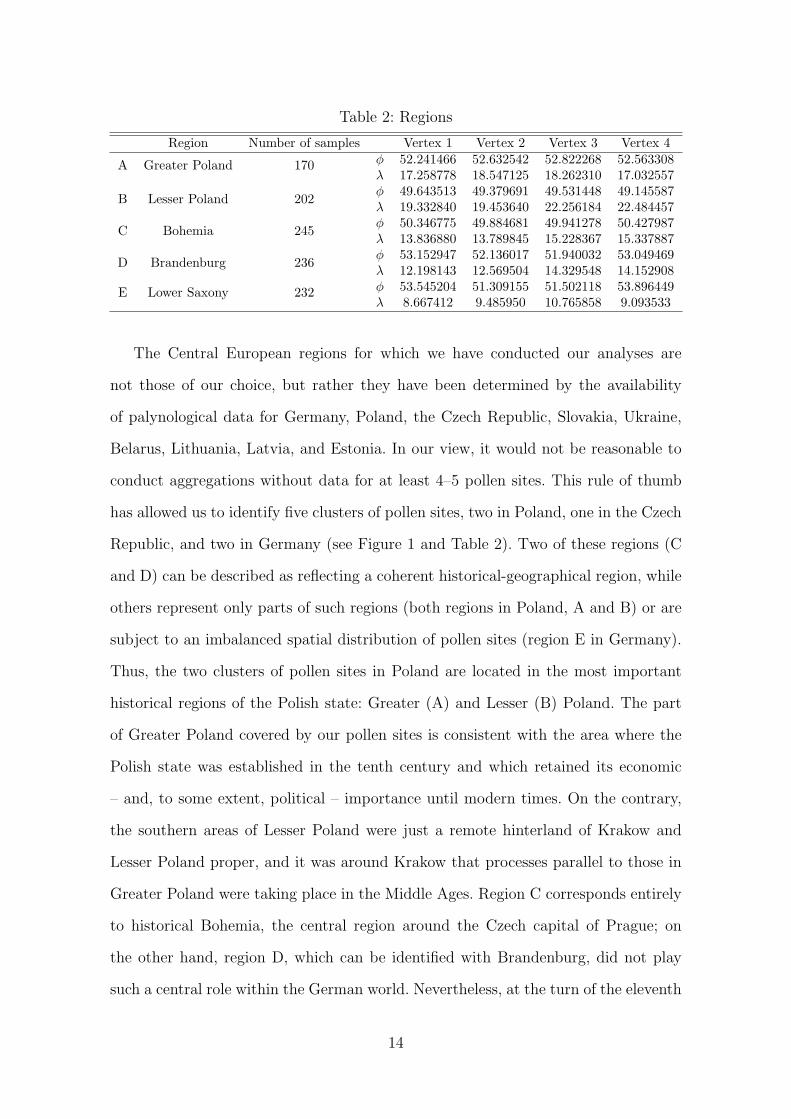
Table 2: Regions
Region Number of samples Vertex 1 Vertex 2 Vertex 3 Vertex 4
A Greater Poland 170 φ 52.241466 52.632542 52.822268 52.563308λ 17.258778 18.547125 18.262310 17.032557
B Lesser Poland 202φ 49.643513 49.379691 49.531448 49.145587λ 19.332840 19.453640 22.256184 22.484457
C Bohemia 245φ 50.346775 49.884681 49.941278 50.427987λ 13.836880 13.789845 15.228367 15.337887
D Brandenburg 236φ 53.152947 52.136017 51.940032 53.049469λ 12.198143 12.569504 14.329548 14.152908
E Lower Saxony 232 φ 53.545204 51.309155 51.502118 53.896449λ 8.667412 9.485950 10.765858 9.093533
The Central European regions for which we have conducted our analyses are
not those of our choice, but rather they have been determined by the availability
of palynological data for Germany, Poland, the Czech Republic, Slovakia, Ukraine,
Belarus, Lithuania, Latvia, and Estonia. In our view, it would not be reasonable to
conduct aggregations without data for at least 4–5 pollen sites. This rule of thumb
has allowed us to identify five clusters of pollen sites, two in Poland, one in the Czech
Republic, and two in Germany (see Figure 1 and Table 2). Two of these regions (C
and D) can be described as reflecting a coherent historical-geographical region, while
others represent only parts of such regions (both regions in Poland, A and B) or are
subject to an imbalanced spatial distribution of pollen sites (region E in Germany).
Thus, the two clusters of pollen sites in Poland are located in the most important
historical regions of the Polish state: Greater (A) and Lesser (B) Poland. The part
of Greater Poland covered by our pollen sites is consistent with the area where the
Polish state was established in the tenth century and which retained its economic
– and, to some extent, political – importance until modern times. On the contrary,
the southern areas of Lesser Poland were just a remote hinterland of Krakow and
Lesser Poland proper, and it was around Krakow that processes parallel to those in
Greater Poland were taking place in the Middle Ages. Region C corresponds entirely
to historical Bohemia, the central region around the Czech capital of Prague; on
the other hand, region D, which can be identified with Brandenburg, did not play
such a central role within the German world. Nevertheless, at the turn of the eleventh
14

century, the processes of state formation seem to have started here as well, and – after
the integration of the region into the German Reich in the twelfth–thirteenth century
– the area demarcated as region D remained a separate entity within the German
world, with its own political and cultural history. Finally, region E can be considered
to represent modern Lower Saxony, the territories conquered by Charlemagne in the
late eighth century which formed a separate and distinct region from the Rhine area
to the south-west. In our data set, unfortunately, this region is represented primarily
by pollen sites grouped in its northernmost part (in Frisia), with some additional
sites in the Harz. Nevertheless, our results for this region are interesting enough to
merit their inclusion in our historical interpretations.
5 Results
5.1 Introductory Remarks
Our historical interpretations are generally based on the most advanced aggrega-
tion method, which we describe in Section 3.4. This method takes into account not
only the chronological quality of pollen sites and their geographical distribution, but
also the chronological distribution of pollen samples in sediment cores. This last as-
pect is very important with regard to the specificity of our data. Before conducting
the aggregation itself, the data is transformed into a time series with non-missing
observations for every calendar year. This interpolation results in losing the initial
information on time periods for which we have actual observations. By weighting our
pollen sites by their time distance from each time period, we attempt to reintroduce
this valuable information.
In order to investigate the economic-agrarian histories of particular regions, we
present our reconstructions as cumulative diagrams of various types of cereals. In
this way, we can show the changing structure of the agricultural output of each re-
gion. We need to bear in mind, however, that our data does not contain information
15

Table 3: Pollen Productivity of Cereals
Amount of pollen per stamenin Uttar Pradesh, India
Amount of pollen per stamenin Germany/Poland
Rye 13,200 19,000/22,360Wheat 2,910Oats 2,300
Barley 2,410
NOTE: For Uttar Pradesh, see Agnihotri and Singh (1975); for Germany, seePohl (1937); for Poland, see Piotrowska (2008).
about millet, a cereal regarded as particularly important during the earlier part of
the Middle Ages (Marinval, 1992; Ruas, 1992; Austin, 2006). Additionally, as dis-
cussed in Section 2, this data needs to be interpreted with caution. If a given cereal
is represented as a higher proportion of pollen grains than some other cereal in a
given time period, it does not necessarily mean that the former cereal was cultivated
in larger absolute volumes than the latter; such differences can be attributed to vari-
ation in the production and distribution of pollen across various types of cereals
(Hellman et al., 2009). For example, rye produces at least four times as much pollen
as any other cereal. Consequently, proportions of various cereals on cumulative dia-
grams can be seriously distorted. We may achieve some degree of visual correction
by weighting our estimated proportions of each cereal type by its pollen productivity,
but unfortunately there is only one study, to the best of our knowledge, which offers
information on pollen productivity of all relevant cereal types, and it uses data from
Uttar Pradesh in India (Agnihotri and Singh, 1975). In Table 3, we present these
estimates of pollen productivity, together with additional data on the pollen produc-
tivity of rye from Germany (Pohl, 1937) and Poland (Piotrowska, 2008). We use the
estimates from Agnihotri and Singh (1975) to correct inferred pollen fractions in our
cumulative diagrams. These diagrams still do not provide a direct assessment of the
actual structure of the agricultural output in a given time period; nevertheless, they
do give a more reliable indication of these proportions and the directions in which
they were changing.
With the help of these corrected cumulative diagrams we are able to present an
16

interpretation of our reconstruction of regional trends in agricultural output. When
necessary, diagrams with trends of single cereal types are also presented. The follow-
ing discussion focuses on three periods of major economic developments in Central
Europe: the dawn of the Middle Ages, the climax of medieval societies and, finally,
the early modern transformation of European economies. Our main interest is in
pointing out the differences between the five regions, from the East to the West.
There is now no doubt that, by the end of the early modern period, major differences
can be observed in the economic development between Western European countries
and the rest of the continent; there was also a significant divergence within Central
Europe itself (Kula, 1976; van Zanden, 2009), which can be compared to the Great
Divergence between Europe and other economic systems of the world, such as China
or Japan (Pomeranz, 2000; Allen, 2009). The continuous records of the agricultural
output of five regional economies from Germany, Poland, and the Czech Republic
enable us to reconstruct the chronology of this intra-European divergence, and to
speculate about its connections with other economic processes and political transfor-
mations. However, our results do not test the ‘divergence hypothesis’ in a classical
way, because we are unable to present any reconstructions of GDP per capita or
similar measures. However, as will become visible in the following discussion, our
reconstructions shed new light on the structural features of pre-industrial agrarian
economies within Central Europe. Thus, by comparing the chronology and the rela-
tive scale of transformations in Greater and Lesser Poland, Bohemia, Brandenburg,
and Lower Saxony, we may add new evidence to the discussion on the origins of the
economic differences between various parts of Europe.
5.2 The Beginnings of the Agrarian Economies of Central
Europe
Archaeological research leaves no doubt that Central Europe has been inhabited for
several millennia and that, throughout this period, its populations gradually attained
17
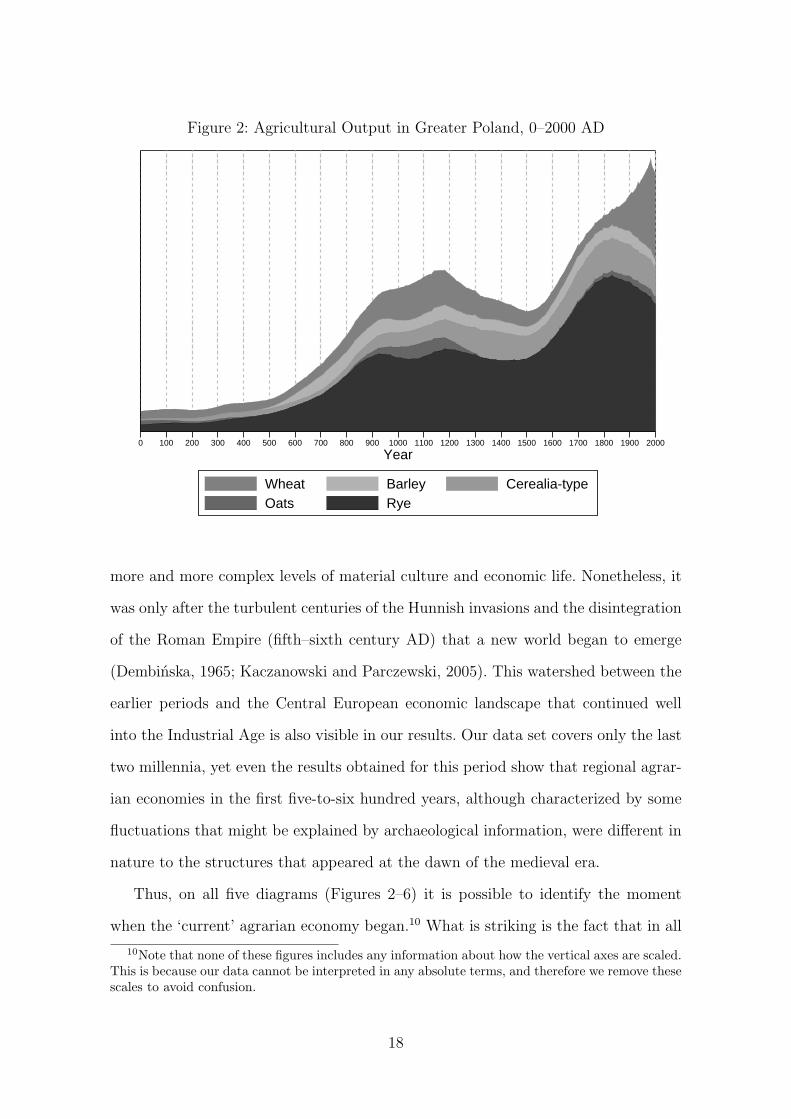
Figure 2: Agricultural Output in Greater Poland, 0–2000 AD
0 100 200 300 400 500 600 700 800 900 1000 1100 1200 1300 1400 1500 1600 1700 1800 1900 2000
Year
Wheat Barley Cerealia-typeOats Rye
more and more complex levels of material culture and economic life. Nonetheless, it
was only after the turbulent centuries of the Hunnish invasions and the disintegration
of the Roman Empire (fifth–sixth century AD) that a new world began to emerge
(Dembińska, 1965; Kaczanowski and Parczewski, 2005). This watershed between the
earlier periods and the Central European economic landscape that continued well
into the Industrial Age is also visible in our results. Our data set covers only the last
two millennia, yet even the results obtained for this period show that regional agrar-
ian economies in the first five-to-six hundred years, although characterized by some
fluctuations that might be explained by archaeological information, were different in
nature to the structures that appeared at the dawn of the medieval era.
Thus, on all five diagrams (Figures 2–6) it is possible to identify the moment
when the ‘current’ agrarian economy began.10 What is striking is the fact that in all
10Note that none of these figures includes any information about how the vertical axes are scaled.This is because our data cannot be interpreted in any absolute terms, and therefore we remove thesescales to avoid confusion.
18
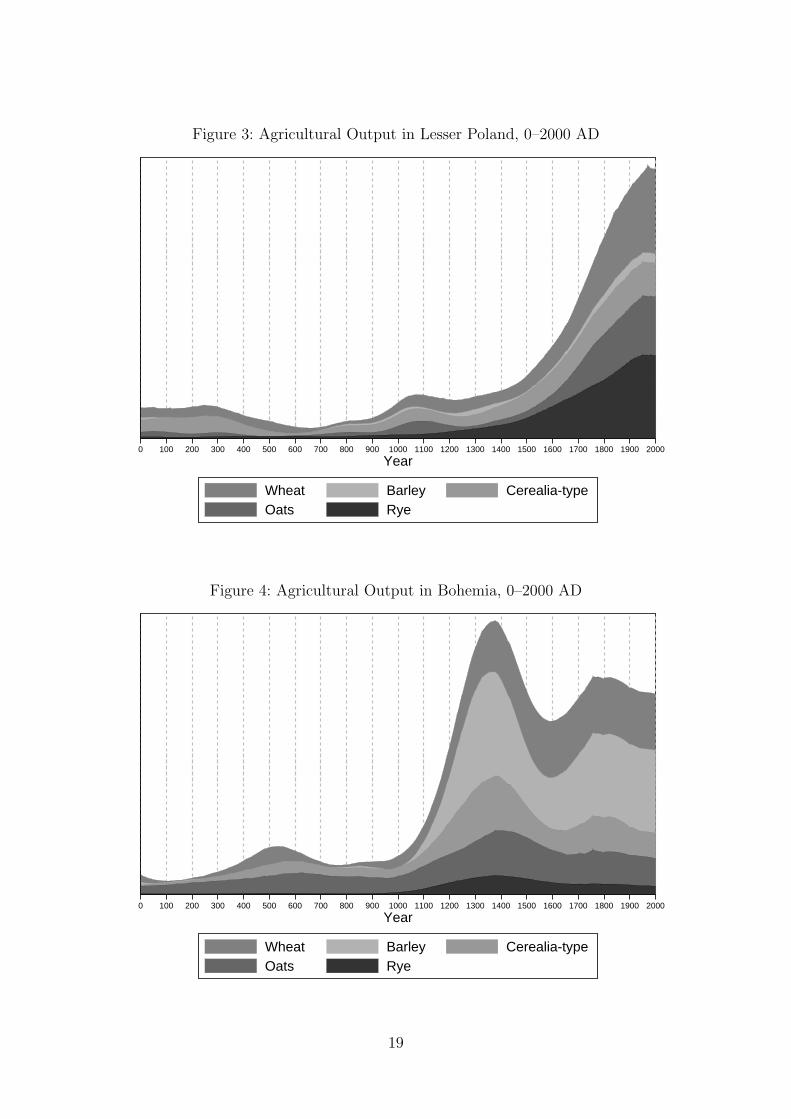
Figure 3: Agricultural Output in Lesser Poland, 0–2000 AD
0 100 200 300 400 500 600 700 800 900 1000 1100 1200 1300 1400 1500 1600 1700 1800 1900 2000
Year
Wheat Barley Cerealia-typeOats Rye
Figure 4: Agricultural Output in Bohemia, 0–2000 AD
0 100 200 300 400 500 600 700 800 900 1000 1100 1200 1300 1400 1500 1600 1700 1800 1900 2000
Year
Wheat Barley Cerealia-typeOats Rye
19

Figure 5: Agricultural Output in Brandenburg, 0–2000 AD
0 100 200 300 400 500 600 700 800 900 1000 1100 1200 1300 1400 1500 1600 1700 1800 1900 2000
Year
Wheat Barley Cerealia-typeOats Rye
Figure 6: Agricultural Output in Lower Saxony, 0–2000 AD
0 100 200 300 400 500 600 700 800 900 1000 1100 1200 1300 1400 1500 1600 1700 1800 1900 2000
Year
Wheat Barley Cerealia-typeOats Rye
20

five regions these beginnings are different – not only in terms of their chronology,
but also in terms of the scale of changes and the structure of cereal production. In
Greater Poland, there is a long period of intensive growth that begins in the first
decades of the sixth century AD (after 500) and continues at the same pace until the
middle of the tenth century. The starting point of this trend is visible not only in the
accelerated growth of the cumulative curve of cereals, but also in the appearance of
a new cereal, barley. Rye was to become another very important cereal type in this
period, and it remained so until the end of the early modern period. Its proportional
values started rising slowly even before the sixth century, but it is from this moment
onward that its expansion becomes particularly intensive. Interestingly, whereas rye
seems to play a significant role in the rapid expansion of Greater Poland’s agrarian
economy until its stabilization in the tenth century, other cereals appear to have had
specific periods of expansion. Thus, the appearance and growth of barley’s share in
the structure of cereals characterized the first phase of the early medieval agrarian
expansion in Greater Poland, whereas wheat and oats can be considered the cereals
of the second phase. The latter were introduced from the ninth century onward,
which is also the period during which the values of wheat started to rise. The entire
era of the accelerated early medieval growth comes to a halt in the first half of the
tenth century, exactly before the Piast dynasty – based in this very region – managed
to create a permanent polity that later became the Polish state (Buko, 2006). The
coincidence of these events leads to two important observations. On one hand, the
formation of state structures clearly followed a long period of intensive economic
growth; on the other, these political processes took place exactly at the time when
the region’s economy experienced transition to a proper medieval form, characterized
by markedly different trends.
The mountainous hinterland of Lesser Poland offers a good comparison for the
pattern of growth visible in Greater Poland (intensive economic growth followed by
stabilization relating to the formation of a state), as it presents a totally different
21
scenario. No visible growth takes place before the tenth and eleventh centuries, and
this is not surprising given both the peripheral location of the area within the early
medieval political-economic networks, as well as its unattractiveness in comparison to
the lowland areas of Lesser Poland that were gradually settled throughout the early
medieval period (Buko, 2006). Interestingly, the structure of this relatively small
agrarian economy – which seems to have developed as a result of growth in the tenth
and eleventh centuries – was dominated by wheat and oats, the two cereals that
started to gain in importance in Greater Poland during the second phase of early
medieval expansion. Surprisingly, the key cereal of Greater Poland – rye – seems
to be uncultivated in the mountains of Lesser Poland during the early Middle Ages,
although it was introduced to the region a few centuries later. This late appearance of
agrarian activity in the form of wheat and oat cultivation, however, is parallel to the
second stage of Greater Poland’s agrarian development in the early medieval era, and
suggests the adoption of similar agricultural strategies by populations which came to
the region after this type of agrarian economy had proved successful elsewhere.
As we move further south from Greater Poland, to Bohemia, the differences be-
come even more striking. The medieval economy seems to start in the ninth century,
with a slight growth in wheat values. Rye appears as late as the middle of the tenth
century, which is also when wheat stops its increase and enters a period of stabil-
ity lasting more than a century. The early tenth century is the moment when the
Premyslid dynasty formed its state in Bohemia (Matla-Kozłowska, 2008). It seems,
however, that while the development of complex political structures quickly stabi-
lized the production of wheat, it prompted the introduction of new cultivars – rye
and, even more importantly, barley – that, in a short time, transformed the relatively
small-scale early medieval agrarian economy based on wheat and oats.
The beginnings of the agrarian economy in Brandenburg, on the contrary, seem to
have followed the scenario we have already witnessed in Greater Poland. After a slight
increase in rye and barley around the sixth century – synchronous with the beginning
22
of the early medieval economic expansion in Greater Poland – the crucial period
of growth starts towards the end of the ninth century, and continues well into the
eleventh. As in Greater Poland, the two key cereals for this period are rye and barley.
Another parallel is the chronological relationship of the first agrarian expansion and
the appearance of stronger political structures. Although some Slavic polities formed
in this region in the tenth century, and again in the eleventh, they did not – for
various reasons, including the proximity of the powerful German marches – succeed
in developing lasting structures that would transform this region into the heartland
of a real state (Strzelczyk, 2002). A state was only formed as late as the first half
of the twelfth century, with the creation of the march of Brandenburg (Helbig, 1973;
Strzelczyk, 1975), and it is exactly around 1125 AD that the rapid early medieval
expansion slowed down. The phenomenon of pre-state economic growth is also visible,
though much earlier, further West in Lower Saxony. Its scale is not as impressive as
in the two other regions of the Middle European Plain, Brandenburg and Greater
Poland; nevertheless, there is no doubt that, between the sixth and eighth centuries,
a new agrarian structure developed, based – as elsewhere – on rye and barley. In
this case its stabilization also seems to correlate with the introduction of complex
political structures in this region, which occurred in the late eighth century when
Charlemagne conquered this part of Europe (Kahl, 1982).
In four out of the five analyzed regions, the early Middle Ages were a period of
substantial economic growth which laid the foundations for the agrarian economies
of Central Europe. The only real exception, the mountainous hinterlands of Lesser
Poland, followed a different path of economic development due to its peripheral loca-
tion. One may, of course, observe important differences between the various regional
scenarios. First of all, in each region the period of early medieval economic expansion
can be dated to different centuries. However, in all three of the regions located on
the Middle European Plain, the first sign of growth is visible in the sixth century;
the final ending dates have to do with political processes, which do not seem to have
23

been directly related to economic changes in the case of all three regions. Secondly,
when compared with later agrarian developments, the scale of early medieval de-
velopments varies from one region to another. Most importantly, however, the early
medieval economic expansion was taking place when the society had not yet formed
any complex political structures. Economic growth preceded the formation of state,
and the appearance of strong centers of power – either from within or from outside
– coincided with some sort of stabilization: the pace of agrarian expansion slowed
down and the structure of cereal production started to change.
5.3 The Medieval Developments
The gradual appearance of state structures in the Central European regions led to
several important changes in the conditions of economic life. First, the states intro-
duced their systems of tax extraction, often favoring one type of economic activity
over another (Lubke, 1991; Modzelewski, 2000; Gawlas, 2000; Klapste, 2012). Sec-
ond, regional economies became increasingly integrated into the pan-European socio-
economic system, with its flows of settlers, ideas, and goods. All of these processes
are reflected in the agrarian output of our regions, and it is thus worth investigating
the changing structures of cereal production, as well as the chronology and potential
historical contexts of peaks and falls in both the cumulative cereal curve and indi-
vidual cereals. This subsection will, therefore, explore when and how the medieval
agrarian economies of Central Europe achieved their climactic point, as well as the
ramifications of their late medieval crisis, if they experienced it at all.
The emergence of a state in Greater Poland did not stop the expansion of the
agrarian economy. What is most characteristic for this period, however, is not the
growth itself, but the continued transformation of the structure of cereal produc-
tion. The tenth and eleventh centuries saw a decrease in the importance of rye, and
agrarian expansion was sustained by increased production of wheat and oats. Values
of rye rose slightly in the twelfth century. The climactic point is reached relatively
24

early, at the end of the twelfth century, while the transformation of social and legal
structures within the countryside of Greater Poland continued throughout the thir-
teenth century (Wyszkowski, 2009). This would suggest that the region’s agrarian
growth was sustained by local resources and, in particular, by its own population
who cultivated new cereal fields in the agricultural land still available and, at the
same time, diversified its cultivation strategies. Interestingly, there is no sign of the
influence of German settlement on Greater Poland’s agrarian output. This accords
with the written sources which suggest that this phenomenon was not as strong in
this part of Poland as it was in the south. The later Middle Ages were a period of
considerable contraction, especially in the production of wheat (see Figure 7). Since
the population of Greater Poland did not suffer from the Black Death, explanations
of this late medieval crisis should be sought elsewhere. If one focuses more closely on
the very area in which the majority of Greater Poland’s pollen sites are located, one
may discover that a key factor contributing to the late medieval crisis was warfare.
The worst period of crisis coincides with the decades of wars between the Teutonic
order and Polish kings. The eastern part of Greater Poland was very close to both
Pomerania and Kuyavia, the regions in which most of the warfare took place (Biskup,
1993). The wars ended in 1466, and it was soon afterward that the period of early
modern agrarian growth began.
In the southern part of Lesser Poland, the Middle Ages witnessed a slow but stable
growth in the values of rye as well as a period in the twelfth-thirteenth centuries
where the presence of barley increased at the expense of oats. However, these were
minor developments compared to the enormous agrarian expansion that started in
the fifteenth century, and accelerated during the early modern period. In comparison
with the economic fluctuations in Greater Poland, the mountainous hinterlands of
Lesser Poland remained a complete periphery; this situation started to change only
at the very end of the Middle Ages, when large waves of new settlers arrived in the
area (Podraza, 1970).
25
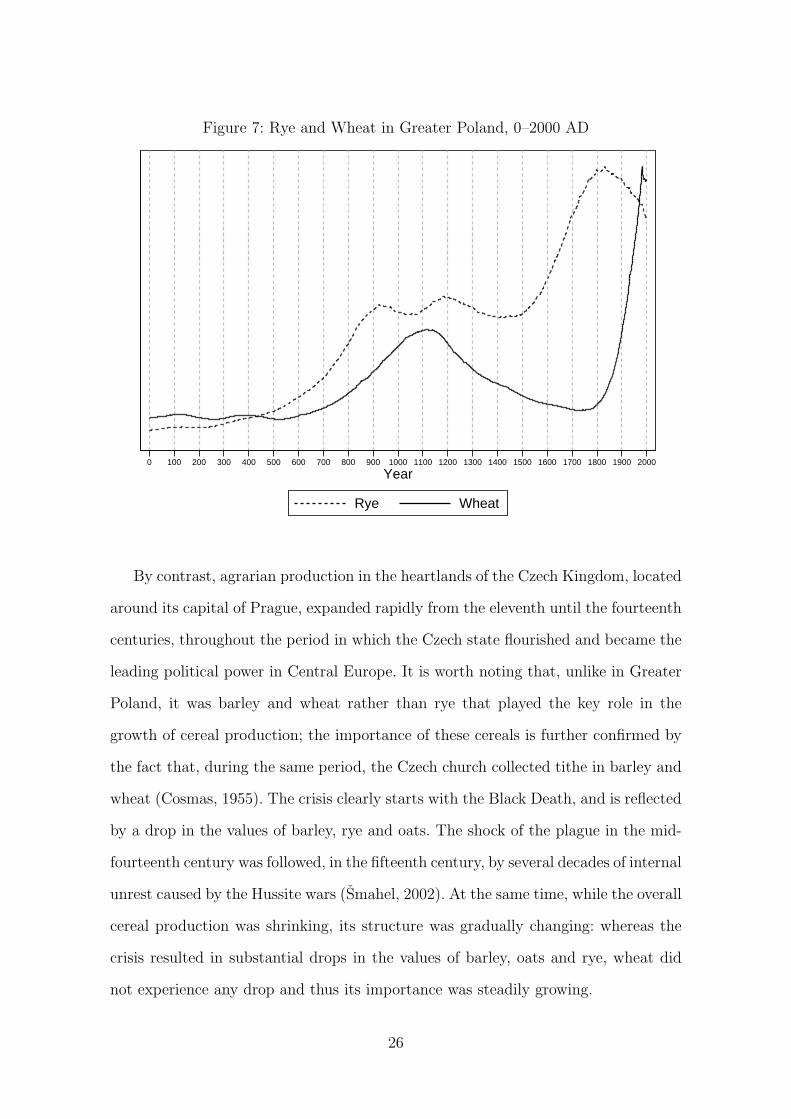
Figure 7: Rye and Wheat in Greater Poland, 0–2000 AD
0 100 200 300 400 500 600 700 800 900 1000 1100 1200 1300 1400 1500 1600 1700 1800 1900 2000
Year
Rye Wheat
By contrast, agrarian production in the heartlands of the Czech Kingdom, located
around its capital of Prague, expanded rapidly from the eleventh until the fourteenth
centuries, throughout the period in which the Czech state flourished and became the
leading political power in Central Europe. It is worth noting that, unlike in Greater
Poland, it was barley and wheat rather than rye that played the key role in the
growth of cereal production; the importance of these cereals is further confirmed by
the fact that, during the same period, the Czech church collected tithe in barley and
wheat (Cosmas, 1955). The crisis clearly starts with the Black Death, and is reflected
by a drop in the values of barley, rye and oats. The shock of the plague in the mid-
fourteenth century was followed, in the fifteenth century, by several decades of internal
unrest caused by the Hussite wars (Smahel, 2002). At the same time, while the overall
cereal production was shrinking, its structure was gradually changing: whereas the
crisis resulted in substantial drops in the values of barley, oats and rye, wheat did
not experience any drop and thus its importance was steadily growing.
26

Figure 8: Barley and Wheat in Bohemia, 0–2000 AD
0 100 200 300 400 500 600 700 800 900 1000 1100 1200 1300 1400 1500 1600 1700 1800 1900 2000
Year
Barley Wheat
The medieval developments in Brandenburg were closer to Greater Poland’s final
stage of medieval growth than to the huge expansion of agriculture that was taking
place in the heart of the Czech Kingdom. Agrarian growth continued after the cre-
ation of the March of Brandenburg, but on a much reduced scale. This would suggest
that the landscape was substantially transformed in the preceding period, and the
region’s agrarian economy may have already been close to achieving the limits of its
expansion. The German political institutions were thus built in a region that was
already relatively well-developed in terms of its agrarian production – its society and
economy were certainly not created ex nihilo. As in other areas of Central Europe,
the eleventh to the thirteenth centuries were a period of important structural trans-
formations, specifically a gradual rise in the importance of barley and wheat at the
expense of rye. As in Bohemia, the crisis coincides with the Black Death. In addition
to a sudden drop in the region’s population, there was also a decrease in the demand
for cereal production in the Netherlands, which suffered greatly from the pandemic
27

Figure 9: Barley, Rye, and Wheat in Brandenburg, 0–2000 AD
0 100 200 300 400 500 600 700 800 900 1000 1100 1200 1300 1400 1500 1600 1700 1800 1900 2000
Year
Barley Rye Wheat
and stopped importing large amounts of grain from Central Europe for more than a
century (Hoffmann, 1989).
What happened in Lower Saxony, to the west of Brandenburg, was completely
different. First, there is no sign that the Black Death had any influence on cereal
production, which reinforces the argument that the disappearance of the export op-
portunities, rather than local demographic problems, brought about the late medieval
crisis in Brandenburg. Second, while one may observe sustained growth in cereal pro-
duction – as well as the increased importance of wheat – between the tenth and the
fourteenth centuries, the major change did not occur until the fifteenth century. It
was during this time – and not a century later, as in Poland or Brandenburg – that
the transition to modernity began, and this rapid growth in agrarian output lasted
until the first decades of the seventeenth century.
While early medieval developments were, despite some chronological differences,
roughly the same across Central Europe, the later part of the medieval period – in
28

particular the last two centuries of the Middle Ages – saw the emergence of economic
divergence between the regions located to the East and the West of the Elbe. Three
of the regions located to the East – Greater Poland, Bohemia, and Brandenburg –
went through a severe late medieval crisis in agrarian production; however the data
from Lower Saxony does not show any signs of crisis during the same period (if
anything, the fourteenth century saw a decrease in barley). Moreover, a period of
accelerated growth had already started in the West when the three other Central
European economies had not even started to recover from the late medieval crisis.
5.4 The Transition to Modernity
The divergence between East and West grew even more pronounced in the early mod-
ern period, although all five regions experienced significant agrarian expansion in the
sixteenth century. In Greater Poland, trends in agricultural production reversed after
the late medieval crisis. Indeed, the second major phase in the transformation of the
region’s landscape – comparable to what happened in the early medieval period –
occurred between the sixteenth and eighteenth centuries. It was the development of
an early modern manor economy, aimed at exporting grain to the Netherlands and
other western markets, that brought about these changes (Kula, 1976). The impor-
tance of the export market as the key incentive for agrarian growth is evident in the
structure of Greater Poland’s early modern cereal production. Until the eighteenth
century, rye achieves values that are incomparably higher than those of other cereals;
by contrast the values of wheat actually decrease in the sixteenth and seventeenth
centuries. The structure of Poland’s grain export going through Gdańsk, and then
the Danish customs at the strait of Sound, is exactly the same: from the beginning
it was dominated by rye (Bang, 1933, 1945; Biernat, 1962; Narojczyk, 2007). Even
when the volume of grain export started to decrease in the seventeenth century, the
new agrarian structure was maintained and even sustained further expansion.
In Lesser Poland, the sixteenth to eighteenth centuries were the period when the
29
region’s mountainous hinterlands were colonized (Podraza, 1970). The enormous ex-
pansion of cereal production leaves no doubt in this respect: more and more land was
used for cultivation, and the landscape of Lesser Poland was completely transformed.
There are also similarities between the two Polish regions in terms of the structure
of cereal production although, in Lesser Poland, rye and wheat followed synchronous
paths of rapid growth, while in Greater Poland, wheat started to increase two cen-
turies later.
In Bohemia and Brandenburg, barley was responsible for the early modern growth,
while wheat retained or improved its position in comparison to other cereals. It is
worth noting, however, that while the early modern growth in Brandenburg starts
right at the beginning of the sixteenth century – and is thus synchronous with similar
developments in Poland – in Bohemia the period of growth started a few decades
later, which suggests that the region was still slowly recovering from the crisis of the
Hussite wars, and perhaps suffered from political instability caused by the Turkish
conquest of Hungary.
The fate of Lower Saxony was clearly different. Growth that had started in the
fifteenth century stopped in the early seventeenth century, which saw a continued
fall in the values of rye and barley, in addition to a stagnation in wheat production.
Again, this illustrates the influence of warfare on agrarian output, as this is the period
when the Thirty Years’ War caused huge damage and population loss across northern
Germany (Rabb, 1962). Agrarian growth reappeared in the later seventeenth century,
although this time it was restricted to wheat, whose values continued to grow at least
until the end of the nineteenth century.
Apart from providing new evidence and illustrating regional economic histories,
our results also show the emergence of different types of divergence within Central
Europe. Thus, reducing the interpretation of these agrarian developments solely to
the East-West dichotomy ignores considerable differences between the four economies
located to the east of the Elbe. The transformation of Poland’s economy into a
30

system dominated by export is clearly visible in pollen data from Greater and Lesser
Poland. Agrarian transformation on such a huge scale, however, did not take place in
Brandenburg or Bohemia, which is not surprising given the fact that the same export
opportunities were not at work in these regions. Thus, apart from the divergence
between the West (represented here only by Lower Saxony) and the East, we have
another divergence – between Poland (or rather, the economic system of the Polish-
Lithuanian Commonwealth) and the rest of Central Europe. Apart from the scale
of the early modern growth, the two Polish regions also differ from Bohemia and
Brandenburg in the structure of their cereal production. Whereas, in all four regions,
rye was the key cereal of the Middle Ages – in particular of the first, early medieval
expansion – in Bohemia and Brandenburg its values had stabilized by the late Middle
Ages; in Poland, however, rye was the cereal that drove the second, early modern
phase of agrarian expansion, and wheat only started gaining in importance as late as
the eighteenth century. Given the fact that environmental differences do not overlap
with this ‘cereal divergence’, explanations should be sought elsewhere than just in
ecological factors.
6 Summary
In this paper we have introduced palynological data as an alternative “biological
measure” which can serve as a useful proxy for human activity. Palynologists routinely
collect and analyze data about proportions of pollen grains of various plant taxa which
are preserved in the bottom sediments of various water basins. This information
allows them to study local histories in the neighborhood of a given site. In this
paper we have taken this approach one step further and developed new methods to
aggregate this local data intro regional trends. We have then collected a large data
set of 36 pollen sites in Central Europe and used our methods to investigate long-
term variation in agricultural output in Greater Poland, Lesser Poland, Bohemia,
Brandenburg, and Lower Saxony since the first century AD, distinguishing between
31

trends in the relative presence of barley, oats, rye, and wheat.
This analysis enables us to provide an interesting historical interpretation of the
economic history of Central Europe. We demonstrate how in all our regions – except
for the peripheral mountainous hinterland of Lesser Poland – agrarian economies
went through initial phases of medieval development in similar ways, until the for-
mation of state structures brought about a degree of stability. In the later part of
the Middle Ages, however, the first structural differences between the East and the
West started to occur. While the period of rapid ‘early modern’ growth had already
started in Lower Saxony by the fifteenth century, that same century saw the cul-
mination of late medieval decline in agricultural output in Brandenburg, Greater
Poland, and Bohemia. The early modern period saw further structural differentia-
tion among the agrarian economies of Central Europe. In both regions located in the
Polish-Lithuanian Commonwealth, Greater and Lesser Poland, large-scale agrarian
expansion (primarily in rye) started in the sixteenth century and continued for the
next two centuries. Bohemia and Brandenburg, although they also experienced some
early modern growth, did not undergo structural transformation on a scale compara-
ble to the processes that took place in Poland. In this way, our results prove capable
of not only providing reconstructions of regional agrarian histories over the very long
term, but also of tracing the agricultural origins of modern economic divergences
within Central Europe.
32
References
Acemoglu, D. and Zilibotti, F. (1997). Was Prometheus unbound by chance? Risk,
diversification, and growth. Journal of Political Economy, 105:709–751.
Agnihotri, M. S. and Singh, B. P. (1975). Pollen production and allergenic significance
of some grasses around Lucknow. Journal of Palynology, 11:151–154.
Allen, R. C. (2000). Economic structure and agricultural productivity in Europe,
1300–1800. European Review of Economic History, 4:1–26.
Allen, R. C. (2009). Agricultural productivity and rural incomes in England and the
Yangtze Delta, c.1620–c.1820. Economic History Review, 62:525–550.
Anderson, J. E. (1979). A theoretical foundation for the gravity equation. American
Economic Review, 69:106–116.
Anderson, J. E. and van Wincoop, E. (2003). Gravity with gravitas: A solution to
the border puzzle. American Economic Review, 93:170–192.
Andrade, A., Valdeolmillos, A., and Ruiz, B. (1994). Modern pollen spectra and
contemporary vegetation in the Paramera mountain range (Avila, Spain). Review
of Palaeobotany and Palynology, 82:129–139.
Austin, D. F. (2006). Fox-tail millets (Setaria: Poaceae) – abandoned food in two
hemispheres. Economic Botany, 60:143–158.
Austin, G., Baten, J., and van Leeuwen, B. (2012). The biological standard of living in
early nineteenth-century West Africa: New anthropometric evidence for northern
Ghana and Burkina Faso. Economic History Review, 65:1280–1302.
Bang, N. E. (1933). Tabeller over skibsfart og varetransport gennem Øresund 1497–
1660. Otto Harrassowitz.
33

Bang, N. E. (1945). Tabeller over skibsfart og varetransport gennem Øresund 1661–
1783 og gennem Strebælt 1701–1748. Otto Harrassowitz.
Baten, J., Ma, D., Morgan, S., and Wang, Q. (2010). Evolution of living standards
and human capital in China in the 18–20th centuries: Evidences from real wages,
age-heaping, and anthropometrics. Explorations in Economic History, 47:347–359.
Baten, J. and Murray, J. E. (2000). Heights of men and women in 19th-century
Bavaria: Economic, nutritional, and disease influences. Explorations in Economic
History, 37:351–369.
Behre, K.-E. (1976). Pollenanalytische Untersuchungen zur Vegetations- und Sied-
lungsgeschichte bei Flogeln und im Ahlenmoor (Elb-Weser-Winkel). Probleme der
Kustenforschung im sudlichen Nordseegebiet, 11:101–118.
Behre, K.-E. (1981). The interpretation of anthropogenic indicators in pollen dia-
grams. Pollen et Spores, 23:225–245.
Biernat, C. (1962). Statystyka obrotu towarowego Gdańska w latach 1651–1815.
Państwowe Wydawnictwo Naukowe.
Biskup, M. (1993). Wojny Polski z Zakonem Krzyżackim: 1308–1521. Marpress.
Bjorck, S. and Wohlfarth, B. (2001). 14C chronostratigraphic techniques in paleolim-
nology. In Last, W. M. and Smol, J. P., editors, Tracking Environmental Change
Using Lake Sediments. Kluwer Academic Publishers.
Blaauw, M. (2010). Methods and code for ‘classical’ age-modelling of radiocarbon
sequences. Quaternary Geochronology, 5:512–518.
Brainerd, E. (2010). Reassessing the standard of living in the Soviet Union: An
analysis using archival and anthropometric data. Journal of Economic History,
70:83–117.
34
Buko, A. (2006). Archeologia Polski wczesnośredniowiecznej: Odkrycia, hipotezy, in-
terpretacje. Wydawnictwo Trio.
Brızova, E. (1999). Late Glacial and Holocene development of the vegetation in the
Labe (Elbe) river flood-plain (central Bohemia, Czech Republic). Acta Palaeob-
otanica Suppl., 2:549–554.
Campbell, B. M. S. and Ó Grada, C. (2011). Harvest shortfalls, grain prices, and
famines in preindustrial England. Journal of Economic History, 71:859–886.
Chen, S.-H. (1988). Neue Untersuchungen uber die spat- und postglaziale Vegeta-
tionsgeschichte im Gebiet zwischen Harz und Leine (BRD). Flora, 181:147–177.
Clark, G. (1991). Yields per acre in English agriculture, 1250–1860: Evidence from
labour inputs. Economic History Review, 44:445–460.
Cosmas (1955). Die Chronik der Bohmen des Cosmas von Prag. Weidmannsche
Verlagsbuchhandlung.
Dıaz, P. M. (1994). Relations between modern pollen rain and mediterranean vege-
tation in Sierra Madrona (Spain). Review of Palaeobotany and Palynology, 82:113–
125.
Dembińska, M. (1965). Z problematyki badań nad strukturą upraw niektórych zbóż
w I tysiącleciu n.e. Archeologia Polski, 10:276–304.
Dorfler, W. (1989). Pollenanalytische Untersuchungen zur Vegetations- und Sied-
lungsgeschichte im Suden des Landkreises Cuxhaven, Niedersachsen. Probleme der
Kustenforschung im sudlichen Nordseegebiet, 17:1–75.
Eastwood, W. J. (2005). Palaeoecology and eastern Mediterranean landscapes: The-
oretical and practical approaches. In Haldon, J. F., editor, General Issues in the
Study of Medieval Logistics: Sources, Problems and Methodologies. Brill.
35

Favre, E., Escarguel, G., Suc, J.-P., Vidal, G., and Thevenod, L. (2008). A contri-
bution to deciphering the meaning of AP/NAP with respect to vegetation cover.
Review of Palaeobotany and Palynology, 148:13–35.
Federico, G. and Malanima, P. (2004). Progress, decline, growth: Product and pro-
ductivity in Italian agriculture, 1000–2000. Economic History Review, 57:437–464.
Feeser, I. and Furholt, M. (2013). Ritual and economic activity during the Neolithic
in Schleswig-Holstein, northern Germany: An approach to combine archaeological
and palynological evidence. Journal of Archaeological Science, forthcoming.
Fyfe, R., Roberts, N., and Woodbridge, J. (2010). A pollen-based pseudobiomisation
approach to anthropogenic land-cover change. Holocene, 20:1165–1171.
Fyfe, R. M., de Beaulieu, J.-L., Binney, H., Bradshaw, R. H. W., Brewer, S., Le Flao,
A., Finsinger, W., Gaillard, M.-J., Giesecke, T., Gil-Romera, G., Grimm, E. C.,
Huntley, B., Kunes, P., Kuhl, N., Leydet, M., Lotter, A. F., Tarasov, P. E., and
Tonkov, S. (2009). The European Pollen Database: Past efforts and current activ-
ities. Vegetation History and Archaeobotany, 18:417–424.
Gaillard, M.-J., Sugita, S., Bunting, M. J., Middleton, R., Brostrom, A., Caseldine,
C., Giesecke, T., Hellman, S. E. V., Hicks, S., Hjelle, K., Langdon, C., Nielsen, A.-
B., Poska, A., von Stedingk, H., Veski, S., and POLLANDCAL members (2008).
The use of modelling and simulation approach in reconstructing past landscapes
from fossil pollen data: A review and results from the POLLANDCAL network.
Vegetation History and Archaeobotany, 17:419–443.
Galor, O. and Moav, O. (2002). Natural selection and the origin of economic growth.
Quarterly Journal of Economics, 117:1133–1191.
Galor, O. and Weil, D. N. (2000). Population, technology, and growth: From Malthu-
sian stagnation to the demographic transition and beyond. American Economic
Review, 90:806–828.
36

Gawlas, S. (2000). O kształt zjednoczonego Królestwa: Niemieckie władztwo terytori-
alne a geneza społeczno-ustrojowej odrębności Polski. Wydawnictwo DiG.
Giesecke, T. (2000). Pollenanalytische und sedimentchemische Untersuchungen zur
naturlichen und anthropogenen Geschichte im Schlaubetal. Sitzungsberichte der
Gesellschaft Naturforschender Freunde zu Berlin, 39:89–112.
Goodfriend, M. and McDermott, J. (1995). Early development. American Economic
Review, 85:116–133.
Hanley, N., Tinch, D., Angelopoulos, K., Davies, A., Barbier, E. B., and Watson, F.
(2009). What drives long-run biodiversity change? New insights from combining
economics, palaeoecology and environmental history. Journal of Environmental
Economics and Management, 57:5–20.
Hansen, G. D. and Prescott, E. C. (2002). Malthus to Solow. American Economic
Review, 92:1205–1217.
Helbig, H. (1973). Gesellschaft und Wirtschaft der Mark Brandenburg im Mittelalter.
Walter de Gruyter.
Hellman, S., Bunting, M. J., and Gaillard, M.-J. (2009). Relevant Source Area of
Pollen in patchy cultural landscapes and signals of anthropogenic landscape dis-
turbance in the pollen record: A simulation approach. Review of Palaeobotany and
Palynology, 153:245–258.
Hellman, S., Gaillard, M.-J., Brostrom, A., and Sugita, S. (2008). The REVEALS
model, a new tool to estimate past regional plant abundance from pollen data
in large lakes: Validation in southern Sweden. Journal of Quaternary Science,
23:21–42.
Hodrick, R. J. and Prescott, E. C. (1997). Postwar U.S. business cycles: An empirical
investigation. Journal of Money, Credit, and Banking, 29:1–16.
37
Hoffmann, R. C. (1989). Land, Liberties, and Lordship in a Late Medieval Coun-
tryside: Agrarian Structures and Change in the Duchy of Wrocław. University of
Pennsylvania Press.
Izdebski, A. (2013). A Rural Economy in Transition: Asia Minor from Late Antiquity
into the Early Middle Ages. Taubenschlag Foundation.
Izdebski, A., Koloch, G., Słoczyński, T., and Tycner-Wolicka, M. (2014). Przemiany
strukturalne w gospodarce Polski i Europy Środkowej w epoce przednowoczesnej
– analiza danych palinologicznych. Unpublished.
Jahns, S. (1999a). Ein holozanes Pollendiagramm vom Kleinen Mochowsee, nordliche
Niederlausitz. Gleditschia, 27:45–56.
Jahns, S. (1999b). Pollenanalytische Untersuchungen am Großen Krebssee, Ostbran-
denburg: Ein Beitrag zur Siedlungs- und Vegetationsgeschichte der Neuenhagener
Oderinsel. Germania, 77:637–659.
Jahns, S. (2000). Late-glacial and Holocene woodland dynamics and land-use history
of the Lower Oder valley, north-eastern Germany, based on two, AMS14C-dated,
pollen profiles. Vegetation History and Archaeobotany, 9:111–123.
Jahns, S. (2006). The later Holocene history of vegetation, land-use and settlements
around the Ahlequellmoor in the Solling area, Germany. Vegetation History and
Archaeobotany, 15:57–63.
Jahns, S. (2007). Palynological investigations into the Late Pleistocene and Holocene
history of vegetation and settlement at the Loddigsee, Mecklenburg, Germany.
Vegetation History and Archaeobotany, 16:157–169.
Kaczanowski, P. and Parczewski, M., editors (2005). Archeologia o początkach
Słowian: Materiały z konferencji, Kraków, 19–21 listopada 2001. Księgarnia Aka-
demicka.
38

Kahl, H.-D. (1982). Karl der Große und die Sachsen: Stufe und Motive einer
historischen “Eskalation”. In Ludat, H. and Schwinges, R. C., editors, Politik,
Gesellschaft, Geschichtsschreibung: Giessener Festgabe fur Frantisek Graus zum
60. Geburtstag. Bohlau.
Kelly, M. (2001). Linkages, thresholds, and development. Journal of Economic
Growth, 6:39–53.
Kelly, M. and Ó Grada, C. (2013). Numerare est errare: Agricultural output and
food supply in England before and during the Industrial Revolution. Journal of
Economic History, 73:1132–1163.
Kogel, T. and Prskawetz, A. (2001). Agricultural productivity growth and escape
from the Malthusian trap. Journal of Economic Growth, 6:337–357.
Kuhl, N. (1998). Pollenanalytische Untersuchungen zur Vegetations- und Siedlungs-
geschichte in einem Kesselmoor bei Drangstedt, Ldkr. Cuxhaven. Probleme der
Kustenforschung im sudlichen Nordseegebiet, 25:303–324.
Klapste, J. (2012). The Czech Lands in Medieval Transformation. Brill.
Kołaczek, P., Fiałkiewicz-Kozieł, B., Karpińska-Kołaczek, M., and Gałka, M. (2010).
The last two millennia of vegetation development and human activity in the Orawa-
Nowy Targ Basin (south-eastern Poland). Acta Palaeobotanica, 50:133–148.
Koepke, N. and Baten, J. (2005). The biological standard of living in Europe during
the last two millennia. European Review of Economic History, 9:61–95.
Koepke, N. and Baten, J. (2008). Agricultural specialization and height in ancient
and medieval Europe. Explorations in Economic History, 45:127–146.
Komlos, J. (2007). Anthropometric evidence on economic growth, biological well-
being and regional convergence in the Habsburg Monarchy, c. 1850–1910. Cliomet-
rica, 1:211–237.
39
Komlos, J., Hau, M., and Bourguinat, N. (2003). An anthropometric history of
early-modern France. European Review of Economic History, 7:159–189.
Kula, W. (1976). An Economic Theory of the Feudal System: Towards a Model of
the Polish Economy, 1500–1800. N.L.B.
Kunes, P., Abraham, V., Kovarık, O., Kopecky, M., Brızova, E., Dudova, L.,
Jankovska, V., Knipping, M., Kozakova, R., Novakova, K., Petr, L., Pokorny, P.,
Roszkova, A., Rybnıckova, E., Svobodova-Svitavska, H., and Wacnik, A. (2009).
Czech Quaternary Palynological Database – PALYCZ: Review and basic statistics
of the data. Preslia, 81:209–238.
Lagerlof, N.-P. (2003). From Malthus to modern growth: Can epidemics explain the
three regimes? International Economic Review, 44:755–777.
Lubke, C. (1991). Arbeit und Wirtschaft im ostlichen Mitteleuropa: Die Spezial-
isierung menschlicher Tatigkeit im Spiegel der hochmittelalterlichen Toponymie in
den Herrschaftsgebieten von Piasten, Premysliden und Arpaden. Franz Steiner
Verlag.
Smahel, F. (2002). Die Hussitische Revolution. Hahnsche Buchhandlung.
Makohonienko, M. (1991). Materiały do postglacjalnej historii roślinności okolic Led-
nicy. Część II: Badania palinologiczne osadów Jeziora Lednickiego – rdzeń I/86 i
Wal/87. In Tobolski, K., editor, Wstęp do paleoekologii Lednickiego Parku Krajo-
brazowego. Wydawnictwo Naukowe Uniwersytetu im. Adama Mickiewicza.
Makohonienko, M. (2000). Przyrodnicza historia Gniezna. Homini.
Marinval, P. (1992). Archaeobotanical data on millets (Panicum miliaceum and
Setaria italica) in France. Review of Palaeobotany and Palynology, 73:259–270.
Matla-Kozłowska, M. (2008). Pierwsi Przemyślidzi i ich państwo (od X do połowy
40

XI wieku): Eskpansja terytorialna i jej polityczne uwarunkowania. Wydawnictwo
Poznańskie.
Milecka, K. (1998). Historia działalności człowieka w okolicach Giecza i Wagowa w
świetle analizy pyłkowej. In Tobolski, K., editor, Biblioteka Studiów Lednickich,
volume 3. Muzeum Pierwszych Piastów na Lednicy.
Modzelewski, K. (2000). Organizacja gospodarcza państwa piastowskiego: X–XIII
wiek. Wydawnictwo Poznańskiego Towarzystwa Przyjaciół Nauk.
Narojczyk, K. (2007). Żegluga i handel bałtycki w świetle Tabel Cła Sundzkiego (1557–
1783): Studium źródłoznawcze. Polskie Towarzystwo Historyczne.
Obidowicz, A. (1990). Eine pollennanalytische und moorkundliche Studie zur Veg-
etationsgeschichte des Podhale-Gebietes (West-Karpaten). Acta Palaeobotanica,
30:147–219.
O’Brien, P. K. and Prados de la Escosura, L. (1992). Agricultural productivity and
European industrialization, 1890–1980. Economic History Review, 45:514–536.
Olmstead, A. L. and Rhode, P. W. (2002). The Red Queen and the Hard Reds:
Productivity growth in American wheat, 1800–1940. Journal of Economic History,
62:929–966.
Piotrowska, K. (2008). Pollen production in selected species of anemophilous plants.
Acta Agrobotanica, 61:41–52.
Podraza, A. (1970). Rola gospodarcza Małopolski w okresie od XVI do XVIII wieku.
In Bobińska, C., editor, Kraków i Małopolska przez dzieje: Studia i szkice profe-
sorów Uniwersytetu Jagiellońskiego. Wydawnictwo Literackie.
Pohl, F. (1937). Die Pollenerzeugung der Windbluter. Beihefte zum Botanischen
Centralblatt, 56A:365–470.
41

Pokorny, P. (2005). Role of man in the development of Holocene vegetation in Central
Bohemia. Preslia, 77:113–128.
Pokorny, P. (2011). Neklidne casy: Kapitoly ze spolecnych dejin prırody a lidı.
Dokoran.
Pokorny, P., Klimesova, J., and Klimes, L. (2000). Late Holocene history and veg-
etation dynamics of a floodplain alder carr: A case study from eastern Bohemia,
Czech Republic. Folia Geobotanica, 35:43–58.
Pokorny, P. and van der Knaap, W. O. (2011). 15. Brve (Czech Republic): Vegetation
development over the last about 2.5 millennia in the Bohemian Lowland close to
Prague. Grana, 50:311–313.
Pomeranz, K. (2000). The Great Divergence: Europe, China, and the Making of the
Modern World Economy. Princeton University Press.
Rabb, T. K. (1962). The effects of the Thirty Years’ War on the German economy.
Journal of Modern History, 34:40–51.
Ralska-Jasiewiczowa, M. (1980). Late-Glacial and Holocene Vegetation of the
Bieszczady Mts. (Polish Eastern Carpathians). Państwowe Wydawnictwo
Naukowe.
Ralska-Jasiewiczowa, M. (1983). Isopollen maps for Poland: 0–11000 years B.P. New
Phytologist, 94:133–175.
Ralska-Jasiewiczowa, M., Goslar, T., Madeyska, T., and Starkel, L., editors (1998).
Lake Gościąż, Central Poland: A Monographic Study. W. Szafer Institute of
Botany. Polish Academy of Sciences.
Ralska-Jasiewiczowa, M., Latałowa, M., Wasylikowa, K., Tobolski, K., Madeyska, E.,
Wright, H. E., and Turner, C., editors (2004). Late Glacial and Holocene History
42

of Vegetation in Poland Based on Isopollen Maps. W. Szafer Institute of Botany.
Polish Academy of Sciences.
Reimer, P. J., Baillie, M. G. L., Bard, E., Bayliss, A., Beck, J. W., Blackwell, P. G.,
Bronk Ramsey, C., Buck, C. E., Burr, G. S., Edwards, R. L., Friedrich, M., Grootes,
P. M., Guilderson, T. P., Hajdas, I., Heaton, T. J., Hogg, A. G., Hughen, K. A.,
Kaiser, K. F., Kromer, B., McCormac, F. G., Manning, S. W., Reimer, R. W.,
Richards, D. A., Southon, J. R., Talamo, S., Turney, C. S. M., van der Plicht, J., and
Weyhenmeyer, C. E. (2009). IntCal09 and Marine09 radiocarbon age calibration
curves, 0–50,000 years cal BP. Radiocarbon, 51:1111–1150.
Ruas, M.-P. (1992). The archaeobotanical record of cultivated and collected plants of
economic importance from medieval sites in France. Review of Palaeobotany and
Palynology, 73:301–314.
Rybnıcek, K. and Rybnıckova, E. (1985). A palaeoecological reconstruction of precul-
tural vegetation in the intermontane basins of the Western Carpathians. Ecologia
Mediterranea, 11:27–31.
Steckel, R. H. (2003). What can be learned from skeletons that might interest
economists, historians, and other social scientists? American Economic Review:
Papers and Proceedings, 93:213–220.
Steckel, R. H. (2008). Biological measures of the standard of living. Journal of
Economic Perspectives, 22:129–152.
Steckel, R. H. (2013). Biological measures of economic history. Annual Review of
Economics, 5:401–423.
Strzelczyk, J. (1975). Brandenburgia. Książka i Wiedza.
Strzelczyk, J. (2002). Słowianie połabscy. Wydawnictwo Poznańskie.
43
Sugita, S. (1993). A model of pollen source area for an entire lake surface. Quaternary
Research, 39:239–244.
Szczepanek, K. (1987). Late-Glacial and Holocene pollen diagrams from Jasiel in the
Low Beskid Mts. (The Carpathians). Acta Palaeobotanica, 27:9–26.
Szczepanek, K. (2001). Anthropogenic vegetation changes in the region of the Dukla
Pass, the Lower Beskid Mountains. In Machnik, J., editor, Archaeology and Natural
Background of the Lower Beskid Mountains. Polska Akademia Umiejętności.
Tobolski, K. (1990). Palaookologische Untersuchungen des Siedlungsgebietes im Led-
nica Landschaftspark (Nordwestpolen). Offa, 47:109–131.
Tobolski, K. (1991). Dotychczasowy stan badań paleobotanicznych i biostraty-
graficznych Lednickiego Parku Krajobrazowego. In Tobolski, K., editor, Wstęp
do paleoekologii Lednickiego Parku Krajobrazowego. Wydawnictwo Naukowe Uni-
wersytetu im. Adama Mickiewicza.
van Zanden, J. L. (2009). The Long Road to the Industrial Revolution: The European
Economy in a Global Perspective, 1000–1800. Brill.
Vermoere, M. (2004). Holocene Vegetation History in the Territory of Sagalassos
(Southwest Turkey): A Palynological Approach. Brepols.
Vermoere, M., Vanhecke, L., Waelkens, M., and Smets, E. (2001). Modern pollen
studies in the territory of Sagalassos (Southwest Turkey) and their use in the
interpretation of a Late Holocene pollen diagram. Review of Palaeobotany and
Palynology, 114:29–56.
Voth, H.-J. and Leunig, T. (1996). Did smallpox reduce height? Stature and the
standard of living in London, 1770–1873. Economic History Review, 49:541–560.
Wacnik, A. (1995). The vegetational history of local flora and evidences of human
44
activities recorded in the pollen diagram from side Regetovka, NE Slovakia. Acta
Palaeobotanica, 35:253–274.
Webb, T. (1974). Corresponding patterns of pollen and vegetation in lower Michigan:
A comparison of quantitative data. Ecology, 55:17–28.
Willutzki, H. (1962). Zur Waldgeschichte und Vermoorung sowie uber Rekurren-
zflachen im Oberharz. Nova Acta Leopoldina, 25:1–52.
Wolters, S. (1999). Spat- und postglaziale Vegetationsentwicklung im Bereich der
Fercher Berge sudwestlich von Potsdam. Gleditschia, 27:25–44.
Wyszkowski, M. (2009). Ustrój polityczny Wielkopolski w latach 1138–1296.
Wydawnictwo Poznańskie.
45