multiyear program plan template - office of energy efficiency
TRANSCRIPT

Multiyear Program Plan Template Phase II Guidance June 30, 2006


Foreword: The Purpose and Value of a Multiyear Program Plan Multiyear Program Plans (MYPPs) are intended primarily to serve as operational guides for programs to manage their activities and as a source of information to help EERE management identify clear linkages between key program activities and progress toward goals. It is understood, however, that they are also read by a broad group of program stakeholders and may serve other purposes as well. Strategic planning in government is closely integrated with budgeting. In effective organizations, planning and strategy guide budget requests, not the other way around. Strategic planning enables programs to create logical budgets and manage their activities toward programmatic and agency goals. Multiyear program plans, which are more tactical in nature, should be closely integrated with program and EERE strategic plans. A program’s strategic plan should inform its MYPP, which in turn informs its annual operating plan (AOP). These three planning efforts should be closely linked and aligned, as illustrated in the figure below:
The MYPP should present the pathways and activities that a program will pursue over a five-year planning horizon toward achieving its goals and objectives, based on reasonable
ii

expectations of the program budget. While programs should write their MYPPs with funding assumptions in mind, they are not required to indicate those assumed funding levels in the MYPP. Programs should conduct separate scenario analyses to determine the sensitivity of their program outputs to differing budget levels. Multiyear planning enables programs to link performance outputs and outcomes to the budget process, an increasingly important requirement. With adequate planning, a program clearly defines the relationship between resource allocation decisions and the expected outputs of funded activities. A sound multiyear planning process enables programs to implement a strategy that can be adjusted over time. The MYPP provides a guide for implementing that strategy, communicates value to program stakeholders, and provides a metric for public sector accountability. Congressional, Administrative, and Departmental guidance and requirements underscore the need for effective planning. The Government Performance and Results Act (GPRA) calls for the linkage of budget requests to strategic plans. Congress has also called for five-year budget submissions that include detailed resource requirements. The President’s Management Agenda (PMA) and the Office of Management and Budget’s Program Assessment Rating Tool (PART) require program justification based on performance goals, funding links to activities, established milestones, progress measurements, and end points. In addition, the Department’s Chief Financial Officer (CFO) has increasingly used program plans in the budgetary process. Furthermore, programs should keep in mind the timing of planning, budgeting, and performance assessment activities, and their relationship to one another. An illustrative example of this linked schedule is shown below. Note that this is an adapted example from a particular program for the 2005-2006 timeframe, and is not necessarily the schedule that all programs should follow.
iii

Timing of Planning, Budgeting, GPRA and PART Activities1
GPRA baseline runs; GPRA programmatic inputs aligned with MYP and budget planning
GPRA program case runs, based on Congressional budget request
OMB PART Activity
GPRA benefits analysis
EERE FY 08 Spring Budget Summit
- FY 06 budget appropriation - FY 07 passback from OMB
Budget review and revision period. FY 07 budget to OMB.
- EERE FY 07 budget summit - FY 07 IRB formulation period. Draft budget to EERE/CFO
Nomination of issues to be considered at EERE Budget Summit
Budget Cycle
MYPP update Outcomes: Improved MYPP that serves as basis for FY 08 budget & FY07 AOP. Updated MYPP may also suggest issues for FY 08 budget formulation
Program Review Period Outcome: Program reviews that incorporate peer review findings and provide basis for MYPP update. FY 06
MYPP Update Workshop Outcome: Priority-based action plan for MYPP update.
First draft of revised MYPP prepared in EERE format. MYPP reviewed and revised, for submission to EERE. Outcome: Completed Draft MYPP that provides framework for final decisions for FY 06 AOP & FY 07 IRB. Also serves as the basic reference for PART.
Program MYPP Integration Workshop Outcome: Identified priorities for MYPP improvement and foundational analyses
Program Planning
Jan– Apr 2006 Oct - Dec July - Sept. April – June Jan – Mar 2005
Final GPRA runs & documentation published
Planned Go/No-Go decisions on key projects
Final GPRA modeling changes to program cases, based on OMB passback & appeals; Final GPRA documentation
Go/no-go decision on technology pathway A
Next PART submission will be for FY07
1 1 Illustrative table adapted from planning table developed by the Buildings Technologies Program for the 2006 Strategic Technical Review (STR).
iv

v

Multiyear Program Plan Template: At a Glance This Multiyear Program Plan (MYPP) Template provides guidance to EERE programs on developing effective program plans. It provides a general framework for multiyear planning, and includes the rationale for the various sections to be included in the MYPP. This Phase II Guidance is an update to the Phase I guidance released in January 2005. The revisions to this MYPP guidance are based on extensive interviews with each of EERE’s technology development (TD) programs and selected staff from the Office of Planning, Budget, and Analysis (PBA). The results of the Strategic Technical Review (STR) meetings, held by the TD Deputy Assistant Secretary for each of the TD programs in the fall of 2005, also informed the decision to make these revisions. PBA took the lead in making the template modifications and working with a review group (Douglas Goodman, PBA; David Rodgers, Building Technologies Program; and JoAnn Milliken, Hydrogen, Fuel Cells, and Infrastructure Technologies Program) to finalize the MYPP Template. It is understood that EERE programs need flexibility in developing their MYPPs. On the other hand, flexibility must be balanced with the need for consistency across EERE that enables the reader to understand how the programs are unique parts of an integrated organization. Efforts have been made in this Phase II guidance to address any redundancies or shortcomings found in the Phase I guidance and to give programs more flexibility in certain sections of the MYPP while striving to maintain a consistent MYPP scope across all programs. While programs should strive to adhere to the guidance presented in this template, they should also feel free to add additional components to their MYPPs not specifically called for in this template where they feel appropriate. Some of the changes made in this Phase II guidance include the following:
• An Executive Summary has been added in which programs can give a succinct overview of their MYPPs in one or two pages.
• The Program Overview section has been streamlined to reduce redundancies with the Technology Research, Development, and/or Deployment Plan section. The Program Overview also includes a new subsection on program logic that demonstrates how the program’s designed structure will apply resources to produce outputs and achieve intended outcomes consistent with the goals, vision, and mission.
• The Technology Research, Development, and/or Deployment Plan section gives programs more flexibility in the manner in which they present their technical plans. Specifically, programs are given the option of describing each program element or subprogram separately (as was required in the Phase I guidance) or using a more cross-cutting approach in cases where program elements are closely linked (e.g. they share similar goals, market barriers, etc.). Programs are also encouraged to include a rolled-up summary of program milestones, decision points, and critical paths at the beginning of this section before going into each of the program elements. Also, a subsection on cross-cutting issues that includes communications and outreach has been added to this section.
vi

Finally, this section now directly follows the Program Overview, making it the focal point of the document.
• The Program Portfolio Management section (now the final section in the template) replaces what was called Program Critical Functions in the Phase I guidance. It gives a more cohesive picture of the planning, analysis, and evaluation activities conducted by the programs and puts these activities within a multiyear planning framework.
• The Program Administration section from the Phase I guidance has been eliminated, with one element (communications and outreach) moved to Technology Research, Development, and/or Deployment Plan. This section was moved because communications and outreach are parts of a program’s approach and not administrative functions.
• Examples from past MYPPs that are representative of the sections called for in this guidance have been moved to an Appendix. The examples can be accessed through hyperlinks that are embedded in the relevant sections of the guidance.
This MYPP guidance is laid out in the following order: Executive Summary; Program Overview; Technology Research, Development and/or Deployment Plan; and Program Portfolio Management, followed by appendices that include sample sections from past MYPPs, a glossary, MYPP Drivers, and a guide to assist programs in developing logic diagrams. A brief overview of what should be included in each section of a program’s MYPP is summarized below. Executive Summary The Executive Summary should succinctly summarize the key components of the MYPP in one to two pages. It should briefly introduce the program, its goals and its structure, and should give an overview of the program’s portfolio, highlighting the program’s approach, major targets and critical paths. The Executive Summary should provide a general overview of what type of R&D and/or deployment/market penetration activities the program is pursuing over the next five years and why those activities are important. Programs are encouraged to include a Gantt chart in the Executive Summary that summarizes major programmatic milestones and decision points. Section 1: Program Overview The Program Overview provides an introduction to the program, including an examination of the external context and market in which the program operates, the program’s history, the reason for funding a Federal program in this area, as well as the program’s mission, vision, and goals. This section also describes the logic of the program, that is, how the program’s designed structure will apply resources to produce outputs and achieve intended outcomes consistent with the vision, mission, and goals. Section 2: Technology Research, Development, and/or Deployment Plan This section presents the technical plan for both R&D and deployment programs as the level of detail of the MYPP shifts from the program level to the element or subprogram level. Some programs may choose to write a separate technical plan for each program element or subprogram, in which the details of each program element will be examined as if each were a separate program with goals, approaches, markets, challenges and barriers, and the related tasks, milestones and decision points addressed for each element. This deeper examination is especially
vii

helpful to those programs whose activities range across a wide variety of areas and who find it difficult to “roll up” activities into broad, program-level descriptions. Other programs whose various program elements are closely linked or share similar issues may find it more cumbersome or repetitive to write a separate section for each element that addresses goals, barriers, and strategies. Such programs may opt to address these issues in a more cross-cutting fashion as they see fit. Programs are strongly encouraged to use Gantt charts to illustrate milestones and decision points. Section 3: Program Portfolio Management This section describes how the program develops and manages its portfolio of research, development, and/or deployment activities. It identifies planned activities for portfolio management functions including portfolio decision making, analysis, performance assessment, and data collection to support performance assessment and describes how those functions inform one another. The detailed results of current portfolio management activities can be provided in the Technology Research, Development, and/or Deployment Plan in Section 2, whereas plans for such activities should discussed in this section (Section 3). Appendix A: Examples from Past Multiyear Program Plans Where available, hyperlinks to representative examples from past MYPPs are included throughout the template as a reference for programs in developing their MYPPs. The hyperlinks embedded throughout this MYPP guidance connect directly to examples listed in Appendix A and vice-versa. Appendix B: Glossary A glossary of key terms used in this guidance is included in Appendix B. Appendix C: MYPP Drivers Appendix C provides a brief overview of some of the drivers for the MYPP. Appendix D: Logic Diagram Development Guide Appendix D explains the scope and purpose of a logic diagram and includes a step-by-step development process.
viii

ix
Table of Contents Foreword: The Purpose and Value of a Multiyear Program Plan ii Multiyear Program Plan Template: At a Glance vi Executive Summary 1 1.0 Program Overview 3
1.1 MARKET OVERVIEW AND FEDERAL ROLE OF THE PROGRAM 3 1.2 PROGRAM VISION 4 1.3 PROGRAM MISSION 4 1.4 PROGRAM DESIGN 5
1.4.1 Program Structure 5 1.4.2 Program Logic 6 1.4.3 Relationship to Other Federal Programs 8
1.5. PROGRAM GOALS AND MULTIYEAR TARGETS 9 2.0 Technology Research, Development, and/or Deployment Plan 13
2.1 ELEMENT/SUBPROGRAM LEVEL PLAN 14 2.1.1 Element/Subprogram Support of Program Strategic Goals 14 2.1.2 Element/Subprogram Support of Program Performance Goals 15 2.1.3 Element/Subprogram Market Challenges and Barriers 15 2.1.4 Element/Subprogram Technical (Non-Market) Challenges and Barriers 16 2.1.5 Element/Subprogram Approach/Strategies for Overcoming Challenges and Barriers 16 2.1.6 Element/Subprogram Milestones and Decision Points 17
2.2 CROSS-CUTTING ISSUES 19 2.2.1 Communication and Outreach 19 2.2.2 Other Cross-Cutting Issues 19
3.0 Program Portfolio Management 21 3.1 PROGRAM PORTFOLIO MANAGEMENT PROCESS 21 3.2 PROGRAM ANALYSIS* 24 3.3 PERFORMANCE ASSESSMENT 25
3.3.1 Performance Assessment Strategy and Plan 26 3.3.2 Data Collection to Support Routine and Periodic Performance Assessment 30
Appendix A: Examples from Past Multiyear Program Plans 31 Appendix B: Glossary 40 Appendix C: MYPP Drivers 45 Appendix D: Logic Diagram Development Guide 46
x

xi

Executive Summary The Executive Summary of the Multiyear Program Plan (MYPP) should succinctly summarize the key components of the MYPP in one or two pages. It should briefly introduce the program, its goals and its structure, and should give an overview of the program’s portfolio, highlighting the program’s approach, major targets and critical paths. Programs are encouraged to include a Gantt chart in the Executive Summary that summarizes major programmatic milestones and decision points. After reading the Executive Summary, the audience should have a general understanding of what type of research and development (R&D) and/or deployment/market penetration activities the program is pursuing over the next five years and why those activities are important.
1

2

1.0 Program Overview The Program Overview provides an introduction to the program, including an examination of the external context and market in which the program operates, the program’s history, the reason for funding a Federal program in this area, as well as the program’s mission, vision, and goals. This section also describes the logic of the program: how the program will apply resources to produce outputs that, in conjunction with its stakeholders, will achieve intended outcomes consistent with the mission, vision, and goals. This section sets the stage for the technology research and development (R&D) and/or deployment plan in Section 2 and the examination of the program’s portfolio management functions and processes in Section 3.
1.1 Market Overview and Federal Role of the Program This subsection provides the business and historical context in which the program operates, including discussion of the market and the need for a Federal program, and the role of the program within EERE. Discussion should include a broad overview of the market, national and state political environment, and international situation. Include a brief description of market barriers that occur at the program level. This allows the program to address external issues that help to explain the program logic (described in Section 1.4) and that influence program strategy. A brief rationale for targeting particular market segments may be provided. Details of barriers that affect specific technologies, as well as the program’s strategies to overcome them, will be addressed in Section 2 (Technology Research and Development and/or Deployment Plan). Discussion should also include a brief history of public efforts and a justification for a Federal program in this area.
Key Components • Overview of current and potential markets • Overview of state, local and international political environment • Description of competing technologies • Overview of market barriers at the program level • Brief history of public efforts in this area and justification for the need for a Federal
program, including: o Description of the national need this program addresses, i.e. what is unique
and critical about this program? o Why should the Federal government address this need instead of States,
associations or industry? o What other Federal programs does this program complement? o The context of the program within EERE
3

Office of Business Administration (BA) Support: BA can advise programs on methods for obtaining market research. The goal is to have EERE programs use the same market assumptions and data in their market research.
1.2 Program Vision This subsection outlines the program’s vision and how this vision aligns with EERE’s corporate vision. A clear, cohesive, and concise vision statement is critical for determining the scope, direction, and rationale for the program. The vision flows down into the program’s strategic goals and its outcomes. The vision is, by its nature, at least in part, external to the program; i.e., the program cannot achieve the vision alone.
A vision statement describes the desired future state of the market and society that the program intends to help achieve.
Best Practices: Clear, comprehensive, and cohesive vision and mission statements are critical for determining the scope and direction of the program and allow for a rational defense of the program. Vision statements describe the future desired state of the market, technology, or program while mission statements identify the program’s role in achieving the vision’s future state. The EERE corporate vision and mission are foundational and programs are encouraged to form links to the corporate vision and mission. Specific EERE goals can also form the building blocks of a program mission and vision statement. However, it is recognized that programs should and probably will want to tailor their mission and vision statements to their particular target markets. A well formulated vision provides the basis for developing strategies and identifying actions within those strategies to help the organization reach its desired future state.
Link to Example: Program Vision (Appendix A, p. 31)
1.3 Program Mission A program mission is the ultimate objective that a program is designed to achieve and is capable of achieving. This subsection describes the program’s mission and how that mission helps EERE to achieve its corporate mission. A clear, cohesive, and concise mission statement is critical for determining the scope, direction, and rationale for a program.
4

• What function does the program perform? • For whom does the program perform this function? • How does the program perform this function?
A mission statement is the charter of the program and provides the basis for all subsequent planning activity. It should be straightforward and succinct as well as descriptive of the program’s core competencies. The more explicit the mission, the better positioned a program is to develop clear, targeted program strategic goals. An explicit mission communicates a public image to important stakeholder groups and succinctly answers:
Best Practices: A well formulated mission statement should describe what the organization does and for whom. Ultimately, it defines why the organization exists. The mission clearly states what function the organization performs (e.g. develop technologies, techniques and tools), how (e.g. research, development, demonstration, and technology transfer), and why (e.g. make buildings more energy-efficient, productive and affordable).
Link to Example: Program Mission (Appendix A, p. 31)
1.4 Program Design This subsection describes the program’s design and how it will lead to achievement of the program vision and mission. There are three components to program design: program structure, program logic, and relationship to other Federal programs.
• Program structure identifies the key components of the program. • Program logic identifies how the program structure will use resources to create the
outputs and outcomes that represent achievement of the program mission and vision. • Relationship to other Federal programs identifies how the program influences, and is
influenced by, other Federal programs. Program design is used internally to identify appropriate metrics and targets (Section 1.5). Program logic is also useful in helping a program to identify outputs and outcomes (required under the Government Performance and Results Act of 1993, OMB’s Program Assessment Rating Tool (PART), and DOE’s Joule system).
1.4.1 Program Structure There are multiple ways program structure can be described, including:
• Substantive Areas of Research, Development, Demonstration, and Deployment (RDD&D) such as Photovoltaics, Concentrating Solar Power, and Solar Heating and Lighting.
• Stage of RDD&D such as basic research, applied research, technology development, and technology acceptance/deployment.
5

• Categories from the diffusion model of innovation (for the acceptance/deployment activities) such as:
o Building/changing the knowledge infrastructure (e.g. characterizing renewable resources, decision support software)
o Building/changing policy and government infrastructure (e.g., better codes/code enforcement, siting rules)
o Building/changing business infrastructure o Stimulating end-user demand
• Target markets such as aluminum, steel, and chemicals • Budget line items, especially if these are different from the above categories
In the MYPP, programs may choose any of these methods to describe their structure. Link to Example: Program Structure (Appendix A, p. 32)
1.4.2 Program Logic This subsection describes the program’s logic, which builds upon the program structure by describing how that structure will lead to the outputs and outcomes that represent achievement of the program mission and vision. There are five key components to program logic:
Inputs Resources available to the program such as funding, new ideas, and policy direction.
Activities
Actions the program takes with the inputs it receives. Activities may be viewed as actions within a program’s structure (e.g., applied research, development, demonstrations) that lead to the creation of program outputs. In other cases, the activities may be grouped within the program structure (e.g., PV research, PV development, PV demonstrations).
Outputs The direct results of program activities such as improved efficiency of a technology in a laboratory.
Outcomes The results of program outputs and actions of other R&D performers and market actors such as commercialization and penetration of a technology in the market. Outcomes may be divided into two types:
• Interim outcomes are short- or intermediate-term outcomes (or leading indicators of progress toward achieving ultimate outcomes) such as reduced cost of a technology or increased public awareness/acceptance of a technology.
• Ultimate outcomes are long-term outcomes such as reduced fossil fuel consumption.
External Factors
Forces beyond the program’s control such as program funding, energy prices, performance of competing technologies, government policies and regulations that influence achievement of outputs and outcomes. External factors are very important for EERE programs because of the complexity of technology innovation and market acceptance.
6

This subsection also describes the key relationships among program inputs, activities, outputs, outcomes, and external factors. One way to do this is by constructing a program logic diagram. A logic diagram is a simple graphic with two dimensions. One dimension is the performance path, which is the sequence of activities that comprise the program structure (described in the previous subsection). The other dimension is the performance spectrum, which is the pathway from inputs to activities to outputs to outcomes. Both dimensions are necessary to fully characterize the program logic. Figure 1.1 shows a simple conceptual logic diagram for an Energy RDD&D program. By showing the causal links, the program logic diagram helps “tell the story” to people not familiar with the program of how the program activities will achieve the strategic goals. Selected outputs in the program logic diagram will tie to program performance goals. Selected outcomes will tie to program strategic goals. The remaining outputs and outcomes will tie to other multiyear targets. Appendix D provides instructions and a template for developing a program logic diagram, including an example of program logic for a Generic RDD&D Program and potential metrics that are revealed through the logic.
BA Support: BA can assist programs with the development of program logic diagrams, including providing training/facilitation, and templates to use for constructing them.
7

Figure 1.1 Conceptual RDD&D Program Logic
External Influences: Political environment, changing budget priorities, technology risk, Cost and performance of competing technologies, Industry willingness to take risk, Energy prices, State of the economy, Government policies and regulations
Conceptual RDD&D Program LogicPerformance Path
Conceptual RDD&D Program Logic
Resources
Outputs
InterimOutcomes
Activities
ideas Federal, state & local government fundingPrivate funding, Personnel, Facilities, Past R&D results
Performance
Spectrum
Programs are not required to develop logic diagrams in their multiyear planning, but they are expected to elaborate on program structure in a way that clearly shows both the performance path and the performance spectrum aspects. A program logic diagram is one way to do this. Link to Example: Logic Diagram (Appendix A, p. 33)
1.4.3 Relationship to Other Federal Programs This subsection describes ways the program relates to other Federal programs. If a program partners with another Federal program, then outputs from the other program (advice, materials, etc.) may be included in the “inputs” to the program logic. The use of a program output by another Federal program can be identified as an outcome. The relationship with other Federal programs should be described in this subsection, regardless of whether it is included in the program logic diagram.
UltimateOutcomes
Preliminary Preliminary InvestigationInvestigation
Detailed Detailed InvestigationInvestigation
DevelopmentDevelopment ValidationValidation11 22 33 44 55
CommercialLaunch/
Technology deployment facilitation
CommercialLaunch/
Technology deployment facilitation
Preliminary Preliminary InvestigationInvestigation
Detailed Detailed InvestigationInvestigation
DevelopmentDevelopment ValidationValidation11 22 33 44 55
Program management
TIO contributions to cost/performance goal
MIO contributions to
market penetration goal
Niche & widespread adoption of technology
Economic, security, and environmental benefits(realized and projected)
Knowledge transfer; Add to R&D knowledge pool; Facilities; networks;
technology option value assets
Increased private
investment;Market Entry
Technical achievements & contribution of multiple projects
8

Link to Example: Program Relation to Other Federal Programs (Appendix A, p. 34)
1.5. Program Goals and Multiyear Targets This subsection describes the goals and targets toward which the program is working. There are four key elements to be included here: the goal cascade, program strategic goals, program performance goals, and multiyear program performance targets. The Goal Cascade depicts how goals flow down through the National Energy Policy, DOE Strategic Plan, EERE Strategic Plan, program strategic plan, and MYPP. Since the documents were developed at different times, the goals may not align perfectly across them. Some goals may even be inconsistent. The MYPP provides an opportunity to update program goals to reflect the latest thinking, challenges, and funding of the program. For instance, the goal cascade for the Industrial Technologies Program (ITP) might show that a goal of a 30% improvement in energy intensity that was originally in the ITP Strategic Plan was updated to a 20% improvement as shown in the ITP MYPP (Figure 1.2). Changes in goals should be explained (e.g., funding levels have decreased). Programs may want to consult the National Energy Policy, DOE Strategic Plan, and EERE Strategic Plan to assist them in developing their goal cascades.2 Figure 1.2 Example of Goal Cascade for Industrial Technologies Program
National Energy Policy(2001)
• Modernize conservation and our energy infrastructure
• Accelerate the protection and improvement of the environment
DOE Strategic Plan (2003)
• Improve energy security by developing technologies that foster a diverse supply of reliable, affordable, and environmentally sound energy by providing for reliable delivery of energy, guarding against energy emergencies, exploring advanced technologies that make a fundamental improvement in our mix of energy options, and improve energy efficiency. (Goal 4)
EERE Strategic Plan (2002)
• Increase the energy efficiency of industry. (Goal 6)
• Dramatically reduce, or even end, dependence on foreign oil
ITP Strategic Plan (2003)
• Between 2002 and 2020, contribute to a 30% improvement in energy intensity by the energy-intensive Industries of the Future
• Between 2000 and 2010, commercialize over 10 industrial energy efficiency technologies
ITP Multiyear Plan(2006)
• Between 2002 and 2020, contribute to a 20% improvement in energy intensity by the IOFs
• Between 2000 and 2010, commercialize over 10 industrial energy efficiency technologies
Link to Example: Goal Cascade (Appendix A, p. 34)
2 National Energy Policy (2001): http://www.whitehouse.gov/energy/National-Energy-Policy.pdfDOE Strategic Plan (2003): http://strategicplan.doe.gov/ (updated version is currently undergoing review and is expected to be released by the end of 2006) EERE Strategic Plan (2002): http://www1.eere.energy.gov/office_eere/strategic_plan.html
9
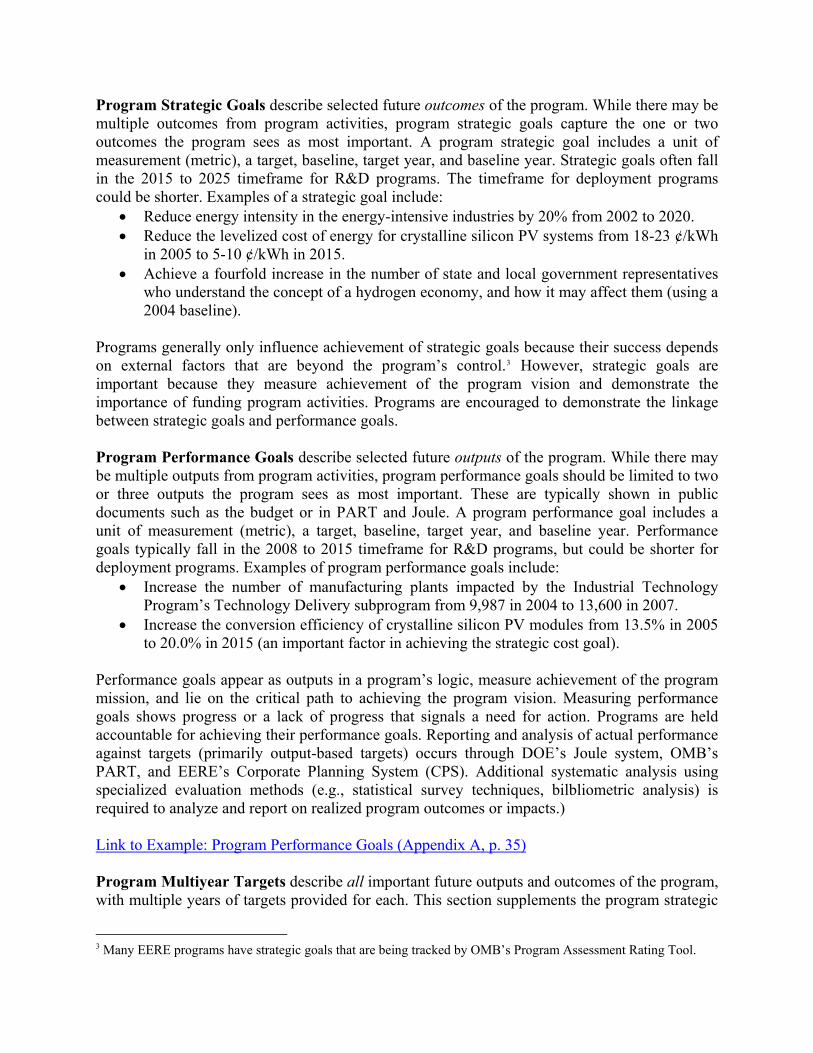
Program Strategic Goals describe selected future outcomes of the program. While there may be multiple outcomes from program activities, program strategic goals capture the one or two outcomes the program sees as most important. A program strategic goal includes a unit of measurement (metric), a target, baseline, target year, and baseline year. Strategic goals often fall in the 2015 to 2025 timeframe for R&D programs. The timeframe for deployment programs could be shorter. Examples of a strategic goal include:
• Reduce energy intensity in the energy-intensive industries by 20% from 2002 to 2020. • Reduce the levelized cost of energy for crystalline silicon PV systems from 18-23 ¢/kWh
in 2005 to 5-10 ¢/kWh in 2015. • Achieve a fourfold increase in the number of state and local government representatives
who understand the concept of a hydrogen economy, and how it may affect them (using a 2004 baseline).
Programs generally only influence achievement of strategic goals because their success depends on external factors that are beyond the program’s control.3 However, strategic goals are important because they measure achievement of the program vision and demonstrate the importance of funding program activities. Programs are encouraged to demonstrate the linkage between strategic goals and performance goals. Program Performance Goals describe selected future outputs of the program. While there may be multiple outputs from program activities, program performance goals should be limited to two or three outputs the program sees as most important. These are typically shown in public documents such as the budget or in PART and Joule. A program performance goal includes a unit of measurement (metric), a target, baseline, target year, and baseline year. Performance goals typically fall in the 2008 to 2015 timeframe for R&D programs, but could be shorter for deployment programs. Examples of program performance goals include:
• Increase the number of manufacturing plants impacted by the Industrial Technology Program’s Technology Delivery subprogram from 9,987 in 2004 to 13,600 in 2007.
• Increase the conversion efficiency of crystalline silicon PV modules from 13.5% in 2005 to 20.0% in 2015 (an important factor in achieving the strategic cost goal).
Performance goals appear as outputs in a program’s logic, measure achievement of the program mission, and lie on the critical path to achieving the program vision. Measuring performance goals shows progress or a lack of progress that signals a need for action. Programs are held accountable for achieving their performance goals. Reporting and analysis of actual performance against targets (primarily output-based targets) occurs through DOE’s Joule system, OMB’s PART, and EERE’s Corporate Planning System (CPS). Additional systematic analysis using specialized evaluation methods (e.g., statistical survey techniques, bilbliometric analysis) is required to analyze and report on realized program outcomes or impacts.) Link to Example: Program Performance Goals (Appendix A, p. 35) Program Multiyear Targets describe all important future outputs and outcomes of the program, with multiple years of targets provided for each. This section supplements the program strategic
3 Many EERE programs have strategic goals that are being tracked by OMB’s Program Assessment Rating Tool.
10

goals and program performance goals described above in two ways. First, for each goal it provides targets for more years, specifically the interim years between the present timeframe and the goal. If a program strategic (or performance) goal is for the year 2015, then this section provides targets for selected years between the present and 2015. Second, it provides targets for important outputs and outcomes that are in addition to the program strategic goals and program performance goals. The identification of additional output and outcome metrics and targets is important because they can serve as useful leading indicators for whether a program is on track toward achieving its strategic and performance goals. If a program performance goal was measured by the efficiency of a system, then this section might identify targets for the efficiency of a key component in the system (an output). If the efficiency of that component is behind schedule, then system efficiency is likely to be as well. Similarly, if a program strategic goal is to achieve widespread adoption of a targeted technology, then a diffusion measure such as market share or extent of early adopter market penetration (interim outcomes) could be used as a leading indicator of whether the strategic goal will be achieved. As noted in Section 1.4, if the program logic is well articulated, then metrics should cover the inputs, outputs, outcomes, and external factors identified in the program logic. Figure D.4 in Appendix D provides an example of program logic for a Generic Energy RDD&D Program and potential metrics that are revealed through the logic. Baseline and target levels of performance should be identified for the metrics for which data can be collected. Data for some metrics may be too difficult or expensive to collect. Data collected range from routine output ‘counts’ data (e.g., number of technologies moving to validation) to interim outcome data that requires statistical sampling (e.g., percent of market that is aware of technology) to data that requires sophisticated study design and analysis performed periodically (e.g., market penetration in innovator and early adopter market segments). One or more years of actual historic data should be provided as a baseline. Targets should be developed for the five years included in the MYPP’s planning horizon (e.g. 2006 to 2011) and for major increments thereafter (e.g., 2015, 2020, and 2025). A sample table for collecting this data is included in Appendix D (Table D.1). Link to Example: Program Multiyear Targets (Appendix A, p. 35)
11

THIS PAGE LEFT INTENTIONALLY BLANK
12

2.0 Technology Research, Development, and/or Deployment Plan This section presents the technical plan for both R&D and deployment programs as the level of detail of the MYPP shifts from the program to the program element or subprogram level. This should include discussion of the program element goals, technical and market challenges, strategies for addressing those challenges, and key milestones and decision points toward achieving goals. This section should also address cross-cutting issues, including communications and outreach (part of a program’s approach/strategy), and any other issues that a program feels cannot be adequately addressed in separate discussions under each program element. Programs can present their technical plans in one of two ways, as discussed below. One of the more useful methods for explaining the technology decision-making process (as opposed to the programmatic decision-making process) is the stage gate process. Stage gate diagrams show the program’s main R&D pathways along with critical go/no-go decision points and milestones. The technical plan for the various program elements or subprograms addressed in this section should include discussion of the decision-making processes used (such as stage gate or go/no-go decision points) to determine which activities to pursue. Programs may want to include a summary roll-up of key milestones, decision points, and critical path activities for the program overall in this introductory section to the technical plan before going into the more detailed program element or subprogram level in the subsections that follow. The focus should be on activities within the five year planning horizon of the MYPP, but if a program wishes, it may include longer out-year activities. One way to illustrate this is with a Gantt chart. Two Options for Presenting the Research, Development, and/or Deployment Plan Some programs may choose to write a separate technical plan for each program element or subprogram (such as Concentrating Solar Power), in which the details of each program element will be examined as if each were a separate program, with goals, approaches, markets, challenges and barriers, and the related tasks, milestones and decision points for each element. This deeper examination is especially helpful to those programs whose activities range across a wide variety of areas and that find it difficult to “roll up” activities into broad, program-level descriptions. Other programs whose various program elements are closely linked or share similar issues may find it cumbersome or repetitive to write a separate section for each element that addresses goals, barriers, strategies, and milestones. Such programs may opt to address these issues in a more cross-cutting fashion as they see fit. As there is variation in the number of program elements within each program, those programs that choose to reference each element separately should do so as 2.1, 2.2, 2.3 etc., followed by 2.4 (or 2.X “Cross-Cutting Issues”). Subsections within each program element (e.g. goals, barriers, strategies, and milestones) would then be included as 2.1.1, 2.1.2, 2.1.3, 2.1.4, etc. (all under program element 2.1) and so forth.
13
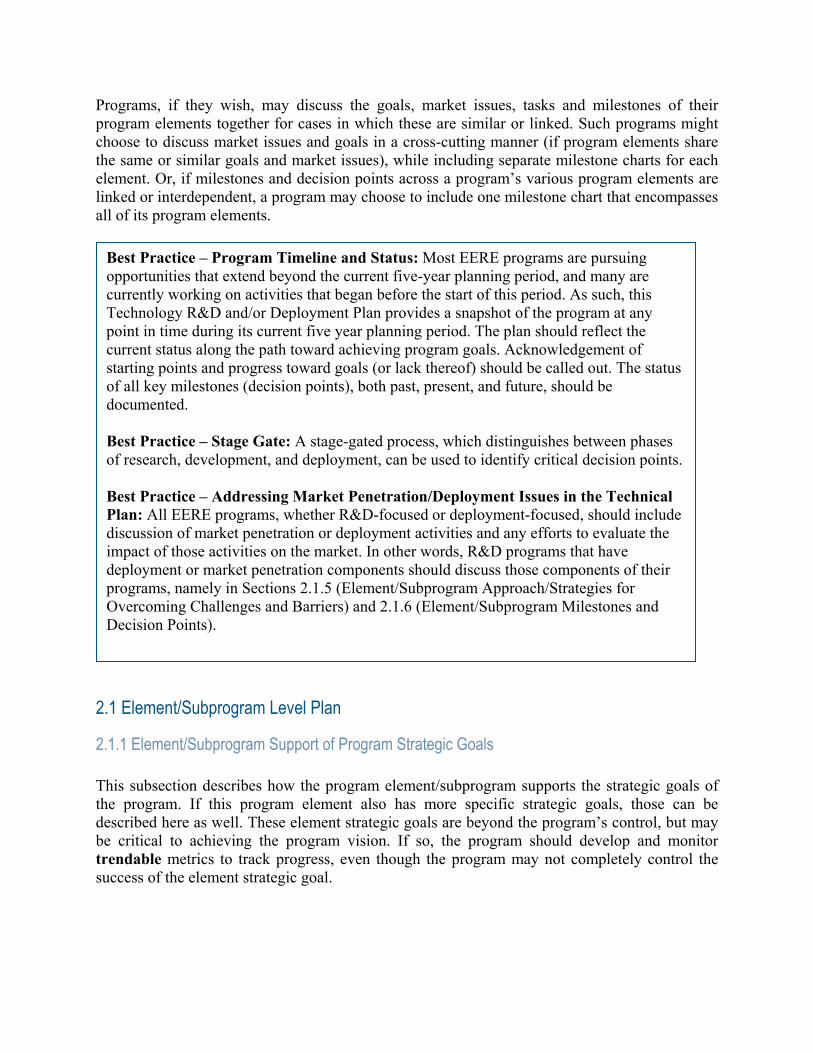
Programs, if they wish, may discuss the goals, market issues, tasks and milestones of their program elements together for cases in which these are similar or linked. Such programs might choose to discuss market issues and goals in a cross-cutting manner (if program elements share the same or similar goals and market issues), while including separate milestone charts for each element. Or, if milestones and decision points across a program’s various program elements are linked or interdependent, a program may choose to include one milestone chart that encompasses all of its program elements.
Best Practice – Program Timeline and Status: Most EERE programs are pursuing opportunities that extend beyond the current five-year planning period, and many are currently working on activities that began before the start of this period. As such, this Technology R&D and/or Deployment Plan provides a snapshot of the program at any point in time during its current five year planning period. The plan should reflect the current status along the path toward achieving program goals. Acknowledgement of starting points and progress toward goals (or lack thereof) should be called out. The status of all key milestones (decision points), both past, present, and future, should be documented. Best Practice – Stage Gate: A stage-gated process, which distinguishes between phases of research, development, and deployment, can be used to identify critical decision points. Best Practice – Addressing Market Penetration/Deployment Issues in the Technical Plan: All EERE programs, whether R&D-focused or deployment-focused, should include discussion of market penetration or deployment activities and any efforts to evaluate the impact of those activities on the market. In other words, R&D programs that have deployment or market penetration components should discuss those components of their programs, namely in Sections 2.1.5 (Element/Subprogram Approach/Strategies for Overcoming Challenges and Barriers) and 2.1.6 (Element/Subprogram Milestones and Decision Points).
2.1 Element/Subprogram Level Plan
2.1.1 Element/Subprogram Support of Program Strategic Goals This subsection describes how the program element/subprogram supports the strategic goals of the program. If this program element also has more specific strategic goals, those can be described here as well. These element strategic goals are beyond the program’s control, but may be critical to achieving the program vision. If so, the program should develop and monitor trendable metrics to track progress, even though the program may not completely control the success of the element strategic goal.
14

Key Components • Description of how the program element/subprogram supports the strategic goals
of the program. • If there are strategic goals specific to this program element/subprogram, those can
be described here also.
2.1.2 Element/Subprogram Support of Program Performance Goals This subsection describes the performance goals of the program element/subprogram, and should show how those goals align with program-level performance goals.
Key Components • Describe the program element/subprogram performance goals. • Show how element/subprogram performance goals align with or support the
program-level performance goals.
Best Practice: Programs must ensure that program element goals are clear, comprehensive, measurable, and verifiable. Goals are only useful if they are easily understood, encompass an appropriate portion of the program’s activities, are able to be tracked and measured, and can be verified for both internal and external audiences. Goals should always include dates. Element goals, like program goals, should be output-oriented for which the program may be held accountable.
2.1.3 Element/Subprogram Market Challenges and Barriers This subsection describes the individual market challenges and barriers faced by the program element/subprogram. These challenges/barriers can be assigned a letter or number for easy reference later when describing strategies for overcoming them and milestones and decision points associated with those strategies (Sections 2.1.5 and 2.1.6).
Key Components • Describe the current market challenges/barriers for the particular technologies
addressed in this program element.
15

Best Practice: Technical, market, and institutional barriers form obstacles to achieving program goals. A well-designed and -articulated program plan will address these barriers directly. A simple listing of the barriers is insufficient for planning purposes. A good plan will fully explain these barriers and the relationship to the goals. In this way, it should be easier to demonstrate the relationship of program activities to overcome these barriers and progress toward the goals. With the goals in mind, and the barriers understood, the program can construct technical pathways (a series of related and interconnected activities) toward goal achievement. A well-constructed plan will tie program activities directly to these barriers and give a sense of timing so that the technical or market pathway has a multiyear dimension that can be readily visualized. Graphic or tabular presentation is an excellent way to convey this information.
2.1.4 Element/Subprogram Technical (Non-Market) Challenges and Barriers This subsection should provide an in-depth look at the technical or non-market challenges/barriers facing this particular program element. These challenges/barriers can also be assigned a letter or number for easy reference later when describing strategies for overcoming them and milestones and decision points associated with those strategies (Sections 2.1.5 and 2.1.6).
Key Components • Describe the technical or non-market challenges/barriers specific to this program
element/subprogram.
Link to Example: Technical (Non-Market) Challenges/Barriers (Appendix A, p. 36)
2.1.5 Element/Subprogram Approach/Strategies for Overcoming Challenges and Barriers This subsection should not only address R&D approaches for overcoming technical barriers, but should also address market penetration or deployment activities, if any, for addressing market barriers. All programs (whether R&D- or deployment-focused) should address the market penetration/deployment activities, if any, that the program is undertaking to address those barriers. If it makes more sense for a program to separate this into two subsections (i.e. strategies for addressing technical barriers and strategies for addressing market barriers), programs may do so. The connection between each strategy and challenge/barrier should be fully explained. This subsection focuses for the first time on the actual activities and tasks that comprise the program element’s strategy for overcoming barriers. This should not focus on projects, which
16
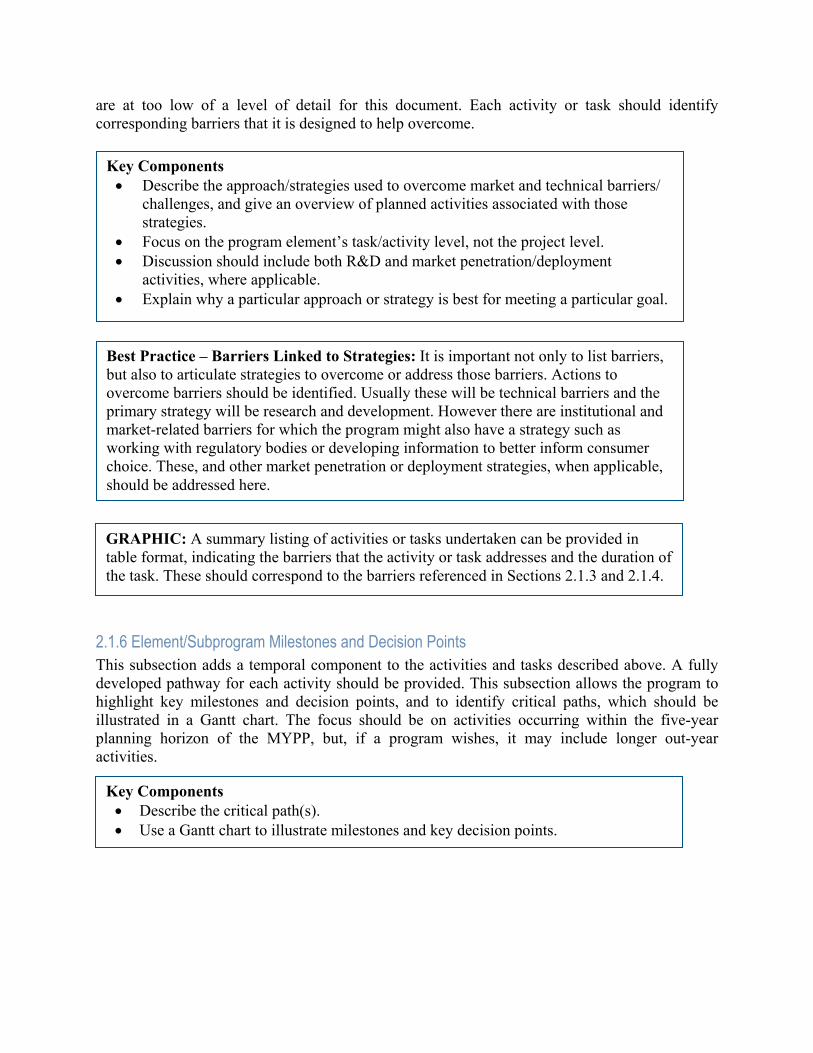
are at too low of a level of detail for this document. Each activity or task should identify corresponding barriers that it is designed to help overcome.
Key Components • Describe the approach/strategies used to overcome market and technical barriers/
challenges, and give an overview of planned activities associated with those strategies.
• Focus on the program element’s task/activity level, not the project level. • Discussion should include both R&D and market penetration/deployment
activities, where applicable. • Explain why a particular approach or strategy is best for meeting a particular goal.
Best Practice – Barriers Linked to Strategies: It is important not only to list barriers, but also to articulate strategies to overcome or address those barriers. Actions to overcome barriers should be identified. Usually these will be technical barriers and the primary strategy will be research and development. However there are institutional and market-related barriers for which the program might also have a strategy such as working with regulatory bodies or developing information to better inform consumer choice. These, and other market penetration or deployment strategies, when applicable, should be addressed here.
GRAPHIC: A summary listing of activities or tasks undertaken can be provided in table format, indicating the barriers that the activity or task addresses and the duration of the task. These should correspond to the barriers referenced in Sections 2.1.3 and 2.1.4.
2.1.6 Element/Subprogram Milestones and Decision Points This subsection adds a temporal component to the activities and tasks described above. A fully developed pathway for each activity should be provided. This subsection allows the program to highlight key milestones and decision points, and to identify critical paths, which should be illustrated in a Gantt chart. The focus should be on activities occurring within the five-year planning horizon of the MYPP, but, if a program wishes, it may include longer out-year activities.
Key Components • Describe the critical path(s). • Use a Gantt chart to illustrate milestones and key decision points.
17

BA Support: BA can assist program personnel with the development of Gantt charts.
GRAPHIC – Gantt Charts: Element/subprogram Gantt charts should visually communicate: • The relationship of the activities within a program element/subprogram; • The relationship to activities in other program elements/subprograms; and • Decision points to evaluate the program’s successes and/or failures in order to direct
future program activities. These points should be communicated by the use of Input, Output, Milestone, and Go/No-go indicators. • Inputs indicate contributions from other subprograms that will be key to determining
whether the program should continue on its current path or redirect some or all of its efforts.
• Outputs, conversely, are contributions provided to other program element/subprogram areas.
• Milestones are specific program targets for the completion of planned activities/tasks. • Go/No-go milestones are points where decisions must be made whether to continue
current R&D pathways or particular activities within a pathway or whether to redirect efforts and funding to areas that show greater potential.
This Gantt chart will provide an easy reference for measuring program success and performance. It should be updated at yearly intervals as underlying technology and market assumptions evolve. The program will need to adjust to these changes and incorporate the consideration of changes to the baseline as part of the revision process.
Best Practice – Milestones and Decision Points Tied to Objectives: Milestones are used to identify discrete accomplishments along the way toward an objective. They are critical to determining program progress. A program plan should have milestones that are timed and tied to specific program goals. The program should be able to demonstrate how acquisition of a milestone brings the program a step closer to achieving the goal. A subset of these milestones should form key decision points that are called out specifically in the plan. As these decision points are reached, or the time has passed when a key milestone was to be met, the program should reevaluate progress toward the objective. These decision points form go/no-go decisions as to whether to continue down a particular path or to reevaluate and redirect resources.
Link to Example: Element/Subprogram Milestones and Decision Points (Appendix A, p. 37) Link to Example: Gantt Charts (Appendix A, pp. 38-39)
18
2.2 Cross-Cutting Issues This subsection should address any cross-cutting issues that a program finds are important to include in its Technology Research, Development, and/or Deployment Plan. This might include issues that cannot be adequately addressed separately under each program element plan because of their interrelationships or interdependencies. A program’s communication and outreach strategy should be discussed in this subsection. 2.2.1 Communication and Outreach This subsection provides a brief description of the program’s approach to communication and outreach (C&O) issues, and how this approach contributes to program goals.
Key Components • Explain the program’s C&O strategy. • Does the program collect market information for use in technology development or
deployment decisions? • How does the program disseminate information to various stakeholders? • Explain how the C&O strategy relates to these essential participants and thus to a
successful program. • Explain how the program uses feedback from stakeholders. • How do the program’s communication and outreach efforts interact with EERE’s
corporate communications and outreach office.
2.2.2 Other Cross-Cutting Issues Use as many subsections as needed to address other cross-cutting issues faced by the program.
19

THIS PAGE LEFT INTENTIONALLY BLANK
20

3.0 Program Portfolio Management This section describes how the program develops and manages its portfolio of R&D and/or deployment activities. It identifies and relates planned activities for portfolio management functions including portfolio decision making, analysis, performance assessment, and data collection to support performance assessment. The detailed results of current portfolio management activities can be provided in the Technology R&D and/or Deployment Plan in Section 2, but Section 3 should describe the program’s multiyear plan for managing its portfolio.
3.1 Program Portfolio Management Process This subsection describes the program’s portfolio management and decision-making process. EERE management is encouraging programs to use a systematic approach to this process. The information contained in this subsection is critical to a successful MYPP and the eventual development of an EERE-wide MYPP. Programs are not restricted to using any one particular decision-making process, but this subsection should explain the logic behind their process. All programs perform the critical functions of planning, analysis, and performance assessment, albeit in slightly different ways to suit their specific needs.
Key Components • Describe the program’s portfolio decision-making process, including a brief
discussion of the role of risk. • Provide a graphic demonstrating the decision-making process. • Identify types of decisions made and relationship to analysis and evaluation
information generated to inform decisions.
Figure 3.1 below provides one way of summarizing a program’s portfolio management process. It includes four steps or major activities and seven major flows of information:
Step 1: Identify Technology Improvement Opportunities (TIOs) and Market Improvement Opportunities (MIOs) that are aligned (consistent) with program goals.
Step 2: Assess program element (PE) potential contribution to TIOs and MIOs.
Step 3: Develop multiyear R&D and/or deployment portfolio.
Step 4: Monitor and evaluate performance as the program is implemented.
Flow A: Program Goals and Program Logic (from Section 1 of MYPP) help determine
which TIOs and MIOs contribute to program goals (Step 1).
Flow B: The TIOs and MIOs that contribute to program goals are examined for potential impact by the program (Step 2).
21

22
Flow C: The program contribution to TIOs and MIOs are inputs into benefits, risk and
cost analyses (Step 3).
Flow D: The projects selected and the associated project/program targets are used in performance monitoring and evaluation (Step 4).
Flow E: Progress (or lack thereof) toward TIOs and MIOs may affect estimated
benefits, costs and risk (Step 3).
Flow F: Progress (or lack thereof) toward TIOs and MIOs may influence the TIOs/MIOs to which a program believes it can contribute (Step 2).
Flow G: Progress (or lack thereof) toward TIOs and MIOs may influence TIO and MIO
targets as well as program goals (Step 1). Programs are not required to use this specific process in their multiyear planning, but are encouraged to consider it because it contains many basic elements and information flows common to those used throughout EERE programs. Portfolio management involves managing multiple pathways toward one ultimate outcome and identifying and monitoring indicators to inform decisions about the mix of multiple pathways. Portfolio management typically involves many different types of analyses and performance assessments (described in Sections 3.2 and 3.3). Examples of types of portfolio level decisions made by programs include continuation, termination, recycle, take corrective actions, redirect funds, streamline operation, and go/no-go. Programs should show the relationships among analysis, assessments, and portfolio decisions in this section.

23
Solicitation and Project Selection(Link Inputs to Activities)
Program Contribution to TIOs & MIOs(Link Program Activities to Outputs)
Market Analysis
Technology & Market
ImprovementOpportunities TIO
Contributionto Goals
ProgramLogic
Program Contribution to TIOs & MIOs
LowHiMedHiLowMIO 2
LowLowLowLowLowMIO 1
LowLowMedHiMedTIO 3
LowHiLowMedLowTIO 2
HiHiHiHiHiTIO 1
NewPE
PE 4PE 3PE 2PE 1
2 Assess Potential Program Contribution toTechnology and Market Improvement Opportunities1 Identify Contribution of Technology and Market
Improvement Opportunities to Program Goals
Program Goals
TIO/MIOContribution
to Goals
TIO/MIO Contribution to Goals(Link Program Outputs to Outcomes)
TIO 2 10%
TIO 1 2%
MIO 1 2%
TIO 3 -5%
MIO 2 11%
Goal 1 5%
Goal 2 10%
Risk Analysis
Benefits Analysis
PortfolioAnalysis
Solicitation and Project Selection
MultiyearPortfolio
Development
3 Develop Multiyear TIO/MIO Portfolioand Select Projects
$200$150$75$50Proj 3
$75$100$75$25Proj 2
$100$125$125$75$75Proj 1
FY 12
FY 11
FY 10
FY 09
FY 08
Program Contribution toTIOs & MIOs
Cost Analysis
Project 1 $$Project 2 $$Project 3 $$
Project 1 MilestoneProject 2 MilestoneProject 3 Milestone
Project 4 $$Project 5 $$
Project 4 MilestoneProject 5 Milestone
External Factors
TIO 1
TIO 2
ProgramGoal 1
4 Monitor and Evaluate Performanceas Programs are Implemented
CPS Joule, PART
Peer Review
Technical Program Review Impact Evaluation
Market Assessment
Cost/Benefit
Process Evaluation
Impl
emen
tEv
alua
te
ProgramOutputs
ProgramOutcomes
ProjectOutputs
ProjectInputs
Mon
itor
Stage Gate
ID Metrics& Set
Targets
Annual Budget Process
TechnologyAnalysis
Outcome Eval
Cost/Benefit
PE = Program Element (e.g., project)
ProgramLogic
External Factors
External Factors
ProgramLogic
MIO Contribution
to Goals
Goal 3 3%
A
E
B
C
D
FG
Figure 3.1 Example of Program Portfolio Management Process

3.2 Program Analysis* This subsection describes the program’s plans for conducting analyses to support planning and decision making, particularly the portfolio management decisions described in Section 3.1. Some types of analyses that might be described in this subsection include:
• Technology Analysis • Market Analysis • Benefits Analysis (GPRA) • Risk Analysis • Cost Analysis • Policy Analysis • Portfolio Analysis
Also, this subsection does not cover analyses to assess past program performance, which are covered in Section 3.3. Key components of this subsection include a brief description of the analysis, the analytical tools used (e.g., models), key assumptions, outputs of the analysis, and how the analytical information informs planning and decision making. For instance, a program could describe how a technology analysis results in the identification of TIOs. The description would also explain that the expected program contributions to achievement of the TIOs represent the performance goals (output goals) of the program and that these goals are included in PART, Joule, etc. Links between analysis and contents of the MYPP would be provided for other analyses as well.
Key Components • Briefly describe the types of analysis performed by the program. • Describe planned analysis activities and schedule. • Describe the outputs of the analysis and how the analytical information is intended to
inform planning and decision making. • Discuss plans for improving program-specific analysis (e.g., tools, methods, and data
collection systems).
*Some programs have dedicated program elements or line-items in their budgets focused on analysis (such as the Hydrogen, Fuel Cells, and Infrastructure Technologies Program’s Systems Analysis effort). As such, programs are free to move any or all components of this subsection to the Technology Research, Development, and/or Deployment Plan (Section 2). If this is done, this subsection (Section 3.2) should still be included and should clearly indicate where in Section 2 those components are located.
24

3.3 Performance Assessment This subsection of the MYPP provides programs with an opportunity to outline their plans for assessing the performance of program activities, and to describe how assessment information is used to inform decision making. This subsection can also be used to describe the types of performance assessments the program plans to undertake, and how those assessments aim to inform programmatic decisions. An OMB examiner should be able to read this section of the MYPP and feel reasonably confident that the program has well-defined plans in place to ensure that appropriate performance assessments are completed over a multiyear period and that it uses performance assessments as a management tool. Programs are encouraged to present all of their performance assessment planning in this section. Note that this section is intended to describe plans for new assessments and how those assessments are expected to provide the information needed to inform decision making. If a program wishes to describe the results of past performance assessments and how those results have informed programmatic decisions, that information could be integrated into Section 2 (Technology Research, Development, and/or Deployment Plan). Performance assessment includes both performance monitoring and program evaluation. Performance assessment provides the means through which a program can measure relevant outputs and outcomes that can aid the program in reevaluating its decisions, goals, and approach, and provide a sense of the real progress being made with the program’s efforts. It is important to emphasize that performance assessment not only includes measuring actual improvements in outputs, such as increased efficiency of a technology, but actual achieved outcomes, such as increased market penetration and realized energy savings.
Key Components • Describe the program’s multiyear performance assessment strategy. What are the
types of assessment performed by the program? What is the schedule of planned performance assessments?
• Discuss how the evaluative information is intended to inform planning and decision making.
• Discuss plans for improving program-specific performance assessment capability (e.g., tools, methods, and data collection systems).
25

BA Support: BA can assist programs in performance assessments by providing guidance on development of well-defined performance metrics and indicators, assisting in preparing program-wide evaluation strategies, working with programs to set up a quality assurance procedure for evaluation studies, and upon request, managing evaluation studies for programs.
Performance Monitoring: The ongoing monitoring and reporting of program accomplishments, particularly progress toward pre-established goals. Performance monitoring uses information on measurable outputs (and sometimes short-term outcomes) obtained from routine data collection activities to address the question – "What has happened?" Program Evaluation: Systematic studies conducted periodically or on an ad hoc basis, usually by outside independent experts, to assess how well a program is working. Program evaluations address questions concerning program rationale, process, impact, or cost-benefit, and ask – "How, who and why?" – using methods such as expert judgment (peer review), as well as general evaluation studies such as statistical sample surveys, case studies, experimental design studies, and bibliometrics.
3.3.1 Performance Assessment Strategy and Plan Ideally a program office should have a program-wide performance assessment strategy that addresses each program element, with a schedule of coordinated planned performance monitoring and program evaluations, and the resources set aside for them4. Strategically planned evaluations are an important part of program performance assessment. One way to have useful and cost effective evaluations is to have an evaluation strategy and a multiyear plan of evaluation activities that support management processes such as planning, budgeting, program implementation, and benefits estimation. In this subsection of the MYPP the program should describe its overall multiyear performance assessment strategy. This includes describing the types of performance assessments to be performed, ways that the program determines the timing of assessments, and a planned schedule. Types of performance assessments The plan should briefly describe the types of performance assessments that will be conducted. The table below shows several types of assessments typically used by EERE programs to assess progress and to promote improvement:5
4 Programs are not required to include resource allocation plan in their MYPPs. 5 Technology validation and operation field measurement is also a form of evaluation used by EERE, but it is not covered in this subsection of the MYPP Template.
26

Performance monitoring
External monitoring for DOE’s Joule performance measurement tracking system and the Office of Management and Budget’s (OMB) Program Assessment Rating Tool (PART).6
Internal monitoring using EERE’s Corporate Planning System (CPS) or program tracking systems for metrics not covered by external monitoring.
Program evaluation
Peer reviews by independent outside experts of both the program and subprogram portfolios to assess quality, productivity, and accomplishments; relevance of program success to EERE strategic and programmatic goals; and management.7
General program evaluation studies by independent outside experts to examine process, quantify outcomes or impacts, identify market needs and baselines, or quantify cost-benefit measures as appropriate.8
Performance monitoring and Program evaluation
Technical Program Reviews by EERE Senior Management, Technical Teams, or Advisory Committees.
When describing peer reviews and general program evaluations, programs should indicate whether the planned study scope is at the program level, portfolio level, or activity level. In addition, discuss how independence of the evaluation is ensured and describe quality assurance procedure(s).9
Frequency of Performance Assessments In developing a schedule of performance assessments the program will need to consider how often performance assessments are required. Many factors determine when a program conducts a performance assessment. One consideration for program evaluations is program life cycle stages, which is illustrated in Figure 3.2 below. 6 Separate guidance on performance monitoring and reporting is also provided by DOE’s Chief Financial Officer (CFO) on the Joule Performance Measurement Tracking System and R&D Investment Criteria, and by OMB on PART. (See FY2006 Instructions for PART Worksheets (www.whitehouse.gov/omb/part/2006_part_guidance.pdf)). 7 EERE guidance for the peer review form of evaluation that uses independent outside experts is provided in a separate EERE Peer Review Guide. U.S. Department of Energy, Office of Energy Efficiency and Renewable Energy, “Peer Review Guide,” August 2004. 8 An “EERE Guide for Managing General Program Evaluation Studies: Getting the Information You Need,” DOE/EERE” was published in February 2006. 9 An EERE Standard Operating Procedure (SOP) on “Best Practices with Peer Reviews” was issued in November 2004. An EERE SOP on “Quality Assurance for general program Evaluation Studies is forthcoming in 2006.
27

Figure 3.2 Program Life Cycle Stages
In addition to consideration of program life cycle stages, the timing of performance assessments is also organized around SMS cycles (e.g., budget and MYPP phases), Joule, GPRA benefits analysis cycles, stage gate decision points or planned dates for critical go/no-go decisions, and anticipated PART submissions. Table 3.1 provides an illustrative way a program can identify the timing considerations associated with these other factors. Programs are encouraged to construct this type of table to help identify their performance assessment scheduling needs in the MYPP. Once performance assessments are described and their frequency and timing considerations discussed, the information should be summarized.
28

Table 3.1 Schedule of Performance Assessments, 2007-2011 Performance Assessment 2007 2008 2009 2010 2011 Performance Monitoring
Joule (quarterly) PART CPS (quarterly) Internal Program Monitoring
Stage Gate Project A Project B Project C Project D Project E Project F
Peer Review Overall program level review Program Element 1 Program Element 2 Program Element 3 Program Element 4 Program Element 5
Technical Reviews Strategic Technical Reviews Program Review (Internal) Other Senior Management Reviews Technical Advisory Committee Reviews
General Program Evaluations Process Evaluation Overall program or program element n
Impact Evaluation Overall program or program element n
Cost/Benefit Evaluation Overall program or program element n
Market Assessment Overall program or program element n
Schedule of planned performance assessments Once the frequency of performance assessments is discussed, a schedule for planned performance assessments should be developed, recognizing that plans may be altered depending on unforeseen external influences. Preferably, the schedule should be linked to critical decision-making points. This subsection should also include a brief description of those planned assessment activities.
29

3.3.2 Data Collection to Support Routine and Periodic Performance Assessment Ideally, programs should gather data to support performance assessments by building on and enhancing existing routine data collection activities, followed by use of specialized data collection procedures (e.g., less frequent and periodic statistical sample surveys, bibliometric data collection methods). This subsection describes the types of data collection methods used, as well as plans for improving program-specific performance assessment capability (e.g., tools, methods, and data collection systems).
30
Appendix A: Examples from Past Multiyear Program Plans
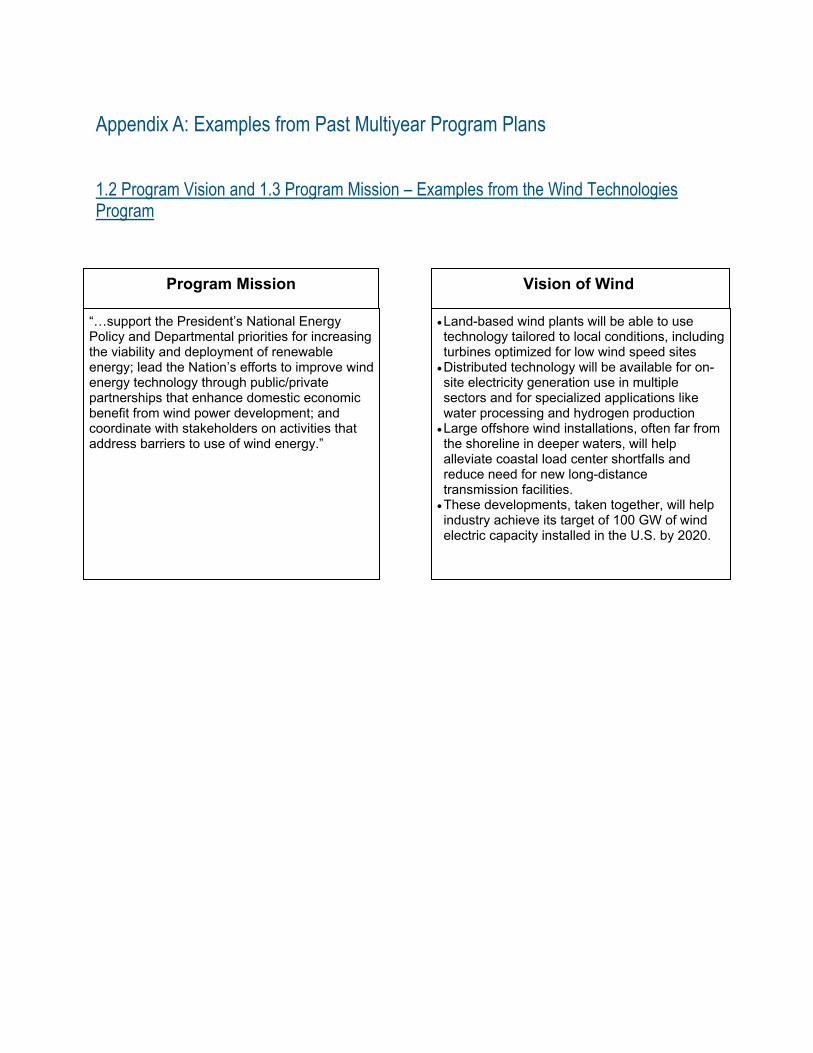
1.2 Program Vision and 1.3 Program Mission – Examples from the Wind Technologies Program
“…support the President’s National Energy Policy and Departmental priorities for increasing the viability and deployment of renewable energy; lead the Nation’s efforts to improve wind energy technology through public/private partnerships that enhance domestic economic benefit from wind power development; and coordinate with stakeholders on activities that address barriers to use of wind energy.”
Program Mission
• Land-based wind plants will be able to use technology tailored to local conditions, including turbines optimized for low wind speed sites
• Distributed technology will be available for on-site electricity generation use in multiple sectors and for specialized applications like water processing and hydrogen production
• Large offshore wind installations, often far from the shoreline in deeper waters, will help alleviate coastal load center shortfalls and reduce need for new long-distance transmission facilities.
• These developments, taken together, will help industry achieve its target of 100 GW of wind electric capacity installed in the U.S. by 2020.
Vision of Wind
31

1.4.1 Program Structure – Example from Solar Energy Technologies Program
32

1.4.2 Program Logic – Example from the Weatherization and Intergovernmental Program (State Energy Program)
Once developed, the logic diagram may be used to develop and select appropriate performance measures. The boxes in the logic diagram represent potential measurement areas. Performance measures for a program should include both output and outcome measures. For SEP, these may include, but are not limited to, the following measures (associated logic diagram areas are highlighted in yellow): Output: Distribute $41 million in grants to State Energy Offices in FY2006. Short-term Outcome: Achieve a 5 percent increase in number of building audits conducted and number of square
feet retrofitted with energy efficient technology increasing measurable program results. Long-term Outcome: FY06 SEP grants will result in an average annual energy savings of 30-37 trillion source
BTU and $200-$230 million in energy cost savings with DOE funds.
33

1.4.3 Program Relation to Other Federal Programs – Example from the Biomass Program “The Biomass Program is the major Federal program supporting RD&D of biomass and biorefinery-related technologies through public-private partnerships. It is guided by the Biomass R&D Initiative, part of the Biomass R&D Act of 2000. The Program complements efforts by the USDA derived from Title IX of the Farm Bill of 2002 and the Healthy Forest Restoration Act of 2003, Title II.”
1.5 Program Goals and Multiyear Targets – Example of Goal Cascade from the Biomass Program
34

35
1.5 Program Goals and Multiyear Metrics – Example of Performance Goals from Wind Technologies Program
• By 2012, COE from large wind systems at Class 4 onshore sites: 3 cents/kWh. • By 2012, COE from large wind systems in Class 4 offshore, shallow water sites: 5 cents/kWh. • By 2016, COE from large wind systems in Class 6 offshore, transitional depth water sites: 5 cents/kWh. • By 2007, reduce the cost of electricity from distributed wind systems to 10-15 cents/kWh in 2007 in Class 3 wind resources. • By 2012, complete program activities addressing electric power market rules, interconnection impacts, operating strategies, and system planning needed for wind energy to compete without disadvantage. • By 2010, facilitate the installation of at least 100 MW of wind energy in 30 states.
Performance Goals
1.5 Program Goals and Multiyear Metrics – Example of Multiyear Targets from Wind Technologies Program
Outcomes
Outputs
87 81 Carbon (MMTCE/yr)
0.50 0.39
Natural gas (quads/yr)
111 93 Capacity (GW)
4 4 Energy Expenditures (B$/yr)
3.7 3.32 Energy (quads/yr)
2050 2025 Annual Savings
• U.S.-developed wind turbine technologies, for
low wind sites, that compete in the full range of electricity markets. • Offshore wind technologies that bring wind's benefits to coastal load centers, while limiting environmental and aesthetic impacts. • Advanced, cost-effective small wind technologies for use in distributed markets. • Techniques and knowledge to fully and equitably integrate wind systems into the national grid. • Reduced institutional and informational barriers that would impede wind’s use.

2.1.4 Technical (Non-Market) Challenges/Barriers – Example from Biomass Program
“There is a hierarchy of technical barriers for the Sugars Platform, with each lower level targeted to a more specifically defined technology. At the highest and most general tier, the barrier to commercial success is conversion cost for cellulosic biomass to sugar(s). At a second level, major contributors to sugar cost are broken out at a generic level. At a third level, selection of a specific technology allows greater specificity of critical barriers in terms of defined process unit operations that must perform to minimum standards and be able to be fully integrated with the other process operations to achieve the cost target.”
1st Tier
3rd Tier
2nd Tier
R&D Technical Barriers Feedstock-Sugars Interface
Biomass Pretreatment Enzymatic Hydrolysis
Sugars Processing Process Integration
Major General Barriers Feedstock Cost
Sugars Composition Sugars Yield
Conversion Rate Sugars Quality
Capital Investment
Commercial Success Barrier Price of Sugars from “Cellulosic” Biomass
36

2.1.6 Element/Subprogram Milestones and Decision Points – Example from Hydrogen, Fuel .1.6 Element/Subprogram Milestones and Decision Points – Example from Hydrogen, Fuel Cells, and Infrastructure Technologies Program
37

2.1.6 Gantt Charts – Example from the Solar Energy Technologies Program
38

39
2.1.6 Gantt Charts – Example from the Solar Energy Technologies Program (Continued)ample from the Solar Energy Technologies Program (Continued)

Appendix B: Glossary Activities. All the action steps necessary to produce program outputs. Auditable. Justifiable/empirical evidence is available and readily accessible to verify stated results. The documentation should directly confirm the reported result in a clear and consolidated manner. Identifying supporting documentation should not be an afterthought in formulating a performance measure. All submitted performance should include specific documentation that could serve as evidence for the reported result. Annual Milestone. (see “Milestone”) Baseline. The starting point from which gains are measured and targets are set. The baseline year shows actual program performance or prior condition for the given measure in a specified prior year.* (*Baselines in GPRA, however, do not only refer to conditions at the starting year of a program, but also the anticipated future changes in metrics for a scenario that assumes that the particular DOE program does not exist. Benefits over time are then measured as the delta between the metrics seen in the presence of the program and the metrics seen in the absence of the program.) Beneficiary. (see “Customer”) Benefits. (see “Outcome”) Critical Path Milestone. (see “Milestone”) Customer. The beneficiaries of the program’s products or services, e.g., citizens, business, governments, and internal Federal operations. Decision Point. A clearly defined point during the performance of an activity where a decision can be made to go on to the next phase, to stop, change direction, or re-focus the activity. Decision points include the identification of circumstances under which the program should end (see “End Point”). A decision point can also be a termination point if the decision is made to prematurely end the activity because milestones have not been reached, or cannot be reached with knowledge that is available or reasonably anticipated (see “Termination Point”). (Related Concepts: Off-ramp; Exit strategy; go/no-go decision point; critical path milestone). End Point. (Synonyms and Related Concepts. “Completion Milestone”). The planned conclusion of an R&D or deployment activity program that reflects the intended successful achievement of a desired goal. Evaluation, Program. Systematic studies conducted periodically or on an ad hoc basis to assess how well a program is working. They help managers determine if timely adjustments are needed in program design to improve the rate, or quality, of achievement relative to the committed resources.
40

External Factor. Factors or events outside the control of the program that could affect the relative success of the program (positively or negatively). Go/No-go Milestone. (See “Decision point”) Input. Resources (dollars, people, skills, and knowledge) available to programs to produce outputs and outcomes. Logic diagram. See Appendix D.
Long term. (see “Short” and “Intermediate” term)
Short term 3 years or less Intermediate term 4-10 years Long term 10 years or more
Market Failures or Barriers. Deficiencies that obstruct or impede the development of or entry of technologies or practices into the market or prevent efficient operation of the market. Market Barriers and Failures
Description and Examples
Deficiencies in information / awareness
Lack of consistent, accurate, unbiased information on the performance, benefits, and costs of different energy technologies and services. End users and decision-makers have limited awareness of efficiency/ renewable options and benefits and costs. Current tax provisions or other subsidies favor other technologies or practices.Principal/Agent issues (information asymmetry) may arise when knowledge of all of the costs and benefits is not fully shared between facilitators or delegated managers and the ultimate customer/decision-maker (e.g., relationship between builders and buyers).
Policy, regulation Potentially incompatible policies, regulations, or codes and standards.Cost and Financing Limited access to capital (e.g., low-income households, small
businesses). Purchasers are more concerned with low first-cost than with life-cycle cost. Financing instruments available do not provide credit for the savings that the buyer will realize.
Technical capacity and knowledge
Limited knowledge and capacity of service providers, project developers, users, and decision-makers. For example, insufficient skills or experience with “systems (optimization)” and how to specify, design whole systems or applications for end-users. Limited experience with transactions and processes necessary to successfully procure and implement a technology or service.
Risk Aversion Some potential buyers or users of improved technology and practices may give greater weight in their decision-making to the "downside risk" of a technology failure than they give to the upside benefits of a
41

technology success. Market fragmentation and undeveloped market structures
Market fragmentation arises when market agents and investors make decisions in one market segment without adequately interacting with others from the other market segments. (e.g., the fragmentation that characterizes the U.S. building industry where developers, designers, builders, utilities, engineers, and occupants pursue objectives which often are at cross-purposes.) Undeveloped market structures include lack of infrastructure to support technology use as has been the case for alternative fueled vehicles which require significant fueling infrastructure).
Misplaced or Displaced Incentives
The person or organization that would make the decision about adopting a particular technology or practice is different from the one who would derive economic benefits. A classic example is a landlord who makes building investments and a tenant who pays all of his own utilities.
Externalities Price signals don’t reflect costs – e.g., don’t account for many environmental costs, or are not time-differentiated.
Public Goods The social benefits cannot be appropriated by any one company to a sufficient degree to justify the required investment.
Market Power When firms have market power they tend to cut back production in order to drive up prices and increase profits – e.g., product supply decisions made by a few powerful equipment manufacturers.
Market Improvement Opportunity (MIO). Potential market expansion that has a realistic possibility of being achieved. For instance, expanding domestic secondary aluminum production from 3 million tons/yr to 4 million tons/yr or increasing market penetration from 30% to 50%. Meaningful. A performance measure is “meaningful” if it measures the outputs the program is intended to achieve. Performance measures should be relevant to the program, and therefore capture the most important aspects of a program’s mission and priorities. Meaningful measures will be useful for the program partners, stakeholders, and citizens. Although it is tempting to design measures around existing data, those are not always the most meaningful. Metric. Unit of measurement used to assess an input, milestone, output or outcome measure. Metrics may be quantitative such “dollars per gallon” or qualitative such as “completed/not completed.” Milestone. A measurable, discrete event or accomplishment marking identifiable and measurable progress toward a desired result. Milestones are further characterized as annual performance, critical path, or completion milestones.
Annual milestone. A performance milestone that marks progress toward an outcome on a fiscal-year basis.
Critical path milestone. A performance milestone that must be completed on schedule for an output to be produced on schedule
Completion milestone. The final performance milestone marking a completion decision point or the achievement of a final output.
42

Mission Statement. The charter of the program and provides the basis for all subsequent planning activity. Program performance goals flow up into the program’s mission. Objective. (Synonym is “goal”)
Off-ramp. (See “Decision Point”)
Outcomes. (See Appendix D, Logic Diagram Development Guide)
Outputs. (See Appendix D, Logic Diagram Development Guide) Partners. Other public and private sector agencies and intermediaries responsible for carrying out different aspects of the program “including grantees, sub-grantees, contractors, cost-sharing partners, and other government partners.”
Peer Review. A rigorous, formal, and documented evaluation process using objective criteria and qualified and independent reviewers to make a judgment of the technical/ scientific/business merit, the actual or anticipated results, and the productivity and management effectiveness of programs and/or projects.
Performance Goal. A tangible, measurable target against which actual achievement can be measured, such as a quantitative amount, value or rate. A performance goal must contain a date. Performance goals are output-oriented while program strategic goals are outcome-oriented. Performance Measure. A general term for any indicator, statistic or metric used to gauge program performance.
Program. A centrally managed set of activities directed toward a common purpose or goal in support of an assigned mission area. Generally, a program is the highest level of work breakdown structure within a specific mission area.
Program Assessment. A determination, through objective measurement and systematic analysis, of the manner and extent to which Federal programs achieve intended objectives.
Program Element. (see also “Subprogram”) Has the same characteristics of a program (but represents one additional level of division). It is the second level of the work breakdown structure, which is also sometimes referred to as a subprogram.
Project. The lowest level of the work breakdown structure. It is an executable element of a program, normally with a discrete start and end point, as well as a scope, schedule and budget. A single project has a program lead, may have multiple phases that cover more than one year, has a project manager and may include multiple awards in support of its objective. For monitoring and assuring progress, interim and final milestones are instituted as an integral part of the project management process.
Resources. (See “input”)
43

Short-term. (See “long-term”)
Stakeholder. Persons or groups who are affected by and/or have an interest in the existence and performance of the program. Beneficiaries and customers are subsets of stakeholders.
Strategic Goal. Program goals that aim to achieve the program’s vision. Strategic goals are outcome oriented and broader than performance goals and contain elements that are beyond the program’s control. They may contribute significantly toward achieving the end-state described in the vision, and are the accumulated program outcomes. As opposed to performance goals, which are output-oriented and more near-term, strategic goals are outcome-oriented and can be longer-term. These measures should be monitored by the program, but not necessarily measured. Program outcome goals should relate to and in the aggregate be sufficient to influence the strategic goals or objectives
Subprogram (see also “Program Element”). Has the same characteristics of a program (but represents one additional level of division). It is the second level of the work breakdown structure, which is also sometimes referred to as a program element.
Target. Quantifiable or otherwise measurable characteristic that tells how well a program must accomplish a performance measure. Targets must be ambitious (i.e., set at a level that promotes continued improvement) and achievable given program characteristics. Technology Improvement Opportunity (TIO). Potential advance in a technology that has a realistic possibility of being achieved. For instance, improving the efficiency of a technology from 30% to 40%. Termination Point. The conclusion of an R&D or deployment activity program that results from a decision point. A termination point may result from a program successfully meeting its goals ahead of time or from failure to meet performance or other conditions for termination. Industry-relevant programs should identify any “off ramps” in their program plans – whether, when, and how aspects of the program may be shifted to the private sector.
Trendable. A quality of a milestone, preferably quantitative in nature, that makes it possible to measure, on a periodic basis, progress toward achieving goals.
Vision Statement. A vision statement describes the desired future state of the market and society that the program intends to help achieve.
44

Appendix C: MYPP Drivers Numerous legislative, Administration, and Department policies and procedures dictate both the need for, and the process and content of multiyear program planning over and above program managers’ planning needs. These include:
• Government Performance and Results Act (GPRA) – Linkage of budget request to outputs and outcomes and to the Strategic Plan
• President’s Management Agenda and OMB Program Assessment Rating Tool (PART) – Provide program justification – Set performance goals – Link dollars to planned activities – Establish targets/milestones – Measure progress and resulting benefits – Include decision points and end points
• CFO – Report quarterly and annual milestones linked to DOE Strategic Goals – Management and Evaluation (ME-20) Program Plans
• Congress (House Rpt.108-554 - Energy and Water Development Appropriations Bill, 2005)
– Beginning with submission of the fiscal year 2007 budget request…submit to Congress detailed five-year budget plans for all major program offices and a consolidated five-year budget plan for the entire Department.
– Preparation of these five-year program plans and the comprehensive five-year DOE plan to be a Federal function
A Program may consult with its contractors in developing its five-year plans, but the actual preparation of these plans is not to be contracted out; this work is to be done by Federal employees of the Department of Energy.
45

Appendix D: Logic Diagram Development Guide
D.1 What is a Logic Diagram? A logic diagram is a diagram that describes the key elements of the “Results Chain” or entire “Performance Spectrum”, linking program inputs to long term goals and ultimate outcomes. A typical logic diagram includes program inputs, activities, outputs, target audience, and outcomes. External factors affecting performance may also be included. Because EERE programs are made up of several program elements that are tackling different stages of the RDD&D continuum, multiple technologies, and multiple areas of technology acceptance or deployment, the program logic is often best depicted in two dimensions (Figure D.1). The first dimension is the “Performance Spectrum” (shown top to bottom in Figure D.1). The second dimension is the logical sequence of program activities referred to as the “Performance Path” (shown left to right in Figure D.1). The logic diagram is often shown with these linear relationships, but in reality there are feedback loops across different activities and outcomes. Usually only the most important ones are shown.
Figure D.1 Two-Dimensional Logic Diagram Structure
Activity 1 Activity 2 Activity 3 Activity 4Performance Path
Perf
orm
ance
Spe
ctru
m
Inputs(Resources)
Activities
Outputs
Outcomes
Long-term outcomes /
impacts
With whomFor whom
Exte
rnal
Fac
tors
Activity 1 Activity 2 Activity 3 Activity 4Performance Path
Perf
orm
ance
Spe
ctru
m
Inputs(Resources)
Activities
Outputs
Outcomes
Long-term outcomes /
impacts
With whomFor whom
Exte
rnal
Fac
tors
The logic diagram can be the basis for a convincing story of the program’s expected performance – telling stakeholders and others the problem the program focuses on and how it is uniquely
46

qualified to address it. Perhaps most importantly, the logic diagram is very helpful in identifying metrics and key research questions for performance measurement and evaluation.
D.2 How to Develop a Logic Diagram The process of building a succinct and plausible model of how the program will work under certain conditions to solve identified problems clarifies and builds a shared understanding of the program. Logic diagramming is best done as a group process by small number of people familiar with the existing program or the opportunities for a new program. Even with the templates provided by PBA (see below), clarifying the performance path and expectations for a complex program is not easy. Thus we recommend that the group process be facilitated by someone with some experience in developing logic diagrams. This does not have to be a long, drawn out process.
Logic diagrams may be prepared at any time in the life cycle of the program and are often revised as more program information is collected. The level of detail in a logic diagram will vary by audience and use. High level logic diagrams are useful for describing the program to audiences with limited knowledge of the program. More detailed models can further explain the logic to those familiar with the program and may be used to identify evaluation questions. Both diagrams enable the logic diagram audience to understand and evaluate the hypothesized linkages from program actions to outcomes. The notion is to pare down concepts and words so the essence of a program’s logic can be displayed on a single page. Such brevity cannot stand alone, however, and thus accompanying text should be developed to guide people through the logic and provide the detail or examples needed to understand the logic.
An overview of the steps involved in developing a logic diagram is provided below. These steps are presented as linear, but in reality logic diagramming is an iterative and dynamic process.
First: Collecting the relevant information. Collect information relevant to the program from multiple sources, such as strategic plans, existing metrics, previous program evaluations, pertinent legislation and regulations, interviews with key stakeholders both internal and external to the program, and literature reviews to gain insights on relevant social science theory and what others have done to solve similar problems.
Second: Describing the problem the program will solve and its context (outcomes). The program should be grounded in an understanding of the problem that drives the need for the program. Who is involved, and what factors “cause” the problems. What are the technology gaps and market barriers? Which will the program address, and which remain as external influences?
Third: Describing the strategy/logic in diagram and text. There are two possible approaches for clarifying links between the outcomes defined in the first step and program activities. One is to organize the outcomes and for each outcome to describe the sequence or confluence of events that must occur for that to happen, separating out program and non-program factors, going all the way back to program activities. The second is to categorize all the collected information into
47

“bins” (resource, activity, output, short-term outcome, intermediate outcome, ultimate outcomes) and then organize them into streams of cause and effect.
Fourth: Verifying the logic diagram with stakeholders. It is a good idea to check to see if a broader group of program stakeholders finds the logic clear and plausible. Are all major program elements represented? Are there gaps (“magic in the middle” ) or is it clear how program action will – through the action of industry and other market actors – result in the desired outcomes?
Fifth: Using the logic diagram in monitoring and evaluation. Once the logic diagram is developed it may be used to identify measurement areas and evaluation questions. Areas of measurement are represented by the boxes in the logic diagram. A performance indicator or metric may be identified for each box in the logic diagram. Evaluation questions are represented by the arrows between boxes in the logic. For instance, “did these activities cause the outcomes and why?”
D.3 Specific Questions
Questions Below is a list of questions that may help you develop your program logic diagram. Generic answers to these questions can be found in the EERE RDD&D logic diagram template (Figure D.2). Your answers to the questions, and the logic diagram you develop, need to be more specific, however. 1. What are the ultimate expected program outcomes, the national need that is the rationale for the program? Which of the EERE goals does your program address?
2. What (interim) outcomes in specific markets and/or technology areas will the program influence in order to achieve those ultimate outcomes? We suggest that you describe both short- and intermediate-term outcomes to express a sequence that occurs over a period of time. See “Tips for Defining a Sequence of Outcomes” below for help with this part.
3. What technical and/or market development outputs will the program achieve so that the interim outcome happens? These are the components that are needed to achieve the short-term outcomes described above. These are likely to be major or representative outputs (milestones) for each program element. 4. What 5-7 groups of activities describe the majority of program activities? These can be grouped by budget line item. Given the different time to commercialization, it can also help to group them by RDD&D stage.
5. What resources are needed to accomplish these activities? 6. What are the program’s assumptions about major external influences of program success? You can think in terms of four types of influences: Technical, economic, political/regulatory, and social/cultural.
48
Tips for Defining a Sequence of Outcomes • These outcomes assume your target audience has taken the outputs of your program and done
something with them. What is it you are assuming that they will do? You can’t control it, but you HAVE to influence it.
• Show in your logic the specific factors in the market and the RDD&D that your program emphasizes. All EERE programs work to the same end – wide technology or practice adoption – but there are many ways to influence that. Be specific about the end users and their needs, the research or technology gaps, and/or the market infrastructure gaps that the program addresses.
• You will see some of the possible sequences of outcomes in Figure D.2. The middle of the three outcome columns is shown as one boxed group because they themselves might be a sequence of outcomes. For example, if a program outcome is to increase R&D capabilities, that leads to hand-offs to the R&D community and industry for further R&D, which could lead to commercial launch. It is also true that the outcomes in that box line up with the individual box before it.
• To clarify this sequence, and perhaps identify necessary precursors to these interim outcomes, ask (1) specifically, how would you define success for each outcome? (2) what non-program factors will contribute or prevent success? (3) what program factors will contribute to or prevent success?
D.4 Useful Logic Diagram Templates
A tabular logic worksheet to help get you started with the logic diagramming process Begin by identify the resources, different activities, target audiences and the program outputs and outcomes, placing the information in a tabular form. Later you will have to remove the artificial structure of the boxes and move things around to create a two dimensional logic diagram structure. This initial tabular worksheet will help you get started.
49

Logic Diagram Tabular Worksheet Inputs/ Resources list: Program structure or Activity Areas
Activity 1 Activity 2 Activity 3 Activity 4 Activity 5
Outputs
-
Target Audiences
-
Short-Term Outcomes
-
Mid-Term Outcomes
-
Ultimate Outcomes
-
External Factors list:
A Generic RDD&D Logic Diagram Template Figure D.2 shows a generic logic for EERE RDD&D programs. It shows both a form to follow for the diagram, and substance of the logic of how RDD&D programs lead to benefits from adoption of clean and efficient energy technologies and practices. Notice the difference in the two templates. In the example in Figure D.2, activities are the rows rather than the columns.
Figure D.2 Generic RDD&D Logic Diagram Template
Increased national R&D capabilities
Realized & potential:
Reduced fossil fuel
consumption
Reduced impact on
environment from energy technologies
Security benefits
Hand offs to R&D
communityand industry
Commercial Launch
Increasing adoption/
diffusion of technologies
Changed markets
Exploratory Research
Investigation
DevelopmentResearch
TechnicalSupport
Development
Validation
Funding
R&D Infra-structure
National priorities
Program plans &
assessment
Partnerships
Ideas
Inputs OutputsActivities
Commercial Launch /
DeploymentFacilitation
Improvements inknowledge, policy,
business infrastructure, end
user demand
Increased market readiness and early
penetration for a technology
NAS Benefit:Contributions to Knowledge, Policy, and Industry Success (intended and unintended)
External Influences onsuccess, positive and
negative
Additions to R&D infrastructure(e.g., facilities, system tools)
Proof of concepts and potential
applications or development
Improved components
Improved systemengineering/ integration
Improved system performance and
cost
Pre-development advances in a next
generation technology
Program Management
Interim Outcomes UltimateOutcomes
50

A Template for Technology Acceptance/Deployment Efforts Technology acceptance and deployment efforts can take advantage of additional templates developed by PBA. The high level template below can clarify the logic of the complex process of diffusion of a technology or practice (Figure D.3). Detailed logics for each of the three infrastructure areas (develop technical information, assist public entities, and assist businesses) and end users are also available from PBA.
Figure D.3 Template for Technology Acceptance Logic Diagram
Analyze and Plan
Develop Technical
Information
Assist Public
Entities
Assist Businesses
Outreach and
Partner
Provide Tools and Technical
Assistance
Assist and Fund
Purchases
Build InfrastructureReviewing
and Reporting
Fund and Promote Adoption
Federal, state, and
local agencies
Manufacturers distributors
retailers
End-user organizations, firms and individuals
Technical and other personnel in laboratories,
government, firms, colleges,
universities
Create, advance, and package market
and technical knowledge to make energy efficiency more accessible
and implementable
Change the policies,
structure and operation of
public entities to smooth the
advance energy efficiency
Create and enhance products, create and
align market channels, enhance
marketing, and develop installation
and support infrastructures
Adopt, replicate, institutionalize, and enculturate energy efficient
technologies and practices
To target
So that these target audiences will
Thereby
Reducing energy use and emissions, enhancing productivity, and global security
D.5 Relationship to Stage Gate and Gantt Chart Processes The stages of the stage gate process are in the logic in both the vertical and horizontal dimensions. The stages (exploratory research through commercial launch) are the elements of the activities column, with the addition of a row for program management and infrastructure building. The stages are also implicit across rows, with movement from R&D progress to commercial launch and ensuing benefits. A particular technology effort may be in one of these stages and in the process of moving to the next, but programs often have efforts in multiple technologies in different stages at the same time. Just as the stage gate process requires a business case, the logic diagramming process has to describe the movement from technology development to commercial launch and the benefits that ensue from that, whether or not the program has technology acceptance and deployment activities. Programs may ask about the relationship between logic diagrams and Gantt charts. The intention of Gantt charts is to show critical paths and sequential tasks or milestones along that critical path.
51

Of course there are tasks that occur in parallel also. They tend to be detailed milestones by a work break down structure. The chart would not typically show what happened after the program completed its outputs, and as we have seen, for technology development efforts, managers also need the information in that business case when making decisions. Gantt charts are typically more detailed than logic diagrams and thus are not as useful for concisely describing how a program works. However, a combination of a program logic diagram and supporting Gantt charts may be very powerful.
D. 6 Using Logic Diagrams for Defining Program Metrics Logic diagrams can be used to identify and define program metrics. Figure D.4 below provides an example of potential metrics for a Generic Energy RDD&D Program. Potential metrics are shown in the boxes.
Figure D.4 Potential Metrics for Generic Energy RDD&D Program
# patent and journal citations
# R&D 100 awards
Realized & Potential:
Primary non-
renewable energy savings
(quads/yr)
Energy-expenditure
savings (billion $/yr)
Carbon savings
(MMTCE/yr)
Oil savings (mbpd)
NG savings (quads/yr)
% share of private
investment in this area
# of technologies commercial-
ized
Manufacturing capacity
(# units)
# units in the market
% market share
Sustained changes in attitudes,
policy, business supply
chain, end user
demand
Exploratory Research
Investigation
DevelopmentResearch
TechnicalSupport
Development
Validation
$ Federal Funding
$ Cost share
% Federal funding
earmarked
% uncostedbalances
% market share
represented by partners
Inputs Outputs Interim OutcomesActivities
Commercial Launch /
DeploymentFacilitation
# web hits# people trainedSq. ft. retrofitted
# standards reviewed
% of market that is:- aware of tech
- understands tech- will supply or buy
% efficiency of competing techsOil prices ($/barrel)
NG prices ($/tcf)Electricity prices (¢/kWh)
% GDP growth
Concepts provedTechnical advance
Tech milestones metFollow on R&D# patents, pub’s
% on time, on budget facility construction
% Unscheduled downtime
Component:Efficiency (%)
Reliability (mtbf)Lifetime (yrs)
Manufacturing:% Yield
Throughput (output/hr)
System:Efficiency (%)
Reliability (mtbf)Lifetime (yrs)
Capital cost ($)O&M cost ($/yr)
State of the art of facilities
Strength of technical networks
List of unintended knowledgebenefits/ use of technicaladvanceOption value benefits
ProgramManagement
UltimateOutcomes
Baseline and target levels of performance should be identified for the metrics for which data can be collected. One or more years of actual historic data should be provided as a baseline. Targets should be developed for the five years included in the MYPP’s planning horizon (e.g. 2006 to 2011) and for major increments thereafter (e.g., 2015, 2020, and 2025). A table for collecting this data is included below (Table D.1) using some of the metrics from Figure D.4. Programs may provide this information in the form of a Gantt chart instead of a table.
52

Table D.1 Examples of Baseline and Multiyear Targets for Generic RDD&D Program ACTUAL TARGETS METRIC 2004 2005 2006 2007 2008 2009 2010 2011 2015 Inputs % of total program costs used for overhead Outputs % facility construction projects on time % facility construction projects w/in budget # techs under preliminary investigation # techs moving to detailed investigation # techs moving to development # techs moving to validation Efficiency of technology component (%) Reliability of technology component (mtbf) Lifetime of technology component (years) Manufacturing throughput (output/hr) # website hits Square feet of buildings retrofitted # standards analyzed and reviewed # patents and publications Interim Outcomes # of patent & journal citations # standards promulgated # of R&D 100 awards Efficiency of technology system (%) Reliability of technology system (mtbf) Lifetime of technology system (years) System capital cost ($/kW) System O&M cost ($/yr) % of market that is aware of technology % of market that understands technology % of market that will buy technology # of technologies commercialized Market penetration in innovator and early adopter market segments
Manufacturing capacity (units/yr) # of units in the market Ultimate Outcomes* Primary nonrenewable. energy savings (quads/yr)
Energy-expenditure savings (billion $/yr) Carbon savings (mmtce/yr) Oil savings (million barrels per day) Other non-energy outcomes Natural gas savings (quadrillion Btu/yr) External Factors Oil prices ($/barrel) NG prices ($/bcf) Electricity prices (¢/kwh) % GDP growth * Ultimate Outcomes includes both realized, actual benefits and GPRA projected benefits.
53