multiplex epifluorescence imaging - perkinelmer · fluorescence tomography system, has excellent...
TRANSCRIPT
Abstract
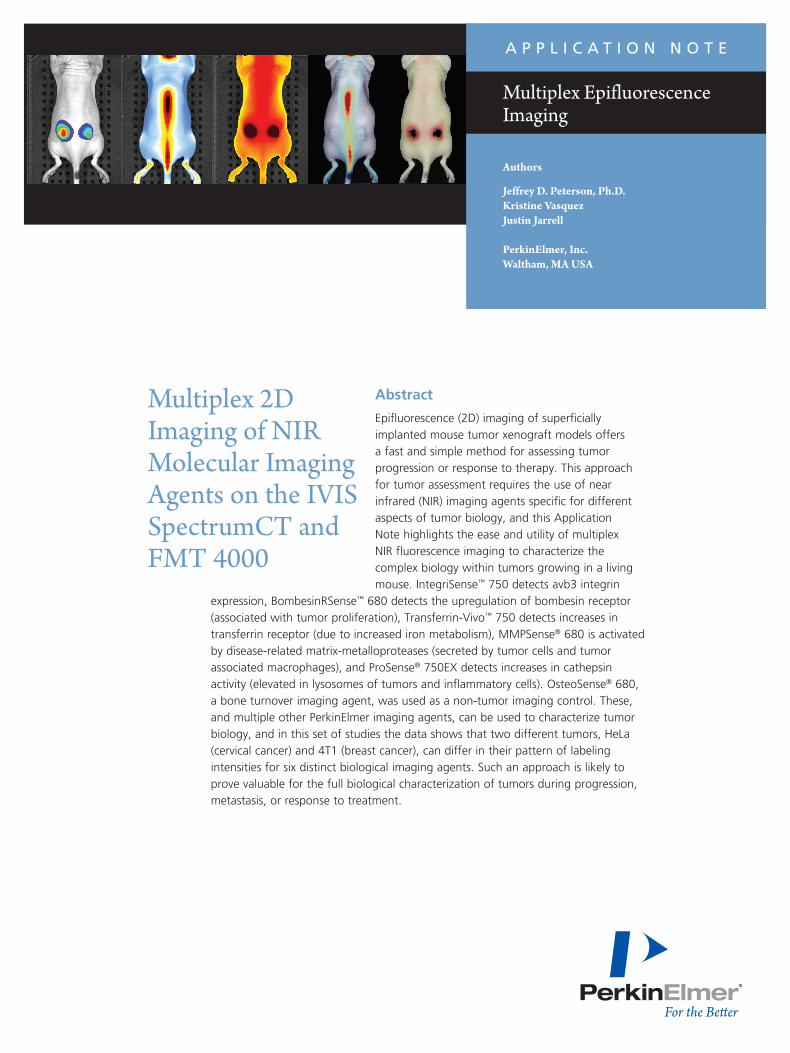
Epifluorescence (2D) imaging of superficially implanted mouse tumor xenograft models offers a fast and simple method for assessing tumor progression or response to therapy. This approach for tumor assessment requires the use of near infrared (NIR) imaging agents specific for different aspects of tumor biology, and this Application Note highlights the ease and utility of multiplex NIR fluorescence imaging to characterize the complex biology within tumors growing in a living mouse. IntegriSense™ 750 detects avb3 integrin
expression, BombesinRSense™ 680 detects the upregulation of bombesin receptor (associated with tumor proliferation), Transferrin-Vivo™ 750 detects increases in transferrin receptor (due to increased iron metabolism), MMPSense® 680 is activated by disease-related matrix-metalloproteases (secreted by tumor cells and tumor associated macrophages), and ProSense® 750EX detects increases in cathepsin activity (elevated in lysosomes of tumors and inflammatory cells). OsteoSense® 680, a bone turnover imaging agent, was used as a non-tumor imaging control. These, and multiple other PerkinElmer imaging agents, can be used to characterize tumor biology, and in this set of studies the data shows that two different tumors, HeLa (cervical cancer) and 4T1 (breast cancer), can differ in their pattern of labeling intensities for six distinct biological imaging agents. Such an approach is likely to prove valuable for the full biological characterization of tumors during progression, metastasis, or response to treatment.
Multiplex Epifluorescence Imaging
A P P L I C A T I O N N O T E
Authors
Jeffrey D. Peterson, Ph.D.Kristine VasquezJustin Jarrell
PerkinElmer, Inc. Waltham, MA USA
Multiplex 2D Imaging of NIR Molecular Imaging Agents on the IVIS SpectrumCT and FMT 4000
2
Materials and Methods:
Fluorescent Agents
Multiple NIR fluorescent agents (see Table 2) from PerkinElmer (Waltham, MA) were used to image tumors. These agents were developed for systemic intravenous injection and were rigorously designed for both biological targeting as well as for favorable drug-like properties of pharmacokinetics and biodistribution. All agents are extensively validated in vitro, in vivo, and ex vivo to assure proper mechanistic performance in vivo. As a control for the multiplex NIR imaging studies, the bioluminescent signal from the tumors (which express luciferase) was assessed to corroborate tumor size and location. The imaging dose for these agents was as recommended in the technical data sheet.
Luciferase-Expressing Tumor Lines
HeLa-luc cells (human cervical adenocarcinoma) and 4T1-luc2 cells (murine breast adenocarcinoma) were acquired from PerkinElmer (Waltham, MA). These tumor cell lines were generated by stable transfection of parent cells with luciferase genes expressed under the SV40 (HeLa) and human ubiquitin C (4T1) promoters. These cell lines can be implanted in nude mice for the purpose of longitudinal detection and imaging following bolus luciferin (the substrate for luciferase) injection. The resulting bioluminescent signal provides intensity measures that correlate with tumor burden and progression.
Tumor Models
Six to eight week-old female athymic nude mice were purchased from Charles River Laboratories (Wilmington, MA) and maintained in a pathogen-free animal facility with water and low-fluorescence mouse chow (Harlan Teklad, Madison, WI). Handling of mice and experimental procedures were in accordance with PerkinElmer IACUC guidelines and approved veterinarian requirements for animal care and use. To induce tumor growth with 4T1-luc2 mouse breast adenocarcinoma cells, mice were injected in both upper mammary fat pads with 1x10⁶ cells/site (PerkinElmer, Waltham, MA), yielding 130-250 mm3 tumor masses within 8-9 days. To induce tumor growth with HeLa-luc cervical cancer cells, mice were injected in two flank sites on the lower back with 2x10⁶ cells/site (PerkinElmer,
Waltham, MA), yielding 500-1000 mm3 tumor masses within 13-19 days. See Figure 3.
These models provided a tool to assess the ability of multiplex imaging to define biological changes associated with tumor growth.
In Vivo Imaging Systems
The IVIS® SpectrumCT and FMT® 4000 imaging systems (PerkinElmer, Waltham, MA) were both used in parallel for all tumor imaging studies. The IVIS SpectrumCT is an optical imaging system designed for fast, high-throughput (multi-animal) 2D imaging of both bioluminescence and fluorescence signal with tomographic capabilities. The FMT 4000 is a dedicated, single-animal rapid fluorescence tomography system with epifluorescence capabilities. See Table 3.
In Vivo 2D Imaging and Analysis
Mice were imaged on the IVIS SpectrumCT for bioluminescence signal, 15 minutes after intraperitoneal luciferin injection, as a means to corroborate the size and location of the 4T1 and HeLa tumors. Two-wavelength (680 and 750 nm) NIR epifluorescence imaging was performed on both the IVIS SpectrumCT and FMT 4000 to detect the 6 different NIR imaging agents injected intravenously as 680/750 pairs in individual mice. Fluorescence was imaged 24 h following agent injection. IVIS SpectrumCT data was analyzed using Living Image® 4.3.1 software. ROIs were placed around the two tumors in each mouse, and a background region was selected in a nearby region. Background was automatically subtracted from tumor signal. FMT 4000 epifluorescence data was analyzed by TrueQuant software, also subtracting background fluorescence from tumor signal. All data was represented as mean fluorescence per tumor region as the best means to normalize for differences in tumor size.
Table 1. In Vivo Imaging Filters
System 680 nm 750 nm BLI
IVIS SpectrumCT Ex 675 nm Ex: 745 nm Ex: N/A Em: 720 nm Em: 800 nm Em: Open
FMT 4000 Ex: 670 nm Ex: 745 nm __________ Em: 690 nm Em: 770 nm
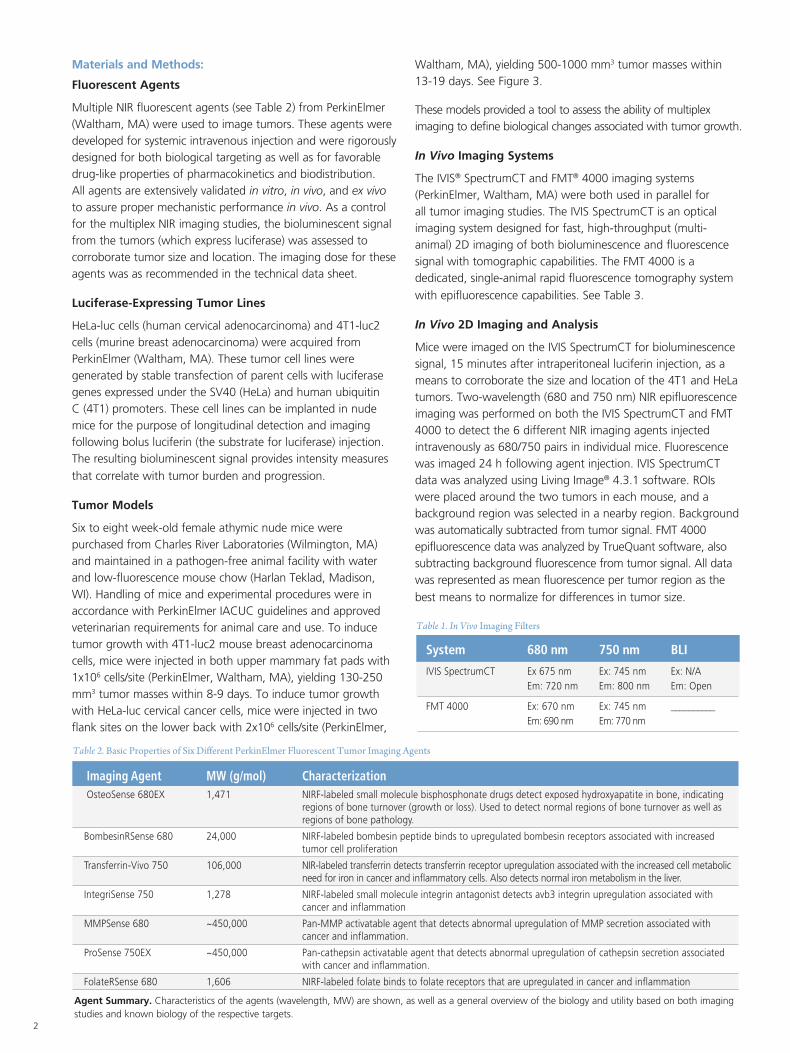
Table 2. Basic Properties of Six Different PerkinElmer Fluorescent Tumor Imaging Agents
Imaging Agent MW (g/mol) Characterization OsteoSense 680EX 1,471 NIRF-labeled small molecule bisphosphonate drugs detect exposed hydroxyapatite in bone, indicating
regions of bone turnover (growth or loss). Used to detect normal regions of bone turnover as well as regions of bone pathology.
BombesinRSense 680 24,000 NIRF-labeled bombesin peptide binds to upregulated bombesin receptors associated with increased tumor cell proliferation
Transferrin-Vivo 750 106,000 NIR-labeled transferrin detects transferrin receptor upregulation associated with the increased cell metabolic need for iron in cancer and inflammatory cells. Also detects normal iron metabolism in the liver.
IntegriSense 750 1,278 NIRF-labeled small molecule integrin antagonist detects avb3 integrin upregulation associated with cancer and inflammation
MMPSense 680 ~450,000 Pan-MMP activatable agent that detects abnormal upregulation of MMP secretion associated with cancer and inflammation.
ProSense 750EX ~450,000 Pan-cathepsin activatable agent that detects abnormal upregulation of cathepsin secretion associated with cancer and inflammation.
FolateRSense 680 1,606 NIRF-labeled folate binds to folate receptors that are upregulated in cancer and inflammation
Agent Summary. Characteristics of the agents (wavelength, MW) are shown, as well as a general overview of the biology and utility based on both imaging studies and known biology of the respective targets.
3
Introduction and Results
Fluorescent Agents
Preclinical imaging of NIR imaging agents in mouse models offer a unique opportunity to capture important biological processes such as disease relevant biomarker upregulation, changes in protease activity, vascularity and vascular leak, inflammation, cell death, and metabolism, in situ and in a living animal. PerkinElmer offers a variety of NIR imaging agents, and a suite of unparalled imaging instrumentation platforms, to detect biological changes associated with disease as measured by quantification of fluorescent signal. The IVIS SpectrumCT and FMT 4000, in particular, provide useful visualization capabilities (a variety of color palettes) and quantification tools for epifluorescence screening of mice. The IVIS SpectrumCT offers a range of 2D and 3D imaging capabilities, including bioluminescence imaging, a broad range of wavelengths for fluorescence excitation (10 filters ranging from 415-760 nm), and the ability to perform advanced spectral unmixing
for better separation of fluorescence signals. The FMT 4000, although designed as a dedicated high-throughput fluorescence tomography system, has excellent epifluorescence capability focused on 4 discrete Red/NIR excitation wavelengths (635, 670, 745, and 785 nm).
For these studies, we focused on simple and rapid epifluorescence imaging, comparing human cervical adenocarcinoma tumor xenografts (HeLa-luc) to orthotopic mouse mammary adenocarcinoma tumors (4T1-luc2) in nude mice. Both tumor lines express avb3 integrin, MMP and cathepsin protease activity, and bombesin and transferrin receptors. Use of appropriate imaging agents (see Table I) allows the detection of these biomarkers non-invasively in vivo in living mice. All mice were maintained on low fluorescent chow, and all agents selected for these studies are excited at either 670 nm or 745 nm, allowing optimal imaging conditions with an expectation of minimal background and no cross-talk between the two agent wavelengths on either system.
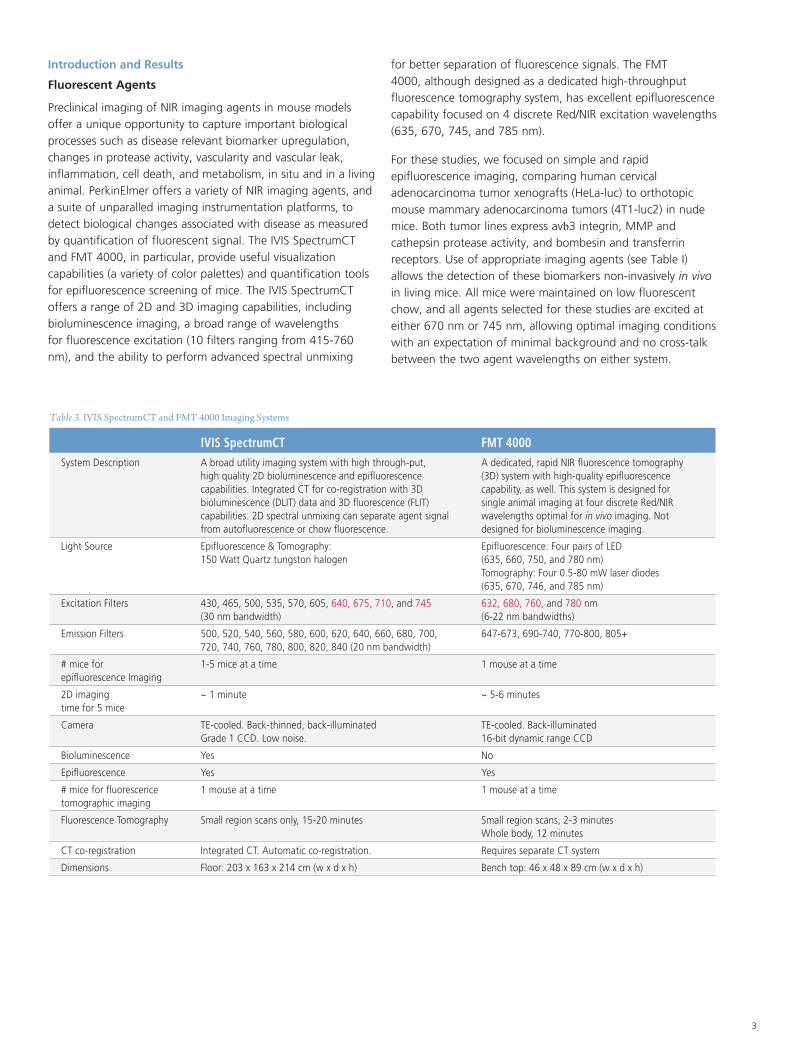
Table 3. IVIS SpectrumCT and FMT 4000 Imaging Systems
IVIS SpectrumCT FMT 4000System Description A broad utility imaging system with high through-put, A dedicated, rapid NIR fluorescence tomography high quality 2D bioluminescence and epifluorescence (3D) system with high-quality epifluorescence capabilities. Integrated CT for co-registration with 3D capability, as well. This system is designed for bioluminescence (DLIT) data and 3D fluorescence (FLIT) single animal imaging at four discrete Red/NIR capabilities. 2D spectral unmixing can separate agent signal wavelengths optimal for in vivo imaging. Not from autofluorescence or chow fluorescence. designed for bioluminescence imaging.
Light Source Epifluorescence & Tomography: Epifluorescence: Four pairs of LED 150 Watt Quartz tungston halogen (635, 660, 750, and 780 nm) Tomography: Four 0.5-80 mW laser diodes (635, 670, 746, and 785 nm)
Excitation Filters 430, 465, 500, 535, 570, 605, 640, 675, 710, and 745 632, 680, 760, and 780 nm (30 nm bandwidth) (6-22 nm bandwidths)
Emission Filters 500, 520, 540, 560, 580, 600, 620, 640, 660, 680, 700, 647-673, 690-740, 770-800, 805+ 720, 740, 760, 780, 800, 820, 840 (20 nm bandwidth)
# mice for 1-5 mice at a time 1 mouse at a time epifluorescence Imaging
2D imaging ~ 1 minute ~ 5-6 minutes time for 5 mice
Camera TE-cooled. Back-thinned, back-illuminated TE-cooled. Back-illuminated Grade 1 CCD. Low noise. 16-bit dynamic range CCD
Bioluminescence Yes No
Epifluorescence Yes Yes
# mice for fluorescence 1 mouse at a time 1 mouse at a time tomographic imaging
Fluorescence Tomography Small region scans only, 15-20 minutes Small region scans, 2-3 minutes Whole body, 12 minutes
CT co-registration Integrated CT. Automatic co-registration. Requires separate CT system
Dimensions Floor: 203 x 163 x 214 cm (w x d x h) Bench top: 46 x 48 x 89 cm (w x d x h)
4
No Crosstalk Between 680 nm and 750 nm NIR Imaging Agents
When performing multiplex fluorescence imaging in mice, spectral crosstalk is an important issue to consider, depending on the spectral wavelength(s) to be imaged, whether the mice have been fed low fluorescent chow, and whether the fluorophores overlap each other in their absorption and emission profiles. In particular, autofluorescence or chow related fluorescent signal can be an issue when imaging 635 or 680 nm fluorescent agents. However, if you keep your mice on low fluorescent chow, background signal in mice is low enough to be negligible when imaging at 680 or 750 nm wavelengths, the two most common NIR wavelengths for in vivo imaging agents.
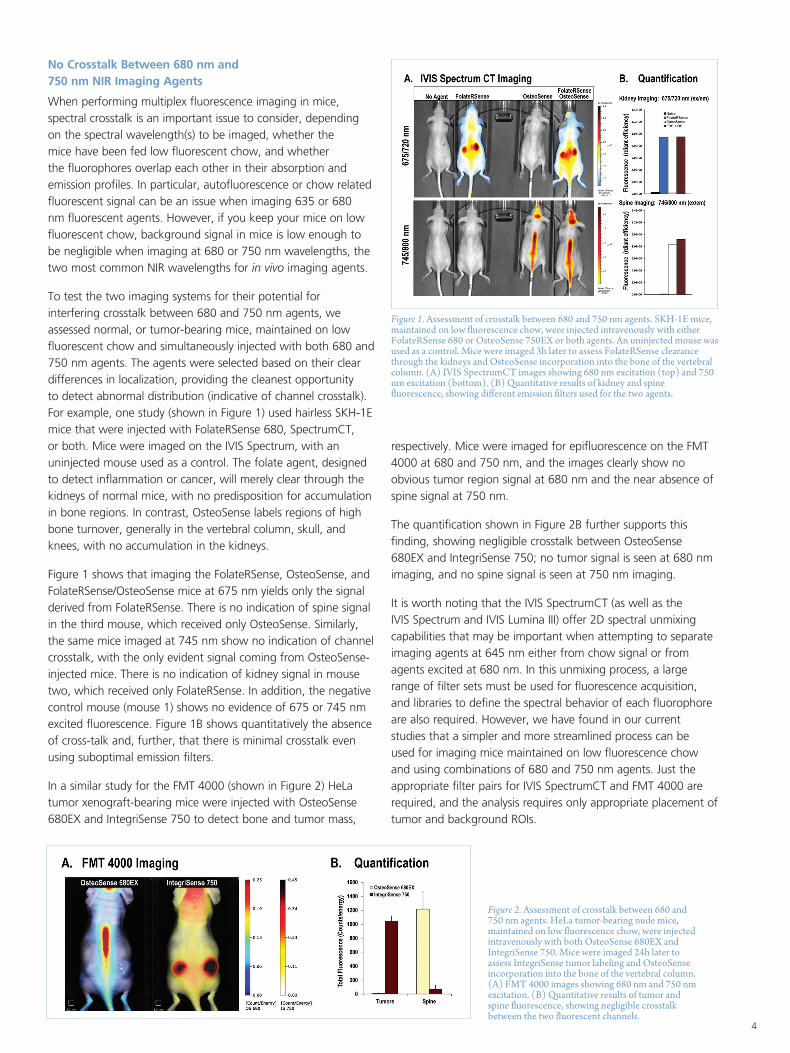
To test the two imaging systems for their potential for interfering crosstalk between 680 and 750 nm agents, we assessed normal, or tumor-bearing mice, maintained on low fluorescent chow and simultaneously injected with both 680 and 750 nm agents. The agents were selected based on their clear differences in localization, providing the cleanest opportunity to detect abnormal distribution (indicative of channel crosstalk). For example, one study (shown in Figure 1) used hairless SKH-1E mice that were injected with FolateRSense 680, SpectrumCT, or both. Mice were imaged on the IVIS Spectrum, with an uninjected mouse used as a control. The folate agent, designed to detect inflammation or cancer, will merely clear through the kidneys of normal mice, with no predisposition for accumulation in bone regions. In contrast, OsteoSense labels regions of high bone turnover, generally in the vertebral column, skull, and knees, with no accumulation in the kidneys.
Figure 1 shows that imaging the FolateRSense, OsteoSense, and FolateRSense/OsteoSense mice at 675 nm yields only the signal derived from FolateRSense. There is no indication of spine signal in the third mouse, which received only OsteoSense. Similarly, the same mice imaged at 745 nm show no indication of channel crosstalk, with the only evident signal coming from OsteoSense-injected mice. There is no indication of kidney signal in mouse two, which received only FolateRSense. In addition, the negative control mouse (mouse 1) shows no evidence of 675 or 745 nm excited fluorescence. Figure 1B shows quantitatively the absence of cross-talk and, further, that there is minimal crosstalk even using suboptimal emission filters.
In a similar study for the FMT 4000 (shown in Figure 2) HeLa tumor xenograft-bearing mice were injected with OsteoSense 680EX and IntegriSense 750 to detect bone and tumor mass,
respectively. Mice were imaged for epifluorescence on the FMT 4000 at 680 and 750 nm, and the images clearly show no obvious tumor region signal at 680 nm and the near absence of spine signal at 750 nm.
The quantification shown in Figure 2B further supports this finding, showing negligible crosstalk between OsteoSense 680EX and IntegriSense 750; no tumor signal is seen at 680 nm imaging, and no spine signal is seen at 750 nm imaging.
It is worth noting that the IVIS SpectrumCT (as well as the IVIS Spectrum and IVIS Lumina III) offer 2D spectral unmixing capabilities that may be important when attempting to separate imaging agents at 645 nm either from chow signal or from agents excited at 680 nm. In this unmixing process, a large range of filter sets must be used for fluorescence acquisition, and libraries to define the spectral behavior of each fluorophore are also required. However, we have found in our current studies that a simpler and more streamlined process can be used for imaging mice maintained on low fluorescence chow and using combinations of 680 and 750 nm agents. Just the appropriate filter pairs for IVIS SpectrumCT and FMT 4000 are required, and the analysis requires only appropriate placement of tumor and background ROIs.
Figure 1. Assessment of crosstalk between 680 and 750 nm agents. SKH-1E mice, maintained on low fluorescence chow, were injected intravenously with either FolateRSense 680 or OsteoSense 750EX or both agents. An uninjected mouse was used as a control. Mice were imaged 3h later to assess FolateRSense clearance through the kidneys and OsteoSense incorporation into the bone of the vertebral column. (A) IVIS SpectrumCT images showing 680 nm excitation (top) and 750 nm excitation (bottom). (B) Quantitative results of kidney and spine fluorescence, showing different emission filters used for the two agents.
Figure 2. Assessment of crosstalk between 680 and 750 nm agents. HeLa tumor-bearing nude mice, maintained on low fluorescence chow, were injected intravenously with both OsteoSense 680EX and IntegriSense 750. Mice were imaged 24h later to assess IntegriSense tumor labeling and OsteoSense incorporation into the bone of the vertebral column. (A) FMT 4000 images showing 680 nm and 750 nm excitation. (B) Quantitative results of tumor and spine fluorescence, showing negligible crosstalk between the two fluorescent channels.
5
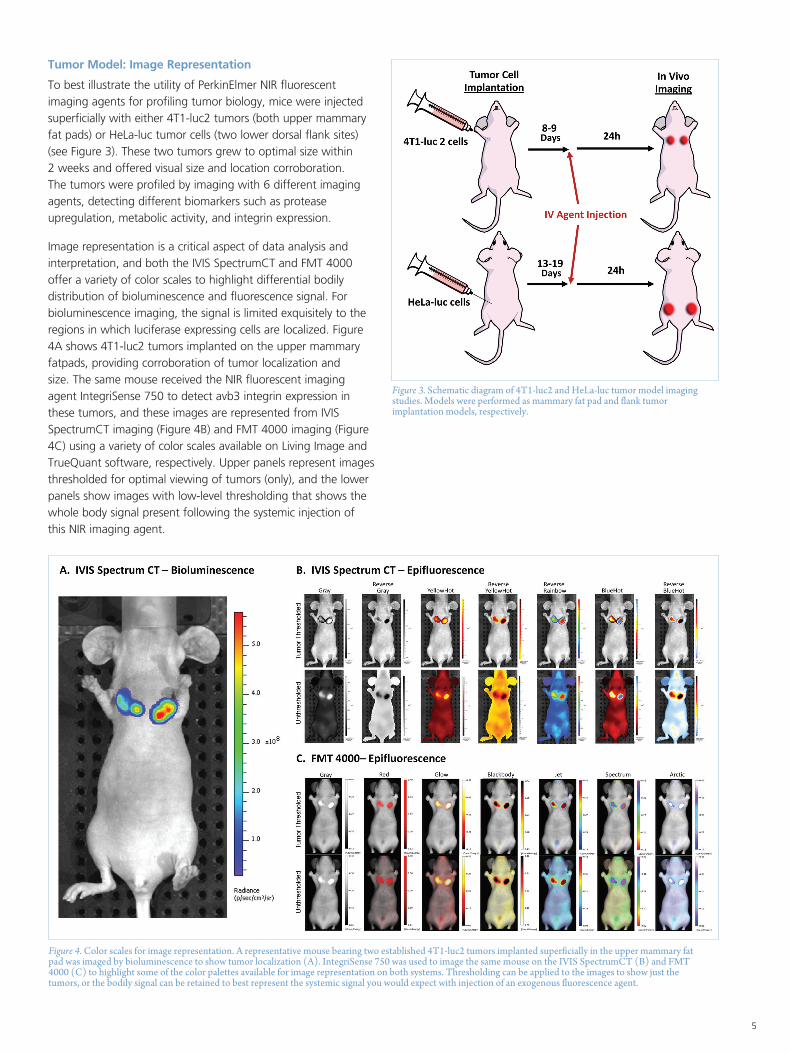
Tumor Model: Image Representation
To best illustrate the utility of PerkinElmer NIR fluorescent imaging agents for profiling tumor biology, mice were injected superficially with either 4T1-luc2 tumors (both upper mammary fat pads) or HeLa-luc tumor cells (two lower dorsal flank sites)(see Figure 3). These two tumors grew to optimal size within 2 weeks and offered visual size and location corroboration. The tumors were profiled by imaging with 6 different imaging agents, detecting different biomarkers such as protease upregulation, metabolic activity, and integrin expression.
Image representation is a critical aspect of data analysis and interpretation, and both the IVIS SpectrumCT and FMT 4000 offer a variety of color scales to highlight differential bodily distribution of bioluminescence and fluorescence signal. For bioluminescence imaging, the signal is limited exquisitely to the regions in which luciferase expressing cells are localized. Figure 4A shows 4T1-luc2 tumors implanted on the upper mammary fatpads, providing corroboration of tumor localization and size. The same mouse received the NIR fluorescent imaging agent IntegriSense 750 to detect avb3 integrin expression in these tumors, and these images are represented from IVIS SpectrumCT imaging (Figure 4B) and FMT 4000 imaging (Figure 4C) using a variety of color scales available on Living Image and TrueQuant software, respectively. Upper panels represent images thresholded for optimal viewing of tumors (only), and the lower panels show images with low-level thresholding that shows the whole body signal present following the systemic injection of this NIR imaging agent.
Figure 3. Schematic diagram of 4T1-luc2 and HeLa-luc tumor model imaging studies. Models were performed as mammary fat pad and flank tumor implantation models, respectively.
Figure 4. Color scales for image representation. A representative mouse bearing two established 4T1-luc2 tumors implanted superficially in the upper mammary fat pad was imaged by bioluminescence to show tumor localization (A). IntegriSense 750 was used to image the same mouse on the IVIS SpectrumCT (B) and FMT 4000 (C) to highlight some of the color palettes available for image representation on both systems. Thresholding can be applied to the images to show just the tumors, or the bodily signal can be retained to best represent the systemic signal you would expect with injection of an exogenous fluorescence agent.
6
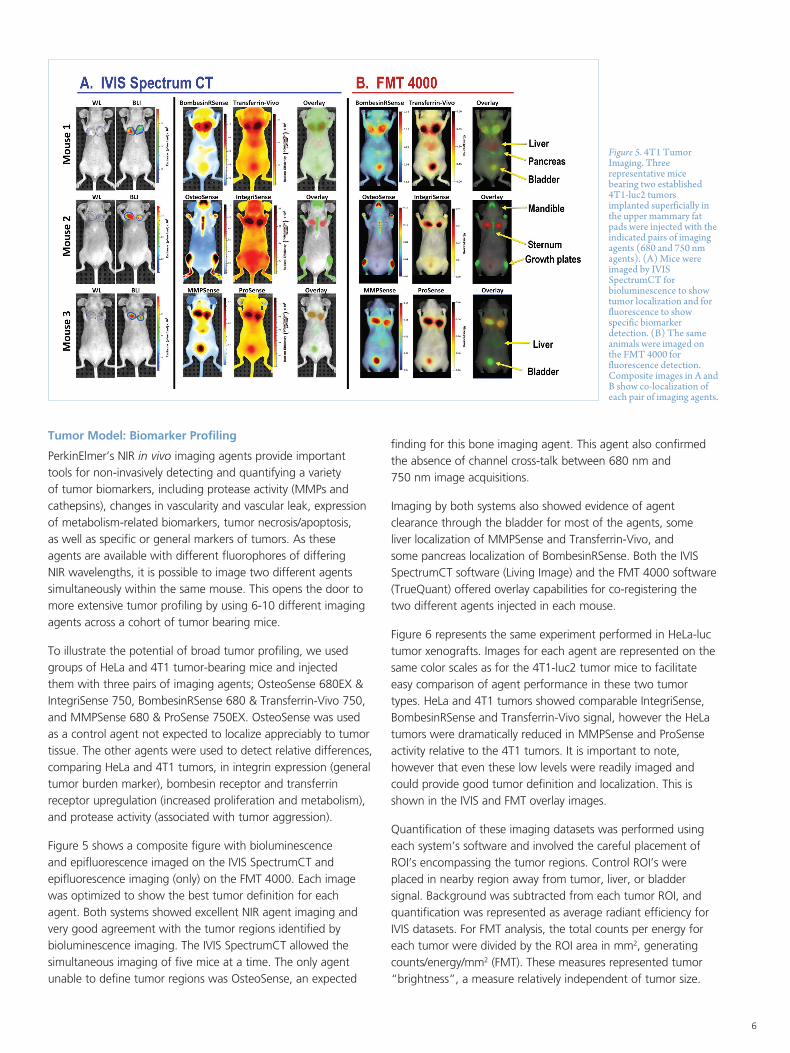
Figure 5. 4T1 Tumor Imaging. Three representative mice bearing two established 4T1-luc2 tumors implanted superficially in the upper mammary fat pads were injected with the indicated pairs of imaging agents (680 and 750 nm agents). (A) Mice were imaged by IVIS SpectrumCT for bioluminescence to show tumor localization and for fluorescence to show specific biomarker detection. (B) The same animals were imaged on the FMT 4000 for fluorescence detection. Composite images in A and B show co-localization of each pair of imaging agents.
Tumor Model: Biomarker Profiling
PerkinElmer’s NIR in vivo imaging agents provide important tools for non-invasively detecting and quantifying a variety of tumor biomarkers, including protease activity (MMPs and cathepsins), changes in vascularity and vascular leak, expression of metabolism-related biomarkers, tumor necrosis/apoptosis, as well as specific or general markers of tumors. As these agents are available with different fluorophores of differing NIR wavelengths, it is possible to image two different agents simultaneously within the same mouse. This opens the door to more extensive tumor profiling by using 6-10 different imaging agents across a cohort of tumor bearing mice.
To illustrate the potential of broad tumor profiling, we used groups of HeLa and 4T1 tumor-bearing mice and injected them with three pairs of imaging agents; OsteoSense 680EX & IntegriSense 750, BombesinRSense 680 & Transferrin-Vivo 750, and MMPSense 680 & ProSense 750EX. OsteoSense was used as a control agent not expected to localize appreciably to tumor tissue. The other agents were used to detect relative differences, comparing HeLa and 4T1 tumors, in integrin expression (general tumor burden marker), bombesin receptor and transferrin receptor upregulation (increased proliferation and metabolism), and protease activity (associated with tumor aggression).
Figure 5 shows a composite figure with bioluminescence and epifluorescence imaged on the IVIS SpectrumCT and epifluorescence imaging (only) on the FMT 4000. Each image was optimized to show the best tumor definition for each agent. Both systems showed excellent NIR agent imaging and very good agreement with the tumor regions identified by bioluminescence imaging. The IVIS SpectrumCT allowed the simultaneous imaging of five mice at a time. The only agent unable to define tumor regions was OsteoSense, an expected
finding for this bone imaging agent. This agent also confirmed the absence of channel cross-talk between 680 nm and 750 nm image acquisitions.
Imaging by both systems also showed evidence of agent clearance through the bladder for most of the agents, some liver localization of MMPSense and Transferrin-Vivo, and some pancreas localization of BombesinRSense. Both the IVIS SpectrumCT software (Living Image) and the FMT 4000 software (TrueQuant) offered overlay capabilities for co-registering the two different agents injected in each mouse.
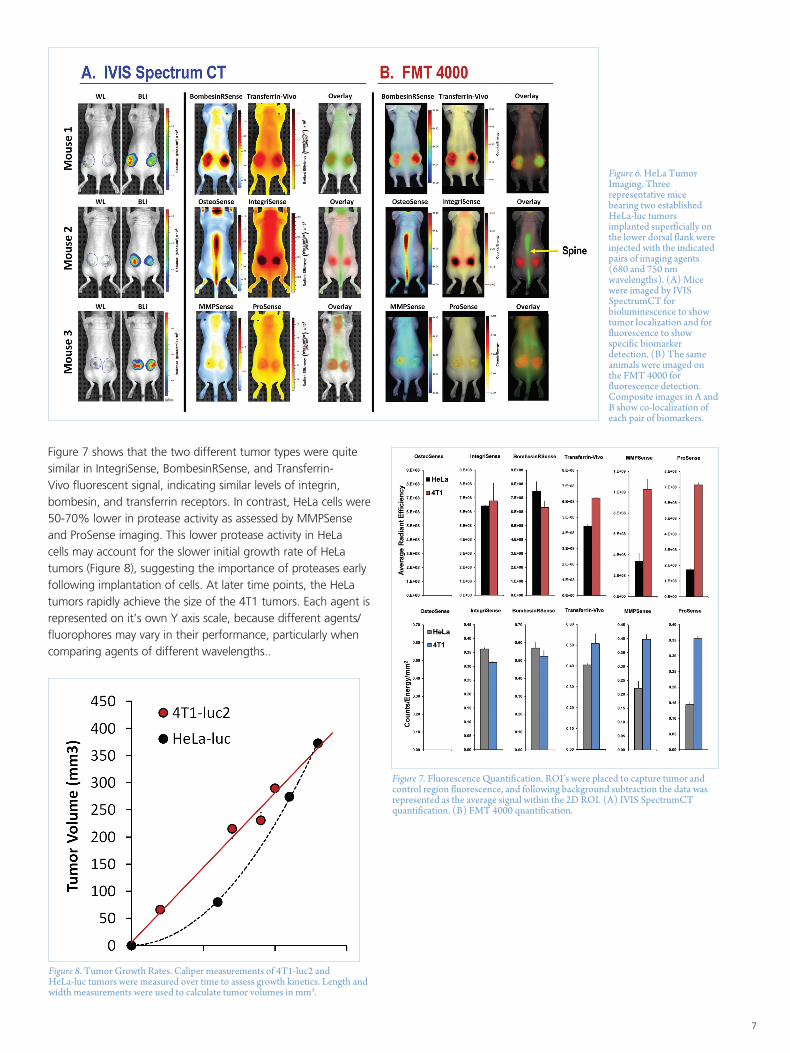
Figure 6 represents the same experiment performed in HeLa-luc tumor xenografts. Images for each agent are represented on the same color scales as for the 4T1-luc2 tumor mice to facilitate easy comparison of agent performance in these two tumor types. HeLa and 4T1 tumors showed comparable IntegriSense, BombesinRSense and Transferrin-Vivo signal, however the HeLa tumors were dramatically reduced in MMPSense and ProSense activity relative to the 4T1 tumors. It is important to note, however that even these low levels were readily imaged and could provide good tumor definition and localization. This is shown in the IVIS and FMT overlay images.
Quantification of these imaging datasets was performed using each system’s software and involved the careful placement of ROI’s encompassing the tumor regions. Control ROI’s were placed in nearby region away from tumor, liver, or bladder signal. Background was subtracted from each tumor ROI, and quantification was represented as average radiant efficiency for IVIS datasets. For FMT analysis, the total counts per energy for each tumor were divided by the ROI area in mm2, generating counts/energy/mm2 (FMT). These measures represented tumor “brightness”, a measure relatively independent of tumor size.
7
Figure 6. HeLa Tumor Imaging. Three representative mice bearing two established HeLa-luc tumors implanted superficially on the lower dorsal flank were injected with the indicated pairs of imaging agents (680 and 750 nm wavelengths). (A) Mice were imaged by IVIS SpectrumCT for bioluminescence to show tumor localization and for fluorescence to show specific biomarker detection. (B) The same animals were imaged on the FMT 4000 for fluorescence detection. Composite images in A and B show co-localization of each pair of biomarkers.
Figure 7. Fluorescence Quantification. ROI’s were placed to capture tumor and control region fluorescence, and following background subtraction the data was represented as the average signal within the 2D ROI. (A) IVIS SpectrumCT quantification. (B) FMT 4000 quantification.
Figure 8. Tumor Growth Rates. Caliper measurements of 4T1-luc2 and HeLa-luc tumors were measured over time to assess growth kinetics. Length and width measurements were used to calculate tumor volumes in mm3.
Figure 7 shows that the two different tumor types were quite similar in IntegriSense, BombesinRSense, and Transferrin-Vivo fluorescent signal, indicating similar levels of integrin, bombesin, and transferrin receptors. In contrast, HeLa cells were 50-70% lower in protease activity as assessed by MMPSense and ProSense imaging. This lower protease activity in HeLa cells may account for the slower initial growth rate of HeLa tumors (Figure 8), suggesting the importance of proteases early following implantation of cells. At later time points, the HeLa tumors rapidly achieve the size of the 4T1 tumors. Each agent is represented on it’s own Y axis scale, because different agents/fluorophores may vary in their performance, particularly when comparing agents of different wavelengths..
For a complete listing of our global offices, visit www.perkinelmer.com/ContactUs
Copyright ©2013, PerkinElmer, Inc. All rights reserved. PerkinElmer® is a registered trademark of PerkinElmer, Inc. All other trademarks are the property of their respective owners. 011295_01
PerkinElmer, Inc. 940 Winter Street Waltham, MA 02451 USA P: (800) 762-4000 or (+1) 203-925-4602www.perkinelmer.com
Conclusions
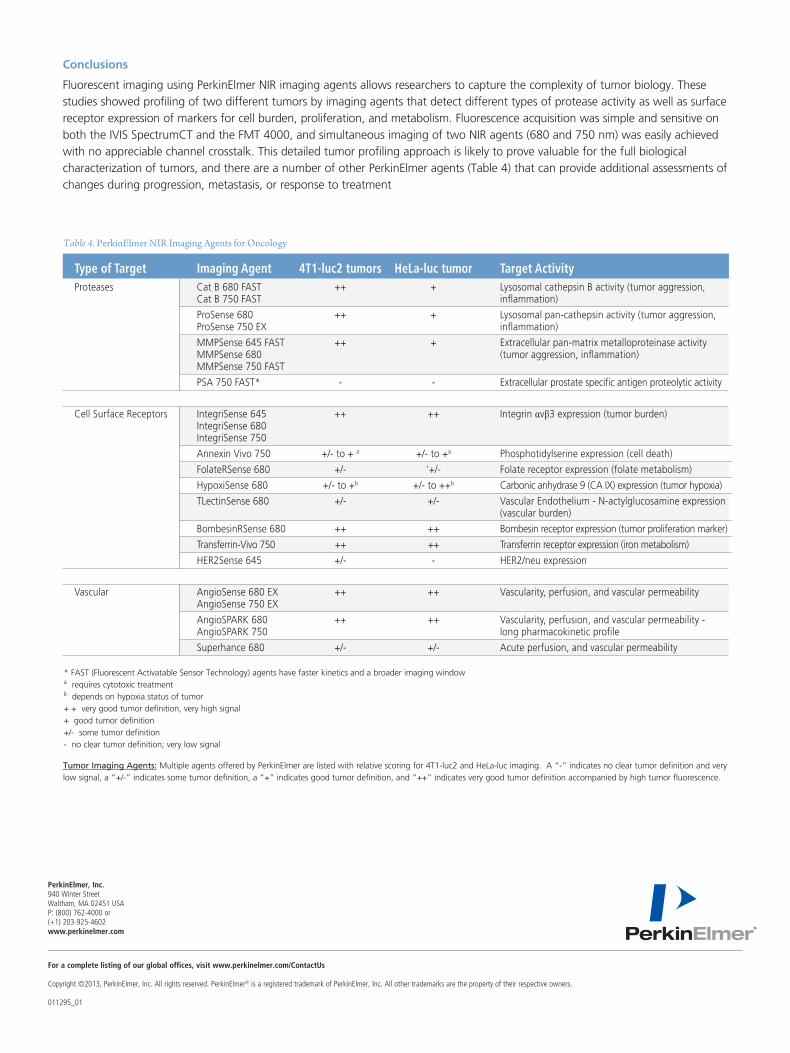
Fluorescent imaging using PerkinElmer NIR imaging agents allows researchers to capture the complexity of tumor biology. These studies showed profiling of two different tumors by imaging agents that detect different types of protease activity as well as surface receptor expression of markers for cell burden, proliferation, and metabolism. Fluorescence acquisition was simple and sensitive on both the IVIS SpectrumCT and the FMT 4000, and simultaneous imaging of two NIR agents (680 and 750 nm) was easily achieved with no appreciable channel crosstalk. This detailed tumor profiling approach is likely to prove valuable for the full biological characterization of tumors, and there are a number of other PerkinElmer agents (Table 4) that can provide additional assessments of changes during progression, metastasis, or response to treatment
Table 4. PerkinElmer NIR Imaging Agents for Oncology
Type of Target Imaging Agent 4T1-luc2 tumors HeLa-luc tumor Target ActivityProteases Cat B 680 FAST ++ + Lysosomal cathepsin B activity (tumor aggression, Cat B 750 FAST inflammation)
ProSense 680 ++ + Lysosomal pan-cathepsin activity (tumor aggression, ProSense 750 EX inflammation)
MMPSense 645 FAST ++ + Extracellular pan-matrix metalloproteinase activity MMPSense 680 (tumor aggression, inflammation) MMPSense 750 FAST
PSA 750 FAST* - - Extracellular prostate specific antigen proteolytic activity
Cell Surface Receptors IntegriSense 645 ++ ++ Integrin αvβ3 expression (tumor burden) IntegriSense 680 IntegriSense 750
Annexin Vivo 750 +/- to + a +/- to +a Phosphotidylserine expression (cell death)
FolateRSense 680 +/- '+/- Folate receptor expression (folate metabolism)
HypoxiSense 680 +/- to +b +/- to ++b Carbonic anhydrase 9 (CA IX) expression (tumor hypoxia)
TLectinSense 680 +/- +/- Vascular Endothelium - N-actylglucosamine expression (vascular burden)
BombesinRSense 680 ++ ++ Bombesin receptor expression (tumor proliferation marker)
Transferrin-Vivo 750 ++ ++ Transferrin receptor expression (iron metabolism)
HER2Sense 645 +/- - HER2/neu expression
Vascular AngioSense 680 EX ++ ++ Vascularity, perfusion, and vascular permeability AngioSense 750 EX
AngioSPARK 680 ++ ++ Vascularity, perfusion, and vascular permeability - AngioSPARK 750 long pharmacokinetic profile
Superhance 680 +/- +/- Acute perfusion, and vascular permeability
* FAST (Fluorescent Activatable Sensor Technology) agents have faster kinetics and a broader imaging windowa requires cytotoxic treatmentb depends on hypoxia status of tumor+ + very good tumor definition, very high signal+ good tumor definition+/- some tumor definition- no clear tumor definition; very low signal
Tumor Imaging Agents: Multiple agents offered by PerkinElmer are listed with relative scoring for 4T1-luc2 and HeLa-luc imaging. A “-” indicates no clear tumor definition and very low signal, a “+/-” indicates some tumor definition, a “+” indicates good tumor definition, and “++” indicates very good tumor definition accompanied by high tumor fluorescence.