multiple auditory steady
TRANSCRIPT

8/3/2019 Multiple Auditory Steady
http://slidepdf.com/reader/full/multiple-auditory-steady 1/10
Aimtits ofOwhigy. R/iin«hgy & Laryiif:«tiif;y 115(4):268-276.
© 200 6 Annals Publishing Cwmpany. All rights reserved.
Multiple Auditory Steady-State Responses in Children andAdults With Normal Hearing, Sensorineural Hearing Loss,
or Auditory Neuropathy
Joseph Attias, DSc; Nora B uller, MD; Yehudith Rubel, M A; Eyal Raveh, M D
Objectives: We tested the clinical effectiveness of multiple auditory steady-state responses (ASSRs) for the objective
assessm ent of hearing thresholds in patients with and without hearin g loss, candid ates for cochle ar imp lants, and children
with auditory neuropathy.
Methods: The study sample included 29 subjects with sensorineurai hearing loss (SNHL). 18 candidates for cochlear
imp lants. II sub jects with auditory neuropa thy, and 18 subjects with normal hearing thres hold s. Behavioral hearing
thresholds and ASSR s to carrier frequencies of 0.5 . 1. 2. and 4 kHz were obtained. S pecial care was taken to minimize
possible aliasing and high-intensity mu ltiple stimulation effects. Differences and correlation s between the AS SR s and tbe
behavioral thresholds were determined.
Results: The ASSR estimation of behaviorai thresholds in the normal-hearing group was elevated, whereas very close
predictions were found for the SNH L group. The correlations between the two measures ranged from 0.86 at 0.5 kH z
carrier frequency to 0.94 at 2 kHz. In the cochtear Implant candidates and the auditory neuropathy group, the ASSR
thresholds generally overestimated the behavioral audiogram. in these groups the number of detected ASSRs was higher
than the number of behavioral resp onses, especially for tbe high-frequency carrier stimuli.
Conclusions: Multiple ASSRs may reliably predict the behavioral threshold in subjects with SNHL and may serve as
a valuable objective measure for assessing the hearing threshold across different frequencies in candidates for cochlear
implants and children with auditory neuropathy.
Key Words: adult , audiogram. auditory neuropathy, auditory steady-state response, child, cochlear implant, hearingloss.
INTRODUCTION
The importance of early diagnosis and manage-ment of hearing loss in infants and small chiidrenhas led to the need for an objective neural tool toefficiently predict the audiograms over the entire au-ditory pathway, from the periphery to the central lo-cation s. An objective tool is necessary for this groupbecause behavioral audiometry is difficult and insome cases impossible to conduct reliably. Thiswould help clinicians to select eligible candidatesfor cochlear impiants and to appropriately fit hearingaids.
At present, cochlear and auditory brain stem sys-tem functions are assessed by measuring o toacousticemissions (OAEs) and auditory brain stem evokedpotentials (A BEP s) in response to clicks or tone pips.However, both of these methods have limitations.
The presence of OAEs in response to clicks in-
dicates normal functioning ofthe outer hair cells only,and accordingly, auditory sensorineural hearing loss(SNHL) thresholds up to 30 dB hearing level (HL).'Yet, the absence of OAEs may not have any clinicalrelevance for the prediction of hearing loss. By con-trast, the ABEP response to clicks is considered acochlear-neural tool, but it lacks specificity for fre-quency, providing information primarily in the nar-row range of 2 to 4 kHz. The use of tone pips in-creases the predictive value of the test, but it alsoprolongs the test duration and is associated with arestriction at the transducer output, resulting in the
absence of ABEPs in cases of severe to profoundSNHL.- Some studies also questioned the frequencyspecificity and reliability of threshold estimation inthe low -frequency tone pip range.̂ *^
The auditory steady-state response (ASSR) mayserve as an alternative objective tool, combining fre-quency specificity and ahigh level of stimulation .The
From the Departmen t of Com munica tion Disor ders. Haifa University, Haifa (Attias). the Institute for Clinical Neurophy siology and
Audiology . Schneider Children 's Medical Center of Israel (Attias). the Department of Otorhinolaryngo logy. Schneider C hildren 's
Medical Center of Israel and Rahin Medical Center. Beilinson Campus (Biillcr. Ravehj.and ihe Institute of Audiology. Rabin Medical
Cenier. Golda Campus (Attias, Rubei), Pelah Tiqva. and Sackler Faculty of Medicine. Tel Aviv University. Tel Aviv |Raveh). Israel.
Correspondence: Joseph Attias. DSc. Instilute for Clinical Neurophysiology and Audiology. Schneider Children's Medical Center of
Israel. 14 Kaplan St, Petah Tiqva 49202, Israel.
268
8/3/2019 Multiple Auditory Steady
http://slidepdf.com/reader/full/multiple-auditory-steady 2/10
8/3/2019 Multiple Auditory Steady
http://slidepdf.com/reader/full/multiple-auditory-steady 3/10
270 Attias et ai Multiple Auditory Steady-State Responses in Children & Adults
follows: 42.7 ± 20.8 dB HL for 0.5 kHz: 45.7 ± 19dB HL for I kHz: 48.3 ± 19.5 dB HL for 2 kHz; and5 8 . 2 + l 9 . 5 d B H L f o r 4 k H z .
Cochlear Implant Candidaies. This group com-prised II female and 7 male subjects 1 to 61 years
of age (mean. 14.7 years) who were referred toour clinic for cochlear implant assessment. Ailhad severe b ilateral hearing loss (total, 36 ears ). Ahigh proportion did not have behavioral responses.specifically to high frequency stimuli. The means(+SD) of the auditory thresholds were as follows:85 ± 15 dB HL for 0.5 kH z; 87.5 ± 11.2 dB HL for 1kHz; 89 ± 19.2 dB HL for 2 kHz; and 96.1 ± 17 dBHL for 4 kHz.
Auditory Neuropathy. This group comprised 6 fe-male and 5 male patients I to 7 years of age (mean.2.7 years) with bilateral auditory neuropathy (total,22 ears). Auditory n europathy w as primarily definedas the presence of cochlear responses (OAEs and/orcochlear m icrophonics) with no or severely impairedABEPs.^^ Ten of the 11 patients were candidatesfor cochlear im plan ts, and 1 was fitted bilaterallywith hearing aids. The means (±SD) of the auditorythresholds w ere as follows: 6 4 ± 17.4 dB H L for 0.5k H z ; 7 4 ± 1 4 d B H L f o r 1 kHz; 78 ± 14.7 dB HL for2 kH z; and 80 ± 17 dB HL for 4 kHz.
Normal Hearing (Control). This group comprised6 female and 12 male volunteer subjects 7 to 55
years of age with hearing thresholds less than 25 dBHL across the frequencies of 0.25 to 8 kHz (total,36 ears).
BEHAVIORAL THRESHOLD TESTS
All audiological tests were carried out by skilledaudiologists at the audiological clinic of SchneiderChildren's Medical Center of Israel in double-walled, sound-attenuated rooms with calibrated GSI61 audiometers (Grason Stadler Inc. Madison. Wis-consin).
The subjects in the normal-hearing and SNHL
groups were tested with pure tone hearing thresholdaudiometry. and the auditory neuropathy group and4 of the 18 patients in the cochlear implant groupwere tested with conditioning behavioral and visualreinforcement audiometry.
For pure tone audiometry, the auditory stimuliwere presented to eaeh ear separately by the 10-dB-down and 5-dB-up approach.-'' For conditioningaudiometry and visual reinforcement audiometry,narrowband stimuli or warbled tones of 0.5 to 4kHz were delivered through headphones or througha free field (5 child ren, 1 to 1.5 yea rs of ag e). In
the free-field stimula tion m ode , the child was seatedon the parent's lap. between the speakers, facing
the clinician. When infants or small children weretested, a second audiologist .sat next to the child inthe sound-attenuated room in order to inspect his orher responses.
All ofth e behavioral results included in this study
were considered reliable by the audiologists w ho per-formed the tests.
ASSR RECORDINGS
The ASSRs were assessed in a sound-attenuatedroom with Bio-logic MASTER version 2.02 (Bio-logic System Corp. Mundelein. Illinois). In thisversion, the analog to digital sampling rate can beincreased to 1.200 Hz. and auditory stimuli above80 dB H L are presented in a single carrier frequencyper ear. This practice prevents auditory stimulusartifacts from interfering with the auditory modu-
lation frequencies, thereby rectifying the aliasingeffect.
The potentials were collected from a scalp elec-trode located at Cz and referenced to the midlineposterior neck (about 7 cm below the inion). Groundelectrodes were attached to the right mastoid. Elec-trode impedance was kept below 5 kQ at 20 Hz. Theparticipants in the normal-hearing and SNHL groupsunderwent the test in the supine position; they wereasked to relax, and most of them slept through thetest. The subjects in the other two groups were asleepor sedated throughout the test.
The responses were collected at a samplingrate of 1.200 Hz at 12-bit resolution. The electro-encephalographic (EEG) responses were amplifiedat a filter bandpass of 3 to 300 Hz. Consecutive dataepochs of 1.024 seconds were linked together toform sweeps of 16.384 seconds, which were thenaveraged and analyzed by a fast Fourier transformto yield an amplitude spectrum with a resolution of0.061 Hz. Epochs that containedelectrophysiologicalactivity exceed ing 90 nV were rejected, and the nextacceptable epoch was used to build the sweep.
To determine whether the fast Fourier transformcomp onents and the stimulus modulation frequencieswere different from the background EEG activity,we compared the values at each of these frequenciesby F ratio to the 120 adjacent frequencies (60 binsabove and 60 below the stimulus frequency or3.7 Hz). Frequencies at which other stimuli weremodulated were excluded. This ratio was calculatedagainst the critical values for F at 2 and 240 df loobtain the probability of the response's being withinthe distribution of the background noise.-^-*^ Thestatistical significance ofthe difference between the
response and the background noise was set at <.O5.
To determine the ASSR threshold, we presented
8/3/2019 Multiple Auditory Steady
http://slidepdf.com/reader/full/multiple-auditory-steady 4/10
Anias el nt. Mulliptc Auditory Sleady-Slalc Re.sponses In Children & Adults 11 1
2.10 50 0 IK 2K 4K
a-
CO
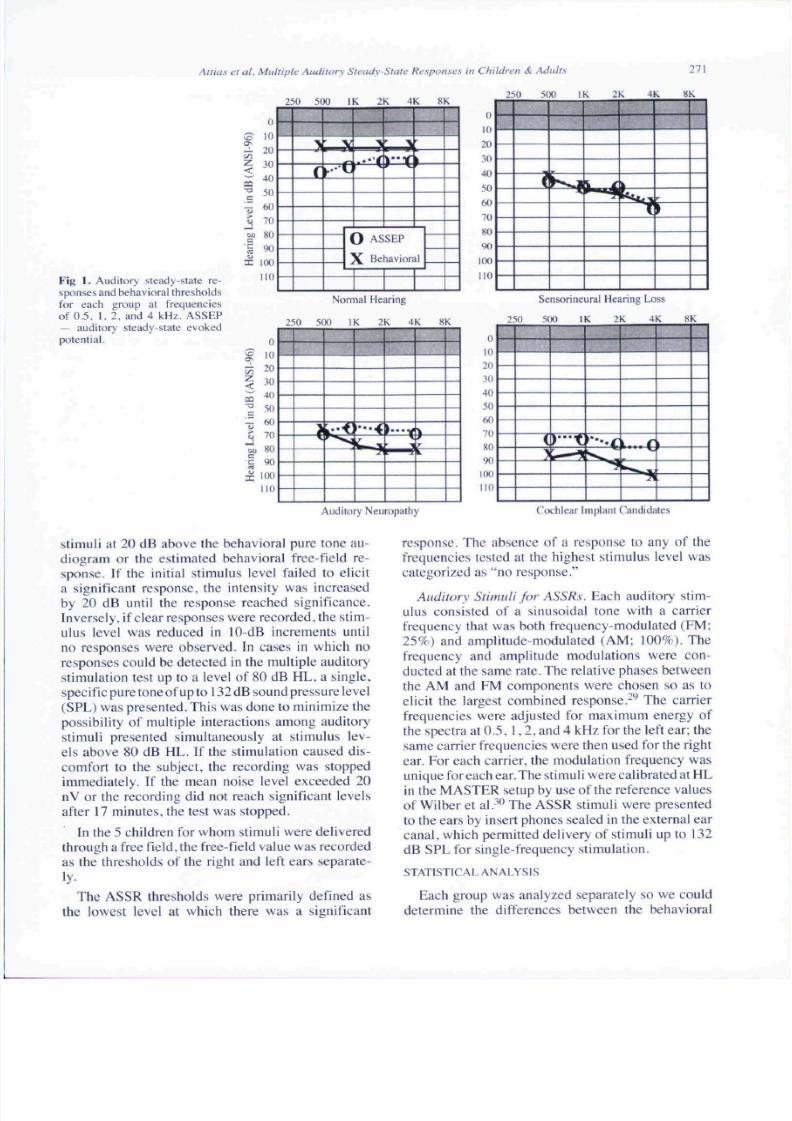
Fig 1. Auditory sleady-state re-sponses and behav ioral thresholdsfor each group at frequenciesof 0.5. 1. 2. and 4 kHz. ASSEP— auditory steady-slale evokedpotential.
0
10
20
30
40•° 50
^ 60
5 70w 80
I ^I 100
no
r
V
• • • 1» o
0 ASSEP
X Behavioral
Nonnal Hearing
0
^ "05^ 20
< * J"^ 50
£ 70
at, 80
^ 90
I 100
no
2 5 0 5(HI I K 2 K 4 K 8 K
20
.M)
4050
60
70
80
90
(K)
10
li
10
2 0
M)
4 0
50
6 0
7 0
8 0
9 0
HK)
no
25(1 50(1 IK :: X 4K K K
1
s r
Sensorineural Hearing Loss
25( 1 51 HI IK : K 4 K NK
(
>
Auditory N europathy Cochlear Implant Candidates
Stimuli at 20 dB above the behavioral pure tone au-diogram or the estimated behavioral free-field re-sponse. If the initial stimulus level failed to elicita significant response, the intensity was increasedby 20 dB until the response reached significance.Inversely, if clear responses were recorded , the stim-ulus level was reduced in 10-dB increments untilno responses were observed. In cases in which noresponses could be detected in the multiple auditorystimulation test up to a level of 80 dB HL. a single.specific pure tone of up to 132 dB sound pressure level(SPL) w aspres ented .Thi s w as done to minimize thepossibility of multiple interactions among auditorystimuli presented simultaneously at stimulus lev-els above 80 dB HL. If the stimulation caused dis-comfort to the subject, the recording was stoppedimmediately. If the mean noise level exceeded 20nV or the recording did not reach significant levelsafter 17 minu tes, the test was stopped.
In the 5 children for whom stimuli were deliveredthrough a free field, the free-field value was recorde das the thresholds of the risht and left ears separate-
ly-
The ASSR thresholds were primarily defmed asthe lowest level at which there was a significant
response. The absence of a response to any of thefrequencies tested at the highest stimulus level wascategorized as "no response."
Auditory Stimuli for A SSRs. Each auditory stim-ulus consisted of a sinusoidal tone with a carrierfrequency that was both frequency modulated (FM :25%) and amplitude-modulated (AM ; 100%). Thefrequency and amplitude modulations were con-ducted at the same rate. The relative phases betweenthe AM and FM components were chosen so as toelicit the largest combined response.-** The carrier
frequencies were adjusted for maximum energy ofthe spectra at 0. 5. 1 .2 . and 4 kHz for the left ear: thesame carrier frequencies were then used for the rightear. For each carrier, the modulation frequency wasunique for each ear. The stimuli were calibrated at HLin the M ASTER setup by use of the reference valuesof Wilber et al.-**^ The ASSR stimuli were presentedto the ears by insert phones sealed in the external ea rcanal, which permitted delivery of stimuli up to 132dB SPL for single-frequency stimulation.
STATISTICAL ANALYSIS
Each group was analyzed separately so we coulddetermine the differences between the behavioral
8/3/2019 Multiple Auditory Steady
http://slidepdf.com/reader/full/multiple-auditory-steady 5/10
272 Attias et al. Mu ltiple Auditory Steady-State Re.sponses in Children & Adu lts
TABLE 1. DIFFERENCES BETWEEN BEHAVIORAL THRESHO LDS AND ASSR THRESHO LDSACCORDING TO CARRIER FREQUENCY
OSkH- kH z 2 kHz 4 kHz
Subject Group Mean ± SD Range Mean ± SD Range Mean ± SD Range Mean ± SD Range
Normal hearing -12.7 ± 13.3 -3 0 to 10 -10.0 ±8 .2 -35 to 0 -3. 4 ±6. 5 -2 0 to 10 -2. 6 ±6 .5 -2 0 to 10
Sensorineural hearing -2 .0 ± l l .8 -20 to 4 0 O.18±7.O -2 0 to 20 0.0 ±9 .6 -3 0 to 20 l .8± 8.0 -20 to 20loss
12.3 ± 9.2 0 to 30 12.5 ± 7.7 0 to 20 7.5 ± 10.5 -1 0 to 30 15.3 ±1 8.1 10 lo 50oehlear implantcandidates
Auditory neuropathy -5 .0 ± 18.7 - 30 to 20
ASSR — auditory steady-stale response.7.1 ± 17.0 - I 0 t o 3 0 8 . 3 ± 1 4. 7 - I 0 t o 3 0 8 . 5 ± 17 . 5 - 1 0 t o 3 0
and the ASSR thresholds, and the groups werecombined so we could correlate the behavioraland objective thresholds. Changes were evaluatedwith a 2-way group x carrier frequency analysis ofvariance (ANOVA) with repeated measures acrosscarrier frequencies. Relationships between vari-ables were evaluated by linear regression, and thesignificance of these relationships was assessed byPearson product-mo ment correlation coefficients.Significance was set at p < .05. A separate analysiswas conducted for cases of no behavioral and/or ob-jective responses.
RESULTS
Figure I presents the ASS Rs and behavioral thresh-olds of each group at the frequencies of 0.5, 1. 2,and 4 kHz. In the normal-hearing group, the ASSR
thresholds were higher than the behavioral puretone thresholds at all frequencies, and especially inthe low-frequency range (I to 2 kHz). The averagebehavioral threshold between 0.5 and 4 kHz was19.2 dB, as compared to 25.5 dB for the ASSR; thisdifference was statistically significant (p < .001).
In contrast to the normal-hearing group, theASSR thresholds in the SNHL group paralleled thebehavioral thresholds, and there was no statisticallysignificant difference between them . The averageASSR threshold across frequencies w as 44 dB . andthe average behavioral threshold was 43 dB.
In the auditory neuropathy group, the ASSR pre-
TABLE 2. PERCENTAGES OF ABSENT ASSRs AND
BEHAVIORAL RESPON SES AT VARIOUS
CARRIER FREQUENCIES
Subject Group
Normal hearing
Sensorineural hearingloss
Cochlear implant
candidatesAuditory neuropathy
0.5
kH z
0
0
44
50
ASSR
I
kH z
0
0
19
27
2
kH z
0
0
38
32
4
kH z
0
0
42
22
03
kH z
0
1
61
72
Behavioral
I
kH z
0
7
55
68
2
kH z
0
7
61
72
4
kH z
0
1
64
68
diction of the behavioral thresholds was higher forthe carrier frequencies of 1, 2. and 4 kHz and lowerfor the 0.5-kHz carrier frequency. These differenceswere significant (ANOVA. p < .01).
In the group of cochlear implant candidates, the
mean ASSR thresholds were significantly lowerfor all carrier frequencies than were the behavioralthresholds (ANOVA, p < .005).
Table 1 details the differences between the be-havioral and ASSR thresholds in the 4 groups. Inthe normal group, the mean ASSR thresholds werelower than the average behavioral thresholds by 10to 13 dB HL at the low frequencies and up to 3 dBat the high frequencies (2 to 4 kHz). In the SNHLgrou p, the difference did not exceed 2 dB on average.By contrast, in the cochlear implant candidates andthe auditory neuropathy group, the ASSR thresholds
were higher than the behavioral thresholds by a meanof 12 to 1 5d BH L.
Table 2 summarizes the percentages of absentresponses in the 4 groups. Absence was defined asno response at any frequency on either the ASSRor the behavioral test. In the normal subjects. ASSRand behavioral responses were obtained for eachfrequency and for ali ears. In the SNHL group. 7ears with severe to profound hearing loss in the 3- to8-kHz frequency range did not show a behavioralresponse, although all ears provided a detectable
ASSR. In the other two groups, a higher proportionof absent responses, across all frequencies, was ob-served for the behavioral audiometry test than forthe ASSR test. In the cochlear implant candidates,the rate of absent ASSRs was 19% to 44% only,compared to 54% to 64% on the behavioral test.The corresponding rates for the auditory neuropathygroup were 20% to 50% only and 68% to 72%.Thus, the rate of detectable ASSRs was greater thanthe rate of behavioral responses, especially in thehigh-frequency range and for the cochlear implantcandidates.
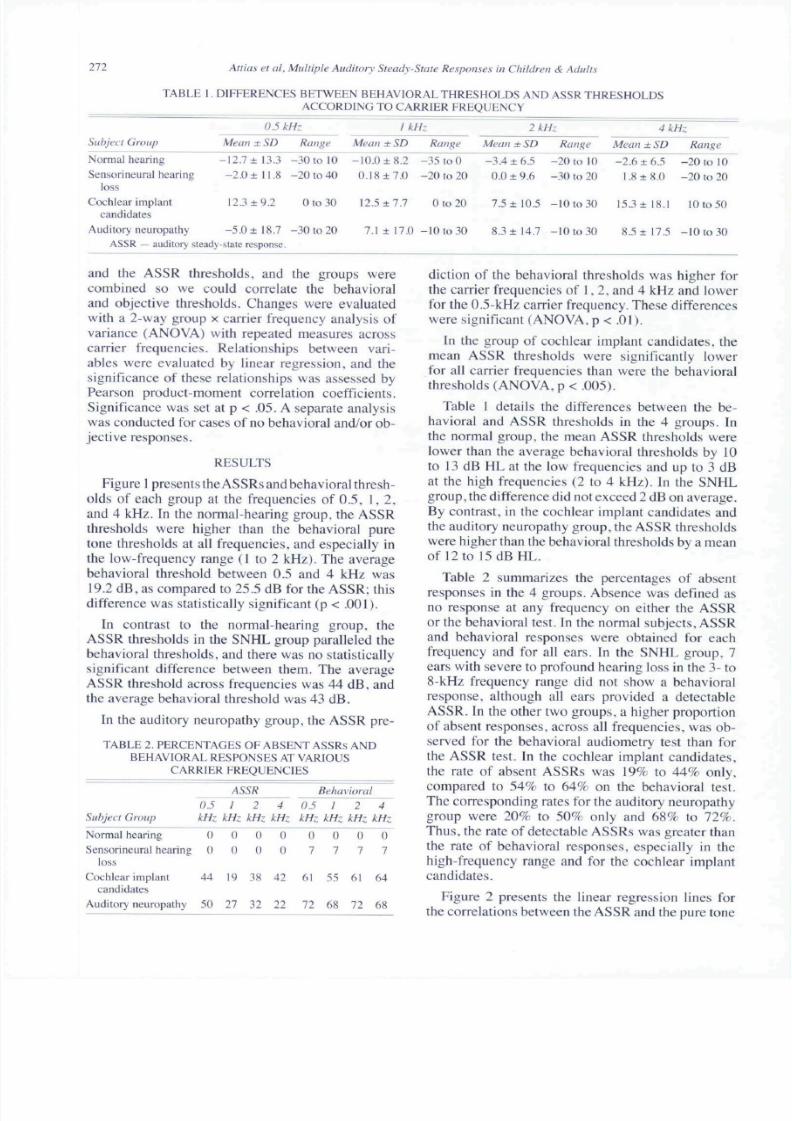
Figure 2 presents the linear regression lines forthe correlations between the ASSR and the pure tone

8/3/2019 Multiple Auditory Steady
http://slidepdf.com/reader/full/multiple-auditory-steady 6/10
Attias et aL Multiple Auditory Steady-State Responses in Children & Adults 273
0 20 40 60 XO 100 120
A S S E P T h r e s h o l d s ( d B H L )
20 40 60 80 !00
ASSEP Thresholds (dB HL)
0 20 40 6( ) 80 100 120
A S S E P T h r e s h o ld s ( d B H L )
120
IOO
8 0
6 0
4 0
20
0120
0 20 40 60 SO IOO ]2 0
A S S E P T h r e s h o ld s ( d B H L )
* ^ ^• ^ • • •
v ^ • • • r = 0.9S
20 40 60 80 100ASSEPThresh() lds(dBHL|
120
Fig 2. Correlations between auditory steady-state response and pure tone threshold for each carrier frequency.
thresho lds for each carrier frequency for all subjects.The correlation across all carriers is presented as well.Ov erall, the data show a strong relationship betweenthe two thresholds, with correlation coefficients of
0.86 for 0.5 kHz and up to 0.94 for 2 kHz; the ASSRthreshold correlated with the behavioral hearingthreshold by a coefficient of 0.95, regardless of car-rier frequency. In the auditory neuropathy group,the correlation of the behavioral responses andthe ASSRs separately for each frequency and alsoacross ail carriers failed to yield a significant result.By contrast, in the coch lear implant candid ates, therewas a significant co rrelation (p < .01) at 0 .5 .1 , and 2kHz (r = 0.65, r = 0.8. and r = 0.84. res pectively), butnot at 4 kHz. A cross all carriers, the ASS R correlatedsignificantly with the behavioral respons e (r = 0.65;
p< .OOI) .
Table 3 details the linear regression formula ofthe ASSR and the behavioral hearing thresholds forall ears and for each frequency carrier, as well as forall carriers combined.
DISCUSSION
In children and infants with developmental re-tardation orsign ificanthea ringlo ss.it may be difficultto obtain a clear behavioral response to repeatedauditory stimulation for a reliable audiogram. Fur-
thermore, the use of free field stimulation to testbehavioral reactions in infants is limited by the
stimulation level ofthe audiometers, which rangesbetween 80 and 90 dB HL across frequencies. Freefield stimulation is also not useful for detecting uni-lateral losses. In the present study, we assessed the
predictive value of ASSRs in clinical audiology asan obje ctive , frequency-specific audiom etric toolin three groups of children and adults with varioustypes of hearing loss and in a group of normal-hear-ing subjects.
In the normal-hearing group, the ASS R estimationof th e behavioral thresholds was elevated, primarilyin the low-frequency range. The mean differences(17, 4. 5, and 11 dB for the 0.5-. I-. 2-, and 4-kHzcarriers, respectively) were sim ilar to those reportedin other studies.'•^"''•'" The poorer estimation of
behavioral thresholds with the ASSR in this groupmay have been related to the method of responsedetection, changes in the ASSR amplitude, and/or
TABLE 3. LINEAR REGRESSION EORMULAS OF ASSRA ND BEHAVIORAL HEARING THRESHOLDS
EOR ALL EARS
CarrierFrequency
(kHz)
0.5
1
2
4All carriers
Slope
L l
1.2
1
11
Intercept
- to .4-10 .2
-2 .8
-0 .97-3.1
Formula
Y = L t X - 1 0 . 4Y= L2X- 10.2
Y = X - 2 . 8
Y = X - 0.97Y = X - 3 . 1
8/3/2019 Multiple Auditory Steady
http://slidepdf.com/reader/full/multiple-auditory-steady 7/10
274 Attias et al. Multiple Auditory Steady-State Responses in Children & Adults
the level of noise and artifacts during the ASSR test.Furthermore, the ASSR amplitude decreased as thestimulus level was attenuated, reaching about 20 nVat 30 dB SPL or 5 to 10 dB sensation level. which isvery close to the EEG noise lev el. Thus , the detectionof small ASSR signals around the hearing thresholds
in normal-hearing subjects is difficult, particularlywhen the subjects are awake and producing muscleand environmental noise, as some w ere in our study.This explanation is supported by the finding thatwithin a single stimulation intensity level, the ASSRamplitude was higher at the high frequencies (2 to 4kHz) than at the low frequencies {0.5 to 1 kHz).' ' '•- 'Conseque ntly, in our study, the m ean difference be-tween the ASSR and the behavioral thresholds de-creased to 3 dB HL in the high-frequency range, ascompared to 12 dB HL in the low-frequency range.
Differences in hearing thresholds between puretone audiograms and the ASSR may also be related todifferences in the threshold determination techniqu e.In the present study, we recorded the physiologicthresholds with a bracketing technique. We initiallypresented a stimulus at sufficient intensity to recordthe ASSR. The stimulus was then reduced in 10-dBHL increments until no response was obtained. TheASSR threshold was defined as the lowest stimulusintensity at which a significant response could bedistinguished from background noise. By contrast,in the pure tone audiogram test, we used a lO-dB-
down. 5-dB-up threshold search procedure, whichyielded more accurate hearing thresholds. Applyingthe latter technique to the ASSR would significantlyincrease testing time without necessarily increasingaccuracy, considering the low ASSR amplitudesaround thresho lds, especially w ith multiple auditorystimulatio ns. Thus, the ASSR do es not seem to be theoptimal audiom etric tool for objectively determininghearing thresholds in normal-hearing subjects whocannot be tested with behavioral audiometry. Otheraudiometric measures, such as OAEs coupled withABEPs to a high stimulus level, may be more accu-
rate and more diagnostic.
The ASSRs predicted the behavioral thresholdswith more accuracy in the groups with hearingloss than in the group with normal hearing. Thedifferences in the prediction value of the ASSRbetween the normal-hearing subjects and thepatients with SNHL may be explained by the findingthat the amplitude of the ASSR is higher in subjectswith SNHL than in normal-hearing subjects,'-'^•-'"^'resulting in a better ASSR signal-to-noise ratioand. consequently, a more easily detected threshold
level. The high ASSR amplitude in the SNHL groupis caused by the presence of loudness recruitment.^'
Thu s, in this group, the ASSR can accurately predictthe behavioral thresholds across frequencies andis thus a suitable tool not only for assessing thedegree of the hearing loss, but also for objectivelypredicting the configuration of the audiogram.-^**-^^This ability is very important in cases of hearing
loss in a restricted frequency range, such as noise-induced hearing ^'
In the normal and SNHL groups, the ASSR find-ings were compared to the pure tone audiograms.How ever, in most of the cochlear impiant cand idatesand most of the auditory neuropathy group, thefindings were compared to those of behavioralconditioning audiometry, wherein the child is pre-sented with auditory stimulation and his or her mo-tor reaction is observed up to the threshold level.The findings showed that in these groups, the mean
physiological thresholds were lower than the be-havioral thresholds for almost all frequencies. Onereason for this difference may be the inaccuracy andbias inherent in behavioral testing of small childrenwith severe to profound hearing loss. Furthermore,because these children may have retarded motor de-velopm ent, their behavioral responses to the auditorystimulus may not be detectable. Because the ASSRis conducted while the child is asleep or sedated, theevocative stimulus level exceeds the level permittedby the audiometers.
It is also noteworthy that the number of detectedASS Rs w as higher than the number of behavioral re-sponses in both the cochiear implant candidates andthe auditory neuropathy group (Table 2). The rateof absent behavioral responses across frequenciesranged between 55% and 64% in the cochlear im-plant candidates and between 68% and 72% for theauditory neuropathy group. By contrast, during theASSR test, the rate of absent responses dropped to19% to 44% in the cochlear implant candidates andto 22% to 50% in the auditory neuropathy group;the decrease was most marked for high-frequencycarriers. It may be assumed that the use of higher
stimulus levels in the ASSR probably increases thesynchronization in the neural tracts, resulting in high-er visible responses. These findings seem to supportthe notion that poor synchronization is the source ofabsent neural responses. Thus, applying the ASSRincreases the accuracy of the audiologicai assessmen tin cochlear implant candidates and in children withauditory neuropathy, and thereby increases the appro-priateness of the medical intervention.
It is also possible that the increased number ofASSRs compared to behavioral responses,especially
in cases of severe to profound hearing loss, mighthave been attributable to nonauditory, physiologic.

8/3/2019 Multiple Auditory Steady
http://slidepdf.com/reader/full/multiple-auditory-steady 8/10
Attia.'i et al. Multiple Auditory Steady-State Respo nses in Children & Adults 275
or auditory artifacts.'''-'^ However, this is unlikely,in view ofthe increased number of ASSRs obtainedfor all frequencies, and especially for the high-fre-quency auditory stimuli, combined with the useof an analog to digital sampling rate of 1,200 Hzto avoid the aliasing effect around 1,000 Hz. Fo r
higher carrier frequencies, because they are furtheraway from the possible aliasing effect, the stimulusartifacts would be much smaller in amplitude.
Moreover, the use of a single auditory stimulusto evoke ASSRs at 80 dB HL and above excludesthe possibility of multiple interactions of auditorystimuli resulting in spurious ASSR s. Thus , artifactualASSRs may have a nonauditory origin.
Previous studies have shown that vestibular-evoked myogenic potentials (VEMPs) can be elic-ited by high-intensity clicks (90 to 100 dB SPL)
and low-tone bursts-^'^'*'' at 3 to 4 ms after stimuluspresentation , even in patients with profound hearingloss. The h igh-intensity auditory .sdmuli are believedto activate the vestibular afferent pathway, mostprobably from the saccule, which in turn modulatesthe tonic electromyographic activity. How ever, if thesubject is relaxed , no VE MPs are recorded.̂ *^ It is notlikely that the results of this study were significantlyaffected by VE M Ps. because the adult subjects wereasked to relax and most ofthe children slept or weresedated throughout the test. ASSRs were detectednot only in the low-frequency carriers, but also in
the high-frequency carriers, in which VEMPs couldnot be elicited.^"*-^'^
Several techniques have been suggested to reducepossible artifactual ASSRs, including the use of al-ternating auditory stimuli in off-line analysis''^ andthe use of stimuli with a frequency energy that wouldnot alias back to the modulation frequencies of theresponse because the polarity of the carrier frequen-cy is alternated at every cycle of the modulation
Correlational analysis of the ASSR findingswith the behavioral pure tone audiograms withineach frequency yielded coefficients of 0.86 at a0.5-kHz carrier frequency and 0.94 at a 2-kHzcarrier frequency. Across all carriers, the coeffi-
cients increased to 0.95. and the behavioral thresh-olds were better by a mean of 8 dB HL than thephysiological thresholds. Similar correlations be-tween the MASTER technique and pure tone audio-grams were previously reported.'' '"" Together, thesestudies emphasize the clinical value of ASSRs as
an objective audiometric tool for predicting the be-havioral audiogram across different frequencies.
The most efficient audiometric tool in terms ofduration and accuracy is the pure tone audiogram.However, in cases in which patient cooperation can-not be provided, the ASSR test is preferred. Test-ing two ears with 8 frequencies takes 25 to 40 min-utes. Eree field behavioral conditioning tests for 4frequencies take 20 minutes, but they cannot detectunilateral thresholds. Thus, the information yieldedby the ASSR is more accurate, although in some
young children sedation may be necessary.To conclude, this study shows that the ability of
the MASTER technique to detect thresholds in the0.5- to 4-kHz range is close to that of pure tone orconditioning tests. The ASSR identifies not only thedegree of hearing loss, but also its configuration.In normal-hearing subjects, the large differencesbetween the behavioral pure tone audiogram andthe ASSR suggest that the ASSR is not the optimalaudiometric tool in this group. However, in contrastto the SNHL and the normal-hearing groups, inwhich the behavioral thresholds were equal to or
higher than the ASSR thresholds, in the cochlearimplant candidates and auditory neuropathy group,ASSR thresholds were lower than the behavioralthresholds, probably owing to the better detectionaccuracy of the MASTER technique and its higherstimulus level as compared to behavioral techniques.Therefore, this measure may serve as a valuableclinical tool in assessing the hearing function ofthese children and the efficacy of early interventioneither by conventional or implanted hearing aids.However, because high stimulus levels, especiallyat lower carrier frequencies, may be associated with
stimulus artifacts, the interpretation of the ASSR forlow frequencies in patients with severe to profoundhearing loss should be made with caution.
REFERENCES
1. Attias J.Fu rsl M . Fuzman V.Reshef I, Horowitz G.Bres-loff I. Noise-induced otoacoLislic emission loss with or withouthearing loss. Ear Hear 1995;l6:6l2-8.
2. Cone-Wesson B. Dowell RC.Tomlin D, Ranee G, MingWJ. The auditory steady-slate response: comparisons with theauditory brainstem response. J Am Acad Audiol 2OO2;!3:173-87,225-6.
3. Gorga MP. Kaminski JR , Beauchaine KA. Jesteadl W.Auditory brainstem responses to tone bursts in nortnally headng
subjects. J Speech Hear Res 1988:31:87-97.
4. Laukti E.FjermedalO.MairlW. Low-frequency auditory
brainstem response threshold. Scand Audiol 1988; 17:171-8.
5. Rickards FW. Tan I.E. Cohen IX Wilson OJ. Drew JH,Clark GM. Auditory steady-state evoked potential in newborns.BrJ Audiol 1994:28:327-37.
6. Kuwada S. Batra R. Maher VL. Scalp potentials of normal
and hearing-impaired subjects in response to sinusoidally am-plitude-modulated tones. Hear Res 1986;21:179-92.

8/3/2019 Multiple Auditory Steady
http://slidepdf.com/reader/full/multiple-auditory-steady 9/10
276 Atlkis et al. MuUiple Auditory Steady-State Responses in Children & Adults
7. Cohen LT. Rickards FW. Clark GM . A comparison of
steady-state evoked potentials to modulated tones in awake andsleeping humans. J Atoust Soc Am l991;90:2467-79.
8. Aoyagi M. Kiren T. Furuse H. et al. Pure-tone thresholdprediction by 8O-H7 amplitude-modulation following response.Acta Otolaryngol SuppI (Stockh) 1994(suppl 511 ):7-14.
9. Levi EC. Folsom RC. Dobie RA. Coherence analysis ofenvelope-following responses (EFRs) and frequency-followingresponses (FFRs) in infants and adulls. Hear Res 1995:89:21-
7.
10. Lins OG. Picton TW. Auditory steady-state responsesto multiple simultaneous stimuli. ElectroencephalogrClin Neu-rophysioi 1995;96:420-32.
11. Ki iwa daS . Anderson JS.B atra R. Fitzpatrick DC . Teis-sierN.D"AngeloWR. Sources of the scalp-recorded amplitude-modulation following response. J Am A cad Atidiol 200 2; 13:188-204.
12. Cone-Wesson B. Rickards F. Poulis C. Parker J. Tan L.Pollard J. The auditory steady-state response: clinical observa-
tions and applications in infantsand children. JA m A cad Aiidiol
20O2;13:270-82.
13. Ranee G. Rickards F. Prediction of hearing thresholdin infants using auditory steady-state evoked potentials. J Am
Acad Audiol 2002:13:236-45.
14. VanderWerffKR. Brown CJ-G ienappB A. Schmidt ClayKM. Comparison of auditory steady-state response and auditorybrainstem response thresholds in children. J Am Acad Audiol
2002; 13:227-35,283-4.
15. Dimitrijevic A. John MS. Van Roon P. et al. Estimatingthe audiogram using multiple auditory steady-state responses. JAm Acad Audiol 2(K)2:13:205-24.
16. John MS. Lins OG. Boucher BL. Picton TW. Multipleauditory steady-state responses (MASTER): stimulus and re-
cording parameters. Audiology 1998:37:59-82.17. John MS. Picton TW. MASTER: a Windows program
for recording multiple auditory steady-state responses. Comput
Methtxis Programs Biomed 2000;61:125-50.
18. Ranee G . Brigg.s RJ. A ssessment of hearing in infants withmoderate to profound impairment: the Melbourne experience
with auditory steady-state evoked pf»tential testing. Ann OtolRhinol Laryngol Suppi 2002:11 l{suppl l8 9):2 2-8 .
19. Small SA.S tapells DR . Artifaciual respons es when record-ing auditory steady-state respt)nses. Ear Hear 2004;25:6l 1-23.
20 . Picton TW. John M S. Avoiding electrom agnetic artifactswhen recording auditory steady-state responses. J Am Acad Au-
diol 2004;15:541-54.
21 . Picton TW. Dimitrijevic A. Perez-Abalo MC. Van RoonP. Estimating audiometric thresholds using auditory steady-stateresponses. J Am Acad Audiol 2005; 16:140-56.
22 . Picton TW, John MS. Dimitrijevic A. Purceil D. Humanauditory steady-state responses. Int J Audiol 2(X)3;42:177-219.
23 . John MS. Purceil DW. Dimitrijevic A. Picton TW. Ad-
vantages and caveats when recording steady-state responses tomultiple simultaneous stimuli. J Am Acad Audiol 2002; 13:246-59 .
24 . Gorga MP. Neely ST. Hoover BM. Dierking DM, Beau-chaine KL. Manning C. Determining the upper limits of stim-ulation for auditory steady-state response measurements. EarHear2O()4;25:3O2-7.
25 . Starr A. Picton TW. Sininger Y. Hotxl LJ. Berlin Ci. Au-ditory neuropathy. Brain 1996;! 19:741-53.
26 . Carhart R. Jerger JJ. Preferred method for clinical deter-
mination of pure-tone thresholds. J Speech Hear Res I959;24:330-45.
27 . Picton TW . Durieux-Smith A. Champagne SC . et al. Ob-jective evaluation of aided thresholds using auditory steady-state respons es. J Am Acad A udiol 1998:9:315-31.
28. John MS. Dimitrijevic A. Picton TW. Auditory steady-
state responses to exponential modulation envelopes. Ear Hear2002:23:106-17.
29 . John MS. Dimitrijevic A. van Rtwn P. Picton TW. Mul-tiple auditory steady-state responses to AM and FM stimuli. Au-diol Neurootol 200 1;6:12-27.
30. Wilber LA , Kruger B. Killion MC. Reference thre sholdsfor the ER-3A insert earphone. J Acoust Soc Am 1988;83:669-76 .
31 . Lins OG. Picton TW. Boucher BL,et al. Frequency-spe-cific audiometry using steady-state responses. Ear Hear 1996;17:81-96.
32 . Perez-Abalo MC , Savio G. Torres A . Martin V. RodriguezE. Galan L. Steady-state responses to multiple amplitude-modu-lated tones: an optimized method to test frequency-specific
thresholds in hearing-impaired children and normal-hearing sub-jects. Ear Hear 2001 ;22:2()O-11.
33 . Hsu W C, Wu HP, Liu T C. Objective assessment of audi-tory thresholds in noise-induced hearing loss using steady-stateevoked potentials. Clin Oto!ar>'ngol Allied Sci 2003:28:195-8.
34. Coiebatch JG. Vestibular evoked potentials. Curr OpinNeurol 2001;l4:2l-6.
35 . Nong DX. Ura M. Owa T. Noda Y. An acousticallyevoked short latency negative response in profound hearing losspatients. Acta Otolaryngol (Stockh) 2000; 120:960-6.
36. Townsend G L. Cody DT. The averaged inion responseevoked by acoustic stimulation: its relation to the saccule. AnnOtol Rhinol Laryngol 1971 ;80:121-31.
37 . Swanepoel D, Hugo R. Roode R. Auditory steady-stateresponses for chiidren with severe to profound hearing loss.Arch Otolaryngol Head Neck Surg 2004:130:531-5.
8/3/2019 Multiple Auditory Steady
http://slidepdf.com/reader/full/multiple-auditory-steady 10/10