multiobjective stochastic optimization approach applied … 1985 (paper jj... · multiobjective...
TRANSCRIPT

Multiobjective Stochastic Optimization Approach Applied to aHybrid Process Production−Separation in the Production ofBiobutanolJuan Jose Quiroz-Ramírez,† Eduardo Sanchez-Ramírez,† Salvador Hernandez,†
Jorge Humberto Ramírez-Prado,‡ and Juan Gabriel Segovia-Hernandez*,†
†Universidad de Guanajuato, Campus Guanajuato, Departamento de Ingeniería Química, Noria Alta s/n, 36050, Guanajuato, Gto.Mexico‡Centro de Investigacion Científica de Yucatan, A.C., Unidad de Biotecnología, Calle 43 No. 130, Colonia Chuburna de Hidalgo, CP97200, Merida, Yucatan Mexico
*S Supporting Information
ABSTRACT: Acetone, butanol, and ethanol are produced inan acetobutylic fermentation, butanol being the main interestproduct because of its superior properties making it a feasiblesubstitute for fuels coming from fossil sources. In this work wehave simulated and optimized under a rigorous scheme anintegrated process to produce acetone, butanol, and ethanolfrom lignocellulosic biomass. Since ABE fermentation presentsseveral hurdles such as low concentration broths or inhibitoryeffects during fermentation, here is proposed a hybridsimultaneous system of saccharification−fermentation−separa-tion in which inhibition products during both fermentation andenzymatic hydrolysis are limited. A liquid−liquid extractionstep is selected as the recovery technique. The reactor was modeled and simulated using Matlab software coupled with AspenPlus which simulated the separation step. The entire optimization was developed taking into consideration several objectivetargets such as the total annual cost and some bioindexes involved in fermentation such as productivity, yield, and butanolconcentration. Our results allowed us to find a feasible operative zone where all our objective targets were not compromisedwhen the goal was the improvement of the process to produce biobutanol.
1. INTRODUCTION
During the acetobutylic fermentation process acetone, butanol,and ethanol (ABE) are produced, butanol being the maininterest product. In the early twentieth century began thedevelopment of the platform for the ABE fermentation inresponse to a high demand in the production of acetone. Thisled, in 1916, to the use of the Weizmann process (by means ofthe microorganism Clostridium acetobutylicum) in the firstindustrial-scale ABE fermentations. A quick progress inpetrochemical production during the second half of thetwentieth century meant a decline in the use of ABEfermentation for obtaining butanol. However, the problemscurrently afflicting the energy sector (i.e., depletion of naturalresources, climate change, environmental pollution, etc.) haveled to a reappraisal of ABE fermentation for sustainableproduction of butanol, considered as a possible biofuel andincreasing its demand. One of the main factors impacting itsperformance and total cost of production is the selection of thesubstrate to ferment. Since the strains of Clostridia are able touse a wide range of carbon sources this flexibility makes themexcellent options for integration into biofuels productionaccording to the cost-benefit of substrates which are the most
suitable locally).1 Traditionally several species of the Clostri-dium genus are involved in this fermentation process such asClostridium acetobutylicum, C. beijerinckii, C. saccharobutylicum,C. saccharoperbutylicum, and C saccharoperbutylacetonicum.2,3
These are strict anaerobic Gram-negative bacteria whosemetabolic pathways carry out the ABE fermentation on twodistinctly divided phases: acidogenesis (sugars are converted toacetic and butyric acids accompanied by a decrease in culturepH), and solventogenesis (sugars and some of the acids aremetabolized into acetone, butanol, and ethanol, accompaniedby an increase in culture pH).3−6 Presently, the use of strains ofC. saccharoperbutylacetonicum are preferred over other speciesdue mainly for two characteristics: first, a higher yield andbetter butanol/acetone ratio (>4:1) in the final solvents mix;8
and second, as mentioned above, its ability to ferment a greatvariety of substrates that could be enriched in glucose,
Received: October 31, 2016Revised: January 16, 2017Accepted: January 26, 2017Published: January 26, 2017
Article
pubs.acs.org/IECR
© 2017 American Chemical Society 1823 DOI: 10.1021/acs.iecr.6b04230Ind. Eng. Chem. Res. 2017, 56, 1823−1833

saccharose, lactose, xylose, starch, glycerol, and many othersugars.7
A boost to the production of biobutanol would consist of twoconverging strategies: (1) A biological approach, engineeringClostridias’ metabolic pathways for butanol hyper-production8
and (2) the theoretical optimization and modeling of moreefficient hybrid production-separation processes, such as thatdescribed in the present study.This separation stage allows the resolution of two problems
associated with the ABE fermentation. The first one is towithdraw the interest components in a continuous processwhich represents a great benefit such as to maintain theconcentration of acetone, butanol, and ethanol in such levels toavoid any damage to microorganism. The second one is toavoid high water concentration which consequently preventsazeotropic formation. The ABE metabolic pathway in theClostridia suffers substrate inhibition by glucose and xyloseconcentrations, and product inhibition by butanol concen-tration,7 both of which represent big obstacles in straingrowing, so that several restrictions must be faced including lowyields during fermentation. Moreover, the correct selection ofraw materials are also an important challenge. Considering afirst generation raw material with high sugar concentration suchas corn as a substrate would represent in practice 78% of thetotal production cost.2 That is why lignocellulosic biomassseems to be a wise selection as raw material for fermentationconsidering its economic and environmental advantages incomparison with first generation raw materials.3 Moreover,lignocellulosic biomass is currently considered a widelypromising substrate during fermentation ABE by severalauthors.9−14 Lignocellulosic biomass is composed mainly ofcellulose, hemicellulose, and lignin. Before lignocellulosicbiomass can be used, a biocatalytic pretreatment is necessaryto reduce hemicellulose to xylose and decrease the crystallinityin cellulose.15 After pretreatment, the biomass must be eitherchemically or enzymatically hydrolyzed.16
Enzymatic hydrolysis may offer several advantages over bothphysical and chemical mechanisms such as low byproducts, lessenergy requirements, and easier operative conditions. However,enzymatic hydrolysis represents also a huge inhibition byglucose and xylose concentrations.15 One alternative whichdecreases inhibition is an integrated fermentation−saccharifi-cation (SSF) reactor; this option is more suitable sincemonosaccharides are simultaneously consumed during fermen-tation.15
During ABE fermentation using lignocellulosic biomass asraw material, these two integrated processes (SSF) may showadditional advantages reducing the inhibitory effect of the finalproducts in both the hydrolysis and fermentation processes.The SSF process shows an improvement generating betteryields and minimizing energy requirements. Moreover, themain advantage of SSF is that both the bacteria and enzymaticcomplex involved in those processes reduce the presence ofsugar inside the reactor. Consequently a better performance isobserved and the saccharification rate is improved.The inhibition caused by high butanol concentration in the
fermentation process is also a big hurdle in this process; that is,when a concentration of butanol near 15 g L−1 is reached thefermentation process is completely inhibited. In this scenario,the low yields, the performance in reactors, and the high energyrequirements during the entire process represent an obstaclethat must be overcome. To improve the performance, severaloptions have been currently proposed, one of them is the
integration of both reaction and recovery processes. Usingexternal units stimulates the purification because a wide rangeof temperatures can be used in the selective removal ofcomponents from the fermentation broth. However, whentemperature is increased a higher number of equipment isrequired since either a cellular immobilizer or biomass recyclermust be used. Considering the separation unit, diverse optionshave been proposed in order to remove all fermentationproducts. Yang et al.17 proposed adsorption as a recoverytechnique, showing promissory results at the laboratory scale.Qureshi and Maddox18 proposed liquid−liquid extraction as agood alternative to purify the ABE mixture. Moreover,pervaporation19 and gas stripping20 are also proposed asalternatives in order to remove and purify mainly the butanolproduced in ABE fermentation. Despite all those approachesthere is not a definitive separation technique: each of them havetheir advantages and disadvantages,21 however liquid−liquidextraction has been reported as the recovery technique whichexhibits the most potential to be used in butanolpurification.22,23
On the other hand, since optimization techniques represent avery useful tool which helps improve several processes, itsapplication in the fermentation process is mandatory. Sharma etal.24 analyzed, under a multiobjective optimization approach, anintegrated reactor with gas stripping and pervaporation toproduce biobutanol having as objective targets the productivity,performance, yields, and sugars conversion. After their analysisthey obtained an improvement using integrated reactors duringfermentation, emphasizing an increase of the productivity andconversion of the integrated reactor. Further, Mariano et al.25
optimized an ABE fermentation integrated with a flash unit andrecycling biomass using genetic algorithms having as theobjective function to maximize butanol production for anexpected substrate conversion. Rohani et al.26 performed amultiobjective optimization of a bioreactor integrated withpervaporation and gas stripping, highlighting its productivityand sugar conversion. However, note that a rigorousoptimization applied to a hybrid process of saccharification−fermentation−separation (SFS) has been little studied.Furthermore, there is a similar situation in the study of therole that all variables included in this kind of process have.Under this scenario, the aim of this study was to model,
simulate, and optimize a continuous fermentation process. Thisprocess consists of two distinct sections: reaction andseparation. For the reaction section we considered anintegrated process in which both fermentation and saccha-rification are carried out together; in the separation section weselected liquid−liquid extraction as the recovery technique topurify the fermentation products. In this manner, this work isproposed as an intensified process since both saccharificationand fermentation are performed in the same process unit. Thisintensification represents economic advantages and diminish-ment in inhibitory effects. Note this work is only focused in thereaction step which is the initial stage for all ABE productionprocesses. However, this approach is quite complicated to solveand optimize since we are considering several variables involvedin the optimization process, furthermore the fermentor model(showed as Supporting Information) is relatively complex andconsiders all compounds involved in ABE fermentation and itsoperative conditions. As results we obtain an effluent with themain ABE compounds coming from the fermenter undercertain operative conditions obtained by means of a rigorousoptimization process. This effluent may be further separated
Industrial & Engineering Chemistry Research Article
DOI: 10.1021/acs.iecr.6b04230Ind. Eng. Chem. Res. 2017, 56, 1823−1833
1824

considering several alternatives already reported by severalauthors.27,28
The modeling of fermentation, saccharification, and extrac-tion was developed in Matlab, the solvent recovery unit ismodeled using Aspen Plus; and the optimization process iscarried out using a stochastic optimization algorithm written invisual basic, both programs linked to each other.The Differential Evolution with Tabu List has shown to be
capable of solving complex nonlinear problems and potentiallynonconvex. Further, through a reasonable computational timeit is totally feasible to find solutions quite near the optimalsolution.29 By means of this optimization algorithm it waspossible to obtain Pareto fronts of the integrated reactorthrough two proposed methods: first a biobjective optimizationwas performed to find the feasible operation zone, and finally amultiobjective optimization was performed to verify theinfluence and improvement by including several objectivefunctions at the same time.
2. PROCESS DESCRIPTION
Currently, biobutanol is produced by fermentation usingclostridium species. A simplified flowsheet is observed inFigure 1. We took as process parameters a continuous feed withconstant sugar concentration. A volume of 1000 m3 isconsidered. To control the fermenter volume, a purge isincluded in our model, having as a target to remove thenonreactant compounds and also avoiding inhibition concen-trations inside the reactor. Also proposed is a feed flow withcellulose/hemicellulose/lignin which is varied according to theraw material until an optimal feed flow is found.The presence of a mixed cell population (acidogenic cells,
solventogenic cells, and spores) characterized by mutualinterferences and the butanol production by means of oneelement of the cell population makes the design of a continuousreactor a complex task.The fermentation−saccharification process has been mod-
eled in Matlab taking into consideration a complex systemwhich includes a rigorous mathematical model which describesadequately all metabolic reactions of the ABE pathway for C.saccharoperbutylacetonicum. Further, considering pH changesand the distinctive temperature profiles of this strain, a widedescription of the model was described previously by Shinto etal.30 (see Supporting Information). Starting from their modelallowed us to predict a dynamic profile taking in account allintermediary products in the fermentation as well as bothsubstrate and product inhibitory effects for Clostridium strains.The inhibitory effect modeled by Shinto et al.30 described theeffect of butanol at low−medium butanol concentrations
considering those current Clostridium strains, just like thoseobtained in this work. So, by means of this model aconventional ABE fermentation might be represented withrelatively good accurracy.31 The model was developed for twodifferent substrates, either glucose or xylose, at the beginning ofthe metabolic route. The kinetic model involved in thesaccharification process is taken from the study of Kadam etal.32 (see Supporting Information). This previous work allowedus to account for the effect of both substrate and productinhibition. Also a competitive inhibition by xylose and enzymeadsorption is considered.To calculate the volume of the reactor, all raw materials and
reactions are included. This work considers the volumeoccupied by solids which produce areas without reaction.However, those solid materials must be eventually purged. Thenecessary purged flow (FP) is obtained by calculating thedifference between the initial volume and final increasedvolume due to solids, multiplied by a proportionality constantaccording to the operative ranges32 which monitors the totalvolume (VT). The overall balance of the integrated reactor isdescribed as follows:
= + − +Cit
R V Fx F x F xdd i F i p Pi L Li1 1 (1)
where Ci is the concentration of each component: butanol,ethanol, acetone, butyric acid, acetic acid, glucose, and xylose.The simulation of a simultaneous saccharification−fermenta-
tion−separation (SFSS-L) is shown in Figure 2. This process is
carried out in a pseudostable state (the reactor in transitorystate and the liquid−liquid extraction unit in steady state). Also,2-ethyl-1-hexanol was selected as the extractant agent becauseof its high partition coefficient, high selectivity, low cost, andappropriate medium boiling point.34,28
Figure 1. Simplified process flowsheet of biobutanol plant.
Figure 2. Schematic diagram of a continuous fermentation processcoupled with a liquid−liquid separation unit and a column to recoverextractant.
Industrial & Engineering Chemistry Research Article
DOI: 10.1021/acs.iecr.6b04230Ind. Eng. Chem. Res. 2017, 56, 1823−1833
1825

The compositions in liquid−liquid equilibrium inside thedecanter are calculated as follow:
α α=x xi i i iI I II II (2)
On the other hand, the flow reactor FL (see Figure 2) is thecalculated aqueous phase in the decanter; this flow in aqueousphase F2 comes from reactor and might be calculated fixing arecycle rate on fermenter rF of 0.95 according to
=r F F/ pF 2 (3)
As an initial operative variable a cellulose feed of 46 g L−1,avoiding substrate inhibition, is used. The reactor starts as abatch process and after 20 h the feed flow rate and purge flowstarts; also the extractant agent is fed in the liquid−liquidextraction column.The total fermentation time is simulated as 500 h; however,
this time could be longer trying to avoid the loss of all materialbefore steady state is reached.
3. OPTIMIZATION PROBLEM FORMULATIONThe modeling and optimization processes offer severaladvantages when some economic index is evaluated sincethey allow us to identify many operative conditions for whicheconomical improvements are reached. An optimizationprocess can be used to find optimal operative conditionsduring a fermentation process integrated with a separationsection. However, being that the ABE fermentation involves acomplex set of equations highly nonlinear with degrees offreedom, using optimization algorithms may help to identify theoptimal condition in this process.First an optimization process considering only two objective
function was performed. This biobjective optimization wasperformed to know the range of all operation variables and alsoknow the impact of each target when it is evaluated against thetotal annual cost (TAC), which we considered as the mostimportant target. Furthermore, this biobjective optimizationwill let us know certain zones where it is possible to operate thereactor without compromising any target.Once both range variable and operation zone were known, a
multiobjective optimization was performed facing all objectivefunctions. This kind of optimization gave us a wider point ofview since all bioindexes such as productivity, butanolconcentration, and butanol yield are in conflict with the totalannual cost. Also, this optimization process lets us know thebest operative condition at fermenter without compromise ofany objective function. All objective function are describedbelow.To optimize the TAC, the optimization problem might be
written as follows:
=
≥
f D E E C C C
y x
min(TAC) ( , , , , , )
s.t. k k
1 N xt c x l
(4)
where D is the dilution rate (h−1), EN is the amount of enzymeadded ($/kg biomass), and Ext is the amount of extractant infeed stream.The TAC has been calculated taking as base the method-
ology presented by Guthrie35,36 as follows:
=+( )
( )TAC
operating cos t
annual ABE production
r$
yeartotal investment ($)
(year)
Kgyear (5)
Where r is the time of return of the investment. We considered3 years.33
The total investment of process is given by
= + + +C C C Ctotal investment R T IN IE (6)
where CR, CT, CIN, and CIE are the reactor cost, column cost,condenser cost, and initial investment, respectively. All costwere calculated as a function of the installation cost.The annualized operative cost is calculated as follows:
= + + + + +C C C C C Coperating cos t E V AE S ENZ Ex(7)
where Ce, Cv, Cae, Cs, Cenz, and Cex represent the electricity cost,steam cost, cooling water cost, substrate cost, enzyme cost, andcost due to extractant lost, respectively.As has been told, we considered a stirred reactor of 1000 m3.
Only 0.7 of total volume is full in order to prevent high volumechanges during a hypothetical control of the process. Despitethe TAC being the main economic index, we used other targetssimultaneously during the optimization process. The secondobjective function is written as follow:
=
≥
f D E E C C C
y x
max(productivity) ( , , , , , )
s.t.
N
k k
2 xt c x l
(8)
The main reason for maximizing the productivity is to reducethe size of the reactor and consequently the production cost.37
The productivity is defined as follows:
= +
≥
PV
C MW F C MW F
y x
productivity ( )1
( ( ))
s.t. k k
B B,3 B 3 B,p B p
(9)
Moreover, the yield evaluation let us know the amount ofsubstrate converted in the interest product. Consequently it ispossible to know the substrate cost during fermentation.Maximizing the yield is equivalent to minimizing biobutanolproduction. Further, maximizing the yield produces aminimization of biomass accumulated in the fermenter, whichis totally desirable since the elimination of waste material is aserious problem.36
To maximize yield inside the fermenter, the third objectivefunction is described as follow:
=
≥
f D E E C C C
y x
max(yield) ( , , , , , )
s.t. k k
3 N xt c x l
(10)
where yield is defined in next equation:
=+−
≥
YC MW F C MW F
C FMW C F MW
y x
( )
( )
s.t. k k
BB,3 B 3 B,p B p
S,1 1 S S,p p B
(11)
Currently the main hurdle in the fermentation process is thelow concentration in products. The main production cost ishighly influenced by product concentration. Further, since theseparation technique is also not efficient, maximizingbiobutanol concentration is equivalent to minimize operativecosts (reboiler heat duty and cooling water) in purificationunits such as liquid−liquid extraction column or distillationcolumns. In this manner our fourth and last objective functionis described as follows:
Industrial & Engineering Chemistry Research Article
DOI: 10.1021/acs.iecr.6b04230Ind. Eng. Chem. Res. 2017, 56, 1823−1833
1826

=
≥
f D E E C C C
y x
max(butan ol concentration) ( , , , , , )
s.t. k k
4 N xt c x l
(12)
where butanol concentration is defined in next equation:
=+
≥
C MW F C MW F
F
y x
C( )
s.t. k k
BB,3 B 3 B,p B p
1
(13)
With all those objective functions a complex scenario could beobserved since almost all our objective functions are in conflictto each other; under this behavior a multiobjective functionwould let us know several steady states in the fermentationprocess trying to reach high productivities, yields, andconcentrations with as small as possible total annual costs. Allobjective functions are subject to several decision variablesobserved in Table 6.
4. MULTIOBJECTIVE OPTIMIZATION STRATEGYTo optimize the bioreactor to produce butanol, we used astochastic optimization method, the Differential Evolution withTabu List (DETL).29 Stochastic optimization algorithms havebeen proven in several works to be able to solve highlynonlinear problems and potentially nonconvex problems,similar to variables involved in this work (shown38,28 in Table1). Those methods even have been tested in MINLP problemsinvolved in other works.39−41
DETL has its basis in natural selection theory, similar togenetic algorithms. In the DETL method it is possible to findsome parameter such as initial population, size of Tabu List,crossover, and mutation. Srinivas and Rangaiah42 showed thatthe use of some concepts of the metaheuristic tabu couldimprove the performance of the DE algorithm. In particular, theTabu List (TL) can be used to avoid the revisit of search spaceby keeping record of recently visited points, which can avoidunnecessary function evaluations.The implementation of this optimization algorithm is
performed using a hybrid platform considering MicrosoftExcel where the algorithm is programmed, Matlab where thebioreactor is modeled, and Aspen Plus where the separationunit is simulated. The vector of decision variables (i.e., thedesign variables) are sent from Microsoft Excel to Matlab usingDDE (Dynamic Data Exchange) in which the bioreactor issimulated and gives the inlet streams to the separation unit. InMicrosoft Excel, these values are attributed to the processvariables that Matlab needs. After the simulation, Matlab andAspen Plus return to Microsoft Excel the resulting vector.
Finally, Microsoft Excel analyzes the values of the objectivefunction and proposes new values of decision variablesaccording to the stochastic optimization method used. Tooptimize our cases of study, we have used the followingparameters for the DETL method: 120 individuals, 500generations, a tabu list of 50% of total individuals, a taburadius of 1 × 10⁻⁸, and 0.85 and 0.5 for crossover and mutationfractions, respectively. These parameters were obtained througha tuning process via preliminary calculations. All the objectivefunctions are subject to a range of values and restrictions of thedecision variable described in Table 1. Those degrees offreedom were selected because of their importance in the ABEfermentation. Note that the variation in dilution rate directlyaffects several indexes such as productivity and productconcentration; besides, the amount of enzyme determines theavailable sugars in fermentation and directly impacts theprocess cost, in the same manner that the amount of extractdirectly impacts the process cost because further recovery isnecessary. Also the sugar and lignin concentrations fed to thesystem must be correct.
5. RESULTS AND DISCUSSION5.1. Preliminary Biobjective Optimization Results. As
mentioned in section 3, a biobjective optimization was initiallyperformed to determine both range variable values and zoneswhere it is feasible to operate the reactor withoutcompromising any target. The results from this biobjectiveoptimization process are presented in the Pareto fronts inFigure 3a. Note that Figure 3a shows both objective functionsTAC and butanol concentration. When these two objectivefunction are evaluated it appears they are in conflict, in otherwords, while butanol concentration grows the TAC increasestoo. The lowest butanol concentrations are obtained by usingthe lowest sugar concentrations and vice versa. However, notethat an increase in sugar concentration implies an increase inthe amount of enzyme, and consequently, the amount ofextractant agent increases as well as the TAC. Approximatelyafter 9.297 g L−1 the TAC value rises drastically. On the otherhand, with low concentration values such as 7.6 g L−1, the TACvalues obtained are near 0.268 $/kg-ABE.A deeper analysis can be carried out observing the values in
Table 2. Basically, three areas in the Pareto front of Figure 3acan be noted. In the zone where higher TAC values are locateda higher amount of butanol is produced if the dilution factor isincreased; however, if this happens the amount of enzymedecreases, both behaviors producing a higher TAC. A contrarybehavior is obtained in the zone where the smallest TAC valuesare.On the other hand, in the middle zone of the Pareto front
both objective functions converge. This zone is consideredmore feasible since the lowest values for both objectivefunctions are obtained. The average amount of butanolproduced is 9.3 g L−1 approximately with a TAC value of0.282 $/kg-ABE.Another relevant index in the fermentation process is the
productivity, which must be optimized for increasing theperformance of the process. After this biobjective optimizationprocess it was possible to obtain the Pareto front in Figure 3b;in this Pareto front the productivity was evaluated bearing inmind the total annual cost. It is possible to observe a similarbehavior than in Figure 3a, in this case when productivityincreases the TAC value increases as well. This behavior isresumed in the convergence zones showed in Table 4.
Table 1. Decision Variables and Their Ranges Used in theMultiobjective Optimization of a Bioreactor
decision variablerange used inoptimization
variablecategory
dilution rate (D) h−1 0.001 ≤ D ≥ 0.1 continuousenzymes Ez (g-enzyme/kg-butanol)
40 ≤ Ez ≥ 180 continuous
solvent (Ex) kg-extractant/kg-butanol
40 ≤ Ex ≥ 80 continuous
concentration cellulose CC g L−1 80 ≤ Cc ≥ 140 continuousconcentration xylose CX g L−1 50 ≤ CX ≥ 100 continuousconcentration lignin CL g L−1 35 ≤ CL ≥ 90 continuous
Industrial & Engineering Chemistry Research Article
DOI: 10.1021/acs.iecr.6b04230Ind. Eng. Chem. Res. 2017, 56, 1823−1833
1827

Table 3 shows several values obtained through thebiobjective optimization process. In brief, if the sugar feedstream increases, the sugar concentration in the reactorincreases, but the sugar conversion decreases. On the otherhand if the rate conversion increases, the productivity increasesas well; however, those two measurements are not able to reach
high values because of substrate inhibition. In this way a feasiblezone exists, where the best values of those two measurementsare located. This zone can be found through a multiobjectiveoptimization process.Figure 3c shows the Pareto front obtained when sugar
conversion is evaluated with the total annual cost. In this Pareto
Figure 3. Pareto-optimal fronts obtained of biobjective optimization of TAC vs bioindicators.
Table 2. Results of the Biobjective Optimization Evaluation of TAC vs Concentration of Butanol at Representative Points of theZones
f1 f4 D Ez Ex Cc Cx Cl
zone 1 0.26844 7.736 0.013015 195.592 42.603 90.22 89.96 45.690.26830 7.565 0.012578 197.938 41.025 90.35 89.80 73.19
zone 2 0.28262 8.988 0.017524 193.249 40.370 90.56 89.97 46.110.28244 8.983 0.017482 198.704 40.281 90.85 89.96 46.68
zone 3 0.33271 9.298 0.020445 184.685 40.256 121.71 88.73 45.730.33583 9.303 0.020623 178.941 40.204 122.27 88.63 45.19
Table 3. Results of the Biobjective Optimization Evaluating TAC vs Conversion at Representative Points of the Zones
f1 f 3 D Ez Ex Cc Cx Cl
zone 1 0.2686 0.3375 0.012205 195.836 41.30 90.39 89.79 75.320.2684 0.3369 0.012913 191.788 43.27 90.81 89.99 70.33
zone 2 0.2821 0.3507 0.010010 149.568 55.77 128.38 89.88 74.030.2819 0.3501 0.010011 160.037 56.34 129.54 89.75 77.80
zone 3 0.3168 0.3603 0.010047 80.231 78.49 119.64 78.02 79.750.3204 0.360 0.010025 80.234 78.12 119.84 74.27 56.81
Industrial & Engineering Chemistry Research Article
DOI: 10.1021/acs.iecr.6b04230Ind. Eng. Chem. Res. 2017, 56, 1823−1833
1828

front, the decision variable which produces a great impact inconversion is the dilution rate. Note that is possible to obtainbutanol with low prices; however, the conversion decreasesnotably. Also, it is observed that work with high dilution ratesimplies a higher amount of enzyme which implies more butanolproduced; however, if there is more butanol the amount ofextractant needed increases as well, increasing energy require-ments in the separation unit.On the other hand, when the dilution rate is set to increase,
the butanol conversion implies that solvent requirements wouldincrease in the separation unit, which obviously requires energyto separate the ABE mixture. In other words, work under thelow dilution rate values produces higher residence time, whichimplies the addition of a lower amount of enzyme because thesugar takes more time to be fermented, subsequently moreextractant and energy are required in the separation unit.
Finally, Figure 3d shows the behavior when yield and butanolconcentration are evaluated. In this test it was possible toobserve how difficult it is to obtain high butanol concentrationswith high yield as well. Therefore, the operative zone must beselected according to the operative necessity, just as in all thecases already studied.
5.2. Multiobjective Optimization Results. In all resultspresented so far, it is possible to notice the role of each targetagainst others during this optimization process. It was feasibleto minimize the TAC when it is evaluated with several targetssuch as productivity, butanol concentration, and sugarconversion. However, since only two objective functions areinvolved in the optimization process, it is not possible to knowthe behavior of the other targets, which probably wouldgenerate a huge impact and several alternative scenarios. In thismanner, a multiobjective optimization is mandatory since this
Table 4. Results of Optimization Biobjective of TAC vs Productivity at Representative Points of the Zones
f1 f 2 D Ez Ex Cc Cx Cl
zone 1 0.26860 0.865 0.01457 198.436 50.66 90.85 89.98 76.090.26876 0.808 0.01369 190.450 46.43 90.77 89.60 72.29
zone 2 0.29194 1.570 0.03055 191.285 79.81 101.14 89.88 78.910.29142 1.567 0.03064 188.726 79.91 98.95 89.81 78.27
zone 3 0.35640 1.773 0.03853 139.749 79.97 129.89 89.24 66.350.34982 1.770 0.03781 139.707 79.90 128.56 89.24 79.84
Figure 4. Pareto-optimal front obtained at 500 generations for the simultaneous minimization of TAC, maximization of butanol concentration, andproductivity.
Industrial & Engineering Chemistry Research Article
DOI: 10.1021/acs.iecr.6b04230Ind. Eng. Chem. Res. 2017, 56, 1823−1833
1829
process would let us know a more complete and morepromissory scenario, where any targets would be compromised.Further, it is clear that under the light of a multiobjective
optimization process it is possible to find a zone of severalstates where it is totally feasible to operate the bioreactorwithout compromise to economic or productivity indexes.Figure 4 shows the Pareto fronts after optimization. In those
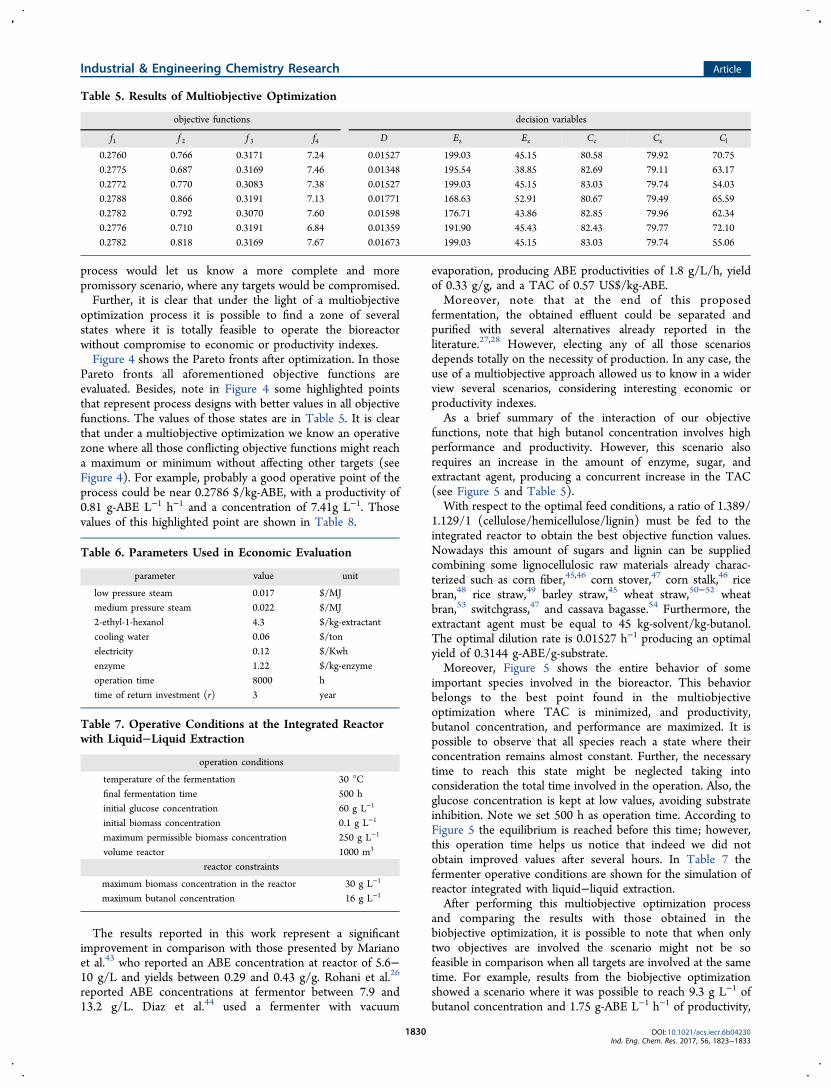
Pareto fronts all aforementioned objective functions areevaluated. Besides, note in Figure 4 some highlighted pointsthat represent process designs with better values in all objectivefunctions. The values of those states are in Table 5. It is clearthat under a multiobjective optimization we know an operativezone where all those conflicting objective functions might reacha maximum or minimum without affecting other targets (seeFigure 4). For example, probably a good operative point of theprocess could be near 0.2786 $/kg-ABE, with a productivity of0.81 g-ABE L−1 h−1 and a concentration of 7.41g L−1. Thosevalues of this highlighted point are shown in Table 8.
The results reported in this work represent a significantimprovement in comparison with those presented by Marianoet al.43 who reported an ABE concentration at reactor of 5.6−10 g/L and yields between 0.29 and 0.43 g/g. Rohani et al.26
reported ABE concentrations at fermentor between 7.9 and13.2 g/L. Diaz et al.44 used a fermenter with vacuum
evaporation, producing ABE productivities of 1.8 g/L/h, yieldof 0.33 g/g, and a TAC of 0.57 US$/kg-ABE.Moreover, note that at the end of this proposed
fermentation, the obtained effluent could be separated andpurified with several alternatives already reported in theliterature.27,28 However, electing any of all those scenariosdepends totally on the necessity of production. In any case, theuse of a multiobjective approach allowed us to know in a widerview several scenarios, considering interesting economic orproductivity indexes.As a brief summary of the interaction of our objective
functions, note that high butanol concentration involves highperformance and productivity. However, this scenario alsorequires an increase in the amount of enzyme, sugar, andextractant agent, producing a concurrent increase in the TAC(see Figure 5 and Table 5).With respect to the optimal feed conditions, a ratio of 1.389/
1.129/1 (cellulose/hemicellulose/lignin) must be fed to theintegrated reactor to obtain the best objective function values.Nowadays this amount of sugars and lignin can be suppliedcombining some lignocellulosic raw materials already charac-terized such as corn fiber,45,46 corn stover,47 corn stalk,46 ricebran,48 rice straw,49 barley straw,45 wheat straw,50−52 wheatbran,53 switchgrass,47 and cassava bagasse.54 Furthermore, theextractant agent must be equal to 45 kg-solvent/kg-butanol.The optimal dilution rate is 0.01527 h−1 producing an optimalyield of 0.3144 g-ABE/g-substrate.Moreover, Figure 5 shows the entire behavior of some
important species involved in the bioreactor. This behaviorbelongs to the best point found in the multiobjectiveoptimization where TAC is minimized, and productivity,butanol concentration, and performance are maximized. It ispossible to observe that all species reach a state where theirconcentration remains almost constant. Further, the necessarytime to reach this state might be neglected taking intoconsideration the total time involved in the operation. Also, theglucose concentration is kept at low values, avoiding substrateinhibition. Note we set 500 h as operation time. According toFigure 5 the equilibrium is reached before this time; however,this operation time helps us notice that indeed we did notobtain improved values after several hours. In Table 7 thefermenter operative conditions are shown for the simulation ofreactor integrated with liquid−liquid extraction.After performing this multiobjective optimization process
and comparing the results with those obtained in thebiobjective optimization, it is possible to note that when onlytwo objectives are involved the scenario might not be sofeasible in comparison when all targets are involved at the sametime. For example, results from the biobjective optimizationshowed a scenario where it was possible to reach 9.3 g L−1 ofbutanol concentration and 1.75 g-ABE L−1 h−1 of productivity,
Table 5. Results of Multiobjective Optimization
objective functions decision variables
f1 f 2 f 3 f4 D Ez Ex Cc Cx Cl
0.2760 0.766 0.3171 7.24 0.01527 199.03 45.15 80.58 79.92 70.750.2775 0.687 0.3169 7.46 0.01348 195.54 38.85 82.69 79.11 63.170.2772 0.770 0.3083 7.38 0.01527 199.03 45.15 83.03 79.74 54.030.2788 0.866 0.3191 7.13 0.01771 168.63 52.91 80.67 79.49 65.590.2782 0.792 0.3070 7.60 0.01598 176.71 43.86 82.85 79.96 62.340.2776 0.710 0.3191 6.84 0.01359 191.90 45.43 82.43 79.77 72.100.2782 0.818 0.3169 7.67 0.01673 199.03 45.15 83.03 79.74 55.06
Table 6. Parameters Used in Economic Evaluation
parameter value unit
low pressure steam 0.017 $/MJmedium pressure steam 0.022 $/MJ2-ethyl-1-hexanol 4.3 $/kg-extractantcooling water 0.06 $/tonelectricity 0.12 $/Kwhenzyme 1.22 $/kg-enzymeoperation time 8000 htime of return investment (r) 3 year
Table 7. Operative Conditions at the Integrated Reactorwith Liquid−Liquid Extraction
operation conditions
temperature of the fermentation 30 °Cfinal fermentation time 500 hinitial glucose concentration 60 g L−1
initial biomass concentration 0.1 g L−1
maximum permissible biomass concentration 250 g L−1
volume reactor 1000 m3
reactor constraints
maximum biomass concentration in the reactor 30 g L−1
maximum butanol concentration 16 g L−1
Industrial & Engineering Chemistry Research Article
DOI: 10.1021/acs.iecr.6b04230Ind. Eng. Chem. Res. 2017, 56, 1823−1833
1830

respectively. However, when all objective functions areevaluated at the same time, those values were not observedin the Pareto front, probably because one or more objectivefunctions could be compromised.
■ CONCLUSIONSThe reactor optimization integrating saccharification, fermenta-tion, and liquid−liquid extraction to produce biobutanol in asemicontinuous process was possible using a hybrid stochasticoptimization algorithm with several targets at the same time.Considering the results facing TAC against concentration weconclude that high concentrations are obtained only with highTAC values. The same tendency is observed evaluatingproductivity and performance against TAC. However, amultiobjective optimization evaluating all indexes showed aclear convergence tendency; that is, it is possible to find afeasible operative zone without compromising one target foranother. In other words, the operative zone and operativevariables in the reactor obtained after the optimization processconsider the balance among all our objective functions in orderto improve the performance of the ABE fermentation process.
■ ASSOCIATED CONTENT*S Supporting InformationThe Supporting Information is available free of charge on theACS Publications website at DOI: 10.1021/acs.iecr.6b04230.
Kinetic model; differential equations to describe the rateof all involved components during fermentation; list offermentation model constants; metabolic pathway forxylose and glucose consumption (PDF)
■ AUTHOR INFORMATIONCorresponding Author*E-mail: [email protected]; [email protected] Gabriel Segovia-Hernandez: 0000-0003-4175-9809NotesThe authors declare no competing financial interest.
■ ACKNOWLEDGMENTSThe authors wish to acknowledge financial support fromCONACyT for the development of this project andUniversidad de Guanajuato for all the support.
■ NOMENCLATURED = Dilution rate (h−1)X = biomass concentration (g L−1)PB = butanol productivity (g-ABE L−1 h−1)V = fermenter volume (m3)MWi = molecular weight of species i (g/mmol)CB = butanol concentration (g L−1)Ci = concentration of species i (mmol/L)Fn = stream volumetric flow rate (m3/h)YABE = yield (g-ABE/g-substrate)Ri = reaction rate g L−1 s−1
xi = molar composition in the reactorrF = recycle rate in fermenterEn = amount of enzyme added($/kg biomass)Ext = extractant in feed streamCc = concentration of celluloseCx = concentration of xyloseCl = concentration of ligninCR = reactor costCT = column costCIN = condenser costCIE = initial investmentCE = electricity costCV = steam costCAE = cooling water costCS = substrate costCENZ = enzyme costCEX = cost due to extractant lostyk = vectors of restrictionsx k = vectors of restrictions
Table 8. Streams Results for the Optimized Solution
wt %
stream ton/h acetone butanol ethanol extractant agent
F1 102.3 0 0 0 0F2 63.1 4.30 × 10−04 5.40 × 10−03 8.60 × 10−04 0F3 34.727 0.429 0.146 0.089 0.697F4 0.024 0 0 0 1F5 24.197 0 0 1F6 24.173 0 0 0 1F7 10.530 0.4292 0.4815 0.0893 0FP 91.770 4.30 × 10−04 5.40 × 10−04 8.60 × 10−04 0FL 52.570 0 0 0
Figure 5. Concentration profiles of a reactor with simultaneousfermentation, saccharification, and separation.
Industrial & Engineering Chemistry Research Article
DOI: 10.1021/acs.iecr.6b04230Ind. Eng. Chem. Res. 2017, 56, 1823−1833
1831

■ REFERENCES(1) Gi Moon, H.; Jang, Y. S.; Cho, C.; Lee, J.; Binkley, R.; Lee, S. Y.One Hundred Years of Clostridial Butanol Fermentation. FEMSMicrobiol. Lett. 2015, 363 (3), fnw001.(2) Green, E. M. Fermentative Production of Butanol–the IndustrialPerspective. Curr. Opin. Biotechnol. 2011, 22 (3), 337.(3) Lee, S. Y.; Park, J. H.; Jang, S. H.; Nielsen, L. K.; Kim, J.; Jung, K.S. Fermentative Butanol Production by Clostridia. Biotechnol. Bioeng.2008, 101 (2), 209.(4) Gottwald, M.; Gottschalk, G. The Internal pH of ClostridiumAcetobutylicum and Its Effect on the Shift from Acid to SolventFormation. Arch. Microbiol. 1985, 143 (1), 42.(5) Keis, S.; Shaheen, R.; Jones, D. T. Emended Descriptions ofClostridium Acetobutylicum and Clostridium Beijerinckii, andDescriptions of Clostridium Saccharoperbutylacetonicum Sp. Nov.and Clostridium Saccharobutylicum Sp. Nov. Int. J. Syst. Evol.Microbiol. 2001, 51 (6), 2095.(6) Durre, P. Physiology and Sporulation in Clostridium. Microbiol.Spectr. 2014, 2 (4), No. TBS-0010-2012, DOI: 10.1128/micro-biolspec.TBS-0010-2012.(7) Jones, D. T.; Woods, D. R. Acetone-Butanol FermentationRevisited. Microbiol. Rev. 1986, 50 (4), 484.(8) Jang, Y. S.; Lee, J.; Malaviya, A.; Seung, D. Y.; Cho, J. H.; Lee, S.Y. Butanol Production from Renewable Biomass: Rediscovery ofMetabolic Pathways and Metabolic Engineering. Biotechnol. J. 2012, 7(2), 186.(9) Lopez-Contreras, A. M.; Claassen, P. A. M.; Mooibroek, H.; DeVos, W. M. Utilisation of Saccharides in Extruded Domestic OrganicWaste by Clostridium Acetobutylicum ATCC 824 for Production ofAcetone, Butanol and Ethanol. Appl. Microbiol. Biotechnol. 2000, 54(2), 162.(10) Claassen, P. A.; Budde, M. A.; Lopez-Contreras, A. M. Acetone,Butanol and Ethanol Production from Domestic Organic Waste bySolventogenic Clostridia. J. Mol. Microbiol. Biotechnol. 2000, 2 (1), 39.(11) Ezeji, T.; Blaschek, H. P. Fermentation of Dried Distillers’Grains and Solubles (DDGS) Hydrolysates to Solvents and Value-Added Products by Solventogenic Clostridia. Bioresour. Technol. 2008,99 (12), 5232.(12) Parekh, S. R.; Parekh, R. S.; Wayman, M. Ethanol and ButanolProduction by Fermentation of Enzymatically Saccharified SO2-Prehydrolysed Lignocellulosics. Enzyme Microb. Technol. 1988, 10(11), 660.(13) Qureshi, N. Agricultural Residues and Energy Crops asPotentially Economical and Novel Substrates for Microbial Productionof Butanol (a Biofuel). CAB Rev. Perspect. Agric. Vet. Sci. Nutr. Nat.Resour. 2011, 5 (59), 1.(14) Wang, L.; Chen, H. Increased Fermentability of EnzymaticallyHydrolyzed Steam-Exploded Corn Stover for Butanol Production byRemoval of Fermentation Inhibitors. Process Biochem. 2011, 46 (2),604.(15) Andrie, P.; Meyer, A. S.; Jensen, P. A.; Dam-Johansen, K.Reactor Design for Minimizing Product Inhibition during EnzymaticLignocellulose Hydrolysis. II. Quantification of Inhibition andSuitability of Membrane Reactors. Biotechnol. Adv. 2010, 28, 407−425.(16) Jang, Y. S.; Malaviya, A.; Cho, C.; Lee, J.; Lee, S. Y. ButanolProduction from Renewable Biomass by Clostridia. Bioresour. Technol.2012, 123, 653−663.(17) Yang, X.; Tsao, G. T. Enhanced Acetone-Butanol FermentationUsing Repeated Fed-Batch Operation Coupled with Cell Recycle byMembrane and Simultaneous Removal of Inhibitory Products byAdsorption. Biotechnol. Bioeng. 1995, 47 (4), 444.(18) Qureshi, N.; Maddox, I. S. Continuous Production of Acetone-Butanol-Ethanol Using Immobilized Cells of Clostridium Acetobuty-licum and Integration with Product Removal by Liquid-LiquidExtraction. J. Ferment. Bioeng. 1995, 80 (2), 185.(19) Li, S. Y.; Srivastava, R.; Parnas, R. S. Study of in Situ 1-ButanolPervaporation from A-B-E Fermentation Using a PDMS CompositeMembrane: Validity of Solution-Diffusion Model for Pervaporative A-B-E Fermentation. Biotechnol. Prog. 2011, 27 (1), 111.
(20) Qureshi, N.; Blaschek, H. P. Recovery of Butanol fromFermentation Broth by Gas Stripping. Renewable Energy 2001, 22,557−564.(21) Ezeji, T. C.; Blaschek, H. P. Butanol Production fromLignocellulosic Biomass. In Biofuels from Agricultural Wastes andByproducts; Wiley-Blackwell, 2010; pp 19−37.(22) Groot, W. J.; Soedjak, H. S.; Donck, P. B.; Van der Lans, R. G. J.M.; Luyben, K. C. A.; Timmer, J. M. K. Butanol recovery fromfermentations by liquid-liquid extraction and membrane solventextraction. Bioprocess Eng. 1990, 5 (5), 203−216.(23) Oudshoorn, A.; van der Wielen, L. A. M.; Straathof, A. J. J.Assessment of Options for Selective 1-Butanol Recovery fromAqueous Solution. Ind. Eng. Chem. Res. 2009, 48 (15), 7325.(24) Sharma, S.; Rangaiah, G. P. Modeling and Optimization of aFermentation Process Integrated with Cell Recycling and Pervapora-tion for Multiple Objectives. Ind. Eng. Chem. Res. 2012, 51 (15), 5542.(25) Mariano, A. P.; Costa, C. B. B.; de Angelis, D. D. F.; Pires Atala,D. I.; Maugeri Filho, F.; Wolf Maciel, M. R.; Maciel Filho, R. GeneticAlgorithms (Binary and Real Codes) for the Optimisation of aFermentation Process for Butanol Production. Int. J. Chem. React. Eng.2010, 8 (1), No. 1542-6580, DOI: 10.2202/1542-6580.2333.(26) Sharif Rohani, A.; Mehrani, P.; Thibault, J. Comparison of in-Situ Recovery Methods of Gas Stripping, Pervaporation, and VacuumSeparation by Multi-Objective Optimization for Producing Biobutanolvia Fermentation Process. Can. J. Chem. Eng. 2015, 93 (6), 986.(27) Sanchez-Ramírez, E.; Quiroz-Ramírez, J. J.; Segovia-Hernandez,J. G.; Hernandez, S.; Bonilla-Petriciolet, A. Process Alternatives forBiobutanol Purification: Design and Optimization. Ind. Eng. Chem. Res.2015, 54 (1), 351.(28) Kraemer, K.; Harwardt, A.; Bronneberg, R.; Marquardt, W.Separation of Butanol from Acetone-Butanol-Ethanol Fermentation bya Hybrid Extraction-Distillation Process. Comput. Chem. Eng. 2011, 35(5), 949.(29) Srinivas, M.; Rangaiah, G. P. Differential evolution with tabu listfor solving nonlinear and mixed-integer nonlinear programmingproblems. Ind. Eng. Chem. Res. 2007, 46 (22), 7126−7135.(30) Shinto, H.; Tashiro, Y.; Kobayashi, G.; Sekiguchi, T.; Hanai, T.;Kuriya, Y.; Okamoto, M.; Sonomoto, K. Kinetic Study of SubstrateDependency for Higher Butanol Production in Acetone-Butanol-Ethanol Fermentation. Process Biochem. 2008, 43 (12), 1452.(31) Mayank, R.; Ranjan, A.; Moholkar, V. S. Mathematical Modelsof ABE Fermentation: Review and Analysis. Crit. Rev. Biotechnol. 2013,33 (4), 419.(32) Kadam, K. L.; Rydholm, E. C.; McMillan, J. D. Developmentand Validation of a Kinetic Model for Enzymatic Saccharification ofLignocellulosic Biomass. Biotechnol. Prog. 2004, 20 (3), 698.(33) Luyben, W. L. Principles and Case Studies of Simultaneous Design;John Wiley and Sons, 2011.(34) Gonzalez-Penas, H.; Lu-Chau, T. a; Moreira, M. T.; Lema, J. M.Solvent Screening Methodology for in Situ ABE ExtractiveFermentation. Appl. Microbiol. Biotechnol. 2014, 98 (13), 5915.(35) Guthrie, K. M. Data and Techniques for Preliminary CapitalCost Estimating. Chem. Eng. 1969, 76 (6), 114.(36) Ulrich, G. D. A Guide to Chemical Engineering Process Design andEconomics; Wiley: New York, 1984; p 295.(37) Doran, P. Bioprocess Engineering Principles; Elsevier, 2013.(38) Errico, M.; Sanchez-Ramirez, E.; Quiroz-Ramìrez, J. J.; Segovia-Hernandez, J. G.; Rong, B. G. Synthesis and Design of New HybridConfigurations for Biobutanol Purification. Comput. Chem. Eng. 2016,84, 482.(39) Yiqing, L.; Xigang, Y.; Yongjian, L. An Improved PSO Algorithmfor Solving Non-Convex NLP/MINLP Problems with EqualityConstraints. Comput. Chem. Eng. 2007, 31 (3), 153.(40) Srinivas, M.; Rangaiah, G. P. Differential Evolution with TabuList for Solving Nonlinear and Mixed-Integer Nonlinear ProgrammingProblems. Ind. Eng. Chem. Res. 2007, 65, 7126 DOI: 10.1021/ie070007q.(41) Bonilla-Petriciolet, A.; Rangaiah, G. P.; Segovia-Hernandez, J. G.Constrained and Unconstrained Gibbs Free Energy Minimization in
Industrial & Engineering Chemistry Research Article
DOI: 10.1021/acs.iecr.6b04230Ind. Eng. Chem. Res. 2017, 56, 1823−1833
1832

Reactive Systems Using Genetic Algorithm and Differential Evolutionwith Tabu List. Fluid Phase Equilib. 2011, 300 (1−2), 120.(42) Srinivas, M.; Rangaiah, G. P. A Study of Differential Evolutionand Tabu Search for Benchmark, Phase Equilibrium and PhaseStability Problems. Comput. Chem. Eng. 2007, 31, 760.(43) Mariano, A. P.; Keshtkar, M. J.; Atala, D. I. P.; Filho, F. M.;Regina, M.; Maciel, W.; Filho, R. M.; Stuart, P. Energy Requirementsfor Butanol Recovery Using the Flash Fermentaion Technology.Energy Fuels 2011, 25, 2347.(44) Díaz, V. H. G.; Tost, G. O. Butanol Production fromLignocellulose by Simultaneous Fermentation, Saccharification, andPervaporation or Vacuum Evaporation. Bioresour. Technol. 2016, 218,174.(45) Qureshi, N.; Saha, B. C.; Dien, B.; Hector, R. E.; Cotta, M. A.Production of butanol (a biofuel) from agricultural residues: Part I -Use of barley straw hydrolysate. Biomass Bioenergy 2010, 34 (4), 559−565.(46) Qureshi, N.; Blaschek, H. P. Butanol production fromagricultural biomass. Food Sci. Technol. 2006, 148.(47) Qureshi, N.; Saha, B. C.; Hector, R. E.; Dien, B.; Hughes, S.;Liu, S.; Iten, L.; Bowman, M. J.; Sarath, G.; Cotta, M. A. Production ofbutanol (a biofuel) from agricultural residues: Part II - Use of cornstover and switchgrass hydrolysates. Biomass Bioenergy 2010, 34 (4),566−571.(48) Lee, J.; Seo, E.; Kweon, D. H.; Park, K.; Jin, Y. S. Fermentationof rice bran and defatted rice bran for butanol production usingClostridium beijerinckii NCIMB 8052. J. Microbiol. Biotechnol. 2009,19 (5), 482−490.(49) Ranjan, A.; Moholkar, V. S. Comparative study of variouspretreatment techniques for rice straw saccharification for theproduction of alcoholic biofuels. Fuel 2013, 112, 567−571.(50) Qureshi, N.; Saha, B. C.; Cotta, M. a. Butanol production fromwheat straw hydrolysate using Clostridium beijerinckii. BioprocessBiosyst. Eng. 2007, 30 (6), 419−427.(51) Qureshi, N.; Saha, B. C.; Hector, R. E.; Hughes, S. R.; Cotta, M.A. Butanol production from wheat straw by simultaneous saccha-rification and fermentation using Clostridium beijerinckii: Part I-Batchfermentation. Biomass Bioenergy 2008, 32 (2), 168−175.(52) Qureshi, N.; Saha, B. C.; Hector, R. E.; Hughes, S. R.; Cotta, M.a. Butanol production from wheat straw by simultaneous saccha-rification and fermentation using Clostridium beijerinckii: Part IIFed-batch fermentation. Biomass Bioenergy 2008, 32 (2), 168−175.(53) Liu, Z.; Ying, Y.; Li, F.; Ma, C.; Xu, P. Butanol production byClostridium beijerinckii ATCC 55025 from wheat bran. J. Ind.Microbiol. Biotechnol. 2010, 37 (5), 495−501.(54) Lu, C.; Zhao, J.; Yang, S.-T.; Wei, D. Fed-batch fermentation forn-butanol production from cassava bagasse hydrolysate in a fibrousbed bioreactor with continuous gas stripping. Bioresour. Technol. 2012,104, 380−387.
Industrial & Engineering Chemistry Research Article
DOI: 10.1021/acs.iecr.6b04230Ind. Eng. Chem. Res. 2017, 56, 1823−1833
1833