multinationals and the globalization of r&d
TRANSCRIPT

Multinationals and the Globalization of R&D
by
María García-Vega, Patricia Hofmann and Richard Kneller*
Abstract
In this paper we consider how the location, organization and output of knowledge production evolve
within domestic firms following acquisition-FDI in order to understand the aggregate effect on an
index of domestically produced innovations. We find strong differences according to how close the
acquiring MNE is to the technologically frontier. Frontier MNEs are more likely to close R&D
activities in acquired affiliates, but when they are retained they expand employment of high-skilled
R&D workers and transfer R&D knowledge. Non-frontier MNEs make fewer changes to R&D.
Overall the effect of acquisition-FDI on the domestic innovation index is positive.
JEL classification: F23; O32; D22; L20
Keywords: MNE; Knowledge Production Function; Acquisition FDI; Knowledge Complementarities; R&D:
innovation, Technology Transfers.
* García-Vega: School of Economics, University of Nottingham, University Park, Nottingham NG7 2RD, United Kingdom
and GEP (email: [email protected]); Hofmann: Department of Economics, University of Hohenheim,
D-70593 Stuttgart, Germany (email: [email protected]); Kneller: School of Economics, University of
Nottingham, University Park, Nottingham NG7 2RD, United Kingdom, GEP and CESIfo (email:
[email protected]). We would like to thank Joel Stiebale for his very helpful comments and Sourafel
Girma for providing the program to calculate treatment effects. We thank Johannes Biesebroeck, Giammario Impullitti,
Simon Gächter, Beata Javorcik, and María Rochina for their helpful comments as well as seminar participants at the
University of Nottingham, Trento, and 14th ETSG Conference (Leuven), ZEW (Mannheim) and 5th ISGEP workshop
(Ljubljana), ICTNET workshop (London), 27th EEA Conference (Malaga), 39th Annual EARIE Conference (Rome),
Royal Economic Society Annual Conference (Sussex).

1
1. Introduction
Modern theories of growth and development (Acemoglu, 2007; Arora et al., 2011; Bloom et al.,
2012; Aghion et al., 2014) emphasise technology and its evolution as an explanation for differences in
income levels across countries. This technology stock is usually defined as the sum of that produced
domestically, together with the technologies that have diffused internationally in an embodied or
disembodied form (Coe and Helpman, 1995; Keller, 2004). Multinational firms (MNEs) are at the
heart of discussions around the determinants of this stock as they account for the majority of global
R&D expenditures and share their knowledge across their international affiliates (Helpman, 1984;
Markusen, 1984; Branstetter et al., 2006; Keller and Yeaple, 2013).
Globally, most foreign direct investment (FDI) takes the form of mergers and acquisitions, often
involving R&D active firms (UNCTAD, 2005, 2007). Such acquisitions therefore impact domestic
technology levels, but how? Guadalupe et al. (2012) show that acquired subsidiaries increase
technology adoption as a result of their access to a larger market. But, what are its effects on the
domestic innovation capability of acquired firms and what are its aggregate effects?1 What happens
with research employment? Do subsidiaries become more reliant on international technology transfers
versus domestic production of knowledge, are there differences across types of MNEs, and does this
alter the productivity of the innovation process? To answer these questions, we examine the effects of
acquisition-FDI on the production of knowledge by acquired firms and then combine these to describe
the evolution of an aggregate domestic technology index.
The starting point for our analysis assumes that MNEs have the incentive to generate and to share
knowledge across their affiliates as efficiently as possible and will therefore alter R&D structures in
response to new acquisitions (Helpman, 1984; Markusen, 1984; Branstetter et al., 2006; Keller and
Yeaple, 2013). We capture these changes by following changes in the probability of starting and
shutting down research labs, and then conditional of keeping research facilities, we study changes in
internal and external R&D spending, R&D employment disaggregated by level of education and
patents per euro of expenditure of acquired firms in the time periods following acquisition. We use a
difference-in-differences approach with non-acquired domestic firms as a counterfactual. To control
for possible selection on observables, we use the propensity score matching previously deployed to
1 Acquisition-FDI is sometimes subject to fierce political scrutiny because of fears it can damage domestic technology
levels. For example, the proposed takeover of the British-Swedish firm AstraZeneca by Pfizer in 2014 led to requests for
guarantees for the retention of research jobs in the UK from the Prime Minister, the leader of the Opposition and the
president of the Royal Society.

2
study the productivity and employment effects of foreign acquisitions by Chen (2011), Criscuolo and
Martin (2009); Greenaway and Kneller (2007) and Guadalupe et al. (2012) amongst others.2
To capture the aggregate effects on domestic innovation we calculate the change in an index of
domestically produced innovations per euro of expenditure following a period of acquisition-FDI.
Within this index, the aggregate effect of FDI depends upon the response of innovation outputs within
acquired firms (a within-firm effect measuring the change in innovation output per euro of expenditure
keeping constant the innovation spending of the firm), but also between firm reallocation effects
(measuring the change in innovation spending keeping innovation output constant), a cross effect
(measuring the change in output and spending) and an entry and/or exit effects (measuring the start, or
cessation of R&D).3 We also allow these outcomes to differ across acquisitions, with different
responses when the acquiring-MNE is closer to the technological frontier. This paper represents the
first attempt in the literature to model the effects of acquisition FDI on the evolution of R&D output
together with its location and organization within acquired firms in this way.
The data we use are an annualized version of the Spanish Community Innovation Survey (CIS)
and contain detailed information on expenditures, employment and innovation outputs. Within the
time period we study (2004 to 2009) there are 300 acquisitions of R&D active domestic firms. These
represent 3.7% of total Spanish R&D expenditures, indicating the importance of understanding the
effect of changes in ownership of this type.4 Consistent with versions of the CIS for other countries,
the data include a direct measure of R&D technology transfers within the MNE: imports of knowledge
from the business group.5 That Spain represents a country that would not typically being viewed as on
the technological frontier provides an important aspect of our investigation as it ensures heterogeneity
in these knowledge transfers across MNEs that we then exploit empirically.6 We consider frontier
foreign acquisitions if the MNE is headquartered in a technologically intensive country or not. In the
baseline regressions we adopt a conservative classification and include only MNEs from Germany
Japan, and USA as technological frontier countries. Of the 300 acquisitions, 104 are by frontier MNEs
and 196 are MNEs that are behind the technological frontier.
2 If the acquisition decision was driven by non-R&D factors that are correlated with observable affiliate characteristics
such as size this will be controlled for through our matching exercise. If it was driven by unobservable time-invariant
heterogeneity related either to the affiliate it will be controlled for through the difference-in-differences approach. 3 This approach was originally applied to decompose aggregate productivity. 4 In Spain, 22% of total R&D expenditures are by foreign owned firms. This compares to 19% of total US R&D spending
(NSF, 2016) and 25% in Germany (DIW, 2016). 5 R&D imports do not include royalties, licenses, trademarks or franchise fees (those are included in a different question
of the survey). 6According to the European Commission, Spain is considered a ‘moderately’ innovative country (European Innovation
Scoreboard, 2009).

3
From the analysis we are able to show that the acquisition of R&D active firms by foreign MNEs
has a positive effect on the stock of domestically produced knowledge, accounting for 7.14% of the
growth in the Spanish technology index over a 5-year period. This is a significant change in the
domestic technology production caused by acquisition-FDI, in particular given these firms accounted
for a smaller share of expenditures (3.7%). A large part of this increase is accounted for by the within
effect; the innovation output of acquired firms increases. This increase is driven by changes that occur
when acquisition is from a technological frontier MNE. For these firms, we find evidence of skill-
upgrading and large increases in technology transfers of scientific knowledge from elsewhere within
the MNE. These positive within effects are offset to some extent by negative between effects, as R&D
expenditures fall when acquisition is by a non-technologically-leading MNE and by the increased risk
the R&D labs are closed by frontier MNEs.
An explanation for our results is that R&D active MNEs face an opportunity cost of choosing a
globalized R&D strategy and retaining innovation within the acquired subsidiary, versus the closure
of the acquired lab and the relocation of this R&D effort elsewhere. These opportunity costs can be
because innovation is produced with increasing returns to scale as in Arkolakis et al. (2014) or because
there are localized knowledge spillovers as in the model of Ekholm and Hakkala (2007). These
incentives are likely to vary with the technological leadership of the MNE. If the opportunity cost is
high, as it might be for technologically frontier MNEs, the acquired R&D lab may be closed and
knowledge creation concentrated within a single location. Alternatively the MNE will exploit
complementarities in the knowledge base across different locations by sharing its scientific knowledge
between its labs.7 The MNE will then retain the affiliate R&D lab and decentralize R&D globally. If
the technology transfers that occur in this outcome are complementary to high-skilled personnel, then
the R&D process in the acquired lab will also be restructured to take advantage of intrafirm knowledge
transfers. Frontier MNEs have more valuable knowledge to share and might undertake the greatest
reorganisation, thereby increasing the retained R&D lab’s rate of innovation by the greatest amount.8
7 For example, Nocke and Yeaple (2008) discuss the importance of complementarities as a determinant of acquisitions.
Moraga et al. (2018) study the effect of mergers on R&D investments when firms have different R&D projects that differ
in their degree of innovativeness. For a summary on the literature of R&D complementarities between merging firms see
Jullien and Lefouili (2018). The Financial Times (2014) reports the growing importance of collaboration and sharing
technology across different labs to generate innovations. These flows of R&D are economically important. For example,
the National Science Foundation (NSF, 2012) reports that, in the US during 2009, the exports and imports of R&D and
testing were $18.2 billion and $15.8 billion, respectively, most of them within MNEs. This represents 1.7% and 1.5% of
exports and imports of trade in goods respectively
8 Regarding the reorganization of the R&D, Federico et al. (2017) consider that R&D might decline after merger activity
due to R&D duplication or substitutability of some innovative activities.

4
A different mechanism that can also lead to an increase in innovation expenditures following
acquisition are due to a market size effect as in Guadalupe et al. (2012) or Denicolò and Polo (2018a).
In the model of Denicolò and Polo (2018a), innovation is not firm-specific, and therefore mergers
might increase innovation and the sharing of technologies because the scope for the application of new
technologies increases.9 Therefore, the effects of acquisition-FDI depend upon the survival of R&D
labs, together with the effects on the organization of R&D that might arise from knowledge
complementarities or sharing technologies within a globalized R&D structure.
Our findings make novel contributions to the literature on innovation and acquisition-FDI. For
Spain, Guadalupe et al. (2012) find that technology adoption increases in acquired affiliates. Stiebale
(2016) extends this literature to show that innovation in the merged entity as a whole rises. Of interest,
he shows that this occurs largely as a consequence of a rise in innovation in the acquirer, with declines
in innovation for the acquired affiliate. In contrast, we find that innovation in the acquired firm rises,
but only for those acquired by technologically-frontier MNEs. This rise in innovations combined with
declines in expenditures, suggest rising productivity and therefore our findings provide a novel
explanation for the ample evidence for productivity improvements that follow from acquisition FDI
(Arnold and Javorcik, 2009; Criscuolo and Martin, 2009; Chen, 2011).10
We also make a contribution to a literature that explores partial effects of acquisition-FDI on total
R&D expenditures. These results appear to depend strongly on the country being considered, with a
mix of positive and negative effects found for total R&D spending (Bandick et al., 2014; Stiebale and
Reize, 2011) and on the empirical literature of the effect of mergers on R&D (Bertrand and Zuniga,
2006; Szücs, 2014; Haucap et al., 2018). Compared to these articles, we study total expenditures
alongside other organisational changes, including closure, and also how acquisition affects innovation
output. Moreover, we analyse indirect effects of FDI-acquisition, or in other words, we study the
impact of acquisition on R&D for the non-acquired firms.
Finally, we can relate our findings to a number of different avenues of research on MNEs found
in the existing literature. Firstly, they are consistent with a number of stylised facts about the R&D
behaviour of MNEs. Alongside being major producers of new technologies (Criscuolo et al., 2010,
Dunning and Lundan, 2008; Javorcik, 2010) MNEs are more globalised in their R&D locations than
9 The increased probability of shutting research labs following acquisition provides support to the theoretical model of
Denicolò and Polo (2018b). 10 See also Harris and Robinson (2002), Girma et al. (2007), Greenaway and Kneller (2007), Arnold and Javorcik (2009),
Keller (2010), and Maksimovic et al. (2011) among others.

5
non-MNEs (Bloom and Griffith, 2001; NSF, 2011; Guadalupe et al., 2012).11 They have also been
shown to use more intensively knowledge sourced internationally within their R&D production
function (Veugelers and Cassiman, 2004; Criscuolo et al., 2010) and transfer knowledge to their
affiliates (Branstetter et al., 2006; Bilir and Morales, 2015).
The rest of the paper is organized as follows. Section 2 details the data used and Section 3 the
empirical methodology. Section 4 describes our main empirical results and provides an overall
quantification of the effect of foreign acquisition on the domestic knowledge production. Section 5
presents some tests for the robustness of our main findings including pre-existing trends, an alternative
definition of frontier-MNEs and measures of indirect effects using the methodology of Girma et al.
(2015) that controls by Stable Unit Treatment Value Assumption (SUTVA) violation. Finally, we draw
the conclusions from the study in Section 6.
2. Data
The data we use is drawn from an annual survey of Spanish firms called Panel de Innovación
Tecnológica (PITEC).12 This survey has been conducted since 2004 by the Spanish National Institute
of Statistics as an annualised version of the Spanish Community Innovation Survey (EUROSTAT).
We use information for all years between 2004 and 2009. The survey is designed to be an unbalanced
panel, representative of firms operating in the manufacturing and service sectors. Each year firms are
asked to provide information on a number of key performance characteristics, such as sales,
employment, ownership, industry and, of interest in this paper, innovation activities. In order to study
the effects of acquisition-FDI relative to a counterfactual of non-acquired firms, we exclude from the
sample firms that are always foreign owned, those that were acquired more than once, public firms
and those without R&D expenditures throughout the sample period. Our final sample contains 7,719
firms.
To construct our measure of acquisition-FDI we use information on the ownership of the firm,
specifically the country location of the headquarters of the owner, and the proportion of equity they
hold. We identify foreign acquisitions by a change in the majority equity holder of the firm to one
11 Bloom and Griffith (2001) provide detailed evidence on the internationalisation of R&D amongst the G5 countries.
According to the National Science Foundation (NSF, 2016) around 13% of all expenditures on R&D by American MNEs
are conducted outside of the United States. 12 For details of the survey see http://icono.fecyt.es/PITEC/Paginas/descarga_bbdd.aspx.
6
where control is outside of Spain (i.e. who controls more than 50% of the equity).13 There are 300
acquisitions of domestic firms by foreign multinationals during the period 2004-2009. These
acquisitions are from 27 different countries, with the three-quarters accounted for by just seven
countries (France 53, Germany 49, US 49, UK 25, Italy 20, Netherlands 19 and Switzerland 12).
We are interested in differences between frontier and non-frontier foreign acquisitions. We
consider frontier foreign acquisitions if the MNE is headquartered in a technologically intensive
country. In the baseline regressions we follow Acemoglu (2009) and adopt a conservative
classification of frontier as including only MNEs from Japan, Germany and USA. In the analysis we
label these as frontier acquired and remaining acquisitions as non-frontier acquired. Under this
definition there are 104 acquisitions from frontier countries and 196 from non-frontier countries,
mostly from other EU countries. We test the robustness of our findings to an alternative categorisation
of frontier acquisitions in Section 5.
The PITEC data provides a large amount of detail on innovation including innovation expenditures.
Summary statistics for these are shown in Table 1, while Table A1 in A1 in the On-line Appendix A
provides definitions for each line of spending. The most aggregated measure of expenditure in the
survey is labelled total innovation expenditures. This includes three categories of spending: internal
R&D (R&D undertaken within the firm within Spain); spending on external R&D (a firm’s purchases
of R&D conducted by other firms, including other plants from the same business group in other
countries); and non-R&D expenditures (which includes expenditures on training for workers, product
alternations, market research and advertising).14 The data allow for further disaggregation of external
R&D into domestic purchases or imports, which we label external-domestic R&D, and external-
foreign R&D expenditures, respectively.15 Finally, the survey also provides information on R&D
spending by type of provider. With this information, we can further separate external-foreign R&D
expenditure into imports of knowledge from the headquarters and from other affiliates within the same
business group abroad. Following Criscuolo et al., (2010) we use this to measure R&D technology
13 This measure is consistent with Balsvik and Haller (2010), Bandick et al. (2014), Guadalupe et al. (2012) and Javorcik
and Poelhekke (2017). It defines who has ultimate control of the acquired firm. 14 External R&D expenditures are defined as: “Acquisitions of R&D services through contracts, informal agreements, etc.
Funds to finance other companies, research associations, etc, which do not directly imply purchases of R&D services are
excluded”. R&D services are defined as: “Creative work to increase the volume of knowledge and to create new or
improved products and processes (including the development of software)”. They specifically exclude licenses and
royalties, which are a different question in the survey. 15 For the average firm, external domestic spending accounts for the majority of total external R&D expenditures (93% on
average).

7
transfers within the MNE.16 Within the estimations we express all R&D expenditures as a share of
total innovation expenditure, except for total innovation expenditures where we use the logged value.
In order to calculate the aggregate effects of FDI we need to be able to identify episodes of entry
and exit from R&D. We describe firms as R&D active, if they record positive internal R&D
expenditures. This is the value of R&D expenditures conducted within Spain. We denote as quitters
those firms with positive internal R&D expenditures in period t-1 that then record zero expenditures
in period t, and do not record positive values in any future time period, t+s with s≥1. Entrants are those
with zero internal R&D expenditures in period t-1 that then record positive expenditures in period t,
and in future time period, t+s with s≥1.17
Within the data, 3,530 non-acquired firms cease R&D at some point during the sample period,
which represents 47% of the 7,719 non-acquired firms. Of the 300 acquired firms, 117 cease their
R&D operations post-acquisition, some 39% of acquired firms. This would appear to suggest that
acquisition-FDI reduces the likelihood that R&D facilities in Spain will be shut, but as we show below,
foreign MNEs are more likely to acquire ‘better-performing’ firms. As such firms are less likely to
shut-their R&D, such a conclusion is premature. In comparison to the rate at which acquired firms stop
R&D, starting R&D post-acquisition occurs very infrequently. There are just 8 firms in the dataset
that are acquired and then switch from zero to positive internal R&D expenditures.
The dataset also contains information on the employment of R&D personnel. Rather than aggregate
these, we use them as they are reported in the original data; that is as total employment, and then by
education level, employees with a PhD, employees with a 5-year BA degree, employees with a 3-year
BA degree and employees without higher education.
3. Empirical strategy
Our goal in the paper is to study empirically the change in R&D outputs, expenditures and
entry/exit due to acquisition FDI. The fundamental evaluation problem for such a question is that the
counterfactual outcome of not being acquired is unobserved. Our approach follows standard practice
in the literature and we combine matching with difference-in-differences. The difference-in-
differences (DID) method allows us to follow changes to R&D between the pre- and post-acquisition
16 This measure does not include other forms of technology transfer from the parent such as those of organisation capital,
software or management technologies. The PITEC data does not include information on such types of technology transfer. 17 Our results are robust to an alternative classification of R&D quitters based on zero R&D expenditures in two consecutive
years.

8
time periods, versus those in firms that have not been acquired (control group). The regression equation
is specified such that it removes the influence of observable and unobservable non-random elements
of the acquisition decision that are constant or strongly time persistent. We also remove the effect of
time-specific shocks to the economy that might affect R&D for all firms. As the comparison between
acquired firms and the control group of non-acquired firms remains vulnerable to the presence of non-
random sample selection, we use matching to select pairs of firms with similar observable
characteristics and pre-treatment trends prior to the change in ownership. For the inference of causal
effects of acquisition to be considered valid, we require the assumption that, conditional on the
observable characteristics that are relevant for the acquisition decision, the potential outcomes of
interest for the treated and non-treated firms are orthogonal to acquisition.
To construct our control group of non-acquired firms we begin by estimating a model for the
probability of being acquired.18 We use a probit model where we regress a dummy variable indicator
of whether the firm becomes acquired during the sample period on various innovation inputs,
controlling simultaneously for a number of other factors that potentially influence this probability
(described in Xit-1).19 Formally,
𝐴𝑐𝑞𝑢𝑖𝑠𝑖𝑡𝑖𝑜𝑛𝑖𝑡 = {1 if 𝜎 + 𝑋𝑖𝑡−1
′ 𝜌 + 𝑑𝑡 + 𝜉𝑖𝑡 > 0
0 if 𝜎 + 𝑋𝑖𝑡−1′ 𝜌 + 𝑑𝑡 + 𝜉𝑖𝑡 ≤ 0
(1)
In equation (1), 𝐴𝑐𝑞𝑢𝑖𝑠𝑖𝑡𝑖𝑜𝑛𝑖𝑡 is a dummy variable that takes the value one if there is a change
from domestic to foreign ownership in period t. The vector 𝑋𝑖𝑡−1′ reflects pre-treatment firm
characteristics that influence acquisition, 𝑑𝑡 denotes time dummies, and 𝜉𝑖𝑡 is the error term, which we
assume is normally distributed with variance 𝜎𝑧2. In all regressions we use cluster robust standard errors.
The results are reported in Table 2.
Amongst the observable characteristics we follow Chen (2011) and include a measure of labour
productivity (measured as sales per employee), physical investment per employee, sales growth and
firm size (employees, measured in various size-bands).20 In addition we consider how acquisition
depends on pre-acquisition differences in R&D expenditures. In Table 2 column (i) we include the
logarithm of total innovation expenditures and a measure of innovation intensity (total innovation
expenditures/turnover). In column (ii) we add the ratio of expenditures on external to internal R&D,
18 Rosenbaum and Rubin (1985) show that if conditioning on X makes the non-participation outcome independent of the
treatment status it is also independent when conditioning on P(X). 19 We use a pooled cross-sectional approach. The results also hold if we use a random effect probit model. 20 Arnold and Javorcik (2009), Harris and Robinson (2002), Balsvik and Haller (2010) and Guadalupe et al. (2012) have
also shown that foreign MNEs are more likely to select domestic firms that are more productive and larger.

9
along with two measures of expenditures of R&D expenditures from within the same business group.
These are a dummy variable if these latter expenditures are non-zero, which we use to capture whether
being a MNE (in R&D) matters or not for acquisition, and their ratio over total external R&D spending,
which captures the extent to which this source of knowledge is used. In column (iii) we separate the
measure of total innovation expenditures into external and internal R&D expenditures, while in column
(iv) we drop the variable measuring the ratio of expenditures on external R&D from the same business
group over total external R&D expenditure. We use columns (v) and (vi) to allow for differences in
the types of firms that are acquired by frontier versus non-frontier firms and in column (vii) we test
whether these differences are statistically significant. In all of the regressions we include year and
industry dummies (measured at the two-digit level).
The results from Table 2 indicate that firms acquired by foreign MNEs are fundamentally different
from non-acquired firms in Spain, with strong evidence of cherry-picking when measured by R&D
and non-R&D characteristics. Focusing on the R&D variables the results indicate that foreign owned
firms target Spanish firms that have greater internal R&D expenditures or are international in their
R&D. While we find some suggestive evidence that there may also be differences in the type of firms
acquired by MNEs at the technological frontier from those that lie behind, these differences are not
statistically significant (Table 2 columns (v) to (vii)).
Based on the results from equation (1), we pair each acquired firm with the closest non-acquired
firm in the same industry and year (excluding those from the same Spanish region) by caliper matching
with replacement. 21 Our results are robust to alternative matching procedures based on nearest
neighbour and propensity score reweighting. We present the regressions with the alternative matching
procedures in the On-line Appendix B. We include as controls for the probit specification those in
column (iv) of Table 2.
A crucial assumption in our estimation strategy is that foreign acquisition does not generate
spillovers on non-acquired firms (SUTVA assumption). We initially rule out this possibility, and relax
this assumption in section 5.22 The matching procedure works well for all variables and any sample of
firms (see Table 3) implying that control and treatment groups are equivalent in their observable
characteristics before acquisition for the different samples.23
21 Matching is carried out with STATA command PSMATCH2 by Leuven and Sianesi (2003). The caliper used is equal
to 0.001. 22 As in Girma et al. (2015) we assume that spillovers are concentrated within regions. This extends the more typical
approach in the literature, which is to exclude the possibility of matches outside of the same industry and year (see for
example Javorcik and Poelhekke (2017). 23 The balancing assumption also holds when we separate firms into frontier and non-frontier acquisitions.

10
4. The Effects of Foreign Acquisitions on R&D
4.1. Does Foreign Acquisition Increase the Likelihood the host’s R&D Labs are Shut?
We begin by examining econometrically the probability that the affiliate will cease R&D following
its acquisition by estimating a probit model and a Cox proportional hazard model.24 The probability
that a firm ceases R&D in year t can be expressed as follows:
𝑆𝑖𝑡∗ = 𝜋 + 𝜁𝐴𝑐𝑞𝑖𝑡−1 + 𝜖𝑖𝑡, 𝑆𝑖𝑡 = 1 if 𝑆𝑖𝑡
∗ > 0 and zero otherwise. (2)
Where 𝑆𝑖𝑡∗ is a latent variable and 𝑆𝑖𝑡 is the observed binary variable that takes the value one if the
firm ceases internal R&D expenditures and zero otherwise. The indicator 𝐴𝑐𝑞𝑖𝑡−1 takes the value one
if the firm has been acquired by a foreign MNE in period t-1. If acquisition increases the probability
of stopping R&D we expect 𝜁 > 0. In the above specification 𝜖𝑖𝑡 is the error term. Using the probit
model we test whether acquisition affects the probability a firm will no longer undertake R&D. We
next allow for the censoring of the observations by estimating a Cox proportional hazard model. This
model assumes that the observed fraction of firms that cease internal R&D expenditures in year t,
relative to those that do not stop at year t is:
ℎ(𝑡) = ℎ0(𝑡) ∗ exp {𝜂𝐴𝑐𝑞𝑖𝑡−1}, (3)
where ℎ0(𝑡) is the baseline hazard of stopping internal R&D. A parameter value for 𝜂 larger than
one implies that acquisition is associated with an increased likelihood that R&D expenditures will end
for acquired firms.
In Table 4, we present formal evidence of the effect of foreign acquisition on the probability of
stopping for the matched sample. In panel A, we show the estimations using a probit model. In panel
B, we report the Cox proportional hazard estimates (we report the hazard ratios). Column (i) shows
the effect of acquisition not distinguishing between the effects of location of the headquarters of the
acquiring MNEs and column (ii) separates acquisitions that occur from countries technologically
leading countries (Germany, Japan and the USA) and those from non-frontier countries.
The results in panel A column (i) indicate that foreign acquisition increases the probability of
stopping domestic R&D by 12.2 percentage points. Column (ii) shows that this effect is larger when
acquisitions are from frontier countries (16.8 percentage points) than from non-frontier countries (13.7
percentage points). A concern with the probit model is that it does not account for the censoring of the
24 The results are identical when using a linear probability model.

11
data. To account for this in panel B, we present the results using the Cox proportional hazard estimates.
Column (i) shows that acquired firms are statistically more likely to shut their R&D facilities than
domestic firms with similar pre-acquisition characteristics. Once we distinguish between firms
acquired by frontier or non-frontier countries, we observe that the effect is due to acquisition by MNEs
from frontier countries. Compared to the matched sample of firms, acquisition by frontier MNEs
significantly increases the risk of stopping internal R&D expenditures in the year of the acquisition.
Moreover the effect is large; the risk of stopping is 0.639 times higher after acquisition from frontier
MNEs as compared to non-acquired firms. This is supportive of an argument that the opportunity cost
of innovating within the subsidiary versus elsewhere in the MNE is highest for technologically leading
MNEs and therefore these firms are more likely to choose an R&D structure that shuts these labs. This
might occur because the remaining R&D labs of the MNE are at the knowledge frontier and there is
little additional knowledge that can be acquired from the domestic market.
4.2. Does Acquisition Affect R&D Expenditures and Employment?
In the first three columns in Table 5 we report the effects of acquisition-FDI on total innovation
expenditures (logged), along with the share of total domestic R&D expenditures undertaken within the
firm (internal R&D/total R &D), and the share of total expenditures on R&D services produced outside
of the firm (external R&D/total R&D). In the remainder of the table we consider how the share of total
external R&D spending evolves post-acquisition compared to the matched counterfactual of firms;
where this includes the share of purchases of R&D from other domestic firms (external domestic
R&D/total R&D) and imported knowledge (external foreign R&D/total R&D). Finally, we separate
external foreign R&D further into knowledge imported within the same business group, denoted R&D
technology transfers. To understand whether acquisition also leads to changes in the types of workers
employed in R&D we consider the education background of R&D employees (reported in Table 6).
All of the regressions have the standard difference-in-difference form set out in equation (4) estimated
on the matched sample of firms that remain R&D active:
𝑌𝑖𝑡 = 𝜅1𝐴𝑐𝑞𝑖𝑡 ∗ 𝑓𝑖 + 𝜅2𝐴𝑐𝑞𝑖𝑡−1 ∗ 𝑓𝑖 + 𝜅3𝐴𝑐𝑞𝑖𝑡−2 ∗ 𝑓𝑖 + 𝜚1𝐴𝑐𝑞𝑖𝑡 ∗ 𝑛𝑓𝑖 + 𝜚2𝐴𝑐𝑞𝑖𝑡−1 ∗ 𝑛𝑓𝑖 +
+𝜚3𝐴𝑐𝑞𝑖𝑡−2 ∗ 𝑛𝑓𝑖 + 𝜏𝑖 + 𝑑𝑡 + 𝜐𝑖𝑡 (4)

12
where 𝑌𝑖𝑡 represents different elements of the knowledge production function (various measures of
innovative expenditures levels, expenditure shares and types of R&D workers). 25 For ease of
exposition, we present results differentiating between acquisitions by frontier (fi) and non-frontier
MNEs (nfi). The coefficients of interest are 𝜅1, 𝜅2 and 𝜅3 which measure the post-acquisition change
in Y for the treatment group when acquisition is by a technologically frontier MNE, where we allow
this effect to differ in the year of acquisition versus one-year and two-years later. The coefficients
𝜚1, 𝜚2, and 𝜚3 capture the effect of acquisition by a non-technologically frontier MNE. Our
counterfactual are non-acquired firms. Time-dummies are denoted by 𝑑𝑡 and capture the effects of
any common-shocks that affect both the treatment and the control group together, a set of firm-fixed
effects is denoted by i, while 𝜐𝑖𝑡 is the error term. In all regressions, we include industry-specific time
trends and year dummies. The regression is estimated using robust variance-covariance matrix
estimators with clustering at the industry level.
From the results presented in Table 5 it is evident that the changes in R&D expenditures after
acquisition are different when acquisition occurs from a frontier MNE than when acquisition is from
a non-frontier MNE. Total innovation expenditures increase by 14.8% in the year of the acquisition
compared to the control group, and by 94% two years following acquisition (column i) when
acquisition is by a frontier MNE. In contrast when acquisition is from a non-frontier MNE total
innovation spending falls; by 28.6% in the year of acquisition and by 23.5% one year later. The existing
literature has reported rather mixed outcomes from acquisition-FDI on total R&D spending. For
example, Stiebale and Reize (2011) find falls in R&D spending, whereas Bertrand (2009), Bertrand et
al. (2012) and Bandick et al. (2014) report increases. The type of heterogeneity we consider, how close
the acquirer is to the technological frontier, could represent one explanation for these differences.
Total innovation expenditure is the sum of R&D expenditures within the firm, along with R&D
services purchased from external R&D labs, universities etc., where these may be either domestic or
foreign. It also includes non-R&D types of spending such as training, product development and
marketing. The results presented in column (ii) suggest that the share of total R&D spending on internal
R&D, which is made up largely of expenditures on the scientists, engineers and their support differ
markedly post-acquisition to this total innovation spending. When acquisition occurs from a frontier-
MNE, the share of spending on internal R&D expenditures declines in the post-acquisition time period
relative to the counterfactual (by 7.0% in the year of acquisition and by 8.3% one year later). Again,
25 Total R&D and employment are logged values.

13
in contrast, they remain constant from a statistical perspective when acquisition was by a non-frontier
MNEs, even though total innovation spending for this group fell on average post-acquisition. To aid
with the interpretation of these changes in expenditure shares we also extract their impact on the level
of spending. The results imply that for acquisitions from frontier countries, internal R&D expenditures
rise by 3.9% in the year of the acquisition. They then decline by 14.3% one year after and increase by
157.0% two years after acquisition. For non-frontier MNEs, given that there is no effect in the ratio of
internal R&D to total R&D expenditures (column ii), the change in internal R&D is proportional to
that for total R&D expenditures. This implies that for acquisitions from non-frontier countries internal
R&D expenditures decline by 24.9% in the year of acquisition, and by 20.9% the next year.
For acquisitions by frontier MNEs the decline in the share of internal R&D spending in total R&D
spending along with the rise in total innovation spending is explained by an increase in expenditures
on R&D services provided outside of the firm and in particular by R&D technology transfers. For non-
frontier acquisitions we find no evidence of such transfers.26 That the share of R&D technology
transfers in total spending rises following acquisition indicates the sharing of technical information
between the various R&D labs that the MNE operates. Such evidence helps to explain why MNEs
have been found to use more intensively external sources of knowledge in the cross-section evidence
of Veugelers and Cassiman (2004) and Criscuolo et al. (2010). Our evidence suggests a causal effect
of acquisition on knowledge transfers from abroad. This is also consistent with very recent evidence
of productivity declines following disinvestment in Javorcik and Poelhekke (2017). They argue that
foreign ownership benefits acquired firms due to a constant inflow of knowledge of the type we report.
Within the category of internal R&D much of the expenditures are made up of staff costs. Table 6
shows what happens to skill mix of employment in R&D. We again observe that there are again some
differences between acquirers relative to the counterfactual. For acquisitions from frontier countries
there is an increase in the employment of workers with Ph.D. level training (by 7.8% on the year of
the acquisition). The remaining employment categories remain constant. When acquisition is by an
MNE from a non-frontier country, the number of employees with the 5-year BA degree declines by
25.6% the year of acquisition and by 23.1% one year after acquisition. There are no other changes to
the employment mix. These results are supportive of the idea of skilled bias technology but only for
acquisitions by frontier MNEs.
26 Total innovation spending falls for this group in column (i) because of a decline in non-R&D spending.

14
4.3. Does Acquisition Affect Successful Innovation?
In previous sections, we have shown that when acquisition is from a frontier MNE, acquisition
decreases domestic innovation expenditures, increases technology transfers and there is some
reallocation of R&D budgets towards high-skilled workers. Do these changes make the firms more
efficient at generating innovation output? In this sub-section, we explore the effect of acquisition on
innovation output using information on the number of patents applied by the firm. We follow the same
econometric specification set out in equation (4).
In Table 7 column (i) we report our estimates for the effect of acquisition on the number of patents
as a ratio of innovation expenditures, where the former are measured for a three year period following
acquisition.27 From this regression, we find that acquisition has a positive effect on the efficiency with
which patents are generated when the acquiring MNE is from a frontier country. For non-frontier
acquisitions we find a negative effect similar to Stiebale (2016), although it is not statistically
significant.
In Table 7 columns (ii) and (iii), we account for the fact that not all innovations are patented by
examining the effect of foreign acquisition on product and process innovation. Here we find some
differences according to the type of innovation. The results suggest a positive effect on process
innovation when acquisitions are from frontier MNEs. Similar to Guadalupe et al. (2012), we find no
significant effect for product innovation.
Finally, to take into account the market channel stressed by Guadalupe et al. (2012), we refine our
analysis by including (the log of) exports as a control variable. The results of the estimates are
presented in columns (iv) to (vi) of Table 7 for patents, product and process innovations respectively.
These estimations confirm the findings from previous regressions: acquisition from frontier countries
has a positive effect on patent efficiency and process innovation. Of interest, they also indicate a
positive and significant effect for exports, confirming that access to a larger market also increases the
inventiveness of the subsidiary. These results suggest that acquisition-FDI may increase domestic
innovation through a number of alternative channels.
4.4. What is the Aggregate effect of Acquisition-FDI on the Domestically Produced Knowledge
Stock?
27 As in previous regressions in this subsection, we control by firm fixed effects, industry-specific time trends and year
dummies

15
To understand how acquisition-FDI impacts collectively on the efficiency of aggregate domestic
knowledge production, we construct an index for the growth of Spanish patents per euro of
expenditure. At a particular point in time the innovation index is measured as the weighted average of
innovation by individual firms. Denoting by 𝑃𝑡 the aggregate index of technology (in terms of patents)
in a country in year t and ΔP the change in the index of technology, the effect of acquisition on the
change in the aggregate index can be expressed as the ratio Δ𝑃𝐴𝑐𝑞
ΔP, where Δ𝑃𝐴𝑐𝑞 is the estimated effect
of acquisition by MNEs from frontier and non-frontier countries as follows:
Δ𝑃𝐴𝑐𝑞 = ∑ 𝑆𝑖𝑡𝑃𝑖𝑡 −
𝑁
𝑖=1
∑ 𝑆𝑖0𝑃𝑖0 = ∑ 𝑆𝑖0(𝑃𝑖𝑡 − 𝑃𝑖0) +
𝑁
𝑖=1
𝑁
𝑖=1
∑ 𝑃𝑖0(𝑆𝑖𝑡 − 𝑆𝑖0) +
𝑁
𝑖=1
∑(𝑃𝑖𝑡 − 𝑃𝑖0)(𝑆𝑖𝑡 − 𝑆𝑖0) − ∑ 𝑆𝑖𝑡𝑒𝑥𝑖𝑡(𝑃𝑖0 − �̅�) + ∑ 𝑆𝑖𝑡
𝑒𝑛𝑡𝑟𝑦(𝑃𝑖𝑒𝑛𝑡𝑟𝑦 − �̅�),
𝑖∈𝑒𝑛𝑡𝑟𝑦
𝑁
𝑖∈𝑒𝑥𝑖𝑡
𝑁
𝑖=1
where the variables 𝑃𝑖0 and 𝑆𝑖0 represent the patents and the weights of acquired firms respectively
before acquisition, 𝑃𝑖𝑡 and 𝑆𝑖𝑡 are the estimated patents and weights of acquired firms after acquisition,
𝑃𝑖𝑒𝑛𝑡𝑟𝑦 are patents by firms that start R&D after acquisition and �̅� is the average number of patents in
the economy.
The first part of the decomposition represents the within firm element and measures the change in
patents keeping constant the weights used in the construction of the index: ∑ 𝑆𝑖0(𝑃𝑖𝑡−𝑃𝑖0) =𝑁𝑖=1
∑ 𝑆𝑖0(𝜑𝑓𝑃𝑖0)𝑖∈𝑓 + ∑ 𝑆𝑖0(𝜑𝑛𝑓𝑃𝑖0)𝑖∈𝑛𝑓 , where f means acquisition from frontier country and nf is
acquisition from non-frontier country In this expression 𝜑𝑓 and 𝜑𝑛𝑓 are transformations of the
estimated coefficients of acquisition on patents for frontier and non-frontier acquirers in Table 7
column (i).
The second component is labelled the between effect, and measures the change in firm-weights
keeping constant patents: ∑ 𝑃𝑖0(𝑆𝑖𝑡 − 𝑆𝑖0) = ∑ 𝑃𝑖0(𝑆𝑖𝑡 − 𝑆𝑖0) + ∑ 𝑃𝑖0(𝑆𝑖𝑡 − 𝑆𝑖0).𝑖∈𝑛𝑓𝑖∈𝑓𝑁𝑖=1 The
weights after acquisition are the estimated values calculated as follows: 𝑆𝑖𝑡 =𝑁𝑖0(1+𝜛𝑓𝐷𝑓+𝜛𝑛𝑓𝐷𝑛𝑓)
∑ 𝑁𝑖0(1+𝜛𝑓𝐷𝑓+𝜛𝑛𝑓𝐷𝑛𝑓)𝑁𝑖=1
.
The value 𝑁𝑖0 is either total innovation expenditures or internal R&D expenditures depending which
weights we use. The expressions 𝜛𝑓 and 𝜛𝑛𝑓 are transformations of the estimated coefficients of
acquisition on total innovation expenditures and internal R&D expenditures respectively for frontier

16
and non-frontier acquirers in Table 6 (columns (i) and (ii)). We calculate the average of the significant
coefficient estimates for frontier and non-frontier countries to construct 𝜛𝑓 and 𝜛𝑛𝑓. The expressions
𝐷𝑓 and 𝐷𝑛𝑓 are indicators of whether a firm has been acquired by a frontier or a non-frontier foreign
firm respectively.
The third element of the decomposition is the cross effect. This effect measures the correlation
between the change in patents and weights. The cross term typically does not have an important
economic impact and it is usually very small.
The exit effect is calculated as in the following expression ∑ 𝑆𝑖𝑡𝑒𝑥𝑖𝑡(𝑃𝑖0 − �̅�) =𝑖∈𝑒𝑥𝑖𝑡
∑ 𝑆𝑖𝑡𝑒𝑥𝑖𝑡(𝑃𝑖0 − �̅�)𝑖∈𝑒𝑥𝑖𝑡 & 𝑓 + ∑ 𝑆𝑖𝑡
𝑒𝑥𝑖𝑡(𝑃𝑖0 − �̅�).𝑖∈𝑒𝑥𝑖𝑡 & 𝑛𝑓 The predicted weights are calculated as
𝑆𝑖𝑡𝑒𝑥𝑖𝑡 =
𝑁𝑖0(1++𝐷𝑛𝑓)
∑ 𝑁𝑖0(1+𝜚𝑓+𝜚𝑛𝑓𝐷𝑛𝑓)𝑁𝑖=1
. In these weights, the expressions 𝜚𝑓 and 𝜚𝑛𝑓 are the estimated
coefficients on the effect of acquisition on the probability of exit for frontier and non-frontier
acquisitions from the probit model in Table 4 panel A column (ii).
The last component is the entry effect: ∑ 𝑆𝑖𝑡𝑒𝑛𝑡𝑟𝑦
(𝑃𝑖𝑒𝑛𝑡𝑟𝑦 − �̅�).𝑖∈𝑒𝑛𝑡𝑟𝑦 In comparison to the rate at
which acquired firms stop R&D, starting R&D occurs very infrequently. There are 8 firms in the
dataset that are acquired by a foreign firm and then begin R&D. We investigated whether acquisition
FDI is associated with a higher or lower probability of starting R&D and find no statistically significant
effect. Given the low power of a regression with so few examples of starting R&D post-acquisition we
report this in Table A2 in the On-line Appendix A and do not formally include it within our
construction of the index. Finally, as in Bloom et al. (2015) in order to obtain the denominator of the
ratio Δ𝑃𝐴𝑐𝑞
ΔP, we use the aggregate growth of patents for the period 2004-2009. This value is equal to
7.7% for the Spanish patents.
The results of this exercise are reported in Table 8. In column (i) we use internal R&D to weight
firms and in column (ii) we use total innovation expenditures as weights.28 As a reminder internal
innovation spending in the data includes R&D spending that occurs internally to the firm within Spain.
Total innovation spending additionally includes R&D resources that are purchased from outside of the
firm, both elsewhere in Spain and from abroad, including those from other parts of the same business
group. To demonstrate the importance of including these external R&D expenditures, including
technology transfers from the parent, we report the results from this aggregation exercise without these
28 As an alternative we also using total employment in R&D as weights. These results, not reported, are very similar to
those for internal R&D expenditures.

17
expenditures in column (i) and with them in column (ii). We also separate the within-firm, between-
firm and exit effects according to whether the acquisition is from a technologically frontier or non-
frontier country.
Both the choice of weights and the technology sophistication of the acquirer matters for the change
in the domestic technology index, with the choice of weights particularly important for the overall
effect. In both columns (i) and (ii) the total effect of acquisition-FDI on the technology index is
positive. In the first column acquisition FDI increases Spanish technology by 6.45% for the sample
period, whereas in column (ii) acquisition-FDI increases the Spanish technology index by 7.14%. The
difference between columns is explained by the differential effect on the relative size of the domestic
R&D lab that occurs following acquisition by foreign MNEs (the weights used in the index): the
between component is smaller when we consider internal R&D as weights rather than weights based
on total R&D . Moreover, there is a positive effect from the closure of R&D labs following acquisition,
although this effect is small in magnitude, and an improvement in the inventiveness of acquired firms
(the within effect is positive). In column (ii) the results for the within, between and cross effect are
larger than in column (i). This highlights that simply focusing on domestic R&D expenditures misses
an important component of the benefits of acquisition-FDI on the domestic production of knowledge.
Technology transfers increase the value of R&D conduced within the acquired affiliate. In both
columns the majority of the effect comes from the changes that occur when acquisition is from a
technologically leading country. Taken together, our results suggest that acquisition-FDI enhances the
domestic innovation.
Given that we found a positive impact of foreign acquisition on process innovation, for
completeness we replicate previous calculations using process innovations as the measure of the
Spanish innovation stock. We present the results in columns (iii) and (iv) of Table 8. We assume that
the average growth of process innovations for the period 2004-2009 is equal to the sample mean of
our dataset. We find that the overall effect of acquisition-FDI on the domestically produced process
innovation stock is positive. The effect is equal to 0.45% when our weights are in terms of internal
R&D (in column (iii)) and 1.15% when the weights are in terms of total innovation expenditures (in
column (iv)). Overall, the calculated impacts are smaller when we use process innovations instead of
patents as the measure of innovation output. The main reason for this difference is that the overall
growth of the technological index (the denominator ΔP ) is larger for process innovations than for
patents.

18
5. Robustness
5.1. Alternative Definitions of Technological Frontier Countries
Within our analysis we consider MNEs from Japan, USA and Germany as countries that are likely
to lie at the technological frontier. 29 While the empirical results we present suggests that this
assumption is a reasonable partitioning of the acquisitions that take place in the data, in Table 9, we
test the sensitivity of our results by choosing an alternative definition. For this new measure we
combine country and industry R&D intensity together (R&D expenditures over value added) using
information made available from the STAN database from the OECD. We identify frontier acquisitions
if the MNE is from a country that is above the 90th percentile of R&D spending within each industry.30
Under this new measure, there are 10 acquisitions from the US within industries in which MNEs from
that country are considered to lie at the frontier, 7 from the France and the Netherlands, 4 from
Germany, Japan and Sweden, 3 from Denmark and 1 from the UK, giving a total of 40. Given the large
number of outcome variables we discuss in the paper we focus the results only on the main variables
of interest.
In column (i) of Table 9 we present a regression that analyses the probability internal R&D will
cease for this alternative definition of frontier MNEs. Comparing the results with those in Table 4 we
note that qualitatively they do not change. We continue to find evidence of an increase in the
probability of stopping R&D for firms acquired by MNEs from technologically advanced countries.
In columns (ii) to (iv) we report results for total innovation expenditures, internal R&D and
technology transfers as a share of total R&D spending. The results showed in this Table are again
highly supportive of those using an alternative definition of frontier. In column (ii) we find a significant
increase in total innovation expenditures, in column (iii) a reduction in the share of internal
expenditures and in column (iv), an increase in the share of international technology transfers for firms
acquired by MNEs at the technological frontier.
The effects of acquisition on different the employment of workers with the highest education levels
are reported in column (v) of Table 9. These results consistently suggest that the average quality of
workers increases after acquisition for frontier MNEs. Finally, in column (vi) we display results for
29 Estimating the changes in R&D expenditures shares separately for acquisitions from Germany, Japan and the US
separately suggests that the technology transfers within the firm in column (viii) are largely explained by the FDI from
Germany and the US. We find weaker evidence of the same effect for Japan, although we note there are only 6 acquisitions
from here in the data period.
30 We have also tested the robustness of our results to a definition of frontier MNEs based on the 10 countries with the
highest ratio of Business Enterprise R&D expenditures (BERD) over GDP for the period 2004-2009 and the country-
industry classification described but using the 95th percentile of R&D spending within each industry to define the frontier.

19
innovation output. The results in this table are again similar to those already presented in Table 7. We
find a positive effect of foreign acquisition on patenting, where again this effect is significant only for
acquisitions by MNEs from countries at the technological frontier.
5.2. Pre-existing trends
The difference-in-differences method that underlies our estimations rests on the assumption that
the treatment and the control group share statistically similar pre-treatment trends. We perform
additional tests control for pre-existing trends in two ways. First, we conduct a matching exercise
which now includes two years of pre-treatment data and second we conduct a placebo test, bringing
forward the date of acquisition into the pre-treatment period and studying the behaviour of R&D over
this period.
For the alternative matching, where we add two years of pre-treatment data, we find results that
closely align with those reported previously. Again, we focus on the main outcomes of interest. The
results are reported in Table 10. We find that the probability of stopping R&D (column (i)) is more
likely when acquisitions is from an MNE at the technological frontier but, if they remain R&D active,
there is an increase in total innovation expenditures (column (ii)) and a shift towards technology
transfers (column (iv)). We also find skill-upgrading (column (v)) and increases in the rate of patenting
for these firms (column (vi)).
In Table 11, we present our placebo-type test, where we regress one and two leads of the acquisition
variables on the dependent variables. The results from these placebo regressions are very different
from previous estimations. As expected, we now find no differences between control and treatment
groups in terms of the probability of quitting R&D (column (i)), as well as R&D expenditures and
R&D personnel in columns (ii) to (v) and innovation output in column (vi). These results point strongly
to a conclusion that the treatment and control group share similar pre-treatment trends in terms of
observable characteristics.
5.3. Indirect effects: Results controlling by Stable Unit Treatment Value Assumption (SUTVA)
violation
Thus far, our calculations of the effects of acquisition-FDI preclude the possibility that there may
exist indirect effects from FDI to non-acquired domestic firms. The literature has discussed several
types of indirect effects (Bloom et al., 2016). A first type includes product market rivalry or business

20
stealing effects. In theoretical models the net effect is ambiguous as they depend on whether the
products of the firms are strategic complements or substitutes. In case of product market rivalry there
can be an increase in the R&D investment of the rival firm because the marginal profitability of the
rival firm increases, while under the business stealing effects there is a decrease (Bloom et al., 2016).
These effects might be moderated by the observability of the R&D investments of the acquired firm
(Denicolò and Polo, 2018a; Lopez and Vives, forthcoming). A second type of indirect effect are those
that arise due to technological spillovers. If there are knowledge transfers from the foreign MNE to
the acquired firm, non-acquired firms may also be able to learn of these new technologies, for example
through the information available in the patents or mobility of workers (Balsvik, 2011). As a
consequence, non-acquired firms might have incentives to increase their own R&D expenditures.31
Given that we find that acquisition-FDI leads to reduced domestic expenditures in some cases, but
greater technology transfers, these indirect might plausibly be positive or negative.
We estimate the combined direct and indirect effects using the methodology proposed by Girma et
al. (2015), which they apply to the effects of acquisition-FDI on productivity.32 The approach by Girma
et al. (2015) considers that there are 𝑟 = 1, … 𝑅 industry-region clusters such that SUTVA holds across
clusters but not necessarily within clusters. Calling 𝑦𝑑 the outcome variable (R&D expenditures and
R&D employment) with d=1 if a firm is foreign acquired and d=0 if not, the average potential
outcomes, denoted by �̅�𝑝𝑑, are a function of the proportion p of treated individuals in a given cluster.
For a given level of foreign acquisitions p, there are four causal treatment effects: a) The direct causal
effect of the treatment is equal to �̅�𝑝𝑝10 = �̅�𝑝
1 − �̅�𝑝0 . This is the difference in the outcome variable
between foreign acquired and non-acquired firms for a given level of foreign acquisition in a cluster;
b) the indirect effect on the non-treatment is equal to �̅�𝑝000 = �̅�𝑝
0 − �̅�00. This is the difference in the
outcome variable between a non-acquired firm in a cluster with p foreign acquisitions and a non-
acquired firm in a cluster with zero foreign acquisitions; c) the total treatment effect is equal to �̅�𝑝010 =
�̅�𝑝1 − �̅�0
0. This is the sum of the direct and indirect effect and it measures the difference in the outcome
variable between acquired firms in a cluster with p foreign acquisitions and a non-acquired firms in a
cluster with zero foreign acquisitions and d) the marginal treatment effect on the treated is �̅�𝑝011 = �̅�𝑝
1 −
31 For a summary of the effects of R&D on non-merged firms see Denicolò and Polo (2018) and Jullien and Lefouili (2018). 32 There may of course be further general equilibrium effects on domestic technology production as a results of acquisition-
FDI that occur through price and quantity changes in other markets, in particular in the labour market. Our data sources do
not contain the information necessary to investigate these changes. As the full extent of these general equilibrium changes
are likely to take some time to fully realise themselves, we arguably capture the most important short-run changes.

21
�̅�01. This is the difference in the outcome variable for the acquired firms if the proportion of foreign
acquisitions would drop from p to zero.
In our analysis, we establish 32 industry-region clusters with an average of 0.7% foreign
acquisitions. As the methodology relies of a sufficient number of acquisitions within each cluster we
cannot distinguish between types of acquisitions in this part of our analysis. The methodology consists
of two steps: In the first step, we calculate average potential outcomes per each cluster controlling by
selection into acquisition. In order to do this, for each cluster, first, we calculate a propensity score of
being acquired based on firm characteristics given by X.33 Second, we calculate an outcome equation
(where the outcomes are R&D expenditures and employment) using an inverse probability weighted
regression, as follows: 𝑦𝑖𝑟 = 𝛼 + 𝛽𝑑𝑖𝑟 + 𝛿𝑋 + 𝑒𝑟𝑟𝑜𝑟, where i=1, …N denotes the number of firms in
the cluster. Third, we compute potential outcomes for treated and non-treated as in the following
expression: �̅�𝑟𝑑 = 1/𝑁 ∑ �̃� + 𝑑 𝛽𝑁
𝑖=1 + 𝛿𝑋 with 𝑑 = 0,1. In the second step, we calculate treatment
effects. In this part of the analysis, we consider the average potential outcomes as the outcome variable
and the proportion of acquired firms as the treatment variable. We control for selection by conditioning
on a generalised propensity score (GPS) via a fractional logit model, where the pre-treatment cluster
characteristics denoted by Z are based on Girma et al. (2015) and include exports, average financial
constraints, labour productivity, average size, internal R&D, physical investment, and sales growth.
Let �̃� denote the vector of estimated coefficients, and Τ =𝑒𝑍�̃�
1+𝑒𝑍�̃� then the GPS conditional on Z and on
pr is equal to �̃�𝑟 = [Τ]𝑝𝑟[1 − Τ]1−𝑝𝑟. We calculate cluster level potential outcomes using the following
polynomial approximation: 𝐸[𝑦𝑟𝑑|�̃�𝑟 , 𝑝𝑟] = 𝛽0 + 𝛽1�̃�𝑟 + 𝛽2𝑝𝑟 + 𝛽3�̃�𝑟
2 + 𝛽4𝑝𝑟2 + 𝛽5�̃�𝑟𝑝𝑟. 34
In figure 1, we plot the estimated direct, indirect, total and marginal treatment effect on total
innovation expenditures evaluated at the mean proportion of foreign acquisition. We also include the
90% confidence interval. The direct average effect is positive statistically significant and equal to 0.48,
suggesting that foreign acquired firms in cluster with average foreign acquisitions have 48% greater
expenditures on total R&D than non-acquired firms. The indirect effect is also positive but it is not
significant at standard levels (the error bounds include zero). The total effect is significantly positive
and slightly larger than the direct effect. Finally, the marginal effect is not significantly different from
zero. For this measure of innovation our results therefore do not suggest strong spillovers.
33 We include as pre-treatment firm variables: labour productivity, size, internal and external R&D expenditures, physical
investments and a dummy variable equal to one if the plant had overseas R&D facilities. 34 We thank Sourafel Girma for sharing the program for the calculation of the treatment effects. The pre-treatment cluster
variables are similar to Girma et al. (2015) and they include exports, average financial constraints, labour productivity,
average size, internal R&D, physical investment, and sales growth.

22
In figure 2, we show the effects for disaggregated R&D expenditures (internal, external, external
domestic and technology transfers). The result suggest that foreign acquisition has a positive direct
effect on internal R&D expenditures, as we found in the matching regressions in the previous section.
The indirect effect is again positive but it not significant at standard levels. The total effect is positive
and slightly larger than the direct effect. For external expenditures, we find a negative and statistically
significant direct effect and a positive and significant indirect effect. This suggests that acquired firms
tend to reduce their dependence to external technological providers while non-acquired firms
increasingly buy R&D from external providers moving towards a more hybrid R&D structure. Finally,
we do not find significant evidence of either direct or indirect effects from foreign acquisitions on
technology transfers when we do not account for the origin of the MNE.
In the first panel of figure 3, we plot the estimated effects and the 90% confidence interval for total
employees in R&D. The direct average effect is positive suggesting that foreign acquired firms have
larger R&D employment than non-acquired firms. The indirect effect is also positive but it is not
significant at standard levels. The total effect is significantly positive and slightly larger than the direct
effect. This suggests that there might be a positive spillover effect on the R&D employment of
domestic firms but it is imprecisely estimated. The estimated coefficient of the total effect is equal to
0.9. This implies that the number of employees working in R&D in a foreign firm in a cluster with
average foreign acquisitions is 90% higher than the R&D employment of a non-acquired domestic
firm in a cluster with no foreign acquisitions. We interpret this change cautiously given that R&D
employment for the control group is very small. Finally, the marginal effect is not significantly
different from zero.
In the second panel of figure 3, we plot the effects for R&D employment with a PhD. In this case,
the total effect is positive and larger than the direct effect, which is also positive. This suggests that
there is a positive direct effect of acquisition on the R&D employment with the highest education
levels and an indirect positive effect on non-acquired firms.35 We also find some suggestive evidence
of a positive spillovers but again those effects are not statistically significant at standard levels.
From this exercise, we conclude that the direct effects we focus on in Section 4 are the most
important changes that occur to the economy following acquisition. They also confirm that spillover
effects may be present and therefore careful consideration of what represents a valid counterfactual is
35 We do not find any statistically significant effect of acquisition on any other type of employment with the exception of
a positive direct effect on workers without higher education. Taking this evidence together, these results suggest that there
are no significant externalities for R&D employment with 5-year undergraduate degree or lower educational levels.
23
warranted when studying the effects on R&D. Finally, as the spillovers we uncover are largely positive,
they imply that our estimates of the direct effects are, if anything, a lower bound on the R&D effects
of acquisition-FDI.
6. Summary and concluding remarks
In this paper, we examine how foreign acquisition influences the capacity to generate innovations
within firms in the host economy. We study this question within the context of the acquisition of an
R&D active domestic firm by a foreign multinational. We provide evidence that acquisition FDI from
technologically advanced countries increases the probability of closing research facilities. Conditional
on keeping the newly acquired R&D lab, these same MNEs reorganize their research inputs to become
more skill intensive and there are transfers of technology from the MNE. Alongside these changes to
R&D expenditures the subsidiary’s innovativeness increases. For acquisitions by non-frontier MNEs
we find fewer significant changes to R&D post-acquisition and no increases in patents. We propose
that the complementarity between technology transfers and high-skilled workers is a plausible
explanation for why there is a simultaneous rise in high-skilled workers, technology transfers,
innovation and productivity of high-skilled workers after acquisition. Our evidence suggests that
knowledge assets of the target firm may be a motive for acquisition FDI. Together our findings support
the role of ownership to transfer intangibles within the MNE.
The aggregate effect of FDI on domestic technology production is significant and positive,
accounting for 7.14% of the Spanish technology index, where this is mostly due to the technology
transfers received from MNEs at the technological frontier. We incorporate the possibility of R&D
spillovers within the analysis, but find no significant changes of this type for non-acquired firms.

24
REFERENCES
Acemoglu, D. (2007): “Equilibrium Bias of Technology” Econometrica 75(5), 1371-1409.
Acemoglu, D. (2009): Introduction to Modern Economic Growth, Princeton: Princeton University
Press.
Aghion, P, Akcigit, U. and P. Howitt (2014): “What do we learn from Schumpeterian growth theory?”
P. Aghion, S.N. Durlauf (Eds.), Handbook of Economic Growth (1st ed.), Elsevier, Vol. 2:515-
563
Arkolakis, C., N. Ramondo, A. Rodríguez-Clare, and S. Yeaple (2013): “Innovation and Production
in the Global Economy” NBER Working Paper No. 18972.
Arnold, J. and B. Javorcik (2009): “Gifted Kids or Pushy Parents? Foreign Direct Investment and Plant
Productivity in Indonesia” Journal of International Economics 79 (1): 42-53
Atalay, E., Hortaçsu A. and C. Syverson (2014): “Vertical Integration and Input Flows” American
Economic Review 104(4): 1120-1148(29).
Balsvik, R. (2011): “Is Labor Mobility a Channel for Spillovers from Multinationals? Evidence from
Norwegian Manufacturing” The Review of Economics and Statistics 93(1): 285-297.
Balsvik, R. and S. Haller (2010): “Picking "Lemons" or Picking "Cherries"? Domestic and Foreign
Acquisitions in Norwegian Manufacturing” Scandinavian Journal of Economics 112: 361–387.
Bandick, R., Görg, H., and P. Karpaty (2014): “Foreign Acquisitions, Domestic Multinationals, and
R&D” The Scandinavian Journal of Economics 116(4): 1091–1115.
Bertrand, O. (2009): “Effects of Foreign Acquisitions on R&D Activity: Evidence from Firm-level
Data for France” Research Policy 38(6): 1021-1031.
Bertrand, O., and P. Zuniga (2006): “R&D and M&A: Are cross-border M&A different? An
investigation on OECD countries” International Journal of Industrial Organization 24 (2):
401-423.
Bertrand, O. Hakkala, K., Norbäck, P.J., and Persson, L. (2012): “Should Countries Block Foreign
Takeovers of R&D Champions and Promote Greenfield Entry?” Canadian Journal of
Economics 45(3): 1083-1124.
Bilir, L. K. and E. Morales (2016): “The Impact of Innovation in the Multinational Firm”, NBER
Working Paper No. 22160
Bloom, N., M. Schankerman, and J. Van Reenen (2016): Identifying Technology Spillovers and
Product Market Rivalry” Econometrica 81(4): 1347–1393.

25
Bloom, N., Draca, M. and J. Van Reenen (2015): “Trade Induced Technical Change? The Impact of
Chinese Imports on Innovation, IT and Productivity” Review of Economic Studies 83 (1): 87-
117.
Bloom, N., Sadun, R., and J. Van Reenen (2012): “The Organization of Firms Across Countries” The
Quarterly Journal of Economics 127 (4): 1663-1705.
Bloom, N., and R. Griffith R (2001): “The Internationalisation of R&D” Fiscal Studies 22 (3): 337-
355.
Branstetter, L. Fisman, R., and C. F. Foley (2006): “Do Stronger Intellectual Property Rights Increase
International Technology Transfer? Empirical Evidence from U. S. Firm-Level Panel Data”
The Quarterly Journal of Economics 121: 321-349.
Braguinsky, S., Ohyama, A., Okazaki, T., and C. Syverson (2015): “Acquisitions, Productivity, and
Profitability: Evidence from the Japanese Cotton Spinning Industry” American Economic
Review 105(7): 2086-2119.
Chen, W. (2011): “The Effect of Investor Origin on Firm Performance: Domestic and Foreign Direct
Investment in the United States” Journal of International Economics 83: 219-228.
Coe, D., and Helpman, E. (1995): “International R&D Spillovers” European Economic Review 39:
859-887.
Criscuolo, C. and R. Martin (2009): “Multinationals and U.S. Productivity Leadership: Evidence from
Great Britain” The Review of Economics and Statistics 91(2): 263-281.
Criscuolo, C., Haskel, J., and M. Slaughter (2010): “Global Engagement and the Innovation Activities
of Firms” International Journal of Industrial Organization 28: 191–202.
Denicolò, V. and M. Polo (2018a): “The Innovation Theory of Harm: An Appraisal” Bocconi
University IEFE Working Paper No. 103
Denicolò, V. and M. Polo (2018b): “Duplicative research, mergers and innovation” Economic Letters
166: 56-59.
DIW (2016): Medium-sized Foreign-owned German Enterprises Heavily Involved in R&D, DIW
Economic Bulletin 22+23.2016
Dunning, J. and S. Lundan (2008): Multinational Enterprises and the Global Economy, Cheltenham,
UK, Edward Elgar Publishing.
Ekholm, K. and K. Hakkala (2007): “Location of R&D and High-tech Production by Vertically
Integrated Multinationals” The Economic Journal 117(March): 512-543.
European Commission (2010): European Innovation Scoreboard (EIS) 2009, European Commission
Enterprise and Industry.

26
Federico G., G. Langus and T. Valletti (2017): “A Simple Model of Mergers and Innovation,”
Economics Letters 157: 136-140.
Girma, S., Kneller, R., and M. Pisu (2007): “Do Exporters Have Anything to Learn from Foreign
Multinationals?” European Economic Review 51: 993-1010.
Girma, S., Gong, Y., Görg, H. and S. Lancheros (2015): “Estimating Direct and Indirect Effects of
Foreign Direct Investment on Firm Productivity in the Presence of Interactions between
Firms”. Journal of International Economics 95(1): 157-169.
Greenaway, D., and R. Kneller (2007): “Firm Heterogeneity, Exporting and Foreign Direct
Investment” Economic Journal 117: F134-F161.
Griliches, Z. (1992): “The Search for R&D spillovers” Scandinavian Journal of Economics 94: 29-47.
Guadalupe, M., Kuzmina, O., and C. Thomas (2012): “Innovation and Foreign Ownership” American
Economic Review 102(7): 3594-3627.
Harris, R., and C. Robinson (2002): “The Effect of Foreign Acquisitions on Total Factor Productivity:
Plant-Level Evidence from U.K. Manufacturing, 1987-1992” The Review of Economics and
Statistics 84: 562-568.
Haucap, J., A. Rasch, and J. Stiebale (2018): “How Mergers Affect Innovation: Theory and Evidence”
International Journal of Industrial Organization In Press, Accepted Manuscript.
Helpman, E. (1984): “A Simple Theory of International Trade with Multinational Corporations”
Journal of Political Economy 92(3): 451-471.
Jaffe, A. B., M. Trajtenberg, and R. Henderson, (1993): “Geographical Localization of Knowledge
Spillovers as Evidenced by Patent Citations” Quarterly Journal of Economics 108: 577-98.
Javorcik. B. and S. Poelhekke (2017): “Former Foreign Affiliates: Cast Out and Outperformed”
Journal of the European Economic Association 15(3): 1-35.
Jullien, B. and Y. Lefouili (2018): “Horizontal Mergers and Innovation” Toulouse School of
Economics Working Paper No. 18-892.
Keller, W. (2004): “International Technology Diffusion” Journal of Economic Literature 42: 752-782.
Keller, W. (2010): “International Trade, Foreign Direct Investment, and Technology Spillovers”
Handbook of the Economics of Innovation, Amsterdam, Elsevier North-Holland.
Keller, W. and S. Yeaple (2013): “The Gravity of Knowledge” American Economic Review 103(4):
1414-1444.
Leuven, E., and B. Sianesi (2003): “PSMATCH2: Stata Module to Perform Full Mahalanobis and
Propensity Score Matching, Common Support Graphing, and Covariate Imbalance Testing,
Statistical Software Components”, Boston College Department of Economics.

27
Lopez A., and X. Vives (forthcoming): “Overlapping Ownership, R&D Spillovers, and Antitrust
Policy” Journal of Political Economy.
Maksimovic, V., Phillips, G., and N. Prabhala (2011): “Post-merger Restructuring and the Boundaries
of Firms” Journal of Financial Economics 102(2): 317-343.
Markusen, J. (1984): ‘‘Multinationals, Multi-Plant Economies, and the Gains from Trade” Journal of
International Economics 16 (3–4): 205–26.
Melitz, M. (2003): “The Impact of Trade on Intra-Industry Reallocations And Aggregate Industry
Productivity” Econometrica v71(6): 1695-1725.
Moraga-González, J., Motchenkova, E., and S. Nevrekar (2018): “Merger and Innovation Portfolios”
Mimeo.
National Science Foundation (NSF) (2016): “R&D Performance of U.S.-Located Multinational
Companies: Results from Multiagency Survey Linking Project” InfoBrief NCSES 16-305.
Nocke, V., and S. Yeaple (2008): “An Assignment Theory of Foreign Direct Investment” Review of
Economic Studies 75: 529–557.
Rosenbaum, P., and D. Rubin (1985): “Constructing a Control Group Using Multivariate Matched
Sampling Methods that Incorporate the Propensity Score” American Statistician 39: 33-38.
Stiebale, J. and F. Reize (2011): “The Impact of FDI through Mergers and Acquisitions on Innovation
in Target Firms” International Journal of Industrial Organization 29: 155–167.
Stiebale, J. (2016): “Cross-border M&As and Innovative Activity of Acquiring and Target Firms,”
Journal of International Economics 99: 1–15.
Szücs, F. (2014): “M&A and R&D: Asymmetric effects on acquirers and targets?” Research Policy
43 (7): 1264-1273.
UNCTAD (2005): “World Investment Report 2005: Transnational Corporations and the
Internationalization of R&D”, United Nations.
UNCTAD (2007): “World Investment Report 2007: Transnational corporations, extractive industries
and development”, United Nations.
Veugelers, R., and B. Cassiman (2004): “Foreign Subsidiaries as a Channel of International
Technology Diffusion: Some direct firm level evidence from Belgium” European Economic
Review 48: 455–476.

28
TABLES AND FIGURES
Table 1: Summary Statistics of Innovation Expenditures by Type of Firm
All foreign acquired firms Frontier foreign acquired
Non-frontier foreign
acquired
Non
acquired
Year t-1 t t+1 t-1 t t+1 t-1 t t+1
Total Innovation Expenditure (log) 11.35 10.41 10.31 11.27 9.88 10.09 11.41 10.72 10.33 9.82 (4.77) (5.52) (5.61) (4.56) (5.80) (5.69) (4.88) (5.34) (5.65) (4.97)
share of total innovation expenditure on...
Internal R&D 0.78 0.71 0.73 0.82 0.70 0.67 0.75 0.72 0.76 0.72 (0.30) (0.34) (0.34) (0.29) (0.35) (0.37) (0.30) (0.33) (0.33) (0.33)
External R&D 0.08 0.12 0.10 0.06 0.13 0.12 0.09 0.12 0.10 0.11 (0.17) (0.23) (0.22) (0.17) (0.26) (0.26) (0.17) (0.22) (0.20) (0.21)
Non-R&D innovation 0.16 0.17 0.17 0.14 0.18 0.20 0.18 0.16 0.14 0.18 (0.28) (0.29) (0.30) (0.26) (0.28) (0.32) (0.29) (0.29) (0.29) (0.30)
Total External R&D Expenditure (log) 3.66 3.94 3.47 2.62 3.83 3.67 4.22 3.96 3.35 3.47 (5.55) (5.71) (5.53) (5.04) (5.74) (5.68) (5.78) (5.70) (5.46) (5.18)
share of external R&D on...
External domestic 0.73 0.69 0.78 0.66 0.64 0.69 0.73 0.70 0.80 0.94 (0.40) (0.41) (0.38) (0.43) (0.43) (0.43) (0.41) (0.42) (0.36) (0.20)
External foreign 0.27 0.31 0.22 0.34 0.36 0.31 0.27 0.30 0.20 0.06 (0.40) (0.41) (0.38) (0.43) (0.43) (0.43) (0.41) (0.42) (0.36) (0.20)
Total External Foreign Expenditure (log) 1.41 1.66 1.17 1.19 1.79 1.60 1.63 1.65 1.08 0.43 (3.94) (4.19) (3.52) (3.69) (4.45) (4.10) (4.20) (4.13) (3.36) (2.15)
share of external foreign R&D on...
External–Foreign - same business group 0.60 0.65 0.61 0.55 0.74 0.79 0.62 0.62 0.48 0.05
(Technology transfers) (0.48) (0.46) (0.48) (0.50) (0.40) (0.40) (0.48) (0.49) (0.50) (0.21)
External–Foreign - other private firms 0.34 0.30 0.21 0.35 0.26 0.21 0.34 0.31 0.21 0.75 (0.47) (0.44) (0.39) (0.47) (0.40) (0.40) (0.47) (0.45) (0.41) (0.42)
External-Foreign - non-private firms 0.06 0.04 0.18 0.10 0.00 0.00 0.04 0.07 0.31 0.20 (0.24) (0.20) (0.39) (0.32) (0.00) (0.00) (0.20) (0.25) (0.48) (0.38)
Number of firms 300 300 228 104 104 71 196 196 157 7,419
Note: The symbol t-1 denotes one year before acquisition by a foreign MNE and t denotes the year of the acquisition. Frontier foreign acquired is defined as domestic firms acquired by foreign MNEs from
Japan, USA and Germany (JUG countries). Standard deviations are in parenthesis.

29
Table 2: Determinants of Acquisition: Probability of being acquired
Sample
Regression No.
All firms
(i)
All firms
(ii)
All firms
(iii)
All firms
(iv)
Frontier vs.
non-acquired
(v)
Non-frontier vs. non-
acquired
(vi)
Frontier vs.
non-frontier
(vii)
Log(Total innovation expenditure) 0.0001 0.0003 (0.000) (0.000) Log(Total innovation /turnover) -0.0004 -0.0009 (0.003) (0.004) External R&D/internal R&D -0.0000 (0.000) Log(internal R&D) 0.0002*** 0.0002*** 0.0001* 0.0001** 0.0000 (0.000) (0.000) (0.000) (0.000) (0.000) Log(external R&D) -0.0003*** -0.0003*** -0.0002*** -0.0001** -0.0000 (0.000) (0.000) (0.000) (0.000) (0.000) External R&D same 0.0000 0.0000 business group/external R&D (0.000) (0.000) External R&D same 0.0424** 0.0633*** 0.0736*** 0.0364** 0.0562*** 0.0000 business group dummy (0.017) (0.020) (0.016) (0.014) (0.016) (0.000) Labour productivity 0.0028*** 0.0036*** 0.0026*** 0.0026*** 0.0011*** 0.0015*** -0.0000 (0.000) (0.001) (0.000) (0.000) (0.000) (0.000) (0.000) Physical investment -0.0001 -0.0003** -0.0001 -0.0001 0.0001 -0.0001 0.0000 per employee (0.000) (0.000) (0.000) (0.000) (0.000) (0.000) (0.000) Sales growth -0.0022*** -0.0025** -0.0021*** -0.0021*** -0.0011** -0.0013** -0.0000 (0.001) (0.001) (0.001) (0.001) (0.001) (0.000) (0.000) Size <50 employees -0.0133*** -0.0121*** -0.0115*** -0.0114*** -0.0041*** -0.0083*** 0.0000 (0.002) (0.002) (0.002) (0.002) (0.001) (0.001) (0.000) Size: 50-99 employees -0.0039*** -0.0041*** -0.0035*** -0.0035*** -0.0009** -0.0028*** 0.0000 (0.001) (0.001) (0.001) (0.001) (0.000) (0.000) (0.000) Size: 200-499 employees -0.0001 -0.0008 -0.0003 -0.0003 0.0004 -0.0009 0.0000 (0.001) (0.001) (0.001) (0.001) (0.001) (0.001) (0.000) Size: >=500 employees 0.0013 0.0000 0.0007 0.0008 -0.0001 0.0005 -0.0000 (0.002) (0.002) (0.001) (0.001) (0.001) (0.001) (0.000)
Observations 24,157 17,249 24,157 24,157 21,180 23,916 1,476
Note: In columns (i) to (vi), the dependent variable is a dummy variable that takes the value one if the firm is acquired in year t, and zero otherwise. In column (vii), the dependent variable is a dummy
variable that takes the value one if the firm is acquired by a MNE from Japan, USA and Germany and zero if the acquisition is by a non-frontier MNE. All estimations use a probit model. The coefficients
refer to marginal effects calculated at sample means. Estimated standard errors are clustered at the firm level and shown in parenthesis. All independent variables are lagged one period and are in logarithms
except dummy variables. All regressions include industry and year dummies. * Significant at 10%. ** significant at 5%. *** significant at 1%

30
Table 3: Test of balancing hypothesis
Table B3a: Test of balancing hypothesis for non-quitters and quitters
Sample of firms:
Test of balancing hypothesis for
non-quitters and quitters
Test of balancing hypothesis for R&D
active firms
Treated Control t-test p-value Treated Control t-test p-value
Log(internal R&D) 10.44 10.66 -0.46 0.64 12.56 11.98 1.52 0.13
Log(external R&D) 3.41 3.21 0.38 0.70 4.12 3.99 0.18 0.85
External same business group dummy 0.04 0.04 0.25 0.81 0.05 0.05 0.04 0.97
Labour productivity 12.16 12.10 0.66 0.51 12.27 12.12 1.39 0.17
Physical investment per employee 6.95 7.48 -1.70 0.09 7.41 7.91 -1.47 0.14
Sales growth 0.03 0.04 -0.48 0.63 0.09 0.06 0.56 0.58
Size <50 employees 0.25 0.24 0.23 0.82 0.20 0.21 -0.17 0.87
Size: 50-99 employees 0.17 0.13 1.10 0.27 0.18 0.12 1.46 0.15
Size: 200-499 employees 0.19 0.18 0.13 0.90 0.19 0.19 -0.06 0.95
Size: >=500 employees 0.14 0.14 0.14 0.89 0.14 0.15 -0.24 0.81

31
Table 4: The Effect of Foreign Acquisition on the Probability of Stopping R&D using a matched
sample
Regression No. (i) (ii)
Panel A: Probability of stopping R&D during the sample period
Foreign acquired 0.122**
(0.052)
Frontier foreign acquired 0.168***
(0.041)
Non-frontier foreign acquired 0.137**
(0.062)
Observations 2,300 2,300
Panel B: Probability of stopping R&D in a given year (hazard rate)
Foreign acquired 0.416***
(0.126)
Frontier foreign acquired 0.639***
(0.180)
Non-frontier foreign acquired 0.284
(0.188)
Observations 2,231 2,231
Note: Frontier foreign acquired is defined as domestic firms acquired by Japan, Germany and USA. The dependent variable
refers to whether a firm with positive internal R&D then become zero and remains so during the sample period. Panel A reports
probit estimates on the probability of quitting R&D during the sample period. We report marginal effects. Estimated standard
errors are clustered at the industry level and shown in parenthesis. All regressions include sector trends and year dummies.
Panel B reports Cox Proportional Hazard estimates. * Significant at 10%;** Significant at 5%; *** significant at 1%.
Table 5: The Effect of Foreign Acquisition on Innovation Expenditures using a matched sample
Dependent variable: Innovation Expenditures
Regression No.
Total
(i)
Internal
R&D
Share
(ii)
External
R&D
Share
(iii)
External
Domestic
Share
(iv)
External
Foreign
Share
(v)
Technology
Transfer
Share
(vi)
Frontier foreign acquired
Year of acquisition 0.148** -0.070** 0.005 0.048 -0.052* 0.077*
(0.059) (0.030) (0.022) (0.063) (0.024) (0.037)
One year after 0.144 -0.083** -0.004 -0.010 -0.078* 0.035
(0.148) (0.036) (0.023) (0.070) (0.037) (0.046)
Two years after 0.944** -0.116 -0.002 0.227* -0.067** 0.078
(0.331) (0.090) (0.017) (0.103) (0.026) (0.046)
Non-frontier foreign acquired
Year of acquisition -0.286* -0.016 0.012 -0.017 -0.013 0.018
(0.148) (0.062) (0.026) (0.052) (0.010) (0.017)
One year after -0.235** -0.014 -0.004 0.006 -0.005 0.001
(0.097) (0.040) (0.013) (0.071) (0.010) (0.014)
Two years after -0.313 -0.040 0.000 -0.011 -0.042 0.006
(0.208) (0.050) (0.036) (0.146) (0.037) (0.042)
Observations 981 981 981 981 981 981
R-squared 0.232 0.190 0.183 0.173 0.112 0.171 Note: Fixed effects-OLS estimates. Estimated standard errors are clustered at the industry level and shown in parenthesis. Frontier foreign acquired is defined as domestic firms acquired by Japan, Germany and USA. All regressions include firm-fixed effects, sector trends and year dummies. Total R&D spending is the logged value. Internal and external R&D expenditures are sub-components of total innovation expenditures and are expressed as shares of this total. Internal R&D is the R&D undertaken within the firm; External R&D is the purchases of R&D by the firm; External domestic and external foreign are sub-components of external R&D. External domestic is the R&D acquired in Spain by the firm and external foreign are the imports of R&D. Technology transfers is a sub-component of external foreign. Technology transfers are the imports of R&D from the business group by the firm. * Significant at 10%;** Significant at 5%; *** significant at 1%.

32
Table 6: The Effect of Foreign Acquisition on Employment by Skill Type using a matched sample
Dependent variable: Employees by skill level
Regression No.
Total
(i)
Ph.D.
(ii)
5-year Undergrad
degree
(iii)
3-year Undergrad
degree
(iv)
Without
higher
education
(v)
Frontier foreign acquired
Year of acquisition 0.115 0.075*** 0.230 -0.055 0.081
(0.183) (0.023) (0.149) (0.078) (0.115)
One year after 0.112 0.013 0.229 0.060 0.041
(0.158) (0.050) (0.214) (0.154) (0.144)
Two years after 0.406* 0.224 0.241 0.498 0.672
(0.211) (0.184) (0.311) (0.307) (0.437)
Non-frontier foreign acquired
Year of acquisition -0.233** -0.099 -0.296*** 0.013 -0.077
(0.083) (0.112) (0.066) (0.049) (0.105)
One year after -0.285** 0.077 -0.263** -0.146 -0.122
(0.093) (0.062) (0.106) (0.109) (0.123)
Two years after -0.272** -0.077 -0.168 -0.104 -0.086
(0.111) (0.098) (0.161) (0.209) (0.177)
Observations 981 981 981 981 981
R-squared 0.296 0.187 0.297 0.162 0.224
Note: Fixed effects-OLS estimates. Estimated standard errors are clustered at the industry level and shown in parenthesis.
Frontier foreign acquired is defined as domestic firms acquired by Japan, USA and Germany. Dependent variables are the
logarithm of the number of employees. All regressions include firm-fixed effects, sector trends and year dummies. *
Significant at 10%;** Significant at 5%; *** significant at 1%.
Table 7: The Effect of Foreign Acquisition on Innovation Output using a matched sample
Dependent variable: Innovation output
Patents/
internal
R&D
Product
innovation
Process
innovation
Patents/
internal
R&D
Product
innovation
Process
innovation
Regression No. (i) (ii) (iii) (iv) (v) (vi)
Frontier foreign acquired
Year of acquisition 0.001 0.039 -0.010 0.0009 0.039 -0.010
(0.001) (0.038) (0.025) (0.001) (0.038) (0.025)
One year after 0.002** 0.040 0.029** 0.0022** 0.040 0.029**
(0.001) (0.031) (0.011) (0.001) (0.031) (0.011)
Two years after 0.008 -0.136 0.081** 0.0084 -0.136 0.080**
(0.007) (0.213) (0.026) (0.007) (0.213) (0.026)
Non-frontier foreign acquired
Year of acquisition -0.000 -0.020 0.022 -0.0002 -0.019 0.021
(0.001) (0.052) (0.028) (0.000) (0.051) (0.028)
One year after -0.001 0.049 -0.051 -0.0004 0.044 -0.043
(0.001) (0.095) (0.082) (0.001) (0.099) (0.079)
Two years after 0.000 -0.006 0.028 0.0007 -0.010 0.033
(0.001) (0.102) (0.190) (0.001) (0.105) (0.190)
Lag exports 0.0003* -0.049 0.080**
(0.000) (0.046) (0.025)
Observations 690 710 710 690 710 710
Note: Fixed effects-OLS estimates. Estimated standard errors are clustered at the industry level and shown in parenthesis.
Frontier foreign acquired is defined as domestic firms acquired by foreign MNEs from Japan, USA and Germany. The
innovation output is the number of patents over internal R&D, product and process innovation for the current year, one year
and 2 years afterwards. Regressions include firm-fixed effects, sector trends and year dummies. * Significant at 10%;**
Significant at 5%; *** significant at 1%.

33
Table 8: The Effect of Foreign Acquisition on the Domestic Innovation Index
Innovation Measure: Patents Process Innovation
Weights in terms of: Weights in terms of:
Internal R&D
expenditures
(i)
Total R&D
expenditures
(i)
Internal R&D
expenditures
(iii)
Total innovation
expenditures
(iv)
Within effect Frontier 2.59 2.72 0.23 0.30
Non-frontier 0.00 0.00 0.00 0.00
Between effect Frontier 3.18 3.34 0.71 0.95
Non-frontier -1.47 -1.17 -0.30 -0.36
Cross effect Frontier 1.83 1.92 0.00 0.55
Non-frontier 0.00 0.00 0.00 0.00
Exit Frontier -0.09 -0.09 -0.09 -0.09
Non-frontier -0.25 -0.25 -0.10 -0.20
Total Frontier 7.68 8.06 0.86 1.70
Non-frontier -1.23 -0.92 -0.40 -0.56
Overall 6.45 7.14 0.45 1.15
Note: All figures are as a percentage of the total increase over the period 2004-2009.
Table 9: The Effect of Foreign Acquisition on Innovation Expenditures for R&D active firms
Using a Matched Sample: Alternative Definition of Technologically Intensive Foreign
Acquisitions
Dependent variable: Innovation Measure
Innovation
Expenditure
measure
Hazard of
stopping
R&D
Total R&D
Internal
R&D
Share
Technology
Transfer
Share
Employees
with PhD
Innovation
Output
Regression No. (i) (ii) (iii) (iv) (v) (vi)
Frontier: above 90th
percentile 1.190***
(0.371) Year of acquisition 0.018 -0.054 0.100* 0.232* -0.001 (0.255) (0.087) (0.049) (0.106) (0.001) One year after 0.329*** -0.160** 0.067 0.111 0.003* (0.084) (0.068) (0.057) (0.091) (0.002) Two years after 0.624* -0.288*** 0.040 0.229 0.018* (0.292) (0.085) (0.067) (0.214) (0.009) Non-frontier: below-
90th percentile 0.316*** (0.118) Year of acquisition -0.129 -0.035 0.032* -0.047 0.000 (0.101) (0.031) (0.017) (0.066) (0.000) One year after -0.150** -0.032 0.008 0.057 0.000 (0.061) (0.034) (0.020) (0.049) (0.000) Two years after -0.008 -0.038 0.025 -0.012 0.000 (0.171) (0.050) (0.023) (0.075) (0.000)
Observations 2,231 981 981 981 981 690 Note: Frontier MNEs are defined as foreign acquisitions from countries with R&D intensity at the 90th percentile within a given industry. Fixed effects-OLS estimates. Estimated standard errors are clustered at the industry level and shown in parenthesis. * Significant at 10%;** Significant at 5%; *** significant at 1%.

34
Table 10: The Effect of Foreign Acquisition on Innovation Expenditures for a matched sample
with matching procedure with two year pre-treatment effects
Dependent variable: Innovation Measure
Innovation
Expenditure
measure
Hazard of
stopping
R&D
Total R&D
Internal
R&D
Share
Technology
Transfer
Share
Employees
with PhD
Innovation
Output
Regression No. (i) (ii) (iii) (iv) (v) (vi)
Frontier foreign
acquired 0.655***
(0.238) Year of acquisition 0.070 -0.073** 0.051* 0.056** 0.001 (0.081) (0.032) (0.023) (0.019) (0.001) One year after 0.133 -0.085* 0.017 0.024 0.002* (0.158) (0.043) (0.035) (0.016) (0.001) Two years after 0.799** -0.193** 0.066 0.195 0.008 (0.303) (0.073) (0.040) (0.149) (0.007) Non-frontier foreign
acquired 0.368** (0.171) Year of acquisition -0.197 -0.020 0.007 -0.053 -0.000 (0.154) (0.041) (0.020) (0.069) (0.000) One year after -0.112 -0.023 -0.010 0.093* -0.000 (0.086) (0.044) (0.020) (0.047) (0.000) Two years after -0.054 -0.058* -0.010 -0.051 0.001 (0.222) (0.028) (0.046) (0.054) (0.001)
Observations 2,225 946 974 974 974 686 Note: Fixed effects-OLS estimates. Estimated standard errors are clustered at the industry level and shown in parenthesis. Frontier foreign acquired is defined as domestic firms acquired by Japan, Germany and USA. All regressions include firm-fixed effects, sector trends and year dummies. * Significant at 10%;** Significant at 5%; *** significant at 1%.
Table 11: The Effect of Foreign Acquisition on Innovation Expenditures for a matched sample.
Placebo test
Dependent variable: Innovation Measure
Innovation
Expenditure
measure
Hazard of
stopping
R&D
Total R&D
Internal
R&D
Share
Technology
Transfer
Share
Employees
with PhD
Innovation
Output
Regression No. (i) (ii) (iii) (iv) (v) (vi)
Frontier foreign
acquired -0.306
(0.580)
Year of acquisition 0.336 0.117 -0.017 0.044 -0.001
(0.239) (0.114) (0.011) (0.051) (0.001)
One year after -0.072 0.070 -0.004 0.241 -0.001
(0.301) (0.095) (0.003) (0.174) (0.001) -0.438
Non-frontier foreign
acquired (0.520)
Year of acquisition 0.150 0.104 -0.018* 0.049 -0.000
(0.172) (0.072) (0.008) (0.104) (0.000)
One year after -0.024 0.038 -0.025 0.092 0.000 (0.183) (0.039) (0.014) (0.070) (0.000)
Observations 1,978 729 777 777 539 1,006 Note: Fixed effects-OLS estimates. Estimated standard errors are clustered at the industry level and shown in parenthesis. Frontier foreign acquired is defined as domestic firms acquired by Japan, Germany and USA. All regressions include firm-fixed effects, sector trends and year dummies. Total R&D spending is the logged value. * Significant at 10%;** Significant at 5%; *** significant at 1%.
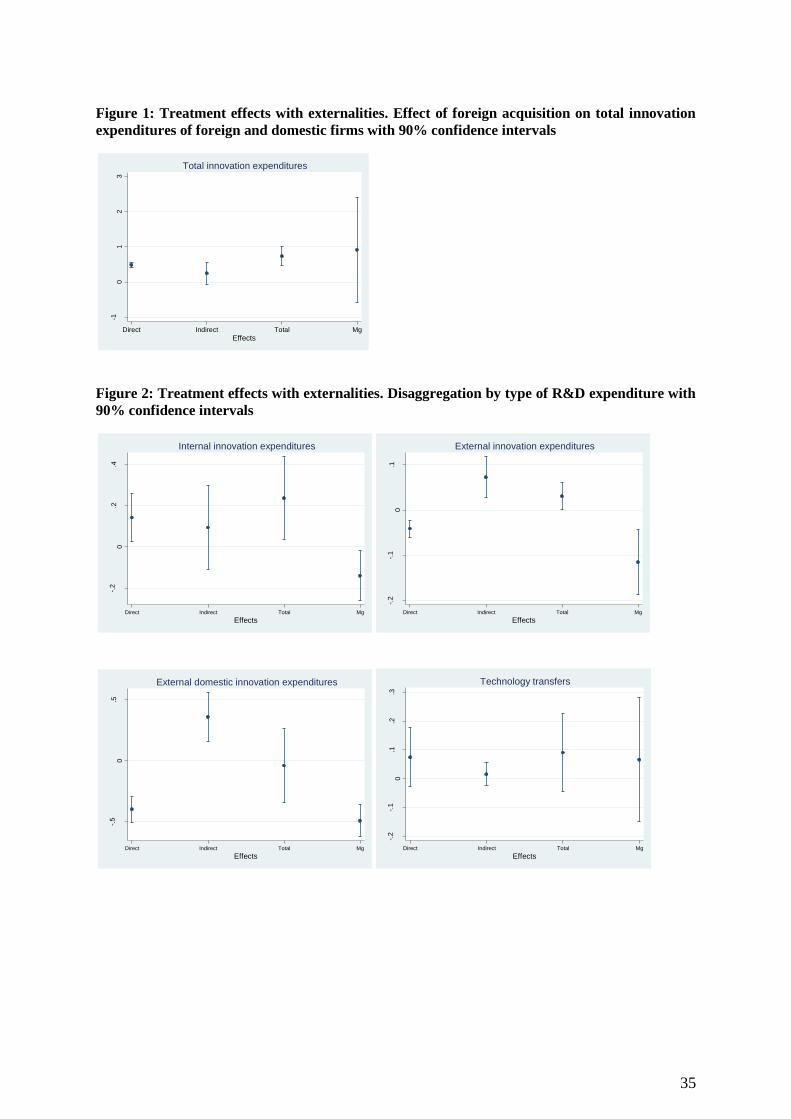
35
Figure 1: Treatment effects with externalities. Effect of foreign acquisition on total innovation
expenditures of foreign and domestic firms with 90% confidence intervals
Figure 2: Treatment effects with externalities. Disaggregation by type of R&D expenditure with
90% confidence intervals
-10
12
3
Direct Indirect Total Mg
Diffe
rence
s b
tw a
vera
ge p
ote
ntia
l ou
tcom
es
Effects
Total innovation expenditures
-.2
0.2
.4
Direct Indirect Total Mg
Diffe
rence
s b
tw a
vera
ge p
ote
ntia
l ou
tcom
es
Effects
Internal innovation expenditures
-.2
-.1
0.1
Direct Indirect Total Mg
Diffe
rence
s b
tw a
vera
ge p
ote
ntia
l ou
tcom
es
Effects
External innovation expenditures
-.5
0.5
Direct Indirect Total Mg
Diffe
rence
s b
tw a
vera
ge p
ote
ntia
l ou
tcom
es
Effects
External domestic innovation expenditures
-.2
-.1
0.1
.2.3
Direct Indirect Total Mg
Diffe
rence
s b
tw a
vera
ge p
ote
ntia
l ou
tcom
es
Effects
Technology transfers

36
Figure 3: Treatment effects with externalities. Effect of foreign acquisition on total employees in
internal R&D of foreign and domestic firms with 90% confidence intervals
-.5
0.5
11
.52
Direct Indirect Total Mg
Diff
ere
nce
s btw
ave
rag
e p
ote
ntia
l ou
tcom
es
Effects
Total employees in internal R&D
-.4
-.2
0.2
.4.6
Direct Indirect Total Mg
Diffe
rence
s b
tw a
vera
ge p
ote
ntia
l ou
tcom
es
Effects
PhD

37
ON-LINE APPENDICES
Multinationals and the Globalization of R&D
María García-Vega, Patricia Hofmann and Richard Kneller
Table of Contents
Appendix A
Table A1: Classification of total innovation expenditures
Table A2: The Effect of Foreign Acquisition on the Probability of Starting R&D using a matched
sample
Appendix B
Table B1: The Effect of Foreign Acquisition on the Probability of Quitting R&D with matching
procedure based on a propensity score reweighted estimation
Table B2: The Effect of Foreign Acquisition on Innovation Expenditures for a matched sample with
matching procedure based on a propensity score reweighted estimation
Table B3: The Effect of Foreign Acquisition on Employment by Skill Type and Innovation Output for
a matched sample with matching procedure based on a propensity score reweighted estimation
Table B4: The Effect of Foreign Acquisition on the Probability of Quitting R&D with matching
procedure based on a nearest neighbour
Table B5: The Effect of Foreign Acquisition on Innovation Expenditures for a matched sample with
matching procedure based on a nearest neighbour
Table B6: The Effect of Foreign Acquisition on Employment by Skill Type and Innovation Output for
a matched sample with matching procedure based on a nearest neighbour

38
Appendix A: Data classification and the effect of foreign acquisition on the probability of
starting R&D
Table A1: Classification of total innovation expenditures
Subcategories of Total innovation expenditures
[1-3] Definition
R&D internal [1] In-house or intramural R&D: Creative work
undertaken within an enterprise on an occasional or
regular basis in order to increase the stock of
knowledge and its use to devise new and improved
goods, services and processes.
R&D external [2] Acquisition of R&D or extramural R&D: Firm
purchases of creative work on an occasional or
regular basis in order to increase the stock of
knowledge and its use to devise new and improved
goods, services and processes form other companies
(including other enterprises within the group) or
public and private research organizations
R&D external-domestic [2.1] Acquisition of R&D in Spain.
R&D external-foreign [2.2] Acquisition of R&D abroad.
R&D external-foreign same business group
(Technology transfers)
[2.2.1] R&D acquisitions abroad from companies that belong
to the same business group
R&D external-foreign other private [2.2.2] R&D acquisitions abroad from companies that are
legally independent and do not belong to the same
business group
R&D external-foreign non-private [2.2.3] R&D acquisitions abroad from public
administrations, universities, non-profit
organizations and other international organizations
Innovation expenditures other than R&D [3] Acquisition of machinery, equipment and software:
Acquisition of advanced machinery, equipment and
computer hardware or software to produce new or
significantly improved goods, services, production
processes, or delivery methods. Acquisition of external knowledge: Purchase or
licensing of patents and non-patented inventions,
know-how, and other types of knowledge from other
enterprises or organizations. Expenditures on design functions for the development
or implementation of new or improved goods,
services and processes. Expenditure on design in the
R&D phase of product development should be
excluded. Internal or external training for personnel
specifically for the development and/or introduction
of innovations. Expenditures on all activities concerning market
preparation and introduction of new or significantly
improved goods and services, including market
research and launch advertising.
Note: The numbers correspond to the classification of innovation expenditures, which we use in the empirical analysis. Source:
PITEC database.

39
Table A2: The Effect of Foreign Acquisition on the Probability of Starting R&D using a
matched sample
Regression No. (i) (ii)
Panel A: Probability of starting R&D during the sample period
Foreign acquired 0.061
(0.043)
Frontier foreign acquired 0.048
(0.050)
Non-frontier foreign acquired 0.055
(0.045)
Observations 2,335 2,335
Panel B: Probability of starting R&D in a given year
Foreign acquired -0.022
(0.014)
Frontier foreign acquired 0.000
(0.001)
Non-frontier foreign acquired 0.000
(0.000)
Observations 2,068 2,068
Note: Frontier foreign acquired is defined as domestic firms acquired by Japan, Germany and USA. Panel A reports probit
estimates on the probability of starting R&D during the sample period. The dependent variable refers to whether a firm with
zero internal R&D expenditures records and continues to record positive internal R&D expenditures during the sample period.
We report marginal effects. Estimated standard errors are clustered at the industry level and shown in parenthesis. All
regressions include industry and year dummies. * Significant at 10%;** Significant at 5%; *** significant at 1%.

40
Appendix B: Results with alternative matching procedures
In this section, we replicate our results using a propensity score reweighted estimation.
Table B1: The Effect of Foreign Acquisition on the Probability of Quitting R&D with matching
procedure based on a propensity score reweighted estimation
Regression No. (i) (ii)
Probability of quitting R&D in a giving year (linear probability model)
Foreign acquired 0.060**
(0.028)
Frontier foreign acquired 0.122**
(0.048)
Non-frontier foreign acquired 0.035
(0.029)
Observations 35,768 35,125
Note: Frontier foreign acquired is defined as domestic firms acquired by Japan, Germany and USA. The dependent variable
refers to whether a firm with positive internal R&D then become zero and remains so during the sample period. Panel A reports
probit estimates on the probability of quitting R&D during the sample period. We report marginal effects. Estimated standard
errors are clustered at the industry level and shown in parenthesis. All regressions include sector trends and year dummies.
Panel B reports Cox Proportional Hazard estimates. * Significant at 10%;** Significant at 5%; *** significant at 1%.
Table B2: The Effect of Foreign Acquisition on Innovation Expenditures for a matched sample
with matching procedure based on a propensity score reweighted estimation
Innovation Expenditure
Regression No.
Total
(i)
Internal
R&D
Share
(ii)
External
R&D
Share
(iii)
External
Domestic
Share
(iv)
External
Foreign
Share
(v)
Technology
Transfers
Share
(vi)
Frontier foreign
acquired
Year of acquisition 0.151 -0.065 0.018 0.046 -0.030 0.088**
(0.117) (0.037) (0.028) (0.084) (0.020) (0.034)
One year after 0.297** -0.067** 0.023 0.034 -0.028 0.044
(0.110) (0.026) (0.031) (0.074) (0.016) (0.057)
Two years after 0.795** -0.122*** 0.063** 0.452*** -0.027 0.085 (0.300) (0.037) (0.021) (0.109) (0.016) (0.060)
Non-frontier foreign
acquired
Year of acquisition -0.068 -0.007 0.029 -0.022 -0.003 0.020
(0.102) (0.023) (0.020) (0.059) (0.007) (0.017)
One year after -0.092 -0.009 0.001 -0.032 -0.003 0.006 (0.056) (0.033) (0.012) (0.054) (0.006) (0.013)
Two years after -0.030 -0.062* 0.011 0.018 -0.015 0.014
(0.222) (0.029) (0.042) (0.118) (0.020) (0.030)
Observations 14,147 14,147 14,147 14,147 14,147 14,147 Note: Fixed effects-OLS estimates. Estimated standard errors are clustered at the industry level and shown in parenthesis. Frontier foreign acquired is defined as domestic firms acquired by Japan, Germany and USA. All regressions include firm-fixed effects, sector trends and year dummies. Total R&D spending is the logged value. Internal and external R&D expenditures are sub-components of total innovation expenditures and are expressed as shares of this total. Internal R&D is the R&D undertaken within the firm; External R&D is the purchases of R&D by the firm; External domestic and external foreign are sub-components of external R&D. External domestic is the R&D acquired in Spain by the firm and external foreign are the imports of R&D. Technology transfers is a sub-component of external foreign. Technology transfers are the imports of R&D from the business group by the firm. * Significant at 10%;** Significant at 5%; *** significant at 1%.

41
Table B3: The Effect of Foreign Acquisition on Employment by Skill Type and Innovation
Output for a matched sample with matching procedure based on a propensity score reweighted
estimation
Employees in Internal
R&D measure:
Regression No.
Total
(i)
With
Ph.D.
(ii)
With 5-year
Undergrad
degree
(iii)
With 3-
year
Undergrad
degree
(iv)
Without
higher
education
(v)
Innovation
Output
(vi)
Frontier foreign
acquired
Year of acquisition 0.146 0.075*** 0.235 -0.078 0.079 -0.000
(0.148) (0.022) (0.180) (0.118) (0.078) (0.001)
One year after 0.128 0.027 0.256 -0.010 0.049 0.006***
(0.173) (0.019) (0.238) (0.110) (0.103) (0.002)
Two years after 0.351* 0.234 0.288 0.522* 0.771 0.012 (0.173) (0.174) (0.321) (0.246) (0.463) (0.007)
Non-frontier foreign
acquired
Year of acquisition -0.045 0.053* -0.203*** 0.068 0.064 -0.000
(0.055) (0.024) (0.059) (0.103) (0.095) (0.001)
One year after -0.109 0.109** -0.183 -0.079 -0.006 -0.000 (0.139) (0.034) (0.107) (0.094) (0.068) (0.001)
Two years after -0.110 0.030 -0.153 -0.137 0.055 0.001
(0.178) (0.038) (0.145) (0.176) (0.146) (0.001)
Observations 14,147 14,147 14,147 14,147 14,147 10,288
Note: Fixed effects-OLS estimates. Estimated standard errors are clustered at the industry level and shown in parenthesis.
Frontier foreign acquired is defined as domestic firms acquired by Japan, USA and Germany. All regressions include firm-
fixed effects, sector and year dummies. * Significant at 10%;** Significant at 5%; *** significant at 1%.
In this section, we replicate our estimations using a nearest neighbour matching procedure
Table B4: The Effect of Foreign Acquisition on the Probability of Quitting R&D with matching
procedure based on a nearest neighbour
Regression No. (i) (ii)
Panel A: Probability of quitting R&D during sample period
Foreign acquired 0.104*
(0.054)
Frontier foreign acquired 0.149***
(0.045)
Non-frontier foreign acquired 0.115*
(0.067)
Observations 2,445 2,445
Panel B: Probability of quitting R&D in a giving year (hazard rate)
Foreign acquired 0.335***
(0.121)
Frontier foreign acquired 0.573***
(0.177)
Non-frontier foreign acquired 0.188
(0.190)
Observations 2,370 2,370
Note: Frontier foreign acquired is defined as domestic firms acquired by Japan, Germany and USA. The dependent variable
refers to whether a firm with some internal R&D stops and after stopping never continues having internal R&D during the
sample period. We report marginal effects. Estimated standard errors are clustered at the industry level and shown in
parenthesis. All regressions include sector dummies as controls. * Significant at 10%;** Significant at 5%; *** significant at
1%.

42
Table B5: The Effect of Foreign Acquisition on Innovation Expenditures for a matched sample
with matching procedure based on a nearest neighbour
Innovation Expenditure
Regression No.
Total
(i)
Internal
R&D
Share
(ii)
External
R&D
Share
(iii)
External
Domestic
Share
(iv)
External
Foreign
Share
(v)
Technology
Transfers
Share
(vi)
Frontier foreign acquired
Year of acquisition 0.136 -0.064* 0.011 0.042 -0.039 0.084***
(0.088) (0.032) (0.020) (0.068) (0.029) (0.025)
One year after 0.165 -0.076* 0.001 -0.021 -0.075** 0.035
(0.127) (0.037) (0.021) (0.062) (0.032) (0.055)
Two years after 0.970** -0.128 0.008 0.287** -0.068** 0.047 (0.325) (0.088) (0.016) (0.095) (0.023) (0.066)
Non-frontier foreign
acquired
Year of acquisition -
0.394*** -0.010 0.008 0.000 -0.024 0.014
(0.110) (0.049) (0.019) (0.043) (0.013) (0.022)
One year after -
0.413*** 0.004 -0.016 0.017 -0.025 -0.031 (0.115) (0.032) (0.020) (0.069) (0.019) (0.027)
Two years after -0.373 -0.015 -0.010 -0.027 -0.066 -0.011
(0.206) (0.046) (0.042) (0.139) (0.042) (0.047)
Observations 1,026 1,057 1,057 1,057 1,057 1,057 Note: Fixed effects-OLS estimates. Estimated standard errors are clustered at the industry level and shown in parenthesis. Frontier foreign acquired is defined as domestic firms acquired by Japan, Germany and USA. All regressions include firm-fixed effects, sector trends and year dummies. Total R&D spending is the logged value. Internal and external R&D expenditures are sub-components of total innovation expenditures and are expressed as shares of this total. Internal R&D is the R&D undertaken within the firm; External R&D is the purchases of R&D by the firm; External domestic and external foreign are sub-components of external R&D. External domestic is the R&D acquired in Spain by the firm and external foreign are the imports of R&D. Technology transfers is a sub-component of external foreign. Technology transfers are the imports of R&D from the business group by the firm. * Significant at 10%;** Significant at 5%; *** significant at 1%.
Table B6: The Effect of Foreign Acquisition on Employment by Skill Type and Innovation Output
for a matched sample with matching procedure based on a nearest neighbour
Employees in Internal
R&D measure:
Regression No.
Total
(i)
With
Ph.D.
(ii)
With 5-
year
Undergrad
degree
(iii)
With 3-
year
Undergrad
degree
(iv)
Without
higher
education
(v)
Innovation
Output
(vi)
Frontier foreign
acquired
Year of acquisition 0.146 0.081*** 0.256 -0.023 0.098 0.001
(0.226) (0.022) (0.192) (0.112) (0.139) (0.001)
One year after 0.122 0.008 0.217 0.005 0.087 0.002**
(0.170) (0.044) (0.217) (0.147) (0.146) (0.001)
Two years after 0.425* 0.228 0.210 0.589** 0.654 0.008 (0.209) (0.182) (0.291) (0.239) (0.427) (0.007)
Non-frontier foreign
acquired
Year of acquisition -0.221*** -0.094 -0.221*** -0.019 -0.089 0.001
(0.061) (0.102) (0.050) (0.044) (0.095) (0.001)
One year after -0.302*** 0.063 -0.247** -0.145 -0.148 0.000 (0.092) (0.059) (0.087) (0.105) (0.100) (0.001)
Two years after -0.264** -0.079 -0.133 -0.090 -0.080 0.001
(0.101) (0.086) (0.142) (0.201) (0.167) (0.001)
Observations 1,057 1,057 1,057 1,057 1,057 744
Note: Fixed effects-OLS estimates. Estimated standard errors are clustered at the industry level and shown in parenthesis.
Frontier foreign acquired is defined as domestic firms acquired by Japan, USA and Germany. All regressions include firm-
fixed effects, sector trends and year dummies. In columns (vi), the innovation output is the number of patents over a 3-year
time period. * Significant at 10%;** Significant at 5%; *** significant at 1%.