multimodal integration of dynamic audio–visual cues in the ... · an important role in the...
TRANSCRIPT

ORI GIN AL PA PER
Multimodal Integration of Dynamic Audio–Visual Cuesin the Communication of Agreement and Disagreement
Marc Mehu • Laurens van der Maaten
� Springer Science+Business Media New York 2014
Abstract Recent research has stressed the importance of using multimodal and dynamic
features to investigate the role of nonverbal behavior in social perception. This paper
examines the influence of low-level visual and auditory cues on the communication of
agreement, disagreement, and the ability to convince others. In addition, we investigate
whether the judgment of these attitudes depends on ratings of socio-emotional dimensions
such as dominance, arousal, and valence. The material we used consisted of audio–video
excerpts that represent statements of agreement and disagreement, as well as neutral
utterances taken from political discussions. Each excerpt was rated on a number of
dimensions: agreement, disagreement, dominance, valence, arousal, and convincing power
in three rating conditions: audio-only, video-only, and audio–video. We extracted low-
level dynamic visual features using optical flow. Auditory features consisted of pitch
measurements, vocal intensity, and articulation rate. Results show that judges were able to
distinguish statements of disagreement from agreement and neutral utterances on the basis
of nonverbal cues alone, in particular, when both auditory and visual information were
present. Visual features were more influential when presented along with auditory features.
Perceivers mainly used changes in pitch and the maximum speed of vertical movements to
infer agreement and disagreement, and targets appeared more convincing when they
Electronic supplementary material The online version of this article (doi:10.1007/s10919-014-0192-2)contains supplementary material, which is available to authorized users.
M. MehuSwiss Center for Affective Sciences, University of Geneva, 7 rue des Battoirs, 1205 Geneva,Switzerland
M. Mehu (&)Department of Psychology, Webster Vienna Private University, 23 Praterstrasse, 1020 Vienna, Austriae-mail: [email protected]
L. van der MaatenDepartment of Computer Science, Delft University of Technology, 4 Mekelweg, 2628 CD Delft,The Netherlandse-mail: [email protected]
123
J Nonverbal BehavDOI 10.1007/s10919-014-0192-2
showed consistent and rapid movements on the vertical plane. The effect of nonverbal
features on ratings of agreement and disagreement was completely mediated by ratings of
dominance, valence, and arousal, indicating that the impact of low-level audio–visual
features on the perception of agreement and disagreement depends on the perception of
fundamental socio-emotional dimensions.
Keywords Multimodal communication � Agreement � Disagreement � Social perception �Optical flow
Introduction
Nonverbal communication is important in social relationships because it regulates inter-
actions via the expression of personal and interpersonal information (Argyle 1988; Ekman
1985; Grammer 1993; Mehrabian 1971; Scherer 1992), but also because it influences the
behavior and affective states of others (Bachorowski and Owren 2001; Patterson
1982). Nonverbal behavior is used by perceivers to infer other people’s personality
(Borkenau et al. 2004; Funder and Sneed 1993; Scherer 1978), attitudes (Mehrabian 1969;
Weisfeld and Beresford 1982), and emotions (Ekman 1983; Scherer and Ellgring
2007). More generally, nonverbal behavior constitutes an important aspect of how evo-
lutionarily adaptive social strategies are implemented in everyday interactions, be it with
the display of social signals or with the acquisition of relevant information via the inter-
pretation of social signals and social cues (Brown et al. 2003; Grammer 1989; Mehu and
Scherer 2012; Simpson et al. 1993).
Multimodal Communication
The integration of information coming from multiple sensory modalities is widespread in the
animal kingdom and has been observed in non-human primates like rhesus macaques
(Ghazanfar and Logothetis 2003) and chimpanzees (Parr 2004) but also in birds (Rowe 2002),
amphibians (Grafe and Wanger 2007), and spiders (Roberts et al. 2007). Multimodal sig-
nalling has most probably evolved to enhance the detection, recognition, discrimination, and
detectability of signals by perceivers (Rowe 1999). In humans, the combination of several
communication channels has long been recognized as an essential aspect of social interaction
because it reflects intimacy (Argyle and Dean 1965), it promotes social control (Edinger and
Patterson 1983), and it influences how people position each other in space (Hall
1968). Although research has shown that the visual channel may be more important than the
auditory channel in the inference of social information from multimodal stimuli (Burns and
Beier 1973; Mehrabian and Ferris 1967), the relative importance of different modalities is
likely to vary depending on the type of information that is inferred and on the context in which
the perception occurs (Ekman et al. 1980; Parr 2004; Scherer et al. 1977). Nevertheless, the
perception of multimodal information remains the most effective way to accurately detect
emotional states (Banziger et al. 2012; Collignon et al. 2008; deGelder and Vroomen 2000)
and interpersonal information (Archer and Akert 1977).
Like the expression of emotions and interpersonal attitudes, the communication of
agreement and disagreement is of a multimodal nature. The tone of voice and the body
J Nonverbal Behav
123
movements associated with verbal statements about opinions contribute to the inferences
made by others about these statements (Mehrabian 1971). This implies two possibilities.
First, the information about agreement and disagreement is redundantly ‘‘encoded’’ in the
different components of the multimodal signal and the perception of any of these com-
ponents in isolation (words, body movements, or vocal parameters) allows the retrieval of
the meaning. This reasoning is based on the principle of robustness (Ay et al. 2007),
whereby the same information is encoded in separate components in order to increase
efficiency of transmission if one of these components fails to operate (Johnstone 1996).
The second possibility is that the information about agreement and disagreement is
‘‘encoded’’ in one component of the signal (e.g., verbal language), the other components
being devoted to other functions, for instance making the signal more efficient at influ-
encing perceivers, or conveying additional information such as basic socio-emotional
dimensions. This view reflects the possibility that, over the course of evolution, multimodal
signals have been optimized to increase their influence on the perceptual system (Owren
et al. 2010), or to convey multiple messages (Johnstone 1996; Partan and Marler 2005).
Agreement and Disagreement
Agreement and disagreement are particularly important in the unfolding of social inter-
actions because their expression operationalizes two fundamental social processes: coop-
eration and conflict. Agreement and disagreement can be defined as a convergence or
divergence of opinion regarding a certain topic and are usually expressed in three different
ways: (1) directly through language (e.g. ‘‘I agree’’, ‘‘I disagree’’), (2) indirectly through
the expression of an opinion that is congruent or incongruent with an opinion that was
expressed earlier in the conversation, or (3) nonverbally through gestures and facial
expressions (Poggi et al. 2011). In the latter case, some prototypical behaviors such as head
nods, headshakes, and certain postures have been associated with the perception of
agreement and disagreement (Argyle 1988; Bull 1987; Darwin 1872). The present study
investigates verbal expressions of agreement and disagreement and, in particular, whether
the co-occurring low-level auditory and visual features influence their perception.
Recent surveys of the literature suggest that the nonverbal expression of agreement and
disagreement goes beyond head nods and headshakes, as a number of facial, hand, body,
and head movements as well as vocalizations are also associated with these two attitudes
(Bousmalis et al. 2013). In addition, movement dynamic and prosodic parameters may play
an important role in the communication of agreement and disagreement (Keller and
Tschacher 2007). For example, increases in pitch levels, speech intensity, and speech rate
have been associated with situational conflicts both in teaching contexts (Roth and Tobin
2010) and in political decision making (Schubert 1986). Prosodic features were also
successfully utilized in algorithms for the automatic classification of agreement and dis-
agreement utterances (Germesin and Wilson 2009; Hillard et al. 2003). In the visual
domain, sideway leans have been identified as a cue to agreement (Argyle 1988; Bull
1987). Physical properties of movements are also postulated to relate to conversational
functions: For example, cyclic movements can be used to signal ‘‘yes’’ or ‘‘no’’, whereas
wide linear movements may reflect intentions to take the floor in a conversation (Hadar
et al. 1985). These studies suggest that dynamic aspects of vocal and visual nonverbal
behavior are important in expressing agreement and disagreement.
Nonverbal cues are typically measured using behavioral categories that are pre-defined
on the basis of descriptive accounts collected during preliminary observations (Altmann
1974; Lehner 1996; Martin and Bateson 1993). Typical variables in observational studies
J Nonverbal Behav
123

are the frequency of occurrence, duration, and intensity of discrete behaviors (Goldenthal
et al. 1981; Moore 1985; Mehu and Dunbar 2008). The use of behavioral categories in
nonverbal communication research, however, entails several methodological limitations.
First, the categories have to be defined in such a way that sufficient agreement is reached
among coders for the use of that category. This limits the amount of detail that can be
coded because different individuals perceive behavioral properties in different ways. For
example, the intensity of facial expression is more reliably coded when degrees of intensity
are ordered on three rather than on five levels (Sayette et al. 2001), suggesting that reliable
fine-grained measurements of intensity and dynamic aspects of nonverbal behavior are
difficult to achieve by human coders. The second problem of using behavioral categories is
that they are difficult to integrate in multimodal research paradigms because categorical
coding of visual behavior does not provide precise and continuous measurement over
time1, making it difficult to align the coding with continuously recorded signals (such as
auditory features). The use of automatic movement analysis therefore presents an advan-
tage over traditional behavior coding techniques in that it provides fine-grained mea-
surements of intensity and movement dynamic that can be time-aligned with continuous
measurements made in different communicative channels.
Alternative approaches to behavioral measurement have emphasized the importance of
movement dynamics in the study of nonverbal communication (Brown et al. 2005;
Castellano et al. 2008; Grammer et al. 1999; Koppensteiner and Grammer 2010), arguing
that properties of motion are at least as much, if not more, relevant than behavioral
categories to convey adaptive social information. For example, human perceivers can
spontaneously infer from body motion social information such as gender, age, and emo-
tional state (Blake and Shiffrar 2007; Blakemore and Decety 2001; Montepare and Zeb-
rowitz-McArthur 1988). Perceivers are also able to reliably infer social intentions on the
basis of simple motion trajectories (Barrett et al. 2005). More generally, perceivers are
expected to extract relevant information about other individuals from multimodal cues that
show dynamic changes over space and time (McArthur and Baron 1983).
With respect to agreement and disagreement, it is not clear whether these attitudes are
specifically ‘‘encoded’’ in dynamic nonverbal cues or if such cues indirectly convey
agreement and disagreement via their association with more fundamental socio-emotional
dimensions. The ecological model of social perception (McArthur and Baron 1983) indeed
suggests that the perception of traits and dispositions can be inferred from the perception of
emotion, an idea that has been supported by several empirical studies (Hess et al. 2000;
Knutson 1996; Montepare and Dobish 2003). These studies, however, showed an effect of
discrete emotional expressions on the perception of dominance and affiliation but did not
explicitly consider emotional dimensions like valence and arousal.
On the basis of past research, we retained three dimensions deemed particularly relevant
to the unfolding of social interactions and that could play a role in the perception of
agreement and disagreement: dominance, valence, and arousal. These three dimensions
consistently emerged in dimensional models of temperament (Mehrabian 1996), emotion
(Fontaine et al. 2007), and interpersonal relationships (Fiske et al. 2007; Wiggins 1979).
Because these dimensions have both social and emotional components we will refer to
them as socio-emotional dimensions. More specifically, dominance reflects the control
1 Note that time information can be included in a categorical coding paradigm for example by using timebased sampling methods (Altmann 1974; Martin and Bateson 1993), in which behavior is recorded peri-odically at regular intervals (as in instantaneous sampling) or during short time windows (as in one–zerosampling).
J Nonverbal Behav
123
individuals have over their environment, in particular, over their social environment. In the
ethological literature, dominance is often referred to as ‘‘resource holding power’’ (Parker
1974), i.e., the ability to acquire resources and defend them in social competition. The
cognitive evaluation of the control one has over the physical and social environment is also
a central aspect in the emergence of particular emotions such as anger and pride (Scherer
2009). Perceived valence, which determines the general tendency for approach and
avoidance, is both a core determinant of affective states (Scherer 2009) and a central
dimension in social evaluations (Todorov et al. 2008). Finally, arousal has been closely
studied in relation to emotion (Fontaine et al. 2007; Russell 1980), and social signals such
as infant crying (Frodi et al. 1978) and gaze (Gale et al. 1978) have been shown to provoke
physiological arousal. Moreover, the arousing qualities of a situation can be positively
associated with sociability (Gifford 1981).
According to the ecological model of social perception, nonverbal cues related to the
perception of socio-emotional dimensions should generalize to the perception of agree-
ment and disagreement. We therefore expect that cues associated with negative valence
will also be associated with disagreement, the reverse being true for cues that are
perceived positively. We also expect that the cues associated with perceived dominance
will be used to infer disagreement, as the latter attitude mostly underlies conflict, a
situation in which dominance is particularly adaptive (Mazur 2005). The relationship
between arousal and agreement/disagreement is ambiguous because arousal characterizes
both positive and negative emotions. Nevertheless, we can hypothesize that conflicts
instantiated by disagreement statements involve a higher degree of social tension and
emotional arousal.
The Present Research
Although past studies have used a multimodal paradigm to investigate the effect of sep-
arate presentations of channels on the perception of emotion and interpersonal dimensions,
they rarely examined the specific behavioral cues that are involved in these effects (for an
exception, see Scherer and Ellgring 2007). Instead, most research that investigated the
effect of behavioral cues on social and emotional perception have focused on one channel,
often the face (Camras 1980; Ekman and Oster 1979), the voice (Bachorowski and Owren
1995; Banse and Scherer 1996; Puts et al. 2006), or the body (Dael et al. 2012; Gross et al.
2010; Wallbott 1998). The originality of the present study is that it investigates the role of
low-level auditory and visual features in the communication of agreement and disagree-
ment both at the production and the perceptual levels.
Figure 1 shows our conceptual approach based on the lens model framework
(Brunswik 1956; Gifford 1994; Scherer 1978). More precisely, we identified four specific
research questions that address our main objective: (Q1) We investigate whether
agreement and disagreement are ‘‘encoded’’ in low-level auditory and visual features by
testing if some of these features are specific to statements of agreement or disagreement;
(Q2) We test whether judges can distinguish excerpts of agreement from excerpts of
disagreement on the basis of nonverbal auditory and/or visual cues alone; (Q3) We
investigate the nonverbal features perceivers use to evaluate the extent to which targets
agree or disagree; (Q4) We test whether the relationship between nonverbal cues and
judgements of agreement and disagreement is mediated by ratings of three socio-emo-
tional dimensions: dominance, valence, and arousal.
The present study investigates the role of nonverbal components in multimodal
expressions of agreement and disagreement. It does not aim at analyzing the purely
J Nonverbal Behav
123

nonverbal emblems of these attitudes (for example head nods and headshakes). Such an
approach would require a selection of stimuli that is different from what we propose in this
paper (see below), as it would be based on the perception of strictly nonverbal expressions
(i.e., expressions that do not involve either oral or written language). Instead, our approach
is relevant to the question of whether the nonverbal cues that co-occur with verbal state-
ments of agreement and disagreement redundantly convey information about agreement
and disagreement, or if they influence the judgement of these attitudes indirectly via the
perception of more fundamental social dimensions like dominance, valence, or emotional
arousal.
Method
Stimuli
Our stimuli were excerpts taken from debates broadcasted on a local TV channel in
Switzerland (Canal 9, Valais). The debates consisted of discussions between two indi-
viduals about a variety of socio-cultural themes. The discussants were often politicians but
they could also be non-politicians, whose professions or community activities are directly
relevant to the topic discussed. Each debate was about a politically relevant topic (i.e., a
theme for which a new law could be voted), for example: ‘‘smoking in bars and restau-
rants’’, ‘‘aggressive dogs’’, ‘‘the regulation of public access to natural parks’’, etc. It is
possible that some of the debates preceded a public referendum (public referendums are
relatively frequent in Switzerland) but this was not a selection criterion for inclusion in the
analysis. The stimuli were extracted from 15 different dyadic debates. Example images
extracted from the videos are included as supplementary material (Figure S1 in the Sup-
plemental Materials).
Fig. 1 Conceptual approach based on the Lens Model (Brunswik 1956). Note Q1, Q2, Q3, and Q4 refer tothe four research questions we investigate in the present article
J Nonverbal Behav
123

The selection of stimuli was based on verbal content and availability of a frontal camera
view. We went through the entire debates and detected instances in which people verbally
agree (e.g., ‘‘I agree’’, ‘‘you are right’’) or disagree (e.g., ‘‘I disagree’’, ‘‘I don’t think so’’).
These instances were marked as agreement or disagreement and the corresponding seg-
ments of the audio–video file were extracted for use as stimuli in a subsequent reliability
analysis. The clips included the verbal utterance used by us to make a decision about
whether they expressed agreement or disagreement, and they sometimes included con-
textual elements. Statements considered neutral with respect to agreement or disagreement
were selected as control stimuli. The neutral instances were taken from the first statements
of the debaters in the discussion, in which the debaters present themselves and their
opinions about the theme of the debate.
Because the videos we obtained from the TV channel were edited during the recording of
the debate (we had no control on when the different camera views switched during the debate)
our second main criterion for selecting an excerpt was that the camera view was frontal during
the statement of agreement/disagreement (i.e., the camera was filming the person in frontal
view while he was expressing agreement/disagreement). So, it often occurred that we could
not use some statements of agreement or disagreement because the camera appeared to be
focusing on something else (say the moderator or the other debater) at the time the debater
said he agreed or disagreed. This let us with one to three ‘‘agreement’’ or ‘‘disagreement’’
clips per individual per debate. If there were multiple eligible clips per speaker, we selected
the one with the highest reliability among six judges, and if two excerpts had the same value
on reliability we selected the one that occurred first in the debate.
Reliability was obtained by asking six judges (3 females) to classify each stimulus in
three categories (agreement, disagreement, neutral) on the basis of the verbal context. To
this end, the audio track of each stimulus was extracted and presented to judges. Excerpts
that reached agreement for 5 out of 6 judges (83 %) were selected for inclusion as stimuli
in the subsequent rating study. The final set of stimuli contained a total of 60 excerpts that
included one instance of each statement by 20 male debaters. Thus, each debater con-
tributed 3 excerpts: one agreement, one disagreement, and one neutral. Excerpts ranged in
length between 1.36 and 13.48 s. There was no significant difference in length between
clips of agreement (M = 4.66, SD = 2.47), disagreement (M = 5.1, SD = 2.63), and
neutral (M = 4.9, SD = 1.46), F(2,18) = .17, p = .84.
Stimuli were then prepared for three different presentation modalities: audio-only
(sound available only), audio–video (sound and image available), and video-only (image
available only). In order to remove semantic content from the audio signal, the audio tracks
of all stimuli were filtered in the following way: A serial combination of 2nd-order high-
pass and low-pass filters was used to create a 50–500 Hz band-pass filter. The final filter
was built as a cascade of 32 instances of this band-pass filter. The filtering removed
information in the high frequencies, thereby removing semantic content, but leaving the
fundamental frequency unaltered. The filtered audio signal was used in the audio-only and
in the audio–video rating conditions.
Rating Procedure and Data Analysis
Male judges (n = 80) aged between 18 and 35 years old were presented with the 60
stimuli in three different conditions: audio-only (n = 27), video-only (n = 26)2, and
2 One rater had to be removed from the video-only condition due to technical problems during the pre-sentation of stimuli.
J Nonverbal Behav
123
audio–video (n = 27). Participants were asked to evaluate the extent to which each excerpt
expressed: agreement/disagreement, dominance/submissiveness, valence (positive/nega-
tive), emotional arousal, and convincing power. We used the Matlab toolbox Cogent 2000
version 1.25 to present the stimuli and collect ratings. Prior to the task, participants were
given a sheet of paper with definitions for each of the dimensions they had to evaluate
(these definitions are reproduced in Appendix 1). They could keep these definitions at hand
while doing the ratings. Participants were then exposed to the stimuli and had to give their
judgments on continuous sliders (visual analogue scales) after each stimulus (60 in total).
Ratings of agreement/disagreement, dominance/submissiveness, and valence included
the possibility of a neutral response: They were bi-directional scales with the centre of the
scales marked as ‘‘neutral’’. These bi-directional scales were then transformed to give a
continuous measure for each end of the scale (e.g., a score of perceived agreement and a
score of perceived disagreement), which ranged from ‘‘0’’ to ‘‘.5’’. Unidirectional scales
(arousal and convincing power) ranged from ‘‘0’’ to ‘‘1’’. Ratings in all scales were
averaged across raters in order to obtain one score per stimulus, which was then used in
subsequent Multivariate Analyses of Variance. In the latter analyses the unit of analysis is
the debater (i.e. the person who contributed to the target stimulus). Because each debater
yielded three types of utterances (neutral, agreement, and disagreement), utterance type is
taken as a within-subject factor. Each debater also yielded three types of stimuli (audio-
only, video-only, and audio–video), which also makes rating condition a within-subject
factor.
Behavioral Measures 1: Auditory Features
In order to extract the vocal features used in the present study, we used Praat (Boersma
2001), a computer program for the analysis, synthesis, and manipulation of speech. For the
extraction of auditory features, each stimulus was processed in its entirety. The following
features were extracted from each auditory stimulus: Fundamental frequency features or F0
(mean, standard deviation, range, minimum, maximum, and mean absolute gradient or
velocity), mean intensity, and articulation rate. The F0 features and mean intensity were
extracted using ‘‘ProsodyPro’’ version 3.4 (Xu 2005), an integrated Praat script for large-
scale systematic prosody analysis. Due to high correlations among F0 features, we retained
two of them for subsequent analyses: Mean F0 and velocity of F0 (or mean absolute
gradient). These two features give us a measure of the average fundamental frequency and
of its variation over time. F0 velocity (or mean absolute gradient of F0) is the average
change of F0 values over time. F0 values were extracted at regular intervals throughout the
continuous vocal signal. We computed the differences between consecutive values and
then computed the average of all these differences (using the absolute values) to have a
single value that reflects the magnitude of change in F0 for each audio excerpt. If F0 varies
a lot in the continuous audio signal, the mean absolute gradient will be higher. Therefore, it
is a measure of how much F0 goes up and down. Articulation rate reflects the number of
syllables per phonation time and was extracted using ‘‘Syllable Nuclei’’ (de Jong and
Wempe 2009), a Praat script which automatically detects syllable nuclei on the basis of
intensity contours. More specifically, ‘‘Syllable Nuclei’’ uses intensity to find peaks in the
energy contour, it then separates voiced from unvoiced intensity peaks and uses voiced
peaks to infer the presence of syllables. Using this method, de Jong and Wempe (2009)
reported high correlations between speech rate calculated from human syllable counts and
speech rate calculated from the script-based automatic detection of syllables.
J Nonverbal Behav
123
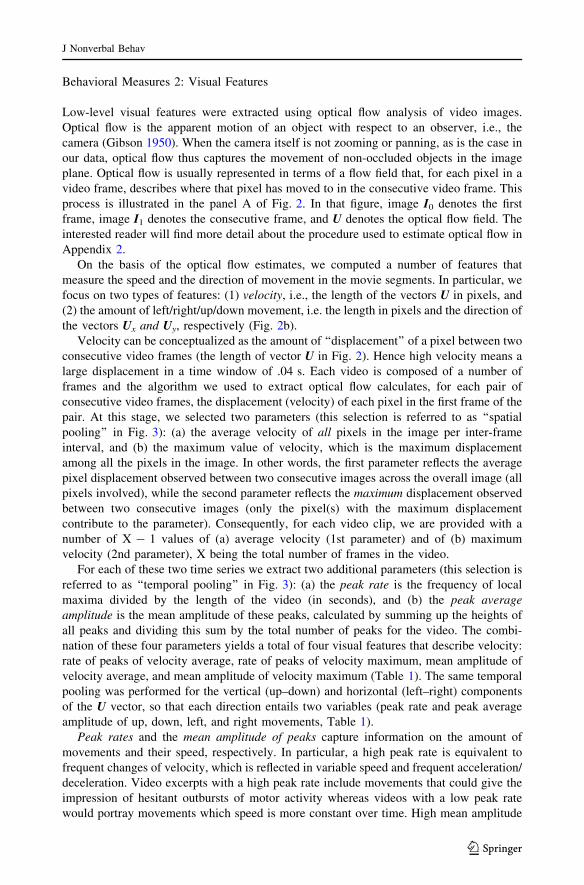
Behavioral Measures 2: Visual Features
Low-level visual features were extracted using optical flow analysis of video images.
Optical flow is the apparent motion of an object with respect to an observer, i.e., the
camera (Gibson 1950). When the camera itself is not zooming or panning, as is the case in
our data, optical flow thus captures the movement of non-occluded objects in the image
plane. Optical flow is usually represented in terms of a flow field that, for each pixel in a
video frame, describes where that pixel has moved to in the consecutive video frame. This
process is illustrated in the panel A of Fig. 2. In that figure, image I0 denotes the first
frame, image I1 denotes the consecutive frame, and U denotes the optical flow field. The
interested reader will find more detail about the procedure used to estimate optical flow in
Appendix 2.
On the basis of the optical flow estimates, we computed a number of features that
measure the speed and the direction of movement in the movie segments. In particular, we
focus on two types of features: (1) velocity, i.e., the length of the vectors U in pixels, and
(2) the amount of left/right/up/down movement, i.e. the length in pixels and the direction of
the vectors Ux and Uy, respectively (Fig. 2b).
Velocity can be conceptualized as the amount of ‘‘displacement’’ of a pixel between two
consecutive video frames (the length of vector U in Fig. 2). Hence high velocity means a
large displacement in a time window of .04 s. Each video is composed of a number of
frames and the algorithm we used to extract optical flow calculates, for each pair of
consecutive video frames, the displacement (velocity) of each pixel in the first frame of the
pair. At this stage, we selected two parameters (this selection is referred to as ‘‘spatial
pooling’’ in Fig. 3): (a) the average velocity of all pixels in the image per inter-frame
interval, and (b) the maximum value of velocity, which is the maximum displacement
among all the pixels in the image. In other words, the first parameter reflects the average
pixel displacement observed between two consecutive images across the overall image (all
pixels involved), while the second parameter reflects the maximum displacement observed
between two consecutive images (only the pixel(s) with the maximum displacement
contribute to the parameter). Consequently, for each video clip, we are provided with a
number of X - 1 values of (a) average velocity (1st parameter) and of (b) maximum
velocity (2nd parameter), X being the total number of frames in the video.
For each of these two time series we extract two additional parameters (this selection is
referred to as ‘‘temporal pooling’’ in Fig. 3): (a) the peak rate is the frequency of local
maxima divided by the length of the video (in seconds), and (b) the peak average
amplitude is the mean amplitude of these peaks, calculated by summing up the heights of
all peaks and dividing this sum by the total number of peaks for the video. The combi-
nation of these four parameters yields a total of four visual features that describe velocity:
rate of peaks of velocity average, rate of peaks of velocity maximum, mean amplitude of
velocity average, and mean amplitude of velocity maximum (Table 1). The same temporal
pooling was performed for the vertical (up–down) and horizontal (left–right) components
of the U vector, so that each direction entails two variables (peak rate and peak average
amplitude of up, down, left, and right movements, Table 1).
Peak rates and the mean amplitude of peaks capture information on the amount of
movements and their speed, respectively. In particular, a high peak rate is equivalent to
frequent changes of velocity, which is reflected in variable speed and frequent acceleration/
deceleration. Video excerpts with a high peak rate include movements that could give the
impression of hesitant outbursts of motor activity whereas videos with a low peak rate
would portray movements which speed is more constant over time. High mean amplitude
J Nonverbal Behav
123

of peaks reflects faster movements in the video. Because speed also entails a spatial
dimension, videos with a high mean amplitude of peaks also comprise movements that
cover a larger spatial range (for a given unit of time), relative to videos with lower mean
amplitude of peaks. Large values of mean amplitude of peaks also reflect more movement
in the video because velocity is averaged across all frame intervals of each video.
The two parameters extracted in the spatial pooling (velocity average and velocity
maximum) do not particularly reflect movement quality but may give information about the
nature of movement. As stated earlier, velocity average reflects the average velocity of all
pixels in the image whereas maximum velocity reflects the displacement of pixel(s) with
maximum values only. It implies that the latter parameter only considers the fastest
movements, which are likely to be arm and hand movements. Conversely, velocity average
takes into account all the pixels in the image. Since the body occupies a larger portion of
the image, posture shifts that involve the whole body (trunk and shoulders) should con-
tribute towards average velocity to a larger extent (since more ‘‘pixels’’ are moving). An
Fig. 2 Illustration of optical flow fields. Note a Optical flow field U operating on image I0 to produce imageI1. b Illustration of how the optical flow vector U decomposes into an x-component and a y-component
Fig. 3 Illustration of the method to extract visual features
J Nonverbal Behav
123

overview of visual features and their abbreviations is given in Table 1. The method used to
extract visual features is illustrated in Fig. 3.
The number of visual features obtained was further reduced by means of a Principal
Component Analysis using Oblimin rotation with Kaiser normalization. The Principal
Component Analysis yielded four components (Table 2).The first component reflects the
average amplitude of movements and, in particular the amplitude of left and right
movements. Therefore, this component represents the quantity of lateral movements
observed in the overall image. The second component reflects the maximum amplitude of
movements, in particular the amplitude of upward and downward movements. This
component represents the speed of the fastest movements in the video, which are likely to
be movements on the vertical dimension that are localized in a particular area of the image.
The third component reflects the peak rate of upward movements and the peak rate of
movements to the right. The third component may reflect a tendency of upward movements
to also involve a lateral shift to the right of the image (i.e., upward movements are not
strictly vertical). Finally, the fourth component reflects the peak rate of average velocity
and the peak rate of leftward movements. The fourth component suggests that when there
are frequent changes in the speed of pixel displacements across the overall image (captured
by average velocity) they tend to occur towards the left side of the image. The component
scores, calculated using the Anderson-Rubin method, are used in all subsequent analyses
that involved visual features.
Results
(Q1) Are There Specific Auditory and Visual Features Associated with Statements
of Agreement Or Disagreement?
We first investigated whether some of the nonverbal audio–visual features we investigated
are specific to statements of agreement and disagreement. Specificity of expression
Table 1 Overview of visual features and their abbreviations
Abbreviation Feature description
Vel. avg rate Rate of peaks of velocity average
Vel. avg amplitude Mean amplitude* of peaks of velocity average
Vel. max rate Rate of peaks of velocity maximum
Vel. max amplitude Mean amplitude of peaks of velocity maximum
Right rate Rate of peaks of average rightward movements
Right amplitude Mean amplitude of peaks of average rightward movements
Left rate Rate of peaks of average leftward movements
Left amplitude Mean amplitude of peaks of average leftward movements
Down rate Rate of peaks of average downward movements
Down amplitude Mean amplitude of peaks of average downward movements
Up rate Rate of peaks of average upward movements
Up amplitude Mean amplitude of peaks of average upward movements
* In the context of the present research, the term amplitude refers to the magnitude of velocity, whichcorresponds to the speed of movements
J Nonverbal Behav
123

requires significant differences in signal properties between agreement and disagreement,
but also between agreement/disagreement and neutral statements. For visual features, the
four components (Table 2) were entered as dependent variables in a repeated measure
analysis of variance with utterance type as a within-subject factor. Although there is no
overall effect of utterance type on visual features, F(8,12) = 1.21, p = .37, univariate tests
reveal a significant effect of utterance type on the first component, F(2,38) = 2.37,
p \ .05. Within-subject contrasts show that the first component of visual features differ
between agreement (M = .39, SD = 1.4) and neutral excerpts (M = -.26, SD = .72),
F(1,19) = 5.04, p = .04, but only marginally between agreement (M = .39, SD = 1.4)
and disagreement excerpts (M = -.13, SD = .60), F(1,19) = 3.11, p \ .10. An exami-
nation of the means for visual features associated with statements of agreement, dis-
agreement, and neutral (see Table S1 in the supplementary material) indicates that the
amplitude of lateral movements is larger in agreement than in neutral and, to some extent,
disagreement statements. A similar repeated measure ANOVA was conducted this time
with auditory features as dependent variables (velocity of F0, mean F0, mean vocal
intensity, and articulation rate) and showed no effect of utterance type on auditory features,
F(8,12) = 1.42, p = .28. Univariate tests for the effect of statement type on auditory
features are non-significant: F0 velocity: F(2,38) = 1.77, p = .18; Mean F0: F(2,38) =
1.01, p = .37; Mean vocal intensity: F(2,38) = .1, p = .9; Articulation rate:
F(2,38) = 2.14, p = .13.
(Q2) Can Judges Distinguish Between Statements of Agreement and Disagreement
on the Basis of Nonverbal Auditory and Visual Features?
The capacity of human judges to accurately detect agreement and disagreement on the
basis of nonverbal cues should be reflected in the ratings of agreement and disagreement
given to these excerpts. More specifically, people should give higher ratings of agreement
and disagreement to agreement and disagreement excerpts, respectively. We conducted a
3 9 3 multivariate analysis of variance with rating condition (audio-only, video-only, and
audio–video) and utterance type (agreement, disagreement, neutral) as within-subject
Table 2 Pattern matrix of theprincipal component analysis onthe visual features
KMO = .602; Bartlett’s test: v2
(66) = 540.53, p \ .001;cumulative variance explained bythe four components: 77.4 %
Features Components
1 2 3 4
Left amplitude .946
Vel. avg amplitude .908
Right amplitude .863
Vel. max amplitude .865
Vel. max rate -.763
Down rate -.709
Up amplitude .583 -.569
Up Rate .882
Down amplitude .457 -.624 .373
Right rate -.455 .469
Vel. avg rate .792
Left rate -.395 .680
J Nonverbal Behav
123
factors, and with ratings of agreement and disagreement as dependent measures. For this
statistical test, the unit of analysis is the producer of the stimulus (the audio or video
excerpt contributed by each stimulus target, N = 20). Multivariate tests reveal main
effects of rating condition, F(4, 76) = 3.03, p = .02, and utterance type, F(4, 76) = 4.44,
p = .003, on ratings of agreement and disagreement, indicating that perceived agreement
and disagreement differ depending both on the rating condition and on the type of utter-
ance. The interaction effect rating condition by utterance type was also significant, F(8,
152) = 2.76, p = .007.
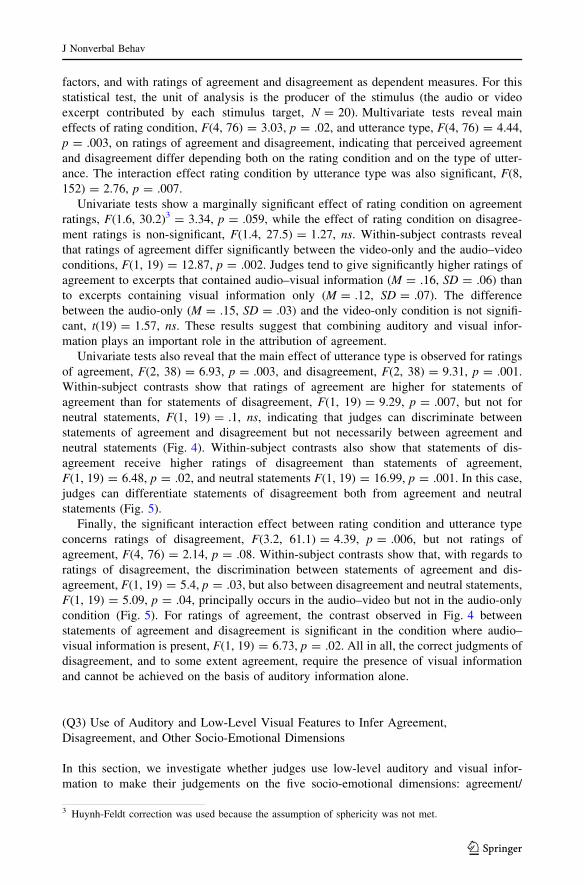
Univariate tests show a marginally significant effect of rating condition on agreement
ratings, F(1.6, 30.2)3 = 3.34, p = .059, while the effect of rating condition on disagree-
ment ratings is non-significant, F(1.4, 27.5) = 1.27, ns. Within-subject contrasts reveal
that ratings of agreement differ significantly between the video-only and the audio–video
conditions, F(1, 19) = 12.87, p = .002. Judges tend to give significantly higher ratings of
agreement to excerpts that contained audio–visual information (M = .16, SD = .06) than
to excerpts containing visual information only (M = .12, SD = .07). The difference
between the audio-only (M = .15, SD = .03) and the video-only condition is not signifi-
cant, t(19) = 1.57, ns. These results suggest that combining auditory and visual infor-
mation plays an important role in the attribution of agreement.
Univariate tests also reveal that the main effect of utterance type is observed for ratings
of agreement, F(2, 38) = 6.93, p = .003, and disagreement, F(2, 38) = 9.31, p = .001.
Within-subject contrasts show that ratings of agreement are higher for statements of
agreement than for statements of disagreement, F(1, 19) = 9.29, p = .007, but not for
neutral statements, F(1, 19) = .1, ns, indicating that judges can discriminate between
statements of agreement and disagreement but not necessarily between agreement and
neutral statements (Fig. 4). Within-subject contrasts also show that statements of dis-
agreement receive higher ratings of disagreement than statements of agreement,
F(1, 19) = 6.48, p = .02, and neutral statements F(1, 19) = 16.99, p = .001. In this case,
judges can differentiate statements of disagreement both from agreement and neutral
statements (Fig. 5).
Finally, the significant interaction effect between rating condition and utterance type
concerns ratings of disagreement, F(3.2, 61.1) = 4.39, p = .006, but not ratings of
agreement, F(4, 76) = 2.14, p = .08. Within-subject contrasts show that, with regards to
ratings of disagreement, the discrimination between statements of agreement and dis-
agreement, F(1, 19) = 5.4, p = .03, but also between disagreement and neutral statements,
F(1, 19) = 5.09, p = .04, principally occurs in the audio–video but not in the audio-only
condition (Fig. 5). For ratings of agreement, the contrast observed in Fig. 4 between
statements of agreement and disagreement is significant in the condition where audio–
visual information is present, F(1, 19) = 6.73, p = .02. All in all, the correct judgments of
disagreement, and to some extent agreement, require the presence of visual information
and cannot be achieved on the basis of auditory information alone.
(Q3) Use of Auditory and Low-Level Visual Features to Infer Agreement,
Disagreement, and Other Socio-Emotional Dimensions
In this section, we investigate whether judges use low-level auditory and visual infor-
mation to make their judgements on the five socio-emotional dimensions: agreement/
3 Huynh-Feldt correction was used because the assumption of sphericity was not met.
J Nonverbal Behav
123

disagreement, dominance/submissiveness, positive/negative valence, arousal, and con-
vincing power. To this end, we computed correlations between the nonverbal features and
ratings performed in the unimodal conditions (video-only and audio-only) and in the
multimodal condition (audio–video).
Video-Only
Table 3 shows that ratings of agreement and disagreement are not significantly related to
visual features when judges are exposed to the videos only. However, there are significant
correlations between the first two components of visual features (amplitude of lateral
movements and amplitude of vertical movements) and ratings of dominance, valence,
arousal, and convincing power. More specifically, the average amplitude of movement
velocity, in particular lateral movement, is negatively related to perceived dominance and
convincing power. Conversely, the maximum velocity and vertical movements (i.e., rapid
movements that are localized in one area of the image) are positively related to perceived
dominance, positive attitude, arousal, and convincing power. The other components of
visual features are unrelated to judgments of socio-emotional dimensions.
Audio-Only
In the ‘‘audio-only’’ condition, ratings of disagreement, dominance, valence, and arousal
heavily rely on auditory features (F0 features in particular). Ratings of agreements are
Fig. 4 Mean ratings of agreement according to utterance type and rating condition
J Nonverbal Behav
123

negatively related to mean intensity and articulation rate. Agreement ratings are also
negatively related to F0 features but the correlations are non-significant. Ratings of dis-
agreement, on the other hand, are strongly related to F0 features and to articulation rate.
This pattern of correlations is also observed for ratings of dominance, negative valence,
and arousal. The attribution of convincing power is poorly related to auditory features.
Audio–Video
The magnitude of the correlations between visual features and socio-emotional judgments
changes substantially when these features are presented in combination with auditory
features (Table 3). The negative correlations between amplitude of lateral movements
(Component 1) and ratings of dominance and convincing power are no longer significant in
the multimodal rating condition. On the other hand, the amplitudes of velocity maximum
and vertical movement have a higher correlation with ratings of disagreement, dominance,
arousal, and convincing power when perceivers are exposed to audio–visual material.
The correlations between auditory features and socio-emotional judgments also change
when audio is perceived along with visual information. In particular, the correlations
between F0 features and judgments of disagreement, dominance, perceived negativity, and
arousal substantially decrease when judges are exposed to audio–visual information. In the
multimodal condition, ratings of agreement are negatively related with F0 features (mean
and velocity). Therefore, F0 features have clearer relationships with judgements of
Fig. 5 Mean ratings of disagreement according to utterance type and rating condition
J Nonverbal Behav
123

agreement when they are perceived simultaneously with visual features. Finally, the cor-
relations between vocal intensity, articulation rate and socio-emotional judgments are no
longer significant in the multimodal rating condition.
Overall, these results indicate that the combined presentation of auditory and visual
features influences how nonverbal features relate to the judgements of socio-emotional
dimensions. The addition of auditory information strongly influences the relation between
the amplitude of maximum velocity (in particular, movements in the vertical dimension)
and ratings of arousal, dominance, and disagreement (Fig. 6). This increase is observed for
Table 3 Correlations between nonverbal features and judgments made in the unimodal and multimodalrating conditions
Condition Visualfeatures
Agr Dis Dom Sub Pos Neg Aro Con
Video-only C1 -.04 -.14 -.32* .35** .04 -.17 -.09 -.35**
Audio–video
.01 -.06 -.14 .10 .04 -.05 .11 -.08
Video-only C2 -.01 .22 .32* 2.40** .29* -.04 .39** .47**
Audio–video
-.15 .37** .57** 2.41** .11 .17 .53** .55**
Video-only C3 -.03 .14 -.10 .11 -.12 .14 -.10 -.06
Audio–video
-.06 .03 -.15 .18 -.12 .08 -.15 -.19
Video-only C4 -.13 .14 .12 -.20 -.05 .05 .06 .21
Audio–video
-.06 .17 .11 -.05 -.05 .12 .19 .22
Auditoryfeatures
Audio-only F0 mean -.24 .73** .58** -.13 -.11 .56** .85** -.18
Audio–video
2.26* .50** .17 .01 -.14 .33** .65** .00
Audio-only F0 velocity -.22 .71** .52** -.14 -.05 .56** .80** -.08
Audio–video
2.33** .54** .26* -.09 -.24 .42** .52** .07
Audio-only Meanintensity
2.26* .18 .27* 2.39** -.08 .00 .36** .15
Audio–video
-.04 .06 -.06 -.08 .17 -.10 .23 -.01
Audio-only ArticulationRate
2.39** .41** .12 -.01 2.30* .38** .37** -.20
Audio–video
.11 .09 .17 -.10 .13 .03 .20 .21
Agr agreement, dis disagreement, dom dominance, sub submissiveness, pos positivity, neg negativity, aroarousal, con convincing power. C1 Mean amplitude of peaks of velocity average and speed of lateralmovements, C2 Mean amplitude of peaks of velocity maximum and speed of vertical movements, C3 Rateof peaks of upward and rightward movements, C4 Rate of peaks of velocity average and leftwardsmovements
Significant correlations are in bold face type
* p \ .05, ** p \ .01
J Nonverbal Behav
123

the visual features that are most correlated with F0 (Table S2, supplementary material),
suggesting that perceivers integrate the correlated audio–visual information in order to
make their judgements. Interestingly, movements on the horizontal axis appear to lose their
importance in the ratings of dominance when audio information is present. It is possible
that judges used horizontal movements in the strictly visual condition, but when auditory
information is presented they focus their attention on the visual features that are most
correlated with auditory features.
(Q4) Is the Relationship Between Audio–Visual Features and Agreement/Disagreement
Mediated by Ratings of Socio-Emotional Dimensions?
We further examined whether the observed associations between nonverbal features and
ratings of agreement and disagreement are mediated by perceived dominance, valence, and
arousal. In this way, we can evaluate whether low-level auditory and visual features advertise
agreement and disagreement directly, or indirectly via their association with socio-emotional
dimensions. For the following mediation analyses, we retained the nonverbal features that are
most correlated with ratings of agreement and disagreement. The mediation models only
concern ratings made in the audio–video conditions, as it is the condition in which statements
of disagreement are best discriminated from agreement and neutral statements (see
above). The independent variables are: F0 velocity and the amplitude of maximum velocity/
amplitude of vertical movements (the second component in the Principal Component Ana-
lysis presented in Table 2). Other visual components are not included in the mediation models
because they are not correlated to ratings of agreement and disagreement in the audio–video
Unimodal features
C1
C2
C3
C4
Velocity F0
Mean F0
Mean intensity
Articulation rate
Agr
eem
ent
Dis
agre
emen
t
Dom
inan
ce
Sub
mis
sion
Pos
itivi
ty
Neg
ativ
ity
Aro
usal
Con
vinc
ing
pow
er
Multimodal features
Agr
eem
ent
Dis
agre
emen
t
Dom
inan
ce
Sub
mis
sion
Pos
itivi
ty
Neg
ativ
ity
Aro
usal
Con
vinc
ing
pow
er
−0.6
−0.4
−0.2
0
0.2
0.4
0.6
Fig. 6 Heatmap of the correlations between the audio–visual features and ratings of socio-emotionaldimensions in the unimodal and multimodal presentation conditions
J Nonverbal Behav
123

condition. A separate model was made for each independent variable (2 mediation models in
total). The three mediator variables are: Perceived dominance/submission, perceived
valence, and perceived arousal. The dependent variable in both models is the judgement of
agreement/disagreement. The ratings used in the mediation analyses are the raw judgements4
taken from the audio–visual rating condition.
The mediation models of the effects of visual and auditory features on perceived
agreement/disagreement through perceived dominance, valence, and arousal are presented
in Table 4 and in Fig. 7. Model 1 (visual features) is statistically significant and explains
82 % of the variance in ratings of agreement/disagreement, [F(4,55) = 37.26, p \ .001,
R2 = .82]. The indirect effect of visual features on perceived agreement/disagreement is
significantly different from zero, indicating that the influence of vertical movement speed
on judgments of agreement and disagreement is completely mediated by ratings of socio-
emotional dimensions5. In particular, perceived dominance and arousal are the only
mediators of that relationship. As indicated by the contrast analyses presented in Table 4,
the effects of these two mediators do not significantly differ from each other.
Model 2 (velocity of F0) is statistically significant and explains 82 % of the variance in
ratings of agreement and disagreement, [F(4,55) = 62.02, p \ .001, R2 = .82]. The
indirect effect of F0 velocity on perceived agreement/disagreement is significantly dif-
ferent from zero, indicating that the influence of F0 velocity on judgments of agreement
and disagreement is completely mediated by ratings of socio-emotional dimensions. The
analysis also shows that perceived valence and arousal are the only mediators of that
relationship. As indicated by the contrast analyses presented in Table 4, the effects of these
two mediators do not significantly differ from each other, but the indirect effects of valence
and arousal both differ from that of dominance.
In both models, perceived arousal is a significant mediator of the relationship between
nonverbal behavior and judgment of agreement/disagreement. The mediation by perceived
dominance and valence, however, depends on whether we consider visual or auditory
features. Perceived dominance mediates the relationship between visual features (maxi-
mum amplitude of movements and amplitude of movements on the vertical dimension) and
perceived agreement/disagreement; whereas perceived valence mediates the relationship
between pitch velocity (auditory feature) and judgments of agreement/disagreement. This
result suggests that perceivers derive different types of information from visual and
auditory features in order to make inferences of agreement and disagreement.
Discussion
The present study shows that raters are able to distinguish statements of agreement from
disagreement on the basis of low-level nonverbal features. The impact of these features is
much clearer for the perception of disagreement than for the perception of agreement, as
4 Raw judgements were made on single scales for agreement/disagreement, dominance/submission, andpositive/negative valence.5 The significance of the indirect effects is tested using the ‘‘product-of-coefficients’’ approach and the‘‘distribution of the product’’ approach (MacKinnon et al. 2004). In the latter approach, an empiricalapproximation of the distribution of the indirect effect is built using bootstrapping and is used to createconfidence intervals for the indirect effect (also described in Preacher and Hayes 2004). This method isrecommended over the Sobel test (Sobel 1982) or the causal steps approach (Baron and Kenny 1986)because it has higher statistical power while keeping the rate of Type I error within reasonable limits(MacKinnon et al. 2004).
J Nonverbal Behav
123

the latter cannot be discriminated from neutral statements. Visual features are most
influential when they combine with auditory features, a result that supports earlier findings
that multimodal integration is an important factor in social perception (Banziger et al.
2012; deGelder and Vroomen 2000). Our results also suggest that agreement and dis-
agreement are neither encoded nor communicated directly by low-level visual or auditory
features. Instead, the influence of low-level nonverbal cues on people’s judgments is likely
to be indirect, as their effect on perceived agreement and disagreement is completely
mediated by ratings of other socio-emotional dimensions such as arousal, valence, and
dominance. By using an automatic method for movement measurements, we were able to
isolate dynamic visual cues important to judgments of disagreement, dominance, arousal,
and convincing power. These cues—the maximum movement velocity and the speed of
movement on the vertical dimension—are virtually impossible to measure (in a reliable
way) with traditional manual coding of nonverbal behavior. Therefore, the use of auto-
mated techniques appears to be extremely useful to study the effect of expressivity on
social perception. We organize the following discussion along the four main research
questions on the relationship between statements of agreement/disagreement and low-level
audio–visual features.
Table 4 Mediation of the effect of visual and auditory features on perceived agreement and disagreementthrough perceived dominance, valence, and arousal
Models Indirect effects Bias corrected bootstrap CI 95 %
Effect s.e. Z Lower limit CI Upper limit CI
M1. Visual features (C2)
Dominance .013 .006 2.23* .003 .070
Valence .003 .011 .26 -.019 .025
Arousal .023 .007 3.27** .012 .039
Total .039 .01 .07
Contrasts
Dominance versus valence .01 -.015 .032
Dominance versus arousal -.011 -.031 .005
Valence versus arousal -.02 -.043 .004
M2. F0 velocity
Dominance .003 .002 1.28 -.001 .009
Valence .02 .007 2.79** .006 .031
Arousal .014 .004 3.16** .007 .024
TOTAL .037 .017 .052
Contrasts
Dominance versus valence -.017 -.028 -.004
Dominance versus arousal -.011 -.021 -.003
Valence versus arousal .006 -.01 .02
Estimates of the indirect effects of visual and auditory features through perceived dominance, valence, andarousal. Visual features = mean amplitude of peaks of velocity maximum and speed of vertical movements(Component 2 in the Principal Component Analysis, see Table 2). CI confidence interval; 5,000 bootstrapsamples. ** p \ .01; * p \ .05
J Nonverbal Behav
123

Are There Specific Visual Or Auditory Features Associated with Statements
of Agreement and Disagreement?
The present data do not support the idea that there are low-level nonverbal features specific
to agreement and disagreement, as agreement, disagreement, and neutral statements did not
differ with respect to the nonverbal features investigated in this study. It is possible that
these low-level features represent individual-specific patterns of behavior rather than
utterance-specific patterns. Dynamic aspects of nonverbal behavior may indeed reflect
stable individual differences in behavioral style (Cohn et al. 2002). It is not excluded that
other features, not measured in this study, could be associated with agreement and dis-
agreement and influenced the ratings. In addition, the weak connections between nonverbal
features and statements of agreement and disagreement may be due to the fact that our
excerpts were selected on the basis of verbal statements only. It is possible that the
nonverbal cues would be less pronounced in such cases because the message meaning is
contained in the verbal component. Several studies indeed showed that the accuracy of
inferences about other’s thoughts and feelings relies more on the target’s words than on
their nonverbal behavior (Gesn and Ickes 1999; Hall and Schmid Mast 2007; Zaki et al.
2009), suggesting that the bulk of message transmission relies on symbolic rather than non-
symbolic components. It is possible that purely nonverbal expressions of agreement and
disagreement carry symbolic information less ambiguously (e.g., emblems) and future
research should investigate low-level dynamic features associated with these cues. The
present results indicate that low-level auditory and visual features accompanying verbal
statements do not encode information related to agreement and disagreement and we will
argue later that their role in communication is to influence the evaluation of more fun-
damental socio-emotional dimensions such as dominance, arousal, and valence.
Fig. 7 Total, direct, and indirect effects of auditory and visual features on perceived agreement anddisagreement through perceived dominance, valence, and arousal. Note This graph presents the effects oftwo separate models. M1 model 1 with visual features as independent variable, M2 model 2 with F0 velocityas independent variable. Total effects are shown in brackets. Visual features = mean amplitude of peaks ofvelocity maximum and speed of vertical movements (Component 2 in the Principal Component Analysis,see Table 2). ** p \ .01; * p \ .05
J Nonverbal Behav
123
Can Judges Distinguish Between Excerpts of Agreement and Disagreement
on the Basis of Nonverbal Auditory and Visual Features?
When presented with auditory information alone, judges were unable to discriminate
between agreement and disagreement. It is only when visual information was present that
judges could distinguish agreement from disagreement statements. While judges were
unable to discriminate agreement from neutral utterances, statements of disagreement were
judged appropriately (they were discriminated from both agreement and neutral state-
ments), in particular when auditory and visual information was presented together. Con-
sequently, we can conclude that visual information is particularly important in the
perception of disagreement (and to some extent agreement) and that the combination of
auditory and visual information helps in the discrimination of disagreement from agree-
ment and neutral utterances.
The finding that statements of disagreement were particularly well discriminated may be
explained by the fact that competitive political discussions are appropriate contexts for
such statements. Hence, we may expect expressions of disagreement to be intense in such a
context. Indeed, interactions between men are often competitive (Eibl-Eibesfeldt 1989;
Mazur and Booth 1998), and expressing disagreement may be a way to achieve dominance
over the interlocutor (Mazur 2005). This is different for expressions of agreement, which,
if too noticeable, may be perceived as submissive and undermine the debater’s credibility
as a strong defender of societal opinions.
What Features Do People Use to Infer Agreement and Disagreement?
The observation that attributions of disagreement tended to be more accurate when visual
information was available to the perceivers suggests that agreement and disagreement are
mostly signalled using the visual channel, supporting the importance of the visual modality
in the evaluation of political candidates (Patterson et al. 1992). Nonetheless, this inter-
pretation is partially true, as it appeared that in the video-only condition no visual feature
clearly correlated with ratings of agreement and disagreement. In the audio–video con-
dition, however, we observed that the amplitude of maximum velocity and the speed of
vertical movements were positively associated with perceived disagreement. This suggests
two conclusions: First, the visual information used by perceivers to infer disagreement is
the speed of the fastest movements observed in the video (reflected by maximum values of
velocity), in particular, movements performed on the vertical dimension. Second, because
the positive associations between visual features and ratings of disagreement were
observed in the audio–video and not in the video-only condition, judges must use a
combination of auditory and visual features in their inferences of disagreement. The fact
that judgments of agreement are poorly related to visual features despite the association
between lateral movements and statements of agreement suggests that perceivers do not
utilize low-level visual cues to evaluate agreement in interlocutors. It is not excluded that a
qualitative analysis of head, face, and body movements will reveal a larger effect of the
visual channel on ratings of agreement.
Visual features were significantly correlated with the perception of socio-emotional
dimensions, dominance and arousal in particular. Perceived dominance was negatively
correlated with the mean amplitude of peaks of velocity averages and speed of lateral
movement (Component 1 of the principal component analysis on visual features), but it
was positively correlated with the mean amplitude of peaks of velocity maximum and
speed of vertical movements (Component 2). These results suggest that people showing
J Nonverbal Behav
123

lateral posture shifts (reflected in Component 1) are perceived as being less dominant. This
seems at odds with the finding that expansiveness of posture is usually related to domi-
nance (Hall et al. 2005; Tiedens and Fragale 2003). In our opinion, this result does not
contradict the link between dominance and expansiveness previously observed in the
literature because body expansiveness most probably reflects movements that make an
individual appear larger (extension of the arms, legs, trunk), rather than reflect the quantity
of movements in general. This is quite different from posture shifts in which the body
moves laterally without modifying its overall appearance. Our measure of amplitude of
peaks of velocity average captures the latter aspect and not expansiveness as operation-
alized in the nonverbal behavior literature (e.g., Tiedens and Fragale 2003).
The positive correlation between Component 2 and ratings of dominance suggests that
fast movements on the vertical dimension are perceived as reflecting high control and
influence over other individuals. An ethological interpretation of these results would
suggest that lateral posture shifts are intention movements reflecting the tendency to flee
(cf. their connection with low perceived dominance), whereas fast movements on the
vertical dimensions are intention movements reflecting a tendency to attack (cf. their
connection with high perceived dominance). More research on the relationship between
action tendencies like attack and avoidance and movement dynamics is called for in
support to these claims. Our results nonetheless suggest that perceivers react differently to
different dynamic aspects of movement quality, as fast and discrete movements on the
vertical dimension is positively related to perceived dominance, while overall speed of
movement on the horizontal dimension is inversely associated with dominance judgments.
In the auditory domain, F0 features were positively related to ratings of disagreement;
whereas articulation rate correlated with both agreement and disagreement. Mean intensity
was negatively related to perceived agreement. These results suggest that increased acti-
vation in the vocal channel (higher F0, higher intensity, and higher articulation rate) leads
to higher, though not necessarily more accurate, judgments of disagreement, supporting
earlier evidence that vocal arousal is involved in conflicting situations (Roth and Tobin
2010; Schubert 1986). The observation that judges could not differentiate between the
three types of statements on the basis of auditory signals alone may result from the
filtering. Indeed, a limitation of this study is that removing verbal information may also
have removed important cues in the evaluation of agreement and disagreement. It is worth
mentioning that despite the filtering, judges still showed high reliability in their ratings of
agreement and disagreement.
All in all, our results suggest that low-level auditory features may not function to
transfer information about agreement and disagreement but rather to influence perceivers
into evaluating the target as being more dominant, more positive/negative, or more
emotionally aroused. This possibility is corroborated by the finding that auditory features
are neither specific to statements of agreement nor disagreement, although we would
expect it to be the case if semantic information were redundantly encoded in low-level
auditory features. In addition, auditory features alone strongly influenced perceivers in
judging disagreement, albeit incorrectly, via perceived dominance and arousal. These
observations therefore suggest that low-level auditory features may function to influence
perceivers’ judgements rather than reliably communicate information about agreement and
disagreement, supporting the idea that nonverbal involvement plays a role in social control
and social influence (Bachorowski and Owren 2001; Edinger and Patterson 1983). Further
research should investigate the relative importance of other auditory features in the transfer
of information and the influence of these features on the perception of agreement/
disagreement.
J Nonverbal Behav
123
In the multimodal presentation condition, the associations between low-level features
and socio-emotional ratings were different than in the unimodal presentation conditions.
The relationships between auditory features and social judgments were still substantial
but were nonetheless reduced in comparison with the unimodal condition. On the other
hand, the relationships between visual features and social judgments increased, sug-
gesting an additive effect of auditory features on visual features. More specifically, the
effect of fast and distinctive vertical movements appeared to have a higher impact on
person perception when they are perceived along with auditory information than when
they are perceived alone. Our results are therefore compatible with the idea of a
potentiation of visual information by auditory information, as potentiation results in a
stronger association between the signal and its ‘‘interpretation’’ than would be observed
from signalling with a single channel (vanKampen and Bolhuis 1993). Moreover, this
potentiation leads to more accurate judgments of disagreement but not necessarily
agreement. Previous experimental research has shown that the perception of multimodal
stimuli facilitates information processing evident in reduced processing time (Pourtois
et al. 2000) and results in more accurate emotion classification (Kreifelts et al. 2007).
The present study shows that such facilitation can also be demonstrated with more
ecological and dynamic social stimuli.
Do Agreement and Disagreement Ratings Rely on the Perception of More Fundamental
Socio-Emotional Dimensions?
We showed that the influence of low-level audio–visual features on evaluations of
agreement and disagreement is only indirect. The relationship between amplitude of
maximum velocity/amplitude of vertical movements and ratings of agreement/disagree-
ment is completely mediated by perceived dominance and arousal, and the relationship
between F0 velocity and ratings of agreement/disagreement is mediated by perceived
valence and arousal. This suggests that, rather than explicitly communicating agreement
and disagreement, low-level audio–visual features act as indirect cues. This finding is in
line with the ecological approach to social perception (McArthur and Baron 1983;
Montepare and Dobish 2003) in that the perception of socio-emotional dimensions
encourages impression formation about social attitudes like agreement and disagreement.
Finally, our results suggest that auditory and visual features have their indirect effects on
the perception of agreement and disagreement through different dimensions: The influence
of prosodic features occurs through its effect on valence judgments while the influence of
speed of vertical movements occurs through its effect on dominance judgments. This result
corroborates the idea that different components of multimodal expressions convey multiple
messages (Ay et al. 2007; Johnstone 1996). Further research into the roles of different
components of multimodal signals is needed to address the interaction between informa-
tion transfer and social influence in human communication.
Acknowledgments This research was funded by the European Network of Excellence SSPNet (Grantagreement No. 231287). We would like to thank Konstantinos Bousmalis and Maja Pantic for their col-laboration in the rating study. Thanks also go to the Swiss Centre for Affective Sciences that providedsupport in data analysis and writing of the manuscript.
Conflict of interest The authors declare that they have no conflict of interest.
J Nonverbal Behav
123

Appendix 1: Definitions of Socio-Emotional Dimensions
Participants were given some time prior to the study to become familiar with the definitions
of the dimensions under study. They also had the definitions along with them in case they
needed it during the rating session. Definitions:
Agreement: an attitude that reflects harmony or accordance in opinion or feeling.
Disagreement: an attitude that reflects a lack of consensus or approval about an opinion
or feeling.
Dominance: a disposition or a tendency to exert influence and control over other
individuals and life events in general.
Submissiveness: a disposition or a tendency to be influenced and controlled by other
individuals or by events.
Positive–Negative: refers to the pleasant or unpleasant character of the attitude
expressed in the excerpt.
Emotional arousal: refers to the degree of physical and physiological activation
associated with the emotional state of the individual.
Convincing power: refers to the extent to which the statement can provoke a change of
opinion, feeling, or attitude in an interlocutor6.
Appendix 2: Method for the Estimation of Optical Flow
Optical flow estimation techniques rely on the fact that the local image appearance around
a particular location does not change drastically between two consecutive frames. The
local image appearance is generally described by the pixel intensity values around the point
under consideration or by the image gradient around this point. Most optical flow esti-
mation techniques find the optical flow by minimizing a function that comprises two terms:
(1) a term that measures how well the second image is reconstructed by transforming the
first image using the flow field and (2) a term that promotes the selection of ‘‘simple’’
optical flow fields. In particular, the functions generally have the form of a minimization
over the flow field U (Horn and Schunck 1981):
minD ðI0; I1; UÞ þ kRðUÞ:
Herein, D (I0, I1, U) is an error function that measures the difference between image I1
and image I0 transformed by flow field U; for instance, a sum of squared errors may be
employed. The function R (U) is a regularizer that promotes smoothness of the optical flow
field U, i.e. that penalizes solutions in which neighbouring locations have drastically
different flow estimates. The scalar k is a free parameter that weighs the regularizer against
the error function.
In this study, we employed an optical flow estimation method that uses a sum of
absolute differences as error function (Werlberger et al. 2010):
6 Perceived convincing power refers to the impression by perceivers that the statement of the target isconvincing, not to the impression that the target, as a person, has a lot of convincing power. In this sense, itrelates to the performance of the speaker rather than to his personality or to his social role.
J Nonverbal Behav
123
D I0; I1; Uð Þ ¼ZZjI0 x; yð Þ � I1 Ux x; yð Þ; Uy x; yð Þ
� �jdxdy;
where the integrals are summing the errors over the entire image. In the equation, the
optical flow at location (x, y) is represented by the x-component Ux of the optical flow
vector and by the y-component Uy of the optical flow vector. This decomposition of the
optical flow vector is illustrated in the panel B of Fig. 2.
The regularizer is implemented by a function that measures the (weighted) total vari-
ation of the optical flow field:
R Uð Þ ¼ZZ ZZ
W x; y; x0; y0ð Þ jUx x; yð Þ � Ux x0; y0ð Þ �þj jUy x0; y0ð Þ�
�Uy x0; y0ð Þj��dx dy dx0 dy0;
where again, the integrals are over the entire image. In the above equation, � is a small
constant and |q|� denotes the so-called Huber loss (Hube 1964):
qj jr ¼ q2=2r if qj j � r ; qj j � r=2 otherwise:
In the above equation, the weights W(x, y, x0, y0) are computed based on the spatial
distance between points (x, y) and (x0, y0) and based on the pixel intensity differences
between those points. Specifically, the weights are large for nearby points with a similar
color, but small for points that are far away or that have a dissimilar color (much like an
anisotropic filter). As a result, the regularizer promotes optical flow fields that are locally
smooth, but smoothness is not promoted across edges in the image (as edges suggest a
different object with a potentially different optical flow).
Hence, the advantage of the optical flow estimator we used is that it promotes
smoothness, whilst allowing for discontinuities in the optical flow field near edges in the
image. The optical flow estimator outlined above is presently one of the best-performing
algorithms on a widely used benchmark data set for evaluation of optical flow algorithms
(Werlberger et al. 2010; Baker et al. 2011).
References
Altmann, J. (1974). Observational study of behavior: Sampling methods. Behaviour, 44, 227–267.Archer, D., & Akert, R. M. (1977). Words and everything else: Verbal and nonverbal cues in social
interpretation. Journal of Personality and Social Psychology, 35(6), 443–449.Argyle, M. (1988). Bodily communication. London: Routledge.Argyle, M., & Dean, J. (1965). Eye-contact, distance and affiliation. Sociometry, 28(3), 289–304.Ay, N., Flack, J. C., & Krakauer, D. C. (2007). Robustness and complexity co-constructed in multimodal
signalling networks. Philosophical Transactions of the Royal Society B, 362, 441–447.Bachorowski, J.-A., & Owren, M. J. (1995). Vocal expression of emotion: Acoustic properties of speech are
associated with emotional intensity and context. Psychological Science, 6(4), 219–224.Bachorowski, J.-A., & Owren, M. J. (2001). Not all laughs are alike: Voiced but not unvoiced laughter
readily elicits positive affect. Psychological Science, 12(3), 252–257.Baker, S., Scharstein, D., Lewis, J. P., Roth, S., Black, M., & Szeliski, R. (2011). A database and evaluation
methodology for optical flow. International Journal of Computer Vision, 92(1), 1–31.Banse, R., & Scherer, K. R. (1996). Acoustic profiles in vocal emotion expression. Journal of Personality
and Social Psychology, 70(3), 614–636.Banziger, T., Mortillaro, M., & Scherer, K. R. (2012). Introducing the Geneva multimodal expression corpus
for experimental research on emotion perception. Emotion, 12(5), 1161–1179.
J Nonverbal Behav
123

Baron, R. M., & Kenny, D. A. (1986). The moderator-mediator variable distinction in social psychologicalresearch: conceptual, strategic, and statistical considerations. Journal of Personality and Social Psy-chology, 51(6), 1173–1182.
Barrett, H. C., Todd, P. M., Miller, G. F., & Blythe, P. W. (2005). Accurate judgments of intention frommotion cues alone: A cross-cultural study. Evolution and Human Behavior, 26(4), 313–331.
Blake, R., & Shiffrar, M. (2007). Perception of human motion. Annual Review of Psychology, 58, 47–73.Blakemore, S.-J., & Decety, J. (2001). From the perception of action to the understanding of intention.
Nature Reviews Neuroscience, 2(8), 561–567.Boersma, P. (2001). Praat, a system for doing phonetics by computer. Glot International, 5(9/10), 341–345.Borkenau, P., Mauer, N., Riemann, R., Spinath, F. M., & Angleitner, A. (2004). Thin slices of behavior as
cues of personality and intelligence. Journal of Personality and Social Psychology, 86(4), 599–614.Bousmalis, K., Mehu, M., & Pantic, M. (2013). Towards the automatic detection of spontaneous agreement
and disagreement based on nonverbal behavior: A survey of related cues, databases, and tools. Imageand Vision Computing, 31, 203–221.
Brown, W. M., Cronk, L., Grochow, K., Jacobson, A., Liu, C. K., Popovic, Z., et al. (2005). Dance revealssymmetry especially in young men. Nature, 438(7071), 1148–1150.
Brown, W. M., Palameta, B., & Moore, C. (2003). Are there nonverbal cues to commitment? An exploratorystudy using the zero-acquaintance video presentation paradigm. Evolutionary Psychology, 1, 42–69.
Brunswik, E. (1956). Perception and the representative design of psychological experiments. Berkeley:University of California Press.
Bull, P. E. (1987). Posture and gesture. Oxford: Pergamon Press.Burns, K. L., & Beier, E. G. (1973). Significance of vocal and visual channels in the decoding of emotional
meaning. Journal of Communication, 23(1), 118–130.Camras, L. A. (1980). Children’s understanding of facial expressions used during conflict encounters. Child
Development, 51(3), 879–885.Castellano, G., Mortillaro, M., Camurri, A., Volpe, G., & Scherer, K. (2008). Automated analysis of body
movement in emotionally expressive piano performances. Music Perception, 26(2), 103–119.Cohn, J. F., Schmidt, K., Gross, R., & Ekman, P. (2002). Individual differences in facial expression:
Stability over time, relation to self-reported Emotion, and ability to inform person identification. InProceedings of the 4th IEEE International Conference on Multimodal Interfaces, (pp. 491–496). IEEEComputer Society.
Collignon, O., Girard, S., Gosselin, F., Roy, S., Saint-Amour, D., Lassonde, M., et al. (2008). Audio–visualintegration of emotion expression. Brain Research, 1242, 126–135.
Dael, N., Mortillaro, M., & Scherer, K. R. (2012). The body action and posture coding system (BAP):Development and reliability. Journal of Nonverbal Behavior, 36(2), 97–121.
Darwin, C. (1872). The expression of the emotions in man and animals. London: John Murray.de Jong, N., & Wempe, T. (2009). Praat script to detect syllable nuclei and measure speech rate auto-
matically. Behavior Research Methods, 41(2), 385–390.deGelder, B., & Vroomen, J. (2000). The perception of emotions by ear and by eye. Cognition and Emotion,
14(3), 289–311.Edinger, J. A., & Patterson, M. L. (1983). Nonverbal involvement and social control. Psychological Bulletin,
93(1), 30–56.Eibl-Eibesfeldt, I. (1989). Human ethology. New York: Aldine De Gruyter.Ekman, P. (1983). Emotions revealed: Recognizing faces and feelings to improve communication and
emotional life. New York: Henry Holt and Company.Ekman, P. (1985). Telling lies: Clues to deceit in the market place, marriage, and politics. New York:
Norton.Ekman, P., Friesen, W. V., O’Sullivan, M., & Scherer, K. (1980). Relative importance of face, body, and
speech in judgments of personality and affect. Journal of Personality and Social Psychology, 38(2),270–277.
Ekman, P., & Oster, H. (1979). Facial expressions of emotion. Annual Review of Psychology, 30, 527–554.Fiske, S. T., Cuddy, A. J. C., & Glick, P. (2007). Universal dimensions of social cognition: Warmth and
competence. Trends in Cognitive Sciences, 11(2), 77–83.Fontaine, J. R. J., Scherer, K. R., Roesch, E. B., & Ellsworth, P. C. (2007). The world of emotions is not
two-dimensional. Psychological Science, 18(12), 1050–1057.Frodi, A. M., Lamb, M. E., Leavitt, L. A., & Donovan, W. L. (1978). Fathers’ and mothers’ responses to
infant smiles and cries. Infant Behavior and Development, 1, 187–198.Funder, D. C., & Sneed, C. D. (1993). Behavioral manifestations of personality: An ecological approach to
judgmental accuracy. Journal of Personality and Social Psychology, 64(3), 479–490.
J Nonverbal Behav
123

Gale, A., Kingsley, E., Brookes, S., & Smith, D. (1978). Cortical arousal and social intimacy in the humanfemale under different conditions of eye contact. Behavioral Processes, 3, 271–275.
Germesin, S., & Wilson, T. (2009). Agreement detection in multiparty conversation. In Proceedings of the2009 international conference on multimodal interfaces (pp. 7–14).
Gesn, P. R., & Ickes, W. (1999). The development of meaning contexts for empathic accuracy: Channel andsequence effects. Journal of Personality and Social Psychology, 77(4), 746–761.
Ghazanfar, A. A., & Logothetis, N. K. (2003). Facial expressions linked to monkey calls. Nature, 423,937–938.
Gibson, J. J. (1950). The perception of the visual world. Boston: Houghton Mifflin.Gifford, R. (1981). Sociability: Traits, settings, and interactions. Journal of Personality and Social Psy-
chology, 41(2), 340–347.Gifford, R. (1994). A lens-mapping framework for understanding the encoding and decoding of interper-
sonal dispositions in nonverbal behavior. Journal of Personality and Social Psychology, 66(2),398–412.
Goldenthal, P., Johnston, R. E., & Kraut, R. E. (1981). Smiling, appeasement, and the silent bared-teethdisplay. Ethology and Sociobiology, 2, 127–133.
Grafe, T. U., & Wanger, T. C. (2007). Multimodal signaling in male and female foot-flagging frogs(StauroisGuttatusRanida): An alerting function of callings. Ethology, 113(8), 772–781.
Grammer, K. (1989). Human courtship behavior: Biological basis and cognitive processing. In A. E. Rasa,C. Vogel, & E. Voland (Eds.), The sociobiology of sexual and reproductive strategies (pp. 147–169).London: Chapman & Hall.
Grammer, K. (1993). Signale der liebe. Die biologischen gesetze der partnerschaft. Hamburg: Hoffmannund Campe.
Grammer, K., Honda, M., Juette, A., & Schmitt, A. (1999). Fuzziness of nonverbal courtship communicationunblurred by motion energy detection. Journal of Personality and Social Psychology, 77(3), 509–524.
Gross, M. M., Crane, E. A., & Fredrickson, B. L. (2010). Methodology for assessing bodily expression ofemotion. Journal of Nonverbal Behavior, 34, 223–248.
Hadar, U., Steiner, T. J., & Rose, F. C. (1985). Head movement during listening turns in conversation.Journal of Nonverbal Behavior, 9(4), 214–228.
Hall, E. T. (1968). Proxemics. Current Anthropology, 9(2/3), 83–108.Hall, J. A., Coats, E. J., & LeBeau, L. S. (2005). Nonverbal behavior and the vertical dimension of social
relations: A meta-analysis. Psychological Bulletin, 131(6), 898–924.Hall, J. A., & Schmid Mast, M. (2007). Sources of accuracy in the empathic accuracy paradigm. Emotion,
7(2), 438–446.Hess, U., Blairy, S., & Kleck, R. E. (2000). The influence of facial emotion displays, gender, and ethnicity
on judgments of dominance and affiliation. Journal of Nonverbal Behavior, 24(4), 265–283.Hillard, D., Ostendorf, M., & Shriberg, E. (2003). Detection of agreement vs. disagreement in meetings:
Training with unlabeled data. In Proceedings of the 2003 conference of the North-American Associ-ation for Computational Linguistics on Human Language Technology: Companion volume of theproceedings of HLT-NAACL 2003-short papers-volume 2 (pp. 34–36).
Horn, B. K. P., & Schunck, B. G. (1981). Determining optical flow. Artificial Intelligence, 17, 185–203.Huber, P. J. (1964). Robust estimation of a location parameter. Annals of Statistics, 53, 73–101.Johnstone, R. A. (1996). Multiple displays in animal communication: ‘‘Backup signals’’ and ‘‘multiple
messages’’. Philosophical Transactions of the Royal Society of London. Series B, Biological sciences,351(1337), 329–338.
Keller, E., & Tschacher, W. (2007). Prosodic and gestural expression of interactional agreement. In A.Esposito (Ed.), Lecture notes in computer sciences (Vol. 4775, pp. 85–98). Berlin/Heidelberg:Springer.
Knutson, B. (1996). Facial expressions of emotion influence interpersonal trait inferences. Journal ofNonverbal Behavior, 20(3), 165–182.
Koppensteiner, M., & Grammer, K. (2010). Motion patterns in political speech and their influence onpersonality ratings. Journal of Research in Personality, 44(3), 374–379.
Kreifelts, B., Ethofer, T., Grodd, W., Erb, M., & Wildgruber, D. (2007). Audiovisual integration of emo-tional signals in voice and face: an event-related fMRI study. Neuroimage, 37(4), 1445–1456.
Lehner, P. N. (1996). Handbook of ethological methods (Vol. 2). Cambridge, UK: Cambridge UniversityPress.
MacKinnon, D. P., Lockwood, C. M., & Williams, J. (2004). Confidence limits for the indirect effect:Distribution of the product and resampling methods. Multivariate Behavioral Research, 39(1), 99–128.
Martin, P., & Bateson, P. (1993). Measuring behavior: An introductory guide (Vol. 2). Cambridge:Cambridge University Press.
J Nonverbal Behav
123
Mazur, A. (2005). Biosociology of dominance and deference. Lanham, Maryland: Rowman & Littlefield.Mazur, A., & Booth, A. (1998). Testosterone and dominance in men. Behavioral and Brain Sciences, 21(3),
353–363.McArthur, L. Z., & Baron, R. M. (1983). Toward an ecological theory of social perception. Psychological
Review, 90(3), 215–238.Mehrabian, A. (1969). Significance of posture and position in the communication of attitude and status
relationships. Psychological Bulletin, 71(5), 359–372.Mehrabian, A. (1971). Silent messages. Belmont, CA: Wadsworth.Mehrabian, A. (1996). Pleasure-arousal-dominance: A general framework for describing and measuring
individual differences in temperament. Current Psychology, 14(4), 261–292.Mehrabian, A., & Ferris, S. R. (1967). Inference of attitudes from nonverbal communication in two
channels. Journal of Consulting Psychology, 31(3), 248–252.Mehu, M., & Dunbar, R. I. M. (2008). Naturalistic observations of smiling and laughter in human group
interactions. Behaviour, 145, 1747–1780.Mehu, M., & Scherer, K. R. (2012). A psycho-ethological approach to social signal processing. Cognitive
Processing, 13(Suppl 2), 397–414.Montepare, J. M., & Dobish, H. (2003). The contribution of emotion perceptions and their overgeneral-
izations to trait impressions. Journal of Nonverbal Behavior, 27(4), 237–254.Montepare, J. M., & Zebrowitz-McArthur, L. (1988). Impressions of people created by age-related qualities
of their gaits. Journal of Personality and Social Psychology, 55(4), 547–556.Moore, M. M. (1985). Nonverbal courtship patterns in women: Context and consequences. Ethology and
Sociobiology, 6(4), 237–247.Owren, M. J., Rendall, D., & Ryan, M. J. (2010). Redefining animal signaling: Influence versus information
in communication. Biology and Philosophy, 25(5), 755–780.Parker, G. A. (1974). Assessment strategy and the evolution of fighting behavior. Journal of Theoretical
Biology, 47, 223–243.Parr, L. A. (2004). Perceptual biases for multimodal cues in chimpanzee (Pan troglodytes) affect recog-
nition. Animal cognition, 7(3), 171–178.Partan, S. R., & Marler, P. (2005). Issues in the classification of multimodal communication signals. The
American Naturalist, 166(2), 231–245.Patterson, M. L. (1982). A sequential functional model of nonverbal exchange. Psychological Review, 89(3),
231–249.Patterson, M. L., Churchill, M. E., Burger, G. K., & Powell, J. L. (1992). Verbal and nonverbal modality
effects on impressions of political candidates: Analysis from the 1984 presidential debates. Commu-nication Monographs, 59(3), 231–242.
Poggi, I., D’Errico, F., & Vincze, L. (2011). Agreement and its multimodal communication in debates: Aqualitative analysis. Cognitive Computation, 3(3), 466–479.
Pourtois, G., de Gelder, B., Vroomen, J., Rossion, B., & Crommelinck, M. (2000). The time-course ofintermodal binding between seeing and hearing affective information. NeuroReport, 11(6), 1329–1333.
Preacher, K. J., & Hayes, A. F. (2004). SPSS and SAS procedures for estimating indirect effects in simplemediation models. Behavior Research Methods, Instruments, and Computers, 36(4), 717–731.
Puts, D. A., Gaulin, S. J. C., & Verdolini, K. (2006). Dominance and the evolution of sexual dimorphism inhuman voice pitch. Evolution and Human Behavior, 27(4), 283–296.
Roberts, J. A., Taylor, P. W., & Uetz, G. W. (2007). Consequences of complex signaling: Predator detectionof multimodal cues. Behavioral Ecology, 18(1), 236–240.
Roth, W.-M., & Tobin, K. (2010). Solidarity and conflict: Aligned and misaligned prosody as a transactionalresource in intra-and intercultural communication involving power differences. Cultural Studies ofScience Education, 5(4), 807–847.
Rowe, C. (1999). Receiver psychology and the evolution of multicomponent signals. Animal Behaviour, 58,921–931.
Rowe, C. (2002). Sound improves visual discrimination learning in avian predators. Proceedings of theRoyal Society of London. Series B: Biological Sciences, 269(1498), 1353–1357.
Russell, J. A. (1980). A circumplex model of affect. Journal of Personality and Social Psychology, 39(6),1161–1178.
Sayette, M. A., Cohn, J. F., Wertz, J. M., Perrott, M. A., & Parrott, D. J. (2001). A psychometric evaluationof the facial action coding system for assessing spontaneous expression. Journal of NonverbalBehavior, 25, 167–185.
Scherer, K. R. (1978). Personality inference from voice quality: The loud voice of extroversion. EuropeanJournal of Social Psychology, 8(4), 467–487.
J Nonverbal Behav
123

Scherer, K. R. (1992). What does facial expression express? In K. T. Strongman (Ed.), International reviewof studies of emotion (pp. 139–165). Chichester, U.K.: Wiley.
Scherer, K. R. (2009). The dynamic architecture of emotion: Evidence for the component process model.Cognition and Emotion, 23(7), 1307–1351.
Scherer, K. R., & Ellgring, H. (2007). Multimodal expression of emotion: affect programs or componentialappraisal patterns? Emotion, 7(1), 158–171.
Scherer, K. R., Scherer, U., Hall, J. A., & Rosenthal, R. (1977). Differential attribution of personality basedon multi-channel presentation of verbal and nonverbal cues. Psychological Research, 39, 221–247.
Schubert, J. N. (1986). Human vocalizations in agonistic political encounters. Social Science Information,25(2), 475–492.
Simpson, J. A., Gangestad, S. W., & Biek, M. (1993). Personality and nonverbal social behavior: Anethological perspective of relationship initiation. Journal of Experimental Social Psychology, 29(5),434–461.
Sobel, M. E. (1982). Asymptotic confidence intervals for indirect effects in structural equations models. InS. Leinhart (Ed.), Sociological methodology 1982 (pp. 159–186). San Francisco: Jossey-Bass.
Tiedens, L. Z., & Fragale, A. R. (2003). Power moves: Complementarity in dominant and submissivenonverbal behavior. Journal of Personality and Social Psychology, 84(3), 558–568.
Todorov, A., Said, C. P., Engell, A. D., & Oosterhof, N. N. (2008). Understanding evaluation of faces onsocial dimensions. Trends in cognitive sciences, 12(12), 455–460.
vanKampen, H. S., & Bolhuis, J. J. (1993). Interaction between auditory and visual learning during filialimprinting. Animal Behaviour, 45(3), 623–625.
Wallbott, H. G. (1998). Bodily expression of emotion. European Journal of Social Psychology, 28(6),879–896.
Weisfeld, G. E., & Beresford, J. M. (1982). Erectness of posture as an indicator of dominance or success inhumans. Motivation and Emotion, 6(2), 113–131.
Werlberger, M., Pock, T., & Bischof, H. (2010). Motion estimation with non-local total variation regu-larization. Proceedings of the International Conference on Computer Vision and Pattern Recognition(CVPR) (pp. 2464–2471).
Wiggins, J. S. (1979). A psychological taxonomy of trait-descriptive terms: The interpersonal domain.Journal of Personality and Social Psychology, 37(3), 395–412.
Xu, Y. (2005). ProsodyPro.praat. Retrieved from http://www.phon.ucl.ac.uk/home/yi/ProsodyPro/.Zaki, J., Bolger, N., & Ochsner, K. (2009). Unpacking the informational bases of empathic accuracy.
Emotion, 9(4), 478–487.
J Nonverbal Behav
123