multimodal corridor system management – incorporating analysis of transit, demand management...
TRANSCRIPT

Multimodal Corridor System Management – Incorporating Analysis of Transit, Demand Management Programs and Operational Strategies
Presented by
Bill Loudon, DKS Associates
May 11, 2011May 11, 2011

Presentation Outline
1. Overview of the Project
2. Modeling Approach
3. Testing of Scenarios
4. Results and Conclusions
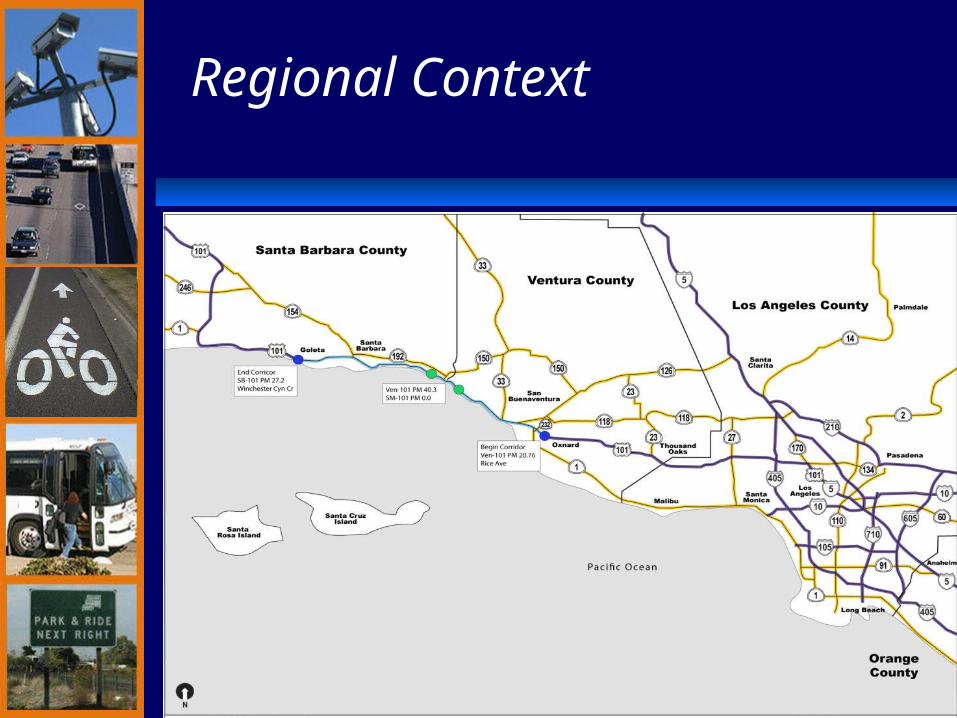
Regional Context

The US-101 Corridor
Project Objectives
To identify the location and characteristics of bottlenecks
To develop tools for the evaluation of delay-reduction strategies
To evaluate the delay-reduction potential of multi-modal strategies in in a complex urban corridor

Santa Barbara Bottlenecks

7
Ventura Bottlenecks

8
2023 Delay as a Percentage of VHT
AM Peak PM Peak
NB SB NB SB
Santa Barbara County 22.3% 12.6% 35.1% 29.7%
Ventura County 17.3% 26.0% 32.1% 48.0%

Existing and Planned Programs
Local and Express Bus Transit Limited Intercity Passenger Rail
Service Limited Park and Ride Lots Demand Management Programs Pedestrian and Bicycle Facilities

Additional Transit and TDM Options Considered
Increased Local Bus Service Increased Express Bus Service in
HOV Lanes “Commuter Friendly” Intercity Rail
Service Expanded Park and Ride Expanded Demand Management
Programs

Stakeholder Participation
State Department of Transportation Metropolitan Transportation
Organizations (MPOs) County Transportation Commissions Cities and Counties Transit Providers Air Quality Management District Community Representatives

Stakeholder Committees
Transit and Demand Management Traffic Operations Modeling

Modeling Approach and Tools

Corridor Network in Santa Barbara County

Corridor Network in Ventura County

Hybrid Simulation Representation of the Network

Supplemental Analysis Tools
Pivot Point Transit Analysis Model TDM Effectiveness Model Freeway Service Patrol Effectiveness
Model

Scenarios for Testing
1. Transit and TDM Enhancement
2. Ramp Metering
3. Minor Roadway Capacity Enhancements
4. Incident Management

Ventura AM Northbound

20
Santa Barbara AM Northbound

Santa Barbara AM Northbound Baseline 2023

Transit and TDM

Ramp Metering

Minor Physical Improvments

25
Transit and TDM - Conclusions
Overall benefits can be significant in peak commute direction
VMT Delay
Santa Barbara County
5% 53%
Ventura County
4% 30%
PM Peak Period Southbound ReductionPM Peak Period Southbound Reduction

26
Ramp Metering - Conclusions
Can reduce delay when congestion is not severe
AM Peak PM Peak
NB SB NB SB
Santa Barbara County 8.9% -9.8% 12.8% 12.2%
Ventura County 7.2% 6.3% -1.6% -1.6%
Peak-Period Delay Reduction 2023

27
Safety Benefits of Ramp Metering
Ramp DelayRamp Delay
Non-recurring Delay
Non-recurring Delay
Mainline Recurring Delay
Mainline Recurring Delay
0%
20%
40%
60%
80%
100%
Without Metering With Metering
Rel
ativ
e D
elay

28
Minor Capacity Improvements - Conclusions
Can significantly improve the productivity of the freeway
AM Peak PM Peak
NB SB NB SB
Santa Barbara County 24% 8% - 36%
Ventura County 24% 59% 30% 24%
Peak-Period Delay Reduction 2023

29
Freeway Service Patrol - Conclusions
Freeway Service Patrol Benefits 2023
Delay Savings
VHT/Year
Benefit/Cost Ratio
Santa Barbara County 206,000 11.9
Ventura County
207,000 10.8

Conclusions
Consideration of multimodal management options was important to the US 101 CSMP
An analytical method for testing multimodal options could be integrated into the modeling process
The involvement of stakeholders throughout the process was important to the testing and integration of multimodal strategies