multifunctional nanocomposites of poly(vinylidene …ubir.bolton.ac.uk/864/1/soin n express polymer...
TRANSCRIPT

1. IntroductionA great challenge in materials engineering is theproduction of multifunctional nanocomposites,which combine inexpensive materials with the easeof processing at large scale. Polyvinylidene fluoride(PVDF), is a semi-crystalline polymer having remark-able thermal stability, good chemical resistance andextraordinary pyroelectric and piezoelectric proper-ties among polymers [1]. These properties combinedwith its high elasticity, relative transparency andease of processing, make this material suitable forvarious technological applications [2]. PVDF shows
a complex structure and it can exhibit five distinctcrystalline phases related to different chain confor-mations, known as !, !, ", # and $ phases [3, 4].Amongst them, ! phase is the most active phase elec-trically and, to a lesser extent, " phase. Thus, the useof PVDF as matrix in nanocomposites is one of thekey parameters for a wide range of applications.Adding nanoparticles to a matrix such as PVDF canenhance its conductive performance and provideenhanced responses by capitalizing on the natureand properties of the nanoscale filler. The final prop-erties of these nanocomposites mainly depend on
1104
Multifunctional nanocomposites of poly(vinylidene fluoride)reinforced by carbon nanotubes and magnetitenanoparticlesC. Tsonos1,2*, C. Pandis3, N. Soin2, D. Sakellari4, E. Myrovali4, S. Kripotou3, A. Kanapitsas1,E. Siores2,5
1Electronics Engineering Department, Technological Educational Institute (TEI) of Sterea Ellada, 35100 Lamia, Greece2Institute for Materials Research and Innovation (IMRI), University of Bolton, Deane Road, BL3 5AB Bolton, UK3Physics Department, National Technical University of Athens, Zografou 15780 Athens, Greece4Department of Physics, Aristotle University of Thessaloniki, 54124 Thessaloniki, Greece5Technological Educational Institute of Athens, 12210 Athens, Greece
Received 12 May 2015; accepted in revised form 27 July 2015
Abstract. In the present study, the effect of nano magnetite (Fe3O4) content on structural, dielectric/electrical, magnetic andthermal properties of poly(vinylidene fluoride)/carbon nanotubes matrix, is investigated. Nanocomposite films ofpolyvinylidene fluoride, carbon nanotubes and Fe3O4 nanoparticles were prepared by the twin screw compounding method.Fe3O4, as magnetic inclusions was incorporated into the composites with carbon nanotubes loadings well above the perco-lation threshold, where conductive networks were formed. Magnetic characterization revealed the ferrimagnetic behavior ofnanocomposites, with saturation magnetization values depending on magnetite content. Results obtained from the analysisof Fourier Transform Infrared Spectroscopy (FTIR), X-ray Diffraction (XRD) and Differential Scanning Calorimetry(DSC) techniques were very informative for the study of the polymorphism and crystallinity in PVDF. The incorporation ofFe3O4 inclusions in PVDF/CNT matrix, gradually increase both electrical conductivity and dielectric permittivity up to10 wt% Fe3O4 content, while at the higher Fe3O4 content (15 wt%) reduced values were obtained. This behavior, at higherFe3O4 content, should be possible related to the insulating and barrier role of Fe3O4 nanoparticles.
Keywords: nanocomposites, dielectric properties, thermal properties
eXPRESS Polymer Letters Vol.9, No.12 (2015) 1104–1118Available online at www.expresspolymlett.comDOI: 10.3144/expresspolymlett.2015.99
*Corresponding author, e-mail: [email protected]© BME-PT

parameters such as filler size, method of prepara-tion and the dispersion of nanoparticles into thepolymer matrix [5–7].Among the nanosized fillers, iron oxides havebecome of long standing interest, because of theirdiverse variety of applications in electronic, mag-netic, optical, and mechanical devices [8]. Iron oxidemagnetic nanoparticles are one of most studied nano -materials, especially due to their magnetic proper-ties, biocompatibility, biodegradability and low cost.Magnetoelectric materials are a relatively new classof materials, where their magnetic nanoparticlesand polymer matrix allow a variety of applications inelectronic, magnetic, optical, and mechanical devices[9, 10]. Magnetoelectric composites have becomeone of the most active research fields in the areas ofmaterials science and engineering in recent years.Fe3O4 nanoparticles and their composites haveattracted enhanced attention and their critical sizefor superparamagnetic to ferrimagnetic transition hasbeen determined to be near 30nm at room tempera-ture [11]. PVDF/Fe3O4 composites exhibit superpara-magnetic behavior with the presence of Fe3O4 nano -particles, while the maximum for saturation magne-tization was found to be 30.8 emu/g [12]. In compos-ite films of PVDF/Fe3O4 which are fabricated bysolvent casting method, it was found that the inclu-sion of nanosized Fe3O4 significantly enhances thecrystallinity of PVDF and the ! phase content [13].Also, increased crystallinity enhances the ferrimag-netic properties of these composites whereas thelatter improves the thermal stability and polarizationeffects. In another similar system, differential scan-ning calorimetry measurements revealed that thecrystallinity of PVDF decreased with the addition ofFe3O4, while the conductivity of the compositefilms increased with increase in Fe3O4 content [14].Fe3O4 nanoparticles were found to form some50 nm–5 µm conglomerates in the PVDF matriceswhile the size of these conglomerates increased withthe increase in Fe3O4 content [15].Also, much work has been done in order to investi-gate the effect of carbon nanotubes (CNT) additionon the crystallization, the mechanical, electrical andthermal properties of PVDF/CNT composites. Fur-thermore the addition of a third phase in the form ofinorganic inclusions has been explored with the aimto enhance the multifunctionality of the prepared ter-nary composites. For example, in very recent workson ternary PVDF/CNT composites it has been shown
that the addition of graphene oxide enhances the ther-mal conductivity [16], while BaTiO3 incorporationgreatly increases the dielectric permittivity [17].The present work deals with a novel three-phasePVDF based system with CNT and nanosized Fe3O4as inclusions. To the best of our knowledge, there isno systematic work on PVDF/CNT/Fe3O4 ternarycomposites in the literature. This system comprises anew type of multifunctional materials that combinethe ferroelectric and piezoelectric properties of PVDFwith the electrical properties of CNT and the mag-netic properties of Fe3O4. Fe3O4 nanoparticles wereincorporated into the composites in various con-tents with CNT loadings well above the percolationthreshold, where stable conductive networks wereformed [18, 19]. The effect of Fe3O4 nanoparticleson PVDF/CNT blends, and especially the insulatingand barrier role of these inclusions on both, dielec-tric response and conductive network formation ofPVDF/CNT matrix, was investigated in this study.
2. Experimental details2.1. MaterialsSamples were composed of PVDF with suitable addi-tives (CNT, Fe3O4) in the desired loading range of 4to 19 wt% (total). More specifically, CNT contentwas kept constant and equal to 4 wt% while Fe3O4contents were 0, 5, 10 and 15 wt%. PVDF was com-pounded with the nanofillers using a lab scale twinscrew compounder (Thermo Scientific) with counterrotating screws. A PVDF homopolymer, SOLEF1008 (from Solvay Solexis) was used for the produc-tion of samples. The polymer had melt flow index(MFI) of 8 g/10 min at 230°C (under a load of2.16 kg). Multiwalled CNT were obtained fromCheap Tubes Inc. with a mean outer diameter of<10 nm, length of 10–30 µm, purity >90% (by wt%)and an ash content of less than 1.5 wt%. No furtherpurification or acid treatment of the CNT was car-ried out and the samples were used as-received.Fe3O4 nanopowder was obtained from Aldrich withaverage particle size <50 nm and purity >98%. ThePVDF pellets (500 grams) were mixed with thesuitable weight of additive and then passed throughthe twin screw extruder. Extruder temperature pro-file was set at 150°C (at hopper end) with 10°C incre-mental changes across the heated barrel (165, 175,185, 195°C) with a final temperature of 195°C atthe die head. Temperature profile was set in such amanner that the polymer started to melt in the mid-
Tsonos et al. – eXPRESS Polymer Letters Vol.9, No.12 (2015) 1104–1118
1105

dle of the barrel and then by the time it reached tothe die head, the viscosity of it was reduced signifi-cantly. Polymer pellet-additive mixture was fed tothe counter rotating screw at 13% feed rate and wasmoved across the length of the screw at 40% torquecorresponding to 350 rpm screw speed. Monofila-ment obtained from the die head was then passedthrough a cooling bath using a set of rollers fromwhere it was passed onto a chopping unit whichmade homogeneous pellets (~ 5 mm long) from it.The pellets were then dried overnight at 75°C toremove the adsorbed water before further processing.The samples were pressed at a pressure of 40 kg/cm2
for duration of 2 min 30 sec and then allowed tocool down at the same pressure using a cold presswhich rapidly cooled down the samples to room tem-perature in approximately 2 mins. The final sampleweight was approximately 48 g, with the rest of addi-tive mix lost to overflow of the polymer to the out-side of the mould. The twin screw compoundingenabled better quality of mixing at low melt tem-peratures and hence the material degradation wasavoided.
2.2. CharacterizationMorphology was studied by field emission ScanningElectron Microscopy (FE-SEM) using FEI NovananoSEM 230 operating in high vacuum mode. Sam-ples were cryofractured using liquid nitrogen andtheir cross section was examined using an acceler-ating voltage of 5 kV. The size of the particles fromthe SEM micrographs was measured using ImageJsoftware.FTIR analysis was carried out using Thermo Scien-tific IS10 Nicolet FTIR spectrometer coupled withsmart iTR accessory. A total of 64 scans at a resolu-tion of ±2 cm–1 were taken during spectrum acqui-sition. Vendor provided OMINIC software was usedto analyze the results and calculations of the betaphase.XRD analysis of samples was performed at roomtemperature using X’Pert MRD (Panalytical)between the 2% range of 5–40° at a scan speed of0.02°/s. A CuK! radiation (& = 0.154 nm) sourceperforming at 45 kV and 40 mA was used.Thermal transitions (crystallization/melting) werestudied by DSC analysis carried out in nitrogenatmosphere in the temperature range from 20 to200°C using a Q20 (TA instrument) apparatus. Theweight of the measured samples was kept constant
at ~5 mg. Heating and cooling rates were fixed to10°C/min.Magnetic measurements were performed, usingVibrating Sample Magnetometer (VSM) – Oxford1.2 H/CF/HT at maximum applied fields of 1 T. Foreach sample magnetization versus applied field wasrecorded at room temperature.Electrical/dielectric properties were studied by meansof Dielectric Relaxation Spectroscopy (DRS) tech-nique using Alpha analyzer in combination with aQuatro cryosystem for temperature control, bothsupplied by Novocontrol. Samples of 1 mm thick-ness were placed between two brass electrodes of20 mm diameter and inserted as a capacitor in aNovocontrol sample cell. Golden electrodes weresputtered (using a sputter coater EMS 550) on bothsides of the samples to assure good electrical con-tact between the sample and the gold-plated capaci-tor plates. The complex dielectric permittivity wasrecorded and measured in a broad frequency rangedfrom 1 to 106 Hz.
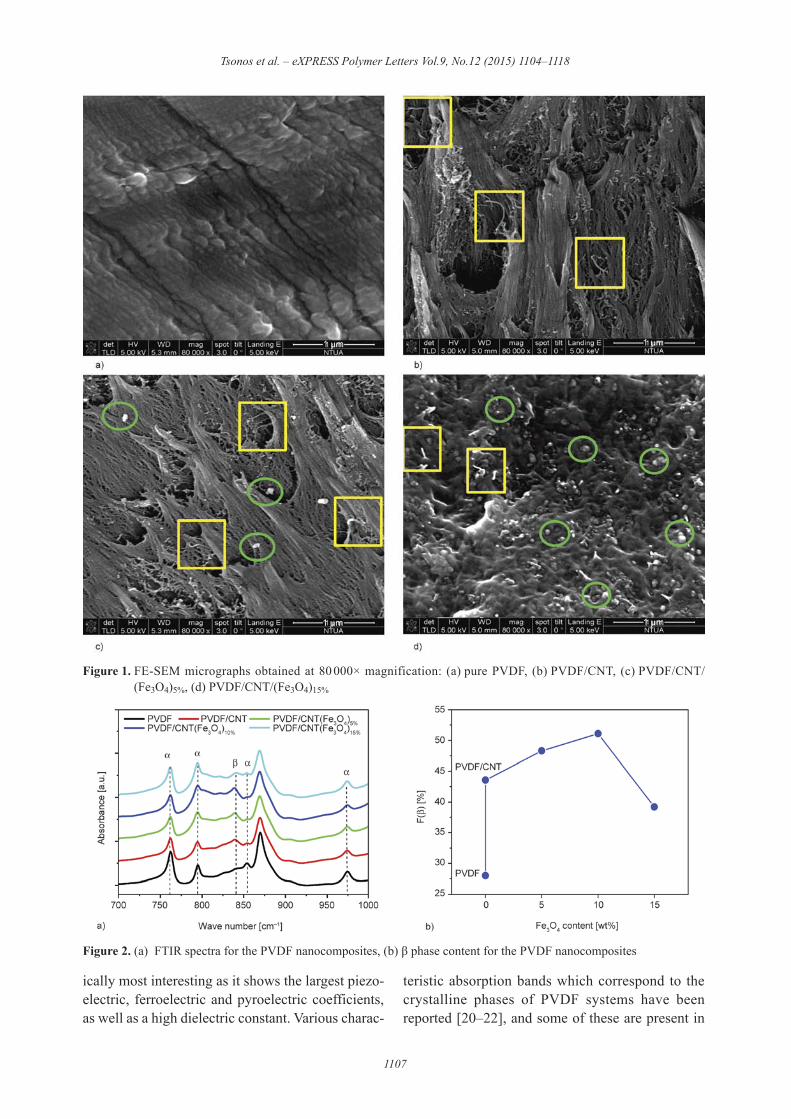
3. Results and discussion3.1. MorphologyFigure 1 shows representative SEM micrographs ofcryo-fractured surfaces obtained at magnification of80 000'. Figure 1a shows the micrograph of purePVDF for comparative analysis. The yellow squaresfor the samples containing CNT highlight the pres-ence of several individual CNTs in the obtainedmicrographs (Figure 1b, a–c), indicative of a lack ofagglomeration and presence of a good dispersion. Itis important to note that the fractured samples wereprepared using cryo-fracture and not the tensile frac-ture, which can sometimes lead to the fibrillation ofPVDF and can be often misinterpreted as the CNT.Similarly, the green circles are indicative of the pres-ence of Fe3O4 particles, which again show a gooddistribution across the PVDF matrix without signif-icant agglomeration, having a mean diameter in therange of 50–100 nm. Furthermore, on increasingthe Fe3O4 particle concentration to 15 wt% (samplePVDF/CNT/(Fe3O4)15%) larger agglomerates ofFe3O4 were observed (Figure 1d).
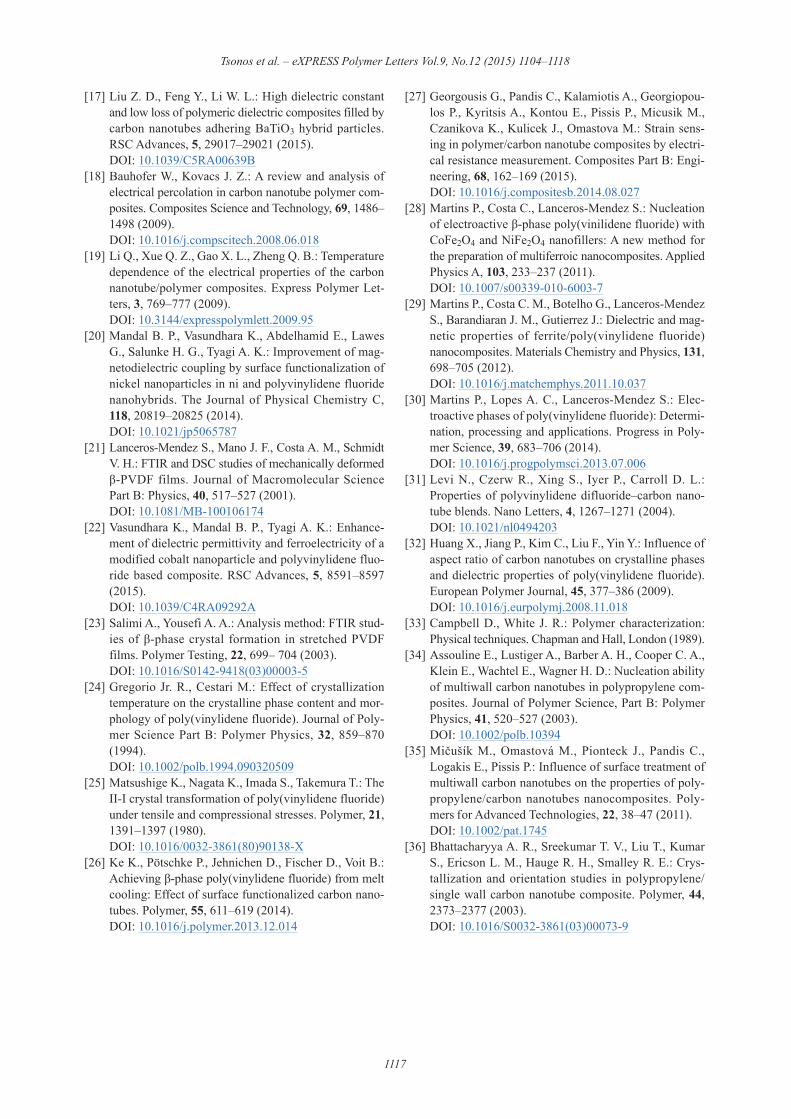
3.2. FTIR measurementsTo calculate relative amount of the ( phase in thecomposite film, FTIR tests for the pure PVDF andnanocomposites were undertaken and results areshown in Figure 2a. The polar ( phase is technolog-
Tsonos et al. – eXPRESS Polymer Letters Vol.9, No.12 (2015) 1104–1118
1106
ically most interesting as it shows the largest piezo-electric, ferroelectric and pyroelectric coefficients,as well as a high dielectric constant. Various charac-
teristic absorption bands which correspond to thecrystalline phases of PVDF systems have beenreported [20–22], and some of these are present in
Tsonos et al. – eXPRESS Polymer Letters Vol.9, No.12 (2015) 1104–1118
1107
Figure 1. FE-SEM micrographs obtained at 80 000' magnification: (a) pure PVDF, (b) PVDF/CNT, (c) PVDF/CNT/(Fe3O4)5%, (d) PVDF/CNT/(Fe3O4)15%
Figure 2. (a) FTIR spectra for the PVDF nanocomposites, (b) ( phase content for the PVDF nanocomposites

Figure 1a. Absorbance at 612, 760, 795, 853 and974 cm–1, correspond to the ! phase, whileabsorbances at 511, 840, 878 and 1279 cm–1 corre-sponded to the ! phase. The content fraction ofphase in each sample of PVDF nanocomposites,F(!), was calculated according to Equation (1) [23–25]:
(1)
where X! and X! are crystalline mass fractions ofthe ! and ! phases and A!, A! correspond to theirabsorbance at 760 and 840 cm–1 respectively. Thisrelation gives the relative amount of the ! and !phases in composites assuming that only these phasesare present and has been used extensively in the lit-erature. As shown in Figure 2b, the ! content calcu-lated for pristine PVDF samples and PVDF/CNTcomposite shows a huge increase from approxi-mately 28 to 44%, signifying the effect of CNT inpromoting the ! phase crystallization. Similar behav-iour has been seen in PVDF based composites pre-pared by melt compounding, in which the incorpo-ration of CNT produced transformation of thephase into ! phase [26, 27]. Furthermore, the incor-
poration of Fe3O4 nanoparticles in PVDF/CNTmatrix slightly and gradually increases the ! phaseup to a maximum value of 51% for the sample with10 wt% Fe3O4, while at the highest Fe3O4 content(i.e. 15 wt%) phase decreases to the value of 39%.Adding Fe3O4 nanoparticles was found to resultalso in ! to ! phase transformation in PVDF matrix[28, 29]. From these results it seems that it is mainlyCNT that promote the formation of phase in PVDFnanocomposites, while the influence of Fe3O4 isless but not insignificant.
3.3. XRD analysisFigure 3a shows X-ray diffractograms of pristinePVDF and PVDF/CNT nanocomposites with 5, 10,and 15 wt% Fe3O4 in the 2% range between 5–40°.The well-known diffraction peaks of ! phase ofPVDF appearing at 2% = 17.8, 18.5, 20 and 26.8°, areassigned to the lattice planes of (100), (020), (110)and (021) respectively [30]. Furthermore, for sam-ples containing Fe3O4 the diffraction peak at 30.6°are assigned to Fe3O4 crystalline plane of (220) [13].In fact, with the increase in the addition of Fe3O4,the peak becomes increasingly prominent. Interest-ingly, when CNT are incorporated in the PVDF
F1b 2 5 XbXa 1 Xb
5Ab
1.26Aa 1 AbF1b 2 5 Xb
Xa 1 Xb5
Ab1.26Aa 1 Ab
Tsonos et al. – eXPRESS Polymer Letters Vol.9, No.12 (2015) 1104–1118
1108
Figure 3. (a) XRD patterns of pure PVDF and PVDF nanocomposites with CNT and Fe3O4, (b) zoom of XRD patterns ofpure PVDF and nanocomposites showing the existence of ( phase for the nanocomposites containing CNT
Table 1. Results from DSC and XRD analysis
Sample
DSCXRD
First heating Second heating First coolingTm
[°C]Tm2[°C]
Tm[°C]
!H[J/g]
Xc[%]
Tc[°C]
Xc[%]
PVDF 173.0 165.5 171.4 50.6 48 137.70 49±2PVDF/CNT 173.2 168.6 173.3 50.8 49 148.50 51±2PVDF/CNT/(Fe3O4)5% 172.9 168.5 173.2 50.4 48 148.50 44±2PVDF/CNT/(Fe3O4)10% 173.0 168.2 173.2 40.9 39 148.40 37±3PVDF/CNT/(Fe3O4)15% 172.9 168.5 172.9 44.2 42 150.14 43±3

matrix, the appearance of a shoulder at 20.6°, attrib-uted to the (110)/(200) planes of the ! phase isobserved [31]. The above can be seen more clearlyin Figure 3b where a zoom in the 2% range between12–25° is presented. These findings suggest that thepresence of CNT induces the formation of ! phase[32], in accordance with FTIR analysis. For the deter-mination of the crystallinity from the XRD profiles,the following equation has been used [33], Xc =Ic/(Ic + I!), where Ic and I! are the integrated intensi-ties scattered by the crystalline and the amorphousphases, respectively. The degree of crystallinity ofPVDF in the nanocomposites has been evaluatedfrom diffractograms and reported in Table 1.
3.4. Thermal propertiesDuring the first heating scan a double melting peakis observed in all studied samples (Figure 4a). Forpristine PVDF a main peak around 173°C and ashoulder around 166°C were observed. The existenceof double melting peak is generally attributed to thepresence of crystallites of different thickness, varietyof crystallites perfection, re-melting of crystallitesformed during heating or existence of polymor-phism [13]. When the samples were cooled from themelt, a single crystallization peak was found andthe crystallization temperature, Tc, of pure PVDF wasobserved at 138°C. In the nanocomposites, a nar-rower crystallization peak and a shift of crystalliza-tion temperature Tc to higher temperatures (~10°C)compared to pure PVDF was detected. Interest-ingly, Tc was found to be independent of the Fe3O4concentration and their effect is less pronounced ascan be seen in Figure 4c. The increase of Tc uponaddition of CNT is a clear indication of theiressence as nucleating agents promoting heteroge-neous crystallization, a feature commonly observedin polymer/CNT nanocomposites [34, 35], whilenarrowing of the crystallization peak implies a nar-rower crystallite size distribution [36].During the second heating scan and after erasingthe thermal history of each sample, a single meltingpeak, independent of the filler concentration, wasobserved around 173°C, slightly higher in the nano -composites compared to pure PVDF (Figure 4b).Melting (Tm) and crystallization (Tc) temperaturestogether with the melting enthalpies ()"m) recordedduring second heating scan are reported in Table 1.The degree of crystallinity Xc of PVDF is calculatedfrom Equation (2):
(2)
where )"0 is the melting enthalpy for 100% ! crys-talline PVDF and # is the total weight fraction offillers in nanocomposites. )"0 was taken equal to104.5 J/g. [37]. The degree of crystallinity is practi-cally unaffected by the addition of CNT and for thelowest concentration sample of Fe3O4 particles. For
Xc 3, 4 5 DHm
11 2 w 2DH0~100Xc 3, 4 5 DHm
11 2 w 2DH0~100
Tsonos et al. – eXPRESS Polymer Letters Vol.9, No.12 (2015) 1104–1118
1109
Figure 4. (a) DSC thermograms showing melting during firstheating and (b) second heating scan, and (c) crys-tallization during cooling

higher Fe3O4 content, a decrease of the degree ofcrystallinity was observed. A similar reduction in thecrystallinity has been observed by other authors [14,15]. This reduction in the crystallinity can be attrib-uted to the inhibition effect of Fe3O4 addition on poly-mer crystal formation, similar to what has beenobserved with various other inorganic fillers. Theabove results are in accordance with those obtainedfrom XRD analysis.It should be noted that while DSC could be veryaccurate in the evaluation of the degree of crys-tallinity in PVDF, it could not be used in our case todistinguish between different polymorphs, in par-ticular between ! and ! phase. The melting temper-atures of crystallite phases are very close and bothappear in the range 167–172°C [24]. In addition,when analyzing DSC results in PVDF nanocompos-ites, further caution must be taken for ascribing themelting peaks to either ! or ! phase, and DSC shouldbe considered as complementary technique to FTIRor XRD, as its features are not only dependent onthe crystalline phase, but also affected by crys-talline defects which are particularly enhanced bythe presence of nanofillers [30]. However, DSC isused to exclude the existence of " phase as no melt-ing peak has been observed at higher temperaturesaround 179–180°C [38]. Combination of resultsanalysis of all three techniques (FTIR, XRD andDSC) are very informative for the study of the poly-morphism and crystallinity in PVDF. FTIR andXRD allowed identifying the different crystallinephases giving a clear evidence of the enhancementof ! phase of PVDF when CNT are incorporated,while DSC was used to evaluate the degree of crys-tallinity.
3.5. Magnetic characterizationFigure 5a presents hysteresis loops as recorded atroom temperature for polymer nanocomposites,including CNT and Fe3O4 nanoparticles. The hystere-sis loops confirm the ferromagnetic behavior of nano -composites, which is attributed to magnetic nano -particle content [13]. This magnetic behaviour isalso observed in other similar composites systems[14]. Moreover, by increasing magnetite (Fe3O4) con-tent a gradual change in hysteresis loops is observed.Specifically, saturation magnetization (Ms) increases,from 2.9 to 7.0 and 10.8 emu/g for PVDF nanocom-posites with 5, 10 and 15 wt% Fe3O4 content respec-tively. As compared to the saturation magnetization
value of 87.6 emu/g (Figure 5b), for the starting mag-netite powder, these values are considerably lowerdue to their addition into a nonmagnetic polymermatrix as well as the low content (5–15 wt%) of theFe3O4 nanoparticles [39]. The observed linearincrease in the values of saturation magnetization(Figure 5c inset) can, however, be attributed to thehigh dispersion of the magnetic nanoparticles in thepolymer matrix and is in accordance with the resultsobtained by various other authors [14, 15, 29].
3.6. Electrical and dielectric characterizationFigures 6a and 6b show the variation of dielectricpermittivity ($*) and dielectric loss ($+) for PVDFand its nanocomposites, as a function of frequencyat room temperature. In the low frequency region(1–103 Hz) for all the nanocomposites, there is a sig-nificant increase of $* values, between two and threeorders of magnitude as compared to pristine PVDFsamples. In fact, for the PVDF/CNT composite itself,a huge increase is observed from ~8 (at 10 Hz) to2425 (at 10 Hz), largely due to the interactionbetween the PVDF and CNT. It is interesting to notethat the dielectric permitivitty of the composite ishigher than the PVDF matrix (about 10) and of car-bon nanotubes alone (about 2000), thereby hintingat the synergistic interactions between them. Accord-
Tsonos et al. – eXPRESS Polymer Letters Vol.9, No.12 (2015) 1104–1118
1110
Figure 5. (a) Hysteresis loop recorded at room temperaturefor samples PVDF/CNT/(Fe3O4): 5, 10 and 15 wt%(green, blue and red respectively) in Fe3O4 con-tent. Inset: saturation magnetization values withmagnetite content, (b) Hysteresis loop recorded atroom temperature for pure magnetite powder,(c) saturation magnetization values for magnetitenanocomposites as a function of Fe3O4 content.

ing to the Maxwell-Wagner-Sillars (MWS) effect,when a current flows across the two-materials inter-faces, charges can be accumulated at the interfacebetween two dielectric materials with differentrelaxation times (% = $/&, where $ is the dielectricpermittivity and & is the conductivity). As the relax-ation time of PVDF is significantly higher than thatof CNT, the charge carriers are blocked at the inter-nal interfaces due to the MWS effect, therebyenhancing the dielectric permittivity significantly.Moreover, in the study carried out by Yuan et al.[40], the formation of donor-acceptor complexes atthe PVDF-CNT interfaces was shown to enhancethe dielectric permittivity due to MWS effects.Now, as the Fe3O4 content increases in PVDF/CNTmatrix, $* values again gradually increase in the lowerfrequency region, while for the highest Fe3O4 con-tent (15 wt%), $* reduces below the correspondingvalues of PVDF/CNT. At 100 Hz, the PVDF/CNT/(Fe3O4)15% sample presents the lowest $* value(1120) between all the PVDF/CNT/Fe3O4 nano -composites, while the maximum $* value (12140) isexhibited by the PVDF/CNT/(Fe3O4)10% sample.While the dielectric permittivity of Fe3O4 has avalue below 100 at room temperature [41], it is
obvious that the Fe3O4 nanoparticles play an impor-tant role on the dielectric properties of composites,with the increase in the $* values (for 5 and 10 wt%Fe3O4 samples) caused by increasing the interfacialspace-charge polarization between the polymermatrix and the Fe3O4 filler. Also, PVDF/CNT/(Fe3O4)10% presents the highest stability in $* valuesfor frequencies below 100 kHz, an interesting prop-erty which could further be utilized for electronicdevices.Now, in the present system the content of CNT ishigher than percolation threshold [18, 19], while thecontent of Fe3O4 is lower than the percolation thresh-old in PVDF/Fe3O4 systems [12]. As mentionedabove, by increasing the Fe3O4 content in PVDF/Fe3O4 systems, $* values gradually increase in lowfrequency region [12]. In the earlier work [12], itwas observed that for Fe3O4 content of up to 6%volume fraction (similar concentration to our PVDF/CNT/(Fe3O4)15%), $* reaches a value between 40–50at 100 Hz. In our case, the dramatic increase of thedielectric permittivity to 7490 at 5 wt% Fe3O4 con-tent suggests that a synergistic effect occurs betweenthe PVDF-CNT matrix and the Fe3O4 nanoparti-cles. As discussed earlier, the high dielectric permit-
Tsonos et al. – eXPRESS Polymer Letters Vol.9, No.12 (2015) 1104–1118
1111
Figure 6. (a) Real part of dielectric permittivity, (b) imaginary part of dielectric permittivity, (c) imaginary part of dielectricpermittivity after subtraction of DC conductivity according to the Equation (3) and (d) dissipation factor tan# as afunction of frequency for PVDF system at room temperature

tivity values at CNT content above the percolationthreshold is related to the presence of a large num-ber of nanocapacitor structures together with a largedipole moment of interfacial polarization whereinthe conductive CNT act as nanoelectrodes and thePVDF matrix as nanodielectrics, experiencing inter-facial polarization [42, 43]. The charges which aretrapped at the nanofiller-polymer interface result inthe MWS polarization effect. This leads to enor-mous increase in the dielectric permittivity and itsstrong frequency dependence at the low frequencyregime.The distribution of CNT within the insulating poly-mer matrix, except the formation of donor-acceptorcomplexes at the PVDF-CNT interface [40], formslots of nanocapacitors connected not only in seriesbut also in parallel combinations, while this nano -capacitor’s formation can significantly improve thedielectric permittivity of the nanocomposites [44,45]. Of course, the presence of the magnetite inclu-sions is expected to affect this nanocapacitors for-mation. As shown in Figure 6a, at the highest Fe3O4content (15 wt%) the value of $* (1121) is lower thanthat of PVDF/CNT (1636) at 100 kHz. This factindicates a significant differentiation in the forma-tion of nanocapacitors at higher Fe3O4 content. Morespecifically, at high Fe3O4 content it is possible thatthe Fe3O4 nanoparticles increase the insulatingegaps between CNT which led to a reduction in thedielectric permittivity of nanocapacitors. The capaci-tance has an inverse relationship with the thicknessof dielectric materials and therefore an increase innanodielectric thickness leads to a reduction incapacitance despite the polar nature of Fe3O4.In the PVDF-based nanocomposites, overall threerelaxations are observed in the dielectric relaxationfrequency spectra. From the low – frequencies tothe high – frequencies, these relaxations were iden-tified as MWS interfacial polarization, !c relaxationand !! relaxation, respectively. Here, two dielectricrelaxations are evident in pristine PVDF at roomtemperature in the frequency spectra as shown inFigure 6b. The first peak at frequency higher than1 MHz is the !! relaxation, also referred to as theprimary relaxation. The frequency limit of the instru-ment constrained the full view of this relaxation.However, earlier works have confirmed the peakaround 1 MHz is related to the micro-Browniancooperative motions of the main chain backboneand is essentially the dielectric manifestation of the
glass transition temperature of the PVDF [46–48].The second relaxation peak observed at lower than10 Hz is the !c relaxation and is attributed to molec-ular motions (rotation and twisting with a smalllengthwise translation of the crystalline chain) ofthe PVDF crystalline region [47]. All the previousrelaxations should be affected by the presence ofthe conductive CNT and semi-conductive Fe3O4fillers. It was found that crystalline relaxation is notaffected by the addition of the Fe3O4 filler in PVDF/Fe3O4 systems, while Fe3O4 loading has shownretardation in the glass transition dynamics [48].As seen in Figure 6b, the presence of CNT makesalmost the overall frequency spectra to be domi-nated by the effects related to the DC conductivity,which result in high values of $+. The dielectriclosses follow an '–1 dependence according to $+ =&dc/($0·'), where $0 is permittivity of vacuum and' = 2"f the angular frequency. In the linear segmentof log$+ vs. logf representation of Figure 6b the sam-ple PVDF/CNT/(Fe3O4)10% presents higher losses,while the one of PVDF/CNT the lower. Deviationfrom the linear dependence '–1 of the losses $+ ispresent at higher frequencies in all nanocomposites.Especially, one shoulder is evidence above 100 kHzfor the PVDF/CNT/(Fe3O4)10%, and its high valuesof $+ suggest that it should be related to the motionof charges. The dominant contribution of Ohmicconduction makes difficult to extract informationabout the characteristics of dielectric relaxationswhich take place in nanocomposites as a result ofnanofillers. One convenient technique to eliminatethe contribution of Ohmic conduction is based onthe following derivation (Equation (3)) [49]:
(3)
which yields approximately the dielectric loss forthe case of broad peaks. As a result, one can obtainconductivity-free dielectric loss peaks as depictedin the Figure 6c. The losses in PVDF/CNT occupythe whole frequency window with a tendency forsaturation at lowest frequencies and a peak could beread at 170 Hz. The sample with the lowest Fe3O4content also shows a broad peak with maximumvalue of dielectric loss, $+max, at frequency 1 kHz. Thesamples with the highest Fe3O4 concentrations (10and 15 wt%) show two distinct peaks where the oneat high frequency is more dominant. The high fre-quency peaks are located at frequencies 145 kHz
e0deriv 5 2p
2 ~0e9 1f 20lnf
< e0e0deriv 5 2p
2 ~0e9 1f 20lnf
< e0
Tsonos et al. – eXPRESS Polymer Letters Vol.9, No.12 (2015) 1104–1118
1112

and 46 kHz for the specimens PVDF/CNT/(Fe3O4)10%and PVDF/CNT/(Fe3O4)15% respectively. For thesame specimens the low frequency peaks occur atfrequencies 3.3 and 330 kHz, respectively.The high values of dielectric losses, $+max, of the Fig-ure 6c peaks clearly suggest that the these relax-ations, should be related to short range electriccharges motion. Also, the values of the dielectric per-mittivity of the components (PVDF, CNT and Fe3O4),cannot explain the high permittivity values of nano -composites in terms of simple mixing if one doesnot take place interfacial polarization effects. Thus,the loss peak which was detected at 170 Hz in PVDF/CNT (Figure 6c), should be related to the MWSinterfacial polarization due to the formation of donor-acceptor complexes at the PVDF-CNT interface inconjunction with the nanocapacitor structure ofCNT and PVDF matrix. At the lower Fe3O4 content(5 wt%), the presence of a broad loss peak at 1 kHzin Figure 6c, suggests that the formation of donor-acceptor complexes at the PVDF-CNT interface inconjunction with the nanocapacitor structure ofCNT and PVDF matrix, has also the dominant role inthe appearance of MWS interfacial polarizationmechanism.On the other hand, at higher Fe3O4 content (10 and15 wt%) the low frequency loss peaks present aremarkable reduction of dielectric losses ($+max)values, which indicate that the presence of Fe3O4inclusions restrict the contribution of nanocapacitorstructure of CNT-PVDF matrix to the formation ofinterfacial polarization effects. This behaviour isconsistent with the insulating effect of Fe3O4 inclu-sions discussed previously, commenting on theresults of Figure 6a. The presence of semi-conduc-tive Fe3O4, is expected to enhance the complexity aswell as the number of interfaces between the com-ponents of our ternary system. The appearance of asecond loss peak, more enhanced, at higher frequen-cies in PVDF/CNT/(Fe3O4)10% and PVDF/CNT/(Fe3O4)15% nanocomposites, should be connected tothe Fe3O4 inclusions effects. These higher frequencyrelaxations, play a major role in forming the dielec-tric constant in PVDF/CNT/(Fe3O4)10% and PVDF/CNT/(Fe3O4)15% nanocomposites. In a study ofFe3O4–polypyrrole hybrid nanocomposites carriedout by Dey et al. [41], the interface between polypyr-role and Fe3O4, was found to play an important rolein producing a large dielectric constant. A MWS typeinterfacial polarization mechanism appears at high
frequency range, caused from Fe3O4-polypyrroleinterfaces and leads to a high dielectric constant inthe nanocomposite. So, it is possible the second losspeak at higher frequencies in PVDF/CNT/(Fe3O4)10%and PVDF/CNT/(Fe3O4)15% nanocomposites, to berelated with a MWS type interfacial polarizationcaused by a synergetic effect that occurs betweenthe PVDF-CNT matrix and Fe3O4 inclusions inter-faces.The real and imaginary parts, $* and $+, of the com-plex dielectric function $* = $* –(j$+, define the dis-sipation factor tan) = $+/$* which is of great impor-tance in technological applications since it reflectsthe ratio of dissipated energy per stored energy. Fig-ure 6d shows the dissipation factors of PVDF andits nanocomposites. It can be observed that the dis-sipation factor of nanocomposites present enhancedvalues in relation to the pure PVDF and as the fre-quency decreases, tan) almost linearly increases sev-eral orders of magnitude. While in the pure PVDFtan) takes values lower than 0.1 at all frequency spec-tra, the nanocomposites exhibit values higher than1 almost at all frequency range. The nanocompositePVDF/CNT/(Fe3O4)15% with the higher dissipationfactor, at lower frequency range, takes value of 127at 1 kHz. Both PVDF/CNT/(Fe3O4)5% and PVDF/CNT exhibit almost the same frequency depend-ence of dissipation factor at lower frequency regionand also present the lower value of 2.7 at 1 kHz.As one can observe in Figure 6d, one shoulderappears above 10 kHz in both PVDF/CNT and PVDF/CNT/(Fe3O4)5%. For the same relaxation processthe peak in tan) is shifted at higher frequencies rel-atively to the one of imaginary part of dielectricpermittivity. The relaxation ratio, )$/$, +1, as wellas the distribution parameters of the process willdetermine how close or far apart the peaks will be[50]. Therefore, the shoulders in tan ) should berelated to the relaxation process detected at low fre-quencies in both nanocomposites (Figure 6c).The alternating current (AC) conductivity is a properrepresentation to correlate the macroscopic meas-urement to the microscopic movement of the chargecarriers. Figure 7a shows the AC electrical conduc-tivity of the studied system, which is determined byusing the dielectric data as &* = $0$+'. All nanocom-posites exhibit a plateau at lower frequencies whichcorresponds to DC conductivity, &dc. DC conductiv-ity measurements which carried out with Keithley2440 Sourcemeter confirm the previous allegation
Tsonos et al. – eXPRESS Polymer Letters Vol.9, No.12 (2015) 1104–1118
1113

with high accuracy. The lower value of DC conduc-tivity between the nanocomposites is exhibited byPVDF/CNT. At 10 Hz, PVDF/CNT presents a valuehigher more than 5 orders of magnitude relativelyto that of pure PVDF. This is an expected behaviorsince CNT content is well above the value of perco-lation threshold. By increasing the Fe3O4 content,DC conductivity increases up to PVDF/CNT/(Fe3O4)10% which presents the maximum value of2.8·10–4 S/cm, more than two orders of magnitudehigher than this of PVDF/CNT. At the higher Fe3O4content, the DC conductivity reduces at a value of6.7·10–5 S/cm which is significantly higher thanthese of the rest two nanocomposites PVDF/CNT andPVDF/CNT/(Fe3O4)5%. The reduced value of DCconductivity at high Fe3O4 content should berelated to the barrier effect of the Fe3O4 nanoparti-cles that disrupted the conductive network of CNTand made it more difficult for charge carriers tomove throughout the network [51].Electric modulus formalism has been proved veryefficient in analyzing dielectric data of polymermatrix nanocomposites. The electric modulus isdefined by Equation (4) as the inverse quantity ofcomplex dielectric permittivity [52]:
(4)
where $*, M* are the real and $+, M+ the imaginaryparts of dielectric permittivity and electric modulus,respectively. Figure 7b shows the dependence ofM+ as a function of frequency f, at room tempera-ture. In pure PVDF, the peak which appears below10 Hz is assigned as the !c relaxation, while the oneappearing at frequency higher than 1 MHz is the !!relaxation. In nanocomposites the contribution of ahigh frequency relaxation is dominant, while ashoulder exists at lower frequency range which ismore distinct in PVDF/CNT/(Fe3O4)10%. Figure 7cshows the best fitting of the following relationwhich consists of a sum of a Havriliak–Negamiexpression (Equation (5)) and a linear term:
(5)
to the experimental data of PVDF/CNT/(Fe3O4)10%in order to separate these two contributions. Thefirst term of Equation (4) represents the contribu-tion of the lower frequencies relaxation, where )M* =M,* –-Ms*, M,* = 1/$,* , Ms* = 1/$s*. %HN is a characteris-
tic relaxation time. ! and * are the Havriliak-Negamishape parameters which correspond to the wideningand asymmetry of relaxation times distribution and' = 2"f the angular frequency of the applied elec-tric field. The second term of Equation (4) repre-sents the linear contribution of the higher frequencyrelaxation to the log–log frequency spectrum. The
M0 5 Im e DM911 1 1jvtHN 2a 2b
f 1 Avn
M*5M91jM051e*5
e9
e921e9
21 je0
e921e0
2M*5M91jM051e*5
e9
e921e9
21 je0
e921e0
2
M0 5 Im e DM911 1 1jvtHN 2a 2b
f 1 Avn
Tsonos et al. – eXPRESS Polymer Letters Vol.9, No.12 (2015) 1104–1118
1114
Figure 7. (a) AC electrical conductivity as a function of fre-quency for PVDF system at room temperature,(b) dependence of imaginary part of electric mod-ulus as a function of frequency, for PVDF systemat room temperature, (c) experimental data (redcircles), total (red line) and individual (blue lines)fitting curves of the imaginary part M+ of electricmodulus according to Equation (4) for the samplewith 10 wt% Fe3O4 with parameters values: ! = 1,! = 0.91, 1/(2"%HN) = 35.3 kHz, )M* = 5·10–5,+ =1.32·10–9 and n = 0.91.

parameter A reflects the position and the strength ofthis mechanism while n defines the slope of the lin-ear left–side contribution.DC conductivity is given through the relation &dc =$0$s'0, where $0 is the permittivity of vacuum, $s thedielectric constant and as '0 is taken the angularfrequency which corresponds to maximum peakposition of conductivity relaxation mechanism inthe imaginary part of electric modules function, .0 =2"fmax,M+ [53]. As shown in Figure 7c the relaxationpresents a maximum value of M+ at frequencyfmax,M+ = 36.6 kHz.If we choose the value of $* = 12 140 at 100 Hz asthe value of dielectric constant of PVDF/CNT/(Fe3O4)10%, then according to the previous relationthe DC conductivity is found to be 2.5·10–4 S/cm.This value is very close to the corresponding oneextracted from the plateau of Figure 7a, which is2.8·10–4 S/cm. This fact is a strong indication that therelaxation which appears as shoulder in logM+–logfplots of Figure 7b is the conductivity mechanismand fmax,M+ value separates the regions of short-range and long-range mobility of charges at theright-hand and left-hand sides of M+ maximum,respectively [54].As it is obvious in Figure 7c, the shoulder of PVDF/CNT/(Fe3O4)10% exists at the higher frequency, whilethe shoulder of PVDF/CNT is present at lower fre-quency. The characteristic frequency '0 is closelyrelated to the relaxation time of conductivity mech-anism via the relation %0 = 1/'0. So, higher '0 meansfaster conductivity relaxation. According to therelation &dc = $0$s'0, the DC conductivity is propor-tional to both, dielectric permittivity and character-istic frequency '0. PVDF/CNT/(Fe3O4)10% charac-terized from the higher values of dielectric permit-tivity and '0, so it is expected to have the higher &dcvalue. On the other hand, PVDF/CNT/(Fe3O4)15%although presents the lower $* value, the significantlyhigh value of '0 dominates and so its &dc value ishigher than that of PVDF/CNT and PVDF/CNT/(Fe3O4)5%.The present study, which is related to the morpho-logical, thermal, magnetic, dielectric and electricalcharacterization of the novel PVDF/CNT/Fe3O4ternary system, was carried out at room tempera-ture. Investigation of the dielectric properties as wellas electrical properties at different temperature pro-files using the same nanocomposites will be per-formed in an ensuing study.
4. ConclusionsNanocomposites consisting of PVDF as matrix, act-ing as ferroelectric and piezoelectric phase, Fe3O4nanopowders as magnetic (ferrite) phase and CNTas conductive phase were prepared by the twin screwcompounding method. SEM measurements show agood dispersion of nanoinclusions in the PVDFmatrix, and only at the used highest Fe3O4 particleconcentration agglomerates containing three ormore particles were observed. FTIR and XRDmeasurements provide clear evidence that mainlythe presence of CNT induces the formation of ! phasein nanocomposites. According to DSC measure-ments, the degree of crystallinity is practically unaf-fected by the addition of CNT for the lowest con-centration of Fe3O4 particles. For higher Fe3O4,content a decrease of the degree of crystallinity isobserved. From magnetic measurements, apart fromthe ferrimagnetic behavior of the prepared nano -composites, the gradually increase of saturationmagnetization values with the magnetite content isconfirmed.The overall frequency spectrum is dominated by theeffects related to DC conductivity. The removing ofthe effect of ohmic conductivity, revealed dielectricloss peaks. In PVDF/CNT and PVDF/CNT/(Fe3O4)5%one broad loss peak appears at the low frequenciesregion. At higher Fe3O4 content, the influence ofFe3O4 nanoparticles in PVDF-CNT matrix givesrise to the existence of a second loss peak, moreenhanced at higher frequencies. The high values ofboth, dielectric losses, $+max, and dielectric permit-tivity, $*, suggest that these loss peaks are possiblerelated to the MWS interfacial polarization mecha-nisms. The first one, at lower frequencies, should berelated to the formation of donor-acceptor com-plexes at the PVDF-CNT interface in conjunctionwith the nanocapacitor structure of CNT and PVDFmatrix. The second one, at higher frequencies, it ispossible to be caused by a synergetic effect thatoccurs between the PVDF-CNT matrix and Fe3O4inclusions interfaces.However, it should be noted that further investiga-tion is needed to clarify the origin of these twopeaks.Values of dielectric permittivity were significantlyenhanced in the whole frequency range due to thepresence of both CNT and Fe3O4. Composites with10 wt% Fe3O4, present higher stability in dielectricpermittivity values in almost the whole frequency
Tsonos et al. – eXPRESS Polymer Letters Vol.9, No.12 (2015) 1104–1118
1115

spectrum, a behavior interesting for electronicsdevices applications. The incorporation of Fe3O4 inPVDF/CNT matrix gradually increases the valuesof both, dielectric permittivity and DC conductivity,when the content of Fe3O4 is up to 10 wt%. At thehigher magnetite content, the role of Fe3O4 as insu-lating barrier in the PVDF/CNT matrix should bedominant. On the one hand, Fe3O4 nanoparticles itis possible to increase the insulating gaps betweenCNT which led to a reduction in the dielectric per-mittivity of nanocapacitors, as well as to the totaldielectric permittivity. On the other hand, the possi-ble barrier effect of Fe3O4 nanoparticles restricts theconductive network of CNT and as a result reducesthe DC conductivity. PVDF/CNT/Fe3O4 ternary com-posites constitute a very promising system withlarge potential in diverse fields since combines andmatches together piezoelectric, electrical, dielectricand magnetic properties.
AcknowledgementsThis research has been co-financed by the European Union(European Social Fund – ESF) and Greek national fundsthrough the Operational Program ‘Education and LifelongLearning’ of the National Strategic Reference Framework(NSRF) � Research Funding Program: THALES. Investingin knowledge society through the European Social Fund.(MIS 379346).The authors also would like to thank Associate Professor M.Angelakeris for providing access to VSM instrument.
References [1] Sencadas V., Moreira V. M., Lanceros-Mendez S.,
Pouzada A. S., Filho R. G.: !- to ( transformation onPVDF films obtained by uniaxial stretch. MaterialsScience Forum, 514–516, 872–876 (2006).DOI: 10.4028/www.scientific.net/MSF.514-516.872
[2] Nalwa H. S.: Ferroelectric polymers: Chemistry,physics, and applications. Marcel Dekker, New York(1995).
[3] Kepler R. G., Anderson R. A.: Piezoelectricity and pyro-electricity in polyvinylidene fluoride. Journal of AppliedPhysics, 49, 4490–4494 (1978).DOI: 10.1063/1.325454
[4] Lovinger A. J.: Annealing of poly(vinylidene fluoride)and formation of a fifth phase. Macromolecules, 15,40–44 (1982).DOI: 10.1021/ma00229a008
[5] Chiang C. K., Popielarz R.: Polymer composites withhigh dielectric constant. Ferroelectrics, 275, 1–9 (2002).DOI: 10.1080/00150190214285
[6] Ishida H., Campbell S., Blackwell J.: General approachto nanocomposite preparation. Chemistry of Materials,12, 1260–1267 (2000).DOI: 10.1021/cm990479y
[7] Ezquerra T. A., Canalda J. C., Sanz A., Linares A.: Onthe electrical conductivity of PVDF composites withdifferent carbon-based nanoadditives. Colloid and Poly-mer Science, 292, 1989–1998 (2014).DOI: 10.1007/s00396-014-3252-6
[8] Prinz G. A.: Magnetoelectronics. Science, 282, 1660–1663 (1998).DOI: 10.1126/science.282.5394.1660
[9] Kumar J., Singh R. K., Samanta S. B., Rastogi R. C.,Singh R.: Single-step magnetic patterning of iron nano -particles in a semiconducting polymer matrix. Macro-molecular Chemistry and Physics, 207, 1584–1588(2006).DOI: 10.1002/macp.200600260
[10] Eerenstein W., Mathur N. D., Scott J. F.: Multiferroicand magnetoelectric materials. Nature, 442, 759–765(2006).DOI: 10.1038/nature05023
[11] Yang T-I., Brown R. N. C., Kempel L. C., Kofinas P.:Magneto-dielectric properties of polymer–Fe3O4 nano -composites. Journal of Magnetism and MagneticMaterials, 320, 2714–2720 (2008).DOI: 10.1016/j.jmmm.2008.06.008
[12] Wang X., Li W., Luo L., Fang Z., Zhang J., Zhu Y.:High dielectric constant and superparamagnetic poly-mer-based nanocomposites induced by percolationeffect. Journal of Applied Polymer Science, 125, 2711–2715 (2012).DOI: 10.1002/app.36587
[13] Prabhakaran T., Hemalatha J.: Ferroelectric and mag-netic studies on unpoled poly (vinylidine fluoride)/Fe3O4 magnetoelectric nanocomposite structures. Mate-rials Chemistry and Physics, 137, 781–787 (2013).DOI: 10.1016/j.matchemphys.2012.09.064
[14] Bhatt A. S., Krishna Bhat D., Santosh M. S.: Crys-tallinity, conductivity, and magnetic properties ofPVDF-Fe3O4 composite films. Journal of Applied Poly-mer Science, 119, 968–972 (2011).DOI: 10.1002/app.32796
[15] Xu C., Ouyang C., Jia R., Li Y., Wang X..: Magneticand optical properties of poly(vinylidene difluoride)/Fe3O4 nanocomposite prepared by coprecipitationapproach. Journal of Applied Polymer Science, 111,1763–1768 (2009).DOI: 10.1002/app.29194
[16] Zhang W-B., Zhang Z-X., Yang J-H., Huang T., ZhangN., Zheng X-T., Wang Y., Zhou Z-W.: Largely enhancedthermal conductivity of poly(vinylidene fluoride)/car-bon nanotube composites achieved by adding grapheneoxide. Carbon, 90, 242–254 (2015).DOI: 10.1016/j.carbon.2015.04.040
Tsonos et al. – eXPRESS Polymer Letters Vol.9, No.12 (2015) 1104–1118
1116
[17] Liu Z. D., Feng Y., Li W. L.: High dielectric constantand low loss of polymeric dielectric composites filled bycarbon nanotubes adhering BaTiO3 hybrid particles.RSC Advances, 5, 29017–29021 (2015).DOI: 10.1039/C5RA00639B
[18] Bauhofer W., Kovacs J. Z.: A review and analysis ofelectrical percolation in carbon nanotube polymer com-posites. Composites Science and Technology, 69, 1486–1498 (2009).DOI: 10.1016/j.compscitech.2008.06.018
[19] Li Q., Xue Q. Z., Gao X. L., Zheng Q. B.: Temperaturedependence of the electrical properties of the carbonnanotube/polymer composites. Express Polymer Let-ters, 3, 769–777 (2009).DOI: 10.3144/expresspolymlett.2009.95
[20] Mandal B. P., Vasundhara K., Abdelhamid E., LawesG., Salunke H. G., Tyagi A. K.: Improvement of mag-netodielectric coupling by surface functionalization ofnickel nanoparticles in ni and polyvinylidene fluoridenanohybrids. The Journal of Physical Chemistry C,118, 20819–20825 (2014).DOI: 10.1021/jp5065787
[21] Lanceros-Mendez S., Mano J. F., Costa A. M., SchmidtV. H.: FTIR and DSC studies of mechanically deformed(-PVDF films. Journal of Macromolecular SciencePart B: Physics, 40, 517–527 (2001).DOI: 10.1081/MB-100106174
[22] Vasundhara K., Mandal B. P., Tyagi A. K.: Enhance-ment of dielectric permittivity and ferroelectricity of amodified cobalt nanoparticle and polyvinylidene fluo-ride based composite. RSC Advances, 5, 8591–8597(2015).DOI: 10.1039/C4RA09292A
[23] Salimi A., Yousefi A. A.: Analysis method: FTIR stud-ies of (-phase crystal formation in stretched PVDFfilms. Polymer Testing, 22, 699– 704 (2003).DOI: 10.1016/S0142-9418(03)00003-5
[24] Gregorio Jr. R., Cestari M.: Effect of crystallizationtemperature on the crystalline phase content and mor-phology of poly(vinylidene fluoride). Journal of Poly-mer Science Part B: Polymer Physics, 32, 859–870(1994).DOI: 10.1002/polb.1994.090320509
[25] Matsushige K., Nagata K., Imada S., Takemura T.: TheII-I crystal transformation of poly(vinylidene fluoride)under tensile and compressional stresses. Polymer, 21,1391–1397 (1980).DOI: 10.1016/0032-3861(80)90138-X
[26] Ke K., Pötschke P., Jehnichen D., Fischer D., Voit B.:Achieving (-phase poly(vinylidene fluoride) from meltcooling: Effect of surface functionalized carbon nano -tubes. Polymer, 55, 611–619 (2014).DOI: 10.1016/j.polymer.2013.12.014
[27] Georgousis G., Pandis C., Kalamiotis A., Georgiopou-los P., Kyritsis A., Kontou E., Pissis P., Micusik M.,Czanikova K., Kulicek J., Omastova M.: Strain sens-ing in polymer/carbon nanotube composites by electri-cal resistance measurement. Composites Part B: Engi-neering, 68, 162–169 (2015).DOI: 10.1016/j.compositesb.2014.08.027
[28] Martins P., Costa C., Lanceros-Mendez S.: Nucleationof electroactive (-phase poly(vinilidene fluoride) withCoFe2O4 and NiFe2O4 nanofillers: A new method forthe preparation of multiferroic nanocomposites. AppliedPhysics A, 103, 233–237 (2011).DOI: 10.1007/s00339-010-6003-7
[29] Martins P., Costa C. M., Botelho G., Lanceros-MendezS., Barandiaran J. M., Gutierrez J.: Dielectric and mag-netic properties of ferrite/poly(vinylidene fluoride)nanocomposites. Materials Chemistry and Physics, 131,698–705 (2012).DOI: 10.1016/j.matchemphys.2011.10.037
[30] Martins P., Lopes A. C., Lanceros-Mendez S.: Elec-troactive phases of poly(vinylidene fluoride): Determi-nation, processing and applications. Progress in Poly-mer Science, 39, 683–706 (2014).DOI: 10.1016/j.progpolymsci.2013.07.006
[31] Levi N., Czerw R., Xing S., Iyer P., Carroll D. L.:Properties of polyvinylidene difluoride–carbon nano -tube blends. Nano Letters, 4, 1267–1271 (2004).DOI: 10.1021/nl0494203
[32] Huang X., Jiang P., Kim C., Liu F., Yin Y.: Influence ofaspect ratio of carbon nanotubes on crystalline phasesand dielectric properties of poly(vinylidene fluoride).European Polymer Journal, 45, 377–386 (2009).DOI: 10.1016/j.eurpolymj.2008.11.018
[33] Campbell D., White J. R.: Polymer characterization:Physical techniques. Chapman and Hall, London (1989).
[34] Assouline E., Lustiger A., Barber A. H., Cooper C. A.,Klein E., Wachtel E., Wagner H. D.: Nucleation abilityof multiwall carbon nanotubes in polypropylene com-posites. Journal of Polymer Science, Part B: PolymerPhysics, 41, 520–527 (2003).DOI: 10.1002/polb.10394
[35] Mi/u0ík M., Omastová M., Pionteck J., Pandis C.,Logakis E., Pissis P.: Influence of surface treatment ofmultiwall carbon nanotubes on the properties of poly -propylene/carbon nanotubes nanocomposites. Poly-mers for Advanced Technologies, 22, 38–47 (2011).DOI: 10.1002/pat.1745
[36] Bhattacharyya A. R., Sreekumar T. V., Liu T., KumarS., Ericson L. M., Hauge R. H., Smalley R. E.: Crys-tallization and orientation studies in polypropylene/single wall carbon nanotube composite. Polymer, 44,2373–2377 (2003).DOI: 10.1016/S0032-3861(03)00073-9
Tsonos et al. – eXPRESS Polymer Letters Vol.9, No.12 (2015) 1104–1118
1117
[37] Nakagawa K., Ishida Y.: Annealing effects in poly(vinylidene fluoride) as revealed by specific volumemeasurements, differential scanning calorimetry, andelectron microscopy. Journal of Polymer Science: Poly-mer Physics Edition, 11, 2153–2171 (1973).DOI: 10.1002/pol.1973.180111107
[38] Gregorio Jr R.: Determination of the !, (, and " crys-talline phases of poly(vinylidene fluoride) films pre-pared at different conditions. Journal of Applied Poly-mer Science, 100, 3272–3279 (2006).DOI: 10.1002/app.23137
[39] Cullity B. D., Graham C. D.: Introduction to magneticmaterials. Wiley, New Jersey (2009).
[40] Yuan J-K., Yao S-H., Dang Z-M., Sylvestre A., Gen-estoux M., Bai J.: Giant dielectric permittivity nanocom-posites: Realizing true potential of pristine carbon nan-otubes in polyvinylidene fluoride matrix through anenhanced interfacial interaction. Journal of PhysicalChemistry C, 115, 5515–5521 (2011).DOI: 10.1021/jp1117163
[41] Dey A., De A., De S. K.: Electrical transport anddielectric relaxation in Fe3O4–polypyrrole hybrid nano -composites. Journal of Physics: Condensed Matter, 17,5895–5910 (2005).DOI: 10.1088/0953-8984/17/37/025
[42] Wang L., Dang Z-M.: Carbon nanotube compositeswith high dielectric constant at low percolation thresh-old. Applied Physics Letters, 87, 042903/1–042903/3(2005).DOI: 10.1063/1.1996842
[43] Arjmand M., Apperley T., Okoniewski M., SundararajU.: Comparative study of electromagnetic interferenceshielding properties of injection molded versus com-pression molded multi-walled carbon nanotube/poly-styrene composites. Carbon, 50, 5126–5134 (2012).DOI: 10.1016/j.carbon.2012.06.053
[44] Simoes R., Silva J., Vaia R., Sencadas V., Costa P.,Gomes J., Lanceros-Méndez S.: Low percolation tran-sitions in carbon nanotube networks dispersed in apolymer matrix: Dielectric properties, simulations andexperiments. Nanotechnology, 20, 035703/1–035703/8(2009).DOI: 10.1088/0957-4484/20/3/035703
[45] Yao S-H., Dang Z-M., Xu H-P., Jiang M-J., Bai J.:Exploration of dielectric constant dependence on evo-lution of microstructure in nanotube/ferroelectric poly-mer nanocomposites. Applied Physics Letters, 92,082902/1–082902/3 (2008).DOI: 10.1063/1.2870104
[46] Bello A., Laredo E., Grimau M.: Distribution of relax-ation times from dielectric spectroscopy using MonteCarlo simulated annealing: Application to !–PVDF.Physical Review: B, 60, 12764–12774 (1999).DOI: 10.1103/PhysRevB.60.12764
[47] Kochervinskii V. V., Malyshkina I. A., Markin G. V.,Gavrilova N. D., Bessonova N. P.: Dielectric relax-ation in vinylidene fluoride–hexafluoropropylenecopolymers. Journal of Applied Polymer Science, 105,1107–1117 (2007).DOI: 10.1002/app.26145
[48] Chanmal C., Jog J.: Dielectric relaxation spectroscopyfor polymer nanocomposites. in ‘Characterization tech-niques for polymer nanocomposites’ (ed.: Mittal V.)Wiley, New York, 167–184 (2012).DOI: 10.1002/9783527654505.ch7
[49] Wübbenhorst M., Turnhout J.: Conduction – free dielec-tric loss #$/#lnf – A powerful tool for the analysis ofstrong (ion) conducting dielectric materials. DielectricsNewsletter: Scientific Newsletters for Dielectric andImpedance Spectroscopy, 14, 1–3 (2000).
[50] Cao W., Gerhardt R.: Calculation of various relaxationtimes and conductivity for a single dielectric relax-ation process. Solid State Ionics, 42, 213–221 (1990).DOI: 10.1016/0167-2738(90)90010-O
[51] Sadeghi F., Ajji A.: Study of crystal structure of (poly -vinylidene fluoride/clay) nanocomposite films: Effectof process conditions and clay type. Polymer Engi-neering and Science, 49, 200–207 (2009).DOI: 10.1002/pen.21248
[52] Macedo P. B., Moynihan C. T., Bose R.: The role ofionic diffusion in polarization in vitreous ionic conduc-tors. Physics and Chemistry Glasses, 13, 171–179(1972).
[53] Macdonald J. R.: Comments on the electric modulusformalism model and superior alternatives to it for theanalysis of the frequency response of ionic conductors.Journal of Physics and Chemistry of Solids, 70, 546–554 (2009).DOI: 10.1016/j.jpcs.2008.12.012
[54] Nikonorova N. A., Barmatov E. B., Pebalk D. A., Bar-matova M. V., Dominguez-Espinosa G., Diaz-CallejaR., Pissis P.: Electrical properties of nanocompositesbased on comb-shaped nematic polymer and silvernanoparticles. Journal of Physical Chemistry C, 111,8451–8458 (2007).DOI: 10.1021/jp068688a
Tsonos et al. – eXPRESS Polymer Letters Vol.9, No.12 (2015) 1104–1118
1118