multifunctional molecular dna machine for rna analysis dna
TRANSCRIPT

1
DNA Nanotechnology for Nucleic Acid Analysis: Multifunctional Molecular DNA Machine for RNA Analysis
A. J. Cox,a,b H. N. Bengtson,a,b K. H. Rohdeb and D. M. Kolpashchikova,b
aChemistry Department, University of Central Florida, 4000 Central Florida Boulevard, Orlando, FL 32816-2366, USAbBurnett School of Biomedical Sciences, University of Central Florida, 4000 Central Florida Boulevard, Orlando, FL 32816-2366, USA*Corresponding authors: E-mail: [email protected]; Tel.: (+1) 407-823-6752; Fax: (+1) 1407-823-2252
Supporting Information
Table of Contents
1. Materials and Methods 2. Detailed Experimental Procedures3. Table S1. Oligonucleotides used in the study4. Figure S1. MDMR1_Msg in complex with 16S rRNA5. Limits of Detection of RMsg (Figure S2) and DMsg (Figure S3) by Msg Sensors6. Figure S4. Kinetics of MDMR1_Msg, no RNA-binding arms and MDMR1_Msg, no Hook
strands7. Figure S5. Kinetics of sensors in the presence of RMsg over 8 hr assay8. Selectivity of MDMR1 approach (Figure S6)9. Analysis of alternative RNA target: 16S rRNA of Mycobacterium tuberculosis (Mtb) (Figure S7)10. References
Electronic Supplementary Material (ESI) for ChemComm.This journal is © The Royal Society of Chemistry 2016

2
1. Materials and MethodsMaterials and instrumentation. DNAse/RNAse-free water was purchased from Fisher Scientific, Inc. (Pittsburgh, PA) and used for all buffers and for the stock solutions of oligonucleotides. Fluorogenic substrates (F_sub and F_sub-1) were synthesised and HPLC purified by TriLink BioTechnologies, Inc. (San Diego, CA). All other oligonucleotides (see Table S1 for sequences) were obtained from Integrated DNA Technologies, Inc. (Coralville, IA). The oligonucleotides were dissolved in water and stored at -20 oC until needed. Stock concentrations of oligonucleotides were calculated by measuring the absorption of the solutions at 260 nm by using a Perkin–Elmer Lambda 35 UV/Vis spectrometer (San Jose, CA). Extinction coefficients of oligonucleotides were calculated by using OligoAnalyzer 3.1 software (Integrated DNA Technologies, Inc.) Fluorescent spectra were recorded on a Perkin–Elmer LS-55 luminescence spectrometer equipped with a Hamamatsu xenon lamp. Experiments were performed at excitation wavelength of 485 nm. Emission of FAM was monitored at 517 nm. Excitation and emission slits were both 10 nm. The data were processed by using Microsoft Excel.
RNA isolation. Total RNA was isolated from M. smegmatis (strain MC2 155) as previously published.[1] The concentration of total RNA was calculated by measuring its absorption at 260 nm using a Nanodrop spectrophotometer and taking into account that 1 OD260 corresponds to 40 µg/mL. The stock concentration for M. smegmatis total RNA was 1400 ng/µl. The fraction of 16S rRNA in total RNA was estimated based on the following assumptions: (i) rRNAs constitute about 80% of total RNA; (ii) 16S rRNA constitute about 34% of rRNA.
2. Detailed Experimental Procedures. 2.1. Assembling of MDMR1 sensor. Stock solutions of MDMR1_Msg were prepared by annealing 100 nM of each of the nine tile strands, T1-T9 (Table S1) in the reaction buffer (50 mM HEPES, pH 7.4, 50 mM MgCl2, 20 mM KCl, 120 mM NaCl, 0.03% Triton X-100, 1% DMSO).
2.2. Concentration-dependence experiments. Each sample was 60 µL and prepared in the reaction buffer (50 mM HEPES, pH 7.4, 50 mM MgCl2, 20 mM KCl, 120 mM NaCl, 0.03% Triton X-100, 1% DMSO). The following working concentrations of oligonucleotides were used: the substrates (either F_sub or F_sub-1) were at 200 nM; Hook, when applicable, was at 160 nM; DZa was at 2 nM; and 10 nM was the concentration for DZb_Msg or MDMR1_Msg in cases involving BiDZ or MDMR1, respectively. Analyte concentrations were 0, 0.5, 1, 2, 5, 10, and 20 pM for DMsg and 0.003, 0.01, 0.03, and 0.3 ng/µL for RMsg (total M. smegmatis RNA). The samples were incubated at 55 oC, and the fluorescence of the samples was measured after 20 and 60 min at 517 nm, upon excitation at 485 nm. At least three trials were completed for each of BiDZ_Msg; MDMR1_Msg; MDMR1_Msg, no hooks; and MDMR1_Msg, no RNA-binding arms. For BiDZ assay F_sub was used, while for MDMR1 assay F_sub-1 was used. The conversion of ng/µL total RNA into pM for 16S rRNA was performed according to the equations: C (pM) = X mg/µL×0.8×0.34×106 µL/L × 10-9 g/ng × (1/339.6 g) × (1 / 1537mol/base) × 1012 pmol/mol
2.3. Kinetic Experiments. Each sample was 25 µL total with ROX at 50 nM, a fluorogenic substrate at 200 nM, and Hook strand, when applicable, at 160 nM in the reaction buffer (50 mM HEPES, pH 7.4, 50 mM MgCl2, 20 mM KCl, 120 mM NaCl, 0.03% Triton X-100, 1% DMSO). The sensors (BiDZ_Msg; MDMR1_Msg; MDMR1_Msg, no hooks; or MDMR1_Msg, no RNA binding arms) were made of 2 nM DZa and 10 nM DZb_Msg or MDMR1_Msg. Analytes DMsg or RMsg were added to the final concentration of 100 pM to initiate the reaction. The fluorescence of FAM and ROX were read in a QuantStudio™ 6 Flex Real-Time PCR System every 30 sec for the first hour and every 5 min for the next 7 hrs. ROX was used as a reference dye to account for the noise in the samples according to the manufacturer suggested protocol. The ratio of FFam/FRox was calculated and used to plot the signal versus time.

3
3. Table S1. Oligonucleotides used in the study
Name Sequence 5‘ 3‘a-,f Purificationg
F_sub-1 CGGT ACA TTG TAG AAG TT AAG GTTFAM TCC TCg uCC CTG GGC A-BHQ1
HPLC
F_sub AAG GTTFAM TCC TCg uCCC TGG GCA-BHQ1 HPLCDMsg CCT GCT GGT CGC ATG GCC TGG TAG G GG AAA GCT TTT
GCG GTG TGG GAT GGSD
DMsg_mm-2 CCT GCT GGT CGC ATG GCC TGG TAG GGG AAA GTT TTT GCG GTG
SD
DMsg_mm-1 CCT GCT GGT CGC ATG GCC TGG TAG GGG AAA GCT TTT GTG GTG
SD
DMtb CAC GGG ATG CAT GTC TTG TGG TGG AAA GCG CTT TAG CGG TGT GGG ATG AG
SD
DZa_Msg CC ATC CCA CAC CGC AAA AGC TTT CC ACA ACG AGA GGA AAC CTT
SD
DZa_Msg_new CAC CGC AAA AGC TTT CC ACAACGA GAG GAA ACC TT SDDZa_Msg_mm1 CAC CAC AAA AGC TTT CC ACAACGA GAG GAA ACC TT SDDZa_Msg_mm2 CAC CGC AAA AAC TTT CC ACAACGA GAG GAA ACC TT SD
DZb_Msg TGC CCA GGG AGG CTA GCT CCT ACC AGG CCA TGC GAC CAG CAG G
SD
T1 CTC TAC TGA CGT GCC G TTT CGTCGATACGATGCA GTACTGTCGCAT TTT CTC TAC TGA CGT GCC G
SD
T2 CTC TAC TGA CGT GCC G TTT AGC TGA TCA CAC TAG ATT CTG TAG TGC ATC GTA TCG ACG TTT CTC TAC TGA CGT GCC G
SD
T3 CTC TAC TGA CGT GCC G TTT ATG CGA CAG TAC CCG ATC GTC ATG AGC ACC TAA CTT TTG GCC ATC ACC CCA CCA ACA AGC
SD
T3_(Mtb) CTC TAC TGA CGT GCC G TT ATG CGA CAG TAC CCG ATC GTC ATG AGC ACC TAA CTT TTC CAT CAC CCC ACC AAC AAG CTG ATA GGC CGC GGG
SD
T4 CTC TAC TGA CGT GCC GTT TGT AAC GAC CGA TGA GTG TGA TCA GCT TTT CTC TAC TGA CGT GCC G
SD
T6 CTC TAC TGA CGT GCC GTT TAG TTA GGT CTC AGC ATC ATC GAG CCT GAT TTC TCT ACT GAC GTG CCG
SD
T7 G TAT TCG GTA TTA GAC CCA GTT TCC CAG TTT AGA CCG TGA GCA TTG ACA ACT GGA TCG CAT CGG TCG TTA CTT TCT CTA CTG ACG TGC CG
SD
T7 (Mtb) GTC GTA TTC GGT ATT AGA CCC AGT TTC CCTT TAG ACC GTG AGC ATT GAC AAC TGG ATC GCA TCG GTC GTT ACT TCT CTA CTG ACG TGC CG
SD
T8 CTC TAC TGA CGT GCC G TTT TCA GGC TCG ATG ATG CAG TCT CAG GTC ACT GAA CTG GTA GCG TAC CTT TCT CTA CTG ACG TGC CG
SD
T9 CTC TAC TGA CGT GCC G TTT GGTACGATACCAGTTCAGTG TCA ATG CTC ACG GTC T TTT CTC TAC TGA CGT GCC G
SD
T5 (DZb_Msg) TGC CCA GGG AGG CTA GCT CCT ACC AGG CCA TGC GAC C AGC AGG TTT CAG AAT CTC GAT CCA GTT GAC CTG AGA CTT GAC GAT CGG CAT
SD
DZa_Mtb CTC ATC CCA CAC CGC TAA AGC GCT TAC AAC GAG AGG SD

4
AAA CCT TDZb_Mtb TGC CCA GGG AGG CTA GCT TCC ACC ACA AGA CAT GCA
T CCC GTGSD
T5 (DZb-_Mtb) TGC CCA GGG AGG CTA GCT TCC ACC ACA AGA CAT GCA T CCC GTG /iSp9/ CAG AAT CTC GAT CCA GTT GAC CTG AGA CTT GAC GAT CGG CAT
SD
Hook AA CTT CTA CAA TGT ACCG TTTTT CGG CAC GTC AGT AGA G
SD
aBHQ-1 – Black Hole Quencher1bnucleotides in red are mismatched to the DMsg analyte
ciSp9, internal triethylene glycol spacer (IDT)dRibonucleotides are in low caseeoligo thymidine linkers are in italicfundelined sequence are part of DZ catalytic coregSD, standard desalting

5
4. Figure S1. MDMR1_Msg in complex with 16S rRNA
Figure S1. Structure of RNA and DNA used in this study. A) Secondary structure of DMsg predicated by Mfold at 55oC in the 190 mM Na+, 50 mM Mg2+. B) Mfold predicted secondary structure of the following fragment of M. smegmatis 16S rRNA (nt 141-314): 5‘-UGG GAU AAG CCU GGG AAA CUG GGU CUA AUA CCG AAU ACA CCC UGC UGG UCG CAU GGC CUG GUA GGG GAA AGC UUU UGC GGU GUG GGA UGG GCC CGC GGC CUA UCA GCU UGU UGG UGG GGU GAU GGC CUA CCA AGG CGA CGA CGG GUA GCC GGC CUG AGA GGG UGA CCG GCC A. Note that the folding conformation can be different in the full-size 16S rRNA. Fragment bound by MDMR1_Msg are shown by the lines of different colors next to the correspondent nucleotides. C) Predicted structure of MDMR1_Msg in complex with the complementary fragment of 16S rRNA analyte.

6
5. Limits of Detection of RMsg (Figure S2) and DMsg (Figure S3) by BiDZ probe and MDMR1
Limits of detection for BiDZ and MDMR sensors were calculated as signals corresponding to the average blank plus three standard deviations based on the concentration dependences shown in Figures 2S and 3S.
Limit of Detection Sample Calculation:
Figure S2A. The graph shows the best fit line from the averaged points of three trials. Error bars show one standard deviation for each point.
a) Fau = 0.366[RMsg] + 5.87 Standard Deviation at 0.00 ng/uL of RMsg = 1.05b) Fau = 0.592[RMsg] + 7.89 Standard Deviation at 0.00 ng/uL of RMsg = 0.54c) Fau = 0.338[RMsg] + 3.77 Standard Deviation at 0.00 ng/uL of RMsg = 0.16d) Fau = 3.278[RMsg] + 8.86 Standard Deviation at 0.00 ng/uL of RMsg = 0.44
Threshold = (𝑆𝑇𝐷𝐸𝑉) ∗ 3 + (𝑎𝑣𝑒𝑟𝑎𝑔𝑒 𝑜𝑓
0.00 𝑛𝑔𝑢𝐿
𝑌 𝑣𝑎𝑙𝑢𝑒)
a) (1.05) * 3 + 6.14 = 9.28b) (0.54) * 3 + 8.36 = 9.98c) (0.16) * 3 + 3.75 = 4.22d) (0.44) * 3 + 8.83 = 10.14
Threshold values were plugged into their respective best fit line equations and solved for Y.
a)𝑌 =
9.28 ‒ 5.870.366
= 9.32 𝑛𝑔/𝑢𝐿
b)𝑌 =
9.98 ‒ 7.890.592
= 3.53 𝑛𝑔/𝑢𝐿
c)𝑌 =
4.22 ‒ 3.770.338
= 1.33 𝑛𝑔/𝑢𝐿
d)𝑌 =
10.14 ‒ 8.833.278
= 0.39 𝑛𝑔/𝑢𝐿
Figures S2B and S3A/B were calculated with a similar method except the highest concentration of analyte was not used in the calculations to prevent negative numbers.

7
Figure S2. Dependence of the sensors fluorescent signal on RMsg concentration in (A) 20 min and (B) 60 min assay. The signal is shown for BiDZ_Msg (a), MDMR1_Msg, no RNA binding arms (b), MDMR1_Msg, no Hooks (c), and MDMR1_Msg (d). Reaction mixtures contained 200 nM F_sub-1 (for tile associated sensors) or 200 nM F_sub (for tile-free sensor), 2 nM DZa_Msg and 10 nM DZb_Msg (a) or MDMR1_Msg, no RNA binding arms (b), MDMR1_Msg, no Hook (c) or MDMR1 (d), and Hook (160 nM when applicable). Samples were incubated at 55oC in reaction buffer (50 mM HEPES, pH 7.4, 50 mM MgCl2, 20 mM KCl, 120 mM NaCl, 0.03% Triton X-100, 1% DMSO) with different concentrations of RMsg. Fluorescent intensities were measured at 517 nm (excitation at 485 nm). The slopes of the correspondent linear trendlines are 0.366 (a), 0.592 (b), 0.338 (c), and 3.278 (d) for 20 min assay and 1.732 (a), 5.692 (b), 1.829 (c), and 10.97 (c) for 60 min assay. Limit of Detection values are shown in Table 1. Data are average values of three independent experiments.

8
Figure S3. Dependence of the sensors fluorescent signal on DMsg concentration in (A) 20 min and (B) 60 min assay. The signal is shown for BiDZ_Msg (a), MDMR1_Msg, no RNA binding arms (b), MDMR1_Msg, no Hooks (c), and MDMR1_Msg (d). Reaction mixtures contained 200 nM F_sub-1 (for tile associated sensors) or 200 nM F_sub (for tile-free sensor), 2 nM DZa_Msg and 10 nM DZb_Msg (a) or MDMR1_Msg, no RNA binding arms (b) MDMR1_Msg, no Hook (c) or MDMR1 (d), and Hook (160 nM when applicable). Samples were incubated at 55oC in the reaction buffer (50 mM HEPES, pH 7.4, 50 mM MgCl2, 20 mM KCl, 120 mM NaCl, 0.03% Triton X-100, 1% DMSO) with different concentrations of DMsg. Fluorescent intensities were measured at 517 nm (excitation at 485 nm) after 20 (A) and 60 (B) min. The slopes of the correspondent linear trendlines are 0.008 (a), 0.033 (b), 0.010 (c), and 0.027 (d) for 20 min assay and are 0.051 (a), 0.102 (b), 0.030 (c), and 0.098 (d) for 60 min assay. Limit of detection values are shown in Table 1. Data are averages of three independent experiments.

9
6. Figure S4. Kinetics of MDMR1_Msg, no RNA-binding arms and MDMR1_Msg, no Hook strands
Figure S4. Time-dependence of the fluorescent signal for MDMR1_Msg, no RNA-binding arms (grey) and MDMR1_Msg, no Hook strands (black) in the presence of 100 pM DMsg (solid lines) or 100 pM RMsg (dashed lines). BiDZ_Msg sensor towards DMsg is shown as a reference (dotted line). Points (a) and (b) indicate where RMsg and DMsg trigger equal fluorescence response of the sensor MDMR1_Msg, no RNA-binding arms (a) or MDMR1_Msg, no Hook strands (b). Samples were incubated at 55 oC in the reaction buffer (50 mM HEPES, pH 7.4, 50 mM MgCl2, 20 mM KCl, 120 mM NaCl, 0.03% Triton X-100, 1% DMSO).

10
7. Figure S5. Signal accumulation for different MDMR1 representations in the presence of RMsg over 8 hrs
Figure S5. Time-dependence of the fluorescent response to RMsg for BiDZ_Msg, MDMR1_Msg, no RNA-binding arms; MDMR1_Msg, no Hook strands; and MDMR1_Msg. Samples were incubated at 55 oC in the reaction buffer (50 mM HEPES, pH 7.4, 50 mM MgCl2, 20 mM KCl, 120 mM NaCl, 0.03% Triton X-100, 1% DMSO) with analyte concentrations at 100 pM. MDMR1_Msg results are an average from three individual experiments, BiDZ_Msg results are an average from two individual experiments, and MDMR1_Msg, no RNA-binding arms and MDMR1_Msg, no Hook strands results are from a single experiment.
11
8. Selectivity of MDMR1 approach (Figure S6)
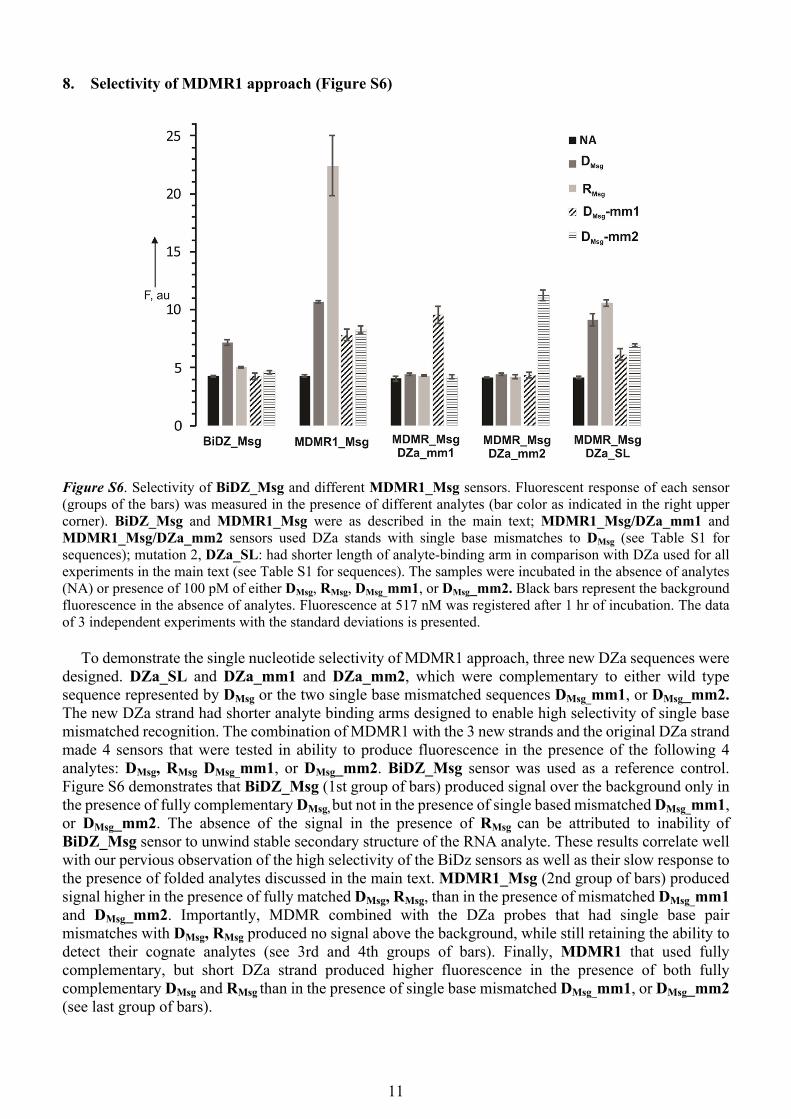
Figure S6. Selectivity of BiDZ_Msg and different MDMR1_Msg sensors. Fluorescent response of each sensor (groups of the bars) was measured in the presence of different analytes (bar color as indicated in the right upper corner). BiDZ_Msg and MDMR1_Msg were as described in the main text; MDMR1_Msg/DZa_mm1 and MDMR1_Msg/DZa_mm2 sensors used DZa stands with single base mismatches to DMsg (see Table S1 for sequences); mutation 2, DZa_SL: had shorter length of analyte-binding arm in comparison with DZa used for all experiments in the main text (see Table S1 for sequences). The samples were incubated in the absence of analytes (NA) or presence of 100 pM of either DMsg, RMsg, DMsg_mm1, or DMsg_mm2. Black bars represent the background fluorescence in the absence of analytes. Fluorescence at 517 nM was registered after 1 hr of incubation. The data of 3 independent experiments with the standard deviations is presented.
To demonstrate the single nucleotide selectivity of MDMR1 approach, three new DZa sequences were designed. DZa_SL and DZa_mm1 and DZa_mm2, which were complementary to either wild type sequence represented by DMsg or the two single base mismatched sequences DMsg_mm1, or DMsg_mm2. The new DZa strand had shorter analyte binding arms designed to enable high selectivity of single base mismatched recognition. The combination of MDMR1 with the 3 new strands and the original DZa strand made 4 sensors that were tested in ability to produce fluorescence in the presence of the following 4 analytes: DMsg, RMsg DMsg_mm1, or DMsg_mm2. BiDZ_Msg sensor was used as a reference control. Figure S6 demonstrates that BiDZ_Msg (1st group of bars) produced signal over the background only in the presence of fully complementary DMsg, but not in the presence of single based mismatched DMsg_mm1, or DMsg_mm2. The absence of the signal in the presence of RMsg can be attributed to inability of BiDZ_Msg sensor to unwind stable secondary structure of the RNA analyte. These results correlate well with our pervious observation of the high selectivity of the BiDz sensors as well as their slow response to the presence of folded analytes discussed in the main text. MDMR1_Msg (2nd group of bars) produced signal higher in the presence of fully matched DMsg, RMsg, than in the presence of mismatched DMsg_mm1 and DMsg_mm2. Importantly, MDMR combined with the DZa probes that had single base pair mismatches with DMsg, RMsg produced no signal above the background, while still retaining the ability to detect their cognate analytes (see 3rd and 4th groups of bars). Finally, MDMR1 that used fully complementary, but short DZa strand produced higher fluorescence in the presence of both fully complementary DMsg and RMsg than in the presence of single base mismatched DMsg_mm1, or DMsg_mm2 (see last group of bars).
12
9. Analysis of alternative RNA target: 16S rRNA of Mycobacterium tuberculosis (Mtb) (Figure S7)
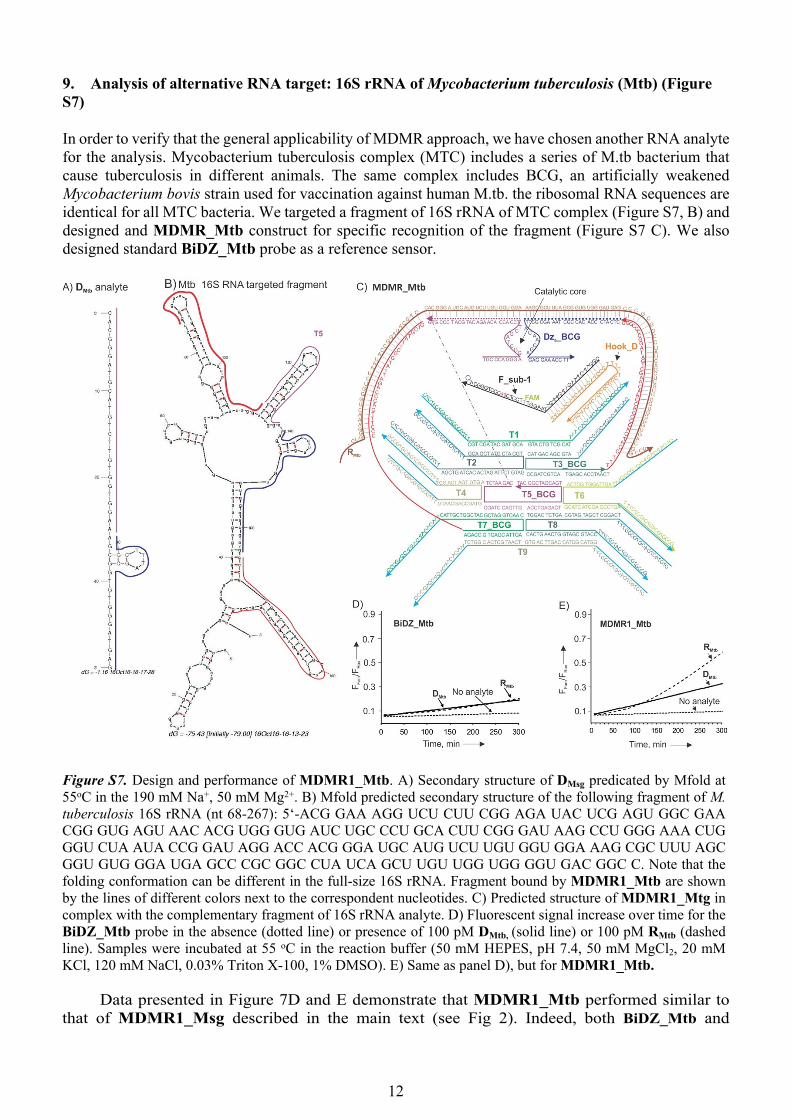
In order to verify that the general applicability of MDMR approach, we have chosen another RNA analyte for the analysis. Mycobacterium tuberculosis complex (MTC) includes a series of M.tb bacterium that cause tuberculosis in different animals. The same complex includes BCG, an artificially weakened Mycobacterium bovis strain used for vaccination against human M.tb. the ribosomal RNA sequences are identical for all MTC bacteria. We targeted a fragment of 16S rRNA of MTC complex (Figure S7, B) and designed and MDMR_Mtb construct for specific recognition of the fragment (Figure S7 C). We also designed standard BiDZ_Mtb probe as a reference sensor.
Figure S7. Design and performance of MDMR1_Mtb. A) Secondary structure of DMsg predicated by Mfold at 55oC in the 190 mM Na+, 50 mM Mg2+. B) Mfold predicted secondary structure of the following fragment of M. tuberculosis 16S rRNA (nt 68-267): 5‘-ACG GAA AGG UCU CUU CGG AGA UAC UCG AGU GGC GAA CGG GUG AGU AAC ACG UGG GUG AUC UGC CCU GCA CUU CGG GAU AAG CCU GGG AAA CUG GGU CUA AUA CCG GAU AGG ACC ACG GGA UGC AUG UCU UGU GGU GGA AAG CGC UUU AGC GGU GUG GGA UGA GCC CGC GGC CUA UCA GCU UGU UGG UGG GGU GAC GGC C. Note that the folding conformation can be different in the full-size 16S rRNA. Fragment bound by MDMR1_Mtb are shown by the lines of different colors next to the correspondent nucleotides. C) Predicted structure of MDMR1_Mtg in complex with the complementary fragment of 16S rRNA analyte. D) Fluorescent signal increase over time for the BiDZ_Mtb probe in the absence (dotted line) or presence of 100 pM DMtb, (solid line) or 100 pM RMtb (dashed line). Samples were incubated at 55 oC in the reaction buffer (50 mM HEPES, pH 7.4, 50 mM MgCl2, 20 mM KCl, 120 mM NaCl, 0.03% Triton X-100, 1% DMSO). E) Same as panel D), but for MDMR1_Mtb.
Data presented in Figure 7D and E demonstrate that MDMR1_Mtb performed similar to that of MDMR1_Msg described in the main text (see Fig 2). Indeed, both BiDZ_Mtb and

13
MDMR1_Mtb demonstrated an increased fluorescent signal over time when RMtb or DMtb were present in the samples (Fig. 7 D and E). Both sensors responded with a linear initial rate to DMsg. In contrast, fluorescence increase for the sensors in the presence of RMtb had a time delay, which was presumably caused by weakened probe interaction with folded RNA conformation. For MDMR1_Mtb, however, the slope of the initial phase was similar to that for DMtb, which can be attributed to the unwinding of the RNA secondary structure by the RNA-binding arms of MDMR1_Mtb in full consistence with our observations demonstrated in Figure 2 of the main text.
10. References
[1] T. J. Fu, N. C. Seeman. Biochemistry. 1993, 32, 8062-8067.[2] A. V. Garibotti, S.M. Knudsen, A.D. Ellington, N.C.Seeman Nano Lett. 2006, 6, 1505-1507. [3] J. Fu, Y. R. Yang, A. Johnson-Buck, M. Liu, Y. Liu, N. G. Walter, N.W. Woodbury, H. Yan, Nature
Nanotech. 2014, 9, 531-536.[4] D. M. Kolpashchikov, Chembiochem 2007, 8, 2039-2042.[5] E. Mokany, S. M. Bone, P. E. Young, T. B. Doan, A. V. Todd, J. Am. Chem. Soc. 2010, 132, 1051-
1059.[6] Y. V. Gerasimova, E. Cornett, D. M. Kolpashchikov, ChemBioChem 2010, 11, 811-817.[7] D. MacDougall, W. B. Crummett, Anal. Chem. 1980, 52, 2242– 2249.