multidisciplinary design optimisation strategies for ... · amit prem1, christophe bastien1 and...
TRANSCRIPT
10th
European LS-DYNA Conference 2015, Würzburg, Germany
© 2015 Copyright by DYNAmore GmbH
Multidisciplinary Design Optimisation Strategies for Lightweight Vehicle Structures
Amit Prem1, Christophe Bastien
1 and Mike Dickison
2
1 Coventry University
Faculty of engineering and Computing Coventry, CV1 5FB, UK
1 Introduction
The future of automobiles will be driven by lightweight structures and highly efficient powertrains. The TARF-LCV EPSRC funded project (Towards Affordable, Closed-Loop Recyclable Future-Low Carbon Vehicle Structures) [1] aims to provide a strong scientific and technological underpinning to future LCV development in areas of advanced materials, low carbon manufacturing technologies, holistic mass-optimised vehicle structure design and closed-loop recycling of end of life vehicles. The initial work undertaken computed the ideal loadpath of the vehicle with the help of linear topology optimisation [2]. From previous research, it was documented that the most realistic boundary condictions to apply in the case of modelling crash events was Inertia Relief, in favour of standard boundary conditions [3][4][5][6]. Inertia relief works by balancing the external loading with inertial loads and accelerations within the structure itself. This is specifically done by "adding" an extra displacement-dependent load to the load vector {F} in (1). Inertia relief has the benefit to prevent any structural loadpath definition skewing, as in crash events the vehicle structure is in motion and not physically restrained to its wheels.
(1)
The optimisation method utilised was based on a SIMP algorithm, which penalised the vehicle structure design envelope Youngs Modulus, part of the stiffness matrix, leading to a vehicle mass reduction (2). It was documented that a SIMP penalty factor p of 1 was adequate to obtain usefull structural results [7].
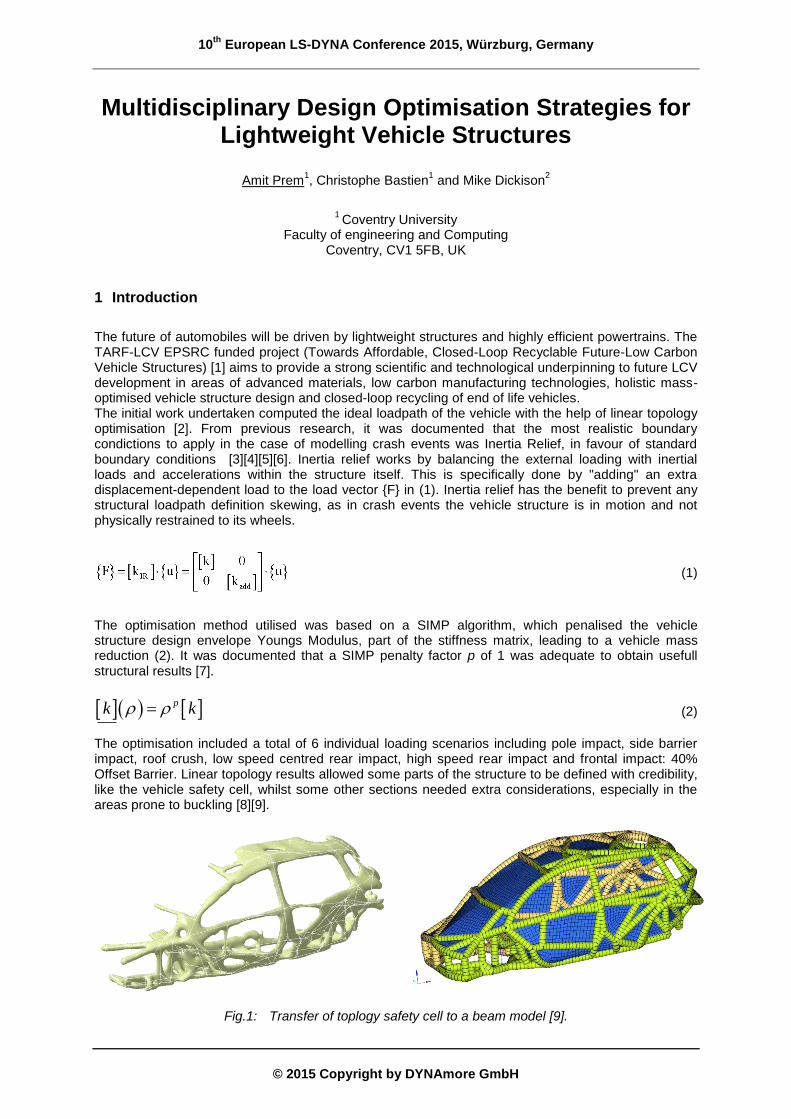
The optimisation included a total of 6 individual loading scenarios including pole impact, side barrier impact, roof crush, low speed centred rear impact, high speed rear impact and frontal impact: 40% Offset Barrier. Linear topology results allowed some parts of the structure to be defined with credibility, like the vehicle safety cell, whilst some other sections needed extra considerations, especially in the areas prone to buckling [8][9].
Fig.1: Transfer of toplogy safety cell to a beam model [9].
pk k
(2)
10th
European LS-DYNA Conference 2015, Würzburg, Germany
© 2015 Copyright by DYNAmore GmbH
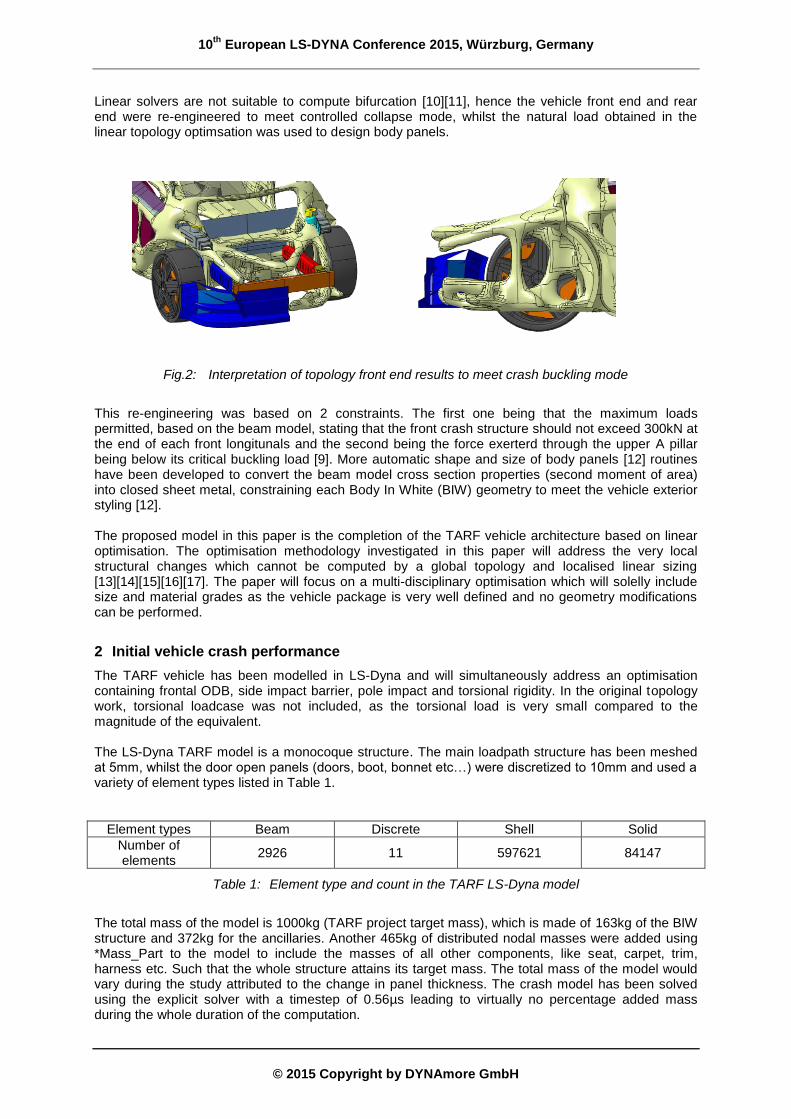
Linear solvers are not suitable to compute bifurcation [10][11], hence the vehicle front end and rear end were re-engineered to meet controlled collapse mode, whilst the natural load obtained in the linear topology optimsation was used to design body panels.
Fig.2: Interpretation of topology front end results to meet crash buckling mode
This re-engineering was based on 2 constraints. The first one being that the maximum loads permitted, based on the beam model, stating that the front crash structure should not exceed 300kN at the end of each front longitunals and the second being the force exerterd through the upper A pillar being below its critical buckling load [9]. More automatic shape and size of body panels [12] routines have been developed to convert the beam model cross section properties (second moment of area) into closed sheet metal, constraining each Body In White (BIW) geometry to meet the vehicle exterior styling [12]. The proposed model in this paper is the completion of the TARF vehicle architecture based on linear optimisation. The optimisation methodology investigated in this paper will address the very local structural changes which cannot be computed by a global topology and localised linear sizing [13][14][15][16][17]. The paper will focus on a multi-disciplinary optimisation which will solelly include size and material grades as the vehicle package is very well defined and no geometry modifications can be performed.
2 Initial vehicle crash performance
The TARF vehicle has been modelled in LS-Dyna and will simultaneously address an optimisation containing frontal ODB, side impact barrier, pole impact and torsional rigidity. In the original topology work, torsional loadcase was not included, as the torsional load is very small compared to the magnitude of the equivalent. The LS-Dyna TARF model is a monocoque structure. The main loadpath structure has been meshed at 5mm, whilst the door open panels (doors, boot, bonnet etc…) were discretized to 10mm and used a variety of element types listed in Table 1.
Element types Beam Discrete Shell Solid
Number of elements
2926 11 597621 84147
Table 1: Element type and count in the TARF LS-Dyna model
The total mass of the model is 1000kg (TARF project target mass), which is made of 163kg of the BIW structure and 372kg for the ancillaries. Another 465kg of distributed nodal masses were added using *Mass_Part to the model to include the masses of all other components, like seat, carpet, trim, harness etc. Such that the whole structure attains its target mass. The total mass of the model would vary during the study attributed to the change in panel thickness. The crash model has been solved using the explicit solver with a timestep of 0.56µs leading to virtually no percentage added mass during the whole duration of the computation.
10th
European LS-DYNA Conference 2015, Würzburg, Germany
© 2015 Copyright by DYNAmore GmbH
Fig.3: TARF model frontal and side impact setup
The impact velocities have been set as per table 2.
Scenarios Impact speed (m/s)
Front crash 17.9
Side impact 11.7
Pole impact 8.3
Table 2: Impact velocities for each safety loadcase
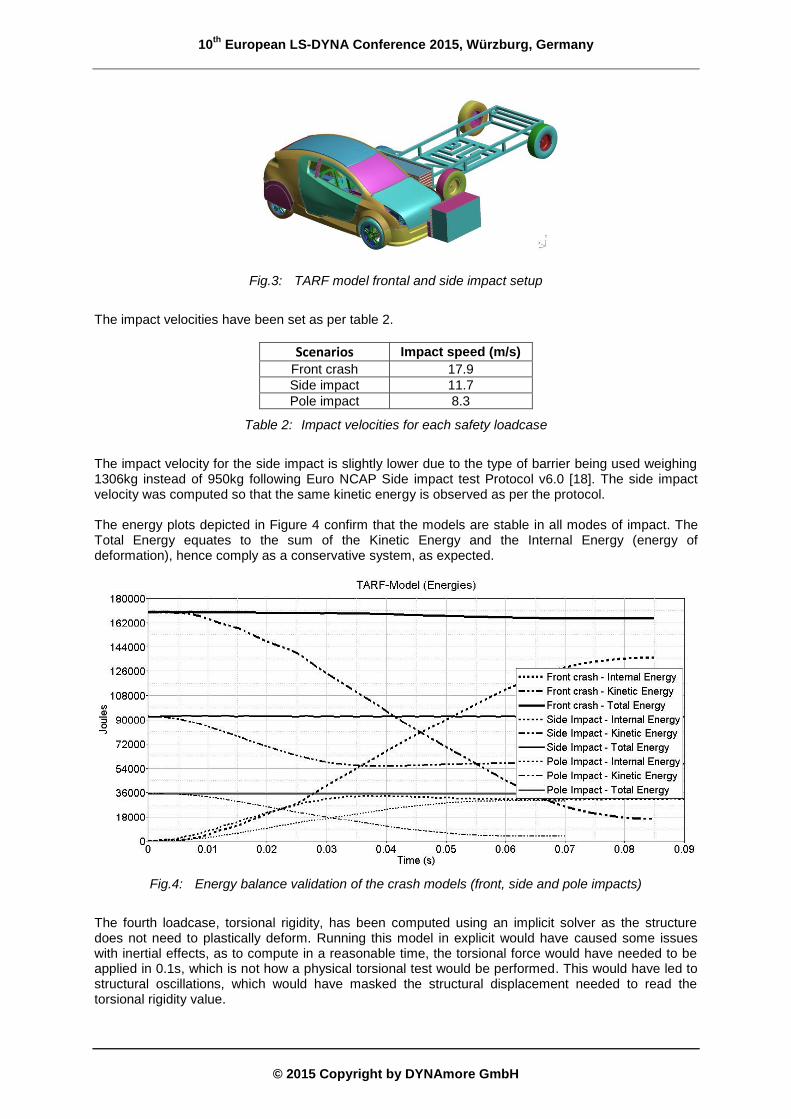
The impact velocity for the side impact is slightly lower due to the type of barrier being used weighing 1306kg instead of 950kg following Euro NCAP Side impact test Protocol v6.0 [18]. The side impact velocity was computed so that the same kinetic energy is observed as per the protocol. The energy plots depicted in Figure 4 confirm that the models are stable in all modes of impact. The Total Energy equates to the sum of the Kinetic Energy and the Internal Energy (energy of deformation), hence comply as a conservative system, as expected.
Fig.4: Energy balance validation of the crash models (front, side and pole impacts)
The fourth loadcase, torsional rigidity, has been computed using an implicit solver as the structure does not need to plastically deform. Running this model in explicit would have caused some issues with inertial effects, as to compute in a reasonable time, the torsional force would have needed to be applied in 0.1s, which is not how a physical torsional test would be performed. This would have led to structural oscillations, which would have masked the structural displacement needed to read the torsional rigidity value.
10th
European LS-DYNA Conference 2015, Würzburg, Germany
© 2015 Copyright by DYNAmore GmbH
The torsional rigidity model is fundamentally the same as the crash models, except that the *IMPLICIT cards were activated. The vehicle is clamped at the rear turrets and a force is applied at
the wheels centre via stiff spring, causing torsion. The torsional rigidity is measured by dividing the cross section moment in the ‘X’ axis against the wheel angle change.
Fig.5: Torsional rigidity model setup
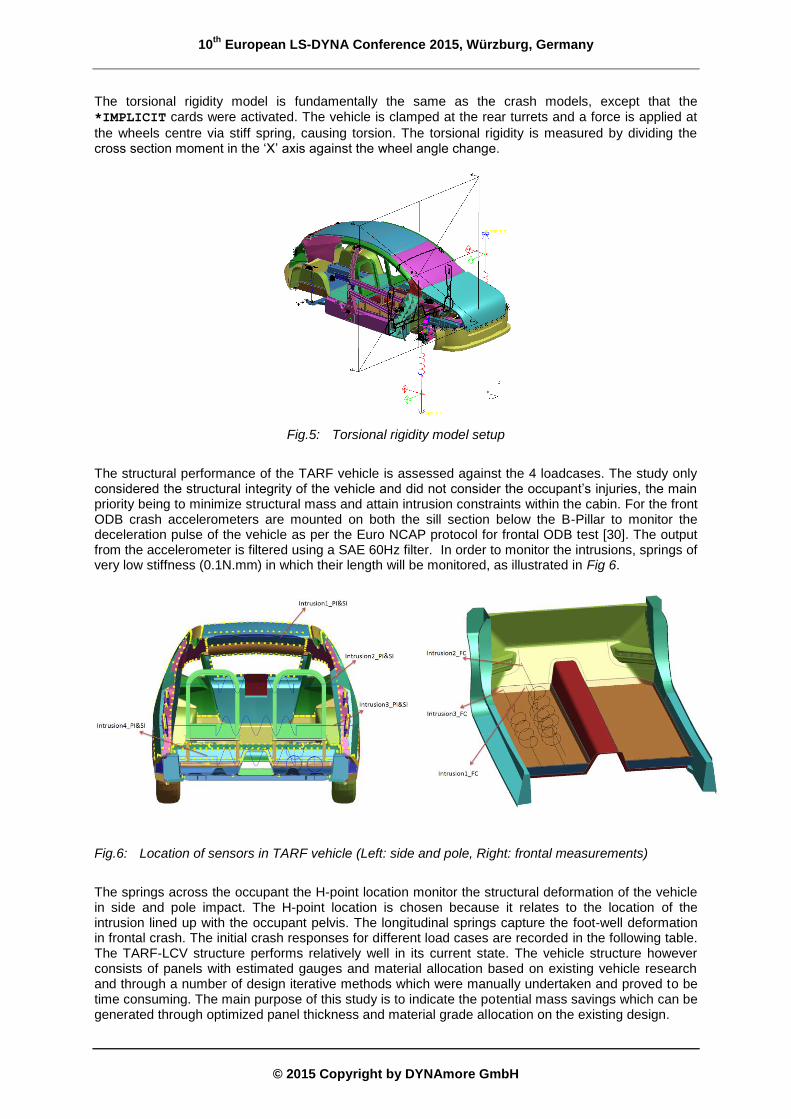
The structural performance of the TARF vehicle is assessed against the 4 loadcases. The study only considered the structural integrity of the vehicle and did not consider the occupant’s injuries, the main priority being to minimize structural mass and attain intrusion constraints within the cabin. For the front ODB crash accelerometers are mounted on both the sill section below the B-Pillar to monitor the deceleration pulse of the vehicle as per the Euro NCAP protocol for frontal ODB test [30]. The output from the accelerometer is filtered using a SAE 60Hz filter. In order to monitor the intrusions, springs of very low stiffness (0.1N.mm) in which their length will be monitored, as illustrated in Fig 6.
Fig.6: Location of sensors in TARF vehicle (Left: side and pole, Right: frontal measurements)
The springs across the occupant the H-point location monitor the structural deformation of the vehicle in side and pole impact. The H-point location is chosen because it relates to the location of the intrusion lined up with the occupant pelvis. The longitudinal springs capture the foot-well deformation in frontal crash. The initial crash responses for different load cases are recorded in the following table. The TARF-LCV structure performs relatively well in its current state. The vehicle structure however consists of panels with estimated gauges and material allocation based on existing vehicle research and through a number of design iterative methods which were manually undertaken and proved to be time consuming. The main purpose of this study is to indicate the potential mass savings which can be generated through optimized panel thickness and material grade allocation on the existing design.
10th
European LS-DYNA Conference 2015, Würzburg, Germany
© 2015 Copyright by DYNAmore GmbH
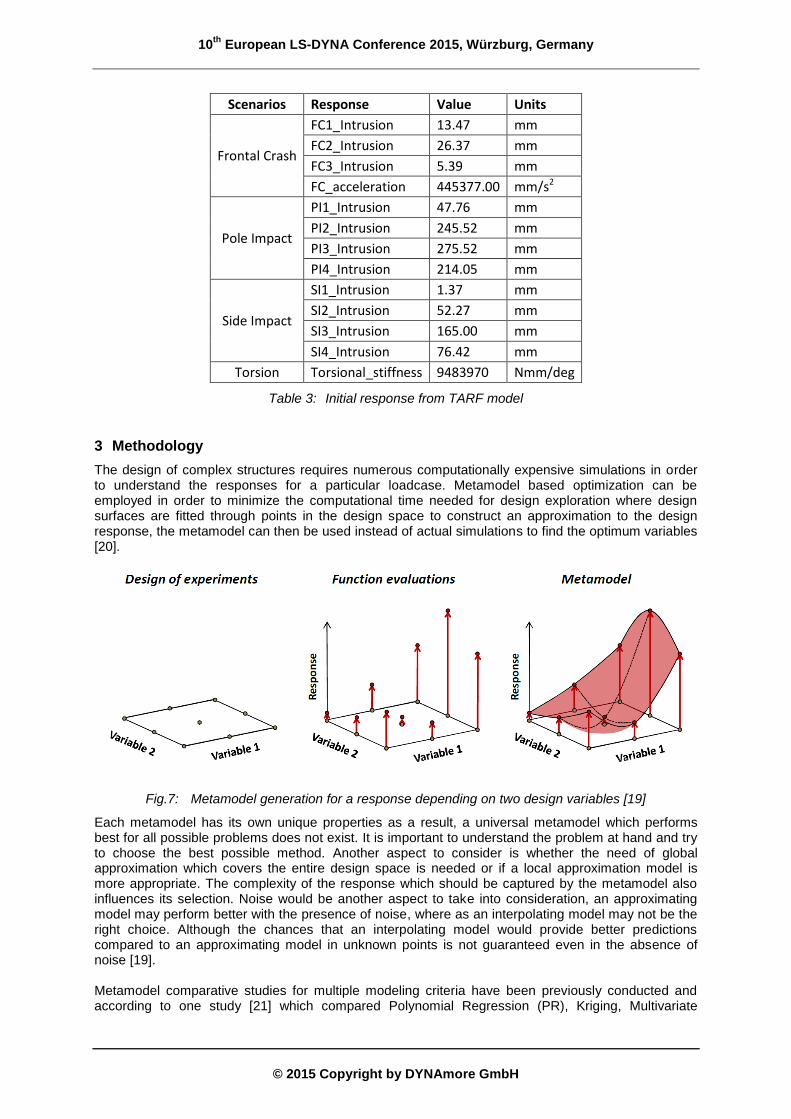
Scenarios Response Value Units
Frontal Crash
FC1_Intrusion 13.47 mm
FC2_Intrusion 26.37 mm
FC3_Intrusion 5.39 mm
FC_acceleration 445377.00 mm/s2
Pole Impact
PI1_Intrusion 47.76 mm
PI2_Intrusion 245.52 mm
PI3_Intrusion 275.52 mm
PI4_Intrusion 214.05 mm
Side Impact
SI1_Intrusion 1.37 mm
SI2_Intrusion 52.27 mm
SI3_Intrusion 165.00 mm
SI4_Intrusion 76.42 mm
Torsion Torsional_stiffness 9483970 Nmm/deg
Table 3: Initial response from TARF model
3 Methodology
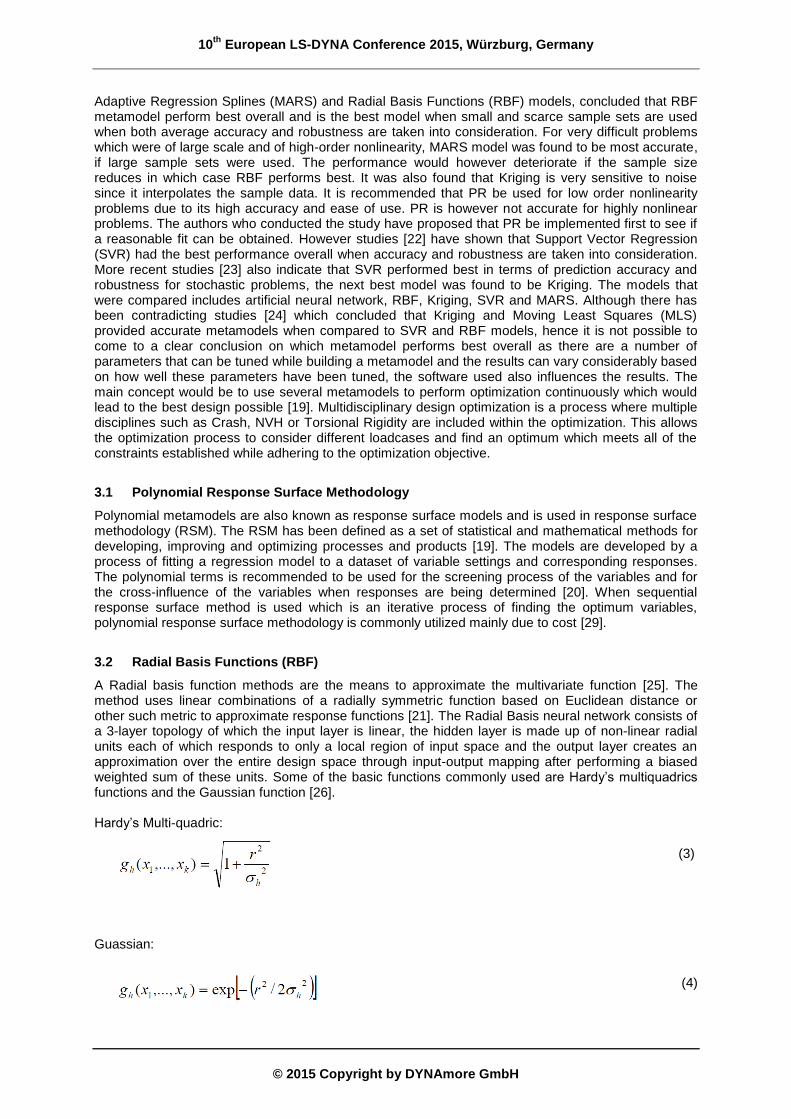
The design of complex structures requires numerous computationally expensive simulations in order to understand the responses for a particular loadcase. Metamodel based optimization can be employed in order to minimize the computational time needed for design exploration where design surfaces are fitted through points in the design space to construct an approximation to the design response, the metamodel can then be used instead of actual simulations to find the optimum variables [20].
Fig.7: Metamodel generation for a response depending on two design variables [19]
Each metamodel has its own unique properties as a result, a universal metamodel which performs best for all possible problems does not exist. It is important to understand the problem at hand and try to choose the best possible method. Another aspect to consider is whether the need of global approximation which covers the entire design space is needed or if a local approximation model is more appropriate. The complexity of the response which should be captured by the metamodel also influences its selection. Noise would be another aspect to take into consideration, an approximating model may perform better with the presence of noise, where as an interpolating model may not be the right choice. Although the chances that an interpolating model would provide better predictions compared to an approximating model in unknown points is not guaranteed even in the absence of noise [19]. Metamodel comparative studies for multiple modeling criteria have been previously conducted and according to one study [21] which compared Polynomial Regression (PR), Kriging, Multivariate
10th
European LS-DYNA Conference 2015, Würzburg, Germany
© 2015 Copyright by DYNAmore GmbH
Adaptive Regression Splines (MARS) and Radial Basis Functions (RBF) models, concluded that RBF metamodel perform best overall and is the best model when small and scarce sample sets are used when both average accuracy and robustness are taken into consideration. For very difficult problems which were of large scale and of high-order nonlinearity, MARS model was found to be most accurate, if large sample sets were used. The performance would however deteriorate if the sample size reduces in which case RBF performs best. It was also found that Kriging is very sensitive to noise since it interpolates the sample data. It is recommended that PR be used for low order nonlinearity problems due to its high accuracy and ease of use. PR is however not accurate for highly nonlinear problems. The authors who conducted the study have proposed that PR be implemented first to see if a reasonable fit can be obtained. However studies [22] have shown that Support Vector Regression (SVR) had the best performance overall when accuracy and robustness are taken into consideration. More recent studies [23] also indicate that SVR performed best in terms of prediction accuracy and robustness for stochastic problems, the next best model was found to be Kriging. The models that were compared includes artificial neural network, RBF, Kriging, SVR and MARS. Although there has been contradicting studies [24] which concluded that Kriging and Moving Least Squares (MLS) provided accurate metamodels when compared to SVR and RBF models, hence it is not possible to come to a clear conclusion on which metamodel performs best overall as there are a number of parameters that can be tuned while building a metamodel and the results can vary considerably based on how well these parameters have been tuned, the software used also influences the results. The main concept would be to use several metamodels to perform optimization continuously which would lead to the best design possible [19]. Multidisciplinary design optimization is a process where multiple disciplines such as Crash, NVH or Torsional Rigidity are included within the optimization. This allows the optimization process to consider different loadcases and find an optimum which meets all of the constraints established while adhering to the optimization objective.
3.1 Polynomial Response Surface Methodology
Polynomial metamodels are also known as response surface models and is used in response surface methodology (RSM). The RSM has been defined as a set of statistical and mathematical methods for developing, improving and optimizing processes and products [19]. The models are developed by a process of fitting a regression model to a dataset of variable settings and corresponding responses. The polynomial terms is recommended to be used for the screening process of the variables and for the cross-influence of the variables when responses are being determined [20]. When sequential response surface method is used which is an iterative process of finding the optimum variables, polynomial response surface methodology is commonly utilized mainly due to cost [29].
3.2 Radial Basis Functions (RBF)
A Radial basis function methods are the means to approximate the multivariate function [25]. The method uses linear combinations of a radially symmetric function based on Euclidean distance or other such metric to approximate response functions [21]. The Radial Basis neural network consists of a 3-layer topology of which the input layer is linear, the hidden layer is made up of non-linear radial units each of which responds to only a local region of input space and the output layer creates an approximation over the entire design space through input-output mapping after performing a biased weighted sum of these units. Some of the basic functions commonly used are Hardy’s multiquadrics functions and the Gaussian function [26]. Hardy’s Multi-quadric:
(3)
Guassian:
(4)
10th
European LS-DYNA Conference 2015, Würzburg, Germany
© 2015 Copyright by DYNAmore GmbH
4 Analysis
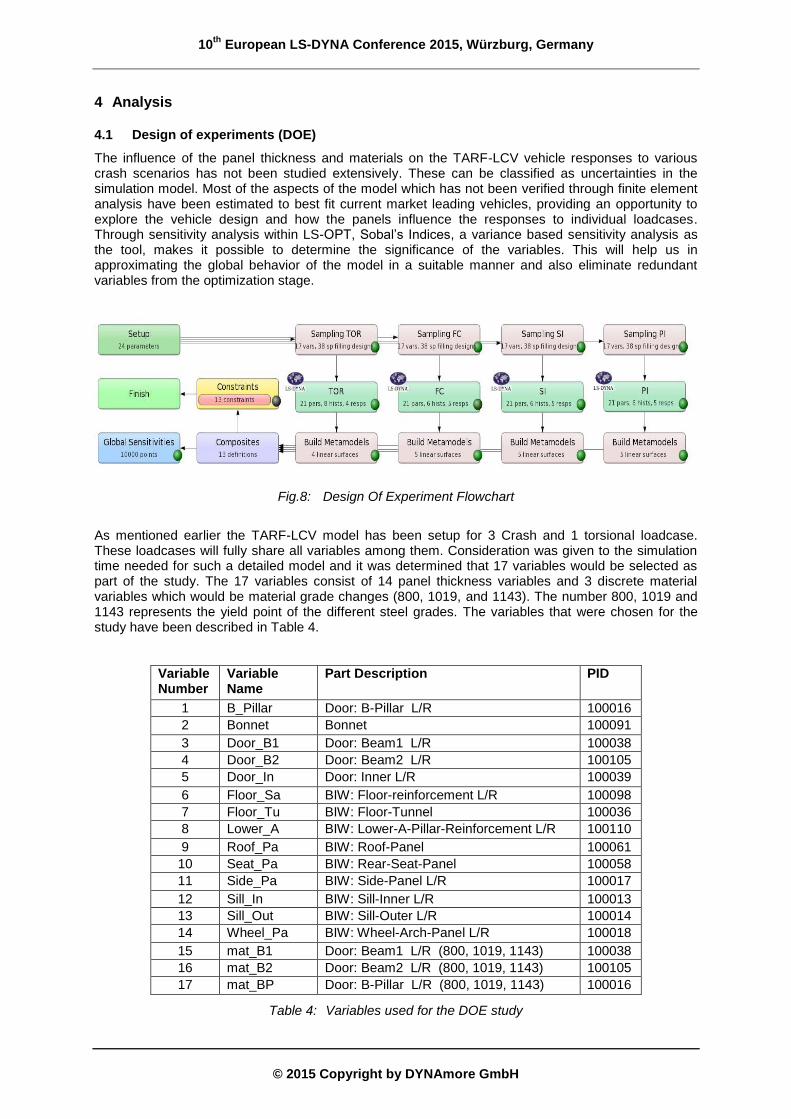
4.1 Design of experiments (DOE)
The influence of the panel thickness and materials on the TARF-LCV vehicle responses to various crash scenarios has not been studied extensively. These can be classified as uncertainties in the simulation model. Most of the aspects of the model which has not been verified through finite element analysis have been estimated to best fit current market leading vehicles, providing an opportunity to explore the vehicle design and how the panels influence the responses to individual loadcases. Through sensitivity analysis within LS-OPT, Sobal’s Indices, a variance based sensitivity analysis as the tool, makes it possible to determine the significance of the variables. This will help us in approximating the global behavior of the model in a suitable manner and also eliminate redundant variables from the optimization stage.
Fig.8: Design Of Experiment Flowchart
As mentioned earlier the TARF-LCV model has been setup for 3 Crash and 1 torsional loadcase. These loadcases will fully share all variables among them. Consideration was given to the simulation time needed for such a detailed model and it was determined that 17 variables would be selected as part of the study. The 17 variables consist of 14 panel thickness variables and 3 discrete material variables which would be material grade changes (800, 1019, and 1143). The number 800, 1019 and 1143 represents the yield point of the different steel grades. The variables that were chosen for the study have been described in Table 4.
Variable Number
Variable Name
Part Description PID
1 B_Pillar Door: B-Pillar L/R 100016
2 Bonnet Bonnet 100091
3 Door_B1 Door: Beam1 L/R 100038
4 Door_B2 Door: Beam2 L/R 100105
5 Door_In Door: Inner L/R 100039
6 Floor_Sa BIW: Floor-reinforcement L/R 100098
7 Floor_Tu BIW: Floor-Tunnel 100036
8 Lower_A BIW: Lower-A-Pillar-Reinforcement L/R 100110
9 Roof_Pa BIW: Roof-Panel 100061
10 Seat_Pa BIW: Rear-Seat-Panel 100058
11 Side_Pa BIW: Side-Panel L/R 100017
12 Sill_In BIW: Sill-Inner L/R 100013
13 Sill_Out BIW: Sill-Outer L/R 100014
14 Wheel_Pa BIW: Wheel-Arch-Panel L/R 100018
15 mat_B1 Door: Beam1 L/R (800, 1019, 1143) 100038
16 mat_B2 Door: Beam2 L/R (800, 1019, 1143) 100105
17 mat_BP Door: B-Pillar L/R (800, 1019, 1143) 100016
Table 4: Variables used for the DOE study
10th
European LS-DYNA Conference 2015, Würzburg, Germany
© 2015 Copyright by DYNAmore GmbH
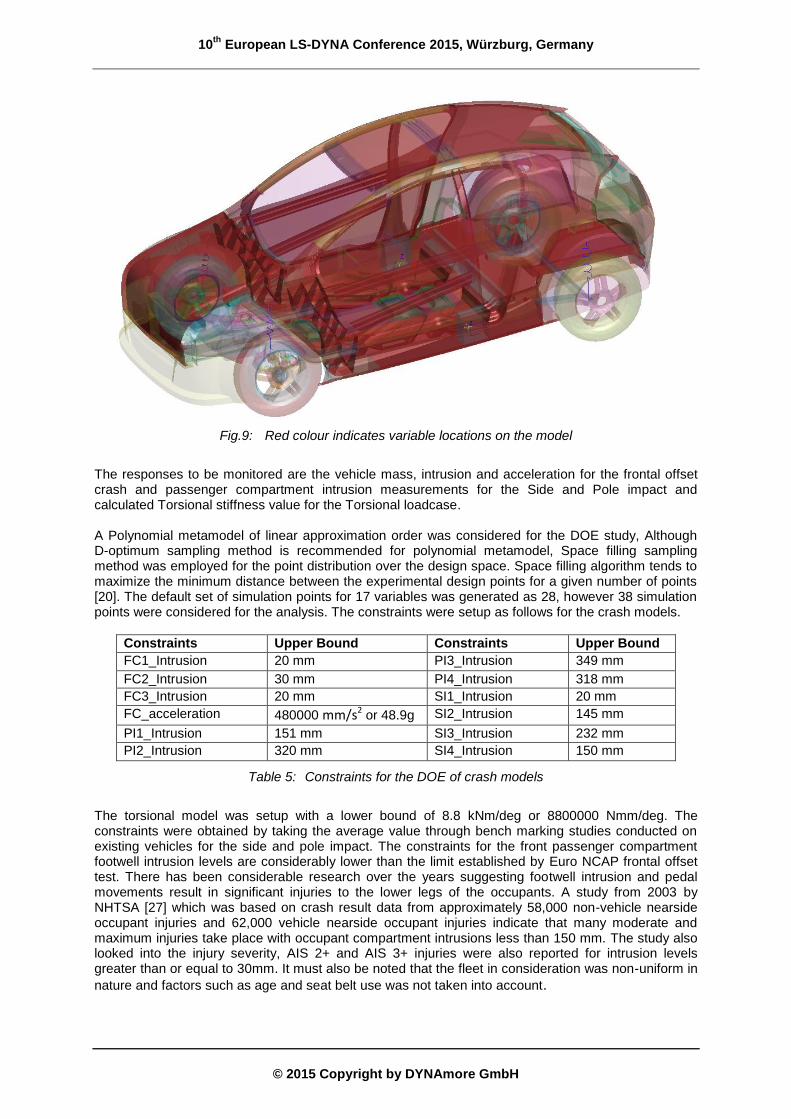
Fig.9: Red colour indicates variable locations on the model
The responses to be monitored are the vehicle mass, intrusion and acceleration for the frontal offset crash and passenger compartment intrusion measurements for the Side and Pole impact and calculated Torsional stiffness value for the Torsional loadcase. A Polynomial metamodel of linear approximation order was considered for the DOE study, Although D-optimum sampling method is recommended for polynomial metamodel, Space filling sampling method was employed for the point distribution over the design space. Space filling algorithm tends to maximize the minimum distance between the experimental design points for a given number of points [20]. The default set of simulation points for 17 variables was generated as 28, however 38 simulation points were considered for the analysis. The constraints were setup as follows for the crash models.
Constraints Upper Bound Constraints Upper Bound
FC1_Intrusion 20 mm PI3_Intrusion 349 mm
FC2_Intrusion 30 mm PI4_Intrusion 318 mm
FC3_Intrusion 20 mm SI1_Intrusion 20 mm
FC_acceleration 480000 mm/s2 or 48.9g SI2_Intrusion 145 mm
PI1_Intrusion 151 mm SI3_Intrusion 232 mm
PI2_Intrusion 320 mm SI4_Intrusion 150 mm
Table 5: Constraints for the DOE of crash models
The torsional model was setup with a lower bound of 8.8 kNm/deg or 8800000 Nmm/deg. The constraints were obtained by taking the average value through bench marking studies conducted on existing vehicles for the side and pole impact. The constraints for the front passenger compartment footwell intrusion levels are considerably lower than the limit established by Euro NCAP frontal offset test. There has been considerable research over the years suggesting footwell intrusion and pedal movements result in significant injuries to the lower legs of the occupants. A study from 2003 by NHTSA [27] which was based on crash result data from approximately 58,000 non-vehicle nearside occupant injuries and 62,000 vehicle nearside occupant injuries indicate that many moderate and maximum injuries take place with occupant compartment intrusions less than 150 mm. The study also looked into the injury severity, AIS 2+ and AIS 3+ injuries were also reported for intrusion levels greater than or equal to 30mm. It must also be noted that the fleet in consideration was non-uniform in
nature and factors such as age and seat belt use was not taken into account.

10th
European LS-DYNA Conference 2015, Würzburg, Germany
© 2015 Copyright by DYNAmore GmbH
Variable influence on the individual loadcases can be seen in the Global sensitivity Plots Figure 10 to13.
Fig.10: Global sensitivity plot for Frontal ODB test
Fig.11: Global sensitivity plot for Pole Impact Test
10th
European LS-DYNA Conference 2015, Würzburg, Germany
© 2015 Copyright by DYNAmore GmbH
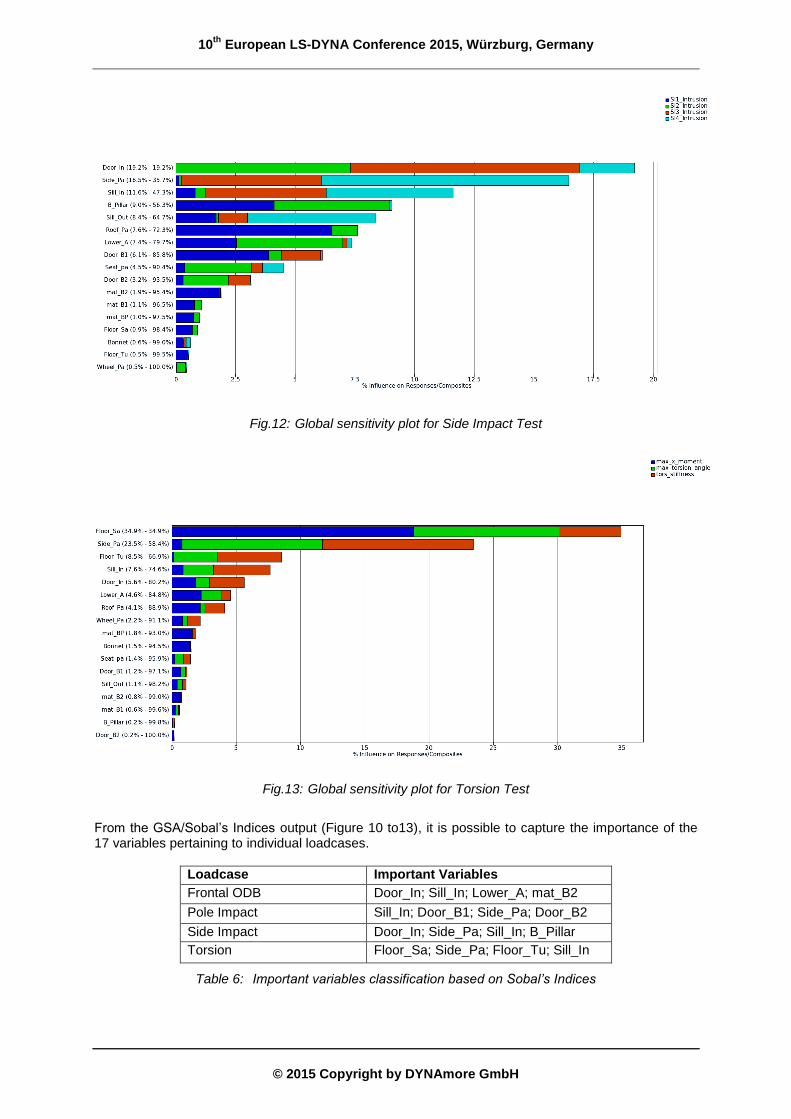
Fig.12: Global sensitivity plot for Side Impact Test
Fig.13: Global sensitivity plot for Torsion Test
From the GSA/Sobal’s Indices output (Figure 10 to13), it is possible to capture the importance of the 17 variables pertaining to individual loadcases.
Loadcase Important Variables
Frontal ODB Door_In; Sill_In; Lower_A; mat_B2
Pole Impact Sill_In; Door_B1; Side_Pa; Door_B2
Side Impact Door_In; Side_Pa; Sill_In; B_Pillar
Torsion Floor_Sa; Side_Pa; Floor_Tu; Sill_In
Table 6: Important variables classification based on Sobal’s Indices
10th
European LS-DYNA Conference 2015, Würzburg, Germany
© 2015 Copyright by DYNAmore GmbH
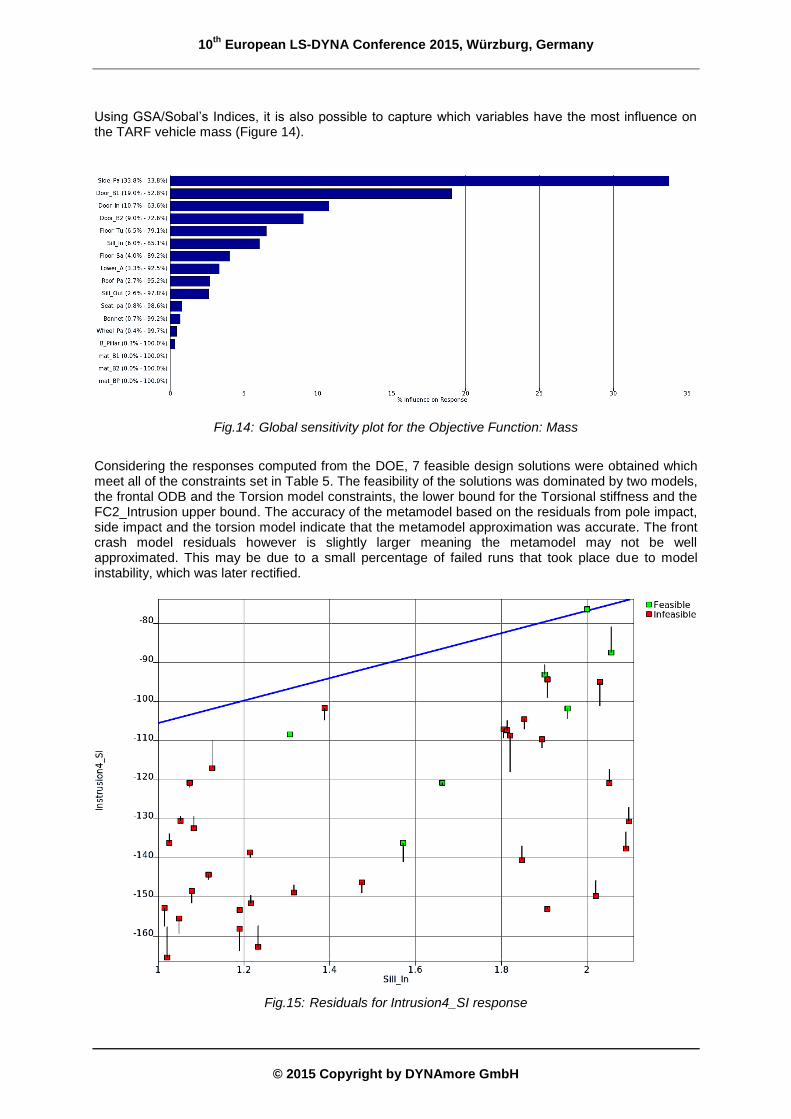
Using GSA/Sobal’s Indices, it is also possible to capture which variables have the most influence on the TARF vehicle mass (Figure 14).
Fig.14: Global sensitivity plot for the Objective Function: Mass
Considering the responses computed from the DOE, 7 feasible design solutions were obtained which meet all of the constraints set in Table 5. The feasibility of the solutions was dominated by two models, the frontal ODB and the Torsion model constraints, the lower bound for the Torsional stiffness and the FC2_Intrusion upper bound. The accuracy of the metamodel based on the residuals from pole impact, side impact and the torsion model indicate that the metamodel approximation was accurate. The front crash model residuals however is slightly larger meaning the metamodel may not be well approximated. This may be due to a small percentage of failed runs that took place due to model instability, which was later rectified.
Fig.15: Residuals for Intrusion4_SI response
10th
European LS-DYNA Conference 2015, Würzburg, Germany
© 2015 Copyright by DYNAmore GmbH
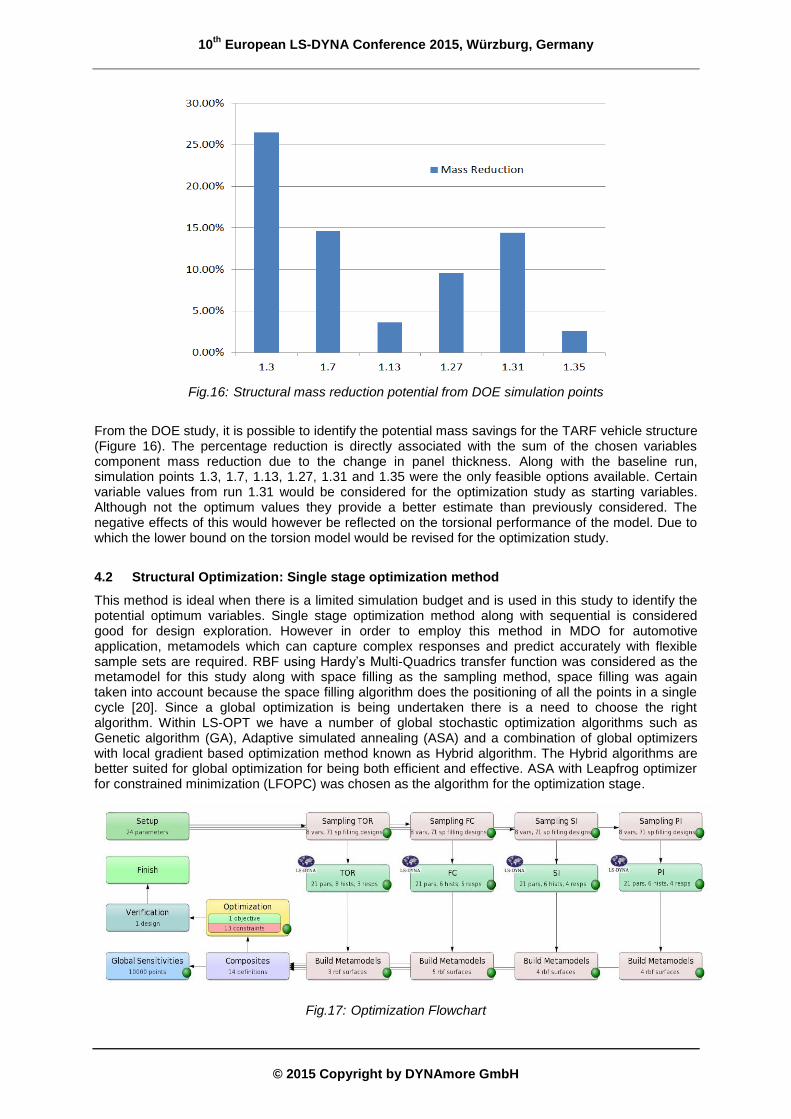
Fig.16: Structural mass reduction potential from DOE simulation points
From the DOE study, it is possible to identify the potential mass savings for the TARF vehicle structure (Figure 16). The percentage reduction is directly associated with the sum of the chosen variables component mass reduction due to the change in panel thickness. Along with the baseline run, simulation points 1.3, 1.7, 1.13, 1.27, 1.31 and 1.35 were the only feasible options available. Certain variable values from run 1.31 would be considered for the optimization study as starting variables. Although not the optimum values they provide a better estimate than previously considered. The negative effects of this would however be reflected on the torsional performance of the model. Due to which the lower bound on the torsion model would be revised for the optimization study.
4.2 Structural Optimization: Single stage optimization method
This method is ideal when there is a limited simulation budget and is used in this study to identify the potential optimum variables. Single stage optimization method along with sequential is considered good for design exploration. However in order to employ this method in MDO for automotive application, metamodels which can capture complex responses and predict accurately with flexible sample sets are required. RBF using Hardy’s Multi-Quadrics transfer function was considered as the metamodel for this study along with space filling as the sampling method, space filling was again taken into account because the space filling algorithm does the positioning of all the points in a single cycle [20]. Since a global optimization is being undertaken there is a need to choose the right algorithm. Within LS-OPT we have a number of global stochastic optimization algorithms such as Genetic algorithm (GA), Adaptive simulated annealing (ASA) and a combination of global optimizers with local gradient based optimization method known as Hybrid algorithm. The Hybrid algorithms are better suited for global optimization for being both efficient and effective. ASA with Leapfrog optimizer for constrained minimization (LFOPC) was chosen as the algorithm for the optimization stage.
Fig.17: Optimization Flowchart
10th
European LS-DYNA Conference 2015, Würzburg, Germany
© 2015 Copyright by DYNAmore GmbH
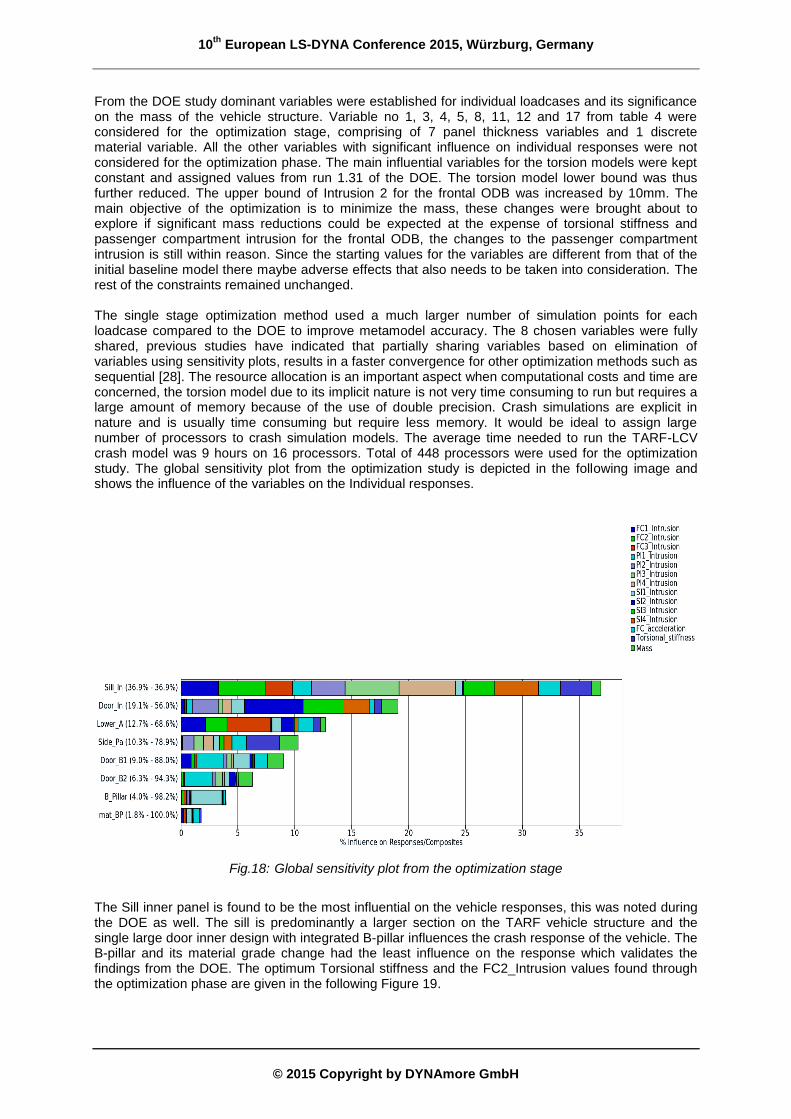
From the DOE study dominant variables were established for individual loadcases and its significance on the mass of the vehicle structure. Variable no 1, 3, 4, 5, 8, 11, 12 and 17 from table 4 were considered for the optimization stage, comprising of 7 panel thickness variables and 1 discrete material variable. All the other variables with significant influence on individual responses were not considered for the optimization phase. The main influential variables for the torsion models were kept constant and assigned values from run 1.31 of the DOE. The torsion model lower bound was thus further reduced. The upper bound of Intrusion 2 for the frontal ODB was increased by 10mm. The main objective of the optimization is to minimize the mass, these changes were brought about to explore if significant mass reductions could be expected at the expense of torsional stiffness and passenger compartment intrusion for the frontal ODB, the changes to the passenger compartment intrusion is still within reason. Since the starting values for the variables are different from that of the initial baseline model there maybe adverse effects that also needs to be taken into consideration. The rest of the constraints remained unchanged. The single stage optimization method used a much larger number of simulation points for each loadcase compared to the DOE to improve metamodel accuracy. The 8 chosen variables were fully shared, previous studies have indicated that partially sharing variables based on elimination of variables using sensitivity plots, results in a faster convergence for other optimization methods such as sequential [28]. The resource allocation is an important aspect when computational costs and time are concerned, the torsion model due to its implicit nature is not very time consuming to run but requires a large amount of memory because of the use of double precision. Crash simulations are explicit in nature and is usually time consuming but require less memory. It would be ideal to assign large number of processors to crash simulation models. The average time needed to run the TARF-LCV crash model was 9 hours on 16 processors. Total of 448 processors were used for the optimization study. The global sensitivity plot from the optimization study is depicted in the following image and shows the influence of the variables on the Individual responses.
Fig.18: Global sensitivity plot from the optimization stage
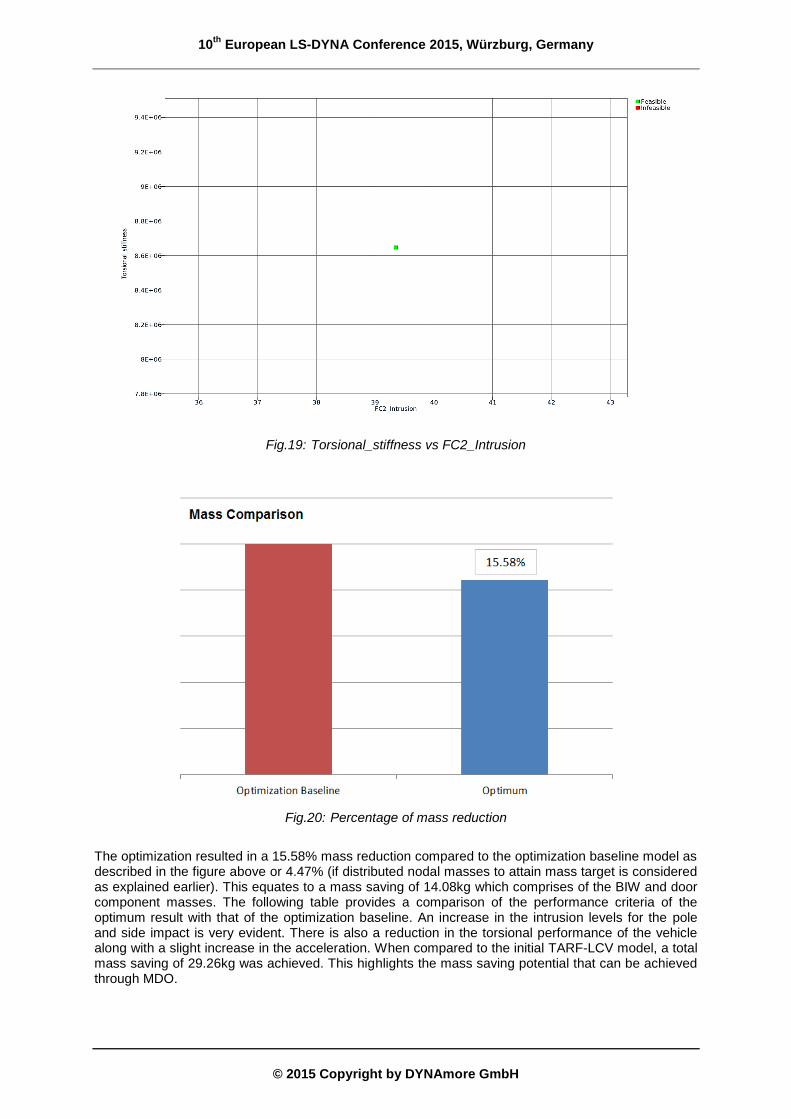
The Sill inner panel is found to be the most influential on the vehicle responses, this was noted during the DOE as well. The sill is predominantly a larger section on the TARF vehicle structure and the single large door inner design with integrated B-pillar influences the crash response of the vehicle. The B-pillar and its material grade change had the least influence on the response which validates the findings from the DOE. The optimum Torsional stiffness and the FC2_Intrusion values found through the optimization phase are given in the following Figure 19.
10th
European LS-DYNA Conference 2015, Würzburg, Germany
© 2015 Copyright by DYNAmore GmbH
Fig.19: Torsional_stiffness vs FC2_Intrusion
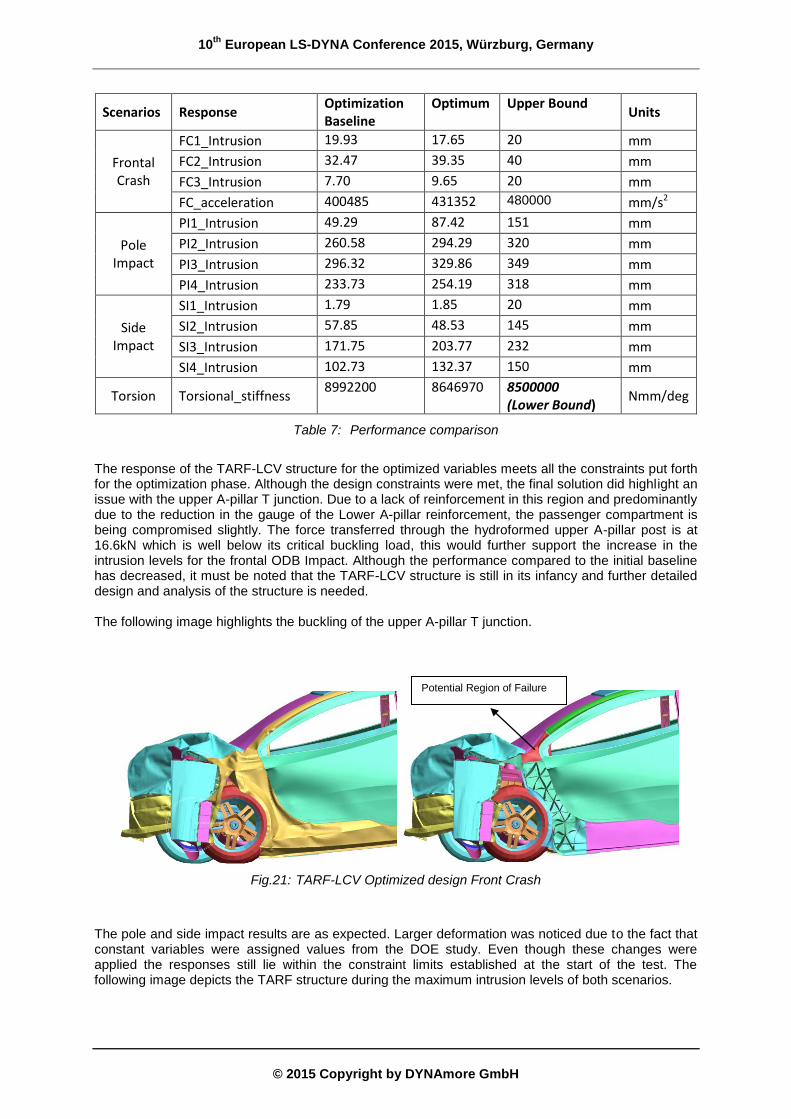
Fig.20: Percentage of mass reduction
The optimization resulted in a 15.58% mass reduction compared to the optimization baseline model as described in the figure above or 4.47% (if distributed nodal masses to attain mass target is considered as explained earlier). This equates to a mass saving of 14.08kg which comprises of the BIW and door component masses. The following table provides a comparison of the performance criteria of the optimum result with that of the optimization baseline. An increase in the intrusion levels for the pole and side impact is very evident. There is also a reduction in the torsional performance of the vehicle along with a slight increase in the acceleration. When compared to the initial TARF-LCV model, a total mass saving of 29.26kg was achieved. This highlights the mass saving potential that can be achieved through MDO.
10th
European LS-DYNA Conference 2015, Würzburg, Germany
© 2015 Copyright by DYNAmore GmbH
Scenarios Response Optimization Baseline
Optimum Upper Bound Units
Frontal Crash
FC1_Intrusion 19.93 17.65 20 mm
FC2_Intrusion 32.47 39.35 40 mm
FC3_Intrusion 7.70 9.65 20 mm
FC_acceleration 400485 431352 480000 mm/s2
Pole Impact
PI1_Intrusion 49.29 87.42 151 mm
PI2_Intrusion 260.58 294.29 320 mm
PI3_Intrusion 296.32 329.86 349 mm
PI4_Intrusion 233.73 254.19 318 mm
Side Impact
SI1_Intrusion 1.79 1.85 20 mm
SI2_Intrusion 57.85 48.53 145 mm
SI3_Intrusion 171.75 203.77 232 mm
SI4_Intrusion 102.73 132.37 150 mm
Torsion Torsional_stiffness 8992200 8646970 8500000
(Lower Bound) Nmm/deg
Table 7: Performance comparison
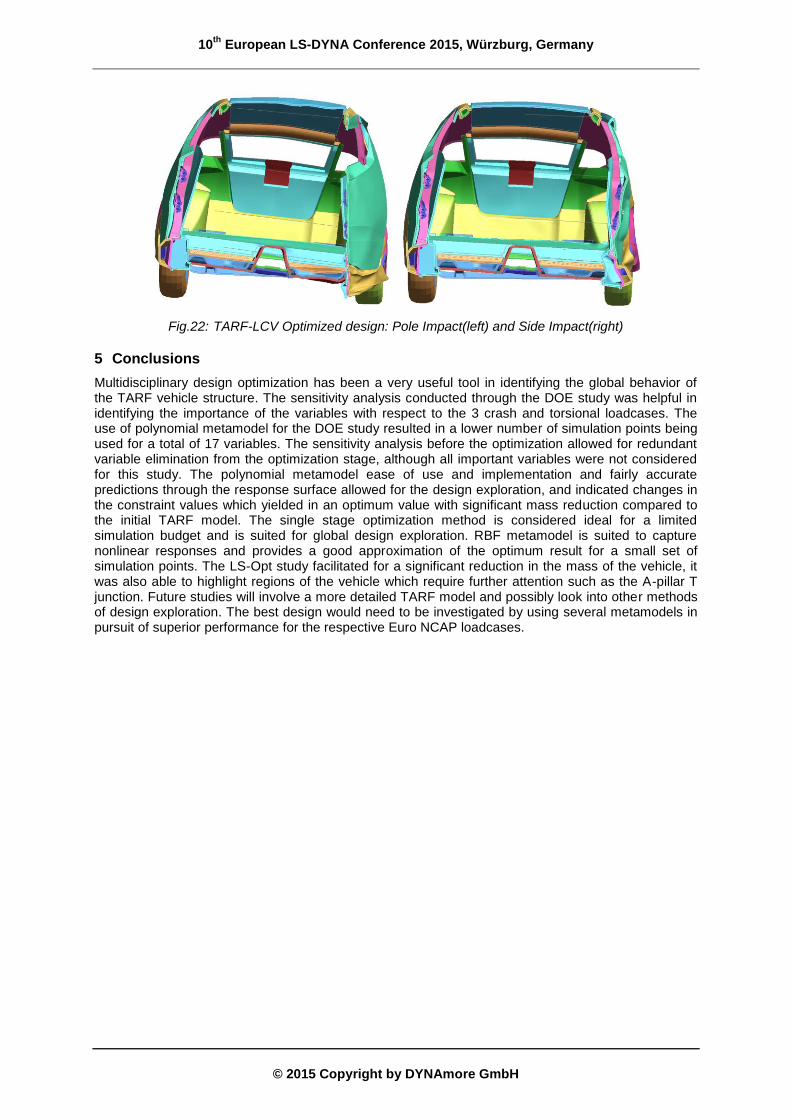
The response of the TARF-LCV structure for the optimized variables meets all the constraints put forth for the optimization phase. Although the design constraints were met, the final solution did highlight an issue with the upper A-pillar T junction. Due to a lack of reinforcement in this region and predominantly due to the reduction in the gauge of the Lower A-pillar reinforcement, the passenger compartment is being compromised slightly. The force transferred through the hydroformed upper A-pillar post is at 16.6kN which is well below its critical buckling load, this would further support the increase in the intrusion levels for the frontal ODB Impact. Although the performance compared to the initial baseline has decreased, it must be noted that the TARF-LCV structure is still in its infancy and further detailed design and analysis of the structure is needed. The following image highlights the buckling of the upper A-pillar T junction.
Fig.21: TARF-LCV Optimized design Front Crash
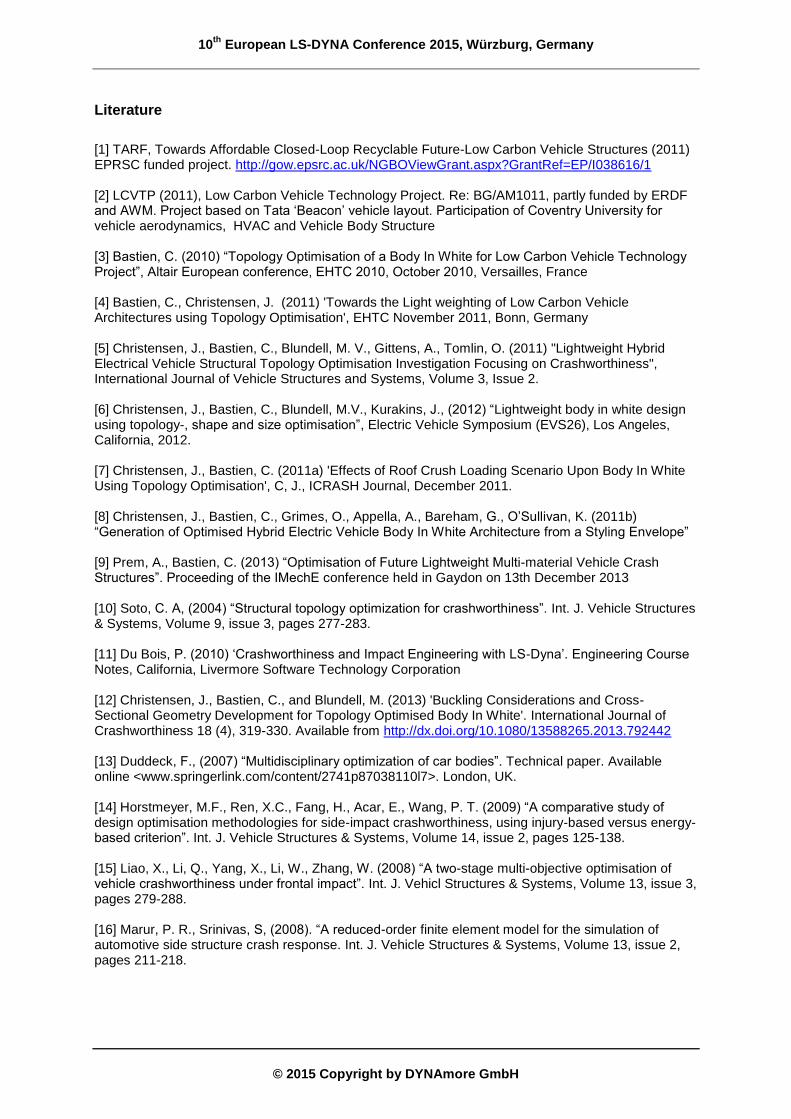
The pole and side impact results are as expected. Larger deformation was noticed due to the fact that constant variables were assigned values from the DOE study. Even though these changes were applied the responses still lie within the constraint limits established at the start of the test. The following image depicts the TARF structure during the maximum intrusion levels of both scenarios.
Potential Region of Failure
10th
European LS-DYNA Conference 2015, Würzburg, Germany
© 2015 Copyright by DYNAmore GmbH
Fig.22: TARF-LCV Optimized design: Pole Impact(left) and Side Impact(right)
5 Conclusions
Multidisciplinary design optimization has been a very useful tool in identifying the global behavior of the TARF vehicle structure. The sensitivity analysis conducted through the DOE study was helpful in identifying the importance of the variables with respect to the 3 crash and torsional loadcases. The use of polynomial metamodel for the DOE study resulted in a lower number of simulation points being used for a total of 17 variables. The sensitivity analysis before the optimization allowed for redundant variable elimination from the optimization stage, although all important variables were not considered for this study. The polynomial metamodel ease of use and implementation and fairly accurate predictions through the response surface allowed for the design exploration, and indicated changes in the constraint values which yielded in an optimum value with significant mass reduction compared to the initial TARF model. The single stage optimization method is considered ideal for a limited simulation budget and is suited for global design exploration. RBF metamodel is suited to capture nonlinear responses and provides a good approximation of the optimum result for a small set of simulation points. The LS-Opt study facilitated for a significant reduction in the mass of the vehicle, it was also able to highlight regions of the vehicle which require further attention such as the A-pillar T junction. Future studies will involve a more detailed TARF model and possibly look into other methods of design exploration. The best design would need to be investigated by using several metamodels in pursuit of superior performance for the respective Euro NCAP loadcases.
10th
European LS-DYNA Conference 2015, Würzburg, Germany
© 2015 Copyright by DYNAmore GmbH
Literature
[1] TARF, Towards Affordable Closed-Loop Recyclable Future-Low Carbon Vehicle Structures (2011) EPRSC funded project. http://gow.epsrc.ac.uk/NGBOViewGrant.aspx?GrantRef=EP/I038616/1 [2] LCVTP (2011), Low Carbon Vehicle Technology Project. Re: BG/AM1011, partly funded by ERDF and AWM. Project based on Tata ‘Beacon’ vehicle layout. Participation of Coventry University for vehicle aerodynamics, HVAC and Vehicle Body Structure [3] Bastien, C. (2010) “Topology Optimisation of a Body In White for Low Carbon Vehicle Technology Project”, Altair European conference, EHTC 2010, October 2010, Versailles, France [4] Bastien, C., Christensen, J. (2011) 'Towards the Light weighting of Low Carbon Vehicle Architectures using Topology Optimisation', EHTC November 2011, Bonn, Germany [5] Christensen, J., Bastien, C., Blundell, M. V., Gittens, A., Tomlin, O. (2011) "Lightweight Hybrid Electrical Vehicle Structural Topology Optimisation Investigation Focusing on Crashworthiness", International Journal of Vehicle Structures and Systems, Volume 3, Issue 2. [6] Christensen, J., Bastien, C., Blundell, M.V., Kurakins, J., (2012) “Lightweight body in white design using topology-, shape and size optimisation”, Electric Vehicle Symposium (EVS26), Los Angeles, California, 2012. [7] Christensen, J., Bastien, C. (2011a) 'Effects of Roof Crush Loading Scenario Upon Body In White Using Topology Optimisation', C, J., ICRASH Journal, December 2011. [8] Christensen, J., Bastien, C., Grimes, O., Appella, A., Bareham, G., O’Sullivan, K. (2011b) “Generation of Optimised Hybrid Electric Vehicle Body In White Architecture from a Styling Envelope” [9] Prem, A., Bastien, C. (2013) “Optimisation of Future Lightweight Multi-material Vehicle Crash Structures”. Proceeding of the IMechE conference held in Gaydon on 13th December 2013 [10] Soto, C. A, (2004) “Structural topology optimization for crashworthiness”. Int. J. Vehicle Structures & Systems, Volume 9, issue 3, pages 277-283. [11] Du Bois, P. (2010) ‘Crashworthiness and Impact Engineering with LS-Dyna’. Engineering Course Notes, California, Livermore Software Technology Corporation [12] Christensen, J., Bastien, C., and Blundell, M. (2013) 'Buckling Considerations and Cross- Sectional Geometry Development for Topology Optimised Body In White'. International Journal of Crashworthiness 18 (4), 319-330. Available from http://dx.doi.org/10.1080/13588265.2013.792442 [13] Duddeck, F., (2007) “Multidisciplinary optimization of car bodies”. Technical paper. Available online <www.springerlink.com/content/2741p87038110l7>. London, UK. [14] Horstmeyer, M.F., Ren, X.C., Fang, H., Acar, E., Wang, P. T. (2009) “A comparative study of design optimisation methodologies for side-impact crashworthiness, using injury-based versus energy- based criterion”. Int. J. Vehicle Structures & Systems, Volume 14, issue 2, pages 125-138. [15] Liao, X., Li, Q., Yang, X., Li, W., Zhang, W. (2008) “A two-stage multi-objective optimisation of vehicle crashworthiness under frontal impact”. Int. J. Vehicl Structures & Systems, Volume 13, issue 3, pages 279-288. [16] Marur, P. R., Srinivas, S, (2008). “A reduced-order finite element model for the simulation of automotive side structure crash response. Int. J. Vehicle Structures & Systems, Volume 13, issue 2, pages 211-218.
10th
European LS-DYNA Conference 2015, Würzburg, Germany
© 2015 Copyright by DYNAmore GmbH
[17] Zimmer, H., Prabhuwaingankar, M., Duddeck, F. (2009) “Topology & Geometry Based Structure Optimization using implicit Parametric Models and LS-OPT”. Technical paper. Available online <www.dynalook.com/european-conf-2009/F-II-02.pdf>. [18] European New Car Assessment Programme: Euro NCAP (2012) Side Impact Testing Protocol V6.0 Available from www.euroncap.com/en/for-engineers/protocols/adult-occupant-protection/ [19] Ryberg, A.B., Bäckryd, R.D., Nilsson, L.: (2012) “Meamodel-Based Multidisciplinary Design Optimization for Automotive Applications”, Linköping University, Technical Report. [20] Stander, N.,Roux W.,Basudhar A.,Effleston T.,Goel T.,Craig K. “LS-OPT User’s Manual, Version 5.0”. Livermore Software Technology Corporation, California, USA, April 2013. [21] Jin, R.,Chen, W., Simpson, T. (2001). “Comparative Studies of metamodelling techniques under multiple modelling criteria”. Structural and Multidisciplinary Optimization, 23(1), 1-13. [22] Clarke, S.M., Griebsch, J.H., Simpson, T.W. (2005). “Analysis of support vector regression for approximation of complex engineering analysis”. Journal of Mechanical Design, 127(6), 1077-1087. [23] Li, Y., Ng, S., Xie, M., Goh, T. (2010). “A systematic comparison of metamodeling techniques for simulation optimization in decision support systems”. Applied Soft Computing, 10(4), 1257-1273. [24] Kim, B.-S., Lee, Y.-B., Choi, D.-H. (2009). “Comparison study on the accuracy of metamodeling technique for non-convex functions”. Journal of Mechanical Science and Technology, 23(4),1175- 1181. [25] Martin, D.B., Ciarlet, P.G., Iserles A., Kohn R.V., Wright M.H. (2003). “Radial Basis Functions theory and Implementations”. Cambridge University Press, 271. [26] Stander, N., Goel, T. (2008). “Metamodel Sensitivity to sequential adaptive sampling in crashworthiness design”. 10th International LS-DYNA User’s Conference. [27] Eigen, A.M., Glassbrenner, D. (2003). “The relationship between occupant compartment deformation and occupant injury”. NHTSA Technical Report, 37. [28] Craig, K.J., Stander, N., Dooge, D.A., Varadappa S. (2002). “Multidisciplinary Design Optimization of automotive crashworthiness and NVH using LS-OPT”. Proceedings from 7th International Ls-dyna User’s Conference. [29] Stander, N., Roux, W.J., Giger, M., Redhe, M., Fedorova, N., Haarhoff, J. (2003). “Crashworthiness Optimization in LS-OPT: Case Studies in Metamodeling and Random Search Techniques”. Proceedings from 4th European LS-DYNA Conference, Ulm, Germany. [30] European New Car Assessment Programme: “Euro NCAP (2012) Frontal Impact Testing Protocol V6.0” Available from www.euroncap.com/en/for-engineers/protocols/adult-occupant-protection/