multichannel fast-acting dynamic range compression hinders
TRANSCRIPT

Multichannel Fast-Acting Dynamic RangeCompression Hinders Performance by Young,
Normal-Hearing Listeners in a Two-TalkerSeparation Task*
MICHAEL A. STONE, BRIAN C. J. MOORE, AES Member, CHRISTIAN FULLGRABE,([email protected]) ([email protected]) ([email protected])
AND ANDREW C. HINTON([email protected])
Department of Experimental Psychology, University of Cambridge, Cambridge, CB2 3EB, UK
Fast-acting amplitude compression is used extensively in the professional audio industry.Such compression can impede perception of the independent sound sources within a com-plex signal. However, listeners may partially compensate for this by using greater mentaleffort. To test this idea, young, normal-hearing university students were required to reportthe keywords from two simultaneously presented sentences, either with or without a second-ary task. The sentences were uncompressed or were compressed by moderate or severeamounts. When the secondary task was required, the time taken to perform the tasks in-creased with increasing amount of compression, demonstrating that the listeners were nearthe limit of the mental effort that they could expend. Measured effects disappeared graduallywith increased experience of the tasks.
0 INTRODUCTION
Amplitude compression is used in the audio industry to
keep a signal within the dynamic range of the equipment
that reproduces, transmits, or stores the signal. It is also
used to increase loudness. For a fixed root-mean-square
(rms) level, multichannel compression increases the per-
ceived loudness [1]. In addition compression reduces the
peak-to-mean ratio of the signal, allowing an increase in
mean level and therefore a further increase in loudness, for
the same peak level. This aspect of compression is causing
considerable public concern, especially in relation to the
loudness of commercials. Also, compression is used to in-
crease the “impact” of a recording. The mean digital level
used on CDs has increased dramatically from the time they
were first introduced [2]. This is illustrated in Fig. 1, which
shows the distribution of levels measured in 10-ms rectan-
gular windows from two CDs by the same artists, one
recorded in 1987 (dashed curve) and one recorded in 1995
(solid curve); all levels are expressed relative to full scale.
The distribution is moved toward higher levels for the later
recording and shows a more restricted distribution of levels
on the upper side. A comparison of different versions of the
same track released at different times by an artist shows a
more restricted dynamic range for the later release [3]. This
is illustrated in Fig. 2. The upper trace [Fig. 2(a)] is a
sample of the waveform from the left channel of a compi-
lation CD of greatest hits released in 1986. Fig. 2(b) shows
a corresponding extract from a remastered CD released in
1995, based on the original album from which the greatest
hits CD was compiled. Notice that in the 1995 release,
signal peaks that are minutes apart in the performance
have the same digital value, something that would be very
unlikely to occur with an uncompressed signal.
Multichannel compression is also used extensively in hear-
ing aids to overcome the reduced dynamic range associated
with a cochlear hearing loss [4]. For a person with such a
loss, weak sounds are inaudible but intense sounds have a
similar loudness to that perceived by normal-hearing listen-
ers: the loudness appears to “catch up” at high sound levels,*Manuscript received 2008 November 13; revised 2009
June 19.
532 J. Audio Eng. Soc., Vol. 57, No. 7/8, 2009 July/August
PAPERS

a process known as recruitment [5]. To a first approxima-
tion, recruitment can be thought of as a form of fast-acting
signal expansion [6]. Partial compensation for this can be
achieved by the use of fast-acting compression, which can
restore the audibility of weak sounds while preventing in-
tense sounds from becoming uncomfortably loud [7].
Although compression can be used to achieve desired
effects, as discussed, it may also have deleterious side
effects. Information in an acoustic signal is conveyed by
changes in amplitude and frequency over time. Compres-
sion reduces temporal contrast, that is, amplitude variation
of the signal envelope over time, the amount of reduction
depending on the speed, compression ratio, and design of
the compressor [8], [9]. Multichannel compression also re-
duces spectral contrast, the amplitude variation across fre-
quency, the amount of reduction depending on number of
channels, compression speed, and compression ratio [10].
Loss of both temporal and spectral contrasts reduces the
information available to the auditory system [10], [11].
However, for speech in quiet, intelligibility remains high
even when fast-acting compression is applied in many
channels [12]. There appears to be an excess or redundancy
of information in the speech signal. This is less true when a
competing signal, such as noise, is present, but even so, fast
compression applied in many channels has only a moderate
deleterious effect on intelligibility [13].
Stone and Moore [14], [15] assessed the effect of com-
pression in a task that required identification of a target
talker in a background talker. The signals were passed
through a noise vocoder [16] which provided information
only about low-rate temporal envelope cues in a few fre-
quency bands. They showed that, for normal-hearing listen-
ers, intelligibility worsened as the speed and the number
of channels of compression were increased. They identified
a factor, which they quantified with a measure called
across-source modulation correlation (ASMC), that was
related to the intelligibility scores found in different com-
pression conditions [17]. During the process of compres-
sion, the signals derived from the target and background
talkers, which were previously independent, acquired a
common component of amplitude modulation, produced
by the time-varying gain of the compressor within each
compression channel (a form of cross modulation). When
assigning components to their appropriate sources, com-
mon modulation is one of the factors that the brain uses
to group components together [18]. Hence sound sources
that would usually be perceived as independent can be-
come perceptually fused after compression. So far the
potential deleterious effects of cross modulation have not
been investigated for normal-hearing people listening to
nonvocoded speech.
Informal discussions with UK studio managers indicate
that they believe a moderate amount of compression to be a
necessary part of signal control, helping to maintain audi-
bility in the user’s listening environment, which is not
always quiet. Subjectively, moderate compression does
not appear to degrade the extraction of information from a
complex signal. However, analysis of signals from off-air
FM transmissions, as well as of music recordings on CD,
shows that the amount of compression routinely employed
is severe, and is close to that found with fast-acting limit-
ers. Some listeners report that signals compressed in this
way are lifeless and muddy, and that prolonged listening,
even at levels below those that are damaging to the ear,
is fatiguing. Such effects are sometimes described and
measured in terms of subjective listening difficulty [19],
[20]. We hypothesize here that, although listeners may be
able to extract all the relevant information from a highly
compressed complex signal, this may require greater men-
tal (cognitive) effort [21] than for uncompressed signals.
Fig. 1. Distribution of levels measured in 10-ms rectangularwindows, expressed relative to full scale, for different CDs re-leased by same artists in 1987 (- - -) and 1995 (—).
Fig. 2. Samples of waveforms from left channels of CDs of same track by same artist. (a) Released in 1986. (b) Released in 1995.
J. Audio Eng. Soc., Vol. 57, No. 7/8, 2009 July/August 533
PAPERS FAST-ACTING AMPLITUDE COMPRESSION AND TWO-TALKER SEPARATION TASK
The experiment described here assessed whether more
effort is required to interpret complex compressed signals
than to interpret uncompressed signals. Young university
students with normal hearing were asked to identify the
keywords from each of two simultaneously presented sen-
tences. The speech was processed with varying amounts
of compression. Compression was applied either after
mixing, so as to give rise to cross modulation, or before
mixing, so as to avoid cross modulation. On some of the
trials an additional, visual task was introduced to provide
a means of manipulating cognitive effort. Both the accu-
racy of performance in reporting keywords in the speech
and two measures of reaction time were recorded.
1 STATISTICAL DISTRIBUTION OF LEVELS INSPEECH BEFORE AND AFTER COMPRESSION
Compression is a highly nonlinear process, and hence is
very difficult to “reverse engineer.” We wanted to simu-
late the type of compression processing that is typically
applied to broadcast speech signals. We therefore aimed
to design a compression system that produced speech
signals with spectrotemporal characteristics similar to
those in FM broadcasts.
One characteristic of speech that is affected by com-
pression is its distribution of signal levels, as measured
over various time scales. These distributions have been
characterized in the literature by the analysis of passages
of continuous prose. Typically the speech has been band-
pass filtered and windowed into short time frames. The
level of each frame has been calculated, and histograms
were constructed of the levels of the frames, for each
center frequency of the bandpass filter [22]–[25]. Record-
ing, background, or breathing noises generally dominate
the lowest 5% of levels in the cumulative distributions. It
is therefore common to regard the dynamic range of
speech as the range between the lowest 5% and the top
1% of frames of the cumulative distributions. Typically
this range is about 40–50 dB. The time frame is reduced,
the dynamic range increases [25]–[27]. We analyzed such
distributions of levels to characterize the effects of com-
pression applied to speech signals.
Our analyses were performed using frequency channels
whose bandwidths were chosen based on a perceptually
relevant scale, the ERBN-number scale, where ERBN
denotes the equivalent rectangular bandwidth of the audi-
tory filter for young, normal-hearing listeners for signals
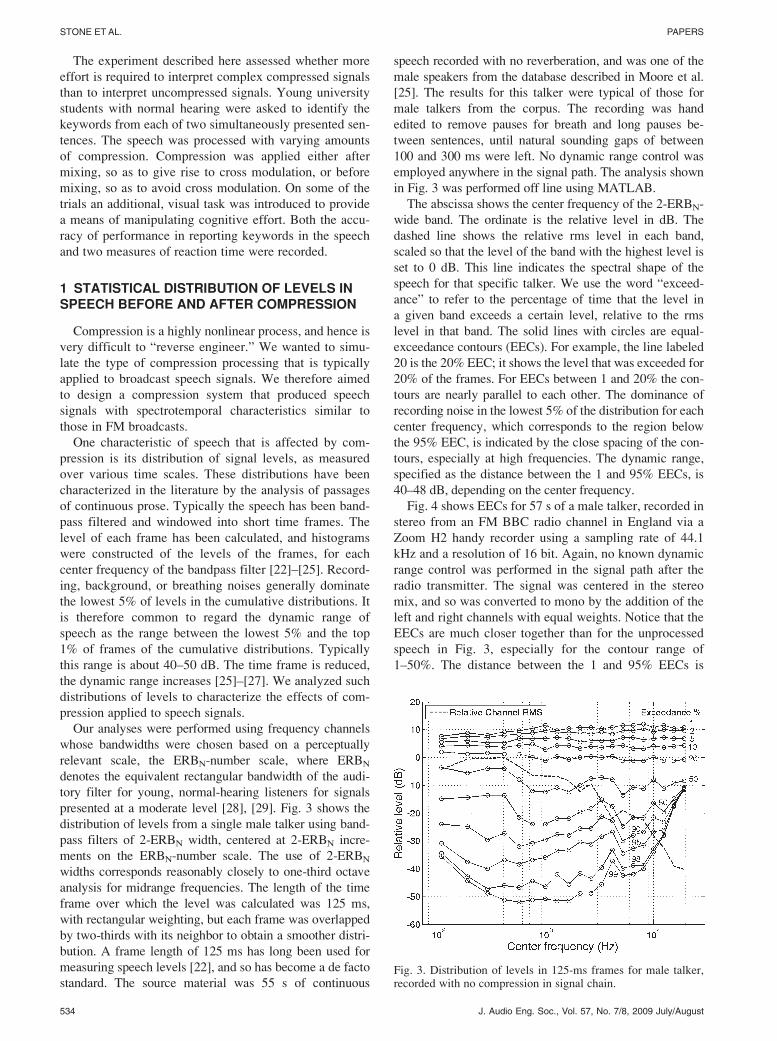
presented at a moderate level [28], [29]. Fig. 3 shows the
distribution of levels from a single male talker using band-
pass filters of 2-ERBN width, centered at 2-ERBN incre-
ments on the ERBN-number scale. The use of 2-ERBN
widths corresponds reasonably closely to one-third octave
analysis for midrange frequencies. The length of the time
frame over which the level was calculated was 125 ms,
with rectangular weighting, but each frame was overlapped
by two-thirds with its neighbor to obtain a smoother distri-
bution. A frame length of 125 ms has long been used for
measuring speech levels [22], and so has become a de facto
standard. The source material was 55 s of continuous
speech recorded with no reverberation, and was one of the
male speakers from the database described in Moore et al.
[25]. The results for this talker were typical of those for
male talkers from the corpus. The recording was hand
edited to remove pauses for breath and long pauses be-
tween sentences, until natural sounding gaps of between
100 and 300 ms were left. No dynamic range control was
employed anywhere in the signal path. The analysis shown
in Fig. 3 was performed off line using MATLAB.
The abscissa shows the center frequency of the 2-ERBN-
wide band. The ordinate is the relative level in dB. The
dashed line shows the relative rms level in each band,
scaled so that the level of the band with the highest level is
set to 0 dB. This line indicates the spectral shape of the
speech for that specific talker. We use the word “exceed-
ance” to refer to the percentage of time that the level in
a given band exceeds a certain level, relative to the rms
level in that band. The solid lines with circles are equal-
exceedance contours (EECs). For example, the line labeled
20 is the 20% EEC; it shows the level that was exceeded for
20% of the frames. For EECs between 1 and 20% the con-
tours are nearly parallel to each other. The dominance of
recording noise in the lowest 5% of the distribution for each
center frequency, which corresponds to the region below
the 95% EEC, is indicated by the close spacing of the con-
tours, especially at high frequencies. The dynamic range,
specified as the distance between the 1 and 95% EECs, is
40–48 dB, depending on the center frequency.
Fig. 4 shows EECs for 57 s of a male talker, recorded in
stereo from an FM BBC radio channel in England via a
Zoom H2 handy recorder using a sampling rate of 44.1
kHz and a resolution of 16 bit. Again, no known dynamic
range control was performed in the signal path after the
radio transmitter. The signal was centered in the stereo
mix, and so was converted to mono by the addition of the
left and right channels with equal weights. Notice that the
EECs are much closer together than for the unprocessed
speech in Fig. 3, especially for the contour range of
1–50%. The distance between the 1 and 95% EECs is
Fig. 3. Distribution of levels in 125-ms frames for male talker,recorded with no compression in signal chain.
534 J. Audio Eng. Soc., Vol. 57, No. 7/8, 2009 July/August
STONE ET AL. PAPERS

about 30 dB, more at low frequencies and less at higher
frequencies, and is much less than in Fig. 3. The conver-
gence of contours above 10 kHz is due to background
noise, especially for the last center frequency (19 kHz)
where there is no information in the broadcast signal due
to the 15-kHz low-pass filter routinely employed in FM
transmissions.
These figures only give a snapshot of the level distribu-
tions measured using analysis frames with a duration of
125 ms. Besides altering the distribution of levels, multi-
channel compression also reduces the peak-to-mean ratio
of complex signals, as will be shown later.
2 DESIGN OF PROCESSING STAGES
In the audio industry multichannel compression is com-
monly performed using specialist black boxes, sometimes
called “loudness optimizers.” Although much of the detail
of loudness optimizers is proprietary, part of the pro-
cessing chain typically consists of an equalizer (used to
adjust timbre; see later for details), followed by a multi-
channel compressor and a fast limiter, as illustrated in
Fig. 5. The number of channels N is typically between
3 and 6, depending on the manufacturer. We used this as
the basis of our system design. The intention was that the
processing should produce good audio quality, with few
audible artifacts, combined with a similar reduction in
signal peak levels and distribution of levels as a function
of frequency to that found in professional broadcasts for
the same type of program material. The method for the
choice of system parameters, such as compression speeds,
ratios, and thresholds, is given in Section 2.4.
2.1 Equalization to Adjust Timbre
Compared to the long-term average spectrum of unpro-
cessed speech [24], [25], the spectra of off-air recorded
speech signals showed more low- and high-frequency en-
ergy and less midfrequency energy, although the equaliza-
tion used in the off-air recordings showed large variations
both for a given broadcaster and across different broad-
casters. Typical examples of long-term spectra of unpro-
cessed and off-air speech signals are shown by the dashed
lines in Fig. 3 and 4. A finite-impulse-response (FIR) filter
was used to produce this difference in overall spectral
shape. The filter was applied before the compression, but
is was designed so that, following compression, the aver-
age spectra of the processed signals resembled those typi-
cal of FM broadcasts. The gain increased smoothly from
9 dB at the lowest frequencies (50 Hz) to reach a local
maximum of 13 dB around 141 Hz. The gain then de-
creased smoothly to 0 dB at 450 Hz. The gain was 0 dB
between 450 and 700 Hz. The gain increased smoothly
between 700 and 8000 Hz, and remained at 18 dB for
frequencies of 8000 Hz and above. At first sight the effec-
tive midfrequency dip produced by this filter seems large.
However, after multichannel compression the effect on the
long-term average spectral shape was smaller.
2.2 Multichannel Compression
Initially the signal was filtered into five channels using
FIR bandpass filters of variable length. The length was
chosen so that the transition region of the response of each
filter was similar when plotted on a logarithmic frequency
scale. The channel center frequencies were spaced by 7.5
ERBN. Edge frequencies between the channels were 505,
1420, 3429, and 7937 Hz. The filters were designed as the
convolution of a high-pass stage with a low-pass stage.
The high-pass stage of channel N +1 was the complement
of the low-pass stage of channel N, so their responses
intercepted at –6 dB. This ensured channel recombina-
tion with very little deviation from a flat passband. The
stopband responses did not exceed –65 dB relative to the
passband response. The variable-length FIRs introduced a
variation in delay across channels, which was removed
before further processing.
Fig. 5. Block diagram of dynamic range compression processing typically used in broadcasting.
Fig. 4. Distribution of levels in 125-ms frames for male talker,recorded from FM radio station.
J. Audio Eng. Soc., Vol. 57, No. 7/8, 2009 July/August 535
PAPERS FAST-ACTING AMPLITUDE COMPRESSION AND TWO-TALKER SEPARATION TASK

The method of estimating signal levels was identical
for each channel. The channel signal was full-wave recti-
fied and smoothed by a two-pole Bessel-derived low-pass
filter with a corner frequency of 8 Hz. This filter had
minimal overshoot, similar to that found in the loop filter
used by Stikvoort [30], and had near-symmetric attack
and release times of about 32 ms each. The envelope filter
introduced a delay of 19 ms; hence the audio was delayed
by this amount in order to time align the gain signal and
the audio signal. This is effectively a form of look ahead
[31]. The compensating delay helped to reduce overshoot
and undershoot effects. The compressor had almost no
effect on envelope modulation for modulation rates above
30 Hz, and it introduced little harmonic or intermodula-
tion distortion [32].
The compression ratio (CR) was the same for each
channel, and was either 1 (no compression), 1.82 (moder-
ate compression), or 10 (severe compression). Following
Moore et al. [1], the compression threshold in each chan-
nel was set to 3 dB below the rms level in that channel,
which avoided excessive pumping and gave a subjective
impression similar to that for off-air broadcasts. After
compression the channel signals were combined.
2.3 Look-Ahead Wide-BandCompression Limiting
Although the channel compressors reduced the peak
levels within each channel markedly, the reduction in the
peak levels of the wide-band signal produced by com-
bining the channel outputs was not so marked. The pur-
pose of the single-channel fast-acting compression limiter
was to reduce instantaneous peaks whose level was more
than a certain amount above the long-term rms level of
the wide-band signal. For the moderate compression sys-
tem the CR was set to 1.82 (the same as for the multi-
channel compressor), and the compression threshold was
set 12 dB above the rms level at the output of the multi-
channel compressor. For the severe compression system
the CR was set to 10 and the compression threshold was
set 10 dB above the rms level at the output of the multi-
channel compressor. Consequently the compressor was
activated infrequently, between 4 and 8% of the time.
The level estimate was implemented with a simple ex-
ponential attack and release of the full-wave rectified
signal. The attack time was 0.15 ms, and the release time
was 5 ms. A compensating delay of 0.125 ms was added
to the audio before application of the gain, to prevent
overshoot (the look ahead). The level estimator used in
the compressor included a peak-hold feature. When the
compression threshold was exceeded and the level estima-
tor was in attack mode, a counter was incremented as the
gain decreased. When the instantaneous level fell back
below that of the level estimator, the estimator went into
release mode. In release mode the counter was decrement-
ed until it reached zero. While the counter was greater
than zero, the estimator peak value was not allowed to
recover. The maximum hold time was 2 ms; the exact
length depended on the length of time that the estimator
has been in the attack mode.
Although this compressor was very fast, and therefore
introduced some intermodulation distortion, the gain
changes introduced by the compressor were small, maxi-
mally 3–4 dB. Hence the distortion was unlikely to be
subjectively disturbing [33].
2.4 Comparison of Compressed andOff-Air Signals
The parameters of the processing system described
were chosen so as to provide a reasonable spectral and
dynamic match to off-air signals. Fig. 6 shows the EECs,
calculated using 125-ms overlapping time frames, for the
same recording as used to produced Fig. 3, after severe
compression using the processing described before. Com-
paring this to Fig. 4, the contour levels are similar for
EECs down to 80%.
Figs. 4 and 6 were derived using relatively long 125-ms
time frames. Fast-acting compressors also reduce the
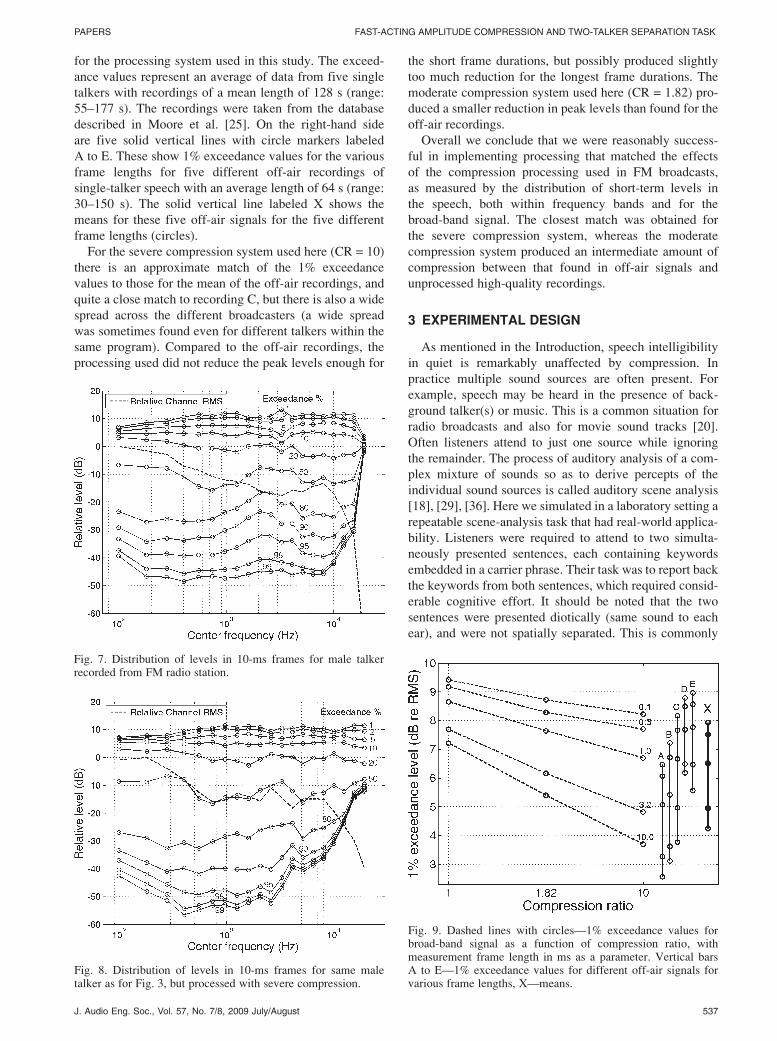
dynamic range over much shorter time scales. Figs. 7
and 8 show EECs derived using 10-ms frames, compara-
ble in duration to the temporal window of the auditory
system as determined by using nonsimultaneous masking
[34], [35]. Fig. 7 shows the EECs for the same recording
as was used to produce Fig. 3, after severe compression.
Fig. 8 shows EECs for the same FM broadcast as was
used to produce Fig. 4. Again, there is a reasonably good
match, but this time only for EECs down to 50%. We
conclude that our processing produced a distribution of
short-term levels similar to that occurring in (compressed)
FM broadcasts.
For the broad-band signal, reductions in peak level rel-
ative to the rms level were achieved mainly by the com-
pression limiter. The effect of this can be examined by
considering the levels that were exceeded for only a small
percentage of the time. Fig. 9 shows the 1% exceedance
values for wide-band signals for a variety of analysis
frame lengths, ranging from 0.1 to 10 ms, in steps of a
factor of 3.16 (10½), based on examples of single-talker
speech. The dashed lines show values as a function of CR
Fig. 6. Distribution of levels in 125-ms frames for same maletalker as for Fig. 3, but processed with severe compression.
536 J. Audio Eng. Soc., Vol. 57, No. 7/8, 2009 July/August
STONE ET AL. PAPERS
for the processing system used in this study. The exceed-
ance values represent an average of data from five single
talkers with recordings of a mean length of 128 s (range:
55–177 s). The recordings were taken from the database
described in Moore et al. [25]. On the right-hand side
are five solid vertical lines with circle markers labeled
A to E. These show 1% exceedance values for the various
frame lengths for five different off-air recordings of
single-talker speech with an average length of 64 s (range:
30–150 s). The solid vertical line labeled X shows the
means for these five off-air signals for the five different
frame lengths (circles).
For the severe compression system used here (CR = 10)
there is an approximate match of the 1% exceedance
values to those for the mean of the off-air recordings, and
quite a close match to recording C, but there is also a wide
spread across the different broadcasters (a wide spread
was sometimes found even for different talkers within the
same program). Compared to the off-air recordings, the
processing used did not reduce the peak levels enough for
the short frame durations, but possibly produced slightly
too much reduction for the longest frame durations. The
moderate compression system used here (CR = 1.82) pro-
duced a smaller reduction in peak levels than found for the
off-air recordings.
Overall we conclude that we were reasonably success-
ful in implementing processing that matched the effects
of the compression processing used in FM broadcasts,
as measured by the distribution of short-term levels in
the speech, both within frequency bands and for the
broad-band signal. The closest match was obtained for
the severe compression system, whereas the moderate
compression system produced an intermediate amount of
compression between that found in off-air signals and
unprocessed high-quality recordings.
3 EXPERIMENTAL DESIGN
As mentioned in the Introduction, speech intelligibility
in quiet is remarkably unaffected by compression. In
practice multiple sound sources are often present. For
example, speech may be heard in the presence of back-
ground talker(s) or music. This is a common situation for
radio broadcasts and also for movie sound tracks [20].
Often listeners attend to just one source while ignoring
the remainder. The process of auditory analysis of a com-
plex mixture of sounds so as to derive percepts of the
individual sound sources is called auditory scene analysis
[18], [29], [36]. Here we simulated in a laboratory setting a
repeatable scene-analysis task that had real-world applica-
bility. Listeners were required to attend to two simulta-
neously presented sentences, each containing keywords
embedded in a carrier phrase. Their task was to report back
the keywords from both sentences, which required consid-
erable cognitive effort. It should be noted that the two
sentences were presented diotically (same sound to each
ear), and were not spatially separated. This is commonly
Fig. 7. Distribution of levels in 10-ms frames for male talkerrecorded from FM radio station.
Fig. 8. Distribution of levels in 10-ms frames for same maletalker as for Fig. 3, but processed with severe compression.
Fig. 9. Dashed lines with circles—1% exceedance values forbroad-band signal as a function of compression ratio, withmeasurement frame length in ms as a parameter. Vertical barsA to E—1% exceedance values for different off-air signals forvarious frame lengths, X—means.
J. Audio Eng. Soc., Vol. 57, No. 7/8, 2009 July/August 537
PAPERS FAST-ACTING AMPLITUDE COMPRESSION AND TWO-TALKER SEPARATION TASK

the case for movie sound, where dialogue is usually pre-
sented via the center channel [20].
Apart from manipulating the processing applied to the
speech, cognitive effort was modulated by an additional
task which prevented listeners from making immediate
responses to the speech. This “distraction” task was design-
ed to stimulate another sense (vision) with information that
did not compete with the linguistic, numeric, or color infor-
mation in the main task. It was used on half the trials.
The rationale behind the use of the distraction task was
as follows. Fast-acting compression may make it harder to
perform scene analysis on a mixture of sounds, the segre-
gation of the two voices in the present case. However,
listeners may compensate for this by applying more ef-
fort, so any effect of the compression will not necessarily
show up in identification scores. Cognitive capacity is
believed to be a finite resource; there is a limit to the
amount of effort that can be expended [21]. Hence a
distraction task may use up some of the effort that would
otherwise be employed on the speech-identification task.
This may make it easier to reveal deleterious effects of the
fast-acting compression. The effects may show up either as
poorer performance on aspects of the main speech-identifi-
cation task, as poorer performance on the distraction task,
or both. A similar rationale has been used in studies of the
effectiveness of signal processing in hearing aids [37], [38].
3.1 Speech Stimuli and Presentation
The stimuli were based on the CRM corpus [39], which
comprises four male and four female speakers, each pro-
ducing 256 utterances of a carrier sentence “Ready
<CALLSIGN> go to <COLOR> <NUMBER> now.”
The keywords of callsign, color, and number varied
between sentences. There were eight variants of the call-
sign, four of the color, and eight of the number. The
British-English recordings were made in a carpeted,
sound-attenuated room using a Sennheiser K3N/ME40
microphone whose output was digitized at a sample rate
of 44.1 kHz with 16-bit amplitude quantization using a
LynxONE soundcard. The recording of each sentence was
edited to remove leading and trailing silences and subse-
quently normalized to the same total rms power. These
recordings were not band-limited other than by the sam-
pling rate, and so contained audible energy up to about 16
kHz, which is typical for speech [25]. The speech produc-
tion style meant that the British-English recording
contained more modulation than the original American-
English recording. Only the recordings from the male
speakers were used. Sentence lengths varied between 1.9
and 3.1 s.
Pairs of sentences were chosen with no speaker, call-
sign, color, or number in common. For each pair the
durations of the sentences differed by less than 7%, so
that they had a similar rhythm. The start of the second
sentence was offset randomly in time from the start of the
first, with a uniform distribution between �150 ms. The
mixing of the sentences was performed at equal rms
levels. The listener’s task was to identify all six keywords,
three from each talker.
In one condition the compression processing was per-
formed after mixing of the sentences, as would usually be
the case in broadcasting. This introduced cross modula-
tion between the two voices, as described earlier, so
this condition is called XMOD. In a second condition
the sentences were compressed independently and then
mixed. For this condition, called INDEP, there was no
cross modulation. A comparison of results for these two
conditions was intended to clarify the extent to which any
deleterious effect of the compression could be attributed
to cross modulation, as opposed to other effects (such as
reduction of modulation depth, or reduction of spectral
contrast), which would occur for both the XMOD and
INDEP conditions.
The stimuli were gated on and off with 20-ms half-
cosine ramps. All processing was performed off line, and
processed stimuli were played from 16-bit wav-format
files using a LynxONE soundcard hosted in a PC. Signal-
level buffering and adjustment was provided by a Mackie
1202 VLZ-pro mixing desk. Signals were presented dioti-
cally (same signal to each ear) via Sennheiser HD580
headphones, at a level of 68 dB SPL. Each listener was
seated in a double-walled, sound-isolated booth.
3.2 Listeners
Twenty-four normal-hearing university students (12 male,
12 female), with ages ranging between 20 and 32 years,
were selected for testing. All listeners had audiometric
thresholds less than 20 dB HL at octave frequencies in the
range 125 to 8000 Hz, as well as at 3000 and 6000 Hz, in
both ears. Listeners attended three sessions, held on different
days, and were paid for their participation.
3.3 Procedure
There were three sessions, one training session (two
blocks of 90 trials, taking about 1.5 h to complete) and two
testing sessions (each comprising one block of 18 trials, to
act as a “warm up,” and two blocks of 120 trials, taking in
total about 2 h to complete). Each block consisted of trials
of either INDEP or XMOD processing. Within each block
multiple examples of linear processing and moderate or
severe compression were presented randomly. The order of
presentation of blocks with INDEP and XMOD processing
was counterbalanced within and across sessions as well as
within and across the gender of the listeners.
Before the experiment started, the listeners were
briefed that data entry would be by mouse clicking on a
scorecard, as shown in Fig. 10, comprising buttons form-
ing columns adjacent to names for the callsign, color, and
number options for each of the two sentences heard. They
were told to enter the keywords spoken by one talker in
one column (chosen arbitrarily) and to enter the keywords
spoken by the other talker in the remaining column. They
were informed of the uniqueness of the talker, callsign,
color, and number in each sentence, but no mention was
made of any other strategy that they might employ to
complete the data entry. They were encouraged to find a
method during the training session with which they were
content, and to stick to that method during the testing
538 J. Audio Eng. Soc., Vol. 57, No. 7/8, 2009 July/August
STONE ET AL. PAPERS

sessions. They were asked to guess if they were uncertain
of any keyword.
During the presentation of the processed sentences the
scorecard was inactive, so no data entry could be per-
formed. After the signal had finished, two things could
happen:
1) In one half of the trials the scorecard became active
and data entry could begin. Once data entry was complete,
the listener clicked the Accept button and the keyword
responses for the trial were recorded. The time between
when the scorecard became active and the time when the
Accept button was clicked also recorded.
2) In the other half of the trials the scorecard remained
inactive while a square orange patch appeared at a ran-
dom angle, but fixed distance, from the Accept button.
This orange patch, the visual distractor, was clicked on to
make it disappear. The time between the appearance of
the visual distractor and its cancellation was recorded.
Once this was done, the scorecard became active and
entry of the keywords could begin. Once complete, the
listener clicked the Accept button and the responses as
well as the time between when the scorecard became
active and the Accept button being clicked was recorded.
The distractor appeared pseudorandomly, with the con-
straint that it appeared on exactly half of the trials within
a block.
After pressing the Accept button there was a short
delay during which the correct results were displayed,
and then the next trial started automatically. During this
delay it was also possible for the listener to press the
Pause button to permit a rest between trials, if desired.
Listeners made only occasional use of this, at most once
per block.
4 RESULTS
For each trial up to four measures were generated.
1) Tvisdis Time taken to clear the visual distractor,
processed statistically as log10(Tvisdis) to normalize the
variance of an otherwise skewed distribution. Tvisdis wasonly available for half the trials, those when the distractor
was presented.
2) Tcard Defined as the time taken to fill the score-
card. This was also processed as log10(Tcard) to normal-
ize variance of an otherwise skewed distribution.
3) Score Number of keywords correct per trial, tak-
ing into account the allocation of keywords to the indi-
vidual talkers. To be completely correct, all keywords
spoken by a given talker should be entered in one col-
umn, and all keywords spoken by the other talker should
be entered in the other column. However, the allocation
of talkers to columns was chosen arbitrarily by the lis-
tener. The first stage in determining Score was to esti-
mate how the listener allocated talkers to columns on a
given trial. We denote the keywords presented on a
given trial by (N1, C1, and X1) and (N2, C2, and X2),
where N, C, and X denote callsign, color, and number,
respectively, and 1 and 2 denote talker 1 and talker 2,
respectively. We denote the responses on that trial by
(n1, c1, and x1) and (n2, c2, and x2), where 1 and
2 denote column 1 and column 2. We compared the
number of matches between presented and reported key-
words for two pairings:
a) (N1, C1, and X1) versus (n1, c1, and x1) and (N2,
C2, and X2) versus (n2, c2, and x2).
b) (N1, C1, and X1) versus (n2, c2, and x2) and (N2,
C2, and X2) versus (n1, c1, and x1).
Since there were fewer colors than callsigns or numbers,
which made colors easier to guess, matches for color were
assigned a weight of 2, whereas matches for callsign and
number were assigned a weight of 3. Whichever of a) and
b) gave the highest number of weighted matches was taken
as indicating the allocation of talkers to columns used by
the listener. For example, if the number of weighted
matches was higher for b), this meant that talker 2 was
allocated to column 1. Rarely the weighted matches were
equal for a) and b). When this happened, then the alloca-
tion of talkers to columns was based on whichever alloca-
tion gave the lowest number of Reversals; these are definedin 4). Once the allocation of talkers to columns had been
determined, the number of keywords correct was deter-
mined. A keyword entered in a given column was only
counted as correct if it had been spoken by the speaker
allocated to that column. Each keyword contributed one
point to the Score, so the maximum value of Score was 6.4) Proportion of Reversals When a listener identified
both keywords in a given category correctly (callsign,
color, or number), but entered them in the “wrong”
columns, as defined before, it was deemed that a Reversalhad occurred. The maximum number of Reversals per trialwas 1, given the method for deciding which talker was
allocated to which sentence. The proportion of ReversalsFig. 10. Screen shot of scorecard used for data collection.
J. Audio Eng. Soc., Vol. 57, No. 7/8, 2009 July/August 539
PAPERS FAST-ACTING AMPLITUDE COMPRESSION AND TWO-TALKER SEPARATION TASK
provides a measure of the extent to which words were
heard correctly but were assigned to the wrong talker.
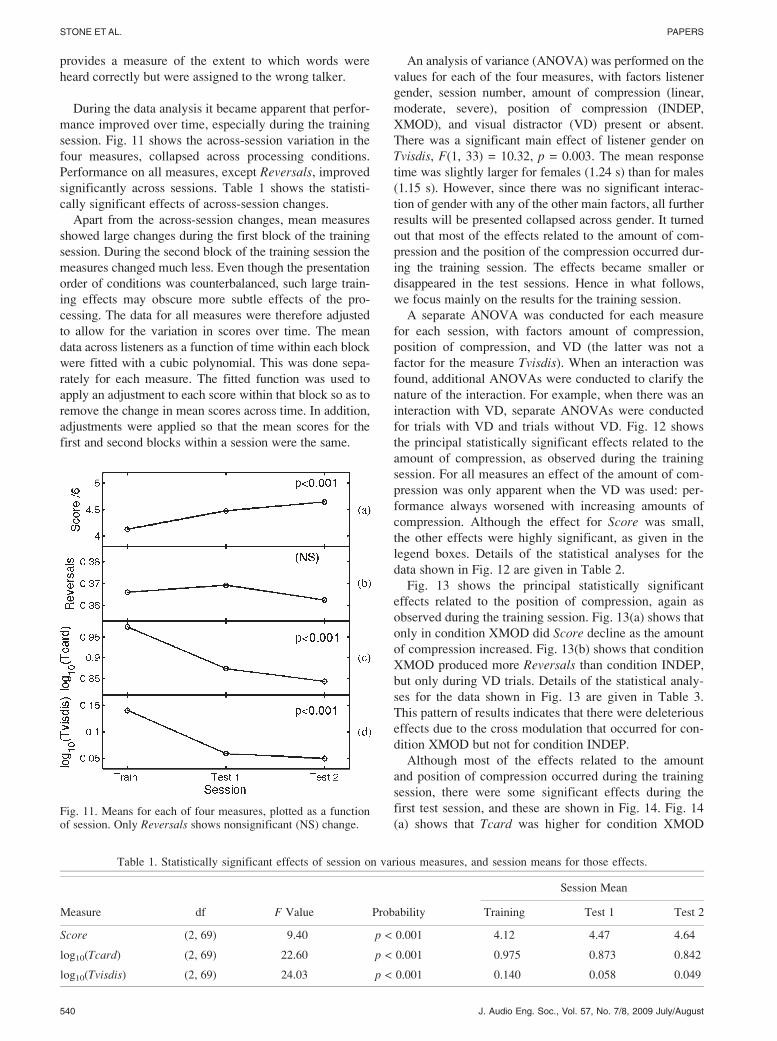
During the data analysis it became apparent that perfor-
mance improved over time, especially during the training
session. Fig. 11 shows the across-session variation in the
four measures, collapsed across processing conditions.
Performance on all measures, except Reversals, improved
significantly across sessions. Table 1 shows the statisti-
cally significant effects of across-session changes.
Apart from the across-session changes, mean measures
showed large changes during the first block of the training
session. During the second block of the training session the
measures changed much less. Even though the presentation
order of conditions was counterbalanced, such large train-
ing effects may obscure more subtle effects of the pro-
cessing. The data for all measures were therefore adjusted
to allow for the variation in scores over time. The mean
data across listeners as a function of time within each block
were fitted with a cubic polynomial. This was done sepa-
rately for each measure. The fitted function was used to
apply an adjustment to each score within that block so as to
remove the change in mean scores across time. In addition,
adjustments were applied so that the mean scores for the
first and second blocks within a session were the same.
An analysis of variance (ANOVA) was performed on the
values for each of the four measures, with factors listener
gender, session number, amount of compression (linear,
moderate, severe), position of compression (INDEP,
XMOD), and visual distractor (VD) present or absent.
There was a significant main effect of listener gender on
Tvisdis, F(1, 33) = 10.32, p = 0.003. The mean response
time was slightly larger for females (1.24 s) than for males
(1.15 s). However, since there was no significant interac-
tion of gender with any of the other main factors, all further
results will be presented collapsed across gender. It turned
out that most of the effects related to the amount of com-
pression and the position of the compression occurred dur-
ing the training session. The effects became smaller or
disappeared in the test sessions. Hence in what follows,
we focus mainly on the results for the training session.
A separate ANOVA was conducted for each measure
for each session, with factors amount of compression,
position of compression, and VD (the latter was not a
factor for the measure Tvisdis). When an interaction was
found, additional ANOVAs were conducted to clarify the
nature of the interaction. For example, when there was an
interaction with VD, separate ANOVAs were conducted
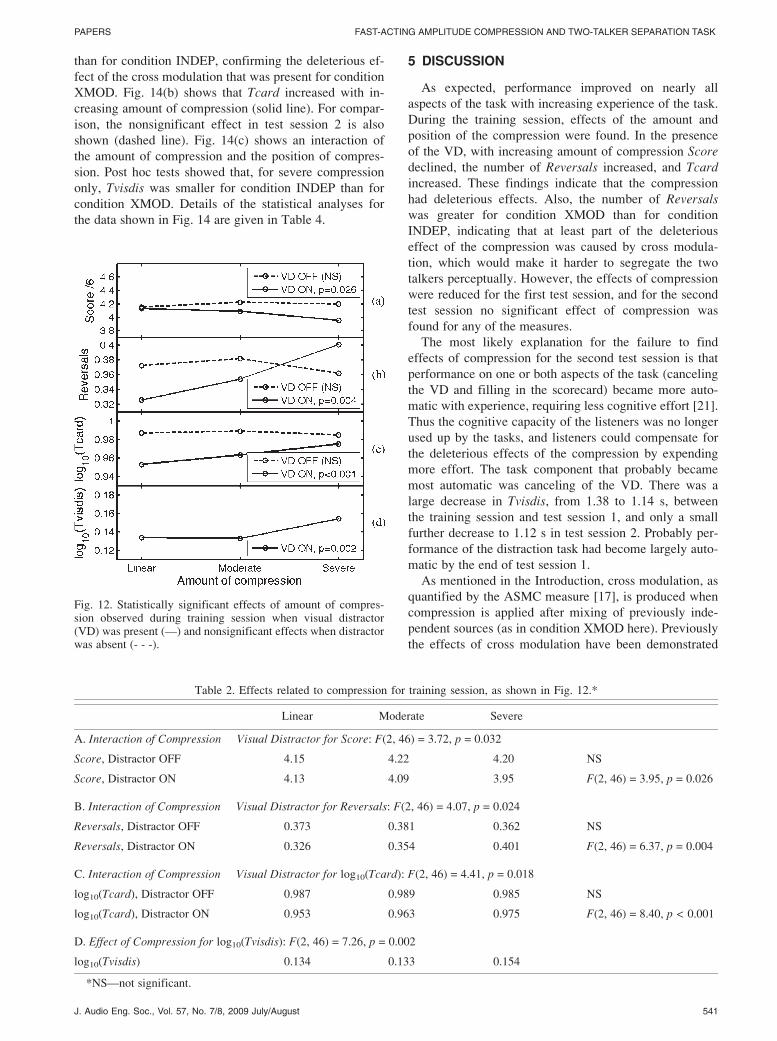
for trials with VD and trials without VD. Fig. 12 shows
the principal statistically significant effects related to the
amount of compression, as observed during the training
session. For all measures an effect of the amount of com-
pression was only apparent when the VD was used: per-
formance always worsened with increasing amounts of
compression. Although the effect for Score was small,
the other effects were highly significant, as given in the
legend boxes. Details of the statistical analyses for the
data shown in Fig. 12 are given in Table 2.
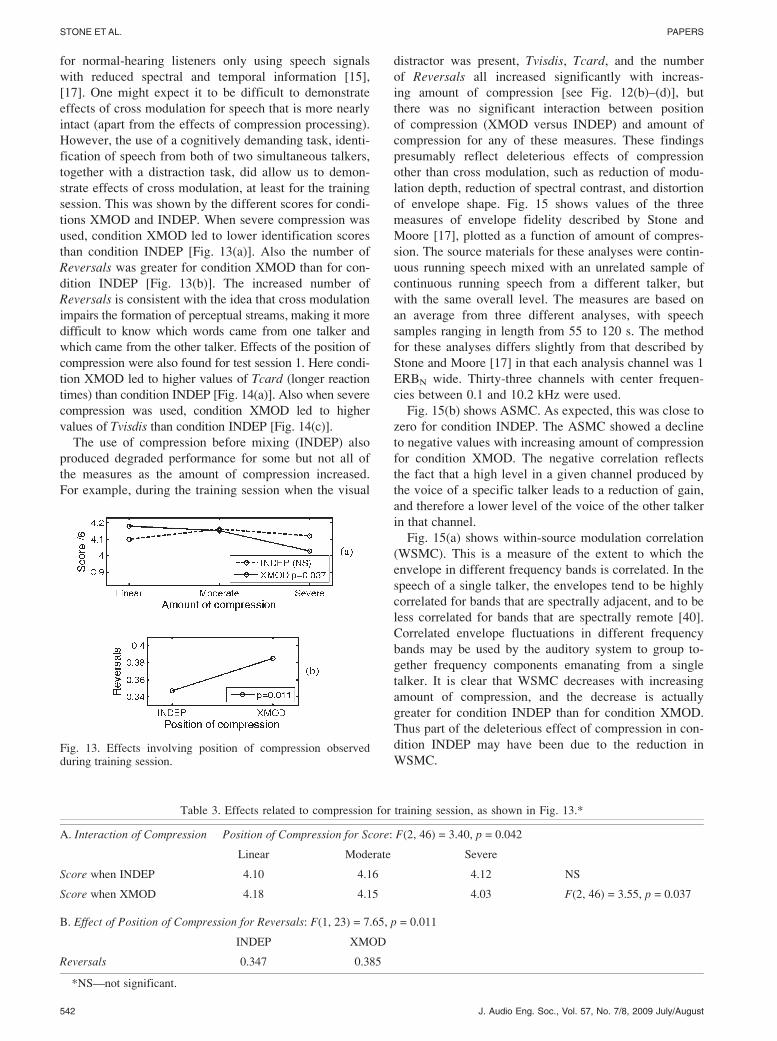
Fig. 13 shows the principal statistically significant
effects related to the position of compression, again as
observed during the training session. Fig. 13(a) shows that
only in condition XMOD did Score decline as the amount
of compression increased. Fig. 13(b) shows that condition
XMOD produced more Reversals than condition INDEP,
but only during VD trials. Details of the statistical analy-
ses for the data shown in Fig. 13 are given in Table 3.
This pattern of results indicates that there were deleterious
effects due to the cross modulation that occurred for con-
dition XMOD but not for condition INDEP.
Although most of the effects related to the amount
and position of compression occurred during the training
session, there were some significant effects during the
first test session, and these are shown in Fig. 14. Fig. 14
(a) shows that Tcard was higher for condition XMODFig. 11. Means for each of four measures, plotted as a functionof session. Only Reversals shows nonsignificant (NS) change.
Table 1. Statistically significant effects of session on various measures, and session means for those effects.
Session Mean
Measure df F Value Probability Training Test 1 Test 2
Score (2, 69) 9.40 p < 0.001 4.12 4.47 4.64
log10(Tcard) (2, 69) 22.60 p < 0.001 0.975 0.873 0.842
log10(Tvisdis) (2, 69) 24.03 p < 0.001 0.140 0.058 0.049
540 J. Audio Eng. Soc., Vol. 57, No. 7/8, 2009 July/August
STONE ET AL. PAPERS
than for condition INDEP, confirming the deleterious ef-
fect of the cross modulation that was present for condition
XMOD. Fig. 14(b) shows that Tcard increased with in-
creasing amount of compression (solid line). For compar-
ison, the nonsignificant effect in test session 2 is also
shown (dashed line). Fig. 14(c) shows an interaction of
the amount of compression and the position of compres-
sion. Post hoc tests showed that, for severe compression
only, Tvisdis was smaller for condition INDEP than for
condition XMOD. Details of the statistical analyses for
the data shown in Fig. 14 are given in Table 4.
5 DISCUSSION
As expected, performance improved on nearly all
aspects of the task with increasing experience of the task.
During the training session, effects of the amount and
position of the compression were found. In the presence
of the VD, with increasing amount of compression Scoredeclined, the number of Reversals increased, and Tcardincreased. These findings indicate that the compression
had deleterious effects. Also, the number of Reversalswas greater for condition XMOD than for condition
INDEP, indicating that at least part of the deleterious
effect of the compression was caused by cross modula-
tion, which would make it harder to segregate the two
talkers perceptually. However, the effects of compression
were reduced for the first test session, and for the second
test session no significant effect of compression was
found for any of the measures.
The most likely explanation for the failure to find
effects of compression for the second test session is that
performance on one or both aspects of the task (canceling
the VD and filling in the scorecard) became more auto-
matic with experience, requiring less cognitive effort [21].
Thus the cognitive capacity of the listeners was no longer
used up by the tasks, and listeners could compensate for
the deleterious effects of the compression by expending
more effort. The task component that probably became
most automatic was canceling of the VD. There was a
large decrease in Tvisdis, from 1.38 to 1.14 s, between
the training session and test session 1, and only a small
further decrease to 1.12 s in test session 2. Probably per-
formance of the distraction task had become largely auto-
matic by the end of test session 1.
As mentioned in the Introduction, cross modulation, as
quantified by the ASMC measure [17], is produced when
compression is applied after mixing of previously inde-
pendent sources (as in condition XMOD here). Previously
the effects of cross modulation have been demonstrated
Fig. 12. Statistically significant effects of amount of compres-sion observed during training session when visual distractor(VD) was present (—) and nonsignificant effects when distractorwas absent (- - -).
Table 2. Effects related to compression for training session, as shown in Fig. 12.*
Linear Moderate Severe
A. Interaction of Compression � Visual Distractor for Score: F(2, 46) = 3.72, p = 0.032
Score, Distractor OFF 4.15 4.22 4.20 NS
Score, Distractor ON 4.13 4.09 3.95 F(2, 46) = 3.95, p = 0.026
B. Interaction of Compression � Visual Distractor for Reversals: F(2, 46) = 4.07, p = 0.024
Reversals, Distractor OFF 0.373 0.381 0.362 NS
Reversals, Distractor ON 0.326 0.354 0.401 F(2, 46) = 6.37, p = 0.004
C. Interaction of Compression � Visual Distractor for log10(Tcard): F(2, 46) = 4.41, p = 0.018
log10(Tcard), Distractor OFF 0.987 0.989 0.985 NS
log10(Tcard), Distractor ON 0.953 0.963 0.975 F(2, 46) = 8.40, p < 0.001
D. Effect of Compression for log10(Tvisdis): F(2, 46) = 7.26, p = 0.002
log10(Tvisdis) 0.134 0.133 0.154
*NS—not significant.
J. Audio Eng. Soc., Vol. 57, No. 7/8, 2009 July/August 541
PAPERS FAST-ACTING AMPLITUDE COMPRESSION AND TWO-TALKER SEPARATION TASK
for normal-hearing listeners only using speech signals
with reduced spectral and temporal information [15],
[17]. One might expect it to be difficult to demonstrate
effects of cross modulation for speech that is more nearly
intact (apart from the effects of compression processing).
However, the use of a cognitively demanding task, identi-
fication of speech from both of two simultaneous talkers,
together with a distraction task, did allow us to demon-
strate effects of cross modulation, at least for the training
session. This was shown by the different scores for condi-
tions XMOD and INDEP. When severe compression was
used, condition XMOD led to lower identification scores
than condition INDEP [Fig. 13(a)]. Also the number of
Reversals was greater for condition XMOD than for con-
dition INDEP [Fig. 13(b)]. The increased number of
Reversals is consistent with the idea that cross modulation
impairs the formation of perceptual streams, making it more
difficult to know which words came from one talker and
which came from the other talker. Effects of the position of
compression were also found for test session 1. Here condi-
tion XMOD led to higher values of Tcard (longer reaction
times) than condition INDEP [Fig. 14(a)]. Also when severe
compression was used, condition XMOD led to higher
values of Tvisdis than condition INDEP [Fig. 14(c)].
The use of compression before mixing (INDEP) also
produced degraded performance for some but not all of
the measures as the amount of compression increased.
For example, during the training session when the visual
distractor was present, Tvisdis, Tcard, and the number
of Reversals all increased significantly with increas-
ing amount of compression [see Fig. 12(b)–(d)], but
there was no significant interaction between position
of compression (XMOD versus INDEP) and amount of
compression for any of these measures. These findings
presumably reflect deleterious effects of compression
other than cross modulation, such as reduction of modu-
lation depth, reduction of spectral contrast, and distortion
of envelope shape. Fig. 15 shows values of the three
measures of envelope fidelity described by Stone and
Moore [17], plotted as a function of amount of compres-
sion. The source materials for these analyses were contin-
uous running speech mixed with an unrelated sample of
continuous running speech from a different talker, but
with the same overall level. The measures are based on
an average from three different analyses, with speech
samples ranging in length from 55 to 120 s. The method
for these analyses differs slightly from that described by
Stone and Moore [17] in that each analysis channel was 1
ERBN wide. Thirty-three channels with center frequen-
cies between 0.1 and 10.2 kHz were used.
Fig. 15(b) shows ASMC. As expected, this was close to
zero for condition INDEP. The ASMC showed a decline
to negative values with increasing amount of compression
for condition XMOD. The negative correlation reflects
the fact that a high level in a given channel produced by
the voice of a specific talker leads to a reduction of gain,
and therefore a lower level of the voice of the other talker
in that channel.
Fig. 15(a) shows within-source modulation correlation
(WSMC). This is a measure of the extent to which the
envelope in different frequency bands is correlated. In the
speech of a single talker, the envelopes tend to be highly
correlated for bands that are spectrally adjacent, and to be
less correlated for bands that are spectrally remote [40].
Correlated envelope fluctuations in different frequency
bands may be used by the auditory system to group to-
gether frequency components emanating from a single
talker. It is clear that WSMC decreases with increasing
amount of compression, and the decrease is actually
greater for condition INDEP than for condition XMOD.
Thus part of the deleterious effect of compression in con-
dition INDEP may have been due to the reduction in
WSMC.Fig. 13. Effects involving position of compression observedduring training session.
Table 3. Effects related to compression for training session, as shown in Fig. 13.*
A. Interaction of Compression � Position of Compression for Score: F(2, 46) = 3.40, p = 0.042
Linear Moderate Severe
Score when INDEP 4.10 4.16 4.12 NS
Score when XMOD 4.18 4.15 4.03 F(2, 46) = 3.55, p = 0.037
B. Effect of Position of Compression for Reversals: F(1, 23) = 7.65, p = 0.011
INDEP XMOD
Reversals 0.347 0.385
*NS—not significant.
542 J. Audio Eng. Soc., Vol. 57, No. 7/8, 2009 July/August
STONE ET AL. PAPERS

Fig. 15(c) shows the measure, fidelity of envelope
shape (FES). This is a measure of the extent to which the
envelope shape in a given frequency channel of the pro-
cessed signal resembles the envelope shape for the same
channel of the original signal. A value below 1 indicates
some distortion of the envelope shape. With increasing
amount of compression the value of FES decreased, more
so for condition INDEP than for condition XMOD. This
decrease in FES may contribute to the deleterious effect
of compression in condition INDEP.
In summary the deleterious effects of compression ap-
plied to a mixture of the speech from two talkers partly
depend on cross modulation, but other factors, including
reduction of modulation depth, reduction of spectral con-
trast, reduction of WSMC, and reduction of FES, may
also play a role.
It should be noted that fast-acting dynamic range com-
pression may have beneficial effects under some condi-
tions. For example, when listening to broadcast or recorded
sound in a noisy environment (such as in a car or aircraft),
the compression may improve the audibility of weaker
parts of the signal by amplifying their level relative to the
background noise. However, as shown here, the excessive
use of compression may lead to a reduced ability to dis-
criminate sounds and/or increased listening effort.
6 SUMMARY AND CONCLUSIONS
Young, normal-hearing listeners were required to iden-
tify the keywords produced by two simultaneous talkers
while, on some trials, performing a distracting visual task.
The effect of multichannel fast-acting compression on
performance in this cognitively taxing situation was
assessed. The compression varied in amount, and the
severe amount was chosen to create processed speech with
Table 4. Effects related to compression for first testing session, as shown in Fig. 14.*
A. Effect of Position of Compression for log10(Tcard) during VD trials: F(1, 23) = 6.97, p = 0.015
INDEP XMOD
log10(Tcard) 0.864 0.875
B. Effect of Compression for log10(Tcard): F(2, 6) = 4.96, p = 0.011
Linear Moderate Severe
log10(Tcard) 0.866 0.877 0.876
C. Interaction of Compression � Position of Compression for log10(Tvisdis): F(2, 46) = 3.22, p = 0.049
Linear Moderate Severe
log10(Tvisdis), when INDEP 0.065 0.060 0.051 NS
log10(Tvisdis), when XMOD 0.056 0.056 0.062 NS
*NS—not significant.
Fig. 14. Effects observed in first testing session. Panel (b) alsoshows a comparison with equivalent data for test session 2.
Fig. 15. Measures according to Stone and Moore [17] on envelopes from 1-ERBN-wide channels of signals processed in the same way asfor conditions used in this experiment. (a) Within-source modulation correlation (WSMC). (b) Across-source modulation correlation(ASMC). (c) Fidelity of envelope shape (FES). - - - Values of same measures for unprocessed signal; linear condition (labeled reference).
J. Audio Eng. Soc., Vol. 57, No. 7/8, 2009 July/August 543
PAPERS FAST-ACTING AMPLITUDE COMPRESSION AND TWO-TALKER SEPARATION TASK
spectrotemporal characteristics similar to those of speech
in FM broadcasts in the UK.
During the training session, performance on several
measures worsened with increasing amount of compres-
sion for trials when the listeners had to perform the dis-
tracting visual task. These measures included the number
of words identified correctly and assigned to the correct
talker (Score), the number of words assigned to the wrong
talker (Reversals), the time taken to enter responses
for the main task (Tcard), and the time taken to perform
the distracting task (Tvisdis). For severe compression the
mean value of Score was lower when the speech of
the two talkers was compressed after mixing (condition
XMOD) than when compression was applied to the
speech of each talker prior to mixing (condition INDEP).
Also the proportion of Reversals was greater for conditionXMOD than for condition INDEP. These latter results
suggest that part of the deleterious effect of compression
in condition XMOD was produced by cross modulation of
the speech of the two talkers, which makes it harder to
segregate the two voices perceptually.
The overall pattern of results is consistent with the
idea that high amounts of compression require increased
cognitive effort to understand speech when there are two
talkers. The amount of effort in this situation is nearly
at the limit of the effort that listeners can expend. The
distracting visual task requires some cognitive effort, and
therefore takes away from the resources available to per-
form the main (speech-identification) task.
The deleterious effects of compression decreased with
experience at the tasks, and were absent after 3–4 hours of
experience, that is, during the final testing session. This
probably happened because the distracting visual task
could be performed automatically after extended training
and required less cognitive effort.
It seems reasonable to assume that large sections of the
population, having less cognitive ability and less normal
hearing than the listeners used here, will have to expend
more effort to attend to and interpret severely compressed
mixtures of sounds. This may contribute to the sense of
fatigue that has been reported anecdotally when listening
to severely compressed sounds.
7 ACKNOWLEDGMENT
This work was supported by the MRC (UK) and an EU
Marie-Curie fellowship to author CF. We thank Floyd
Toole and another anonymous reviewer for helpful com-
ments on an earlier version of this paper. We thank Brian
Glasberg and Andrew and Sarah Creeke for access to their
ageing music collections.
8 REFERENCES
[1] B. C. J. Moore, B. R. Glasberg, and M. A. Stone,
“Why Are Commercials So Loud?—Perception and Mod-
eling of the Loudness of Amplitude-Compressed Speech,”
J. Audio Eng. Soc., vol. 51, pp. 1123–1132 (2003 Dec.).
[2] Http://Floweringtoilet.Blogspot.Com/2008/07/Yo-
Turn-It-Down.Html; accessed 2008 Sept. 10.
[3] Http://Floweringtoilet.Blogspot.Com/2008_07_01_
Archive.Html; accessed 2008 Sept. 10.
[4] B. C. J. Moore, Cochlear Hearing Loss: Physiolog-ical, Psychological and Technical Issues, 2nd ed. (Wiley,
Chichester, UK, 2007).
[5] E. P. Fowler, “A Method for the Early Detection of
Otosclerosis,” Arch. Otolaryngol., vol. 24, pp. 731–741(1936).
[6] B. C. J. Moore, M. Wojtczak, and D. A. Vickers,
“Effect of Loudness Recruitment on the Perception of
Amplitude Modulation,” J. Acoust. Soc. Am., vol. 100,pp. 481–489 (1996).
[7] B. C. J. Moore, J. S. Johnson, T. M. Clark, and
V. Pluvinage, “Evaluation of a Dual-Channel Full Dynamic
Range Compression System for People with Sensorineural
Hearing Loss,” Ear Hear., vol. 13, pp. 349–370 (1992).[8] L. D. Braida, N. I. Durlach, S. V. De Gennaro,
P. M. Peterson, and D. K. Bustamante, “Review of Recent
Research on Multiband Amplitude Compression for the
Hearing Impaired,” in The Vanderbilt Hearing-Aid ReportG. A. Studebaker and F. H. Bess, Eds. (Monographs in Con-
temporaryAudiology,UpperDarby, PA, 1982), pp. 133–140.
[9] M. A. Stone and B. C. J. Moore, “Syllabic Com-
pression: Effective Compression Ratios for Signals
Modulated at Different Rates,” Brit. J. Audiol., vol. 26,pp. 351–361 (1992).
[10] R. Plomp, “The Negative Effect of Amplitude
Compression in Multichannel Hearing Aids in the Light
of the Modulation-Transfer Function,” J. Acoust. Soc.Am., vol. 83, pp. 2322–2327 (1988).
[11] H. J. M. Steeneken and T. Houtgast, “A Physical
Method for Measuring Speech-Transmission Quality,”
J. Acoust. Soc. Am., vol. 69, pp. 318–326 (1980).
[12] C. T. Tan and B. C. J. Moore, “Comparison of
Two Forms of Fast-Acting Compression Using Physical
and Subjective Measures,” in Proc. 18th Inter. Congr. onAcoustics (Kyoto, Japan, 2004).
[13] R. A. van Buuren, J. Festen, and T. Houtgast,
“Compression and Expansion of the Temporal Envelope:
Evaluation of Speech Intelligibility and Sound Quality,”
J. Acoust. Soc. Am., vol. 105, pp. 2903–2913 (1999).
[14] M. A. Stone and B. C. J. Moore, “Side Effects of
Fast-Acting Dynamic Range Compression that Affect In-
telligibility in a Competing Speech Task,” J. Acoust. Soc.Am., vol. 116, pp. 2311–2323 (2004).
[15] M. A. Stone and B. C. J. Moore, “Effects of Spectro-
Temporal Modulation Changes Produced byMulti-Channel
Compression on Intelligibility in a Competing-Speech
Task,” J. Acoust. Soc. Am., vol. 123, pp. 1063–1076 (2008).[16] H. Dudley, “Remaking Speech,” J. Acoust. Soc.
Am., vol. 11, pp. 169–177 (1939).
[17] M. A. Stone and B. C. J. Moore, “Quantifying the
Effects of Fast-Acting Compression on the Envelope of
Speech,” J. Acoust. Soc. Am., vol. 121, pp. 1654–1664 (2007).[18] A. S. Bregman, Auditory Scene Analysis: The Per-
ceptual Organization of Sound (Bradford Books, MIT
Press, Cambridge, MA, 1990).
[19] H. Sato, J. S. Bradley, and M. Morimoto, “Using
Listening Difficulty Rating of Conditions for Speech
544 J. Audio Eng. Soc., Vol. 57, No. 7/8, 2009 July/August
STONE ET AL. PAPERS
Communication in Rooms,” J. Acoust. Soc. Am., vol. 117,pp. 1157–1167 (2005).
[20] F. E. Toole, Sound Reproduction (Focal Press,
Elsevier, Amsterdam, The Netherlands, 2008).
[21] D. Kahneman, Attention and Effort (Prentice-Hall,Englewood Cliffs, NJ, 1973).
[22] H. K. Dunn and S. D. White, “Statistical Measure-
ments on Conversational Speech,” J. Acoust. Soc. Am.,vol. 11, pp. 278–283 (1940).
[23] N. R. French and J. C. Steinberg, “Factors Govern-
ing the Intelligibility of Speech Sounds,” J. Acoust. Soc.Am., vol. 19, pp. 90–119 (1947).
[24] D. Byrne, H. Dillon, K. Tran, S. Arlinger,
K. Wilbraham, R. Cox, B. Hagerman, R. Hetu, J. Kei,
C. Lui, J. Kiessling, M. N. Kotby, N. H. A. Nasser,
W. A. H. El Kholy, Y. Nakanishi, H. Oyer, R. Powell,
D. Stephens, R. Meredith, T. Sirimanna, G. Tavartkiladze,
G. I. Frolenkov, S. Westerman, and C. Ludvigsen, “An In-
ternational Comparison of Long-Term Average Speech
Spectra,” J. Acoust. Soc. Am., vol. 96, pp. 2108–2120 (1994).[25] B. C. J. Moore, M. A. Stone, C. Fullgrabe,
B. R. Glasberg, and S. Puria, “Spectro-Temporal Character-
istics of Speech at High Frequencies, and the Potential for
Restoration of Audibility to People with Mild-to-Moderate
Hearing Loss,” Ear Hear., vol. 29, pp. 907–922 (2008).[26] H. Levitt, “Speech Discrimination Ability in the
Hearing Impaired: Spectrum Considerations,” in The Van-derbilt Hearing-Aid Report, G. A. Studebaker and F. H.
Bess, Eds. (Monographs in Contemporary Audiology,
Upper Darby, PA, 1982), pp. 32–43.
[27] R. M. Cox, J. S. Matesich, and J. N. Moore, “Distri-
bution of Short-Term RMS Levels in Conversational
Speech,” J. Acoust. Soc. Am., vol. 84, pp. 1100–1104 (1988).[28] B. R. Glasberg and B. C. J. Moore, “Derivation of
Auditory Filter Shapes from Notched-Noise Data,” Hear.Res., vol. 47, pp. 103–138 (1990).
[29] B. C. J. Moore, An Introduction to the Psychology ofHearing, 5th ed. (Academic Press, San Diego, CA, 2003).
[30] E. F. Stikvoort, “Digitial Dynamic Range Com-
pressor for Audio,” J. Audio Eng. Soc., vol. 34, pp. 3–9(1986 Jan./Feb.).
[31] C. E. Robinson and D. A. Huntington, “The Intel-
ligibility of Speech Processed by Delayed Long-Term
Averaged Compression Amplification,” J. Acoust. Soc.Am., vol. 54, p. 314 (1973).
[32] M. A. Stone, B. C. J. Moore, J. I. Alcantara, and
B. R. Glasberg, “Comparison of Different Forms of
Compression Using Wearable Digital Hearing Aids,”
J. Acoust. Soc. Am., vol. 106, pp. 3603–3619 (1999).
[33] C. T. Tan, B. C. J. Moore, and N. Zacharov, “The
Effect of Nonlinear Distortion on the Perceived Quality of
Music and Speech Signals,” J. Audio Eng. Soc., vol. 51,pp. 1012–1031 (2003 Nov.).
[34] B. C. J. Moore, B. R. Glasberg, C. J. Plack,
and A. K. Biswas, “The Shape of the Ear’s Temporal Win-
dow,” J. Acoust. Soc. Am., vol. 83, pp. 1102–1116 (1988).[35] A. J. Oxenham and B. C. J. Moore, “Modeling
the Additivity of Nonsimultaneous Masking,” Hear. Res.,vol. 80, pp. 105–118 (1994).
[36] C. J. Darwin and R. P. Carlyon, “Auditory Group-
ing,” in Hearing, B. C. J. Moore, Ed. (Academic Press,
San Diego, CA, 1995), pp. 387–424.
[37] T. Baer, B. C. J. Moore, and S. Gatehouse, “Spec-
tral Contrast Enhancement of Speech in Noise for Listen-
ers with Sensorineural Hearing Impairment: Effects on
Intelligibility, Quality and Response Times,” J. Rehab.Res. Devel., vol. 30, pp. 49–72 (1993).
[38] A. Sarampalis, S. Kalluri, B. W. Edwards, and
E. R. Hafter, “The Effects of Noise Reduction on Cogni-
tive Effort in Normal-Hearing and Hearing-Impaired
Listeners,” in Auditory Signal Processing in Hearing-Im-paired Listeners; Proc. 1st Int. Symp. on Auditory andAudiological Research (Isaar, 2007) T. Dau, J. M. Buch-
holz, J. M. Harte, and T. U. Christiansen, Eds. (Centertryk
A/S, Denmark, 2008), pp. 569–575.
[39] R. S. Bolia, W. T. Nelson, M. A. Ericson, and
B. D. Simpson, “A Speech Corpus for Multitalker
Communications Research,” J. Acoust. Soc. Am., vol.
107, pp. 1065–1066 (2000).
[40] H. J.M. Steeneken and T. Houtgast, “Mutual Depen-
dence of the Octave-Band Weights in Predicting Speech
Intelligibility,” Speech Comm., vol. 28, pp. 109–123 (1999).
THE AUTHORS
M. Stone B. Moore C. Fullgrabe A. Hinton
J. Audio Eng. Soc., Vol. 57, No. 7/8, 2009 July/August 545
PAPERS FAST-ACTING AMPLITUDE COMPRESSION AND TWO-TALKER SEPARATION TASK
Michael Stone started his career at the BBC, where heworked on an early digital audio editor and investigatedscanning standards for high-definition television. He sub-sequently joined the Auditory Perception Group at theUniversity of Cambridge, UK, led by Brain Moore, underwhose supervision he received his Ph.D. degree in 1995.A primary theme of his work has been to characterize thebehavior of single- and multichannel dynamic range com-pressors and their perceptual effects, focusing mainly onhearing aids. For this work he was elected a Fellow of theAcoustical Society of America in 2008.He is a member of the UK-based Institute of Engineer-
ing and Technology and a Chartered Engineer.
l
Brian Moore is professor of Auditory Perception at theUniversity of Cambridge, UK, president of the Associationof Independent Hearing Healthcare Professionals, UK, as-sociate editor of the Journal of the Acoustical Society ofAmerica, and member of the Editorial Boards of HearingResearch as well as Audiology and Neurotology.He has written or edited 14 books and over 500 scientific
papers and book chapters. His most recent book is CochlearHearing Loss, Wiley, 2007. In 2003 he was awarded theAcoustical Society of America Silver Medal in physiologi-cal and psychological acoustics. In 2004 he was awarded thefirst International Award in Hearing from the AmericanAcademy of Audiology. He has twice been awarded theLittler Prize of the British Society of Audiology. In 2008 hereceived the Award of Merit from the Association for Re-search in Otolaryngology and the Hugh Knowles Prize forDistinguished Achievement from Northwestern University.
Dr. Moore is a Fellow of the Royal Society, the Acad-emy of Medical Science, and the Acoustical Society ofAmerica; and an Honorary Fellow of the Belgian Societyof Audiology and the British Society of Hearing AidAudiologists.
l
Christian Fullgrabe received his undergraduate andgraduate education in experimental and cognitive psy-chology from the University of Paris 5, France. In2005 he was awarded a Ph.D. degree for his workon the role of (non)linear mechanisms involved inthe auditory processing of complex temporal-envelopecues.He than joined Brian Moore’s group, first as a Fyssen
Foundation (France) postdoctoral fellow and then as aMarie Curie Intra-European (EU) fellow. In 2008 he waselected a junior research fellow at Wolfson College,Cambridge, UK. While pursuing work on temporal-enve-lope processing, he was also involved in research projectson auditory stream segregation, perceptual learning, andthe potential benefit of frequency transposition and ex-tended bandwidth in hearing aids.
l
Andrew Hinton read natural sciences at CambridgeUniversity, UK, and graduated in 2008 after a final yearspecializing in experimental psychology. His long-heldinterest in psychoacoustics and sound technology isexpressed currently by working as a theatrical soundtechnician. He intend to pursue a postgraduate qualifica-tion in sound design.
546 J. Audio Eng. Soc., Vol. 57, No. 7/8, 2009 July/August
STONE ET AL. PAPERS